Article

Comparison of Point Measurement Strategies and Mathematical Algorithms for Evaluation in Contact Measurement of a Spherical Surface on a CMM

1
Meshcheryakov Laboratory of Information Technologies, Joint Institute for Nuclear Research, Joliot-Curie st, 6, 141980 Dubna, Moscow Region, Russia
2
Department of Biomedical Engineering and Measurement, Institute of Special Engineering Processes, Faculty of Mechanical Engineering, Technical University of Košice, Letná, 9, 04001 Košice, Slovakia
*
Author to whom correspondence should be addressed.
These authors contributed equally to this work.
Appl. Sci. 2025, 15(23), 12392; https://doi.org/10.3390/app152312392
Submission received: 16 October 2025 / Revised: 8 November 2025 / Accepted: 13 November 2025 / Published: 21 November 2025
(This article belongs to the Special Issue Modernly Designed Materials and Their Processing)

Abstract

This paper compares different point measurement strategies for spherical surfaces using a coordinate measuring machine. A total of 77 points were measured using the Sphere, Touch Point, Space Point, and Mid Point strategies, and approximately 2200 points were measured by scanning the surface with eight circles. Three probe configurations with different probe tip diameters were used for the measurements. The acquired data were processed with Calypso software, and the results for sphere diameters and centers were verified using the LSQ algorithms with the Kåsa and Newton methods, as well as Chebyshev fitting. Spherical shell half-widths and Root Mean Square Errors were used to evaluate accuracy. The results show that the sensor with r probe = 2.500557 mm provides the smallest deviation from the certified value for both diameter and center position. The deviations remain smaller than the maximum permissible error of length measurement E 0 , MPE . The scanning strategy does not consistently provide better results for either the diameter or the sphere center compared to point measurement. The results of the LSQ method in Calypso correspond to those obtained by the Kåsa/Newton methods (with results identical at the μ m scales), while the Calypso Minimum Feature evaluation method corresponds to the Chebyshev fit.

1. Introduction

Coordinate Measuring Machines (CMMs) are widely used in industry and research to obtain information about the shape, dimensions, and geometric tolerances of measured objects [1,2]. During measurement, various errors occur that affect the obtained results [3,4,5,6]. Weckenmann et al. [7] present the principle of coordinate measuring machines, the technology of probing systems, the influence of tip ball diameter on mechanical filtering, and other factors affecting the measurement process.
Figure 1 shows the factors influencing measurement and the errors considered in the experiment.
  • The most significant influence on the measurement result comes from the measuring strategy, the operator, and the inspection task, which together account for more than 50 percent of the effect [8]. Sadaoui [9] examines the impact of component placement, its orientation on measurement planning, and the optimization of the measurement approach in the paper.
  • From the perspective of experimental design, the stylus configuration plays a critical role in the measurement result. Different materials used for the stylus shaft, tip diameter, stylus length, extension, stiffness, and mass can affect the measurement result. The thermal expansion of carbon fiber is 0.4 × 10 6 K 1 , while for tungsten carbide it is 5.0 × 10 6 K 1 [10]. Therefore, it is essential to calibrate the stylus under the actual measurement conditions.
  • It is recommended to use the shortest possible stylus system (stylus without/with extension) within the specifications given by the manufacturer. Increasing stylus length causes the stylus to bend or deflect, which increases the error and reduces accuracy [11].
  • The elastic modulus E (GPa) is a material property describing the relationship between stress and strain when a solid body is deformed. A higher elastic modulus indicates greater resistance to deformation. The elastic modulus is ≥450 GPa for carbon fiber and 620 GPa for tungsten carbide. Styli with a tip diameter smaller than 2 mm typically have tungsten carbide shafts, while those with tip diameters larger than 2 mm may use either tungsten carbide or carbon fiber shafts, with the shaft diameter increasing proportionally with the probe diameter [12,13]. As the shaft diameter increases, the stiffness of the stylus and its resistance to bending also increase.
  • The probe tip diameter has a fundamental impact on distortions caused by the tip’s mechanical filtration effect. Lou et al. [14] investigated the effect of probe tip diameter on the measurement of additively manufactured parts. Their results show that probe diameter has a significant influence on the measurement result. The role of probe diameter as a mechanical filter is further confirmed by other studies [15,16].
  • Salah [17] studied the influence of the stylus, combined with scanning speed, on roundness and measurement uncertainty using a calibration ring. The impact of stylus tip radius on the mean form error at different probing speeds is approximately 1  μ m.
  • Woźniak and Dobosz [18] investigated the influence of surface shape (flat, convex, concave), object stiffness, and surface roughness on touch trigger probe accuracy and measurement uncertainty.
Table 1 summarizes the Calypso software version 5.0.24.12 settings used in this study.
The measurement of features (Sphere, Plane, Circle, Cylinder, etc.) and the evaluation of their characteristics (dimensions, geometrical tolerances, etc.) are based on either point probing or scanning (continuous readings along the surface of a workpiece). Each feature has a defined minimum number of points [19,20] and a specific measurement principle. The distribution of points on the measured surface should be uniform to capture the surface geometry with maximum accuracy [19]. Zeng [21] presents methods for measuring freeform surfaces based on the Gaussian curvature variation grid method and the isoparametric line curvature variation grid method. The number of points and their distribution affect the measurement results [22]. The selection of the feature evaluation method (depending on the type of feature) is also an important factor [23,24,25].
Several probing strategies can be used for the measurement of point location (coordinates). These are defined as point modes and differ in the probe–workpiece contact point, the approach vector, and software corrections (see Figure 2) [26,27].
Mazur et al. [28,29] analyzed the influence of probing direction and probing angle on measurements of cylindrical surfaces and planar point identification accuracy [30]. Hexagon [31] states that the probe should be within ± 20 of the perpendicular to minimize skidding error. For this reason, the probe approach vectors are oriented perpendicular to the surface of the sphere.
The adjustment of measured data can be achieved through filtering (Gauss, spline, RC, …) and/or the elimination of outliers (e.g., 3 σ filter). Filtering based on undulation per revolution (circular features) or wavelength (linear features) allows for the removal of repetitive phenomena and outliers. Outlier elimination determines which values lie within the interval centered at the mean, with a range defined by the standard deviation σ for a Normal (Gaussian) distribution [32,33,34,35].
From the above, it follows that the measurement result is influenced by factors that cannot be controlled (CMM accuracy, CMM error, the probing system used, etc.) and by factors that depend on the device operator (selection of the probe, determination of the feature measurement strategies, feature design, filtering, etc.).
In our study, we focus on processing data from spherical surface measurements. The main goal is to compare different measurement strategies and the use of different probe radii. To better understand the use of the Calypso program options, we compare the results obtained by this program with the results from three different fitting methods. Using defined probing systems, the spherical surface was measured with various features (sphere, point, circle) and measurement strategies (touch point, space point, mid point), while the measurement parameters (point positions, normals, speeds, elimination of values) remained constant throughout the entire measurement process. The aim is to identify the influence of different factors (probing system, measurement strategy, filtering, etc.) on the measurement result and to compare the results obtained from the Calypso software with our fitting results. An additional contribution is the clear identification of mathematical algorithms suitable for processing raw data with the required accuracy.
The paper is structured as follows: Section 2.1 describes the measurement system, its properties, and measurement strategies and procedures. Section 2.2 introduces the formulations of the fitting problems for sphere identification and provides references to works devoted to their solution. Solutions to two problems in Octave are presented. Section 3 presents the results in the form of tables and figures. The results are analyzed and discussed in Section 4. Finally, Section 5 concludes the study and outlines future work.

2. Materials and Methods

2.1. Experimental Setup

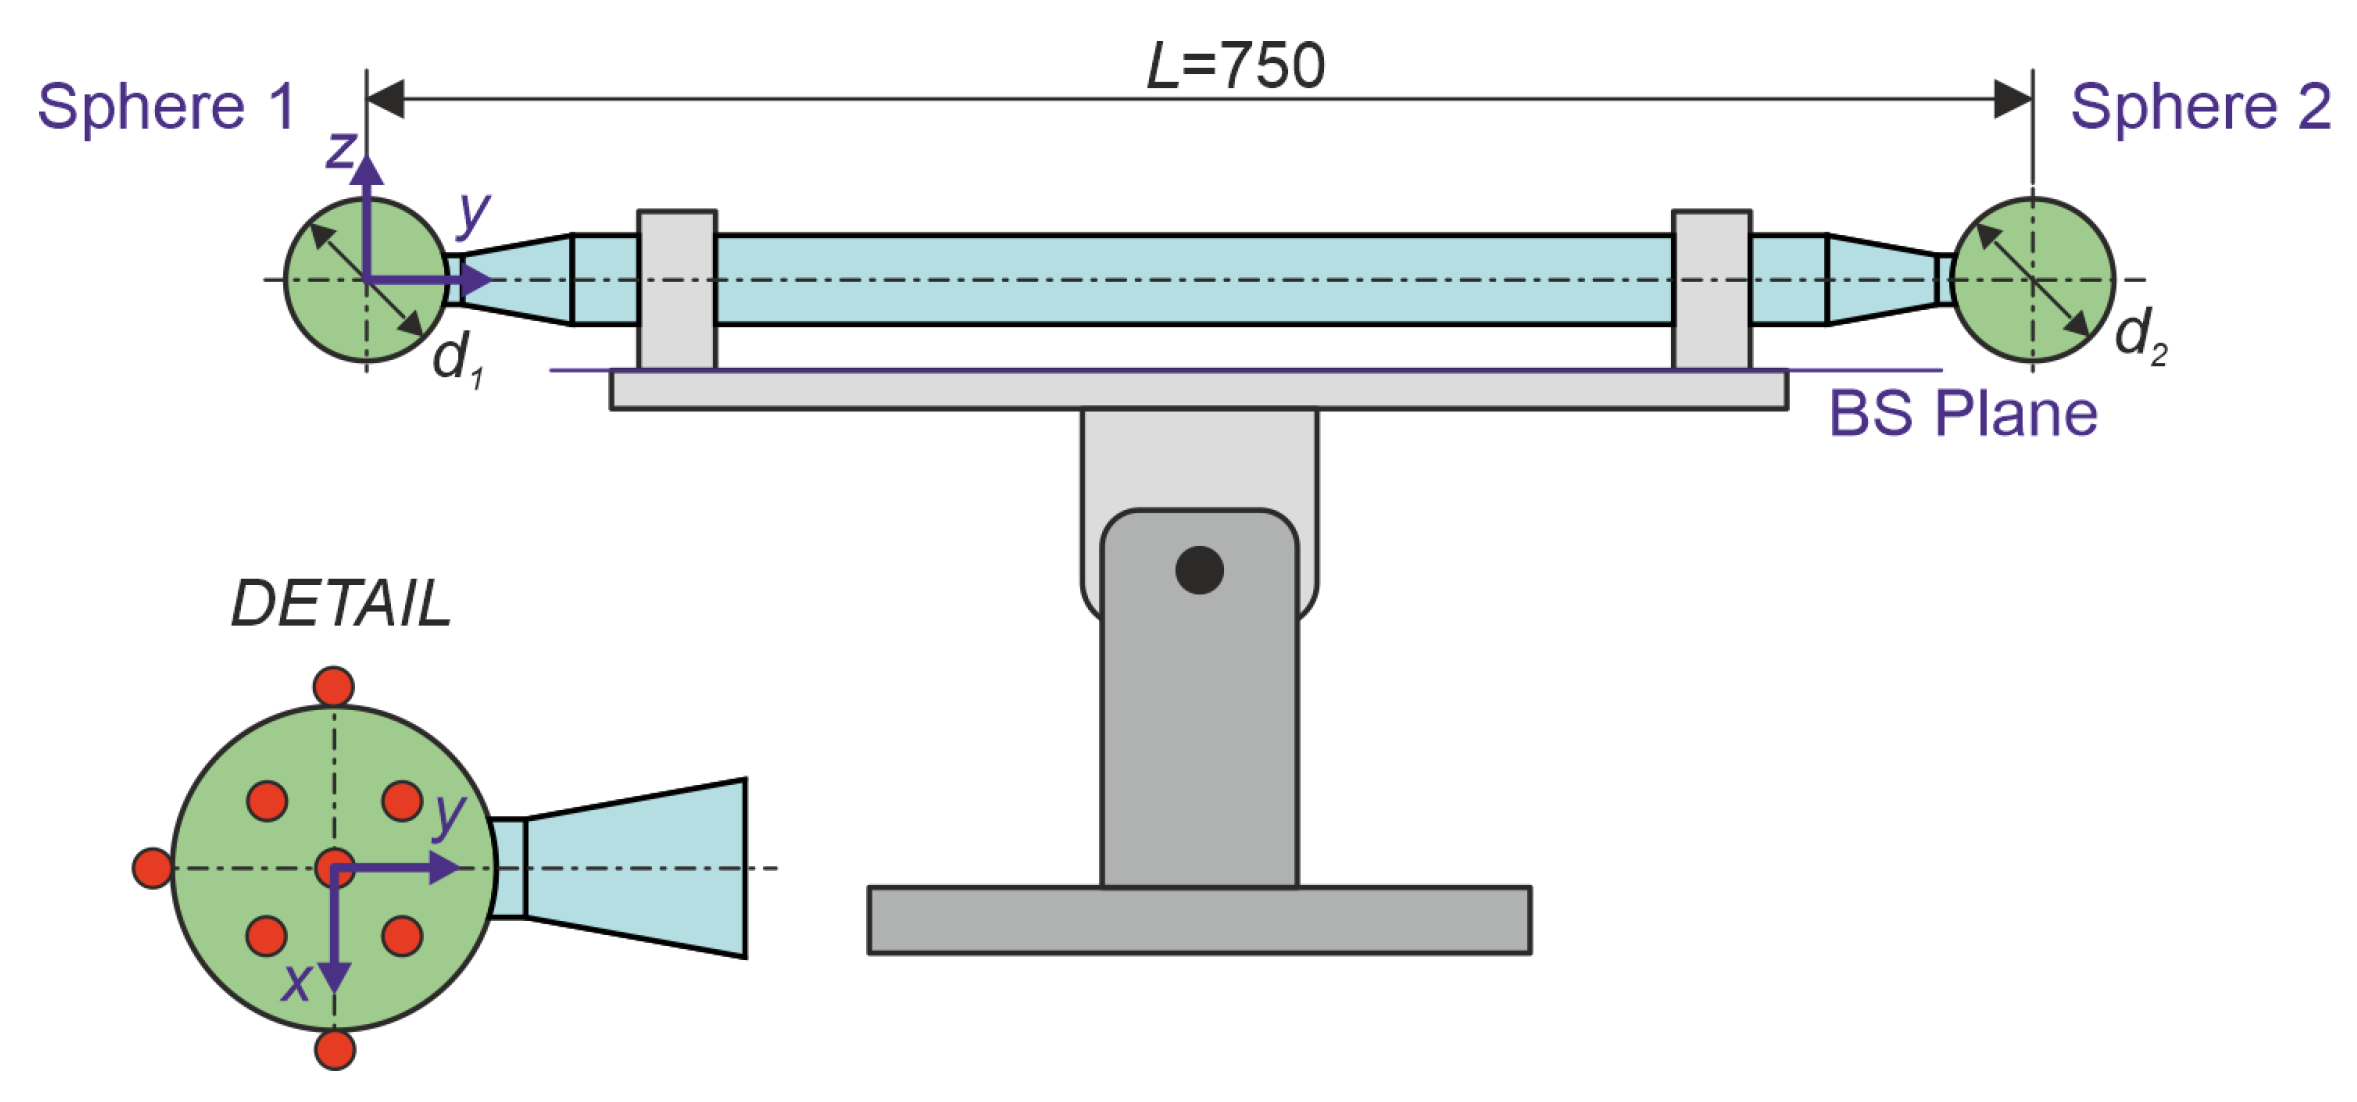
We measured a 750 mm Ball Bar with the spheres size d nominal = 1.00000 in = 25.4 mm (see Figure 3). The certificated values of the diameters are d certificate = 1.000010 in = 25.400254 mm (Sphere 1) and 1.000008 in = 25.4002032 mm (Sphere 2), respectively. The uncertainty of the diameter determination is 10 millionths of an inch = 254  nm, and the maximum deviation of sphericity of the spheres is 127 nm. A Ball Bar standard/artifact was used because of its precisely defined dimensions and form deviations, thereby eliminating the influence of the measured object on the results. The average ambient temperature during the measurement was 19.97 °C in the interval (19.91; 20.01) °C.
The Ball Bar coordinate system was created from the BS Plane on the measuring fixture (spatial rotation), the line connecting the centers of Sphere 1 and Sphere 2 (planar rotation), and the center of Sphere 1 as the origin of the X, Y, Z coordinate system (Figure 3).
The experiments were performed on a Contura G2 coordinate measuring machine (Carl Zeiss, Germany) equipped with an RDS articulating probe holder, a VAST XXT TL1 scanning probe, and Calypso software version 5.0.24.12. The measuring range of the CMM for X / Y / Z is 700/1000/600 mm. The maximum permissible error of length measurement for the CMM is defined as: E 0 , MPE = ( A + d / K ) ( μ m), where A is a constant in μ m specified by the manufacturer, K is a dimensionless constant specified by the manufacturer, and d is the measured length in mm [24,36]. The repeatability range of E 0 stated in the machine specification is 1.4 μ m [37].
The E 0 for the Contura G2 CMM [37] for d = d nominal = 25.4  mm is:
E 0 , MPE = 1.8 + d 300 mm μ m 1.884667 μ m .
The measurements were performed using three probes with different stylus tip diameters ( D K ), probe shaft diameters ( D S ), probe lengths ( L S ), and extension lengths ( L E )—see Figure 4. The probe parameters, their designations/name/title/label, and the calibrated probe tip radii ( r c ) are listed in Table 2. All styli were calibrated with the scanning force set to Standard (200 mN) and 100% probing dynamics. For scanning, the scanning speed was set to 1.5 mm/s and the step width to 0.2 mm.
The measurement of the sphere, or points on the sphere, was performed using five strategies for each stylus. For the first probe, 77 points were measured on the sphere within the Sphere feature. Their coordinates, adjusted for the probe tip diameter, were used for the other Sphere features and points (Figure 5):
  • Sphere—Within the Sphere feature, points from the first measurement were used with coordinates ( x i , y i , z i ) adjusted according to the change in probe tip diameter D K , while preserving the normal vectors n i = ( x n i , y n i , z n i ) , i = 1 , , N . The Sphere feature was created using the LSQ evaluation method.
  • Mid Point (MP)—Within the Point feature, points were measured as Mid Points; the point coordinates and their direction vectors are the same as for the Sphere feature, but they are measured as individual points.
  • Space Point (SP)—Within the Point feature, points were measured as Space Points with the option Plane measurement always. Points to determine the normal vector are measured along the direction of the largest component of the normal vector, after which the point is measured at the specified coordinates using the obtained normal vector.
  • Touch Point (TP)—Within the Point feature, points were measured as Touch Points along the direction of the largest component of the normal vector.
  • Circle—Within the Circle feature, the measurement was performed by scanning 8 circles with a 2 mm spacing and a step width of 0.2 mm between points.
An Excel file containing the characteristics of the measured features was exported from Calypso, including point coordinates x, y, z; diameters and centers x c , y c , z c of measured/created spheres; and geometrical tolerances (Form) for both unfiltered data and data filtered in LSQ using 2 σ and 3 σ . Information for all features was also exported to geoactual files, which contain the current coordinates of each measured point (e.g., x MP i , y MP i , z MP i ), the measurement direction “kraft” vector k i = ( x k i , y k i , z k i ) , and the probe tip radius r probe from the calibration. For the Sphere feature, point measurements in the geoactual file included 77 points with vectors and probe radius, while scanning included 2200 points with corresponding data. Points for TP, MP, and SP measurements were obtained from the geoactual file of the Sphere feature. For the TP and SP measurement strategies, it was necessary to convert the coordinates of the probe tip center to surface contact points (2) (see Figure 2).
x TP i = x MP i + r probe · x k i , y TP i = y MP i + r probe · y k i , z TP i = x MP i + r probe · z k i , i = 1 , , N .
Using the measured TP, MP, and SP, spheres were created in Calypso using the Recall Feature Points option of the Sphere feature, with the LSQ feature evaluation applied. The measurement procedure and the generated outputs are illustrated in Figure 6. For the measured points, coordinates ( x i , y i , z i ) were generated; for spheres, the coordinates of centers ( x c , y c , z c ) , sphere diameter d, and form deviation were obtained; and for scanned circles, the coordinates of centers ( x c , y c , z c ) and the geoactual files containing each obtained point, its “kraft” vectors, and the probe radius were generated.
Form definition: The form deviation is determined from the extreme values of features as the difference between the maximum and minimum measured point “oriented” distance perpendicular to the feature (e.g., cone form or sphere form) [26].
For the Touch Point method, the coordinates of the nominal point are known, and the vector is defined by one of the axes of the created coordinate system of the measured object. Probing occurs along the axis corresponding to the largest component of the vector obtained from the Sphere feature measurement. The radius correction is applied in the direction of the coordinate system axis corresponding to the probing direction. This method typically shows the largest deviations from the nominal values.
The Mid Point method should provide results very similar to the Sphere feature, as it uses the same base. The points share the same nominal coordinates of the probe tip centers and the same vectors. The Point mode does not use probe tip radius correction. In the Mid Point method, individual points are measured and then used to create the Sphere feature (using the Recall Feature Points option). In practice, this method is rarely used, since the output provides the probe center coordinates rather than the contact point. The result must be corrected by the probe radius.
The Space Point method is suitable for measuring points on an unknown surface or complex shapes. The approach vector is oriented opposite to the surface normal at the measured point. Radius correction is applied in the direction of the normal vector, followed by projection onto the normal of the nominal point. Usually, both the point coordinates and their normal vector are known (defined on the drawing or from the CAD model). In the experiment, we do not use the CAD model and the direction of the normal vector is determined by measuring three points around the coordinates of the measured point (macro for Space point measurement). From these, a plane is created with a new vector for the space point, and the point is then measured along this obtained vector. However, on highly curved surfaces, the probe can ‘slide’ along the surface during the macro measurement, resulting in an incorrect determination of the point vector.

2.2. Used Spheres Fitting Methods

In this paper, we compare measurement results provided by the CMM software Calypso 5.0.24.12 [26] with numerical results obtained by the Delonge–Kåsa [38,39] and Newton methods (see, e.g., the overview [40]), as well as a method for Chebyshev or Midrange fitting [41,42] using the Octave 10.2.0 function fminsearch to minimize the width of the midrange domain. Octave [43] is free software that is, in many respects, comparable to the proprietary Matlab [44].
Let us consider a measurement dataset M = { ( x i , y i , z i ) } , i = 1 , 2, …, N of N points in R 3 , together with a hypothetical sphere S described by the equation
x x c 2 + y y c 2 + z z c 2 r 2 = 0 ,
where C = x c , y c , z c is its center and r is the radius. Denote
r i = ( x i x c ) 2 + ( y i y c ) 2 + ( z i z c ) 2
the distance of a point ( x i , y i , z i ) to the center C.
The least squares error criterion for sphere fitting (in [39] circles were considered) is
i = 1 N ( r i r ) 2 = i = 1 N d i 2 = min ,
where d i = r i r is the geometrical distance from the data point ( x i , y i , z i ) to the hypothetical sphere S [40]. Shakarji presented in [45] the NIST Algorithm Testing System, which uses the Levenberg-Marquardt algorithm to solve nonlinear problems, including sphere fitting.
We will call the value
RMSE = 1 N 1 i = 1 N ( r i r ) 2
the root mean squared error.
Along with d i , we also consider
f i = x i x c 2 + y i y c 2 + z i z c 2 r 2 .
Some authors, e.g., [46,47], refer to f i as the algebraic distance of the point ( x i , y i , z i ) to the sphere S [40].
Problem (5) is a nonlinear problem. Kåsa [39], following Delonge [38], considered the modified least squares criterion
i = 1 N ( r i 2 r 2 ) 2 = i = 1 N f i 2 = min .
Problem (8) is also nonlinear with respect to the unknown parameters x c , y c , z c , and r. However, a simple change in parameters (proposed by Kåsa) transforms it into a linear problem. We will further refer to this as the Kåsa method.
In addition to the geometric and algebraic fits mentioned above, a third approach to sphere fitting is based on the criterion
max 1 i N | d i | = min ,
also called the midrange, thinnest spherical shell [42], or Chebyshev fit [41], where
w = max 1 i N d i min 1 i N d i
is the width of a spherical shell (the minimum in (9) is then equal to w / 2 ).
Such a fit is also a type of geometrical fit – if we introduce a vector d = ( d 1 , d 2 , , d N ) of “distances”, then problem (5) is based on minimizing the Euclidean norm d 2 , and problem (9) is based on minimizing the “maximum” norm d . Reference [42] presents a very interesting midrange fitting investigation, with important theorems proving that problem (9) can be solved by a finite algorithm. The authors of [41] proposed an exponential penalty function method to solve problem (9). However, we simply used the fminsearch function in Octave to minimize the width of the spherical shell. We also implemented the Kåsa method and the Newton method to solve problem (5) in Octave (the corresponding scripts can also be used in Matlab).
Remark 1.
There are many methods to solve problems (5), (8) and (9) (some of which, applied to circle fitting, are described in [40]). It is also noted that there exist datasets, for which these problems have no solutions! For the 3D problem of spherical fitting, for example, a dataset containing coplanar points has a solution that is “a plane”, which could be considered as the result of the spheres sequence with the radius r .

2.2.1. Octave Code for the Kåsa Method

Our implementation of the Kåsa method for sphere fitting in Octave/Matlab is very simple (consisting of only three–five matrix commands):
01 % Kasa LSQ method
02 phi=[x ones(N,1)];
03 s=-(x(:,1).^2+x(:,2).^2+x(:,3).^2);
04 coeff=pinv(phi)*s;
05 % Center
06 CK=-coeff(1:3)’/2;
07 disp([’CK: ’,num2str(CK,12)])
08 % Radius
09 RK=sqrt(sum(CK.^2)-coeff(4));
10 disp([’rK: ’,num2str(RK,12)])
Here, x is a matrix of size N × 3 where the ith row contains the coordinates ( x i , y i , z i ) . The solution vector coeff is 4 × 1 . The first three components correspond to the center C coordinates in the vector CK (see line 07), and the fourth component, together with the center coordinates, is used to determine the radius r (see line 09).

2.2.2. Octave Code for the Minimum Sphere’s Shell Width Method

As mentioned above, the Octave function fminsearch is used to minimize the function width (see line 02).
01 options=optimset(’TolFun’,1.e-12,’TolX’,1.e-12);
02 [CM,w_fmin]=fminsearch(’width’,CN,options) % Newton initial guess CN
03 rvM=x-CM;  % radius vectors - CM - Midpoint Center
04 for k=1:N,
05   rrM(k)=norm(rvM(k,:));  % radii
06 end
07 rM=(max(rrM)+min(rrM))/2; % Midpoint radius
08 wM=max(rrM)-min(rrM);     % shell width - the same as w_fmin
01 function [w]=width(p) % Sphere center p
02 global x; % x - matrix [xi,yi,zi] of size N x 3
03 N=size(x,1); % Points number
04 rv=x-p;
05 for k=1:N
06   r(k)=norm(rv(k,:));  % radii
07 endfor
08 w=max(r)-min(r);       % width of a shell
As an initial guess, the center CN—the result of the Newton method—has been used.

3. Results

We consider measurement data obtained using three different “probe radii”: r probe = 0.750844 , 1.500736, and 2.500557 mm (corresponding to “diameters” 1.5, 3, and 5 mm, respectively – see Table 2). The results (center coordinates, diameters, shell width w, and RMSE error) are rounded to nanometers (nm).
Table 3 provides an overview of the “production precision” estimated by the different fitting methods mentioned above for 5 options of the CMM measurement software, for the three different radii r probe . For estimation, half-width values w / 2 and RMSE values are calculated and presented. For the CMM software Calypso, two different values are presented—for all points and for points with extreme values removed, where the distance to the center C is more than 2 σ (as expected, 2 σ -filtering leads to smaller halfwidth values). The RMSE values for all points using the Calypso method are “the same” as those for the Kåsa/Newton method RMSE (because the centers and diameters calculated by these three methods differ by a maximum of 3 nm). In Tables 4 and 5 the sphere centers and diameters are calculated for r probe = 0.750844 mm, in Tables 7 and 8 for r probe = 1.500736 mm and in Tables 10 and 11 for probe diameter r probe = 2.500557 mm.
The differences between the Kåsa and Newton methods’ results are presented in Tables 6, 9 and 12, with a maximum difference of 0.0614 nm. Therefore, the results for these two methods are presented in the same column, below.
Table 3. Accuracy comparison for different measurement options and different fitting methods for all probe radii.
Calypso FormKåsaMidKåsaMid
Option r probe  (mm)All 2 σ NewtonRangeNewtonRange
Half-Width w / 2 (μm) RMSE (μm)
0.7508440.4330.4090.4980.4330.2330.240
Sphere1.5007360.4530.3710.5210.4530.2120.238
2.5005572.1440.4302.3412.1460.5271.203
0.7508440.4360.3840.4730.4360.2170.227
Mid Point1.5007360.6050.4890.7270.6050.2700.301
2.5005572.2250.5612.4702.2250.5741.350
0.7508440.5000.4630.5460.5000.2500.270
Space Point1.5007360.6960.6040.8220.6960.3320.353
2.5005571.6390.4871.9581.6390.4721.079
0.7508440.5320.4040.6270.5320.2360.263
Touch Point1.5007361.2150.5631.4491.249 *0.3810.737
2.5005570.4230.3870.4810.4230.2240.235
0.7508441.6630.6781.6621.5640.2700.849
Circle Scan1.5007361.4380.8051.4381.2420.3110.492
2.5005572.8850.7854.0782.8850.3331.505
* Using fmincon 1.237 has been achieved.
It should be noted that there is no need to use the Newton method; however, this study may only be valid for the specific case of a high-quality product. On the other hand, the calculation times in Octave were about 0.1 and 0.3 milliseconds for 77 and 2200 points, respectively, for the Kåsa method, and 0.9 and 1.2 ms, respectively, for the Newton method. In the Newton method, the Kåsa results were used as initial points, and two iterations were always sufficient to reach precision of 1 × 10 12 (mm). For comparison, the computation times of the “Midrange” method were approximately 0.26 and 4.5 seconds, respectively.
The results are presented in Table 4, Table 5, Table 6, Table 7, Table 8, Table 9, Table 10, Table 11 and Table 12 for probe radii r probe = 0.750844 , 1.500736, and 2.500557 mm, respectively.

4. Discussion

Based on the measurement results and the processing of raw data using various mathematical algorithms, the following conclusions can be drawn:
1.
The differences between the results obtained by the Kåsa and Newton methods are presented in Table 6, Table 9 and Table 12. The maximum difference for the diameter d was Δ d = 21.3 pm (for r probe = 2.500557 mm and the Sphere feature). For the center coordinates, the maximum differences were Δ x c = 23.7 pm, Δ y c = 61.4 pm, and Δ z c = 25.4 pm, obtained for r probe = 2.500557 mm and the features Sphere, Mid Point, and Sphere, respectively (see Table 12). These results indicate that the LSQ solutions obtained by the Kåsa and Newton methods can be considered “identical” at the nanometer scale. Given the minimal differences in diameter and position, computation time may play a more significant role. For Circle measurements with 2200 points, the computation time was at most 0.3 ms for the Kåsa method and 1.2 ms for the Newton method. Comparing the results, rounded to 1 nm, obtained by the Calypso software and the Kåsa/Newton methods (Table 4, Table 5, Table 7, Table 8, Table 10 and Table 11) shows that for the Circle Scan measurement strategy, the diameter differences are less than or equal to 3 nm, and the coordinate differences are less than or equal to 2 nm. For all other strategies/options, the results and r probe values are identical, with the only exceptions being Δ x = 1 nm for the Sphere option at r probe = 0.750844 mm, Δ y = 1 nm for the Mid Point option, and Δ z = 1 nm for the Space Point option at r probe = 1.500736 mm. Finally, the absolute values | d d certificate | are always less than 1.388 μ m (for LSQ methods Calypso/Kåsa/Newton), which is below the maximum permissible error of length measurement E 0 , MPE of the device for d certificate —1.885 μ m calculated in (1) above (Table 5, Table 8 and Table 11). Hence, each of the applied strategies can be considered suitable for measurement.
2.
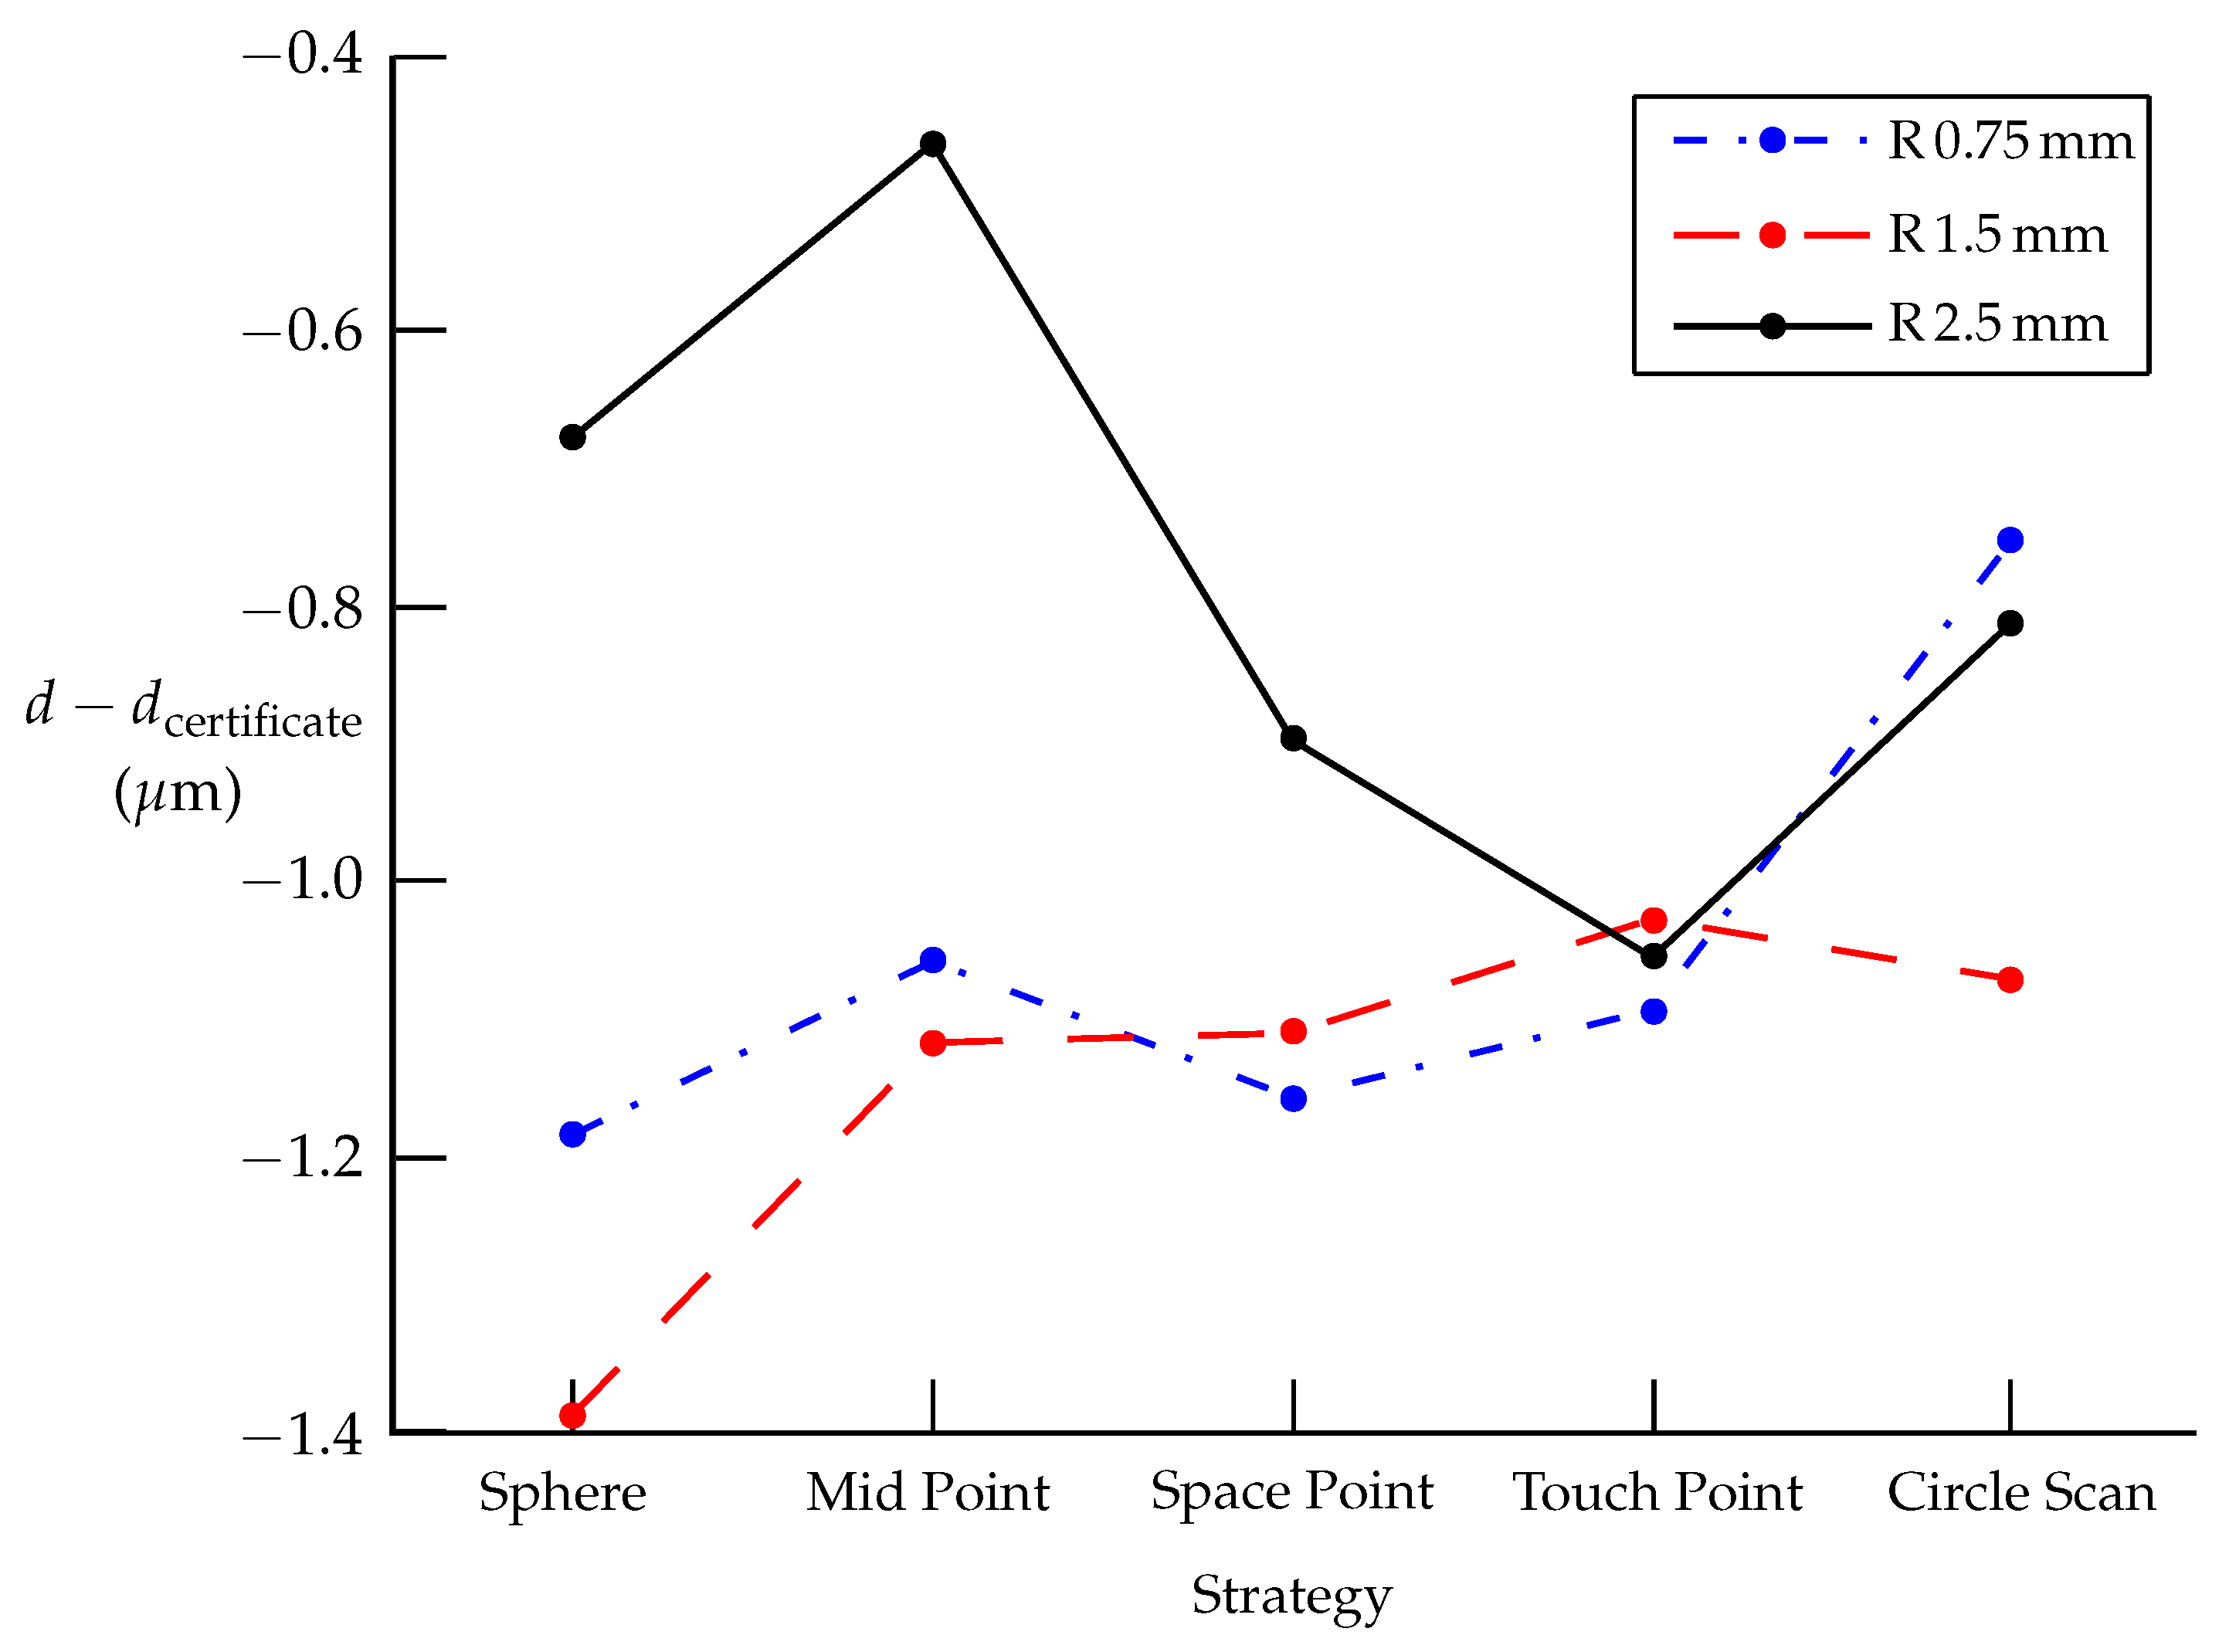
In the experiment, new touch probes and an adapter plate were used to eliminate the effect of wear. The air temperature near the measured object varied by no more than 0.3 K during touch probe calibration and measurement. The differences d d certificate for the individual probes and strategies are small. The smallest deviations d d certificate were observed for the probe with r probe = 2.500557 mm using the Mid Point, Sphere, and Circle Scan strategies (see Table 5, Table 8 and Table 11, and Figure 7). The Touch Point strategy shows the smallest d d certificate variance for the touch probes used (Figure 7).
The differences are probably due to the influence of the stiffness of the sensing systems. The probe extensions are made of the same material and have the same thickness (diameter). The probe with R = 0.75 mm has a shorter metallic shaft (diameter 1 mm), the probe with R = 2.5 mm has a shaft with a diameter of 3.5 mm, and the probe with R = 1.5 mm has a shaft with a diameter of 2 mm.
3.
The best estimate of the certificate diameter  d certificate was achieved for the r probe = 2.500557 mm (see Table 11) using the Mid Point option for Calypso/Kåsa/ Newton (0.463 nm) and also with the Midrange method (0.391 nm). The influence of the probe tip diameter corresponds to [14,15].
4.
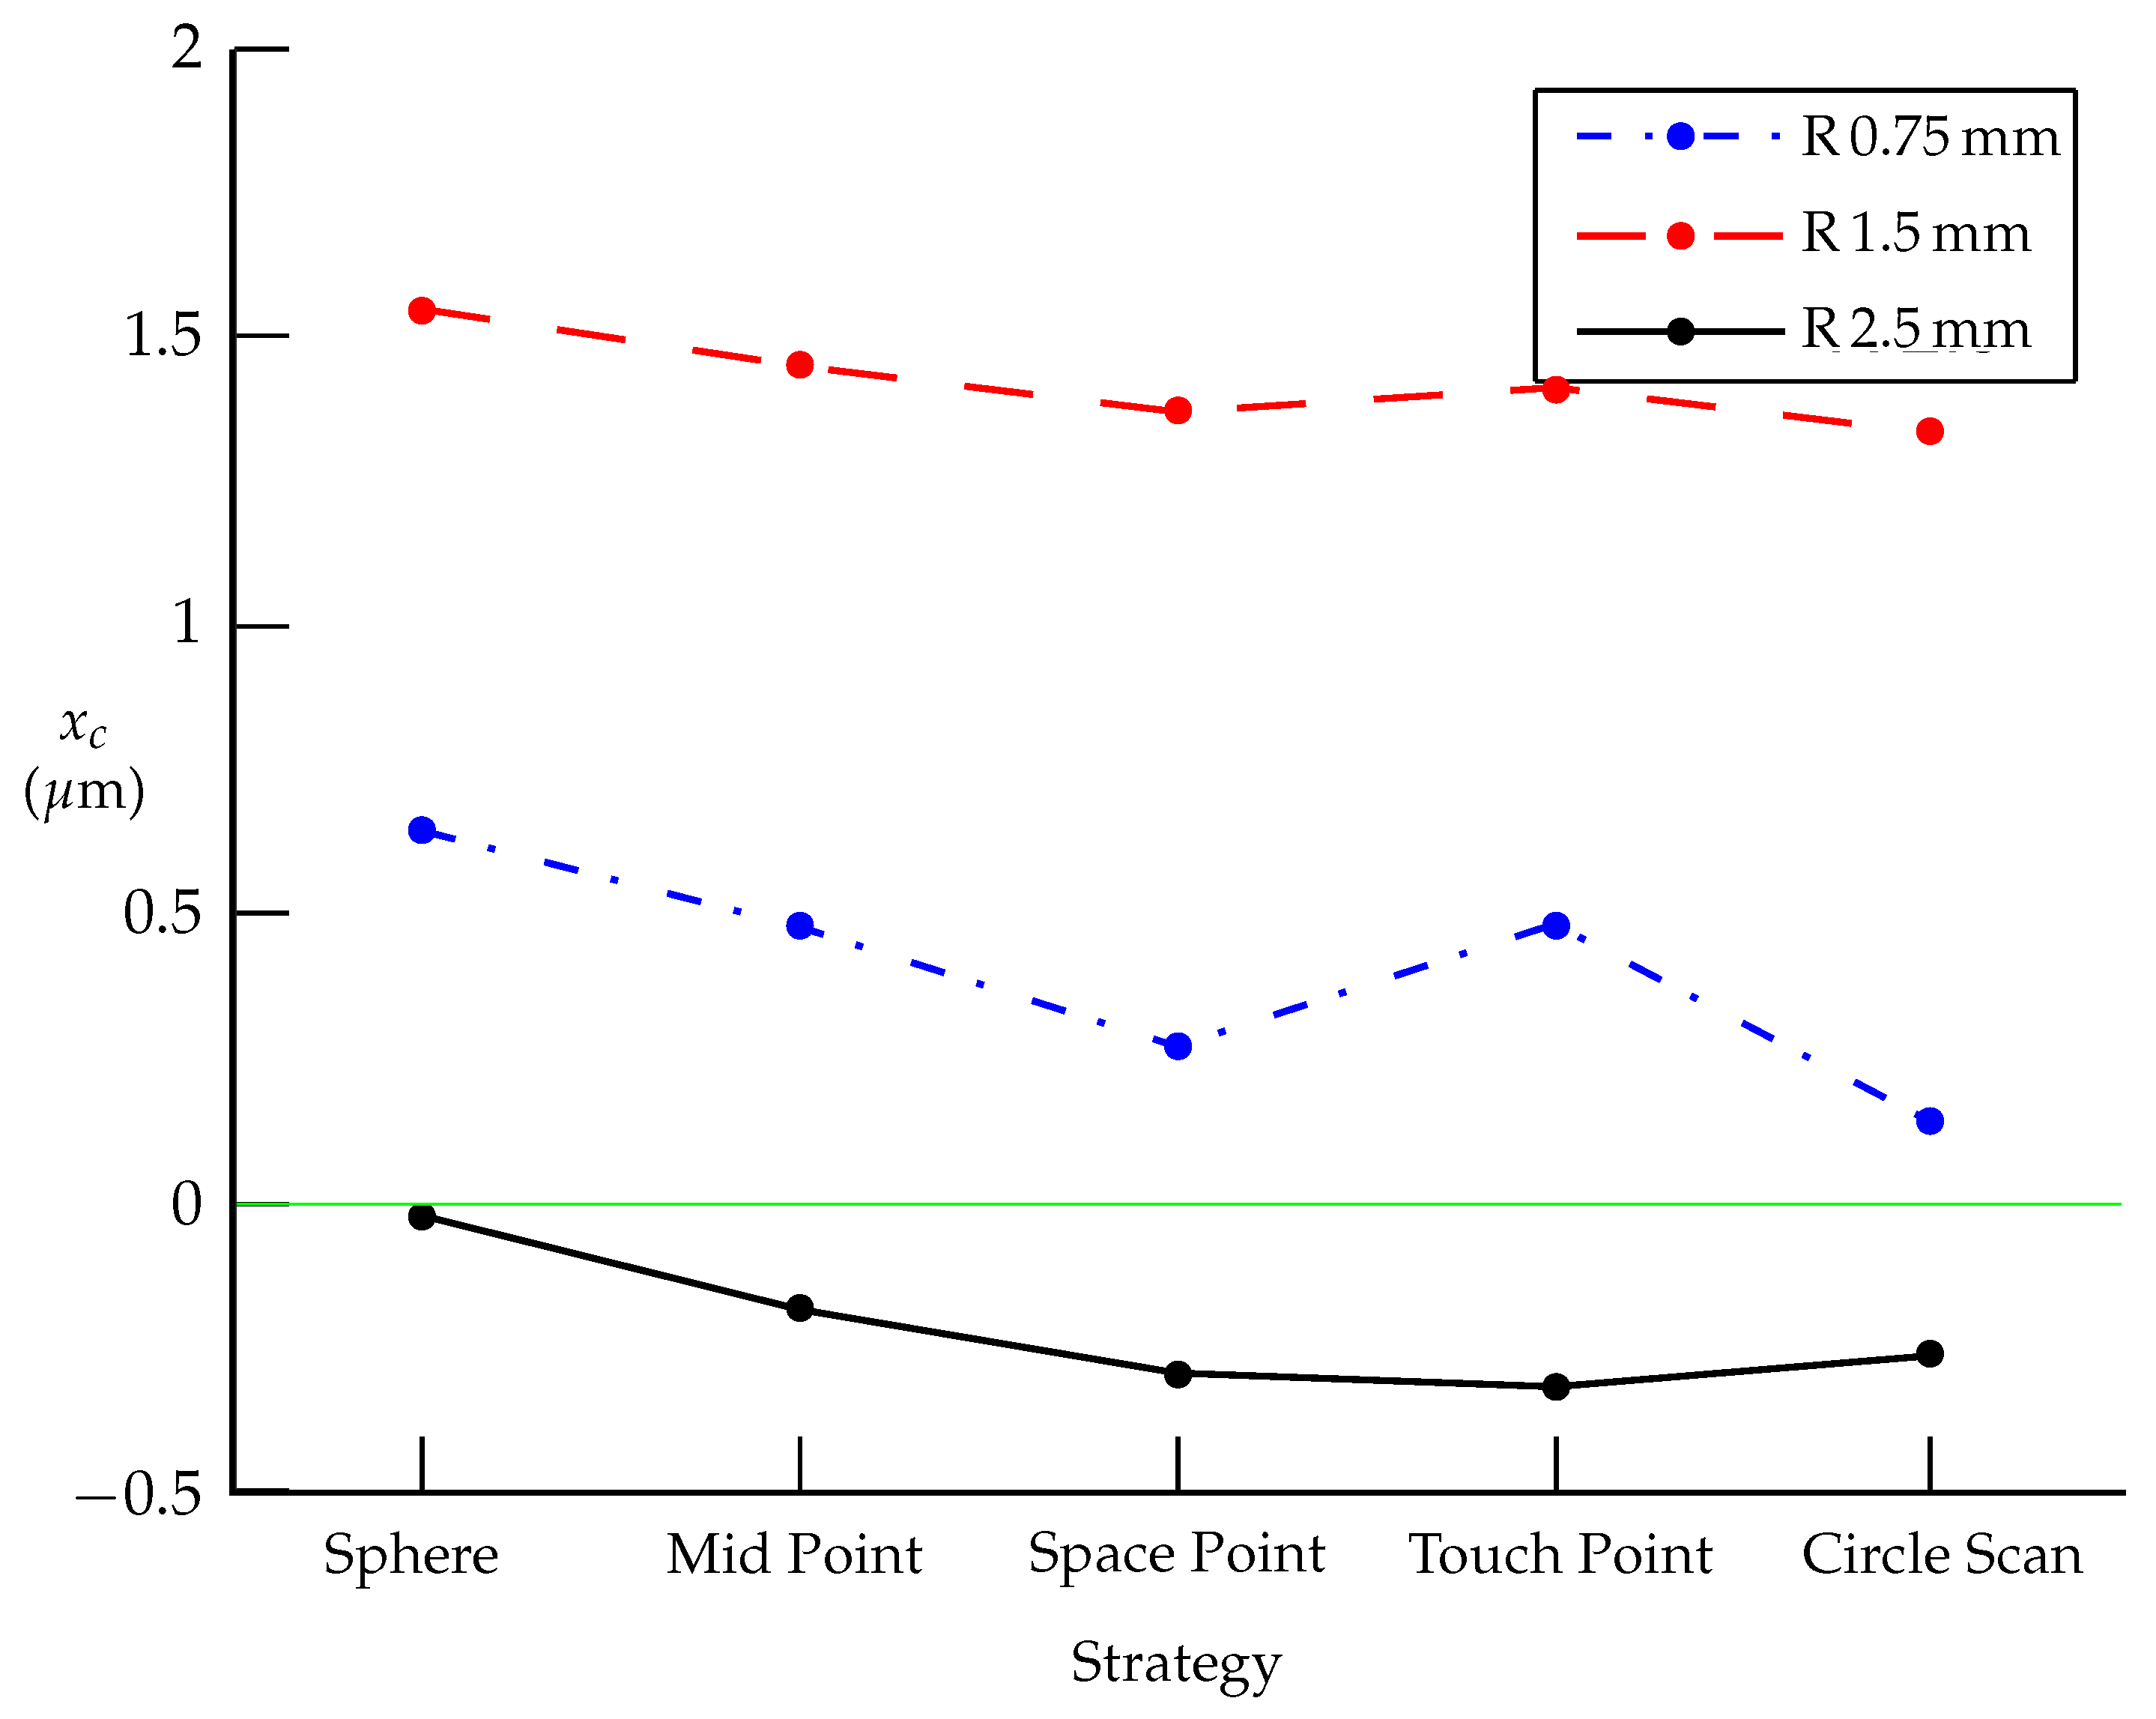
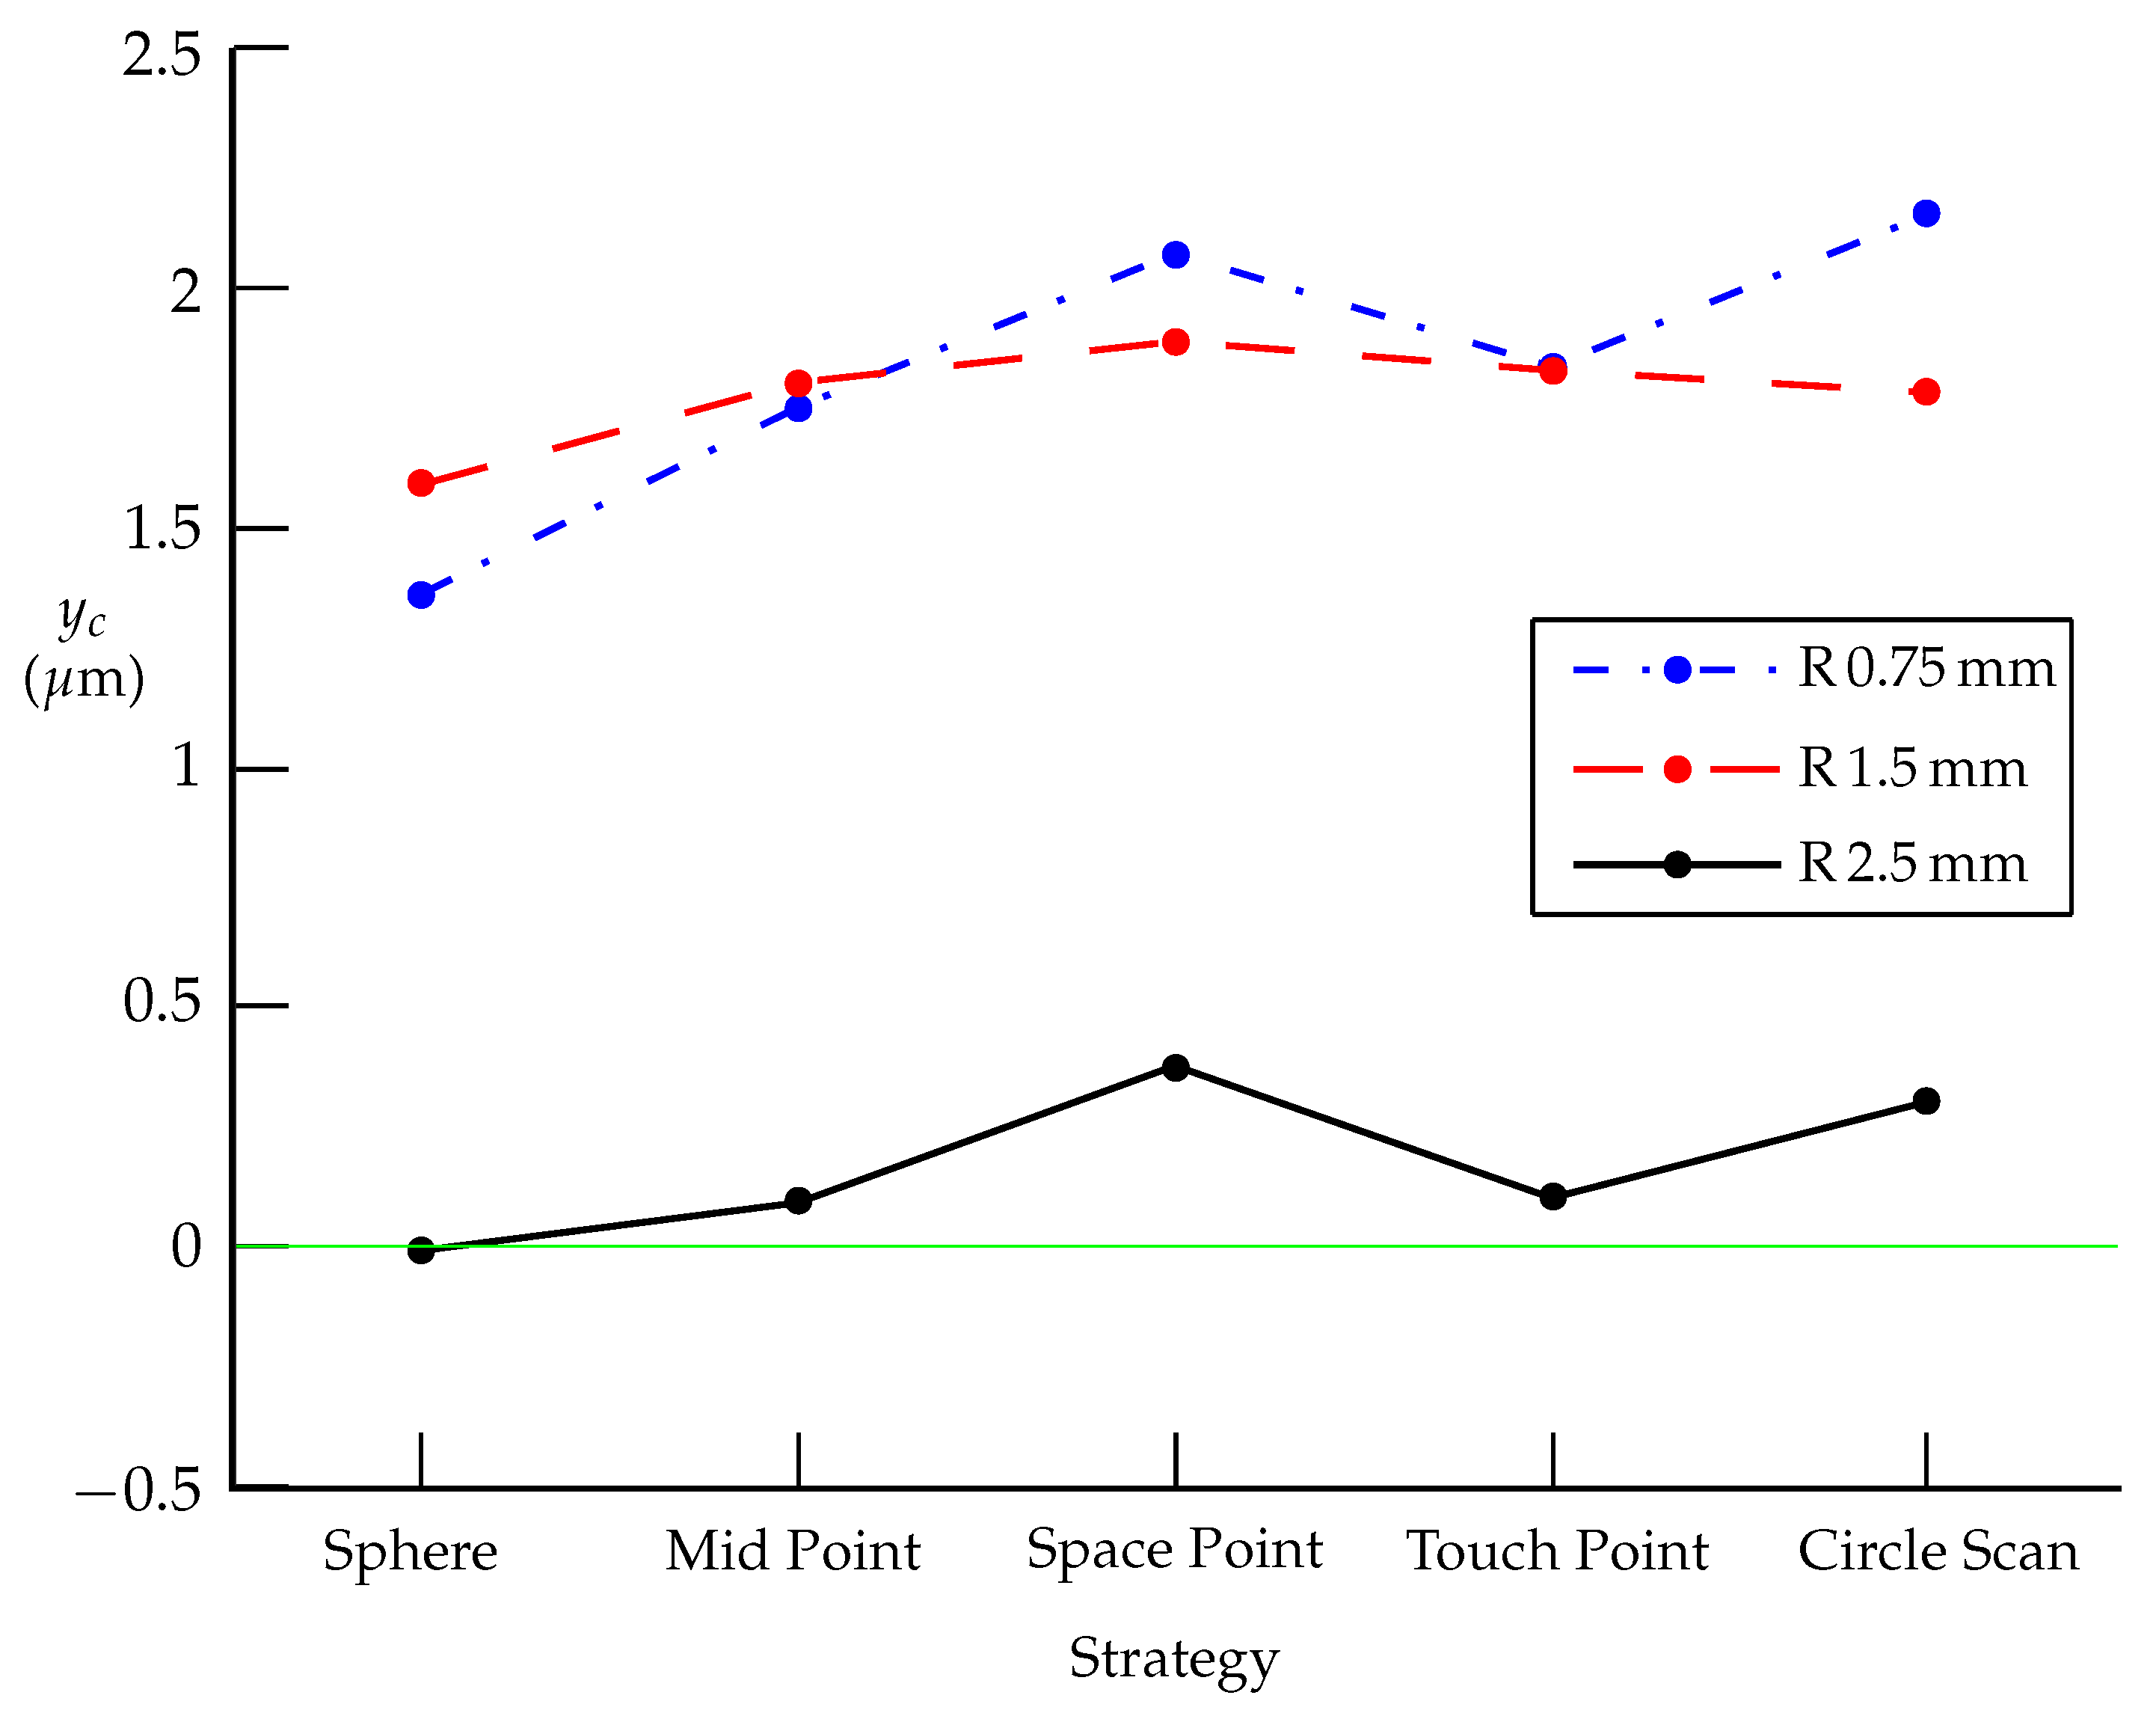
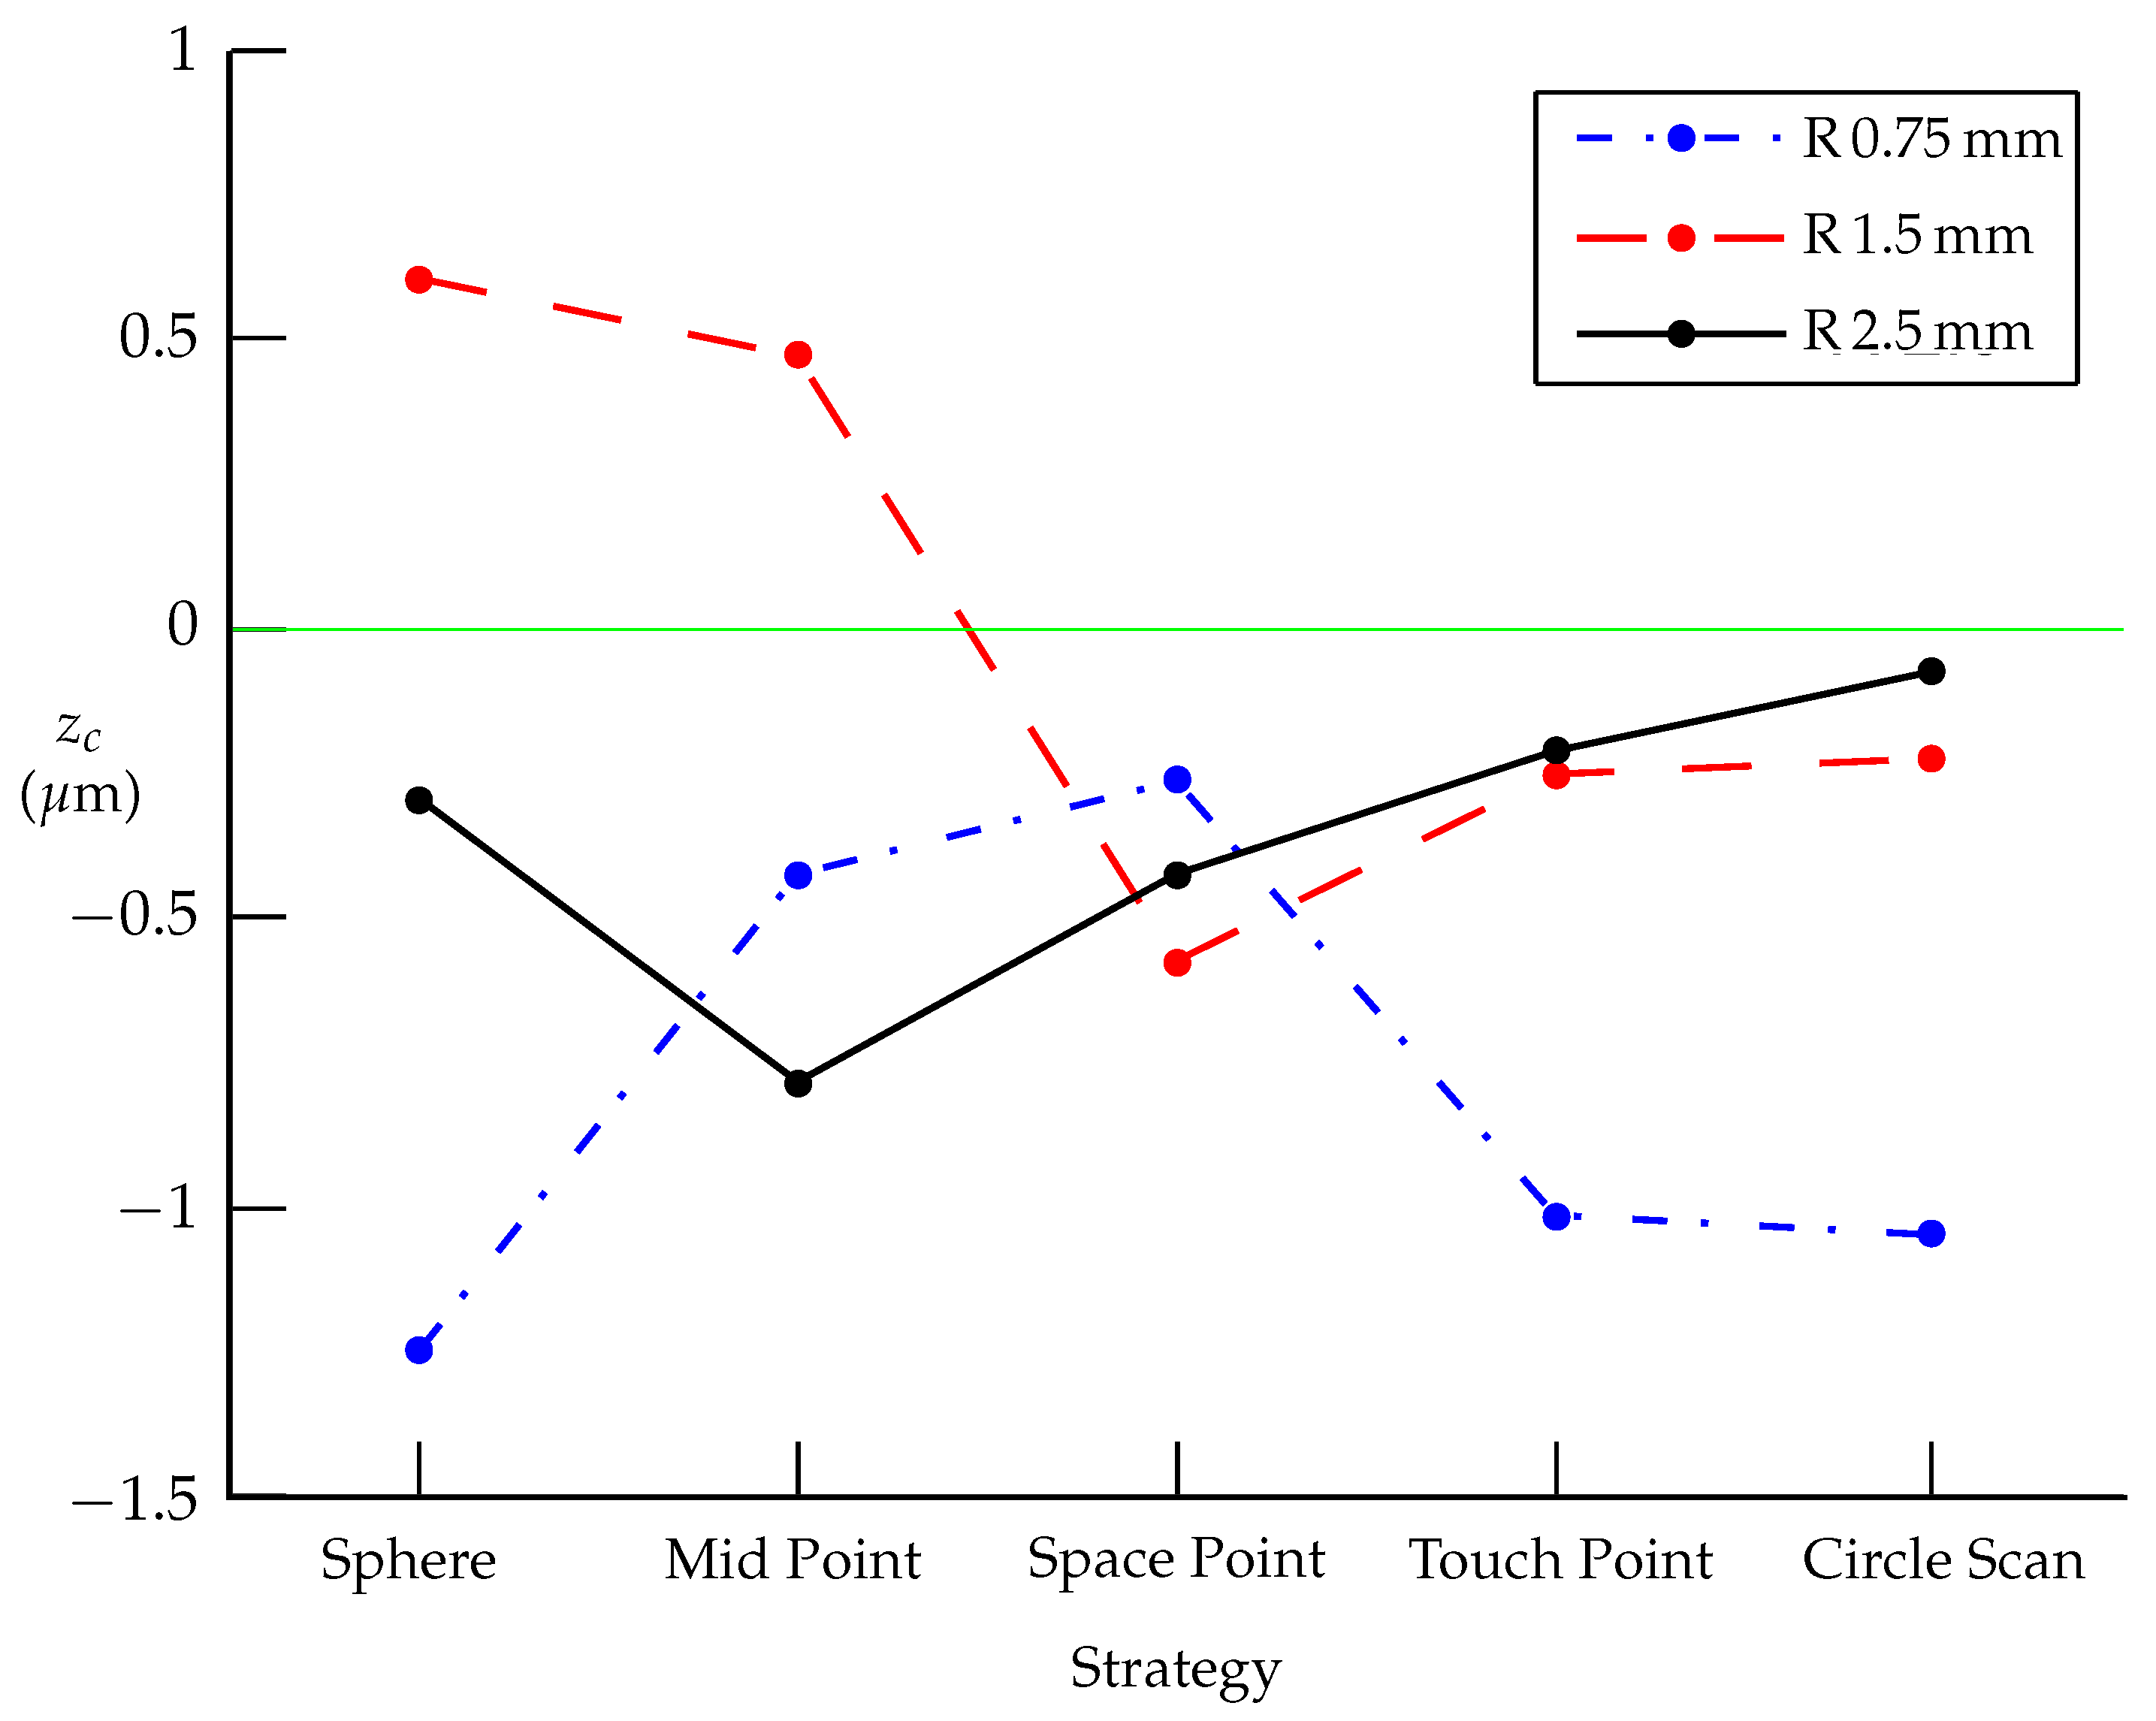
The centers of spheres created from individual measurements depend on the evaluation method (LSQ, minimum feature) (see Table 4, Table 7 and Table 10), as well as on the elimination of outliers and data filtering. Figure 8, Figure 9 and Figure 10 show the position of the evaluated center for different probe radii and strategies. It is evident that for measuring the diameter and center of the sphere, the probe with a radius of R = 2.5 mm provides the best results for all coordinates, while the R = 1.5 mm probe gives better results for the y c and z c coordinates than the R = 0.75 mm probe. The results are consistent with [14,15].
5.
Form values in Calypso for a Feature and the values obtained using the geometric tolerance Form may not be identical. In the experiment, the Sphere features were created using the LSQ evaluation method, which corresponds to the Kåsa/Newton method. The geometric tolerance Form value in Calypso corresponds to the Minimum Feature evaluation method and to the Midrange method. Differences are present in both the diameters of the Spheres and their centers. The differences between the Form of the Sphere feature and Kåsa/Newton and between Form and Midrange are on the order of picometers. From the definitions of LSQ and Minimum Feature, and from the mathematical computation of RMSE, it follows that the geometric tolerance values from Minimum Feature (Midrange) will always be smaller than those from LSQ. Zaimovic-Uzunovic [13] recommends using a stylus tip with the smallest possible diameter for measuring shape deviations to limit mechanical filtering during surface measurement.
6.
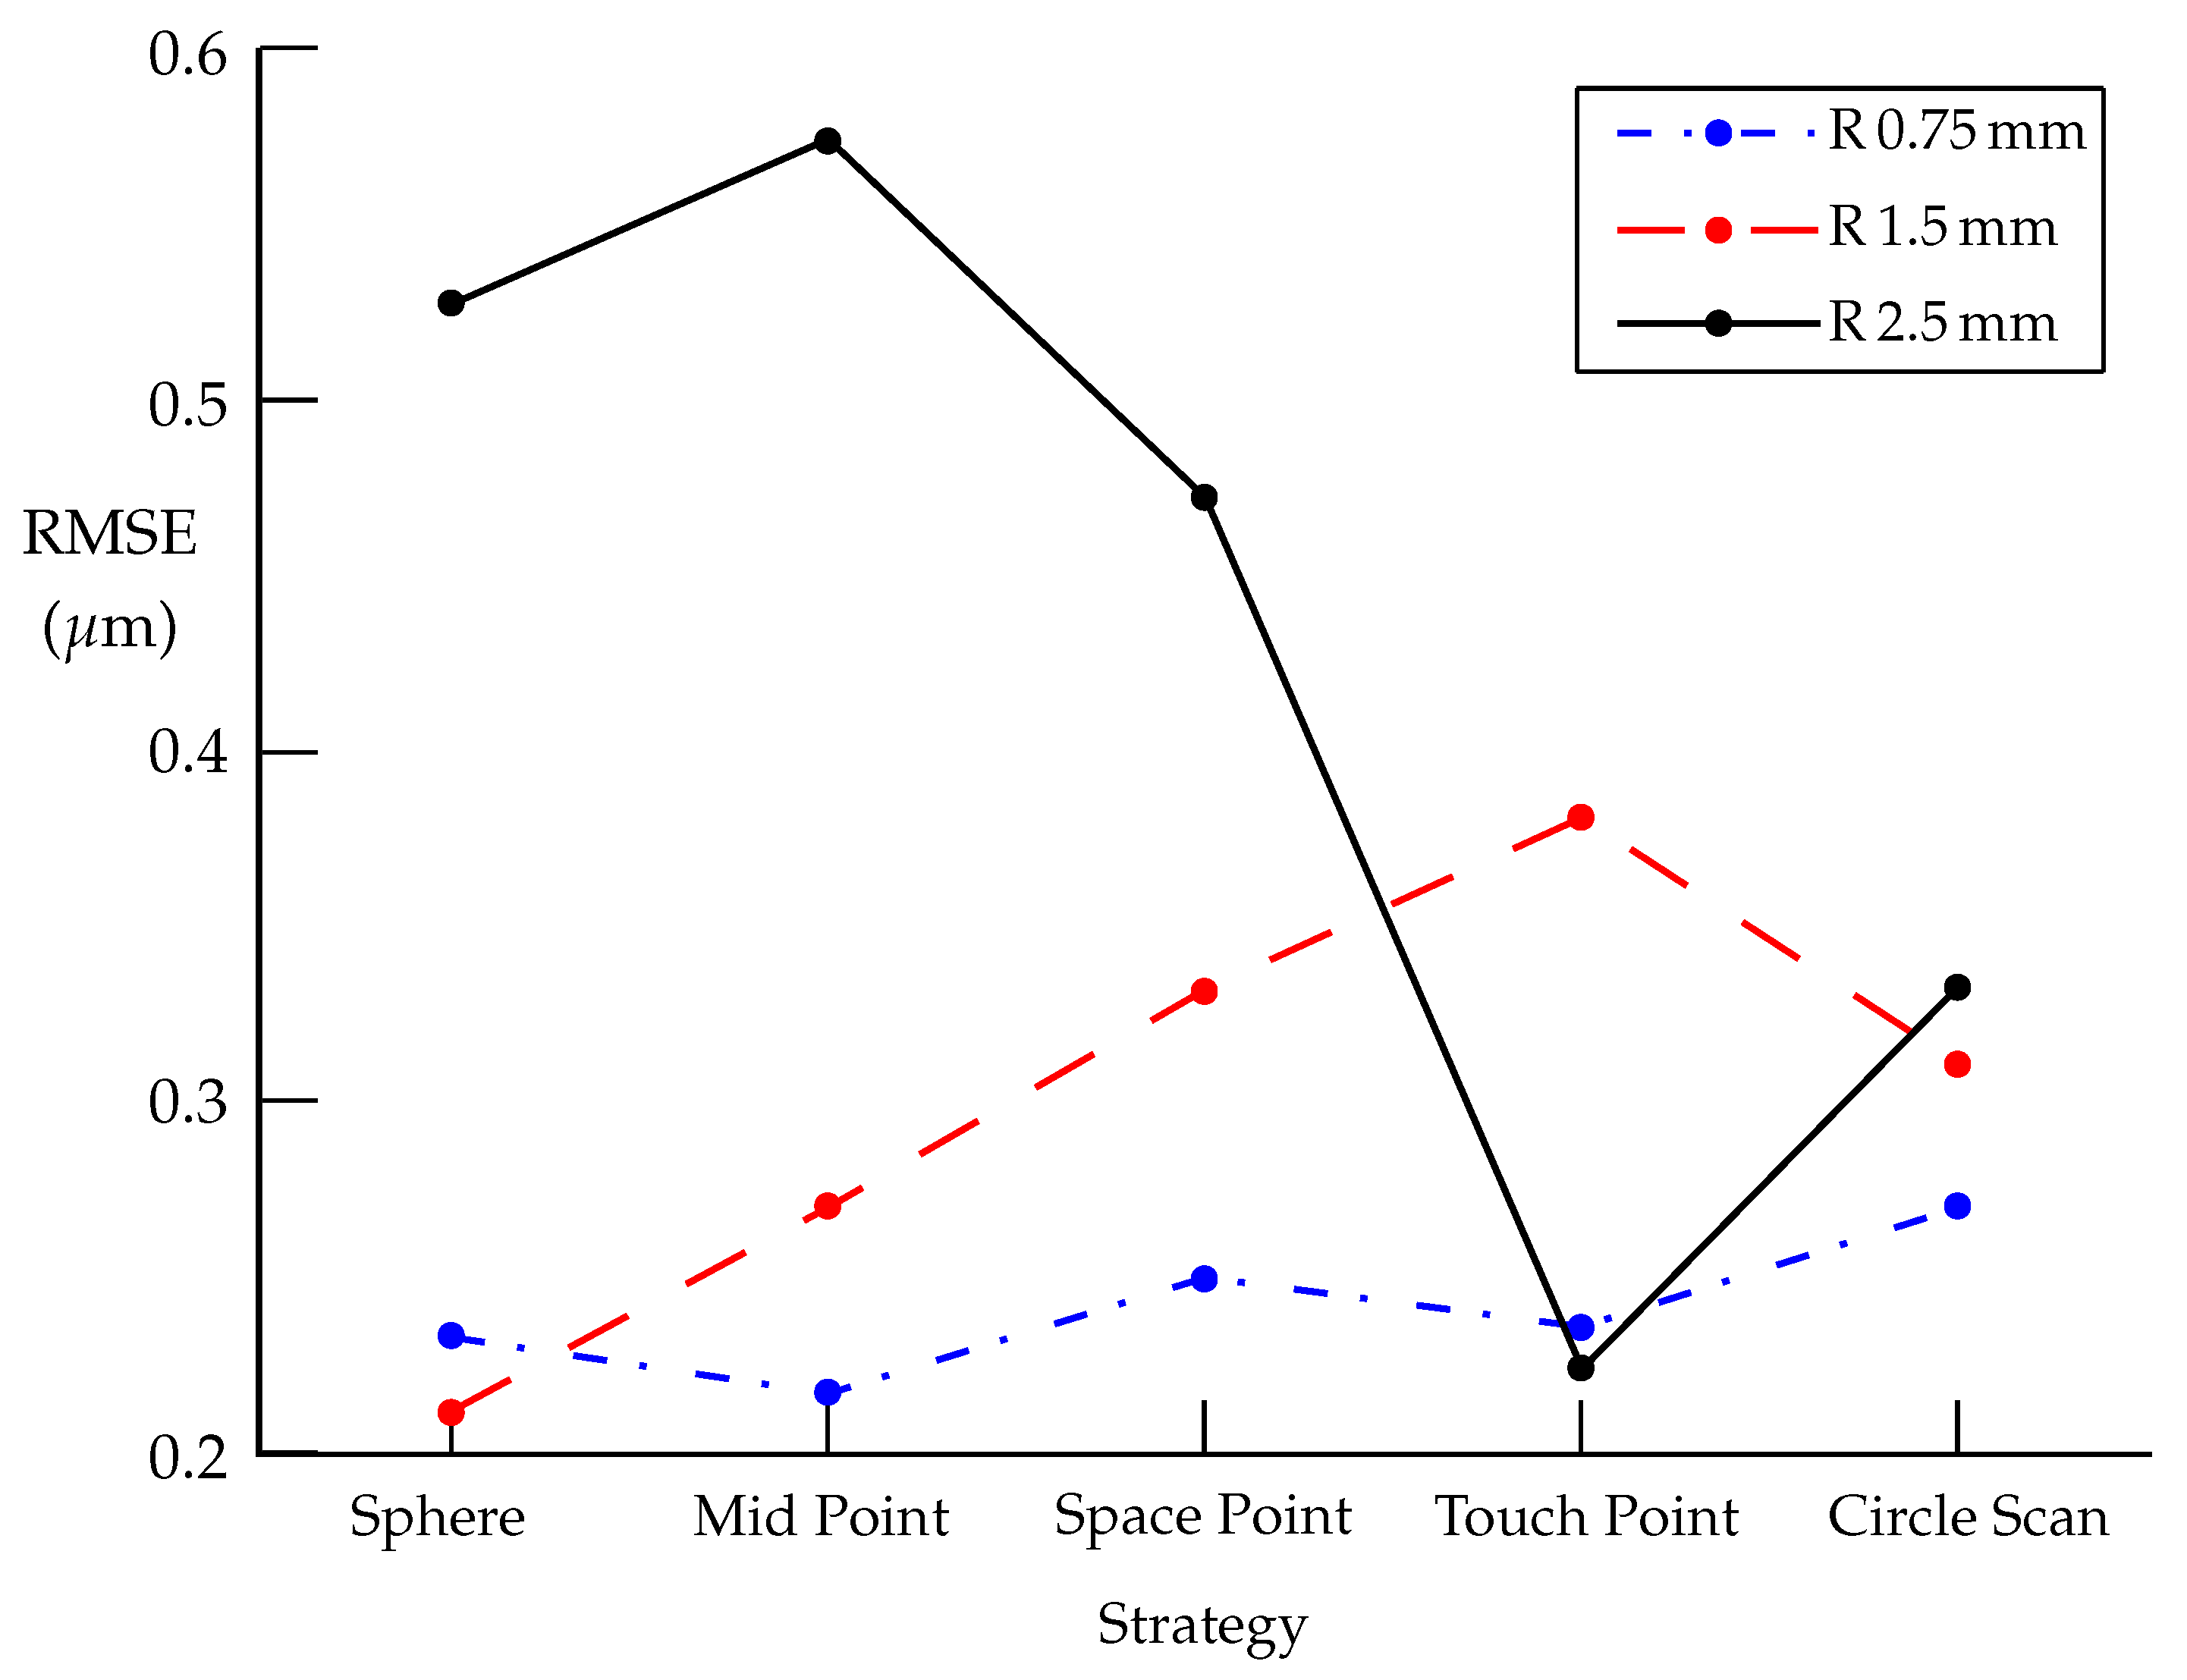
The smallest RMSE values (Table 3 and Figure 11) and their variation ranges (VR) for the strategies Sphere, Mid Point, Space Point, and Touch Point were achieved for the probe r probe = 0.750844 mm, where the RMSE was at most 0.25 μ m and the variation range was 0.033 μ m. For the Kåsa/Newton method, RMSE values are always less than 0.575 μ m ( r probe = 2.500557 mm, Mid Point). These results also correspond to the half-width values from Calypso (maximum 0.532 μ m, VR 0.099 μ m) and Form 2 σ (maximum 0.463 μ m, VR 0.079 μ m).
7.
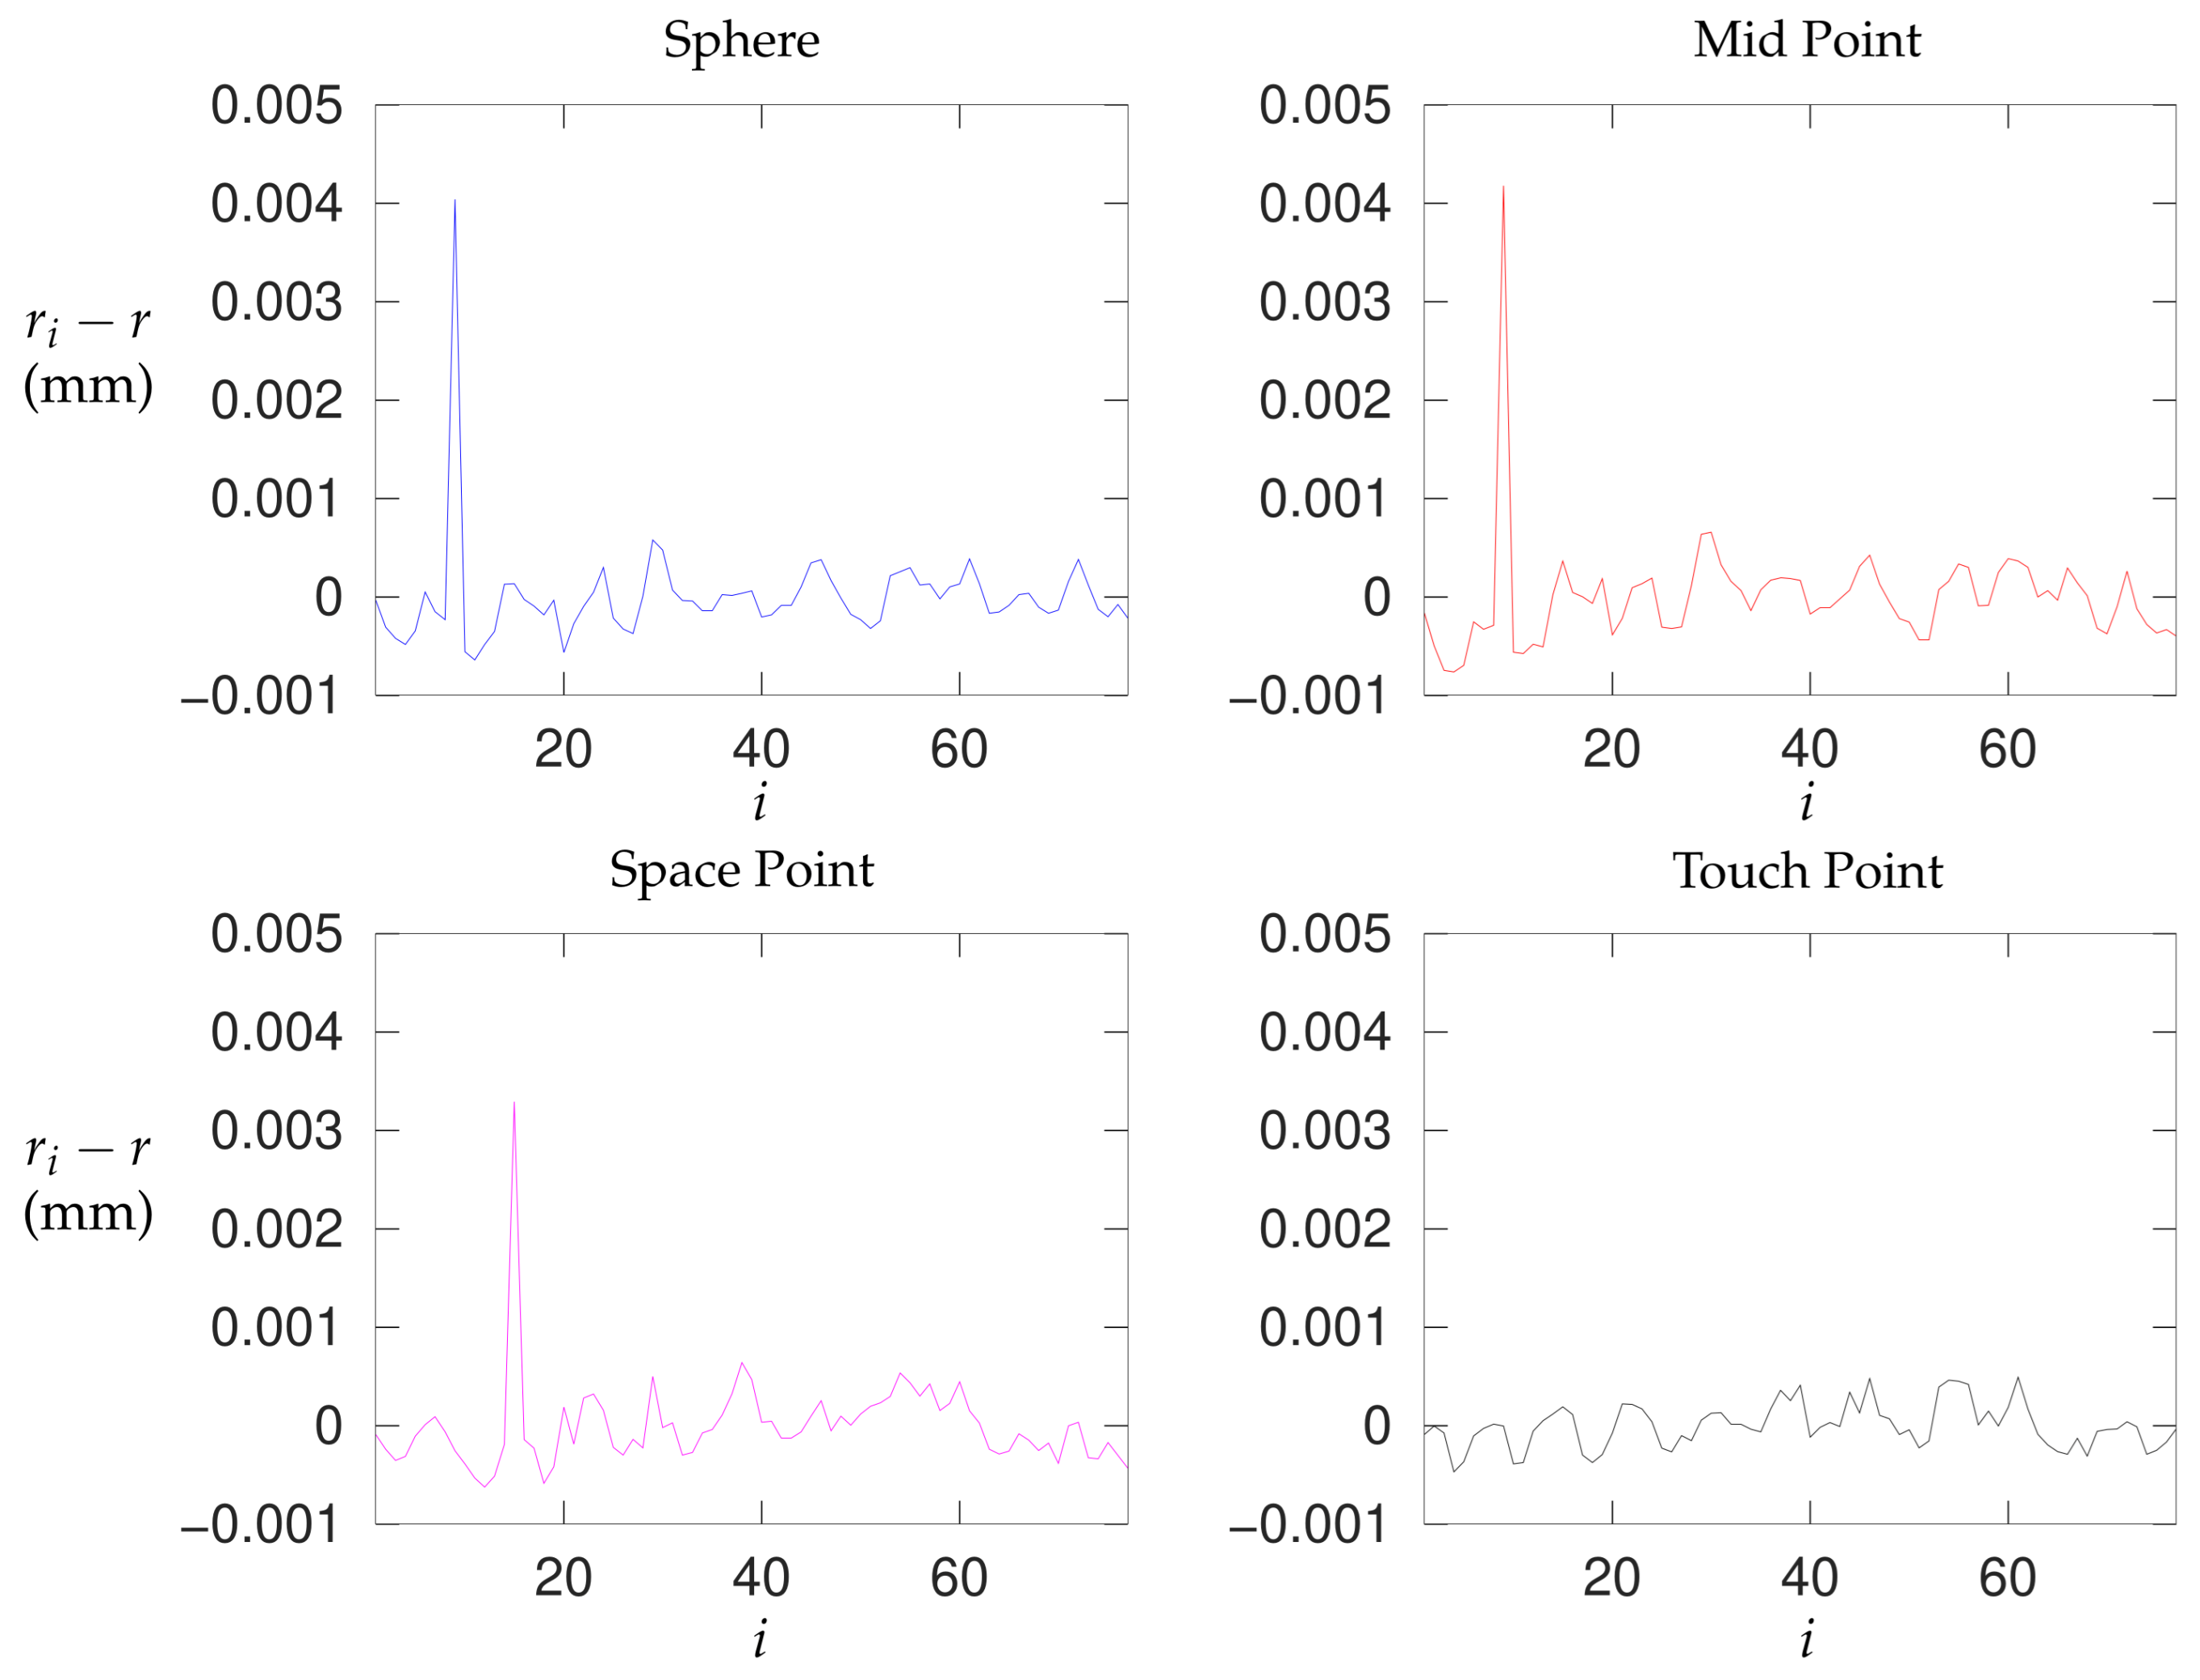
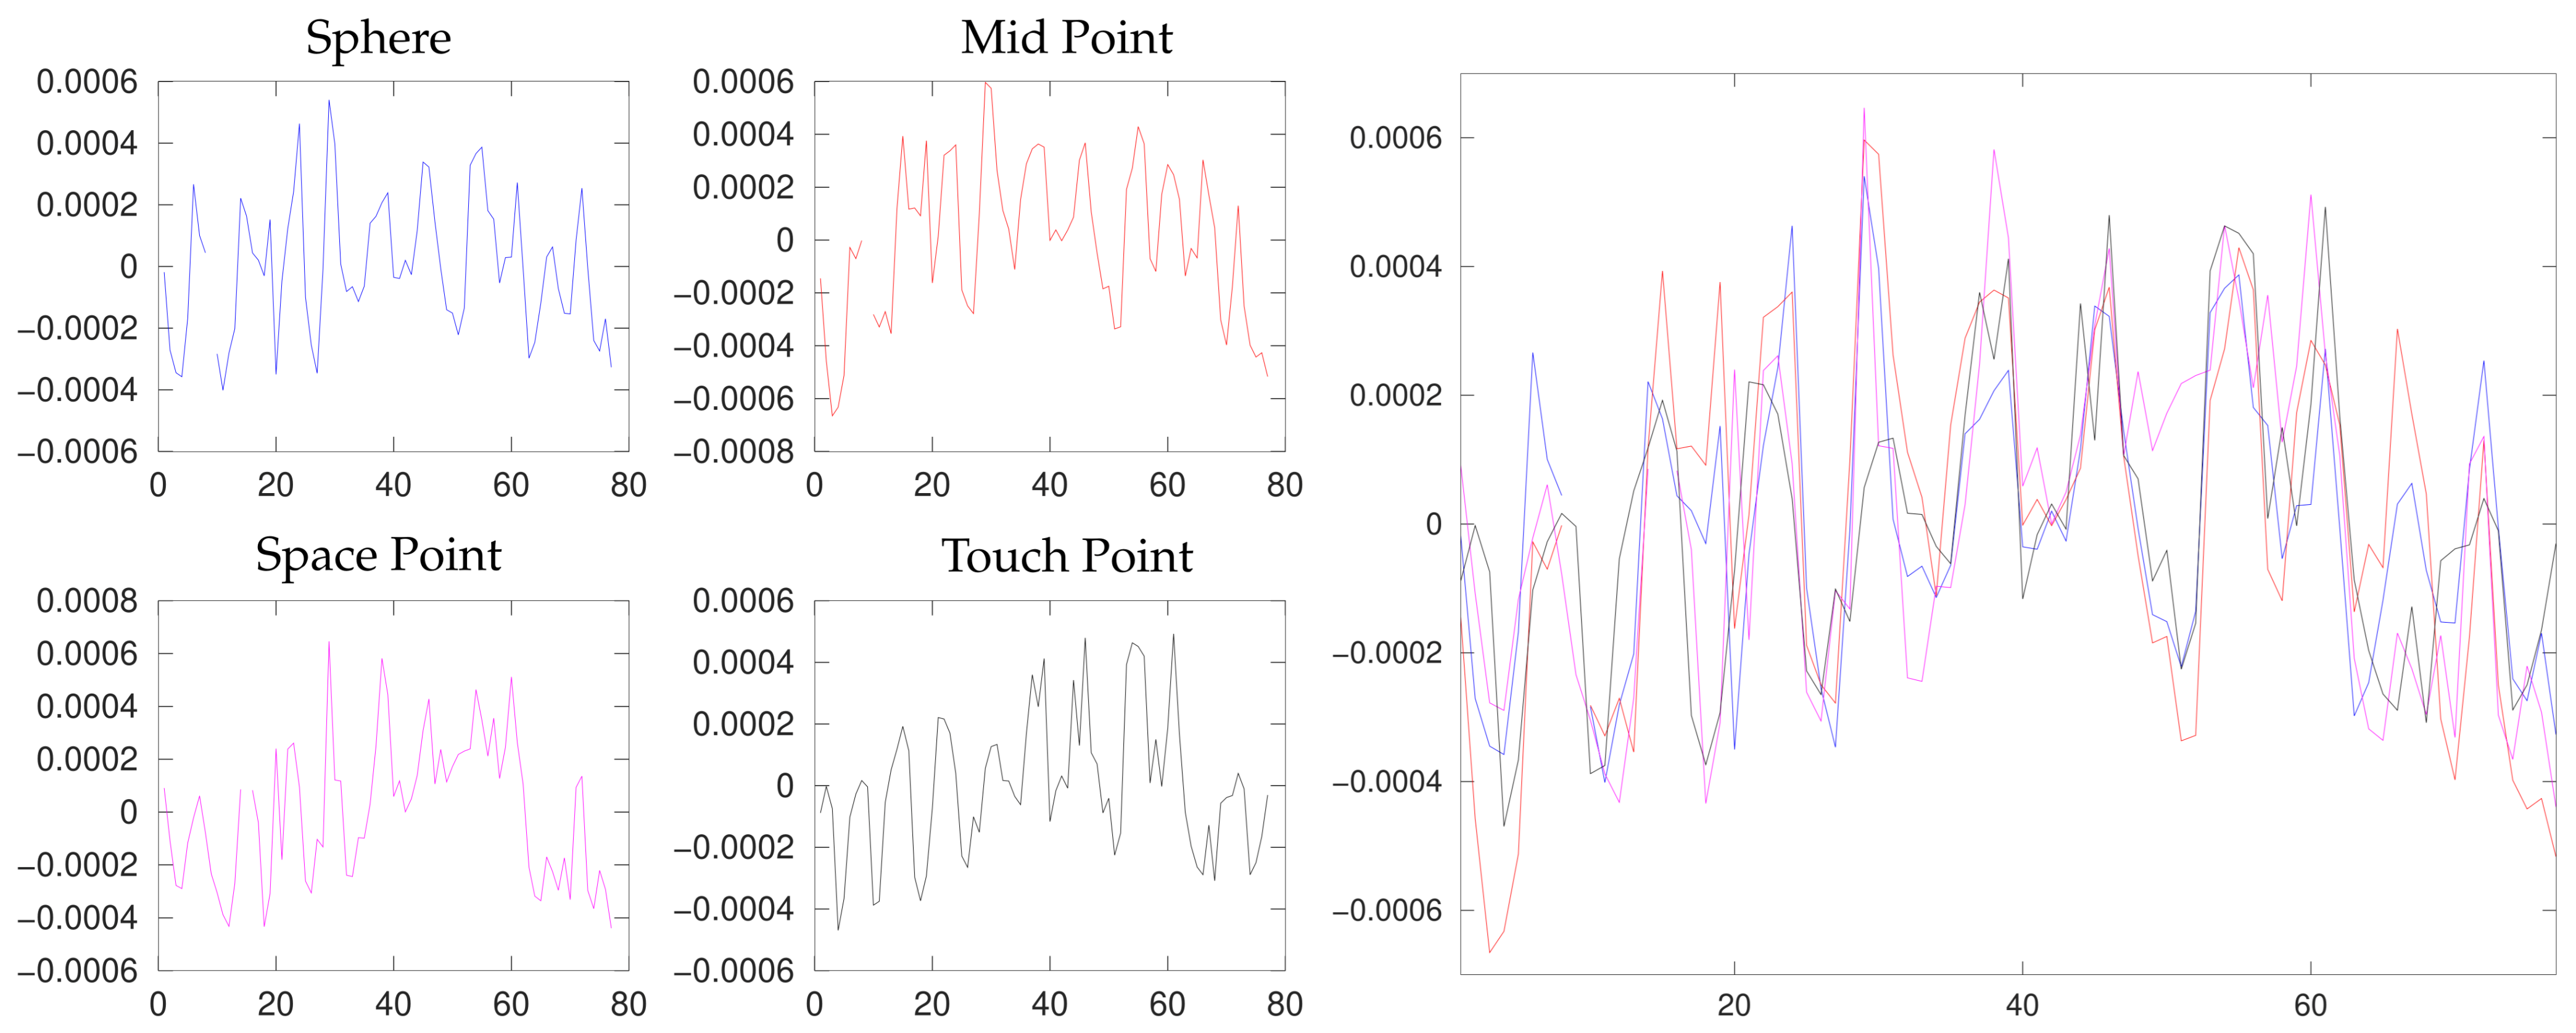
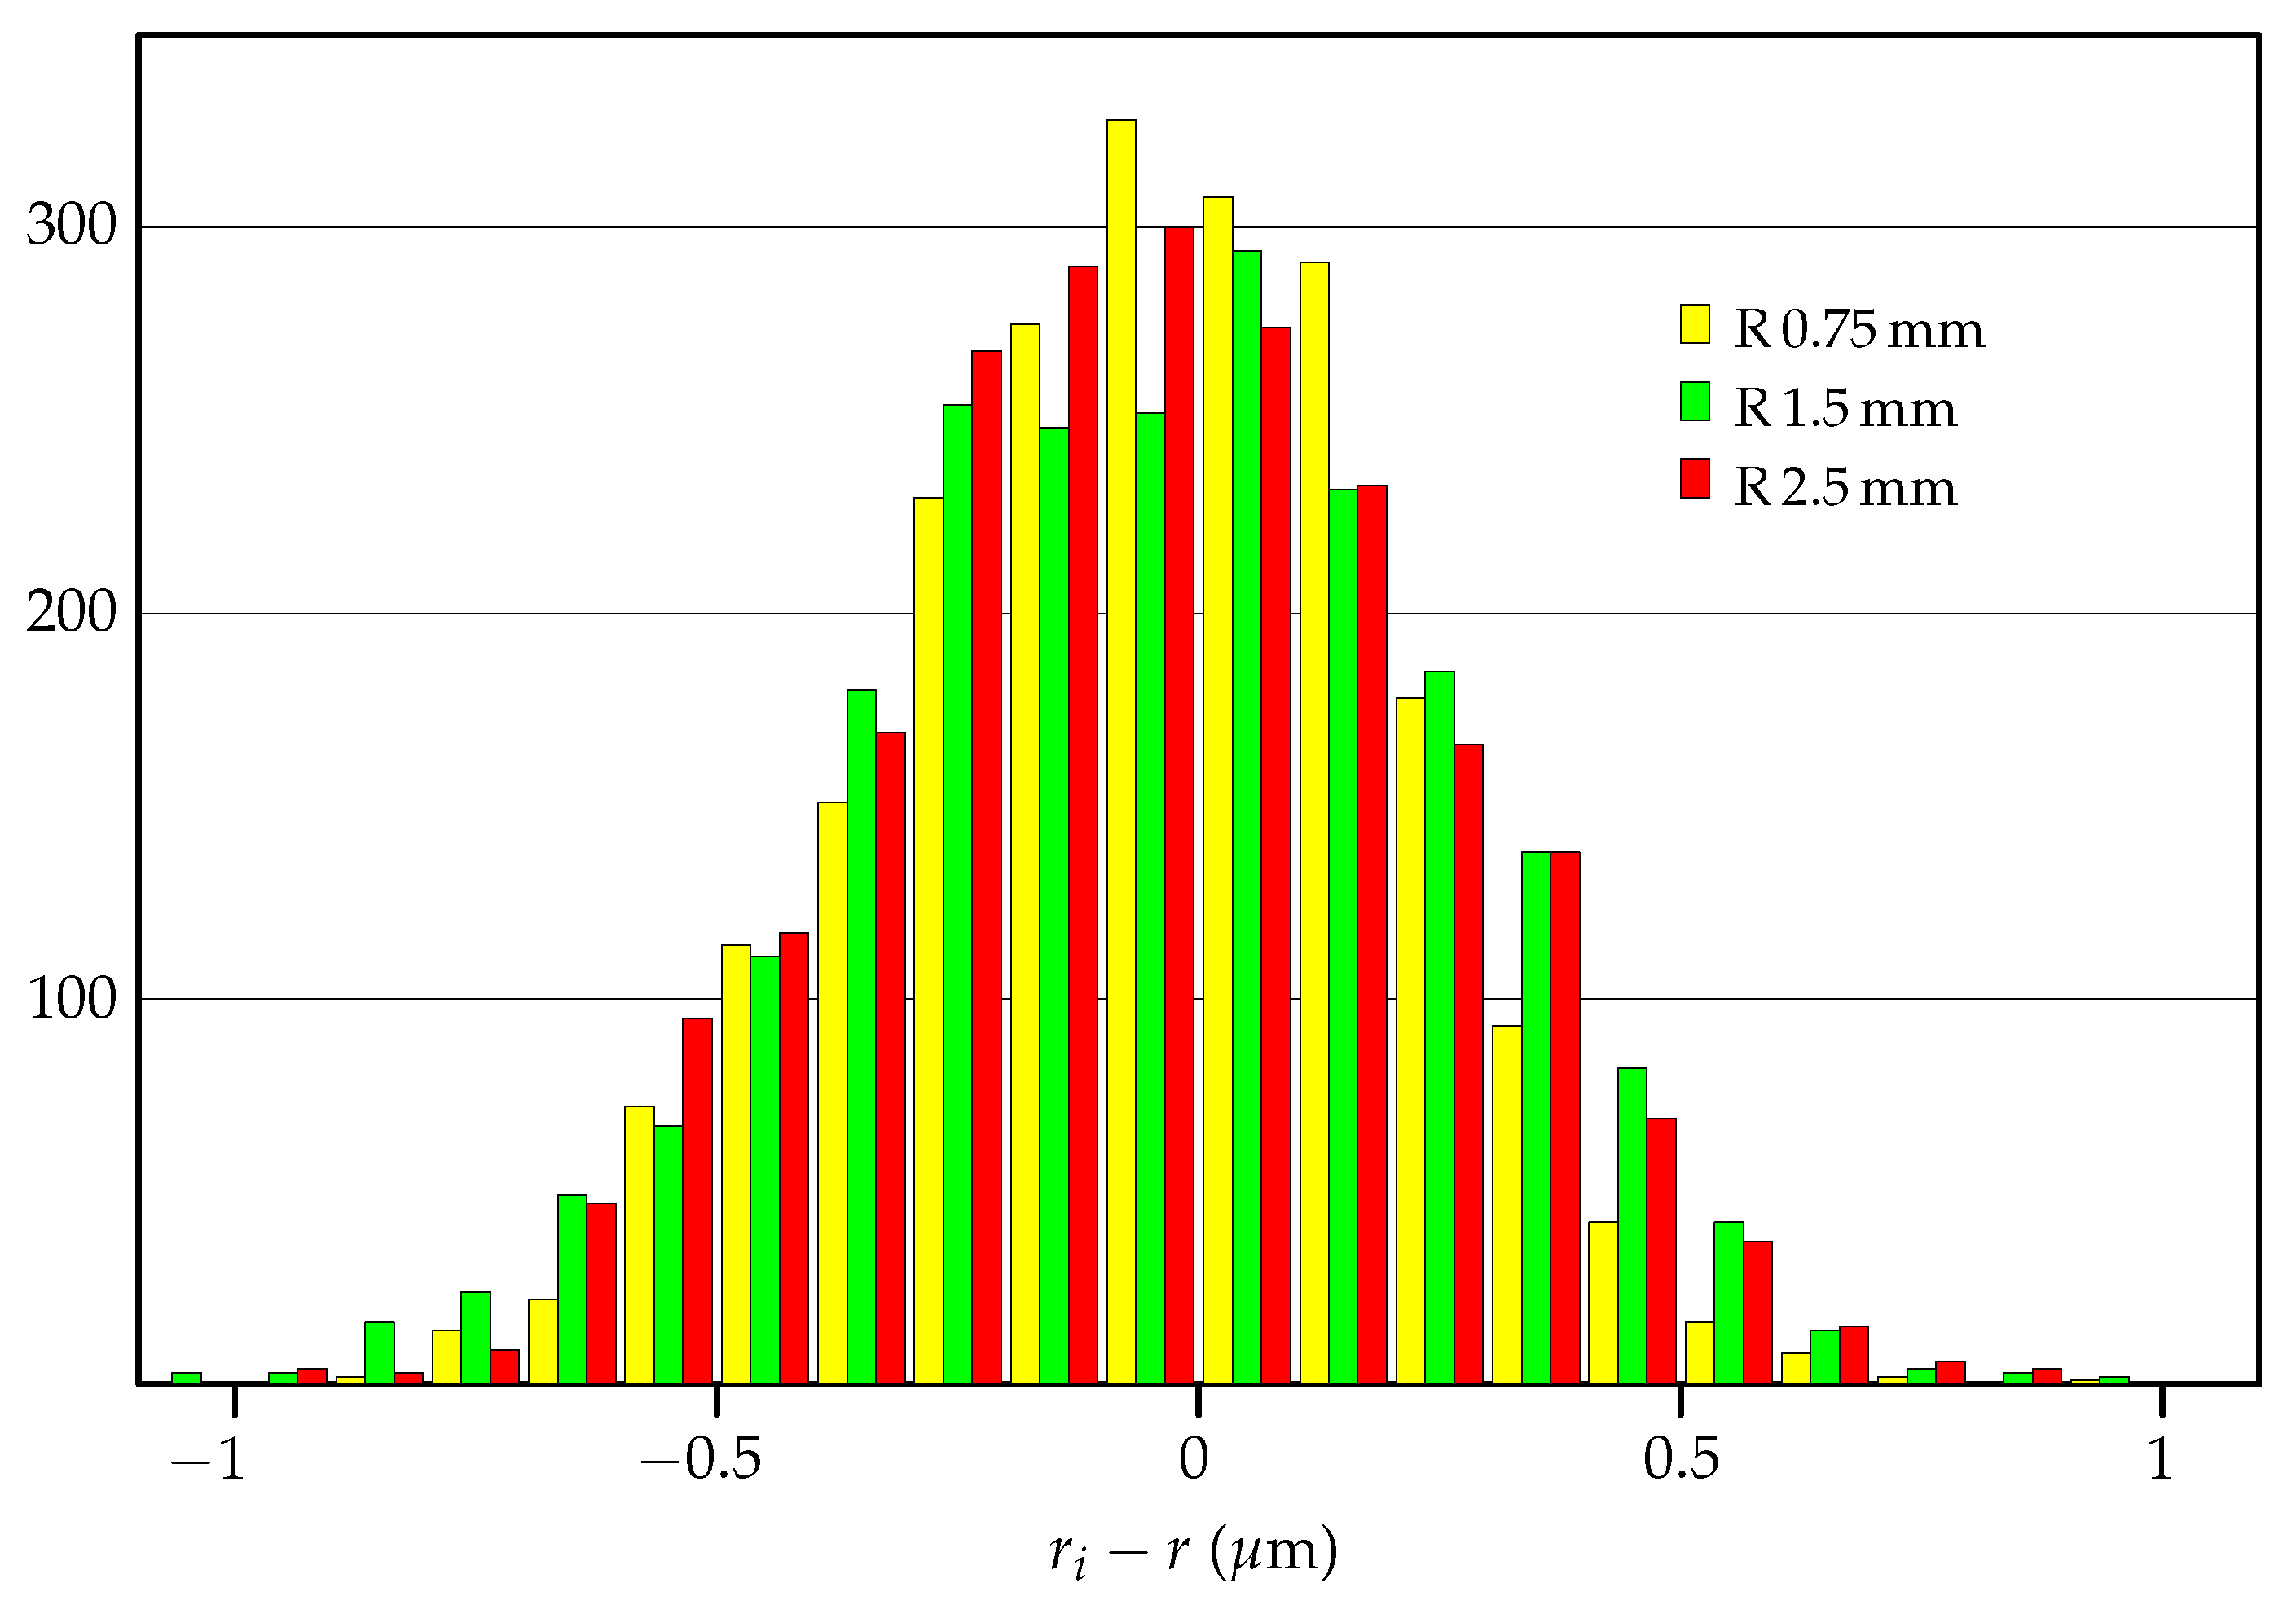
Figure 12 shows the differences between the radii r i defined in (4) and the calculated radius r, for i = 1 , …, 77, for four measurement options for r probe = 2.500557 mm. The Sphere and Mid Point datasets contain the extreme point ( x 9 , y 9 , z 9 ) , and the Space Point dataset contains the extreme point ( x 15 , y 15 , z 15 ) —so only one point in each of these cases causes the large half-width values in the corresponding rows of Table 3. Removing this point leads to smaller RMSE values; however, d d nominal and d d certificate become larger (see Figure 13 and Table 11 and Table 13). Figure 14 shows a histogram of the differences r i r for the Circle Scan option for all three probe radii. Several extreme values for each radius have been ignored; the number of points has been 2147 of 2151, 2203 of 2205, and 2244 of 2253, respectively, for probe radii 0.75 , 1.5 , and 2.5 mm. We believe that the difference between the three distributions is insignificant.
Considering further questions arising from the measurements, the aim of future research will be to investigate the influence of probing force and scanning dynamics on measurement results on curved surfaces.
Table 13. Results of the 3 σ filtering for r probe = 2.500557 dataset ( μ m).
OptionForm
3 σ
Kåsa
Newton
Mid
Range
Kåsa
Newton
Mid
Range
Kåsa
Newton
Half-Width w / 2 (μm)RMSE (μm) d d nominal
Sphere0.4300.4710.4300.2190.232 0.680
Mid Point0.5610.6310.5640.2920.320 0.475
Space Point0.4870.5430.4870.2660.288 0.874
Touch Point0.4230.4810.4230.2240.235 0.801

5. Conclusions

For all measurement strategies, the deviations of the measured sphere diameters from the certified value are within the maximum permissible error of the length measurement E 0 , MPE calculated in (1) for d = d nominal . The measurement results confirmed that the choice of probing system affects the measurement accuracy. The probe with R = 2.5 mm provided the most accurate results for estimating the sphere’s radius. The differences between the probes are very small, likely because the measurements were performed on a calibration artifact with high accuracy and surface quality. For the LSQ (Gauss) evaluation method, the results for sphere diameter and center correspond to those obtained by the Kåsa/Newton methods; this also applies to the geometric tolerance Form in the Sphere Feature window. The mathematical Midrange method corresponds to the Minimum Feature setting for the geometric tolerance Form. Eliminating outliers was also shown to improve results. The Point mode Mid Point provides the best sphere diameter estimations because, for “exact” spherical surface, the probe centers lie exactly on the sphere with the same center as the measured sphere and a radius enlarged by the value r probe .
The research has only minimal practical limitations. The critical aspect was defining points for measuring the sphere. For the Sphere and Mid Point measurement strategies, this choice has no effect, as the measurement is performed in the direction of the normal to the measured surface. In the case of the Space Point strategy, the result can be affected by two factors. The first is the initial point measurement along the selected axis, where on a highly curved surface, it is more difficult to achieve probe stability, and thus to accurately determine the point position and the reference normal. The second factor is obtaining the normal for the measured point from three surrounding points—an inaccurate measurement of any of them affects the resulting normal and, consequently, the final result. For the Touch Point measurement, the same considerations apply as for the initial Space Point measurement. The stability of probing can be improved by adjusting the dynamics and measuring force; however, with a large number of points, this significantly increases the total measurement time. In practice, a limiting factor may also be the touch probe itself, which cannot compensate for the probing force when the surface curvature changes.
The results and practical experience indicate that measurements on geometrically complex surfaces can be problematic if the measurement strategy is insufficiently or improperly defined. The main issue arises with highly curved surfaces, where the stability of the probe’s contact with the measured surface is reduced.
Further research will focus on the influence of measurement dynamics, probing force, and other parameters on measurement accuracy.

Author Contributions

Conceptualization, M.D. and T.T.; Methodology, J.B., M.D. and T.T.; Software, J.B.; Validation, J.B., M.D. and T.T.; Investigation, M.D. and T.T.; Data curation, J.B. and T.T.; Writing—original draft, J.B., M.D. and T.T.; Writing—review & editing, J.B., M.D. and T.T.; Supervision, M.D. and T.T.; Project administration, T.T.; Funding acquisition, M.D. All authors have read and agreed to the published version of the manuscript.

Funding

This work was supported by the projects VEGA 1/0191/24 “Development, optimization, and application of coordinate measurement strategies of geometric parameters and structure of additive products” and KEGA 004TUKE-4/2024 “Innovative methods of implementing students’ digital skills in length metrology”.

Data Availability Statement

The data presented in this study are available on request from the corresponding author.

Conflicts of Interest

The authors declare that they have no conflicts of interest.

References

  1. Varga, J.; Tóth, T.; Frankovský, P.; Dulebová, Ľ.; Spišák, E.; Zajačko, I.; Živčák, J. The Influence of Automated Machining Strategy on Geometric Deviations of Machined Surfaces. Appl. Sci. 2021, 11, 2353. [Google Scholar] [CrossRef]
  2. Mian, S.H.; Al-Ahmari, A. New developments in coordinate measuring machines for manufacturing industries. Int. J. Metrol. Qual. Eng. 2014, 5, 101. [Google Scholar] [CrossRef]
  3. Boeckmans, B.; Vlaeyen, M.; Probst, G.; Dewulf, W.; Haitjema, H.; Kruth, J.-P. CMM tactile probe performance evaluation according to ISO/DIS 10360-5:2018. In Proceedings of the Laser Metrology and Machine Performance XIII—13th International Conference and Exhibition on Laser Metrology, Machine Tool, CMM and Robotic Performance (LAM|DAMAP 2019), Aachen, Germany, 9–12 June 2019; pp. 111–119. Available online: https://www.euspen.eu/knowledge-base/LAM19121.pdf (accessed on 6 November 2025).
  4. Flack, D. Measurement Good Practice Guide No. 42. CMM Verification; National Physical Laboratory. Queen’s Printer and Controller of HMSO: Teddington, UK, 2011; ISSN 1368-6550. Available online: https://eprintspublications.npl.co.uk/2045/1/mgpg42.pdf (accessed on 6 November 2025).
  5. Lee, M.; Cho, N.-G. Surface normal estimation of freeform surface using efficient neighborhood selection method in point cloud data. Meas. Sci. Technol. 2013, 24, 095001. [Google Scholar] [CrossRef]
  6. Shen, Y.; Ren, J.; Huang, N.; Zhang, Y.; Zhang, X.; Zhu, L. Surface form inspection with contact coordinate measurement: A review. Int. J. Extrem. Manuf. 2023, 5, 022006. [Google Scholar] [CrossRef]
  7. Weckenmann, A.; Estler, T.; Peggs, G.; McMurtry, D. Probing Systems in Dimensional Metrology. CIRP Ann. 2004, 53, 657–684. [Google Scholar] [CrossRef]
  8. Carl Zeiss Industrielle Messtechnik GmbH. Influences on Measuring Results, EN_60_023_014I, Printed in Germany, CZ-II/2014; Carl Zeiss Industrielle Messtechnik GmbH: Oberkochen, Germany, 2014. [Google Scholar]
  9. Sadaoui, S.E.; Phan, N.D.M. Touch Probe Measurement in Dimensional Metrology: A Review. Int. J. Automot. Mech. Eng. 2021, 18, 8647–8657. [Google Scholar] [CrossRef]
  10. Renishaw User Guide: Precision Styli, Part Number: H-1000-3304. Available online: https://www.renishaw.com/resourcecentre/en/details/--130708?lang=en (accessed on 23 July 2025).
  11. What Is a CMM Stylus? Available online: https://hexagon.com/resources/resource-library/what-is-a-cmm-stylus (accessed on 23 July 2025).
  12. Zeiss Metrology Shop. Available online: https://shop.metrology.zeiss.co.uk/ (accessed on 23 July 2025).
  13. Zaimovic-Uzunovic, N.; Lemes, S. Cylindricity Measurement on a Coordinate Measuring Machine. In Advances in Manufacturing; Hamrol, A., Ciszak, O., Legutko, S., Jurczyk, M., Eds.; Lecture Notes in Mechanical Engineering; Springer: Cham, Switzerland, 2018. [Google Scholar] [CrossRef]
  14. Lou, S.; Brown, S.B.; Sun, W.; Zeng, W.; Jiang, X.; Scott, P.J. An investigation of the mechanical filtering effect of tactile CMM in the measurement of additively manufactured parts. Measurement 2019, 144, 173–182. [Google Scholar] [CrossRef]
  15. Miguel, P.C.; King, T.; Abackerli, Á. A review on methods for probe performance verification. Measurement 1998, 23, 15–33. [Google Scholar] [CrossRef]
  16. Johnson, R.P.; Yang, Q.; Butler, C. Dynamic error characteristics of touch trigger probes fitted to coordinate measuring machines. IEEE Trans. Instrum. Meas. 1998, 47, 1168–1172. [Google Scholar] [CrossRef]
  17. Ali, S. Probing System Characteristics in Coordinate Metrology. Meas. Sci. Rev. 2010, 10, 120–129. [Google Scholar] [CrossRef]
  18. Woźniak, A.; Dobosz, M. Influence of Measured Objects Parameters on CMM Touch Trigger Probe Accuracy of Probing. Precis. Eng. 2005, 29, 290–297. [Google Scholar] [CrossRef]
  19. Flack, D. Measurement Good Practice Guide No. 41. CMM Measurement Strategies; National Physical Laboratory. Queen’s Printer and Controller of HMSO: Teddington, UK, 2014; ISSN 1368-6550. Available online: https://www.npl.co.uk/resources/gpgs/cmm-measurement-strategies (accessed on 6 November 2025).
  20. ZEISS Measuring Strategies Cookbook—English Edition, 11th ed.; Carl Zeiss Industrial Metrology: Oberkochen, Germany, 2019.
  21. Zeng, L.; Chen, Y. Measurement point layout strategy of free-form surface based on gridding using coordinate measuring machine. Int. J. Metrol. Qual. Eng. 2023, 14, 7. [Google Scholar] [CrossRef]
  22. Bastas, A. Comparing the probing systems of coordinate measurement machine: Scanning probe versus touch-trigger probe. Measurement 2020, 156, 107604. [Google Scholar] [CrossRef]
  23. Swornowski, P.; Rucki, M. The errors occurring in the CMM fitting method. Meas. Sci. Rev. 2003, 3, 135–138. Available online: https://www.measurement.sk/2003/S3/Swornowski.pdf (accessed on 6 November 2025).
  24. Ali, S.H.R. The influence of fitting algorithm and scanning speed on roundness error for 50 mm standard ring measurement using CMM. Metrol. Meas. Syst. 2008, 15, 33–53. [Google Scholar]
  25. Calvo, R.; D’Amato, R.; Gómez, E.; Domingo, R. A Comparative Experimental Study of an Alternative CMM Error Model under Least-Squares and Minimum Zone Fittings for Industrial Measuring. Procedia Eng. 2015, 132, 780–787. [Google Scholar] [CrossRef]
  26. Calypso Networks Association. Calypso Basics—Operating Instructions; Version 2016; Zeiss: Oberkochen, Germany, 2016. [Google Scholar]
  27. Tóth, T.; Dovica, M.; Buša, J.; Buša, J. Verification of Coordinate Measuring Machine Using a Gauge Block. Meas. Sci. Rev. 2024, 24, 226–233. [Google Scholar] [CrossRef]
  28. Mazur, T.; Szymanski, T.; Samociuk, W.; Rucki, M.; Ryba, T. The Impact of Probe Angle and Swivel Length on Contact Point Identification in Coordinate Measuring Machine Measurements: A Case Study. Sensors 2025, 25, 2008. [Google Scholar] [CrossRef]
  29. Mazur, T.; Rucki, M.; Jakubowicz, M.; Cepova, L. Analysis of the Direction-Dependent Point Identification Accuracy in CMM Measurement. In Advances in Manufacturing III. MANUFACTURING 2022; Diering, M., Wieczorowski, M., Harugade, M., Pereira, A., Eds.; Lecture Notes in Mechanical Engineering; Springer: Cham, Switzerland, 2022. [Google Scholar] [CrossRef]
  30. Mazur, T.; Cepova, L.; Szymanski, T.; Rucki, M. Analysis of the Planar Point Identification Accuracy in CMM Measurements. Sensors 2022, 22, 7005. [Google Scholar] [CrossRef] [PubMed]
  31. Intro to Coordinate Metrology. Available online: https://hexagon.com/resources/resource-library/intro-coordinate-metrology (accessed on 24 September 2025).
  32. Giganto, S.; Martínez-Pellitero, S.; Meana, V.; Cuesta, E.; Barreiro, J. Influence of point cloud filtering on optical inspection of additive manufactured metal parts. Precis. Eng. 2024, 90, 12–20. [Google Scholar] [CrossRef]
  33. Mohaghegh, K.; Roncevic, V.; Andreasen, J.L.; De Chiffre, L. Investigation on the effect of filtering and plane creation on differences between XCT and CMM measurements on a miniature step gauge. In Proceedings of the 19th European Conference on Non-Destructive Testing, Göteborg, Sweden, 11–15 October 2020. [Google Scholar] [CrossRef]
  34. Raja, J.; Muralikrishnan, B.; Fu, S. Recent advances in separation of roughness, waviness and form. Precis. Eng. 2002, 26, 222–235. [Google Scholar] [CrossRef]
  35. Muralikrishnan, B.; Ren, W.; Stanfield, E.; Everett, D.; Zheng, A.; Doiron, T. Applications of profile filtering in the dimensional metrology of fuel cell plates. Meas. Sci. Technol. 2013, 24, 065003. [Google Scholar] [CrossRef]
  36. ISO 10360-2:2009; Geometrical Product Specifications (GPS)—Acceptance and Reverification Tests for Coordinate Measuring Machines (CMM), Part 2: CMMs Used for Measuring Linear Dimensions. ISO: Geneva, Switzerland, 2009.
  37. Carl Zeiss Contura G2 Specification, Version: October 2016, EN_60_022_335II Printed in Germany MAC-CZ-I/2014 Uoo; Carl Zeiss Industrielle Messtechnik GmbH: Oberkochen, Germany, 2014; Available online: https://5.imimg.com/data5/SELLER/Doc/2020/10/IO/QE/OS/50240193/7-zeiss-contura-g2-coordinate-measuring-machine.pdf (accessed on 6 November 2025).
  38. Delonge, P. Computer optimization of Deschamps’ method and error cancellation in reflectometry. In Proceedings of the IMEKO Symposium on Microwave Measurement, Budapest, Hungary, 10–13 May 1972; pp. 117–123. [Google Scholar]
  39. Kåsa, I. A circle fitting procedure and its error analysis. IEEE Trans. Inst. Meas. 1976, 25, 8–14. [Google Scholar] [CrossRef]
  40. Chernov, N. Circular and Linear Regression: Fitting Circles and Lines by Least Squares; CRC Press, Taylor & Francis Group, A CHAPMAN & HALL BOOK: Boca Raton, FL, USA, 2010; Available online: https://web.archive.org/web/20130512154618id_/http://people.cas.uab.edu:80/~mosya/cl/book.pdf (accessed on 6 November 2025).
  41. Zhang, X.; Zhang, H.; He, X.; Xu, M.; Jiang, X. Chebyshev fitting of complex surfaces for precision metrology. Measurement 2013, 46, 3720–3724. [Google Scholar] [CrossRef]
  42. Nievergelt, Y. A finite algorithm to fit geometrically all midrange lines, circles, planes, spheres, hyperplanes, and hyperspheres. Numer. Math. 2002, 91, 257–303. [Google Scholar] [CrossRef]
  43. Eaton, J.W.; Bateman, D.; Hauberg, S.; Wehbring, R. GNU Octave Version 10.3.0 Manual: A High-Level Interactive Language for Numerical Computations. 2025. Available online: https://octave.org/doc/v10.3.0/ (accessed on 6 November 2025).
  44. Matlab, R2025b; The MathWorks, Inc.: Natick, MA, USA, 2025. Available online: https://ch.mathworks.com/products/matlab.html (accessed on 10 April 2025).
  45. Shakarji, C.M. Least-Squares Fitting Algorithms of the NIST Algorithm Testing System. J. Res. NIST 1998, 103, 633–641. [Google Scholar] [CrossRef] [PubMed]
  46. Gander, W.; Golub, G.H.; Strebel, R. Least-squares fitting of circles and ellipses. BIT 1994, 34, 558–578. [Google Scholar] [CrossRef]
  47. Pratt, V. Direct least-squares fitting of algebraic surfaces. Comput. Graph. 1987, 21, 145–152. Available online: http://boole.stanford.edu/pub/fit.pdf (accessed on 6 November 2025). [CrossRef]
Figure 1. Considered influences on measurement results.
Applsci 15 12392 g001
Figure 2. Point measurement strategies/Point mode and corrections.
Applsci 15 12392 g002
Figure 3. Measuring setup.
Applsci 15 12392 g003
Figure 4. Stylus system.
Applsci 15 12392 g004
Figure 5. Sphere measurement strategies: point measurement (left) and scanning (right).
Applsci 15 12392 g005
Figure 6. Measurement procedure.
Applsci 15 12392 g006
Figure 7. Deviation of the diameter value determined by the LSQ method from the nominal value d nominal for different probes and strategies (see also Table 5, Table 8 and Table 11).
Applsci 15 12392 g007
Figure 8. x c coordinates determined by the LSQ method for different probes and strategies (see also Table 4, Table 7 and Table 10).
Applsci 15 12392 g008
Figure 9. y c coordinates determined by the LSQ method for different probes and strategies.
Applsci 15 12392 g009
Figure 10. z c coordinates determined by the LSQ method for different probes and strategies.
Applsci 15 12392 g010
Figure 11. RMSE values ( μ m) for different strategies for all probe radii.
Applsci 15 12392 g011
Figure 12. Graph of differences r i r , i = 1 , …, 77, for r probe = 2.500557 mm for all 77 point options.
Applsci 15 12392 g012
Figure 13. Graph of differences r i r for r probe = 2.500557 mm for 3 σ filtering applied to the Sphere, Mid Point, and Space Point data – removed points number i = 9 , 9, and 15, respectively.
Applsci 15 12392 g013
Figure 14. Histogram of values r i r for the Circle Scan option for all three probe radii.
Applsci 15 12392 g014
Table 1. Explanation of used terms.
CategoryItems in Category
FeatureSphere, Point, Plane, Cylinder, Line, Circle, etc.
Point strategies/Point modeTouch Point, Space Point, Mid Point, Plane Point, etc.
Circle strategiesSingle Points, Four Point Cirle Macro, Circle Path, etc.
Sphere strategiesSingle Points, Sphere Macro, Circle Path, etc.
Feature evaluation methodLSQ (Gauss), Minimum Feature, Maximum inscribed element, Minimum circumscribed element, etc.
Form and positionForm, Flatness, Roundness, Cylindricity, etc.
Outlier eliminationStandard deviation multiplicator, Undulation per revolution, wavelength
CharacteristicDimension, Position x , y , z , Geometric tolerance, etc.
Table 2. Parameters of the stylus systems used.
Probe Name D K (mm) L S (mm) D S (mm) L E (mm) r c (mm)
R 0.75.51.5201600.750844
R 1.553332501.500736
R 2.55530.53.5502.500557
Table 4. Center C coordinates (mm) for different measurement options and fitting methods for probe radius r probe = 0.750844 mm.
Option CalypsoKåsa
Newton
Midrange
x c 0.0006460.0006450.000730
Sphere y c 0.0013610.0013610.001414
z c 0.001249 0.001249 0.001341
x c 0.0004780.0004780.000502
Mid Point y c 0.0017500.0017500.001815
z c 0.000424 0.000424 0.000385
x c 0.0002710.0002710.000329
Space Point y c 0.0020710.0020710.002197
z c 0.000263 0.000263 0.000278
x c 0.0004830.0004830.000547
Touch Point y c 0.0018350.0018350.001751
z c 0.001014 0.001014 0.000586
x c 0.0001400.000139 0.000957
Circle Scan y c 0.0021510.0021530.001800
z c 0.001047 0.001048 0.000190
Table 5. Sphere diameter and its deviations from the nominal and certificate diameters (mm) for different measurement options and fitting methods for r probe = 0.750844 mm.
Option CalypsoKåsa
Newton
Midrange
d25.39907025.39907025.399197
Sphere d d nominal 0.000930 0.000930 0.000803
d d certificate 0.001184 0.001184 0.001057
d25.39919625.39919625.399259
Mid Point d d nominal 0.000804 0.000804 0.000741
d d certificate 0.001058 0.001058 0.000995
d25.39909725.39909725.399260
Space Point d d nominal 0.000903 0.000903 0.000740
d d certificate 0.001157 0.001157 0.000994
d25.39916125.39916125.398889
Touch Point d d nominal 0.000839 0.000839 0.001111
d d certificate 0.001093 0.001093 0.001365
d25.39950325.39950625.399049
Circle Scan d d nominal 0.000497 0.000494 0.000951
d d certificate 0.000751 0.000748 0.001205
Table 6. Differences in Kåsa and Newton centers and diameters (pm) for r probe = 0.750844 mm.
Option Δ x c Δ y c Δ z c Δ d
Sphere 0.8 2.0 12.0 5.7
Mid Point 1.8 1.2 12.5 6.3
Space Point 3.3 4.0 22.6 13.6
Touch Point 2.0 6.8 12.1 6.8
Circle Scan 3.0 4.6 19.6 11.3
Table 7. Center C coordinates (mm) for different measurement options and fitting methods for probe radius r probe = 1.500736 mm.
Option CalypsoKåsa
Newton
Midrange
x c 0.0015490.0015490.001759
Sphere y c 0.0015890.0015890.001568
z c 0.0006060.0006060.000604
x c 0.0014500.0014500.001741
Mid Point y c 0.0018030.0018020.001953
z c 0.0004710.0004710.000497
x c 0.0013710.0013710.001643
Space Point y c 0.0018870.0018870.002033
z c 0.000575 0.000574 0.000576
x c 0.0014130.0014130.001097
Touch Point y c 0.0018270.0018270.002754
z c 0.000251 0.000251 0.000601
x c 0.0013350.0013340.000814
Circle Scan y c 0.0017790.0017810.002076
z c 0.000225 0.000224 0.000125
Table 8. Sphere diameter and its deviations from the nominal and certificate diameters (mm) for different measurement options and fitting methods for r probe = 1.500736 mm.
Option CalypsoKåsa
Newton
Midrange
d25.39886625.39886625.398936
Sphere d d nominal 0.001134 0.001134 0.001065
d d certificate 0.001388 0.001388 0.001319
d25.39913725.39913725.399212
Mid Point d d nominal 0.000863 0.000863 0.000788
d d certificate 0.001117 0.001117 0.001042
d25.39914425.39914425.399207
Space Point d d nominal 0.000856 0.000856 0.000793
d d certificate 0.001110 0.001110 0.001047
d25.39922725.39922725.399063
Touch Point d d nominal 0.000773 0.000773 0.000937
d d certificate 0.001027 0.001027 0.001191
d25.39918325.39918525.399100
Circle Scan d d nominal 0.000817 0.000815 0.000900
d d certificate 0.001071 0.001069 0.001154
Table 9. Differences in Kåsa and Newton centers and diameters (pm) for r probe = 1.500736 mm.
Option Δ x c Δ y c Δ z c Δ d
Sphere 1.9 1.7 12.4 6.7
Mid Point 5.4 0.9 17.9 8.7
Space Point 7.6 3.8 24.0 11.3
Touch Point 19.2 7.424.0 4.6
Circle Scan 2.1 4.8 30.3 17.5
Table 10. Center C coordinates (mm) for different measurement options and fitting methods for probe radius r probe = 2.500557 mm.
Option CalypsoKåsa
Newton
Midrange
x c 0.000022 0.000022 0.000460
Sphere y c 0.000007 0.000007 0.001819
z c 0.000293 0.000293 0.000537
x c 0.000185 0.000185 0.000414
Mid Point y c 0.0000930.000093 0.001803
z c 0.000783 0.000783 0.000250
x c 0.000295 0.000295 0.000128
Space Point y c 0.0003780.0003780.001886
z c 0.000424 0.000424 0.000355
x c 0.000319 0.000319 0.000288
Touch Point y c 0.0001030.0001030.000130
z c 0.000211 0.000211 0.000073
x c 0.000264 0.000265 0.001309
Circle Scan y c 0.0003020.000304 0.001576
z c 0.000071 0.000073 0.000769
Table 11. Sphere diameter and its deviations from the nominal and certificate diameters (mm) for different measurement options and fitting methods for probe radius r probe = 2.500557 mm.
Option CalypsoKåsa
Newton
Midrange
d25.39957725.39957725.399676
Sphere d d nominal 0.000423 0.000423 0.000324
d d certificate 0.000677 0.000677 0.000578
d25.39979125.39979125.399863
Mid Point d d nominal 0.000209 0.000209 0.000137
d d certificate 0.000463 0.000463 0.000391
d25.39935725.39935725.399582
Space Point d d nominal 0.000643 0.000643 0.000418
d d certificate 0.000897 0.000897 0.000672
d25.39919925.39919925.399197
Touch Point d d nominal 0.000801 0.000801 0.000803
d d certificate 0.001055 0.001055 0.001057
d25.39944325.39944625.399729
Circle Scan d d nominal 0.000557 0.000554 0.000271
d d certificate 0.000811 0.000808 0.000525
Table 12. Differences in Kåsa and Newton centers and diameters (pm) for probe radius r probe = 2.500557 mm.
Option Δ x c Δ y c Δ z c Δ d
Sphere23.7 57.3 25.4 21.3
Mid Point21.0 61.4 21.4 20.7
Space Point20.931.213.611.7
Touch Point0.6 5.1 11.7 6.6
Circle Scan 1.4 6.2 27.3 14.3
Disclaimer/Publisher’s Note: The statements, opinions and data contained in all publications are solely those of the individual author(s) and contributor(s) and not of MDPI and/or the editor(s). MDPI and/or the editor(s) disclaim responsibility for any injury to people or property resulting from any ideas, methods, instructions or products referred to in the content.