Article

Grouting Power Prediction Method Based on CEEMDAN-CNN-BiLSTM

1
Changjiang Institute of Survey, Planning, Design and Research Corporation, Wuhan 430010, China
2
Changjiang Geotechnical Engineering Corporation, Wuhan 430010, China
3
State Key Laboratory of Water Resources Engineering and Management, Wuhan 430010, China
4
China National Petroleum Corporation, Beijing 100007, China
5
School of Automation, Wuhan University of Technology, Wuhan 430070, China
*
Author to whom correspondence should be addressed.
Appl. Sci. 2025, 15(23), 12382; https://doi.org/10.3390/app152312382
Submission received: 29 September 2025 / Revised: 6 November 2025 / Accepted: 17 November 2025 / Published: 21 November 2025

Abstract

Grouting power serves as a critical parameter reflecting real-time energy input during grouting operations, and its accurate prediction is essential for intelligent control and engineering safety. Existing prediction methods often struggle to handle the strong nonlinearity, noise interference, adaptability to varying conditions in grouting power data. To address these challenges, an intelligent grouting system that integrates real-time data collection and core control modules has been developed. Subsequently, a grouting power prediction model is then proposed, which combines Complete Ensemble Empirical Mode Decomposition and Adaptive Noise (CEEMDAN) with a Convolutional Neural Net-work-Bidirectional Long Short-Term Memory Neural Network (CNN-BiLSTM) is proposed. The approach employs CEEMDAN to decompose the nonlinear and non-stationary power sequence into multiple intrinsic mode functions (IMFs). Each IMF is then separated into linear and nonlinear components using a moving average method. The linear components are predicted using an Autoregressive Integrated Moving Average (ARIMA) model, while the nonlinear components are predicted using a CNN-BiLSTM model. The final prediction is obtained by reconstructing the results from both components. Experimental comparisons under both normal and heaving grouting conditions demonstrate that the proposed model significantly outperforms LSTM, CNN-LSTM, and CNN-BiLSTM models. With 80% of the dataset used for training, the RMSE for normal conditions is reduced by 95.69%, 85.11%, and 80.55%, respectively, and for heaving conditions by 94.91%, 90.71%, and 84.62%, respectively. This research provides high-precision predictive support for grouting regulation under complex working conditions, offering substantial engineering application value.

1. Introduction

Grouting technology serves as a critical technique in the fields of engineering and foundation reinforcement, playing an irreplaceable role in rock mass strengthening, leakage control, and anti-seepage of foundation pits [1]. It provides a solid guarantee for the safe construction and stable operation of projects, especially in hydropower stations and related infrastructures. With advancements in technology, automation and intelligent control of grouting engineering have emerged as cutting-edge research directions [2,3]. The development of modern information technology has provided new technical support for grouting applications, promoting the adoption of advanced grouting specifications and data acquisition systems. Intelligent automated control facilitates online monitoring and precise regulation of the grouting process, akin to industrial control systems deployed in manufacturing and digital twin technologies employed in infrastructure monitoring [4]. Such systems utilize real-time data acquisition and predictive analytics to improve operational reliability and safety. The described intelligent grouting system incorporates these principles by integrating a programmable logic controller (PLC) and a pressure regulation unit for dynamic adjustment [5], aligning with advanced industrial practices. In grouting construction, grouting pressure and injection rate are two essential parameters. Rational control of these variables plays a key role in quality assurance in dam foundation grouting. However, their regulation under field conditions remains relatively complex and lacks unified standards. In response, researchers have proposed the use of grouting power—defined as the product of real-time grouting pressure (P, unit: MPa) and injection rate (Q, unit: L/min), expressed in kilowatts (kW) in the International System of Units [6,7]. Grouting power represents the real-time energy applied per unit time within the grouted section. Maintaining grouting power within a predefined threshold range can effectively enhance the safety and quality of grouting operations. Accurate prediction of grouting power helps in early detection of potential exceedances, facilitating timely adjustments in pressure or injection rate to prevent undesirable outcomes. Nevertheless, measured grouting power data are often contaminated with noise and exhibit strong nonlinearity and high volatility [8,9,10], which pose significant challenges to achieving high-precision prediction.
In the field of grouting process data prediction, Xue et al. [11] proposed a novel hybrid model for predicting grouting power. This approach utilizes an empirical wavelet transform to adaptively decompose the original grouting sequence into several sub-sequences and a residual sequence. The partial autocorrelation function is applied to objectively identify optimal input variables. Support vector regression is then employed to obtain prediction results for each sub-sequence. The final prediction is generated by aggregating the forecasted results of all decomposed sub-sequences. Li et al. [12] developed a prediction method based on an adaptive neuro-fuzzy inference system for forecasting and evaluating curtain grouting efficiency. The study selected geological factors (such as fracture density), effective grouting construction parameters (including effective grouting pressure and grouting duration), and test section depth as key influencing factors, which serve as input parameters for the prediction model. Grouting efficiency evaluation indicators were taken as output parameters. Zhao et al. [13] introduced a machine learning-based algorithmic framework that integrates prediction, interpretation, and automated hyperparameter tuning to identify complex underlying relationships between mix proportion parameters of cement-based grouting materials and their compressive strength and fluidity. Zhe et al. [14] collected field test data from Yunnan Province, China, and incorporated borehole image data—previously overlooked in earlier studies—into their model. By combining explainable machine learning methods, they constructed a grouting volume prediction model with high accuracy and interpretability. The results demonstrated that integrating image features into the dataset significantly enhanced the model’s interpretability, prediction accuracy, and stability. Hu et al. [15] proposed a grouting volume prediction method based on an ensemble learning model, employing Bayesian optimization to tune the model hyperparameters. The prediction model was constructed using real shield tunneling construction data, and its performance was evaluated through comparative analysis. Zhong et al. [16] developed a prediction and control method for cement injection volume. Based on fractal theory, the relationship between cement injection volume and transmissivity was established by considering fracture roughness, leading to the formulation of a corresponding control standard. A hybrid kernel function support vector machine model, optimized using the whale optimization algorithm, was developed for predicting cement injection volume. The proposed method was validated through engineering case studies, demonstrating its effectiveness and advantages. Zhu et al. [17] introduced a hybrid interval prediction model for the PQ index—a comprehensive grouting process parameter representing the relationship between grouting pressure and flow rate—based on an improved extreme learning machine and lower-upper bound estimation method. The model was applied to predict the PQ value during grouting processes in a hydropower project in China, proving its high practical potential in grouting engineering. Chen et al. [18] developed a prediction model for the rheological properties of slurries with different water-cement ratios based on a Backpropagation (BP) neural network. This model provides guidance for detecting and analyzing the rheological characteristics of grouting materials used in dam foundation treatments. Niu et al. [19] proposed an intelligent multi-parameter integrated method for predicting grouting volume, founded on the principles of support vector machines. This approach overcomes the limitation of scarce sample data in practical engineering applications. The method utilizes grouting construction conditions and slurry properties—which govern grout diffusion and are readily available during field operations—as input parameters. It significantly enhances both prediction accuracy and generalization capability. While these studies demonstrate the growing application of machine learning in grouting prediction, several critical limitations remain unaddressed [20,21]. First, models primarily focus on single working conditions, lacking adaptability to abnormal scenarios such as formation heaving or fracturing, which are frequent in practical engineering. Second, methods based on simple neural networks or support vector machines struggle to fully extract multi-scale features from highly non-stationary grouting power sequences, often resulting in insufficient accuracy when faced with strong nonlinearity and noise interference. Furthermore, existing approaches rarely integrate real-time monitoring and predictive control, limiting their practical utility in dynamic grouting regulation. These shortcomings highlight the need for a more adaptive, high-precision prediction framework capable of handling complex, multi-condition grouting processes.
The grouting process is inherently a complex dynamical system involving strong coupling effects among multiple physical fields, including seepage, stress, and chemical processes [22,23]. Predicting grouting power is particularly challenging due to its nonlinear and fluctuating nature, susceptibility to noise interference, high accuracy requirements, and the inherent complexity of the data. Existing prediction methods often fail to achieve high accuracy when handling complex and non-stationary time-series data, and they often struggle to effectively extract and integrate multi-scale information. Furthermore, traditional statistical approaches and simple machine learning models may be inadequate for capturing the underlying dynamics and latent patterns in the data [24]. Current research on grouting power prediction has significant limitations. Existing models primarily address single working conditions and fail to account for abnormal scenarios like normal grouting, heaving, or fracturing conditions [25,26]. This represents a major disconnect from real-world engineering applications, where working conditions are time-varying and anomalies occur frequently. The field urgently requires novel models capable of recognizing and predicting performance under multiple working conditions.
Due to its unique gating structure, LSTM networks are widely used to address the gradient explosion problem in traditional recurrent neural networks when processing time series data. Ref. [27] employs a BiLSTM network for nonlinear time series prediction, which enhances the network’s ability to capture both historical and future data. Considering CNN’s ability to effectively extract features from time series data, Ref. [28] proposes a combined CNN-LSTM model for time series forecasting. Ref. [29] presents a comparative analysis of the CNN-BiLSTM and CNN-LSTM models. With identical model parameters and training data ratios, the CNN-BiLSTM model demonstrates superior accuracy in time series prediction. Therefore, this paper proposes a grouting power prediction model that integrates Complete Ensemble Empirical Mode Decomposition with Adaptive Noise (CEEMDAN) and CNN-BiLSTM, denoted as CEEMDAN-CNN-BiLSTM. The CEEMDAN method is employed to decompose the nonlinear and non-stationary grouting power time series into several Intrinsic Mode Functions (IMFs), thereby reducing the complexity of the raw data. The CNN component is used to extract local features from each modal component, while the BiLSTM network captures both forward and backward temporal dependencies in the time series data, enabling accurate characterization of grouting power dynamics. By leveraging the complementary strengths of these three components, a highly accurate and adaptive prediction model is constructed, which effectively addresses key challenges in grouting power prediction such as data nonlinearity, complex dynamics, and poor adaptability to abnormal conditions. This model provides strong support for engineering applications. Furthermore, by integrating the CEEMDAN-CNN-BiLSTM grouting power prediction method with a pressure regulation device, the system enables not only real-time monitoring and forecasting of grouting power but also dynamic adjustment of grouting parameters based on the predictions, thereby significantly enhancing the stability and safety of the grouting process. An intelligent grouting control system was developed, incorporating real-time data acquisition, parameter configuration, and process control modules. Utilizing a PLC (Programmable Logic Controller) and a pressure regulation unit—comprising components such as flow dividers, flowmeters, and pressure gauges—the system achieves precise regulation of grouting pressure and injection rate. During curtain grouting construction at borehole B1W-2-III-4 in the Xiong’an Regulation Reservoir of the South-to-North Water Diversion Middle Route Project, real-time grouting power data were collected under both normal grouting and heaving conditions (including ‘heaving warning’ moments). The dataset includes multidimensional information such as average pressure, injection rate, and grout parameters, providing comprehensive, multi-condition measured samples for model training and validation. This research establishes a high-precision grouting power prediction model applicable to multiple working conditions, effectively overcoming the difficulties associated with predicting highly nonlinear and dynamically complex grouting data. Moreover, this study provides crucial technical support for real-time adjustment of pressure and injection rate in grouting engineering, enhancing the level of intelligent control. It has significant practical importance for ensuring the safety of grouting operations and improving project quality.

2. Grouting Process and Experimental Data Acquisition

2.1. Grouting Process

To ensure precision and effectiveness in grouting operations, the process is usually divided into distinct stages and zones, as illustrated in Figure 1, to maintain stability and safety throughout the procedure [30,31,32].
Zone I—Rapid Pressure Build-up Zone: In this stage, grouting pressure rises rapidly accompanied by a high injection rate. This facilitates efficient filling of fractures and voids, allowing the grout to penetrate the formation quickly.
Zone II—Stable Grouting Zone: Within this zone, both grouting pressure and injection rate are maintained within a stable range between PQmin and PQmax. PQmin represents the critical threshold to avoid insufficient grouting, while PQmax is the upper limit to prevent formation damage or excessive grout dispersion. The stable grouting zone is considered the optimal working range, ensuring the highest quality of grouting results [33,34,35].
Zone III—Critical Grouting Zone: In this zone, both grouting pressure and injection rate exceed PQmax, significantly increasing the risk of formation damage and substantial grout loss. Immediate adjustment of grouting parameters is necessary to prevent adverse outcomes.
The entire grouting process consists of five distinct stages:
Stage A—High Injection Rate, Low Pressure Phase: Characterized by a high injection rate and relatively low grouting pressure.
Stage B—Maximum Injection Rate Control Phase: Marked by the injection rate reaching its peak while pressure begins to rise.
Stage C—Stable Grouting Phase: Both injection rate and pressure remain within a stable range.
Stage D—Grouting Under Design Pressure: Injection rate decreases while pressure stabilizes at the designed value.
Stage E—Grouting Completion Phase: Both injection rate and pressure gradually decline until the grouting is completed.
Among these, the stable grouting phase (Stage C) is the most critical for ensuring grouting effectiveness and long-term formation stability. Consistent grouting pressure not only promotes uniform distribution and complete filling of the grout but also mitigates the risks of formation fracturing and grout loss [36,37,38].

2.2. Grouting Experimental Data Acquisition

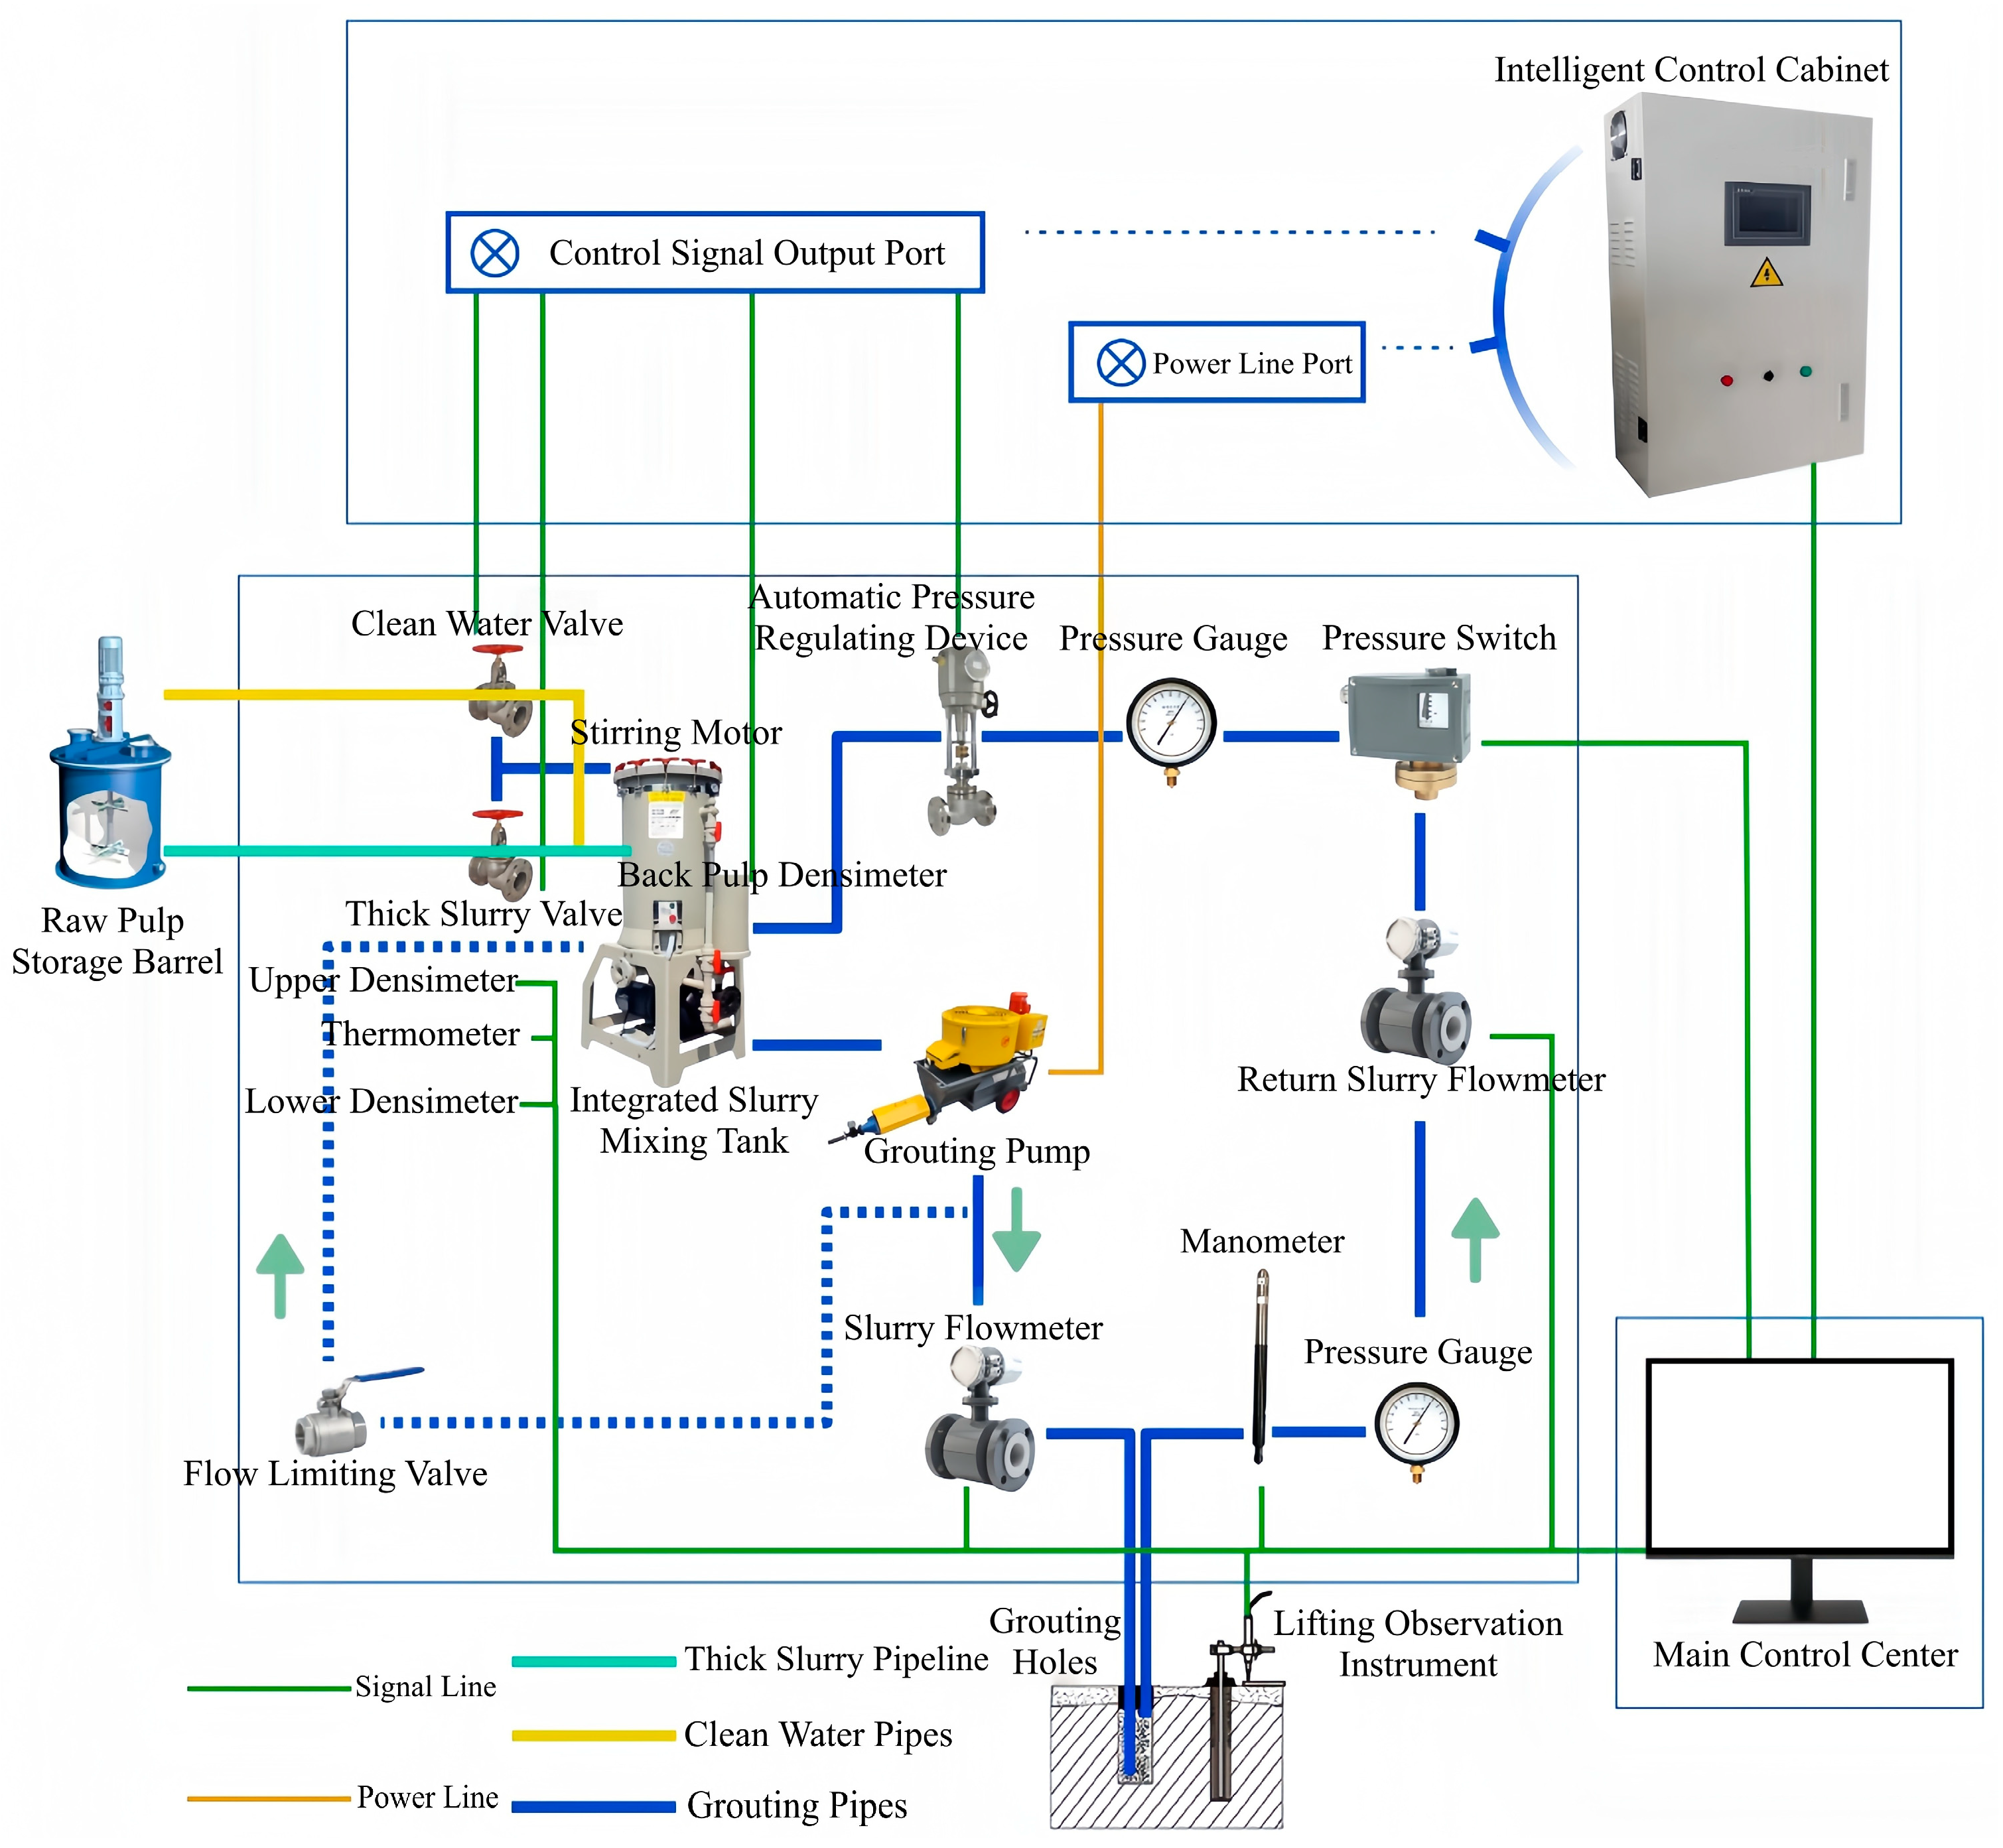
The intelligent grouting system allows for precise regulation of grouting pressure and injection rate through an integrated pressure regulation device, thereby effectively controlling grouting power. The core components of the system include a flow divider, inlet flowmeter, pressure gauge, return flowmeter, and an automatic pressure regulation unit, as shown in Figure 2. The pressure regulation device, coupled with a programmable logic controller (PLC), dynamically adjusts grouting parameters based on real-time pressure and flow data to maintain grouting power within the predefined range. During the stable grouting phase, the system requires high control precision, rapid response, and minimal fluctuations in grouting power.
The intelligent upper-computer system at the grouting control center is a comprehensive platform developed based on Python 3.10, using the PyQt framework for interface design. It is designed to achieve intelligent monitoring and predictive control throughout the entire cement grouting process. The system comprises five modules: a real-time data module, a parameter setting module, a report and process data module, a historical records module, and a process control system module. The process control system module serves as the core component of the grouting process, enabling real-time control of grouting equipment via a Programmable Logic Controller (PLC). This module facilitates the start-stop operation of grouting pumps, pressure regulation, and flow control. Based on predefined process parameters and grouting power prediction results, the system automatically adjusts the grouting process to ensure that the grouting power remains within the specified threshold range.
During the grouting construction of the Xiong’an Regulation Reservoir Project under the Middle Route of the South-to-North Water Diversion Project, the intelligent grouting system was applied to the curtain grouting at borehole B1W-2-III-4. The grouting power data used in this study were obtained from real-time monitoring data of B1W-2-III-4 holes for curtain grouting in the Xiong’an Reservoir Project of the South to North Water Diversion Middle Route. This dataset synchronously collected power sequences under normal grouting and heaving conditions, providing a diverse set of measured samples for model training and validation. It should be noted that the model construction and validation in this stage are based on the data of this single borehole, aimed at verifying the basic effectiveness of the proposed method under complex working conditions. The model input is the grouting power sequence of the past 30 min (based on a 1 Hz sampling rate) to capture dynamic changes under normal and heaving conditions, and the time window is set based on the typical duration of the grouting process. As shown in Figure 2, the system acquired real-time construction process data, including parameters such as average pressure, maximum pressure, grout inflow volume, return flow rate, injection rate, cumulative binder consumption, water-cement ratio of the slurry, slurry density, cumulative heaving, and temperature at multiple time points. Simultaneously, real-time grouting power data were collected, covering both normal grouting phases and heaving conditions (e.g., moments recorded as “heaving warning” in construction logs). Table 1 presents the specifications and context of key parameters acquired by the intelligent grouting control system. This comprehensive dataset, with its full temporal coverage and multidimensional measurements, provides essential real-world samples for the CEEMDAN-CNN-BiLSTM-based grouting power prediction model.

3. Methodology for Grouting Power Prediction

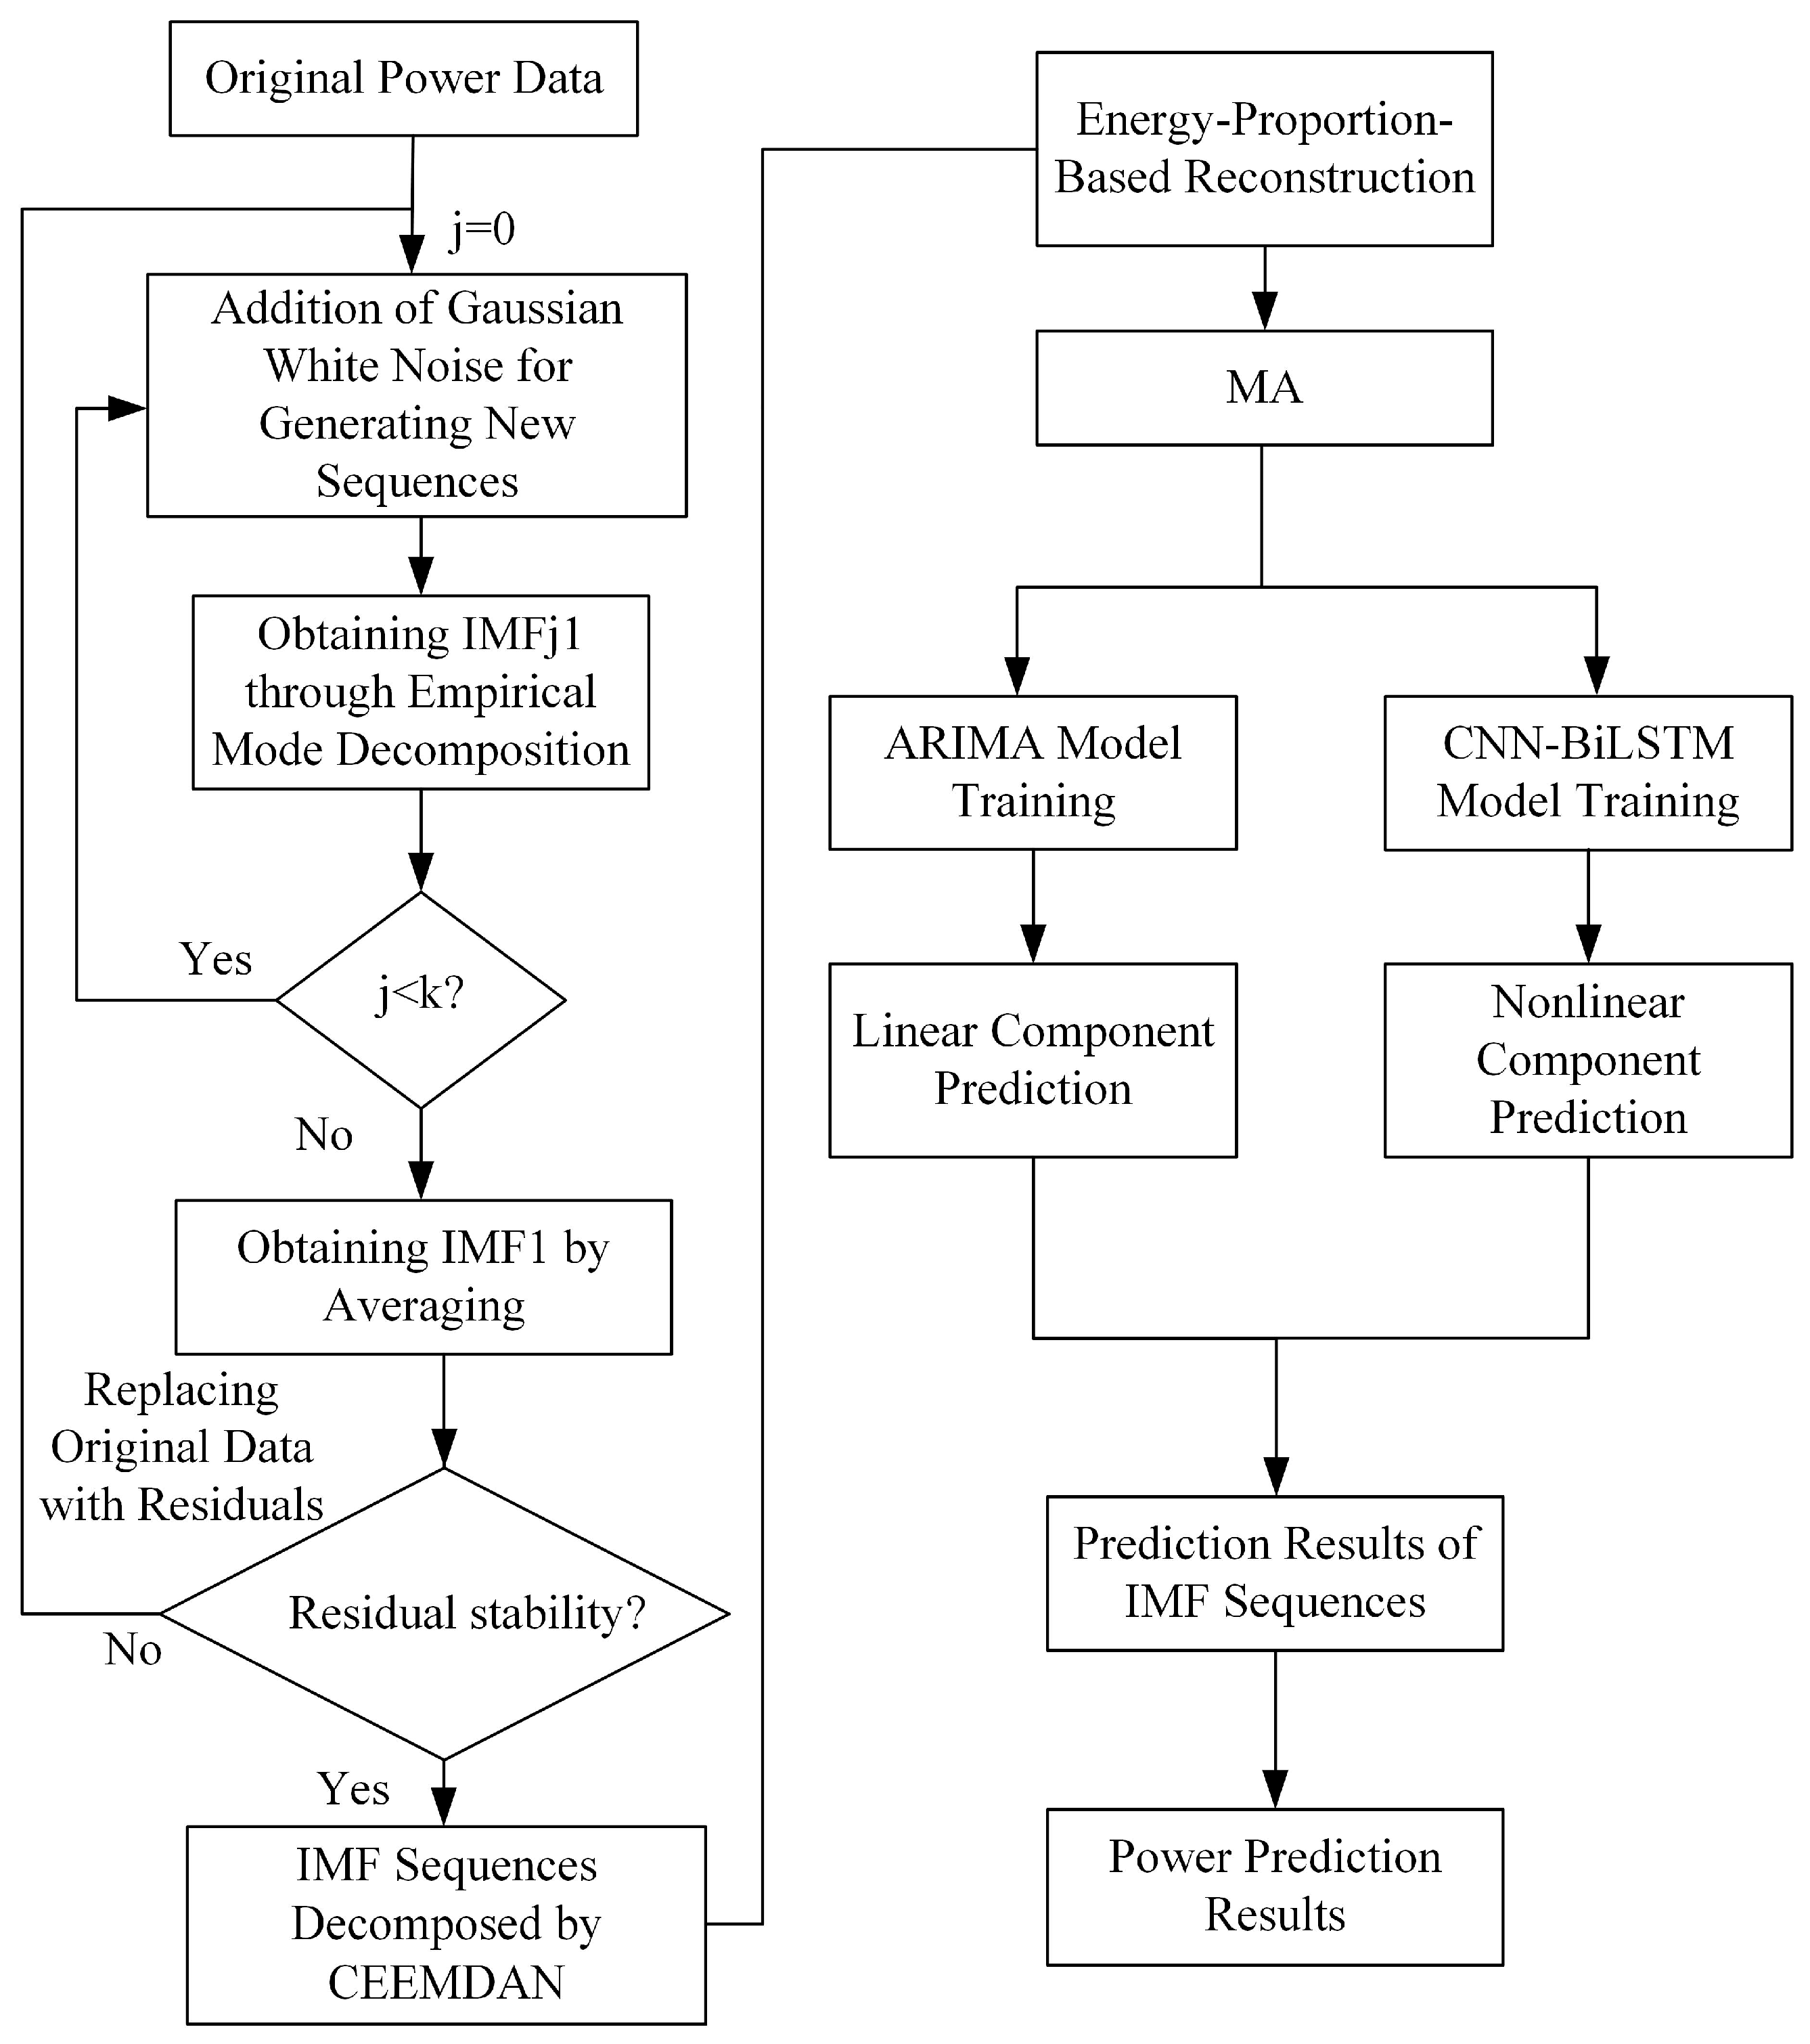
Figure 3 illustrates the overall framework of the grouting power prediction method based on the CEEMDAN-CNN-BiLSTM model. The prediction process consists of the following steps: First, the Complete Ensemble Empirical Mode Decomposition with Adaptive Noise (CEEMDAN) method is applied to decompose the original grouting power data, collected during experiments, into multiple Intrinsic Mode Function (IMF) sequences. This effectively extracts multi-frequency features from the original power series and reduces its non-stationarity. The collected raw grouting power time series is divided into a training set and a testing set in chronological order. Subsequently, a fixed-step Moving Average (MA) method is employed to separate each IMF sequence into linear and nonlinear components. The linear component is predicted using an Autoregressive Integrated Moving Average (ARIMA) model to capture its temporal characteristics. The nonlinear component is predicted using a CNN-BiLSTM neural network model, where the Convolutional Neural Network (CNN) extracts local dependency features, and the Bidirectional Long Short-Term Memory (BiLSTM) network captures long-term dependencies in both forward and backward temporal directions. The predictions of the linear and nonlinear components of each IMF sequence are combined to obtain the complete predicted value of the IMF. Finally, the predictions of all IMF sequences are aggregated and reconstructed to generate the final grouting power prediction. This method, structured within a “decomposition–component prediction–ensemble reconstruction” framework, thoroughly exploits both the linear and nonlinear characteristics embedded in the grouting power sequence.

3.1. Principle of the CEEMDAN Method

The Complete Ensemble Empirical Mode Decomposition with Adaptive Noise (CEEMDAN) method is an advanced adaptive signal decomposition technique developed to overcome the mode mixing problem inherent in the traditional Empirical Mode Decomposition (EMD) approach, thus significantly improving decomposition performance [39]. This method has been successfully applied to decompose the original voltage data, y(t), of PEMFC into sequences representing different aging time scales. The computational procedure involves the following key steps:
(1) Add j (j = 1, 2, …, k) instances of Gaussian white noise to the original grouting power data y(t) collected during the grouting process, resulting in a series of new sequences yj(t), such that:
I M F 1 = j = 1 k I M F j 1 k
where IMF1 is the first Intrinsic Mode Function (IMF) obtained by applying CEEMDAN to the original signal y(t), and IMFj1 is the first IMF derived through Empirical Mode Decomposition (EMD) of the noise-added sequence yj(t). The residual sequence r1(t) after the first step of CEEMDAN is then expressed as:
r 1 ( t ) = y ( t ) I M F 1
(2) Replace the original y(t) with r1(t), and repeat step (1) until the final residual sequence rn−1(t) cannot be further decomposed, thereby obtaining multiple IMF sequences of the original voltage data y(t). At this point, the original voltage data y(t) can be expressed as:
y ( t ) = i = 1 n - 1 I M F i + r n - 1 ( t ) = i = 1 n I M F i
where the residual sequence rn−1(t) is regarded as the n-th IMF component.
The decomposed IMF sequences represent grouting power at different frequencies, and separating their linear and nonlinear components can further enhance the prediction accuracy of grouting power. The IMF sequences are analyzed using the moving average (MA) method, the principle of which is as follows [40]:
l t = 1 m i = t m + 1 t y i
r t = y t l t
where m is the step length. lt denotes the linear component with a stable decreasing trend, which is suitable for linear prediction methods. rt denotes the nonlinear component containing local fluctuation information, which is better predicted using nonlinear forecasting methods.

3.2. ARIMA Model

Separate ARIMA models are trained for the linear component of each IMF sequence. The ARIMA model treats the current value yt as a linear function of past observations:
y t = f ( y t 1 , y t 2 , , y t p , ε t 1 , ε t 2 , , ε t q )
where yt-1, yt-2, ..., yt-p are historical grouting power measurements, and εt−1, εt−2, ..., εtq are measurement errors with zero mean and constant variance. The p and q are the autoregressive and moving average orders, respectively, and their values are determined during model training. Additionally, to ensure the input data for the ARIMA model is stationary, differencing of order d is applied. When the input data is already stationary and no differencing is required, d is set to 0. The autocorrelation function (ACF) and partial autocorrelation function (PACF) of the stationary time series are used to initially identify the possible ranges for p and q. A grid search within this range is performed using the Akaike Information Criterion (AIC), and the model with the lowest AIC is selected as optimal.

3.3. Principle of the CNN-BiLSTM Method

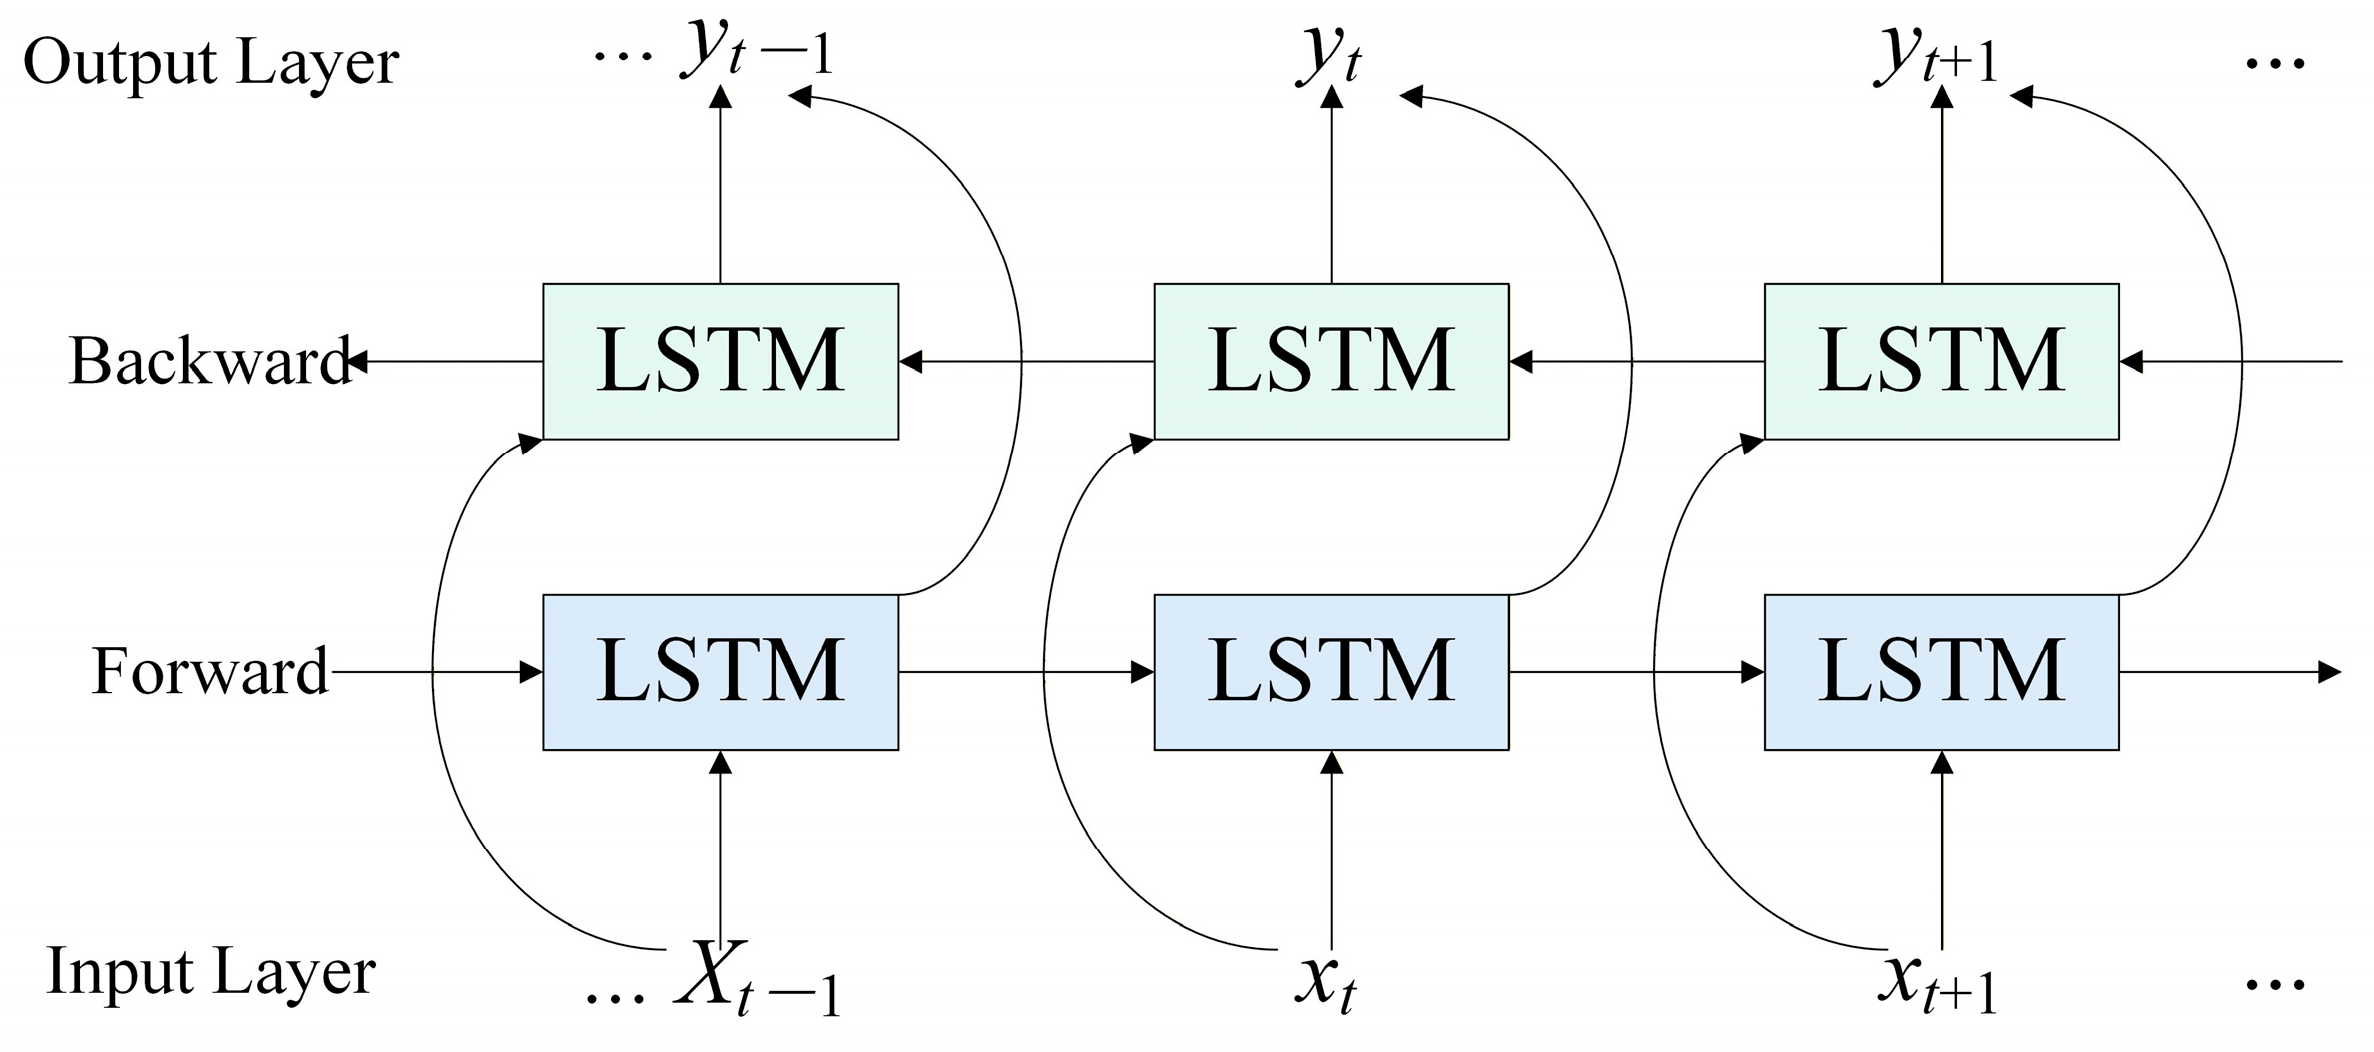
The Convolutional Neural Network (CNN) extracts features through convolutional, pooling, and fully connected layers [41]. The Bidirectional Long Short-Term Memory (BiLSTM) network utilizes both forward and backward LSTM units to process historical data and incorporate future context for prediction. This bidirectional architecture enhances the model’s ability to capture temporal dependencies in both directions, providing deeper insight into sequence trends [42]. The prediction strategy of the CNN-BiLSTM model is structured as follows: first, the CNN acts as a feature extractor, where convolutional layers identify local patterns and pooling layers reduce dimensionality while retaining essential hidden information. Then, the extracted features are fed into the BiLSTM model, as shown in Figure 4. By processing the sequence data bidirectionally, the model effectively incorporates both past and future contextual information, significantly improving its capacity to capture complex temporal dependencies.
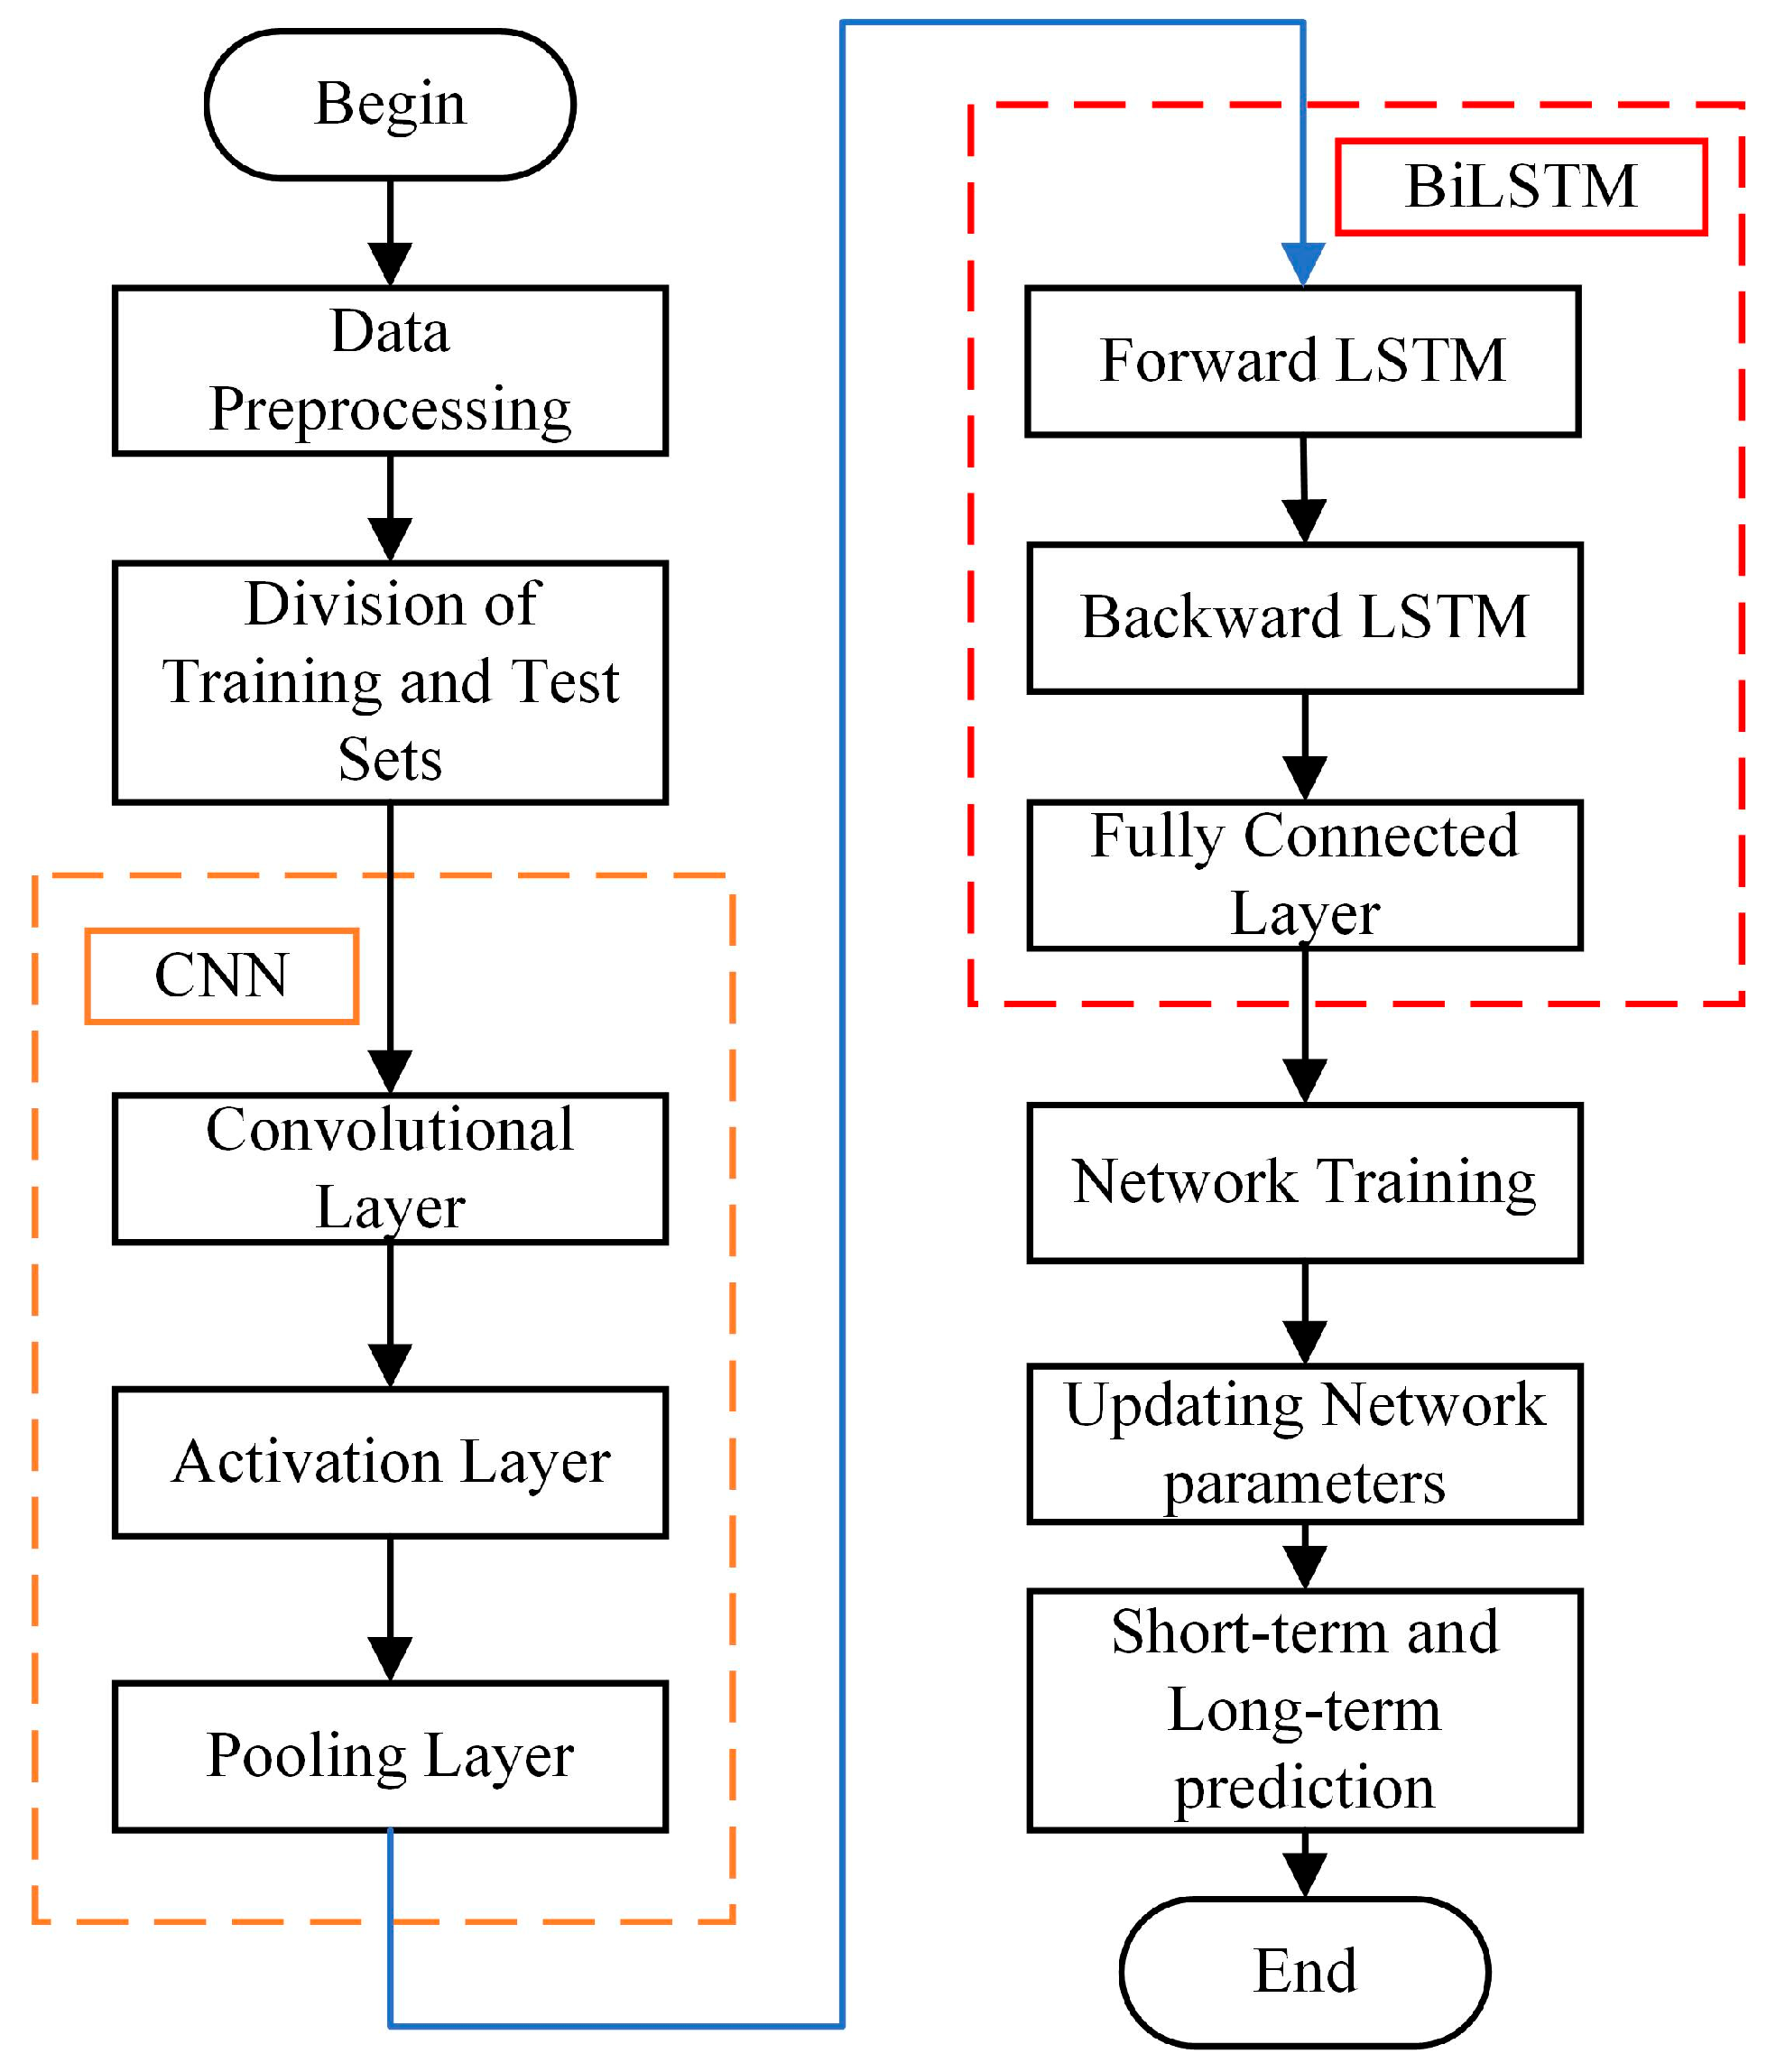
The process for predicting nonlinear components with the CNN-BiLSTM model is shown in Figure 5. The target nonlinear component series is divided into training and testing sets. Key model parameters, including the number of CNN convolutional kernels, the number of BiLSTM units, the initial learning rate, and the L2 regularization coefficient, are determined. The CNN-BiLSTM model is then trained on the training set, and finally, prediction results are generated.

4. Experimental Results and Discussion

4.1. Evaluation Metrics for Prediction Performance

The evaluation metrics for aging prediction adopted commonly used regression metrics: Root Mean Square Error (RMSE), Mean Absolute Error (MAE), and Coefficient of Determination (R-squared, R2). The calculation formulas are as follows:
RMSE = 1 n i = 1 n y p y t 2
MAE = 1 n i = 1 n y p y t
R 2 = 1 i = 1 n y p y t 2 i = 1 n y ¯ t y t 2
where yp denotes the predicted value and yt denotes the measured value.

4.2. Grouting Power Prediction Under Normal Conditions

When decomposing the grouting power series using CEEMDAN, the noise standard deviation is 0.2 of the original signal’s standard deviation, with an ensemble size of 500 to ensure statistical stability of the decomposition. The goal of selecting an appropriate moving average step size is to separate reasonable trends from fluctuations. Therefore, multiple step sizes are tested, and after decomposition, the sample entropy of the nonlinear components in each IMF (Intrinsic Mode Function) is calculated. Smaller sample entropy indicates a more regular sequence. The step size minimizing the sample entropy of most IMF components is selected, which in this case is m = 10. For hyperparameter selection in the CNN-BiLSTM model, the CNN has 16 convolution layers, the BiLSTM has 32 units, the initial learning rate is 0.005, and the maximum number of iterations is 500.
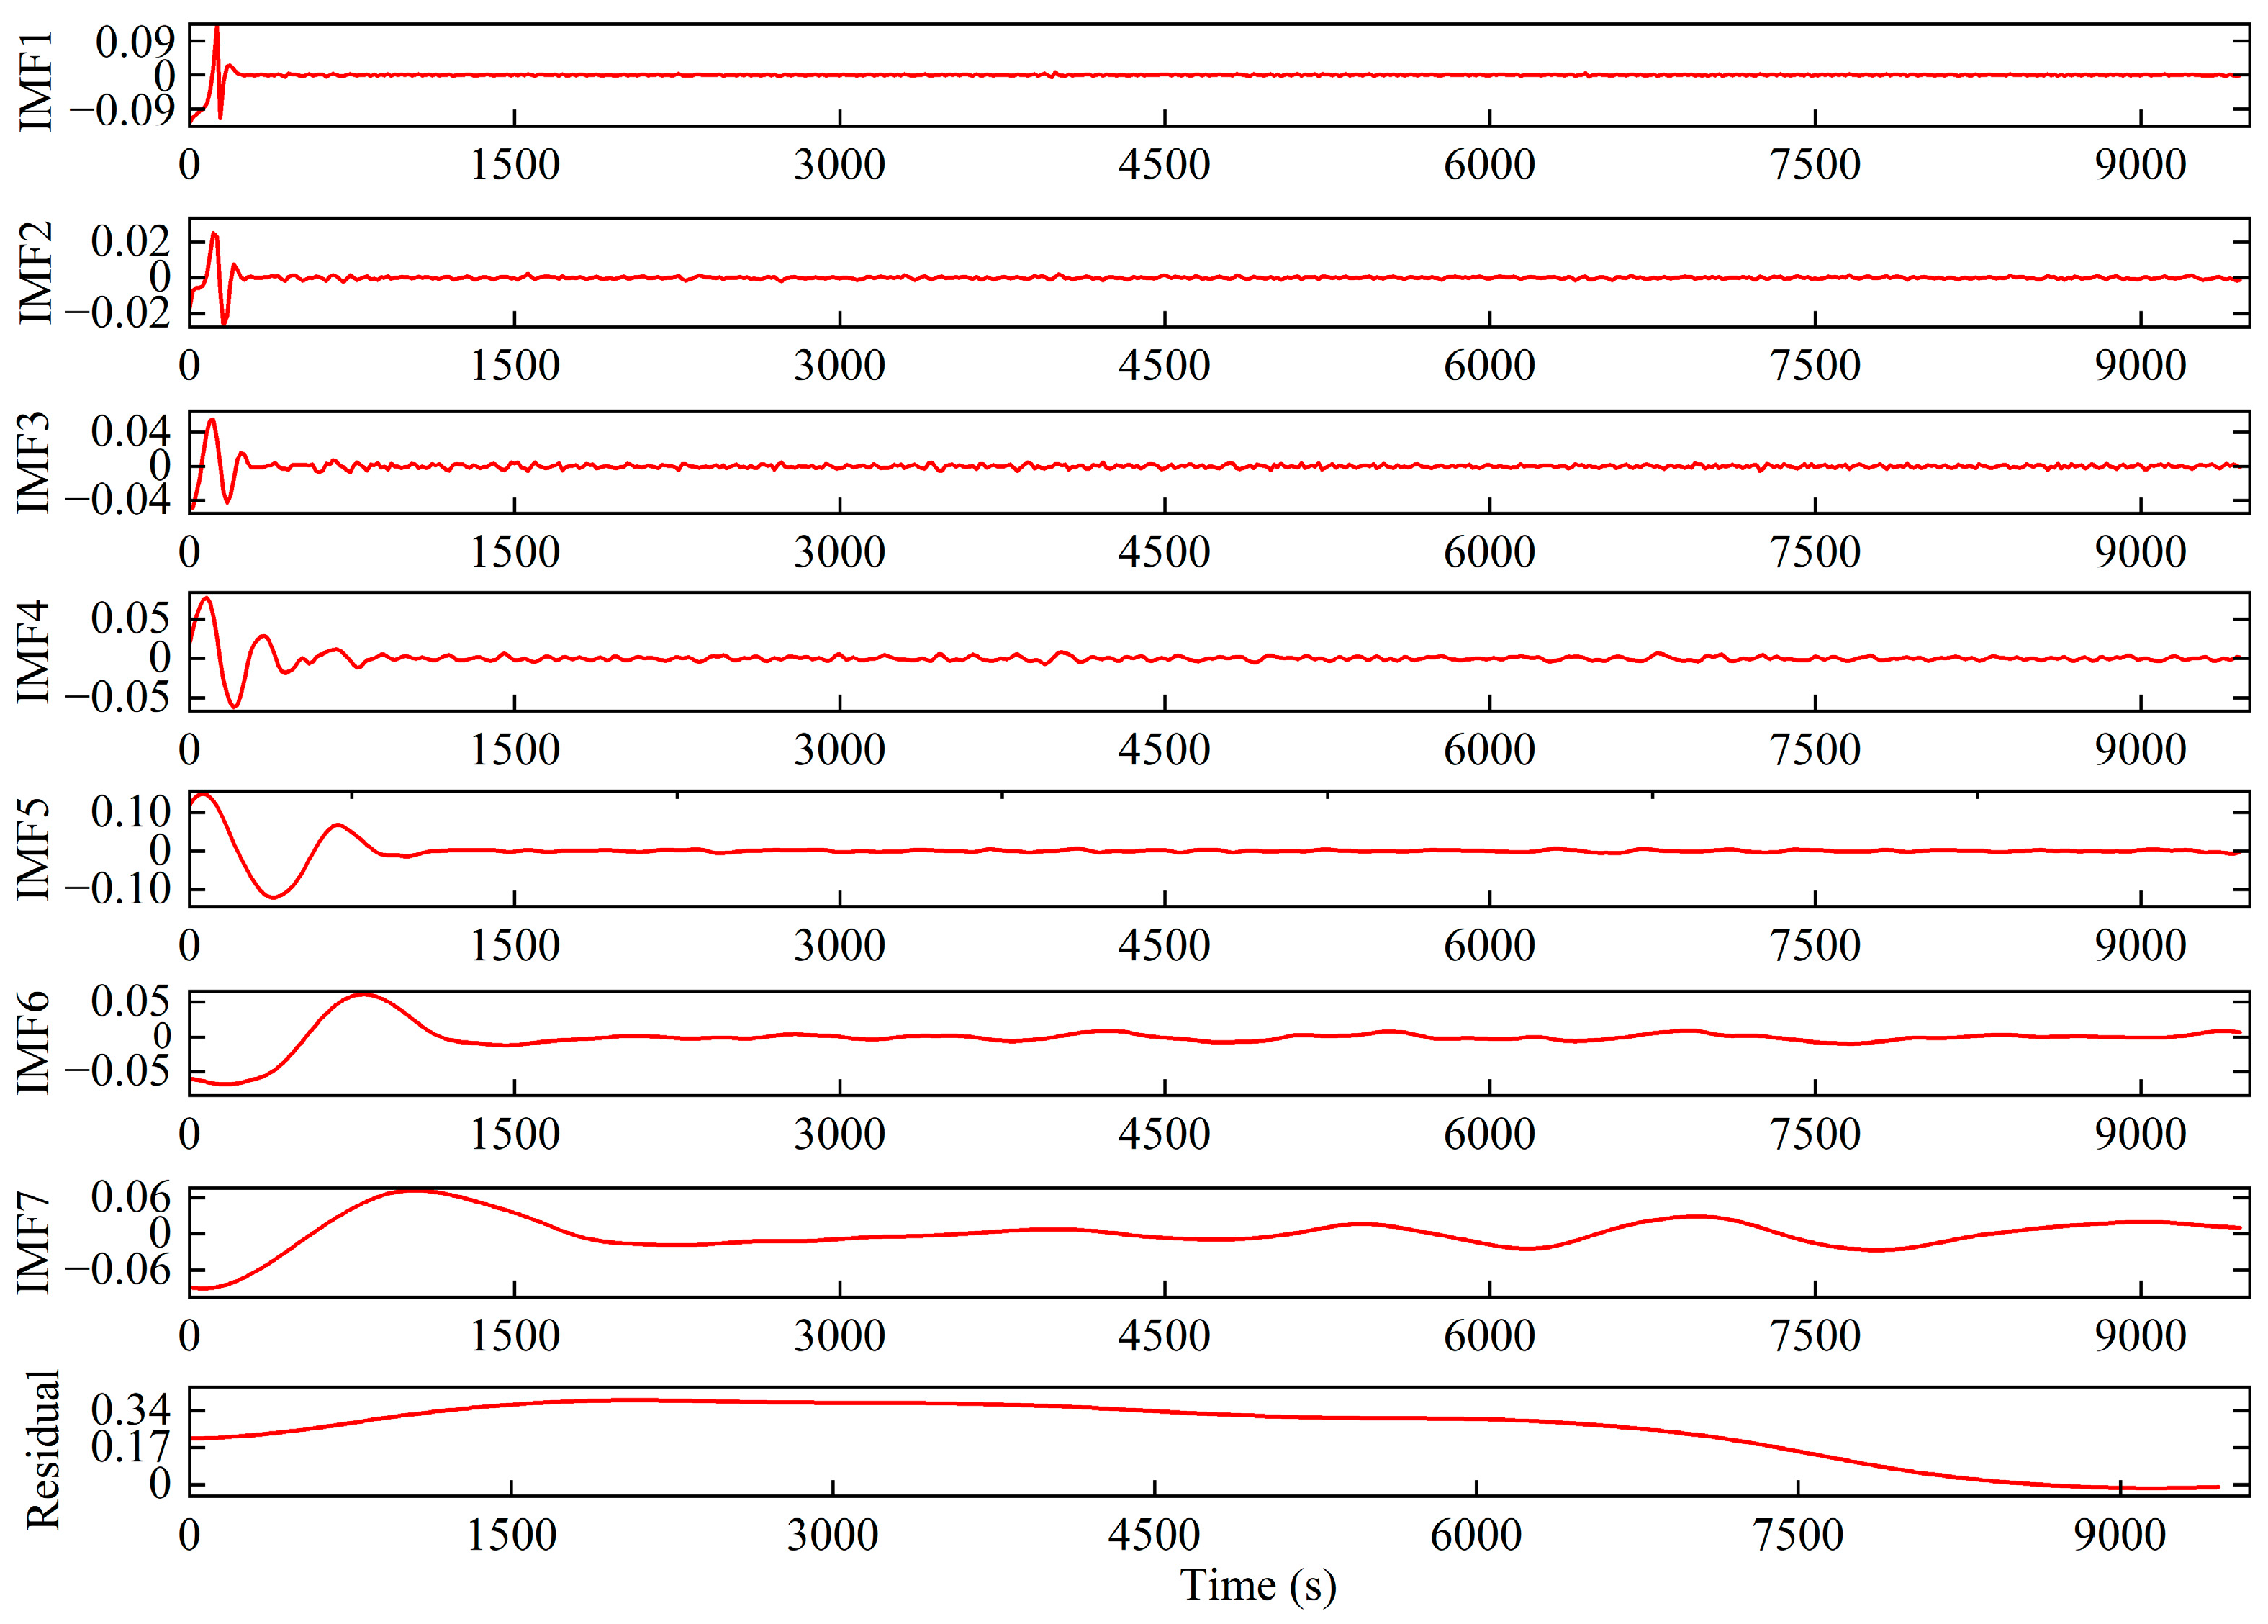
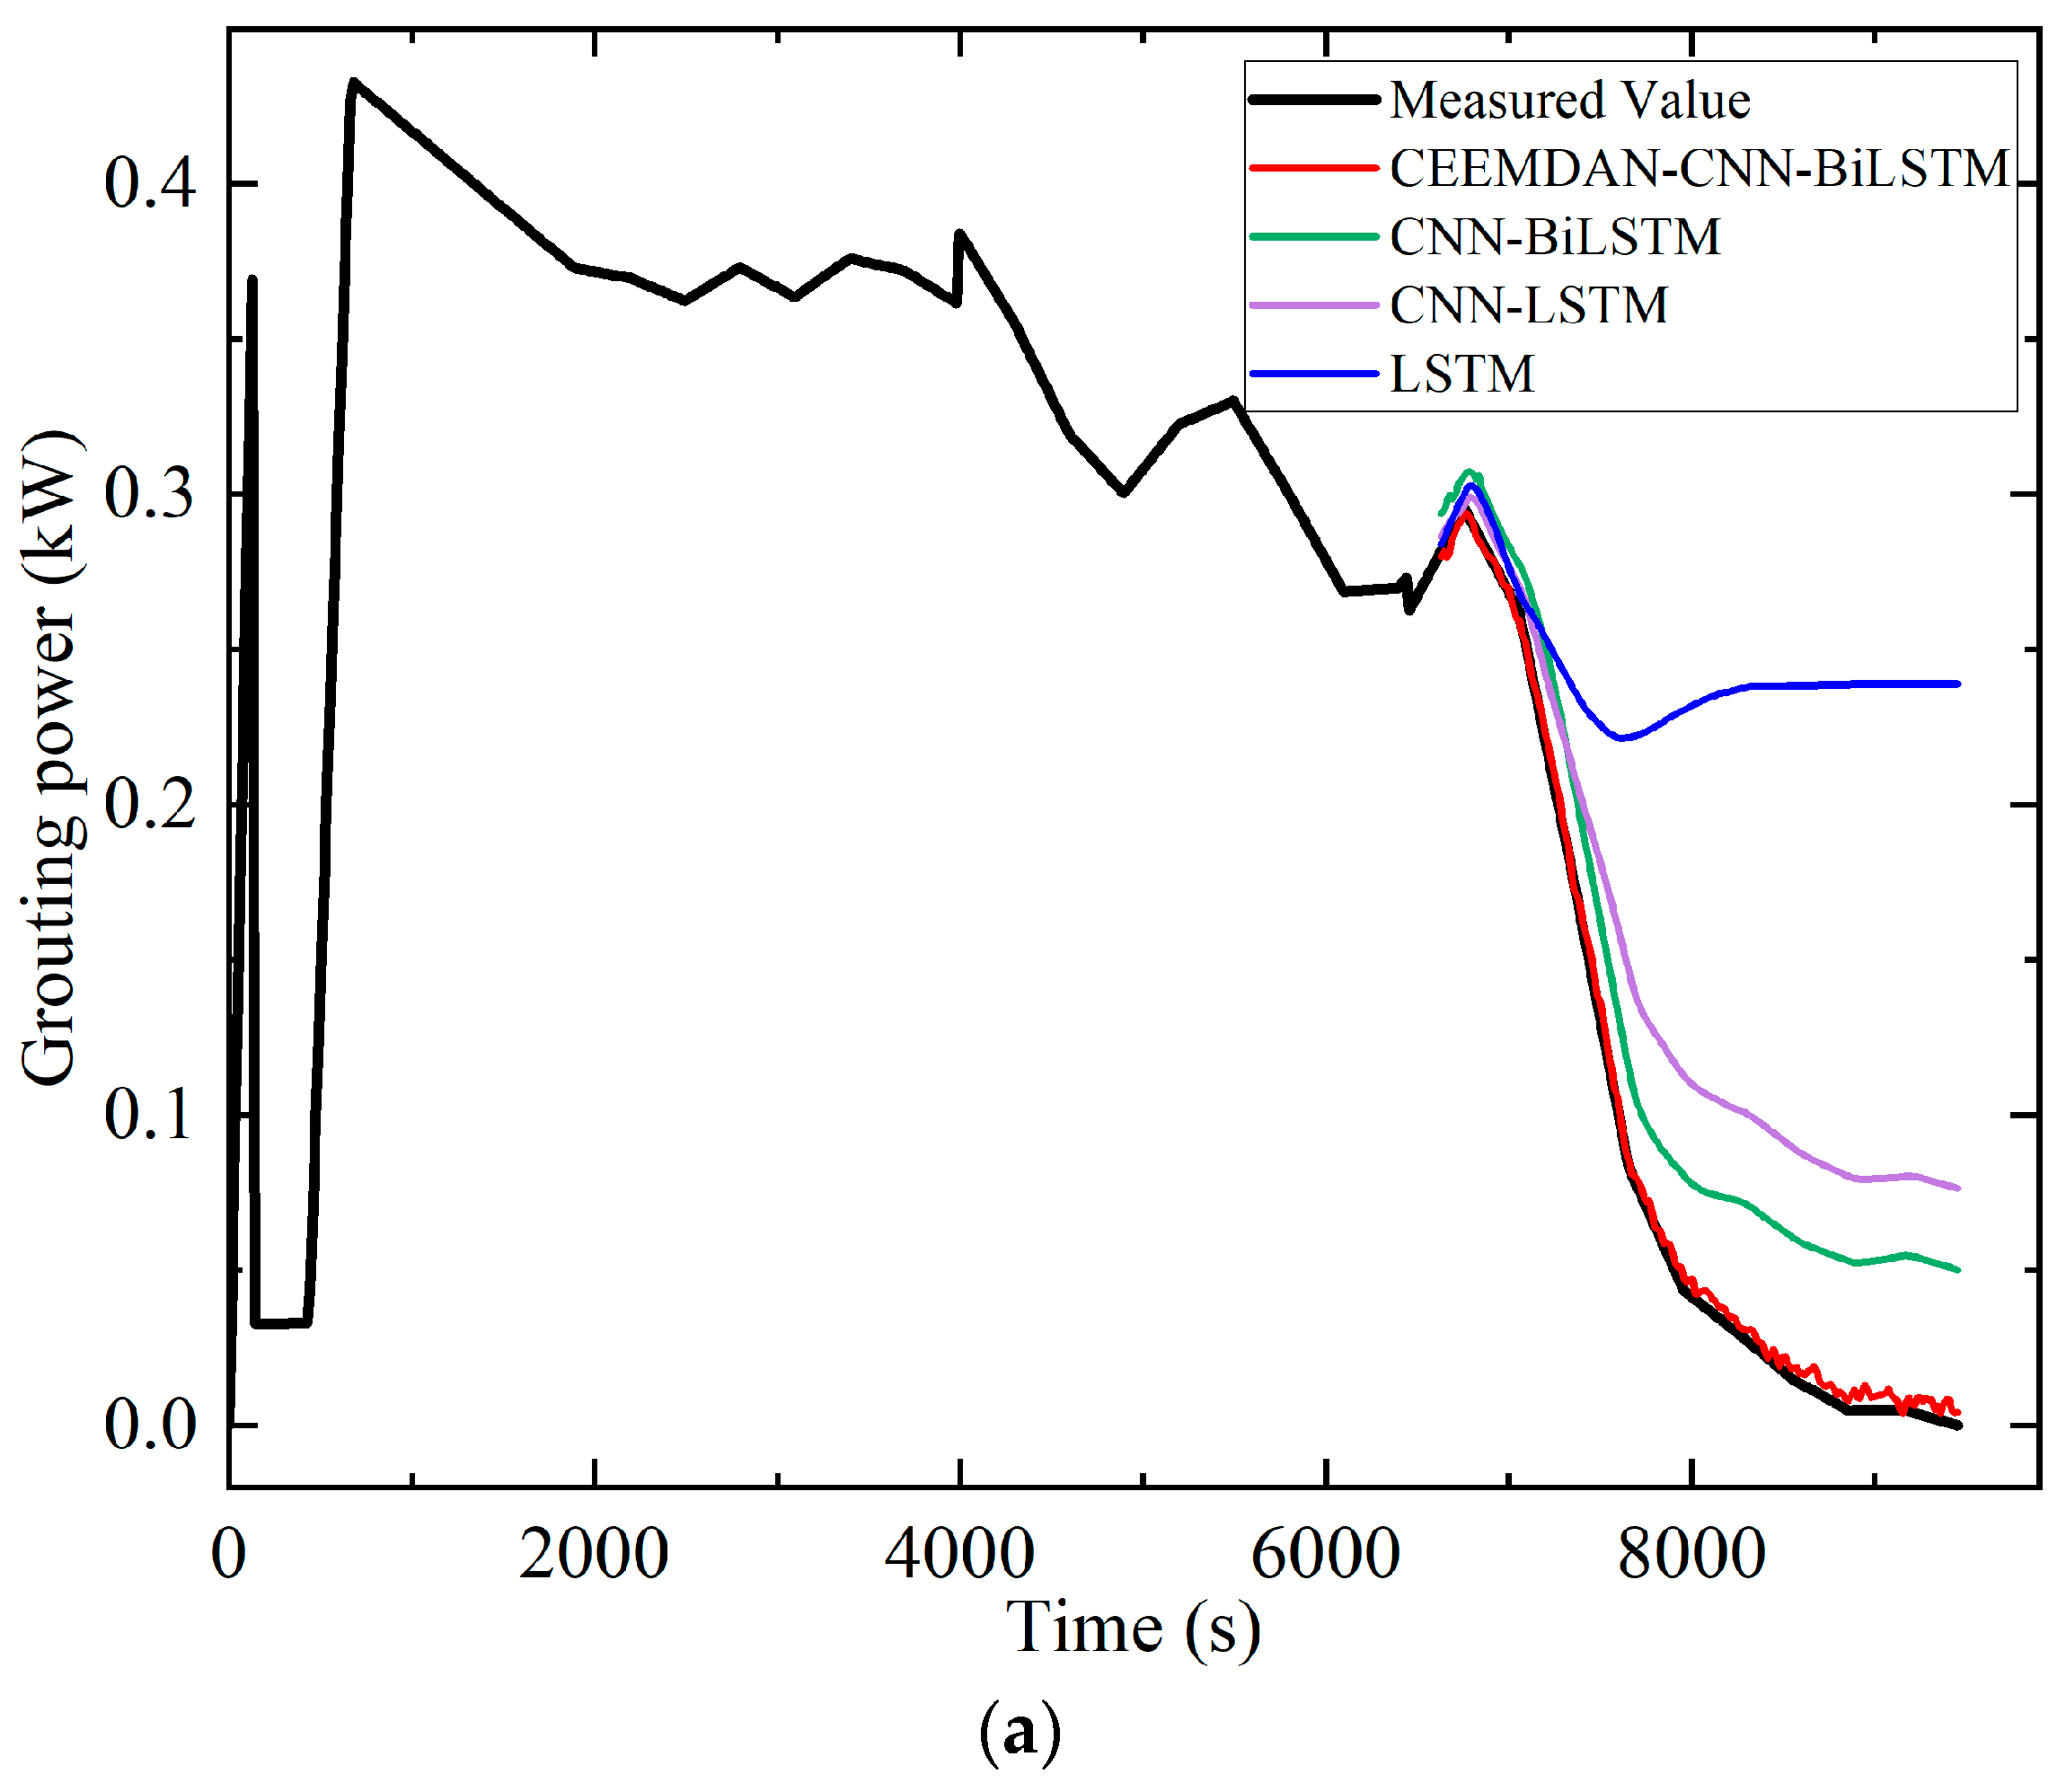
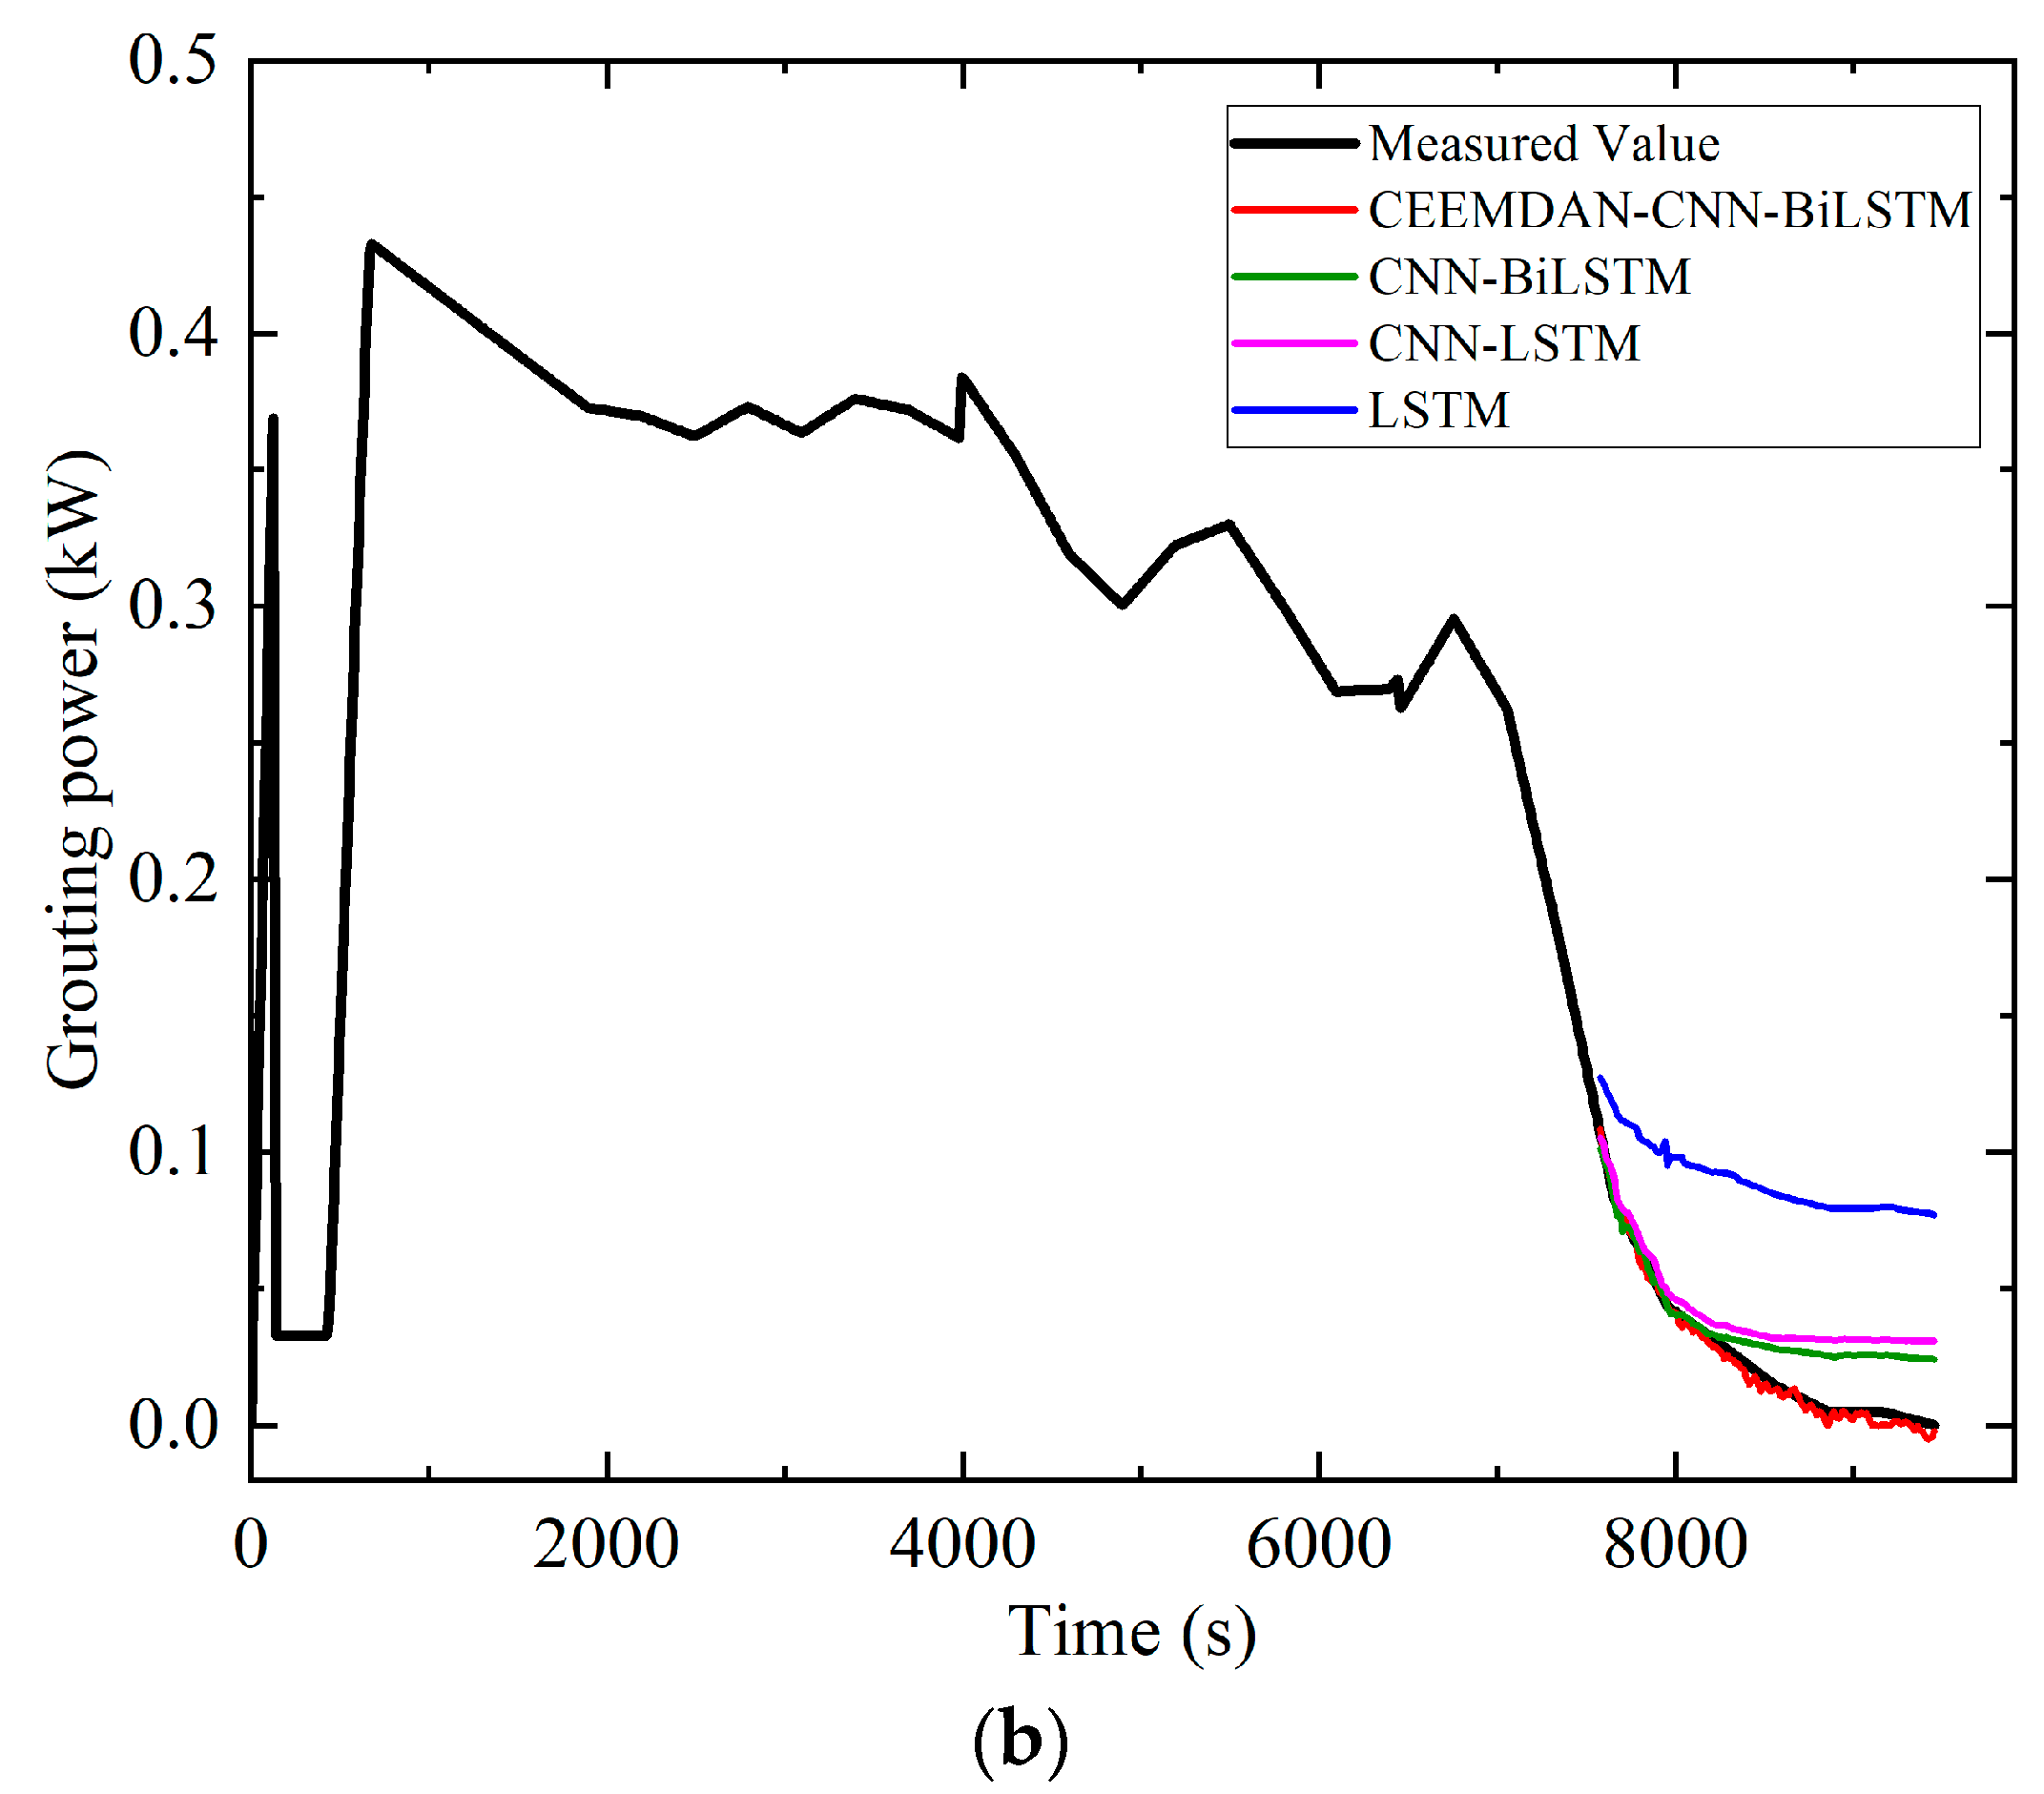
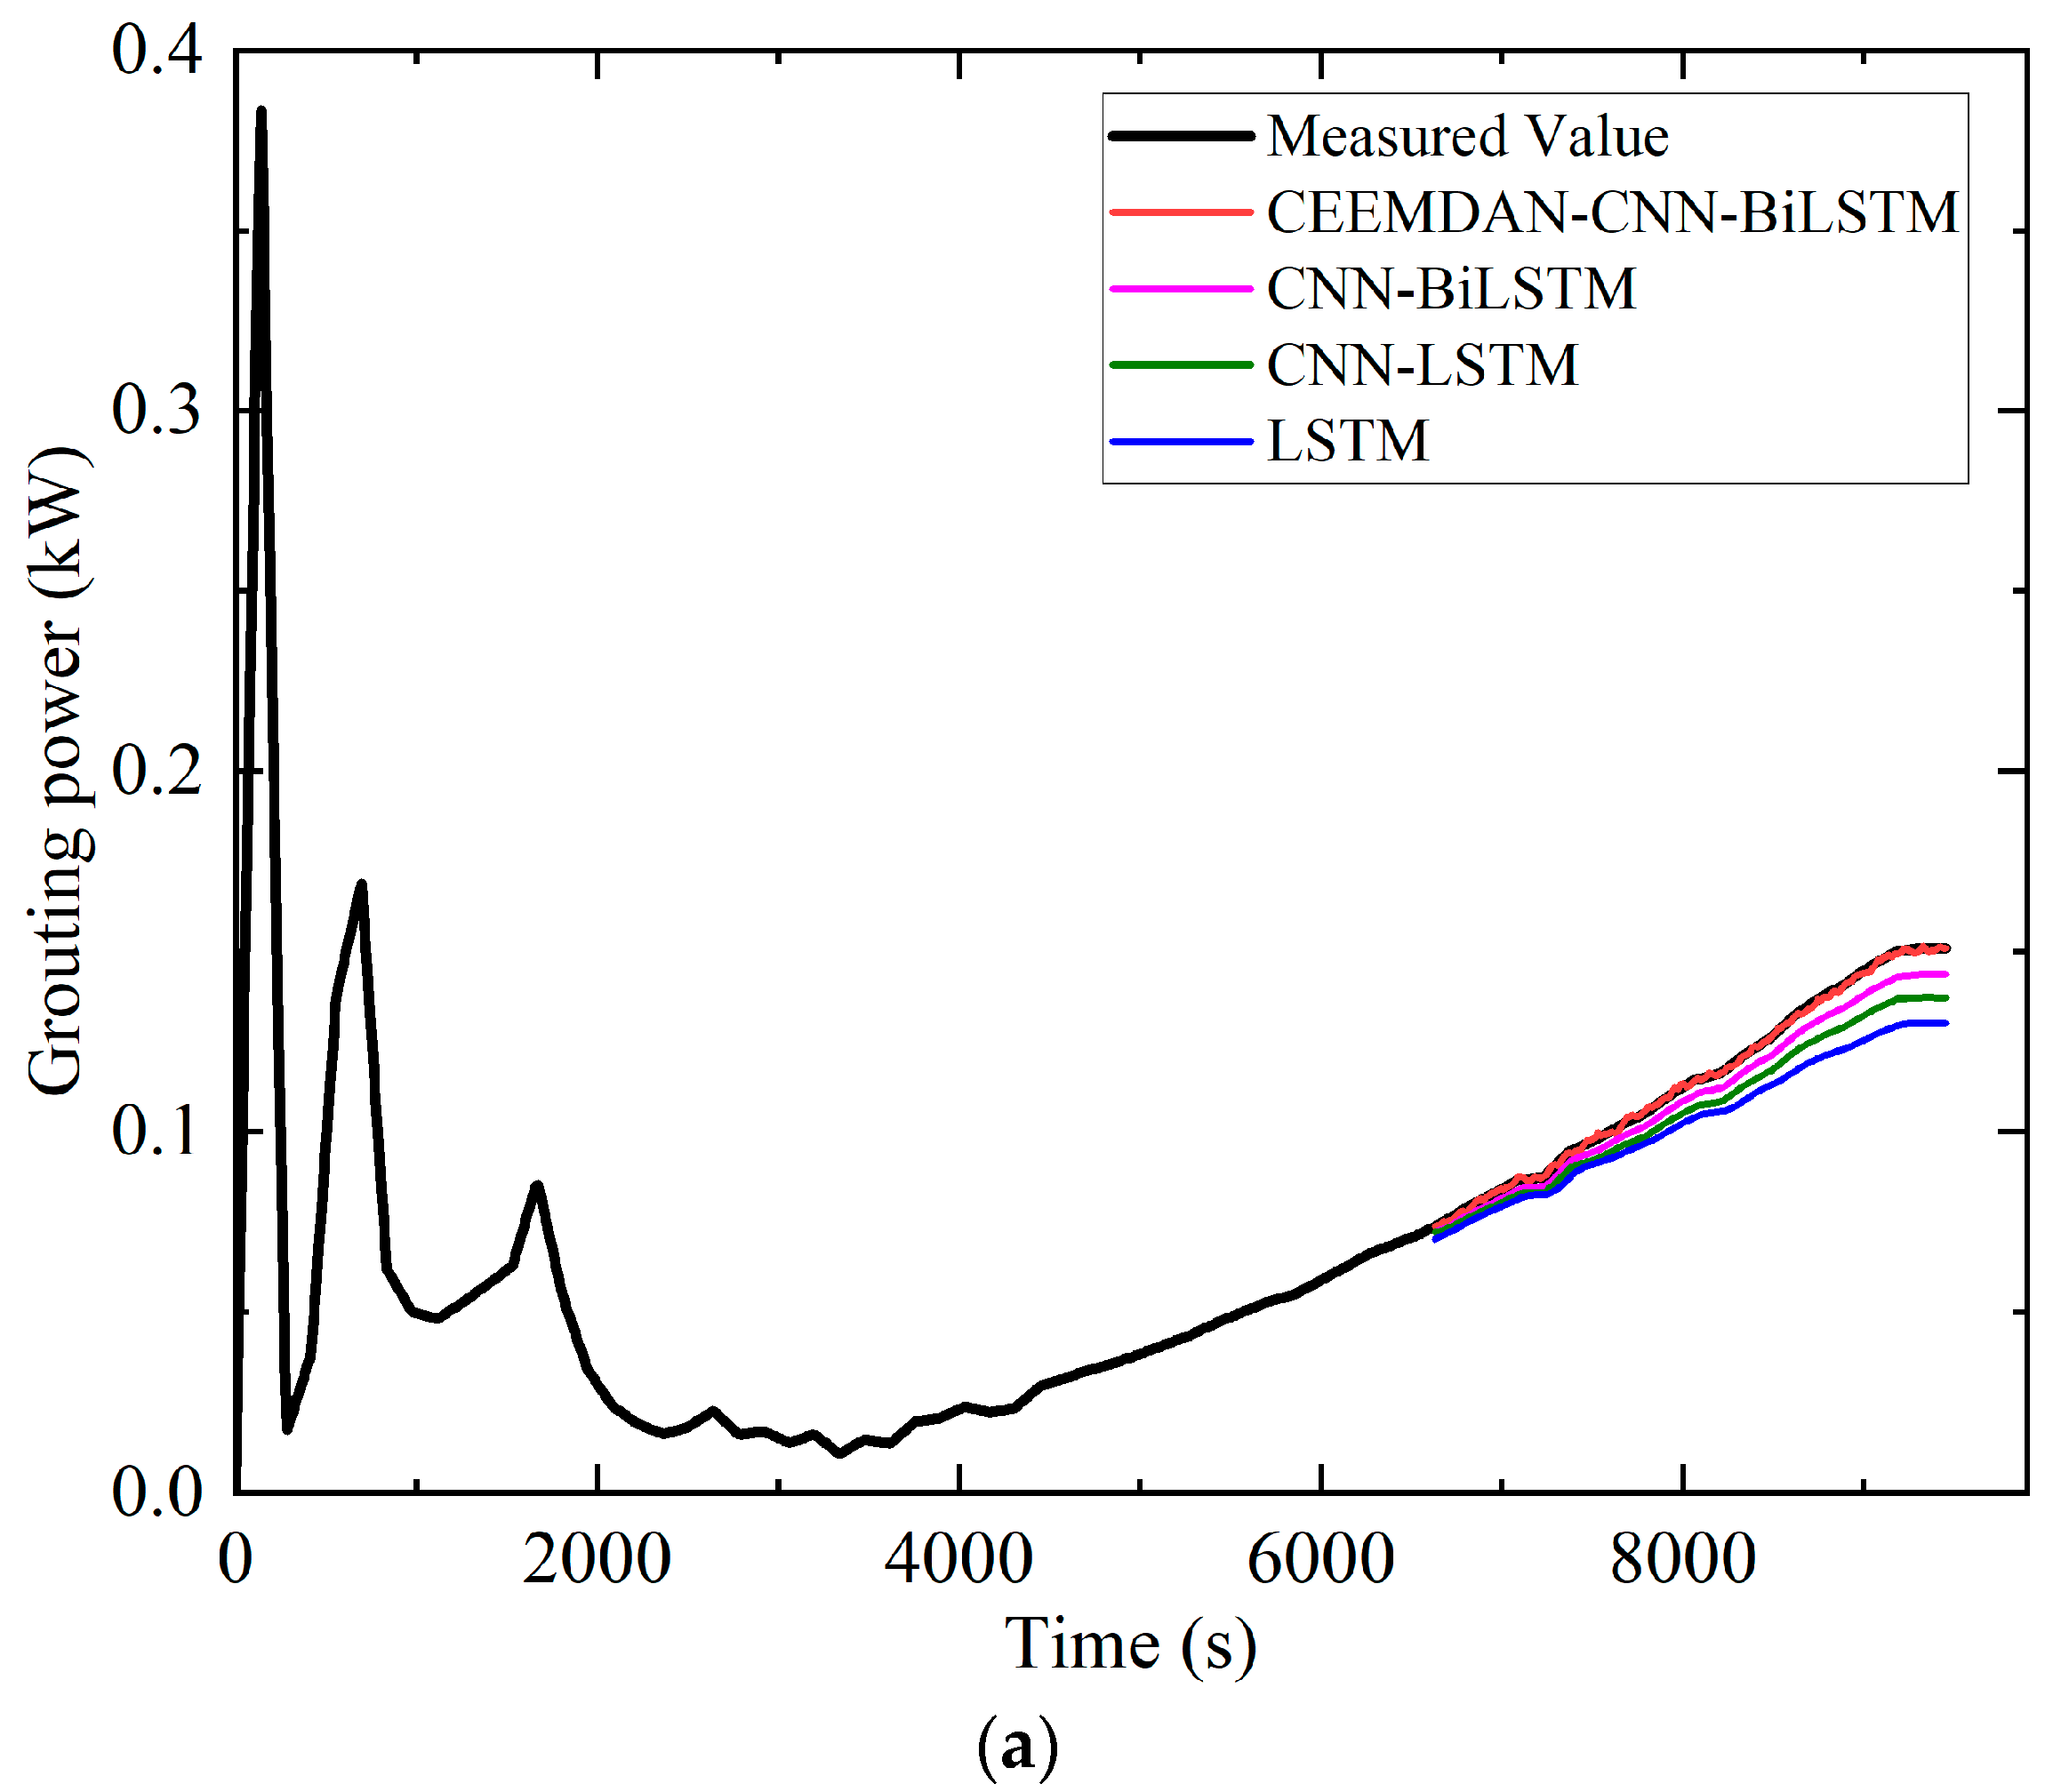
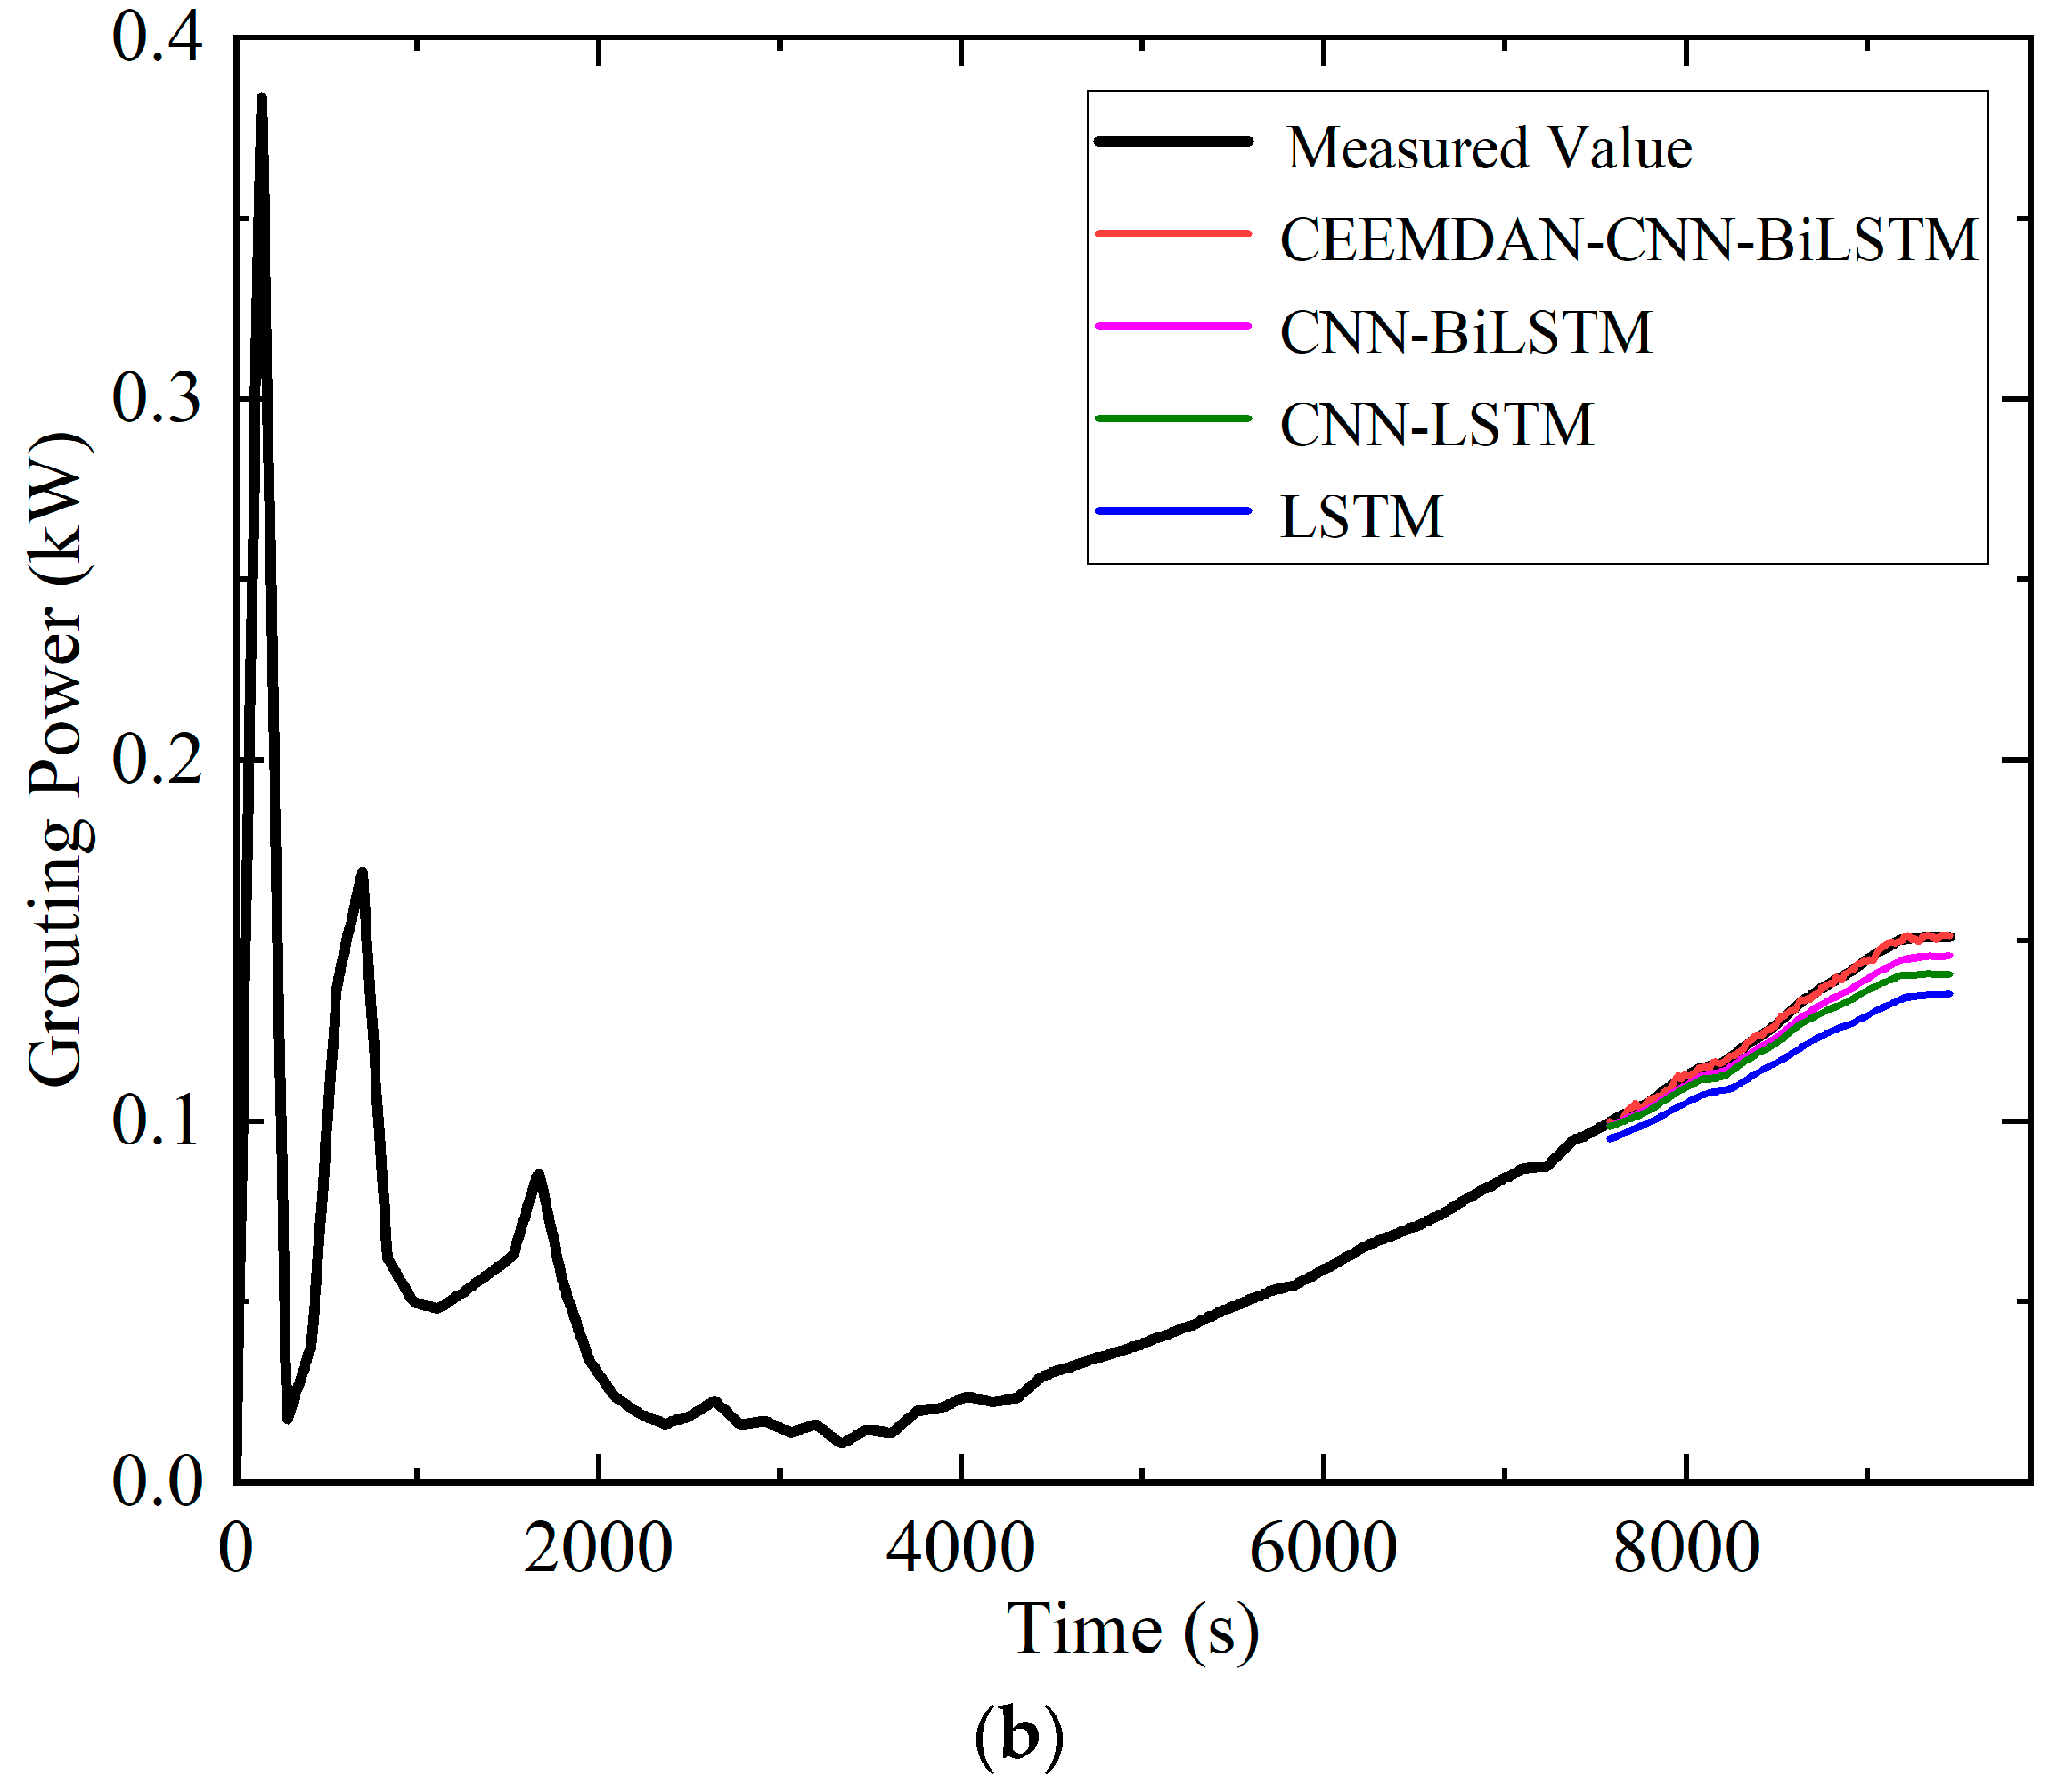
The original grouting power data under normal conditions were decomposed using the CEEMDAN method, as illustrated in Figure 6. Each IMF was separated into linear and nonlinear components using the Moving Average (MA) method. Linear components were predicted with the ARIMA model, and nonlinear components with the CNN-BiLSTM model. 70% and 80% of the grouting power data were used for training, with the remaining data for testing. To thoroughly validate the superiority of the proposed CEEMDAN-CNN-BiLSTM model for grouting power prediction under normal conditions, its performance was compared with that of LSTM, CNN-LSTM, and CNN-BiLSTM models. As shown in Figure 7, the CEEMDAN-CNN-BiLSTM method achieved the best prediction accuracy for both training set ratios, with predicted values closely following the measured ones. The CNN-LSTM model outperformed the LSTM model due to the CNN’s feature extraction capability. Similarly, the CNN-BiLSTM model outperformed the CNN-LSTM model, confirming that bidirectional LSTM better captures temporal dependencies than unidirectional LSTM. Decomposing the original data with CEEMDAN, predicting each IMF component with selected methods, and reconstructing the signal improved the model’s prediction accuracy.
Since the CEEMDAN-CNN-BiLSTM model provides point estimates, the prediction uncertainty (confidence interval) is calculated from the distribution of prediction errors to assess reliability. Table 2 compares the prediction errors of the four models for grouting power under normal conditions. At a 70% training set ratio, the RMSE of the CEEMDAN-CNN-BiLSTM model is reduced by 97.87%, 93.88%, and 90.24% compared to the LSTM, CNN-LSTM, and CNN-BiLSTM models, respectively. At an 80% training set ratio, the RMSE is reduced by 95.69%, 85.11%, and 80.55% compared to the same three models. Overall, under normal grouting conditions, the proposed model demonstrates superior performance in both capturing the variation trend of grouting power and achieving high prediction accuracy. The high accuracy is based on the noise profile and geological conditions of the current case study. The model’s sensitivity to unseen and potentially more adversarial noise types (e.g., strong electromagnetic interference from other heavy machinery) remains an open question and a key area for future robustness testing.
A method combining Empirical Wavelet Transform (EWT) and Support Vector Regression (SVR) for grouting power prediction has been proposed in the literature, with the RMSE of the grouting power prediction being 0.2672 MPa·L/min when the training set ratio is 80% [11]. In comparison, the method proposed in this paper demonstrates a significant improvement in the accuracy of grouting power prediction.

4.3. Grouting Power Prediction Under Heaving Conditions

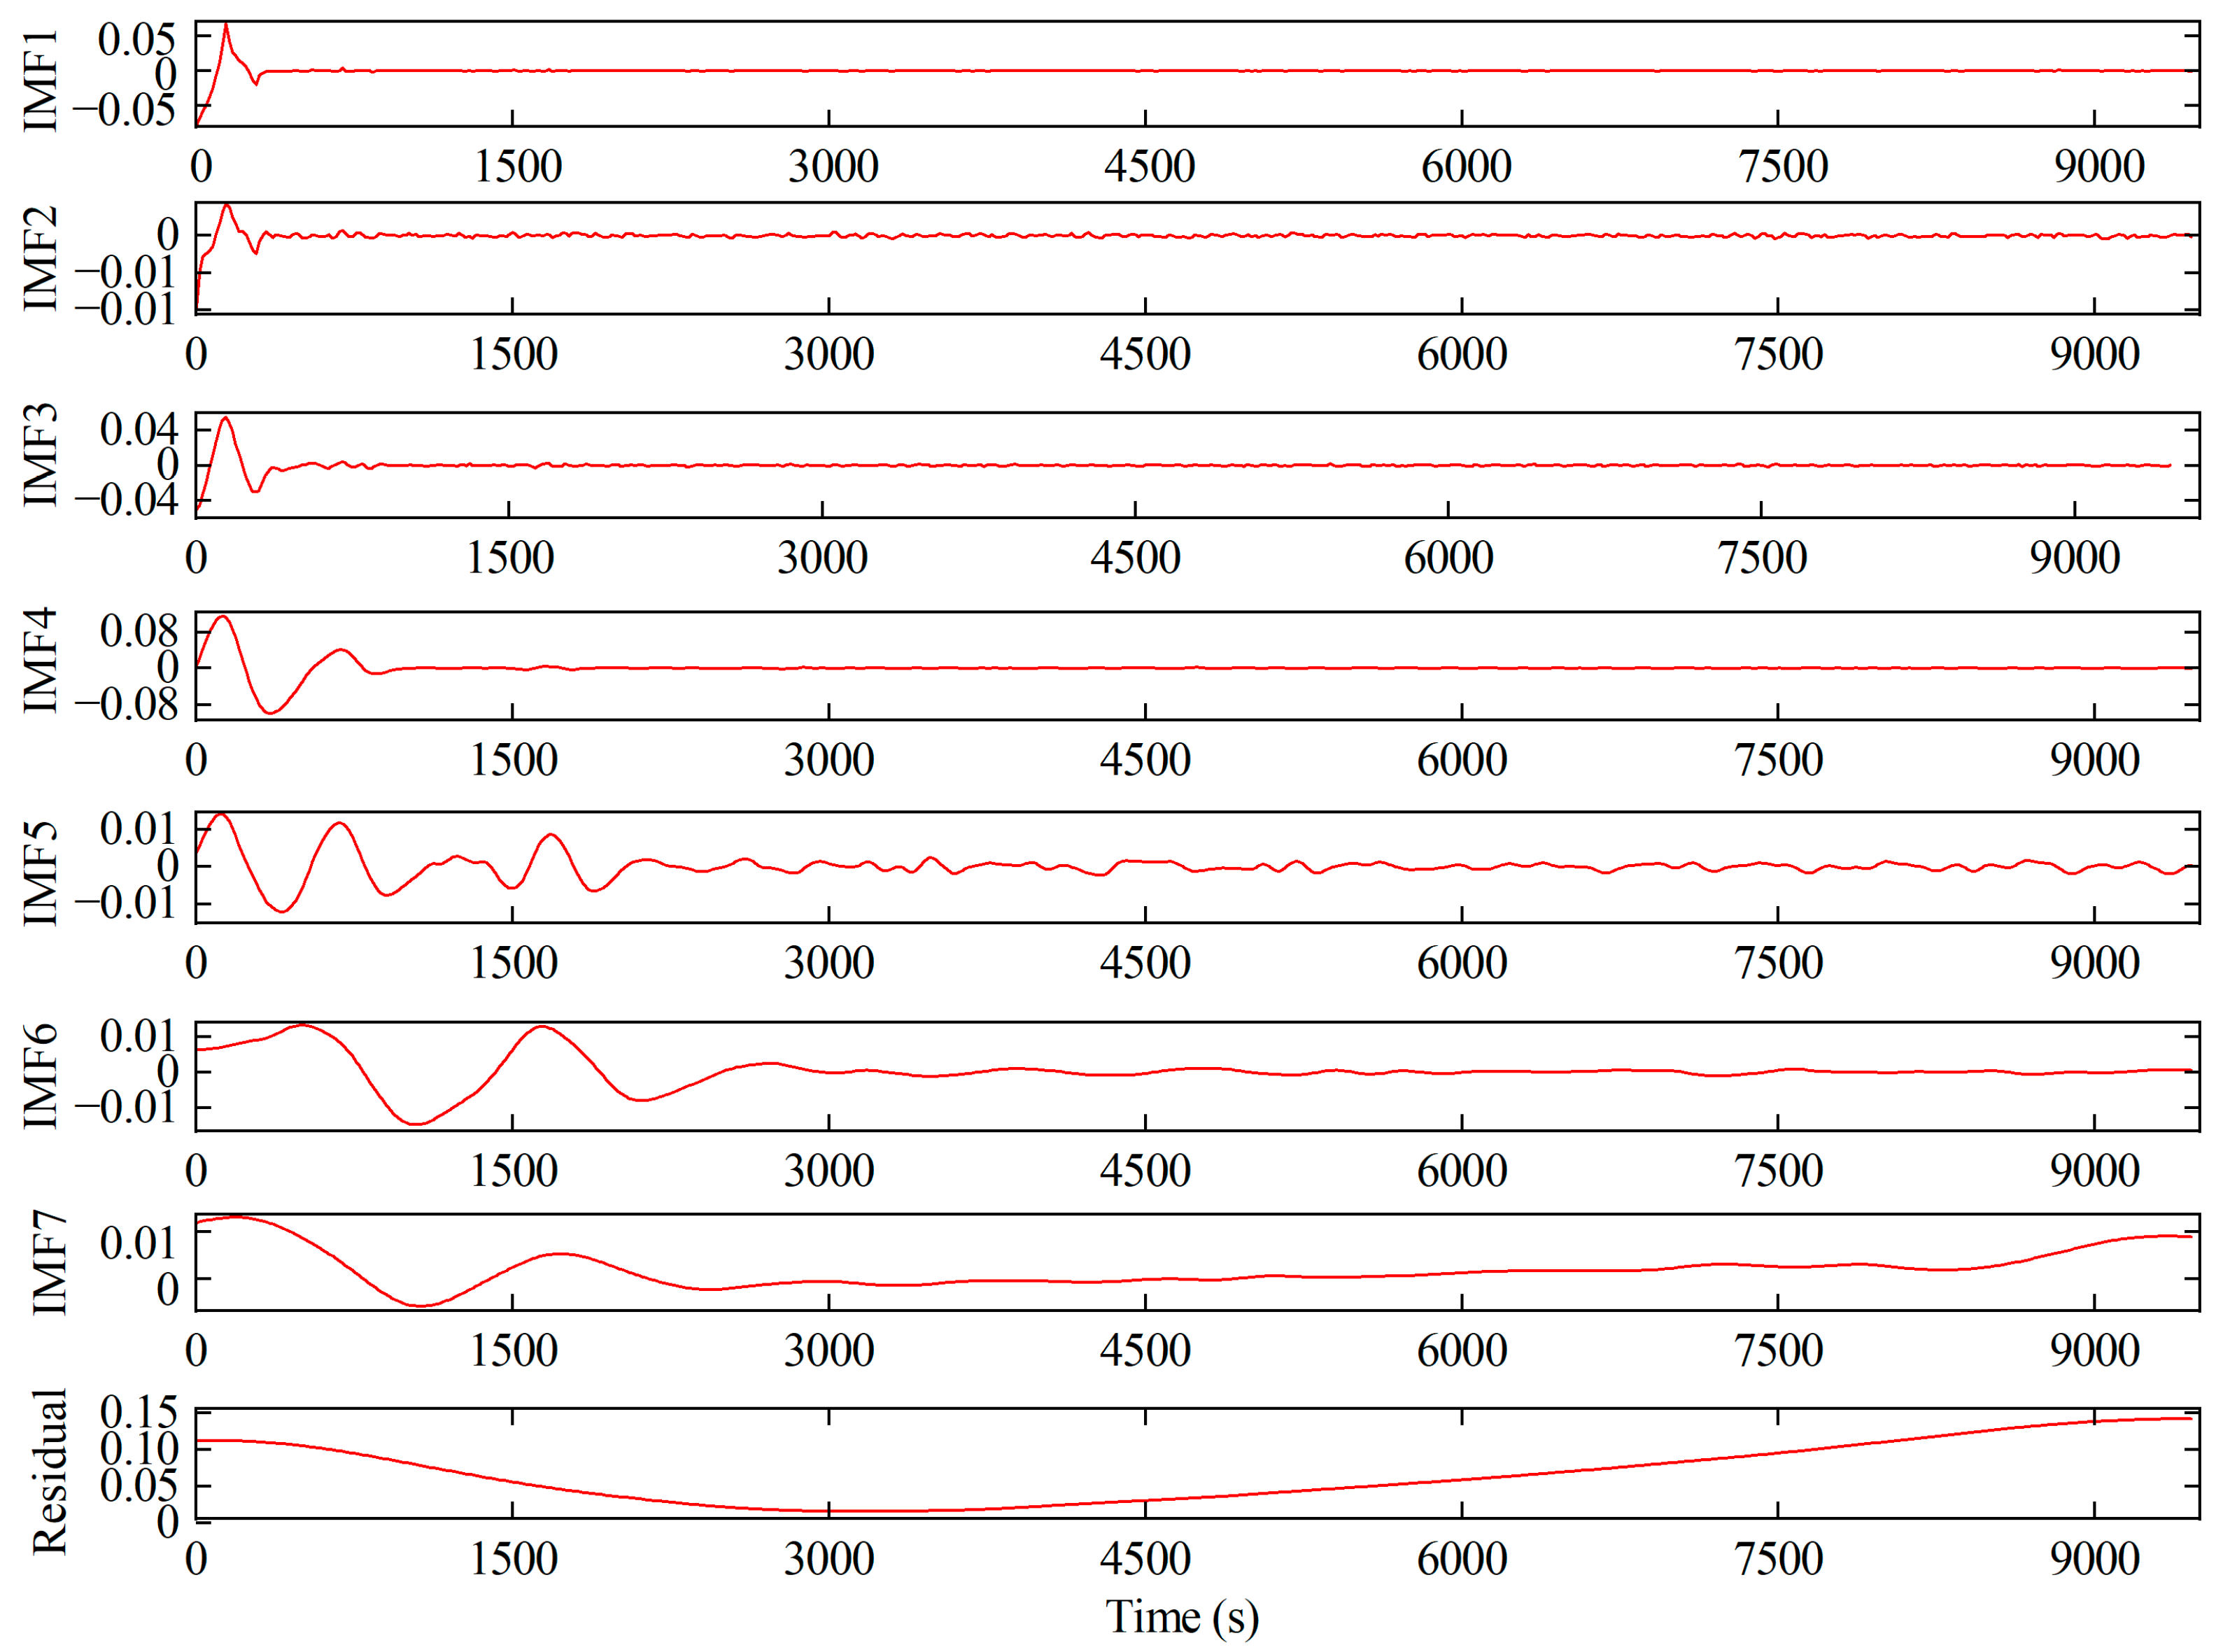
The parameter settings of the proposed CEEMDAN-CNN-BiLSTM model are consistent with those of normal grouting conditions. To further assess the generalization capability of the proposed prediction method, real-world grouting power data collected under heaving conditions were used for performance verification and evaluation. The original power data from the heaving grouting operations was decomposed using the CEEMDAN method, as shown in Figure 8. The first 70% and 80% of the measured grouting power data were utilized as training sets, with the remainder serving as the test set. The prediction results of the CEEMDAN-CNN-BiLSTM model were compared with those of the LSTM, CNN-LSTM, and CNN-BiLSTM models. As illustrated in Figure 9, under both training set ratios, the predictions obtained by the CEEMDAN-CNN-BiLSTM method show the best agreement with the measured values.
Similarly, the confidence intervals of the predicted results are calculated based on the distribution of the prediction errors. As shown in Table 3, the prediction errors and confidence intervals of the four models for grouting power under heaving conditions are compared. The results indicate that when the training set ratio is 70%, the RMSE of the proposed CEEMDAN-CNN-BiLSTM model is reduced by 95.27%, 92.94%, and 87.23% compared to the LSTM, CNN-LSTM, and CNN-BiLSTM models, respectively. When the training set ratio is 80%, the RMSE values are reduced by 94.91%, 90.71%, and 84.62% compared to the same three benchmark models, respectively. In conclusion, the proposed model achieves the highest prediction accuracy for grouting power under heaving conditions. In summary, the proposed model achieves the highest prediction accuracy for grouting power under heaving conditions. However, this success is based on a single project’s data. The scalability of this approach—translating it to projects of significantly different scales, with different equipment, or in radically different rock masses (e.g., karst formations)—remains unproven and represents a critical next step for broader industrial application.

5. Conclusions

This study developed an intelligent grouting control system for real-time monitoring and parameter adjustment during grouting operations. Multi-dimensional real-time grouting power data under both normal and heaving conditions were collected from the Xiong’an Regulation Reservoir Project of the South-to-North Water Diversion Middle Route. A novel grouting power prediction method based on CEEMDAN-CNN-BiLSTM was proposed; its effectiveness and accuracy were rigorously validated through comparative experiments with multiple models under two distinct working conditions. The main conclusions are as follows:
(1) The developed intelligent grouting control system effectively acquired multi-condition grouting data, including average pressure, injection rate, and slurry density, providing comprehensive, real-time, and multi-dimensional foundational data for model training and validation. The CEEMDAN-CNN-BiLSTM model proposed in this study provides a novel approach for handling the strong non-stationarity of grouting power by integrating signal decomposition and the prediction of linear and nonlinear components. This method not only enhances prediction accuracy but also enables the development of a unified prediction model for both normal and heaving conditions.
(2) The proposed CEEMDAN-CNN-BiLSTM model significantly improved the prediction accuracy of grouting power under normal conditions. Experimental results demonstrated that with an 80% training set ratio under normal grouting conditions, the model achieved an RMSE as low as 0.0037, representing reductions of 95.69%, 85.11%, and 80.55% compared to LSTM, CNN-LSTM, and CNN-BiLSTM models, respectively. This demonstrates the model’s ability to effectively handle nonlinear characteristics and accurately capture the dynamic variations in grouting power during normal operations.
(3) The model demonstrated excellent generalization performance under heaving conditions, significantly outperforming all comparison models. With a training set ratio of 80%, the proposed model achieved RMSE reduction of 94.91%, 90.71%, and 84.62% compared to LSTM, CNN-LSTM, and CNN-BiLSTM, respectively. This demonstrates its robustness in handling data fluctuations under abnormal conditions and provides high-precision support for dynamic parameter adjustment in complex grouting operations.
Currently, the model’s validation is limited to the power series data from a single grouting hole, and its generalization ability across different geological conditions or boreholes has yet to be verified. Future research will focus on collecting more empirical data from multiple grouting holes and exploring prediction algorithms based on Bayesian neural networks and transfer learning. This will allow for the validation of cross-hole power prediction accuracy and reliability, as well as its deployment in an intelligent grouting control system, to advance the engineering application of grouting power prediction methods.

Author Contributions

Conceptualization, Y.D. and F.H.; Data curation, Z.C.; Formal analysis, Y.D.; Methodology, F.H. and Y.Y.; Project administration, Y.D.; Software, Z.C.; Writing—original draft, Y.D. and Y.Y. All authors have read and agreed to the published version of the manuscript.

Funding

This research was funded by the “Intergovernmental Special Project on International Science, Technology and Innovation Cooperation” under the National Key R&D Program (2022YFE0117500).

Institutional Review Board Statement

Not applicable.

Informed Consent Statement

Not applicable.

Data Availability Statement

The original contributions presented in this study are included in the in the article. Further inquiries can be directed to the corresponding author.

Conflicts of Interest

Authors Ye Ding and Fan Huang were employed by Changjiang Institute of Survey, Planning, Design and Research Corporation. Authors Ye Ding and Fan Huang were employed by Changjiang Geotechnical Engineering Corporation. Author Zhi Cao was employed by China National Petroleum Corporation. The remaining authors declare that the research was conducted in the absence of any commercial or financial relationships that could be construed as a potential conflict of interest.

Nomenclature

P Q m a x Maximum allowable grouting power threshold
P Q m i n Minimum allowable grouting power threshold
y ( t ) Original grouting power data
y j ( t ) New sequence with Gaussian white noise added
ε j ( t ) Gaussian white noise added at the j-th iteration
I M F 1 First IMF obtained by CEEMDAN decomposition
I M F j 1 Normal velocity First IMF obtained by EMD
r 1 ( t ) Residual sequence after the first decomposition step
r n ( t ) Final residual sequence
l t Linear component
r t Nonlinear fluctuation component
m Moving average step size
y t Grouting power value at current time step
y t 1 Grouting power value at previous time step
ε t Measurement error
d Differencing order
y p Predicted grouting power value
y t Measured grouting power value
R M S E Root Mean Square Error
M A E Mean Absolute Error
R 2 Coefficient of determination

References

  1. Xu, X.; Wu, Z.; Weng, L.; Chu, Z.; Liu, Q.; Wang, Z. Investigating the impacts of reinforcement range and grouting timing on grouting reinforcement effectiveness for tunnels in fault rupture zones using a numerical manifold method. Eng. Geol. 2024, 330, 107423. [Google Scholar] [CrossRef]
  2. Peng, L.; Xiong, J.; Liu, Y. A self-control and visual grouting model test system and measurement method. Measurement 2020, 154, 107481. [Google Scholar] [CrossRef]
  3. Fan, Q.; Jiang, X.; Wang, K.; Huang, C.; Li, G.; Wei, P. Cement grouting online monitoring and intelligent control for dam foundations. J. Intell. Constr. 2023, 1, 1–15. [Google Scholar] [CrossRef]
  4. Ismail, F.B.; Al-Faiz, H.; Hasini, H.; Al-Bazi, A.; Kazem, H.A. A comprehensive review of the dynamic applications of the digital twin technology across diverse energy sectors. Energy Strategy Rev. 2024, 52, 101334. [Google Scholar] [CrossRef]
  5. Moshood, T.D.; Rotimi, J.O.; Shahzad, W.; Bamgbade, J.A. Infrastructure digital twin technology: A new paradigm for future construction industry. Technol. Soc. 2024, 77, 102519. [Google Scholar] [CrossRef]
  6. Wang, K.; Chen, P.; Xu, K.; Yang, C.; Li, Y.; Zong, H. A forchheimer-based fluid-solid coupling model for nonlinear flow of power-law grouts in fractured rock grouting. Sci. Rep. 2025, 15, 29445. [Google Scholar] [CrossRef]
  7. Wu, Y.; Ren, G.; Zhang, X.; Zhao, C.; Zhao, C. Spherical permeation grouting model of a power-law fluid considering the soil unloading effect. Int. J. Geomech. 2024, 24, 04023266. [Google Scholar] [CrossRef]
  8. Ye, F.; Qin, N.; Han, X.; Liang, X.; Gao, X.; Ying, K. Displacement infiltration diffusion model of power-law grout as backfill grouting of a shield tunnel. Eur. J. Environ. Civ. Eng. 2022, 26, 1820–1833. [Google Scholar] [CrossRef]
  9. Zhao, L.; Qi, X.; Tan, F.; Chen, Y. A new prediction model of the jet grouting column diameter for three jet grouting systems. Comput. Geotech. 2023, 163, 105753. [Google Scholar] [CrossRef]
  10. Gaspar, G.; Budjac, R.; Sedivy, S.; Stremy, M.; Benka, D.; Nemlaha, E.; Elias, R. Innovative Grouting Process Monitoring: Design and Implementation of a Measurement Device with Datalogger Function. IEEE Access 2025, 13, 19340–19352. [Google Scholar] [CrossRef]
  11. Xue, L.; Zhu, Y.; Guan, T.; Ren, B.; Tong, D.; Wu, B. Grouting Power Prediction Using a Hybrid Model Based on Support Vector Regression Optimized by an Improved Jaya Algorithm. Appl. Sci. 2020, 10, 7273. [Google Scholar] [CrossRef]
  12. Li, X.; Zhong, D.; Ren, B.; Fan, G.; Cui, B. Prediction of curtain grouting efficiency based on ANFIS. Bull. Eng. Geol. Environ. 2019, 78, 281–309. [Google Scholar] [CrossRef]
  13. Zhao, W.; Feng, S.; Liu, J.; Sun, B. An explainable intelligent algorithm for the multiple performance prediction of cement-based grouting materials. Constr. Build. Mater. 2023, 366, 130146. [Google Scholar] [CrossRef]
  14. Zhe, Y.; Hou, K.; Wang, Z.; Yang, S.; Sun, H. Prediction model for grouting volume using borehole image features and explainable artificial intelligence. Constr. Build. Mater. 2025, 470, 140626. [Google Scholar] [CrossRef]
  15. Hu, M.; Xie, H.; Lu, J. Prediction of Grouting Volume for Shield Tunnel Construction Based on Integrated Learning Model. In Proceedings of the 2025 IEEE 8th Information Technology and Mechatronics Engineering Conference (ITOEC), Chongqing, China, 14–16 March 2025; IEEE: New York City, NY, USA, 2025; pp. 1311–1315. [Google Scholar]
  16. Zhong, D.; Liu, Z.; Su, Z.; Li, K.; Li, X. Predicting and controlling the cement intake during curtain grouting of dam foundations. Eur. J. Environ. Civ. Eng. 2022, 26, 4237–4262. [Google Scholar] [CrossRef]
  17. Zhu, Y.; Wang, X.; Wang, J.; Xue, L.; Yu, J.; Chen, W. A hybrid interval prediction model for the PQ index using a lower upper bound estimation-based extreme learning machine. Soft Comput. 2021, 25, 11551–11571. [Google Scholar] [CrossRef]
  18. Chen, X.; Deng, L.; Xie, T.; Liang, J. Research on Dam Grouting Efficiency Based on Dynamic Detection and Prediction of Cement Slurry Rheology. In Proceedings of the 2024 14th Asian Control Conference (ASCC), Dalian, China, 5–8 July 2024; IEEE: New York City, NY, USA, 2024; pp. 1710–1716. [Google Scholar]
  19. Niu, J.; Wang, B.; Wang, H.; Deng, Z.; Liu, J.; Li, Z.; Chen, G.; Zhang, B. An intelligent prediction method of the karst curtain grouting volume based on support vector machine. Geofluids 2020, 2020, 8892106. [Google Scholar] [CrossRef]
  20. Spampinato, C.; Valastro, S.; Calogero, G.; Smecca, E.; Mannino, G.; Arena, V.; Balestrini, R.; Sillo, F.; Ciná, L.; La Magna, A.; et al. Improved radicchio seedling growth under CsPbI3 perovskite rooftop in a laboratory-scale greenhouse for Agrivoltaics application. Nat. Commun. 2025, 16, 2190. [Google Scholar] [CrossRef]
  21. Arena, V.; Smecca, E.; Valastro, S.; Bongiorno, C.; Fisicaro, G.; Deretzis, I.; Spampinato, C.; Mannino, G.; Dattilo, S.; Scamporrino, A.A.; et al. Lead Detection in a Gig-Lox TiO2 Sponge by X-ray Reflectivity. Nanomaterials 2023, 13, 1397. [Google Scholar] [CrossRef] [PubMed]
  22. Yang, J.; Yin, Z.; Liu, Y.; Laouafa, F. Multiphysics modelling of backfill grouting in sandy soils during TBM tunnelling. Acta Geotech. 2023, 18, 553–571. [Google Scholar] [CrossRef]
  23. Li, G.; Cao, H.; Wu, J.; Wang, B.; Zhou, X.; Zhao, W.; Cai, X. Multiphase flow coupling analysis of shield synchronous grouting filling law with time-dependent viscosity. Aip Adv. 2023, 13, 125126. [Google Scholar] [CrossRef]
  24. Jayaraman, P.; Nagarajan, K.K.; Partheeban, P.; Krishnamurthy, V. Critical review on water quality analysis using IoT and machine learning models. Int. J. Inf. Manag. Data Insights 2024, 4, 100210. [Google Scholar] [CrossRef]
  25. Cui, X. A comprehensive study on damage prediction of pile foundations of inclined high rise buildings and the effect of compaction grouting. Sci. Rep. 2025, 15, 31813. [Google Scholar] [CrossRef] [PubMed]
  26. Sui, X.; Leng, Z.; Wang, S.; Cai, X.; Gong, M.; Zhang, L. In-situ grouting rate prediction of semi-flexible pavement based on a novel composite dielectric constant model and ground-penetrating radar. Constr. Build. Mater. 2024, 438, 137209. [Google Scholar] [CrossRef]
  27. Wang, F.; Tadele, M.; Chen, X. Bi-directional long short-term memory recurrent neural network with attention for stack voltage degradation from proton exchange membrane fuel cells. J. Power Sources 2020, 461, 228170. [Google Scholar] [CrossRef]
  28. Sun, B.; Liu, X.; Wang, J.; Wei, X.; Yuan, H.; Dai, H. Short-term performance degradation prediction of a commercial vehicle fuel cell system based on CNN and LSTM hybrid neural network. Int. J. Hydrog. Energy 2023, 48, 8613–8628. [Google Scholar] [CrossRef]
  29. Peng, Y.; Chen, T.; Xiao, F.; Zhang, S. Remaining useful lifetime prediction methods of proton exchange membrane fuel cell based on convolutional neural network-long short-term memory and convolutional neural network-bidirectional long short-term memory. Fuel Cells 2023, 23, 75–87. [Google Scholar] [CrossRef]
  30. Jiang, H.; Qiu, X. Performance assessment of a newly developed and highly stable grouting material for a completely weathered granite dam foundation. Constr. Build. Mater. 2021, 299, 123956. [Google Scholar] [CrossRef]
  31. Ren, Z.; Zhang, C.; Wang, Y.; Lan, S.; Liu, S. Stability analysis and grouting treatment of inclined shaft lining structure in water-rich strata: A case study. Geohazard Mech. 2023, 1, 308–318. [Google Scholar] [CrossRef]
  32. Kang, H.; Li, W.; Gao, F.; Yang, J. Grouting theories and technologies for the reinforcement of fractured rocks surrounding deep roadways. Deep. Undergr. Sci. Eng. 2023, 2, 2–19. [Google Scholar] [CrossRef]
  33. Liang, X.; Feng, K.; Hu, Z.; Wang, C.; He, C. Study on grout ratio and performance of backfill grouting in water-rich strata. Constr. Build. Mater. 2024, 443, 137766. [Google Scholar] [CrossRef]
  34. Peng, P.; Peng, F.; Sun, Z.; Zhang, D. Grouting for tunnel stability control and inadequate grouting section recognition: A case study of countermeasure of giant karst cave. Appl. Sci. 2022, 12, 11895. [Google Scholar] [CrossRef]
  35. Xu, Z.; Sun, J.; Li, R.; He, L.; Liu, C. Effects of elevated ground temperatures on properties of cement grouts for deep rock grouting. Deep. Undergr. Sci. Eng. 2025, 4, 171–188. [Google Scholar] [CrossRef]
  36. Zhao, J.; Huang, G.; Guo, Y.; Feng, Z.; Gupta, R.; Liu, W.V. Development of a novel cement-based grout with enhanced thermal and sealing performance for borehole heat exchangers. Energy Build. 2024, 302, 113754. [Google Scholar] [CrossRef]
  37. Cheng, X.; Sheng, L.; Xia, Z.; Liu, Y.; Ma, X.; Pan, J.; Zheng, G.; Wang, R. Grouting theory and strategy of simultaneous control of the horizontal and vertical deformations of tunnels. Int. J. Geomech. 2024, 24, 04023267. [Google Scholar] [CrossRef]
  38. Cao, C.; Xie, Z.; Zhang, N.; Han, C.; Yan, G.; Mu, F.; Zhang, W. Differential roof cutting for roadway support in dual gob-side entry retention on a single working face− Multilevel continuous anchor-grouting control technology: A case study. Eng. Fail. Anal. 2024, 163, 108475. [Google Scholar] [CrossRef]
  39. Wu, S.; Guo, H.; Zhang, X.; Wang, F. Short-Term Photovoltaic Power Prediction Based on CEEMDAN and Hybrid Neural Networks. IEEE J. Photovolt. 2024, 14, 960–969. [Google Scholar] [CrossRef]
  40. Karijadi, I.; Chou, S. A hybrid RF-LSTM based on CEEMDAN for improving the accuracy of building energy consumption prediction. Energy Build. 2022, 259, 111908. [Google Scholar] [CrossRef]
  41. Zhang, J.; Ye, L.; Lai, Y. Stock price prediction using CNN-BiLSTM-Attention model. Mathematics 2023, 11, 1985. [Google Scholar] [CrossRef]
  42. Song, B.; Liu, Y.; Fang, J.; Liu, W.; Zhong, M.; Liu, X. An optimized CNN-BiLSTM network for bearing fault diagnosis under multiple working conditions with limited training samples. Neurocomputing 2024, 574, 127284. [Google Scholar] [CrossRef]
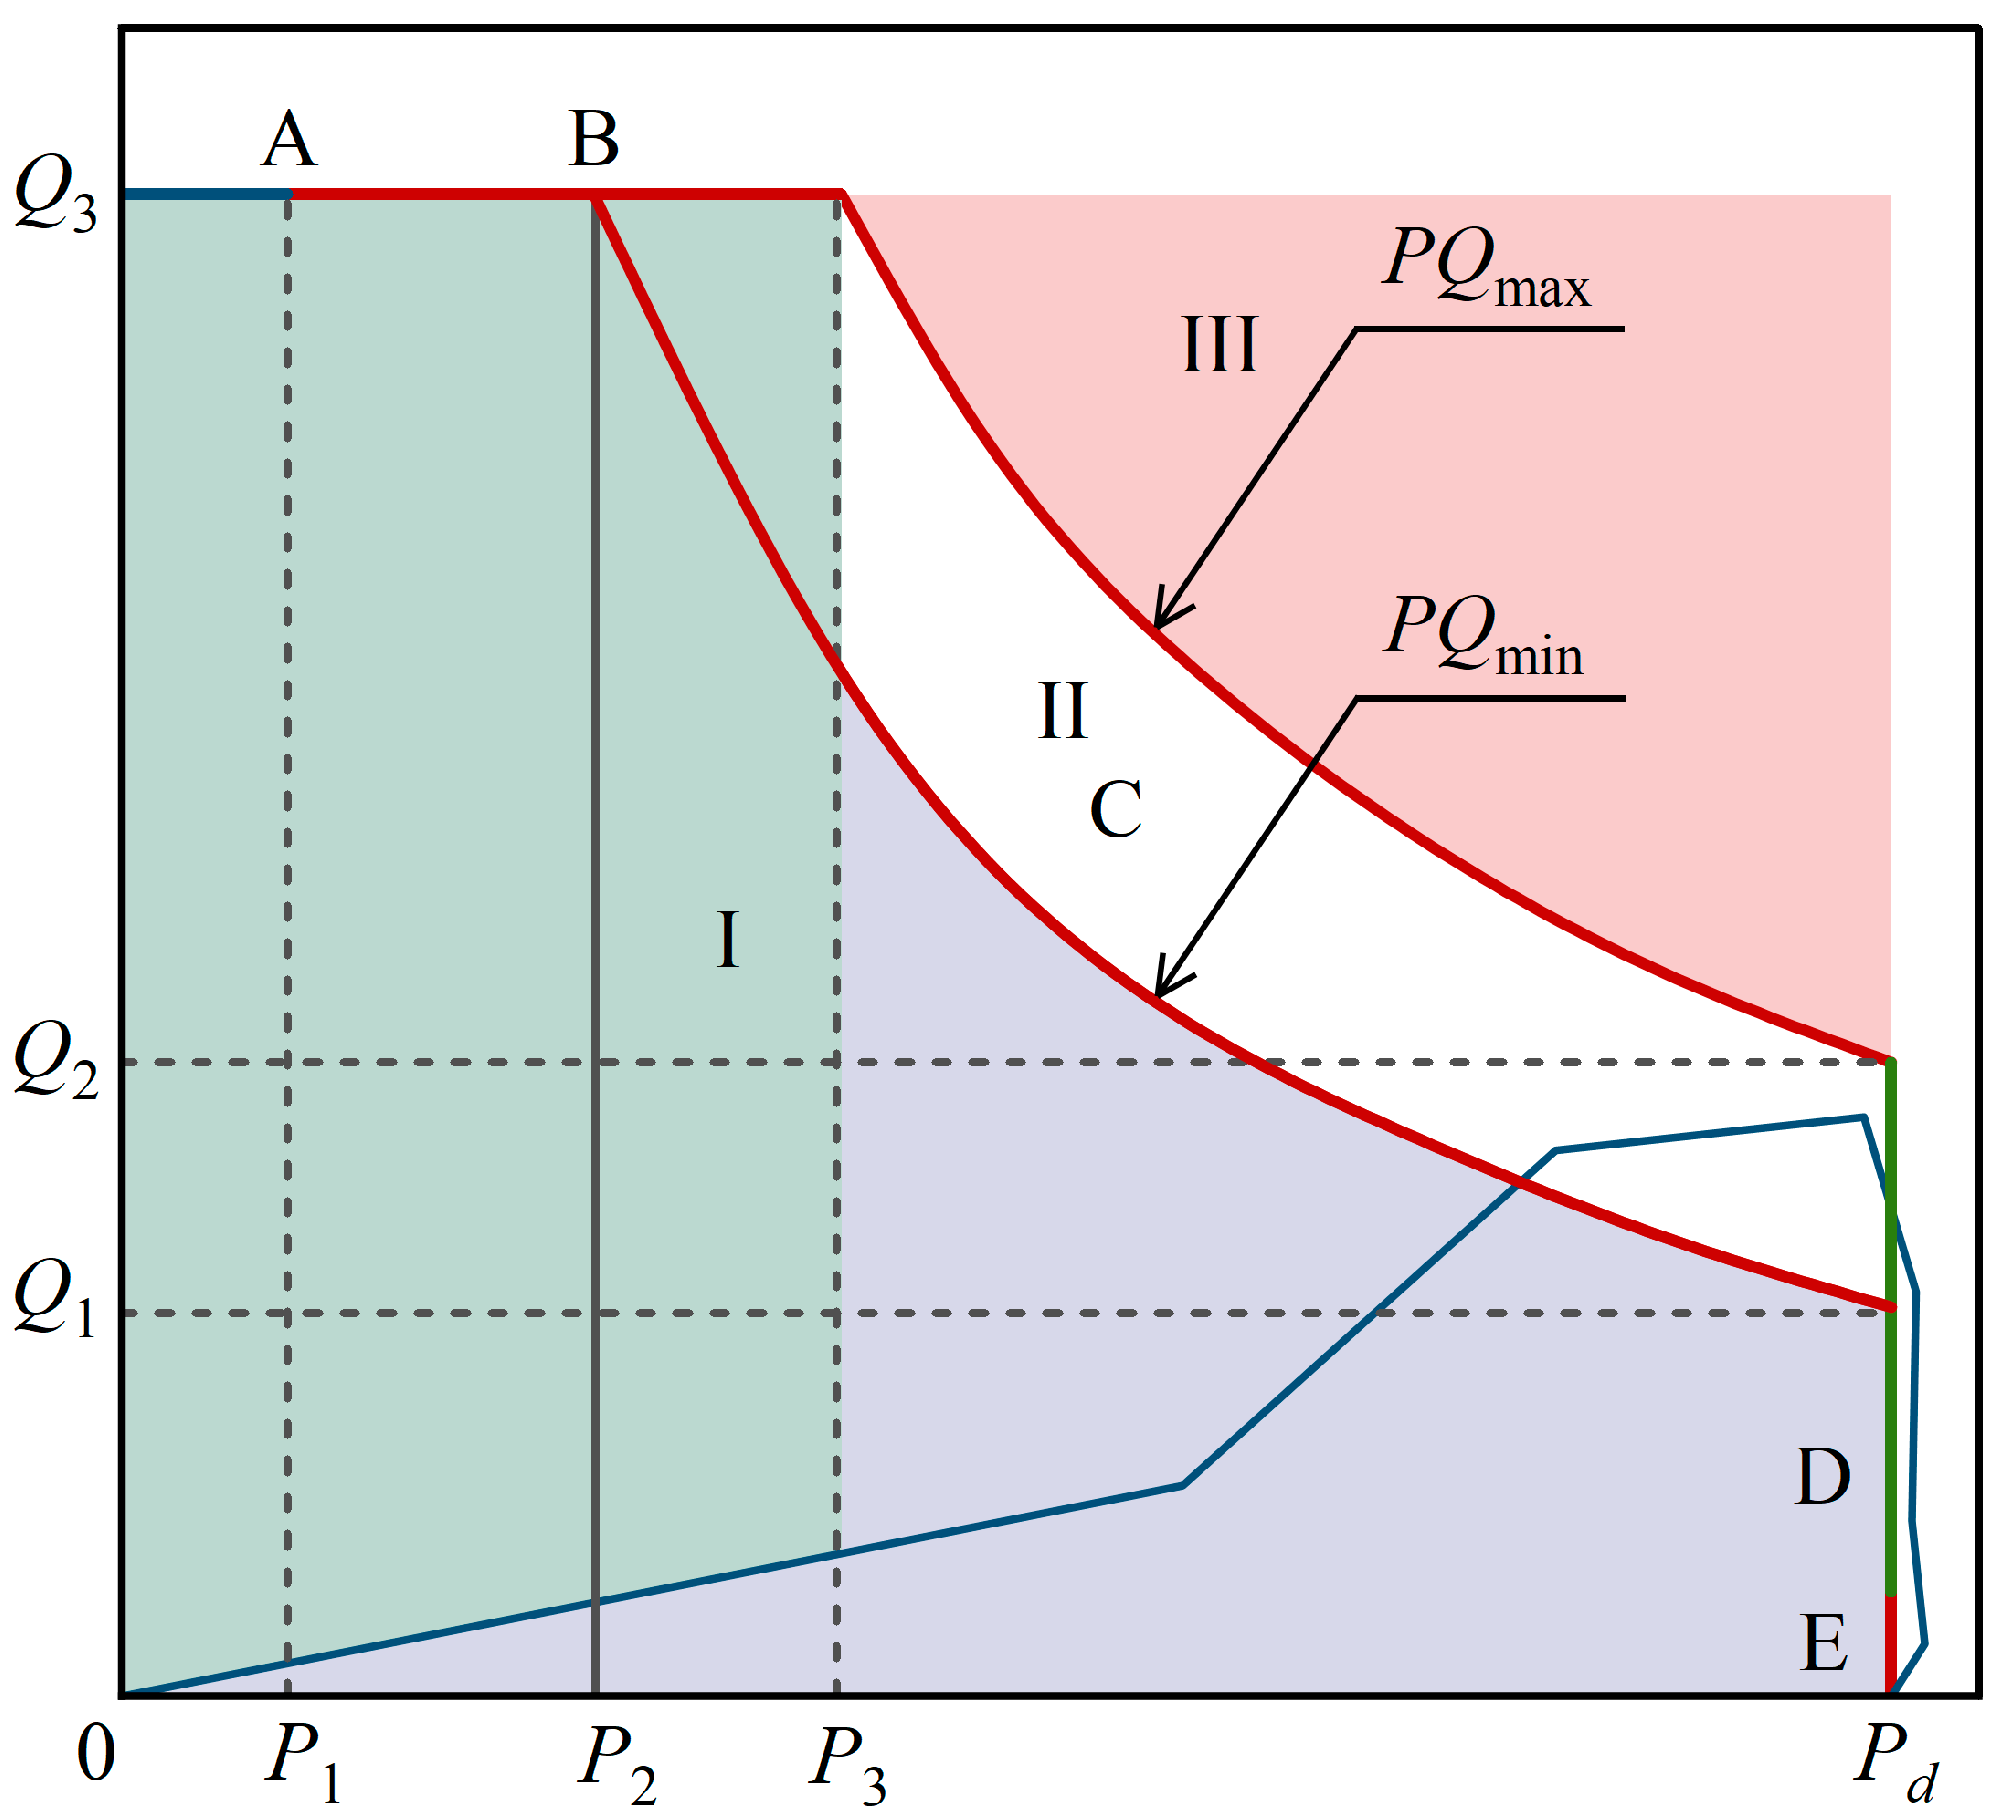
Figure 1. Grouting process curve (The horizontal axis represents pressure (P), and the vertical axis represents the flow rate (Q)).
Applsci 15 12382 g001
Figure 2. Overall architecture of the intelligent grouting control system.
Applsci 15 12382 g002
Figure 3. Overall Framework of the Grouting Power Prediction Methodology.
Applsci 15 12382 g003
Figure 4. Structure of the BiLSTM model.
Applsci 15 12382 g004
Figure 5. Flowchart of the CNN-BiLSTM prediction process.
Applsci 15 12382 g005
Figure 6. IMF Sequences of Grouting Power under Normal Grouting Conditions.
Applsci 15 12382 g006
Figure 7. Prediction results of grouting power under normal grouting conditions: (a) training set ratio of 70%; (b) training set ratio of 80%.
Applsci 15 12382 g007aApplsci 15 12382 g007b
Figure 8. IMFs sequences derived from grouting power data under heaving conditions.
Applsci 15 12382 g008
Figure 9. Prediction results of grouting power under heaving conditions: (a) training set ratio of 70%; (b) training set ratio of 80%.
Applsci 15 12382 g009aApplsci 15 12382 g009b
Table 1. Specifications and context of key parameters acquired by the grouting control system.
ParameterRangeResolutionContext
Average Pressure0–10 MPa±0.1% FSMeasured by a pressure transducer at the grouting line. The key variable for power calculation and control.
Injection Rate0–100 L/min±0.5% of readingMeasured by an electromagnetic flowmeter. Determines the grout delivery speed.
Slurry Density1.0–2.0 g/cm3±0.01 g/cm3Measured in-line by a nuclear density meter. Used to calculate and control the water-cement ratio in real-time.
Grouting Power/CalculatedThe primary control parameter. Represents the real-time energy input.
Cumulative Heaving0–50 mm±0.1 mmMeasured by a high-precision displacement sensor to monitor formation lift-off, a critical safety indicator.
Return Flow Rate0–30 L/min±0.5% of readingMeasured to assess grout loss and detect anomalies like heaving or fracturing.
Table 2. Comparison of prediction error metrics for grouting power under normal conditions.
Training Set RatioModelRMSEMAER2Confidence Interval
(95%)
70%CEEMDAN-CNN-BiLSTM0.00370.00350.9893[0.0035, 0.0040]
CNN-BiLSTM0.03790.03590.9619[0.0364, 0.0395]
CNN-LSTM0.06050.05450.8754[0.0578, 0.0632]
LSTM0.17440.15040.7264[0.1650, 0.1838]
80%CEEMDAN-CNN-BiLSTM0.00280.00230.9889[0.0025, 0.0031]
CNN-BiLSTM0.01440.01140.9658[0.0132, 0.0157]
CNN-LSTM0.01880.01590.8915[0.0173, 0.0204]
LSTM0.06510.06350.5123[0.0629, 0.0672]
Table 3. Comparison of prediction error metrics for grouting power under heaving conditions.
Training Set RatioModelRMSEMAER2Confidence Interval
(95%)
70%CEEMDAN-CNN-BiLSTM0.00060.00050.9989[0.0006, 0.0007]
CNN-BiLSTM0.00470.00440.9619[0.0045, 0.0050]
CNN-LSTM0.00850.00780.8754[0.0081, 0.0091]
LSTM0.01270.01130.7264[0.0120, 0.0136]
80%CEEMDAN-CNN-BiLSTM0.00060.00050.9986[0.0005, 0.0007]
CNN-BiLSTM0.00390.00360.9658[0.0037, 0.0042]
CNN-LSTM0.00650.00580.8915[0.0060, 0.0070]
LSTM0.01180.01100.5123[0.0111, 0.0124]
Disclaimer/Publisher’s Note: The statements, opinions and data contained in all publications are solely those of the individual author(s) and contributor(s) and not of MDPI and/or the editor(s). MDPI and/or the editor(s) disclaim responsibility for any injury to people or property resulting from any ideas, methods, instructions or products referred to in the content.