Article

Graphene-Mediated Lubrication of Phospholipid Membranes: Insights from Molecular Dynamics Simulations

by
Przemysław Raczyński
1,
Krzysztof Górny
1,
Piotr Bełdowski
2,
Zbigniew Lutowski
3,
Sylwester Kloska
4 and
Zbigniew Dendzik
1,*
1
Faculty of Science and Technology, University of Silesia in Katowice, 75 Pułku Piechoty 1A, 41-500 Chorzów, Poland
2
Faculty of Computer Science, Kazimierz Wielki University, Kopernika 1, 85-074 Bydgoszcz, Poland
3
Faculty of Telecommunications, Computer Science and Electrical Engineering, Bydgoszcz University of Science and Technology, Al. prof. S. Kaliskiego 7, 85-796 Bydgoszcz, Poland
4
Faculty of Medicine, Bydgoszcz University of Science and Technology, Al. prof. S. Kaliskiego 7, 85-796 Bydgoszcz, Poland
*
Author to whom correspondence should be addressed.
Appl. Sci. 2025, 15(23), 12369; https://doi.org/10.3390/app152312369
Submission received: 10 October 2025 / Revised: 14 November 2025 / Accepted: 18 November 2025 / Published: 21 November 2025

Abstract

In this study, we performed molecular dynamics simulations to investigate the lubricating properties of graphene situated between phospholipid membranes. Four membrane models were analyzed: 1,2-dimyristoyl-sn-glycero-3-phosphocholine (DMPC) with 10% or 20% admixture of cholesterol, pure DMPC, and pure 1,2-dimyristoyl-sn-glycero-3-phosphoethanolamine (DMPE). The simulations explored how varying the thickness of the water layer and the sliding speeds of graphene affect its interactions with the membranes. The results show that the presence of water and cholesterol significantly reduces the shear stress required to move graphene. In contrast, van der Waals interactions between graphene and lipids depend on membrane composition. These findings contribute to a better understanding of the potential of graphene as a biolubricant in biomedical applications.

1. Introduction

Graphene is a two-dimensional carbon allotrope with remarkable potential across various industries, including fire detection, energy storage, and biomedical engineering [1,2,3,4,5]. Recent research has demonstrated its ability to enhance fire alarms, create more efficient radiant heating systems, and even aid in tissue regeneration by acting as a scaffold for cartilage repair [6,7,8,9,10]. Beyond these advancements, the mechanical, electrical, and thermal properties of graphene have made it a focus in biophysics and nanotechnology, particularly as a lubricating agent between biological membranes and proteins [11,12]. In this study, we delve into the intricacies of graphene-mediated lubrication between phospholipid membranes using molecular dynamics simulations. Through these computational techniques, our aim is to elucidate how the introduction of graphene alters the lubrication properties between membranes under varying conditions, such as different thicknesses of the water layer, drag velocities and lipid compositions [11]. By applying molecular dynamics simulations, we explore the dynamic behavior of biomolecular systems at atomic resolution, providing insight into phenomena that are difficult to observe experimentally, as illustrated in [13]. The interaction between graphene and phospholipid membranes is multifaceted, governed by a delicate balance of van der Waals forces, electrostatic interactions, and steric obstructions [14]. Understanding this interplay is crucial for fundamental biophysical research and the development of graphene-based technologies for biomedical and industrial applications.
Biolubrication, the process by which biological systems reduce friction and wear, is crucial for various biological processes, including joint lubrication and cell membrane dynamics [11,15]. Furthermore, biomimicry, the emulation of natural biological processes and structures in engineering and design, offers significant opportunities for the development of innovative materials and devices inspired by nature [13,16]. With its unique mechanical strength, flexibility, and biocompatibility, graphene presents a promising platform for biomimetic applications. The fluidity of the phospholipid membrane, particularly in phospholipids of PE (phosphatidylethanolamine) and PC (phosphatidylcholine), plays a critical role in the dynamic properties of cellular membranes [17,18]. PE lipids typically exhibit intrinsic curvature and greater fluidity in comparison to PC lipids as a result of their smaller head groups, leading to looser packing within bilayers. However, cholesterol incorporation into PC bilayers significantly influences membrane fluidity by inducing a phase transition that tightens lipid packing and reduces lateral diffusion of lipid molecules. Cholesterol acts as a modulator, improving the order of the membrane in the fluid phase and creating a more rigid structure, which affects the dynamics and mechanical stability of the membrane [19,20,21]. This modulation of fluidity and phase behavior has profound implications for biological membranes, affecting processes such as membrane fusion, signal transduction, and vesicle formation.
Molecular dynamics simulations and experimental studies have demonstrated that graphene can adsorb onto lipid bilayers, potentially disrupting membrane integrity, altering lipid organization, and modulating membrane properties such as permeability and mechanical strength [14,22,23,24]. The presence of water layers between graphene and membrane surfaces can significantly influence their interactions [25,26]. Molecular dynamics simulations have not yet thoroughly (to our knowledge) investigated the hydration structure at the graphene–membrane interfaces and its impact on frictional behavior, adhesion, and sliding dynamics. However, it seems that the thickness and arrangement of the water layers play crucial roles in mediating the sliding motion of graphene on the membrane surfaces, as has also been observed in other graphene-based systems [27,28]. Understanding the frictional properties of graphene and the lubrication mechanisms between phospholipid membranes is of particular interest. Molecular dynamics simulations allow for the detailed exploration of frictional forces, shear stress, interfacial sliding dynamics, and the role of water in the lubrication of graphene–membrane systems. These studies provide insights into the factors that govern the ease of sliding and the potential applications of graphene as a lubricating agent in biological and nanotechnological contexts. By elucidating the molecular mechanisms underlying graphene–membrane interactions, researchers aim to develop novel biomimetic materials, drug delivery systems, and biosensing platforms with enhanced functionality and biocompatibility [11,14].

2. Materials and Methods

Visualizations (created using VMD 1.9.3 software [29]) of the initial configurations of the simulated systems are shown in Figure 1. In general, systems are composed of two phospholipid bilayers, between which a single graphene sheet, also known as the carbon layer, is located. In Figure 1b–d, water separates the membranes and graphene. The water visible in the uppermost and lowermost parts of the screenshots prevents interactions between membranes above and below the graphene plane, as periodic boundary conditions (PBC) were applied in the simulations. The systems shown in Figure 1 differ in the thickness of the water layer between the graphene and the phospholipid bilayer. The leftmost screenshot shows the system without water in this area, and in the next ones, the thickness of water is equal to 6, 9, and 13 Å (panels b, c, and d, respectively).
As an example, the membrane composed of 1,2-dimyristoyl-sn-glycero-3-phosphocholines (DMPC) and a 20 percent admixture of cholesterol is shown in Figure 1. In the presented studies, three other membrane models were also taken into account:
  • DMPC with a 10 percent admixture of cholesterol;
  • DMPC molecules only;
  • DMPE (1,2-dimyristoyl-sn-glycero-3-phosphoethanolamine) molecules only.
The motivation for using these particular membrane models was that cholesterol is responsible for membrane fluidity and DMPE is more elastic compared to DMPC due to the ethylamine group (as described in the Introduction section).
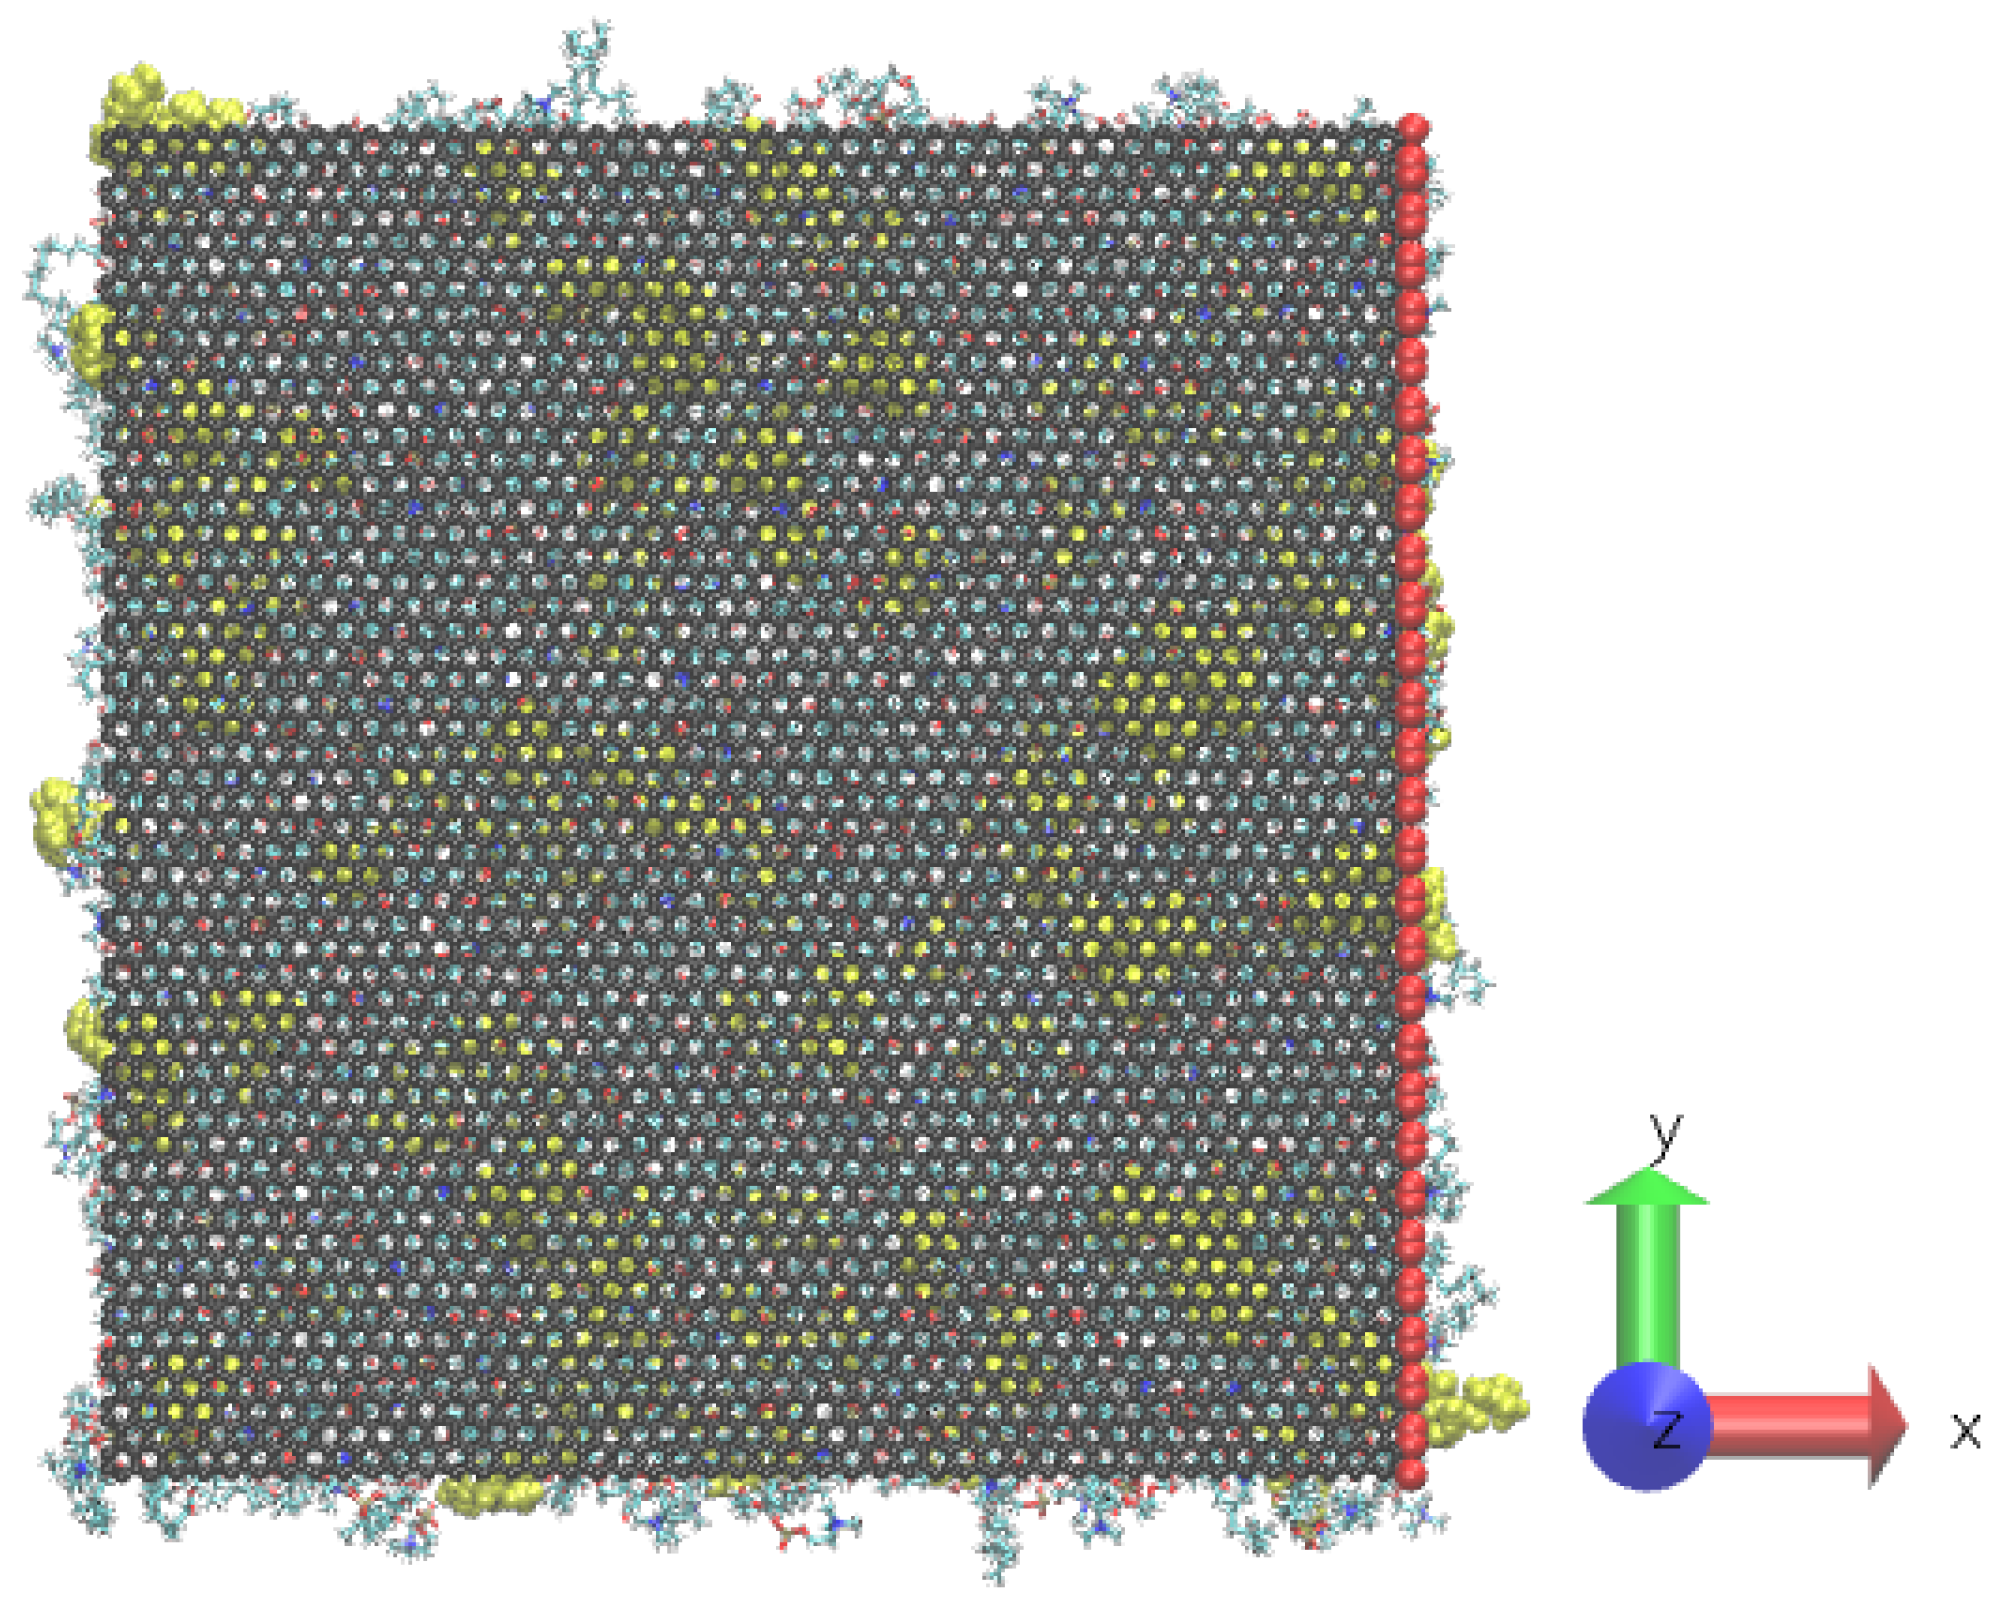
All computer experiments were performed using the NAMD 2.14 simulation software [30] with the standard NAMD integrator (Brünger–Brooks–Karplus algorithm) [31]. During simulations, the graphene sheet was moved in its own plane (specifically, the x–y plane, along the x axis) using constant-velocity steered molecular dynamics (SMD) method [30,32]. “Imaginary” particles were attached via virtual springs to the rightmost column of atoms in the graphene sheet, and the graphene was shifted to the right. It is shown in Figure 2, where the rightmost column of graphene atoms was colored red and the direction of the velocity vector is along the x axis. The spring constant was set to k = 10 kcal mol 1 Å 2 for each atom used as a virtual spring. The edge-tethered SMD pulling setup can lead to non uniform shear in the setup and introduce significant differences in membranes and water layer bending. This will likely result in an artificial increase of force required to pull the graphene. The setup studied corresponds to the worst possible case. Due to the consequent treatment of all studied systems, although the reported values of shear stress might be to some extent inflated, the trends reported in this study remain meaningful. The Particle Mesh Evald grid spacing was set to 1.5 length units of the system, and the cut-off was equal to 12 Å. These PME and cutoff parameters have been extensively tested in our previous simulations of phospholipid bilayers [33,34,35] and were found to be well-validated, internally consistent and sufficiently convergent with respect to the chosen cutoff distances.
During simulation runs, graphene was moving at four speeds: 0.1, 1, 10, and 100 nm/ns.
As mentioned earlier, periodic boundary conditions were applied to all systems examined. During all stages of the simulation, including equilibration, the size of the box was fixed in the x–y plane and aligned so that graphene could be considered infinite. All systems studied had similar sizes in the x–y plane (approximately 120 × 120 Å). The size of the box along the z-axis differed depending on the thickness of the water layer between the graphene, and the membrane and was not fixed during the first part of the equilibration stage performed in the NPT environment. During this part of the simulations, the pressure was set to 1 atm and controlled using a Langevin barostat [36] implemented in NAMD. Next, when the system reached equilibrium (the box size along the z axis no longer changed), the system was equilibrated for 2 × 10⁶ steps in the NVT ensemble (constant number of particles, constant volume, and constant temperature). After the equilibration process, also in the NVT ensemble, the main simulations were performed for 30 × 106 simulation steps for each system examined.
All simulations were performed at physiological temperature, maintained by a Langevin thermostat (damping coefficient γ = 1 ps 1 ). A standard TIP3P water model [37], implemented in NAMD, was used. To ensure sufficient energy conservation, the integration time step was set to 1 fs. The interactions in the membrane were modeled using the all-atom CHARMM36 [38,39] force field. Each process was repeated five times and the results presented in this work represent data averaged over multiple trajectories.

3. Results and Discussion

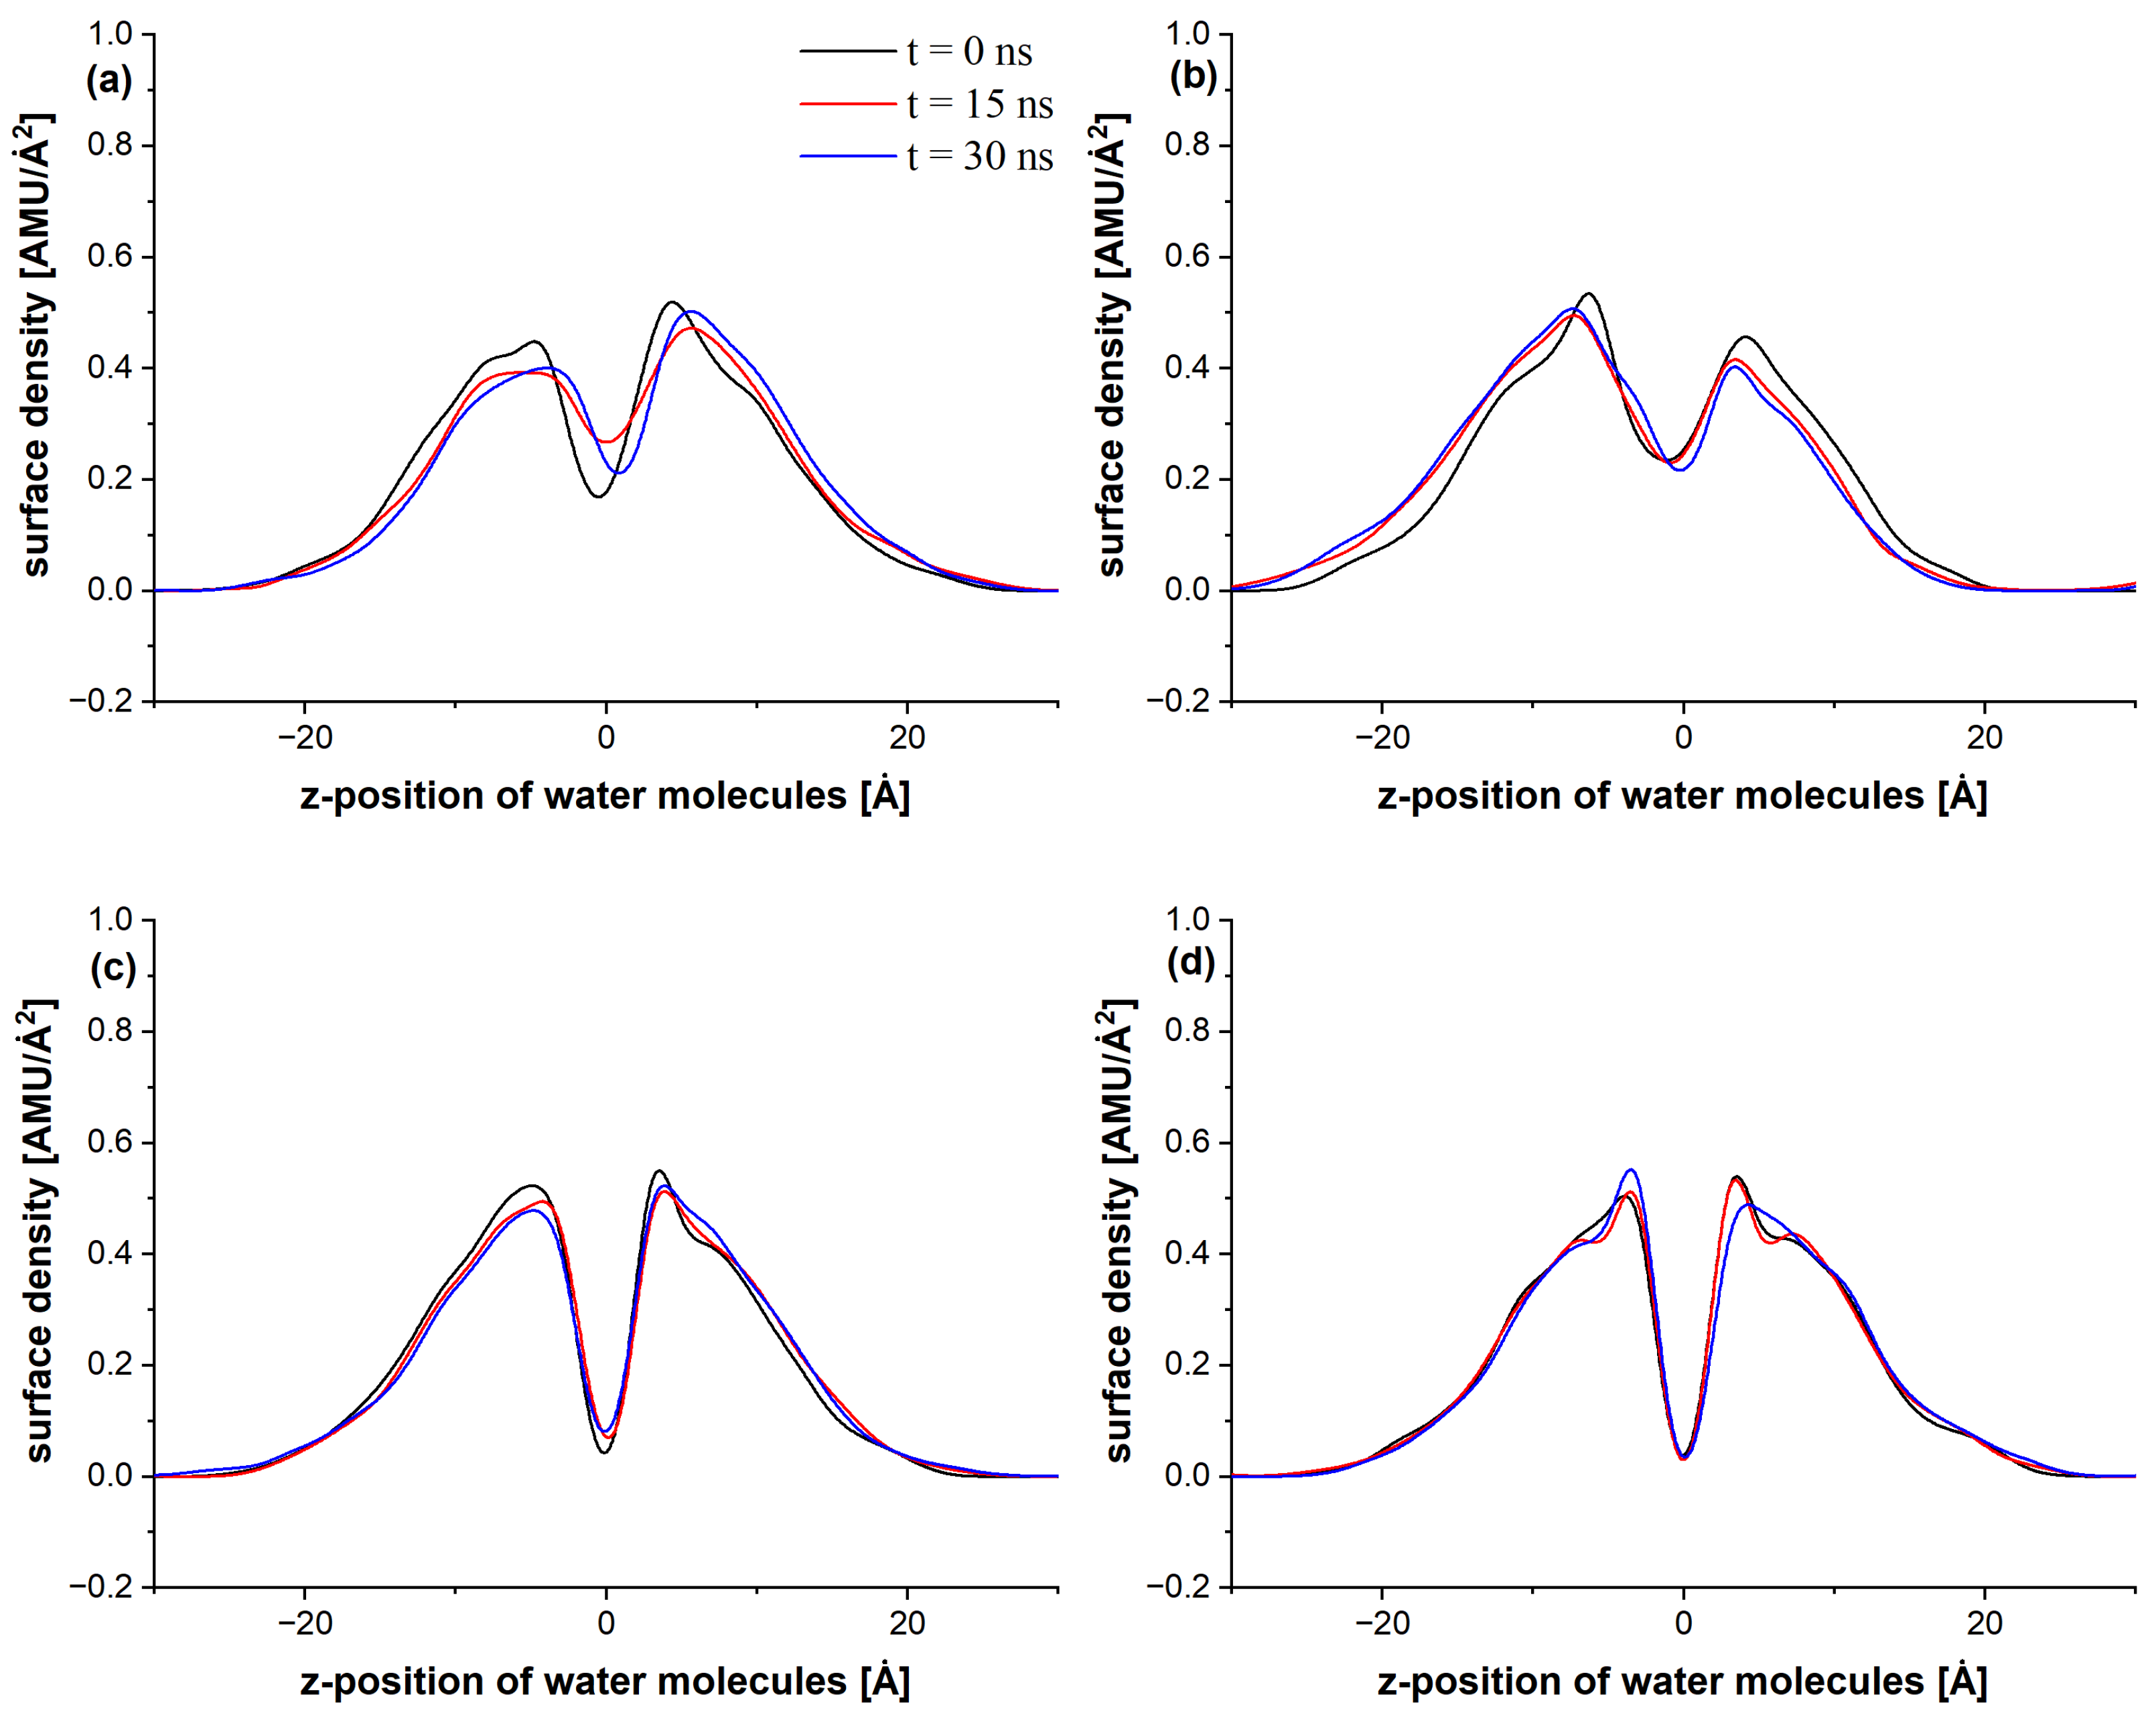
We would like to discuss the linear density profile of the water molecules located between graphene and the bilayer. The stability of the water layer between graphene and bilayer will strongly affect the hydratation/lubrication effects of water in the system. The thickness of the water layer was defined as the average distance between phosphate atoms of the lipids divided by two. To test the stability of the water layer density profiles of instantaneous configurations during the simulations were calculated (for 0, 15 and 30 ns). As an example, the system with a 10 percent admixture of cholesterol and water thickness of 9 Å was chosen for presentation. From the Figure 3 it can be seen, that changes in the water layer are not significant. Smaller changes are observed for higher graphene rates (v = 10 and 100 m/s), where a slippage occurs. The above observation leads to the conclusion, that during simulations the systems are pretty stable. In another case, the changes should be visible in the density profile of small and light water molecules. This conclusion also applies to other simulated systems, due to very similar shape of the profiles only the densities for one system were presented.
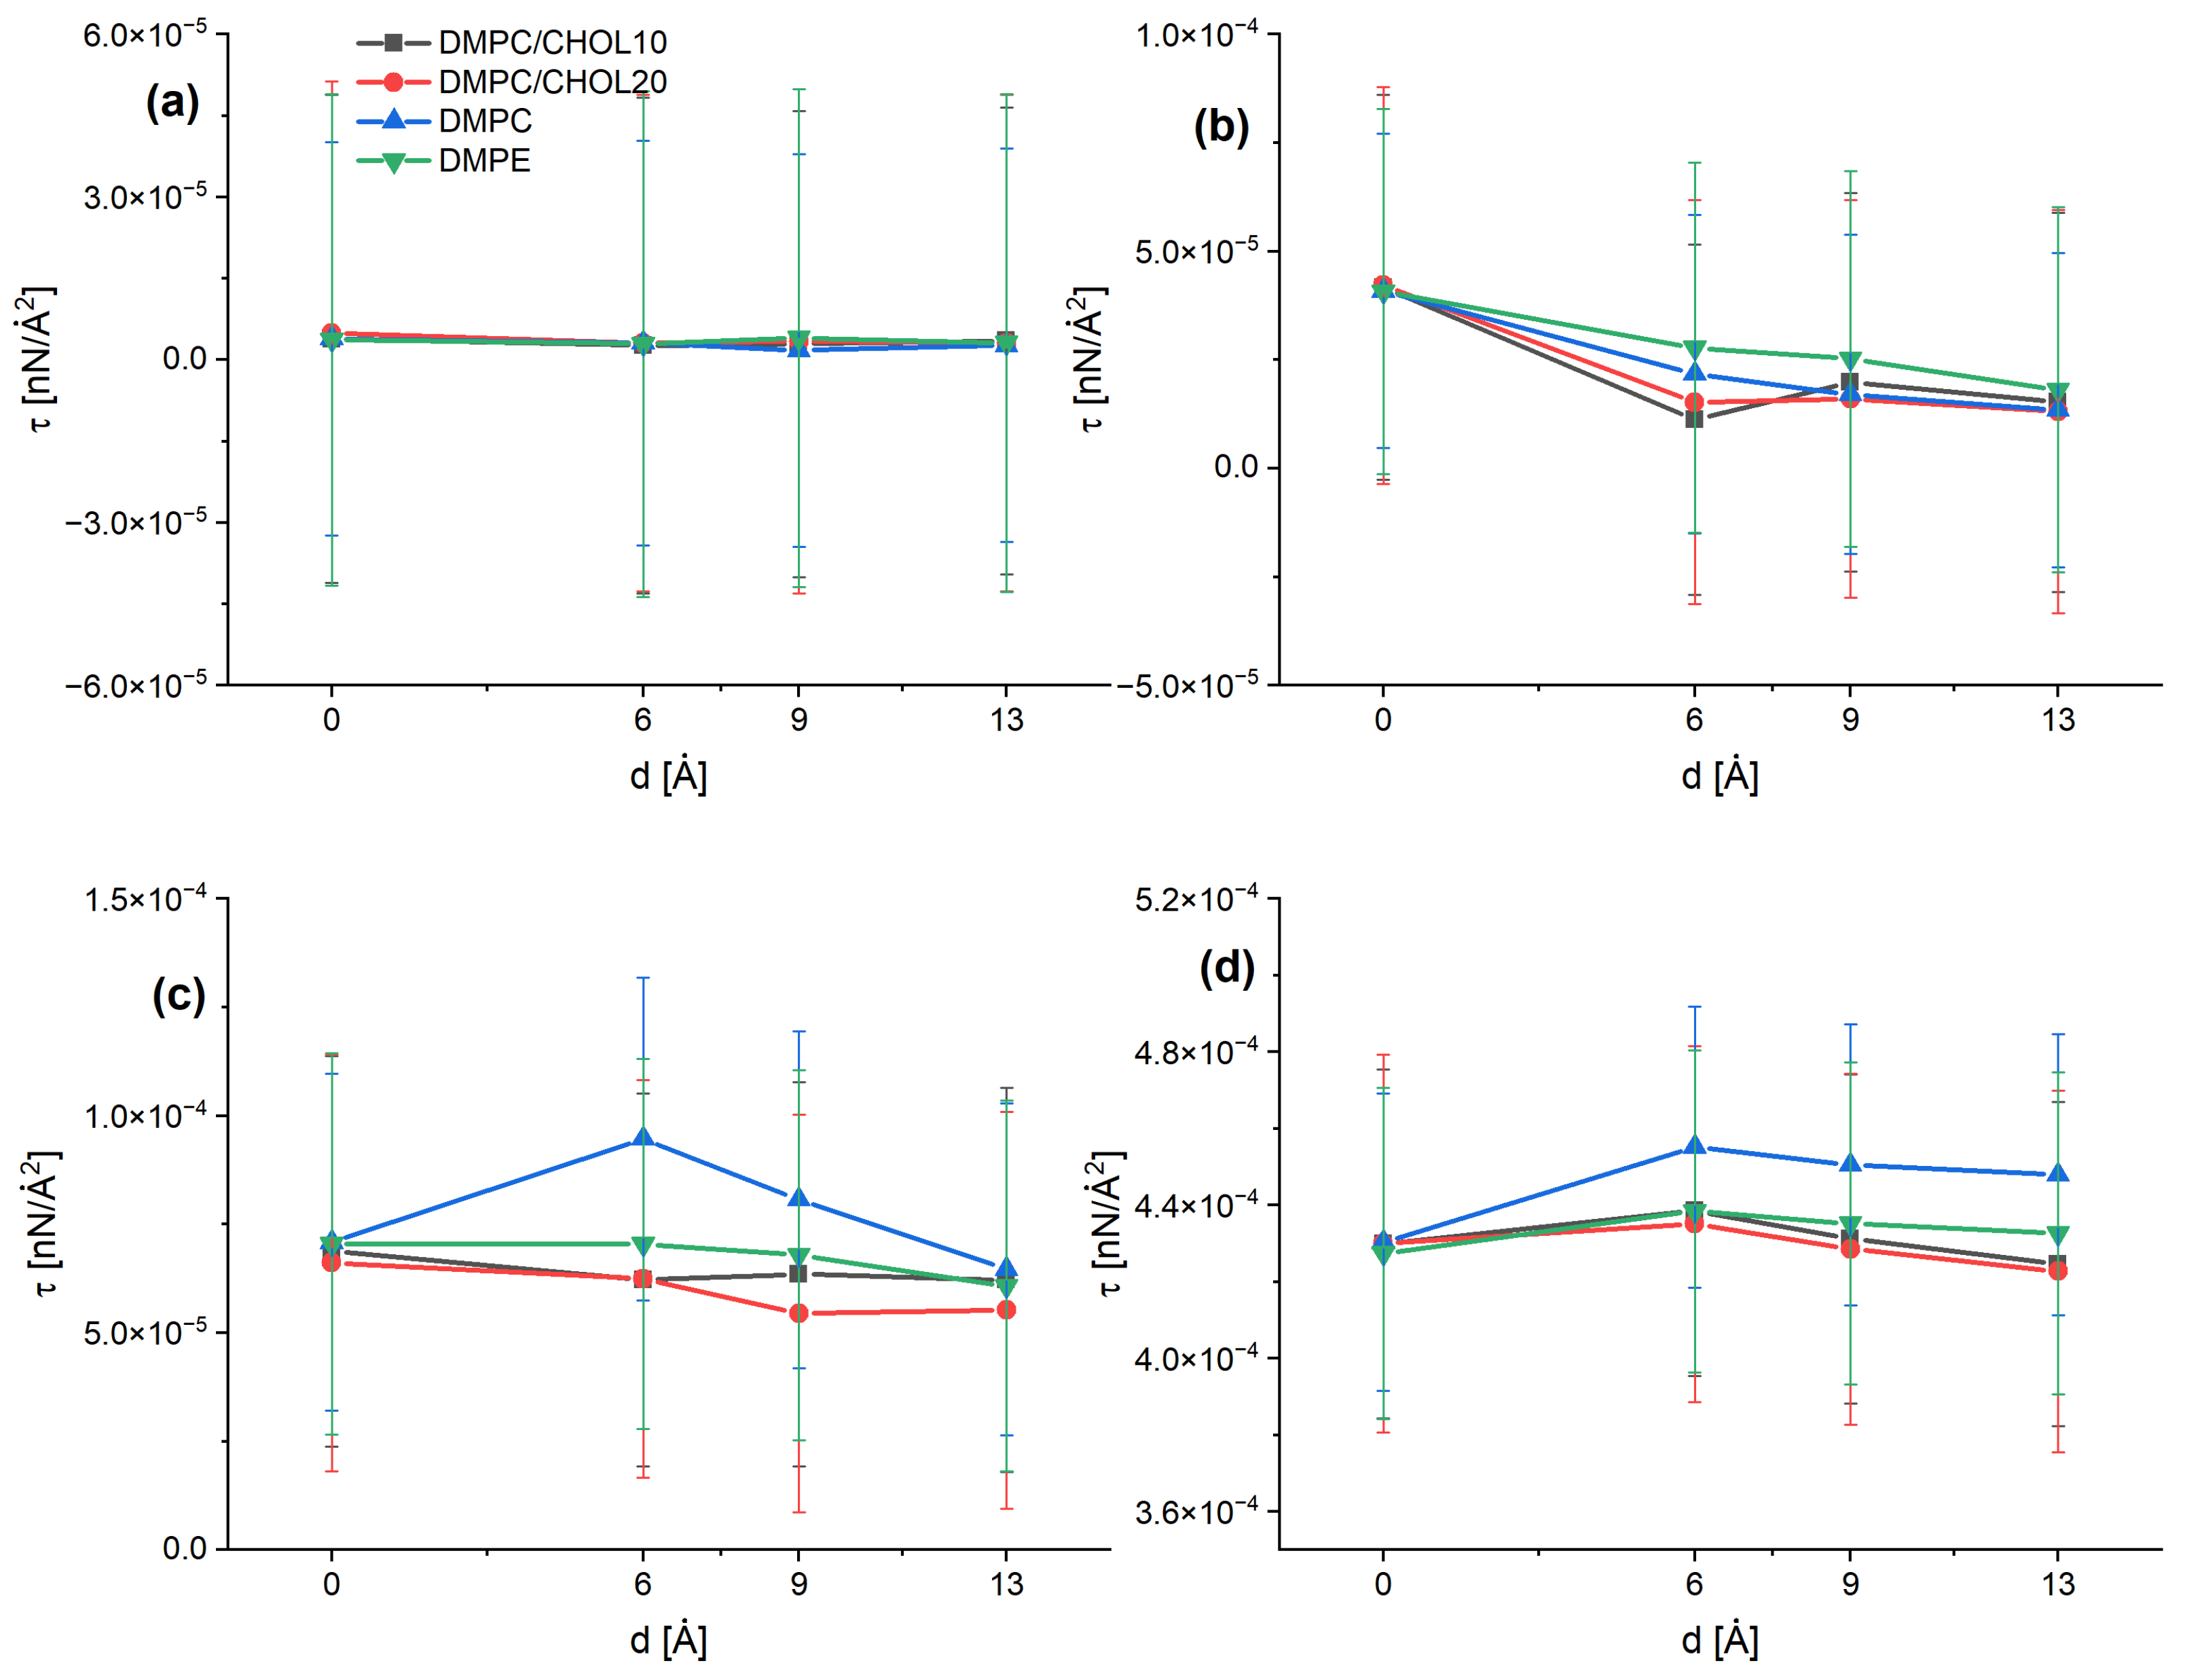
Subsequently, we would like to discuss the results of the examined sliding processes by analyzing the calculated average values of the shear stress, shown in Figure 4. The values on the x-axis correspond to the thickness of the water layer between the graphene and bilayer. Each point represents the average shear stress calculated during the entire simulation run. Moreover, as was mentioned in the previous section, the shear stress is additionally averaged over five independent simulation runs.
The prepared models of membranes differed from each other in the surface area. This is the reason for the use of shear stress quantity defined as:
τ = F A
The estimated values of force F are in the range of a few nanonewtons and the surfaces A of bilayers are of the order of several thousand Å 2 . As one might expect, a higher movement speed of the graphene layer means/requires higher shear stress. The fluidity/stiffness of the membrane also affects the shear stress required. Since cholesterol affects the fluidity of the membrane, the main type of phospholipid is not the only factor that influences the results. For systems without water between the membrane and graphene, the calculated values of the shear stress are similar.
Cholesterol moderates membrane fluidity; the higher the cholesterol concentration, the lower the overall fluidity of the membrane. The hydrophilic hydroxyl group of cholesterol is small relative to the entire molecule, oriented toward the aqueous phase, and is located in the boundary between hydrophilic heads and hydrophobic hydrocarbon chains. As such, they are not in direct contact with water or graphene. As such, cholesterol hydroxyl groups have a minimal direct influence on graphene-lipid or lipid-water interactions, because the polarized hydrophobic heads of the phospholipids shield them. Although it should be noted, that the cholesterols indirectly affect friction between the bilayer and graphene, as the fluidity of the membrane increaseas the shear stress in the system/force required to pull the graphene. Consequently, the interactions between these groups and graphene are relatively weak. This aspect of cholesterol presence on membrane fluidity and friction between the membrane and the graphene is especially crucial in systems without hydratation, when direct contact between membrane and graphene occurs. When comparing shear stress values for DMPC and DMPE bilayers, one can observe that the interactions between DMPC and graphene are stronger. This effect can be explained by the fact that DMPE molecules have a smaller and more compact ethanolamine group compared to the choline group, resulting in larger DMPC head groups.
Similar observations can be made for systems with water; however, in these assemblies, water penetrates the polar parts of the lipids. The value of the shear stress diminishes with increasing thickness of the water layer. This effect is most pronounced for membranes composed of pure DMPC. Generally, increased membrane hydration makes it easier for graphene to move. The hydration effect decreases with increasing membrane stiffness.
When the movement speed of the carbon layer is low (v = 0.1 or 1 m/s), the average shear stress in systems without water is greater than in those with water. When the graphene speed is not high enough, the membrane is more easily set in motion, and its movement follows the graphene plane. In contrast, at higher graphene movement speeds, slippage occurs, which results in a lower required shear stress. For higher pulling speeds, it is easier for graphene to glide along the membrane surface than to pass through a thin water layer. Only an increase in the thickness of the water layer can mitigate this effect.
It should be noted, that the standard deviations are large at certain sliding speeds. The simulations were performed for five independent runs. Our conclusions are based on the consistent direction of these trends across all replicates. The larger error bars reflect variability but do not overturn the observed effects.
Figure 5 shows the average van der Waals interaction energy between the lipids and the graphene plane. The energy practically does not depend on the graphene movement speed, as changes in the velocity rate almost imperceptibly affect the values of the lipid–graphene energy.
Some differences can be observed when systems are compared with and without water. In anhydrous systems, where water is absent between the graphene and the membranes, the van der Waals energy values are similar across different membrane compositions. However, in hydrated systems, the interaction energy between DMPE lipids and graphene is lower than that between DMPC lipids and the carbon layer. The presence of cholesterol in the membrane does not significantly affect the energy values.
In systems where the thickness of the water layer between the graphene and the membrane ranges from 6 to 9 Å, the van der Waals interaction energy between DMPE molecules and the carbon layer is noticeably lower, indicating a more tightly bound system.
The van der Waals energy between water and graphene is also independent of the pulling rate of the carbon layer (see Figure 6). However, its values are lower than those between the lipids and the graphene layers. In contrast to Figure 5, a thicker water layer corresponds to a lower interaction energy due to the increased number of possible interaction sites. In addition, for systems with DMPE lipids, the energy is generally higher than for others, suggesting that water–graphene interactions are less pronounced in systems with DMPE membranes.
To further study the interactions between water and graphene, the average radial distribution function (RDF) g(r) of water oxygen atoms with respect to graphene carbon atoms is shown in Figure 7. The relation between the thickness of the water layer and the values of g(r) is noticeable. More water between the carbon layer and the membranes results in lower RDF values. The shape and height of the first peak of the RDF function, which corresponds to the density of the first water coordination sphere around the graphene, are more interesting. In the case of systems with pure DMPE membranes, the first peak is visibly lower than the second peak or the following plateau. This suggests that while the surface density of water is similar for all membranes studied with a given water thickness, the hydration of the graphene surface is lowest in the case of DMPE systems. The relatively smaller and more hydrophilic heads of DMPE molecules appear to influence the overall water organization between the graphene and phospholipid membranes.
Water quite easily penetrates the area of phospholipid heads in the membrane. The functions presented in Figure 8 represent the RDF function calculated between lipid phosphorus atoms and oxygen atoms from water. The first peak values of the RDF are about three times higher than in the case of graphene-water RDF. By analyzing the second coordination area, it can be observed that the height of the second peak is comparable to the height of the first peak for the graphene layer. While in all cases the first peak is relatively sharp, the second peak is not as well-defined, especially for DMPE membranes, and the transition between peaks is smoother than in the case of DMPC membranes. This suggests that, as previously reported, the hydrophilic heads of DMPE molecules are more in contact with the water environment and bind a greater amount of water than their DMPC counterparts, effectively reducing the hydration of the graphene surface. To further study the effects of membrane composition on the ordering of water between graphene and bilayer, the RDF functions between oxygen atoms of water were also calculated and are presented in Figure 9.
The shape of the RDF functions shown in Figure 9 is similar and there are practically no significant differences for different membrane types. This suggests that the differences for different membranes occur only in the water–membrane and water–graphene interface.
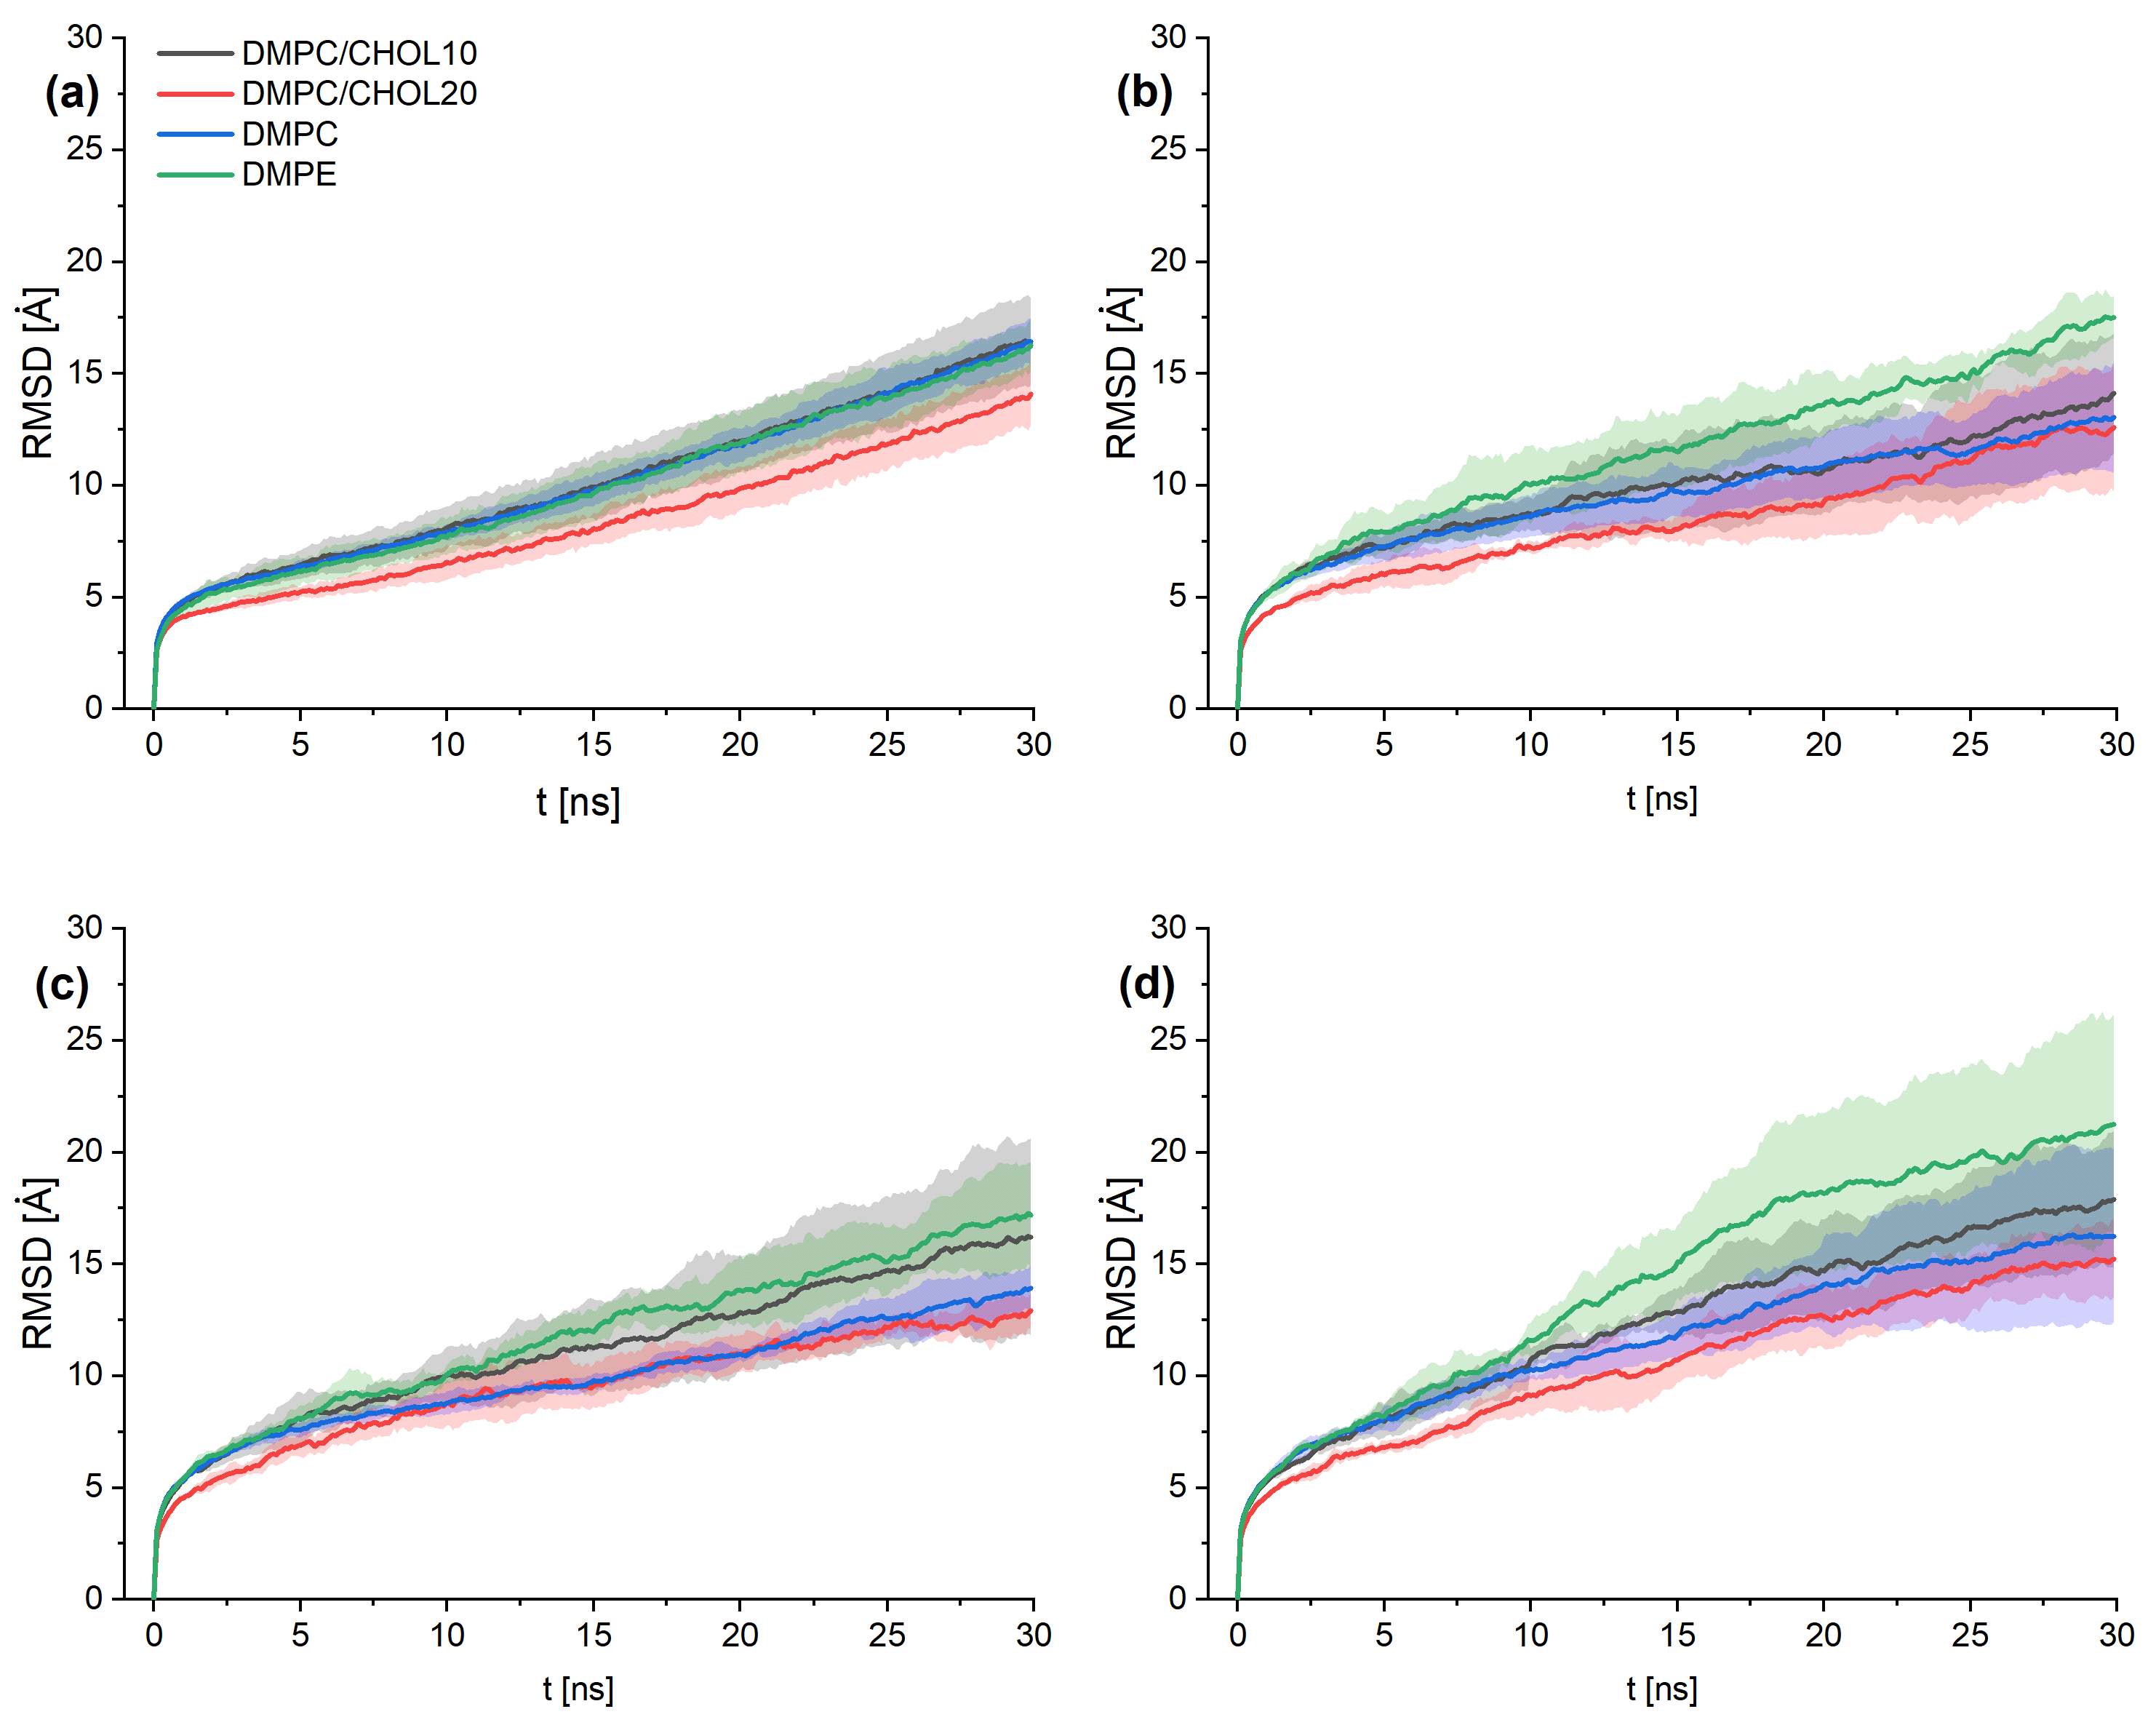
In Figure 10, the average root mean square displacement (RMSD) of the lipids in the membranes is shown for the smallest graphene pulling rate studied. The movement of the bilayers appears to be independent of the water layer thickness between them and the graphene, as the the RMSD plots are similar. Also, the behavior of the systems without water in this area does not differ from those with water. The DMPE layers experience the largest displacement, and the lipid shift is smallest in systems with the highest admixture of cholesterol molecules.
To better understand the sliding process, we prepared a comparison between the distance traveled by the DMPC membrane along the pulling direction for the system with a water layer thickness of 6 Å. The values shown in Table 1 were obtained in the following way: the average position of the C atoms of the graphene layer and the average position of the C2 atoms of the DMPC glycerol backbone along the x-axis were calculated in the initial and final configurations. The data were obtained for pure DMPC membrane and DMPC membrane with 20% cholesterol admixture. Because the graphene was moved using the steered molecular dynamics method, its speed was constant and no standard deviation values are required. In contrast, the carbon layer pulled the membrane layer at different distances in each independent simulation run.
As expected, the movement of the graphene set the membrane in motion, and the distance traveled by the membrane is tightly connected with the speed of the carbon layer. A higher graphene movement rate means higher membrane displacement. However, a higher carbon layer rate also means increased slippage of the bilayer (and water) on its surface, as shown in the last column of Table 1. Membrane movement expressed as a percentage of graphene movement, indicates that the higher graphene movement speed leads to increased slippage. In the case of pure DMPC membranes, for the highest rate studied, the membrane was moved less than 2% of the total graphene displacement, while at the lowest speed it was almost 65%. In the case of DMPC with 20% cholesterol admixture (see Table 2), the distance traveled by the membrane is two times smaller than that of a pure DMPC membrane. Additionally, the decrease in the percentage of membrane movement with respect to the graphene sliding speed is even more pronounced than in the case of the pure, more fluid, DMPC membrane. This conclusion corresponds well with the results previously mentioned for the average required shear stress.

4. Conclusions

In this paper, we analyze how the phospholipid composition and hydration affect the lubrication of the bilayer-graphene system at the nanoscale. The results show that all of the factors impact the lubrication of the system under study. The fluidity of the membrane is directly related to the composition and was identified as the most important factor. The heterogeneous membranes composed of PC lipids and cholesterol showed the lowest fluidity and, hence, the lowest energy dispersion. In addition, the thickness of the water significantly influenced the overall process. The influence of membrane hydration on the graphene sliding is directly related to its stiffness. The reduction of friction between membrane and graphene layer introduced by water is negatively affected by the stiffness of the membrane. Our simulations reveal a marked decrease in frictional forces at the graphene–lipid interface, which aligns with previous experimental observations of graphene-family additives reducing wear and friction in liquid-based lubricants. The observed behavior may be attributed to the ability of graphene to act as a physical barrier and energy dissipator, consistent with mechanisms proposed in tribological studies of functionalized graphene systems. The results obtained may be useful in the development of new classes of biomimetic materials based on nanostructures, especially new coatings for implants. The insights gained from our molecular dynamics simulations not only deepen the understanding of nanoscale lubrication phenomena but also suggest potential applications in biomedical engineering, such as the design of artificial membranes or biosensors. These implications resonate with broader trends in graphene-based tribology, where the material’s versatility continues to inspire innovations in both mechanical and biological domains.

Author Contributions

Conceptualization, P.R. and K.G.; methodology, P.R., K.G., Z.D., P.B., Z.L. and S.K.; software, K.G. and Z.D.; validation, P.B., Z.L. and S.K.; investigation, P.R., K.G., P.B., Z.L. and Z.D.; resources, P.R. and Z.L.; data curation, P.R. and S.K.; writing—original draft preparation, Z.D., P.R. and P.B.; visualization, P.R.; supervision, Z.D. All authors have read and agreed to the published version of the manuscript.

Funding

This research received no external funding.

Institutional Review Board Statement

Not applicable.

Informed Consent Statement

Not applicable.

Data Availability Statement

The raw data supporting the conclusions of this article will be made available by the authors on request.

Acknowledgments

The calculations were partially performed at Supercomputers Tryton and Tryton Plus in the Centre of Informatics Tricity Academic Supercomputer and Network.

Conflicts of Interest

The authors declare no conflicts of interest.

References

  1. Li, D.; Kaner, R.B. Graphene-based materials. Science 2008, 320, 1170–1171. [Google Scholar] [CrossRef] [PubMed]
  2. Choi, J.R.; Kim, J.; Sim, S.; Jang, H.; Jang, W.S. Graphene oxide–based nanocomposite as an effective, multifunctional, antibiofilm coating. ACS Nano 2015, 9, 9097–9104. [Google Scholar]
  3. Lee, C.; Wei, X.; Kysar, J.W.; Hone, J. Measurement of the elastic properties and intrinsic strength of monolayer graphene. Science 2008, 321, 385–388. [Google Scholar] [CrossRef]
  4. Hu, Y.; Li, D.; Luo, Y.; Tang, Y.; Li, J. Graphene and graphene oxide: Two ideal choices for the enrichment and ionization of long-chain fatty acids by MALDI-TOF MS. Chem. Commun. 2015, 51, 3176–3179. [Google Scholar]
  5. Ali Olad, H.B.K.H. Graphene oxide and amin-modified graphene oxide incorporated chitosan-gelatin scaffolds as promising materials for tissue engineering. Compos. Part B Eng. 2019, 6, 692–702. [Google Scholar] [CrossRef]
  6. Chathuranga, H.; Wijesinghe, I.; Marriam, I.; Yan, C. Recent advances in graphene allotropes-based fire detection sensors. Crit. Rev. Solid State Mater. Sci. 2024, 50, 54–76. [Google Scholar] [CrossRef]
  7. Chang, H.; Ho, T.; Su, Y. Graphene-Enhanced Battery Components in Rechargeable Lithium-Ion and Lithium Metal Batteries. C—J. Carbon Res. 2021, 7, 65. [Google Scholar] [CrossRef]
  8. Chen, Y.; Liu, M. Hydrogel-integrated graphene superstructures for tissue engineering. Carbon 2024, 215, 118000. [Google Scholar] [CrossRef]
  9. Sun, X.; Liu, Z.; Wang, Y. PEGylated nanographene oxide for delivery of water-insoluble cancer drugs. J. Am. Chem. Soc. 2008, 130, 10876–10877. [Google Scholar] [CrossRef]
  10. Kim, K.S.; Zhao, Y.; Jang, H.; Lee, S.Y.; Kim, J.M.; Kim, K.S.; Ahn, J.H.; Kim, P.; Choi, J.Y.; Hong, B.H. Large-scale pattern growth of graphene films for stretchable transparent electrodes. Nature 2009, 457, 706–710. [Google Scholar] [CrossRef] [PubMed]
  11. Willems, N.; Urtizberea, A.; Verre, A.F.; Iliut, M.; Lelimousin, M.; Hirtz, M.; Vijayaraghavan, A.; Sansom, M.S.P. Biomimetic Phospholipid Membrane Organization on Graphene and Graphene Oxide Surfaces: A Molecular Dynamics Simulation Study. ACS Nano 2017, 11, 7171–7179. [Google Scholar] [CrossRef]
  12. Li, S.; Mulloor, J.J.; Wang, L.; Ji, Y.; Mulloor, C.J.; Micic, M.; Orbulescu, J.; Leblanc, R.M. Strong and Selective Adsorption of Lysozyme on Graphene Oxide. ACS Appl. Mater. Interfaces 2014, 6, 5704–5712. [Google Scholar] [CrossRef]
  13. Lipowsky, R. The conformation of membranes. Nature 1992, 349, 475–481. [Google Scholar] [CrossRef]
  14. Chen, Y.; Pandit, S.; Rahimi, S.; Mijakovic, I. Interactions Between Graphene-Based Materials and Biological Surfaces: A Review of Underlying Molecular Mechanisms. Adv. Mater. Interfaces 2021, 8, 2101132. [Google Scholar] [CrossRef]
  15. Nosonovsky, M.; Bhushan, B. Multiscale friction mechanisms and hierarchical surfaces in nano- and bio-tribology. Mater. Sci. Eng. R Rep. 2007, 58, 162–193. [Google Scholar] [CrossRef]
  16. Vincent, J.F.; Bogatyreva, O.A. Biomimetics: Its practice and theory. J. R. Soc. Interface 2007, 4, 637–656. [Google Scholar] [CrossRef] [PubMed]
  17. Veatch, S.L.; Soubias, O.; Keller, S.L.; Gawrisch, K. Critical fluctuations in domain-forming lipid mixtures. Proc. Natl. Acad. Sci. USA 2007, 104, 17650–17655. [Google Scholar] [CrossRef]
  18. Kučerka, N.; Tristram-Nagle, S.; Nagle, J.F. Structure of fully hydrated fluid phase DMPC and DLPC lipid bilayers using X-ray scattering from oriented multilamellar arrays and from unilamellar vesicles. Biophys. J. 2005, 88, 2626–2637. [Google Scholar] [CrossRef] [PubMed]
  19. Kučerka, N.; Tristram-Nagle, S.; Nagle, J.F. Cholesterol in bilayers: A combined X-ray and neutron scattering study. Biochim. Biophys. Acta-(BBA)-Biomembr. 2005, 1716, 77–88. [Google Scholar]
  20. Epand, R.M. Cholesterol and the interaction of proteins with membrane domains. Prog. Lipid Res. 2006, 45, 279–294. [Google Scholar] [CrossRef] [PubMed]
  21. Pan, J.; Tristram-Nagle, S.; Nagle, J.F. Cholesterol perturbs lipid bilayers nonuniversally. Phys. Rev. E 2008, 77, 011901. [Google Scholar] [CrossRef]
  22. Li, Z.; Wang, Y.; Du, X.; Zhang, J.; Wang, Y.; Fan, J. Interaction of Graphene and Its Oxide with Lipid Membranes: A Molecular Dynamics Simulation Study. J. Phys. Chem. C 2016, 120, 9566–9573. [Google Scholar] [CrossRef]
  23. Yue, T.; Wang, X.; Zhang, X.; Huang, F. Molecular modeling of interaction between lipid monolayer and graphene nanosheets: Implications for pulmonary nanotoxicity and pulmonary drug delivery. RSC Adv. 2015, 5, 30092–30106. [Google Scholar] [CrossRef]
  24. Chen, X.; Wang, Y.; Du, X.; Zhang, J.; Wang, Y.; Fan, J. Interaction of graphene oxide with artificial cell membranes: Role of anionic phospholipid and cholesterol in nanoparticle attachment and membrane disruption. Chemosphere 2021, 285, 131438. [Google Scholar] [CrossRef]
  25. Bonakala, S.; Lalitha, A.; Shin, J.E.; Moghadam, F.; Semino, R.; Park, H.B.; Maurin, G. Interaction of Graphene Nanoparticles and Lipid Membranes Displaying Different Liquid Orderings: A Molecular Dynamics Study. Langmuir 2019, 35, 16661–16668. [Google Scholar] [CrossRef]
  26. Li, Z.; Zhu, X.; Li, J.; Zhong, J.; Zhang, J.; Fan, J. Molecular insights into the resistance of phospholipid heads to the membrane penetration of graphene nanosheets. Nanoscale 2022, 14, 5384–5391. [Google Scholar] [CrossRef]
  27. Lee, H.; Ko, J.H.; Choi, J.S.; Hwang, J.H.; Kim, Y.H.; Salmeron, M.; Park, J.Y. Enhancement of Friction by Water Intercalated between Graphene and Mica. J. Phys. Chem. Lett. 2017, 8, 3482–3487. [Google Scholar] [CrossRef] [PubMed]
  28. Lee, H.; Jeong, H.; Suh, J.; Doh, W.H.; Baik, J.; Shin, H.J.; Ko, J.H.; Wu, J.; Kim, Y.H.; Park, J.Y. Nanoscale Friction on Confined Water Layers Intercalated between MoS2 Flakes and Silica. J. Phys. Chem. C 2019, 123, 8827–8835. [Google Scholar] [CrossRef]
  29. Humphrey, W.; Dalke, A.; Schulten, K. VDM: Visual molecular dynamics. J. Mol. Graph. 1996, 14, 27–28. [Google Scholar] [CrossRef] [PubMed]
  30. Phillips, J.C.; Braun, R.; Wang, W.; Gumbart, J.; Tajkhorshid, E.; Villa, E.; Chipot, C.; Skeel, R.D.; Kale, L.; Schulten, K. Scalable molecular dynamics with NAMD. J. Comput. Chem. 2005, 26, 1781–1802. [Google Scholar] [CrossRef]
  31. Brünger, A.; Brooks, C.L., III; Karplus, M. Stochastic boundary conditions for molecular dynamics simulations of ST2 water. Chem. Phys. Lett. 1984, 105, 495–500. [Google Scholar] [CrossRef]
  32. Kale, L.; Skeel, R.; Bhandarkar, M.; Brunner, R.; Gursoy, A.; Krawetz, N.; Phillips, J.; Shinozaki, A.; Varadarajan, K.; Schulten, K. NAMD2: Greater Scalability for Parallel Molecular Dynamics. J. Comput. Phys. 1999, 151, 283–312. [Google Scholar] [CrossRef]
  33. Raczyński, P.; Górny, K.; Pabiszczak, M.; Gburski, Z. Nanoindentation of biomembrane by carbon nanotubes–MD simulation. Comput. Mater. Sci. 2013, 70, 13–18. [Google Scholar] [CrossRef]
  34. Raczynski, P.; Gorny, K.; Raczynska, V.; Pabiszczak, M.; Dendzik, Z.; Gburski, Z. On the impact of nanotube diameter on biomembrane indentation-Computer simulations study. Biochim. Biophys.-Acta-Biomembr. 2018, 1860, 310–318. [Google Scholar] [CrossRef]
  35. Raczynski, P.; Raczynska, V.; Gorny, K.; Gburski, Z. Properties of ultrathin cholesterol and phospholipid layers surrounding silicon-carbide nanotube: MD simulations. Arch. Biochem. Biophys. 2015, 580, 22–30. [Google Scholar] [CrossRef]
  36. Martyna, G.J.; Tobias, D.J.; Klein, M.L. Constant pressure molecular dynamics algorithms. J. Chem. Phys. 1994, 101, 4177. [Google Scholar] [CrossRef]
  37. Jorgensen, W.L.; Chandrasekhar, J.; Madura, J.D.; Impey, R.W.; Klein, M.L. Comparison of simple potential functions for simulating liquid water. J. Chem. Phys. 1983, 79, 926. [Google Scholar] [CrossRef]
  38. MacKerell, A.D., Jr.; Bashford, D.; Bellott, M.; Dunbrack, R.L.; Evanseck, J.D.; Field, M.J.; Fischer, S.; Gao, J.; Guo, H.; Ha, S.; et al. All-Atom Empirical Potential for Molecular Modeling and Dynamics Studies of Proteins. J. Phys. Chem. B 1998, 102, 3586–3616. [Google Scholar] [CrossRef] [PubMed]
  39. Klauda, J.B.; Venable, R.M.; Freites, J.A.; O’Connor, J.W.; Tobias, D.J.; Mondragon-Ramirez, C.; Vorobyov, I.; MacKerell, A.D.; Pastor, R.W. Update of the CHARMM All-Atom Additive Force Field for Lipids: Validation on Six Lipid Types. J. Phys. Chem. B 2010, 114, 7830–7843. [Google Scholar] [CrossRef] [PubMed]
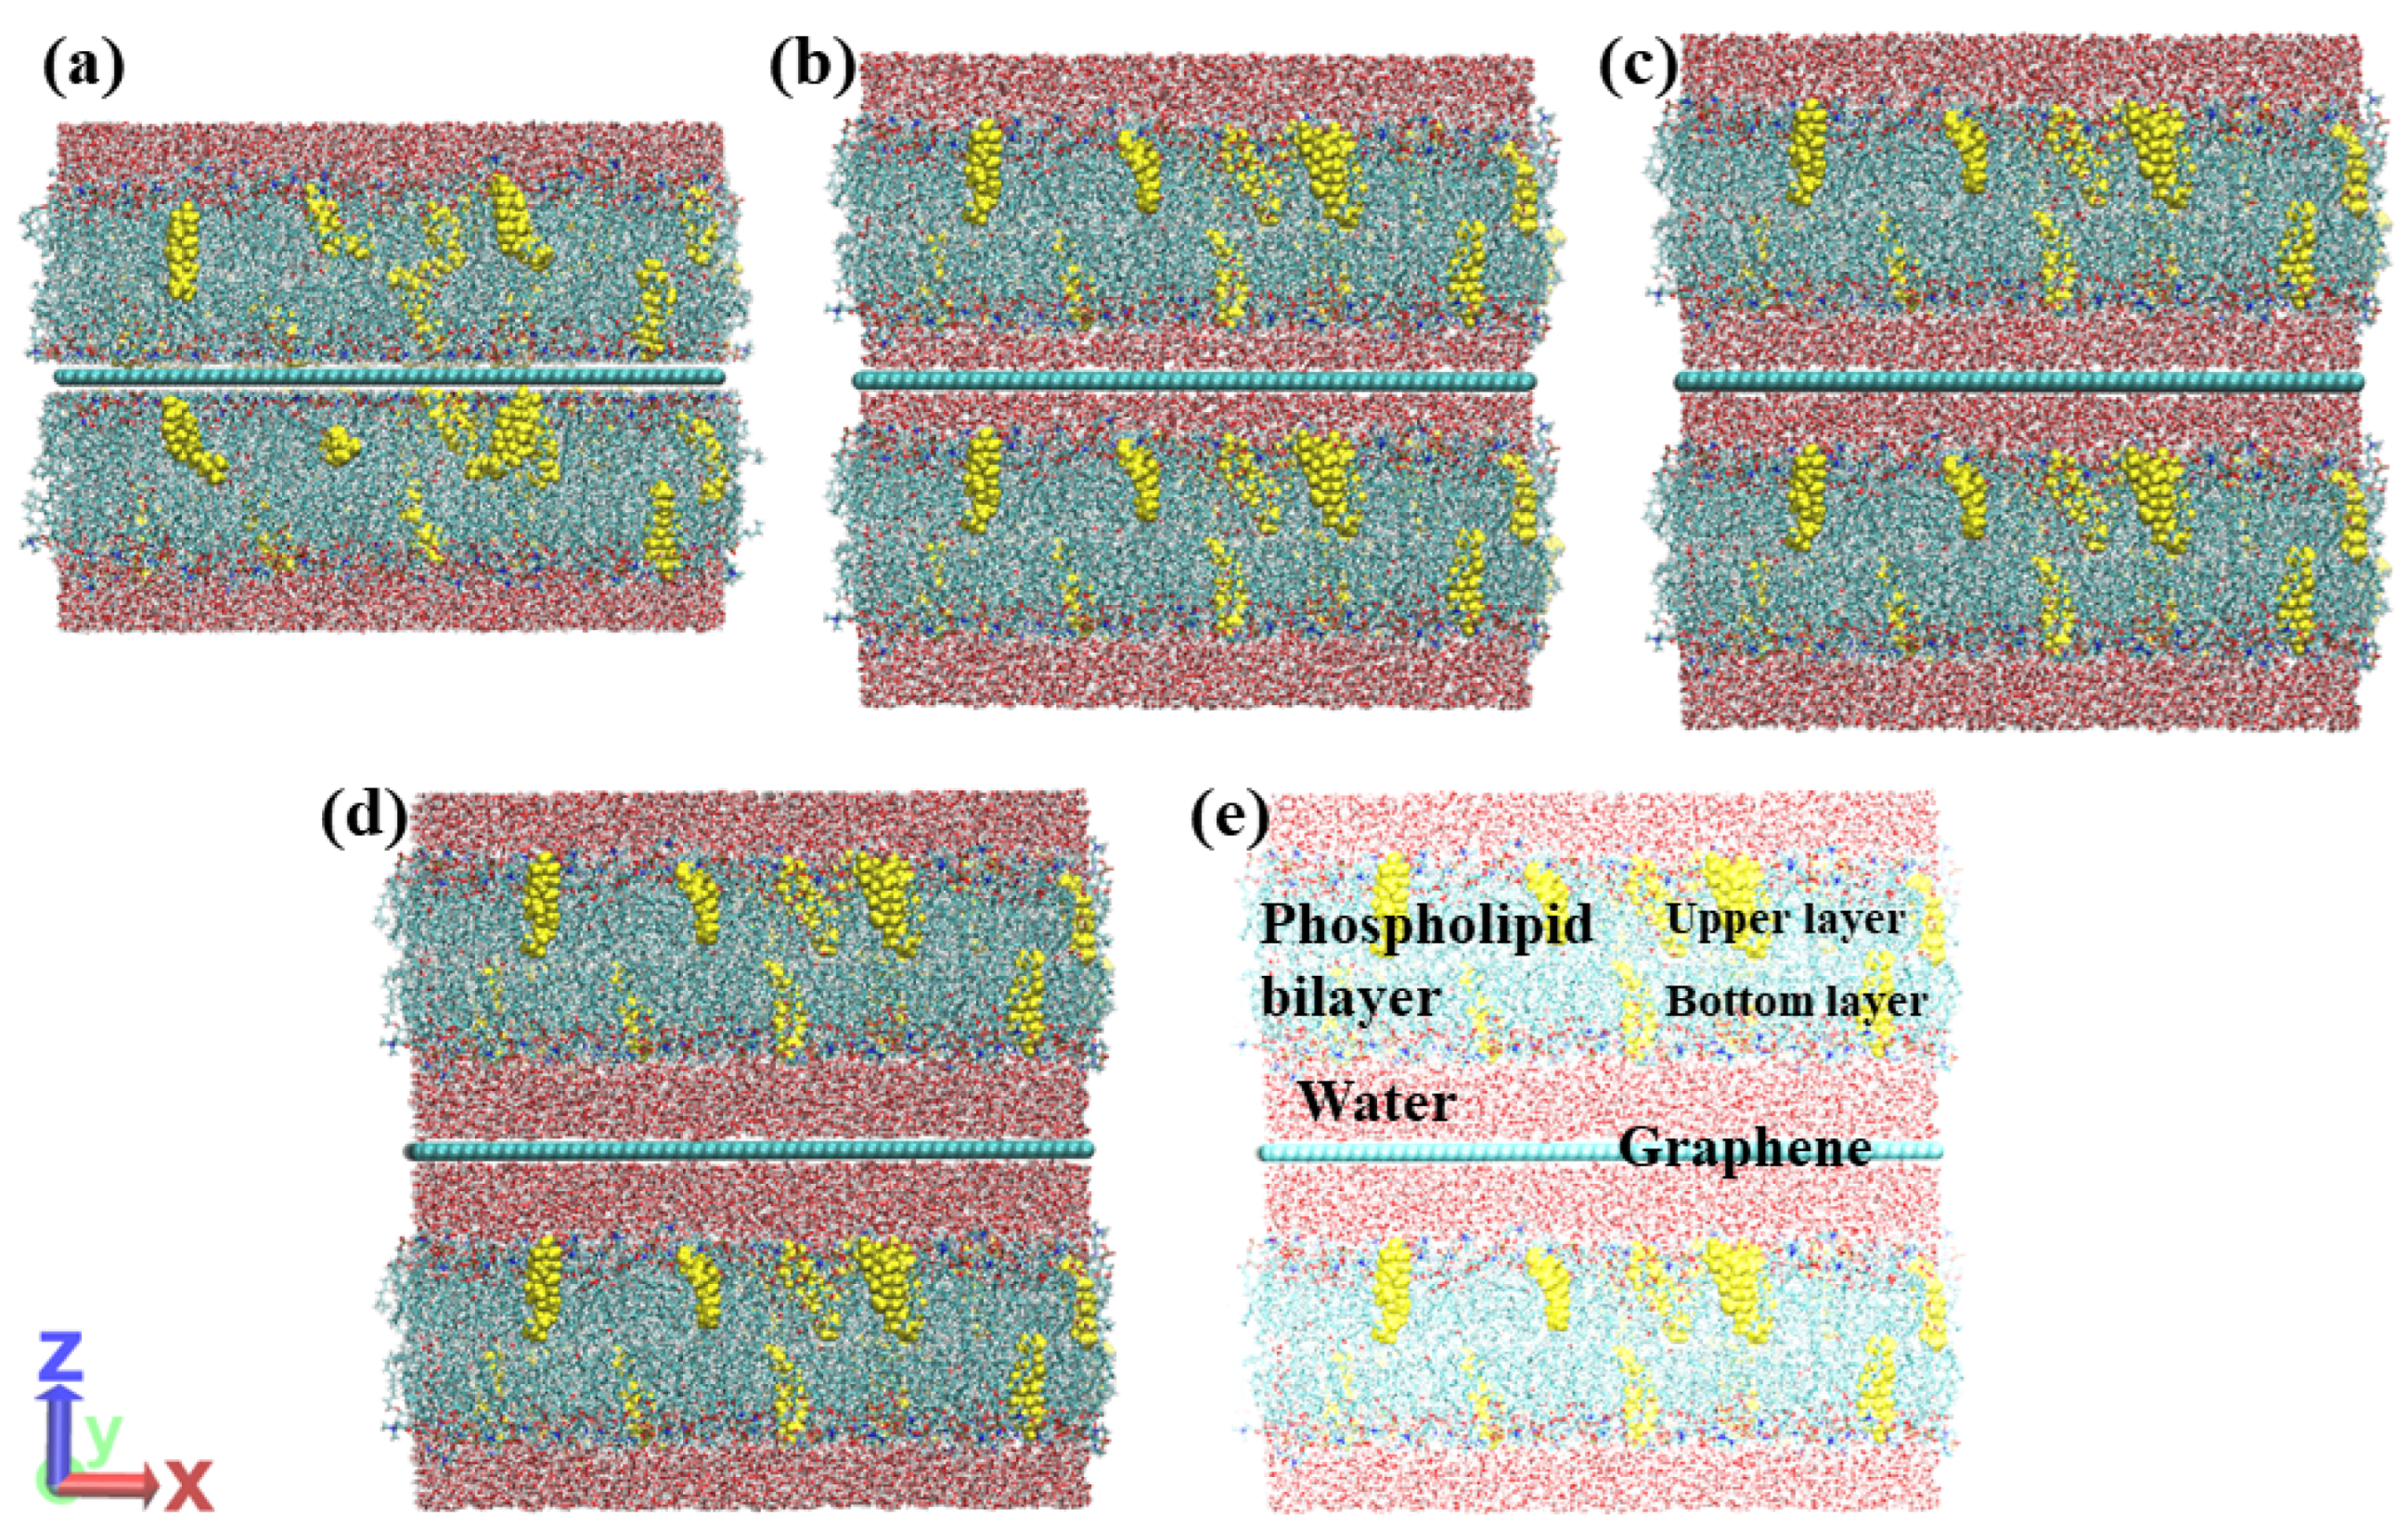
Figure 1. The initial configurations of the systems composed of bilayers (DMPC with 20 percent admixture of cholesterol) and the graphene sheet located between them. (a): System without water between the bilayers and the graphene. (bd): Systems with the water layers between the graphene plane and the membranes and the thicknesses of 6, 9, and 13 Å, respectively. (e): Transparent (d) with descriptions of the integral system structures. The cholesterol in the bilayers is marked with yellow color.
Applsci 15 12369 g001
Figure 2. Figure shows “imaginary” particles attached to the atoms of the carbon plane (red balls) pulling the graphene during SMD simulations. The direction of the velocity vector is the same as the x axis. Only one phospholipid bilayer, “below” graphene (colored black), was shown.
Applsci 15 12369 g002
Figure 3. The density profile of water molecules between bilayers for the system with 10 percent admixture of cholesterol and d = 9 Å. (a) v = 0.1 m/s, (b) v = 1 m/s, (c) v = 10 m/s, (d) v = 100 m/s.
Applsci 15 12369 g003
Figure 4. The average shear stress required to shift the graphene plane through the surrounding environment. (a) v = 0.1 m/s, (b) v = 1 m/s, (c) v = 10 m/s, (d) v = 100 m/s.
Applsci 15 12369 g004
Figure 5. The average Van der Waals interaction energy between the lipids in the bilayer and graphene plane. (a) v = 0.1 m/s, (b) v = 1 m/s, (c) v = 10 m/s, (d) v = 100 m/s.
Applsci 15 12369 g005
Figure 6. The average Van der Waals interaction energy between water and graphene plane. (a) v = 0.1 m/s, (b) v = 1 m/s, (c) v = 10 m/s, (d) v = 100 m/s.
Applsci 15 12369 g006
Figure 7. The average radial distribution function between the carbon atoms from graphene and the oxygen atoms in water, for the moving speed v = 0.1 m/s. (a) d = 6 Å, (b) d = 9 Å, (c) d = 13 Å.
Applsci 15 12369 g007
Figure 8. The average radial distribution function between the phosphorus atoms from phospholipids and the oxygen atoms in water, for the moving speed v = 0.1 m/s. (a) d = 6 Å, (b) d = 9 Å, (c) d = 13 Å.
Applsci 15 12369 g008
Figure 9. The average radial distribution function between the oxygen atoms in water, for the moving speed v = 0.1 m/s. (a) d = 6 Å, (b) d = 9 Å, (c) d = 13 Å.
Applsci 15 12369 g009
Figure 10. The average root mean square displacement calculated for the moving speed v = 0.1 m/s. (a) d = 0 Å, (b) d = 6 Å, (c) d = 9 Å, (d) d = 13 Å. Errors are shadowed.
Applsci 15 12369 g010
Table 1. The comparison between average distance traveled by DMPC membrane and graphene plane. The values of the standard deviation is given in brackets.
Graphene Rate [m/s]Distance—Lipids [Å]Distance—Graphene [Å]Distance Percentage
0.19.8 (2.3)15.164.9
161.6 (7.5)152.240.4
10185.1 (7.6)1502.012.3
100242.3 (3.9)15,020.01.6
Table 2. The comparison between average distance traveled by DMPC—20% admixture cholesterol membrane and graphene plane. The values of the standard deviation is given in brackets.
Graphene Rate [m/s]Distance—Lipids [Å]Distance—Graphene [Å]Distance Percentage
0.18.3 (4.0)15.155.0
134.7 (11.7)152.222.8
1076.1 (3.3)1502.05.1
100163.5 (3.4)15,020.01.1
Disclaimer/Publisher’s Note: The statements, opinions and data contained in all publications are solely those of the individual author(s) and contributor(s) and not of MDPI and/or the editor(s). MDPI and/or the editor(s) disclaim responsibility for any injury to people or property resulting from any ideas, methods, instructions or products referred to in the content.