Article

AI-Based Image Time-Series Analysis of the Niacin Skin Flush Test in Schizophrenia and Bipolar Disorder

1
1st Department of Psychiatry, Psychotherapy and Early Intervention, Medical University of Lublin, Gluska Street 1, 20-439 Lublin, Poland
2
Department of Technical Computer Science, Faculty of Mathematics and Technical Computer Science, Lublin University of Technology, Nadbystrzycka 38, 20-618 Lublin, Poland
3
Department of Basic Medical Sciences, Faculty of Medicine, The John Paul II Catholic University of Lublin, Konstantynów 1H, 20-708 Lublin, Poland
4
Department of Machine Design and Mechatronics, Faculty of Mechanical Engineering, Lublin University of Technology, Nadbystrzycka 36, 20-618 Lublin, Poland
5
Department of Clinical Neuropsychiatry, Faculty of Medicine, Medical University of Lublin, Gluska Street 1, 20-439 Lublin, Poland
6
Department of Psychiatry and Psychiatric Nursing, Medical University of Lublin, 20-439 Lublin, Poland
*
Author to whom correspondence should be addressed.
Appl. Sci. 2025, 15(23), 12368; https://doi.org/10.3390/app152312368
Submission received: 16 October 2025 / Revised: 11 November 2025 / Accepted: 19 November 2025 / Published: 21 November 2025

Abstract

Psychotic disorders such as schizophrenia (SCH) and bipolar affective disorder (BD) are associated with lipid metabolism abnormalities and inflammatory dysregulation. The niacin skin flush test (NSFT) has long been investigated as a non-invasive indicator of these disturbances. This study used deep learning models to assess the diagnostic utility of SKINREMS, a computerized system for automated temporal analysis of skin flush responses. The study included a total of 188 participants, comprising individuals with psychotic disorders and healthy controls. Sequential skin images were recorded after topical application of methyl nicotinate. Five convolutional neural network architectures—ResNet50, ResNet101, DenseNet121, InceptionV3, and EfficientNetB0—were evaluated for their performance in analyzing these time-dependent dermatological responses in a binary classification task. Accuracy, precision, recall, F1-score, and AUC were calculated at four time points (frames 1, 10, 20, 30). The models demonstrated distinct temporal performance profiles. ResNet50 showed consistent high performance across all time points, making it suitable for clinical environments requiring stable predictions. DenseNet121 achieved the highest AUC (up to 0.99) after 15 min, indicating its potential in extended monitoring. EfficientNetB0 offered gradual performance improvement with lower computational demands, while InceptionV3 was most effective at intermediate time points. ResNet101 showed initial high performance but declined mid-phase. AUC remained stable across all models, suggesting robust discriminative capability over time. This study highlights the importance of selecting appropriate deep learning architectures based on the temporal dynamics of biological responses. The findings demonstrate potential for future clinical application of AI in non-invasive diagnostics of psychotic spectrum disorders.

1. Introduction

The niacin skin flush test (NSFT) is a simple method for assessing the fatty acid content in cell membranes. Due to its properties, it has the potential to be an indicator of fatty acid deficiencies. In patients with mental illness, reaction spectra have been reported, demonstrating statistically significant differences compared to control groups in numerous studies [1,2,3]. Improving the methodology for performing NSFT and assessing the obtained results as a simple, non-invasive, reproducible, and inexpensive method may be important for differentiating psychotic disorders based on their pathophysiological basis [4,5]. This can also support the development of new therapeutic options and medications based on NSFT mechanisms and enable early intervention [6,7,8]. Furthermore, it may help develop psychiatric staging and individualized diets, which could contribute to symptom relief and help maintain remission [9,10].
Polyunsaturated fatty acids are primary elements of neuronal membranes, and their role in mental disorders is crucial [11]. As the dietary interventions have the potential to improve mental and physical health, the World Federation of Societies of Biological Psychiatry and the Canadian Network for Mood and Anxiety Disorders contributed to the creation of clinical guidelines for the treatment of psychiatric disorders. Among others, they underline the preventive role of omega-3 fatty acids in high-risk youth with pre-existing fatty acid deficiency in the transition to psychosis [12]. There are scientific reports that highlight the role of fatty acids in mental disorders. For example, Jones et al. reported protective effects of long-chain omega-3 and omega-6 fatty acids in schizophrenia, and Robinson et al. reported that omega-3 supplementation has the potential to relieve anxiety and depression symptoms in individuals who have experienced psychosis [13].
Moreover, NSFT bears the hallmarks of a determinant that can significantly impact the individualization of treatment in psychiatry. Careful analysis of the results obtained from NSFT in a dynamic manner can contribute to improved diagnostics, which has the potential to reduce individual, social, and economic burdens, while timely treatment can prevent the insidious and devastating course of the disease. NSFT functions as a research tool, not a clinical standard, and is subject to various methodological limitations. Importantly, there is currently no standardized test performance worldwide, nor a standard concentration of niacin solution used for research.
Sequential image analysis is a cornerstone of modern medical diagnostics, spanning applications from contrast-enhanced imaging to temporal analysis of anatomical changes. Selecting appropriate deep learning architectures for such tasks remains challenging because models can perform differently as temporal information accumulates.
Transfer learning has been shown to improve performance in medical image analysis, particularly when datasets are small, by enabling pretrained networks to transfer feature representations learned from large-scale datasets to domain-specific tasks [14,15,16]. The EfficientNetB0 model, used to classify dermoscopic images at various scales, achieved a high diagnostic accuracy of 86.2% [17]. A method for automatic recognition of melanoma in dermoscopic images, using a combination of deep learning (feature transfer from a network trained on natural images), sparse coding, and an SVM classifier, achieved an accuracy of 93.1% (sensitivity 94.9%, specificity 92.8%) in classifying melanoma from benign lesions and an accuracy of 73.9% (sensitivity 73.8%, specificity 74.3%) in distinguishing melanoma from atypical nevi, which significantly outperformed previous ensemble approaches (p < 0.05) [18]. In subsequent studies, the authors proposed a method for classifying skin lesions in dermoscopic images using deep learning based on the VGGNet architecture and knowledge transfer, achieving a sensitivity of 78.66% on the ISIC Archive dataset, which was a significant improvement over previous methods for early melanoma detection [19]. A multi-scale ensemble approach (MSM-CNN) for skin lesion classification, combining transfer learning and three convolutional networks (EfficientNetB0, EfficientNetB1, SeResNeXt-50) trained on dermoscopic images cropped to six different sizes, achieved a balanced multiclass accuracy of 86.2% on the ISIC 2018 test set [17]. A model combining MASK R-CNN segmentation with DensNet feature extraction achieved a skin lesion segmentation efficiency of 93.6% [20]. Applying a similar architecture based on the DensNet for automatic skin lesion segmentation in dermoscopic images achieved first place using deep-separable convolutions, outperforming U-Net and FCN8s networks with diagnostic accuracy of 77.5% and 87%, depending on the dataset [21]. The approach of combining the results of multiple pre-trained (GoogleNet, ResNet-101, NasNet-Large) models for skin lesion diagnosis effectively increased the classification accuracy compared to individual methods [22]. In turn, combining the SMOTE technique to solve the imbalanced data problem with a model based on deep convolutional networks for multiclass skin cancer classification (melanoma, BCC, SCC, MN) allows for very high accuracy of 94% on three different datasets [23]. In a subsequent work, the authors also combined several models, both pre-trained networks and those trained from scratch, for skin cancer detection based on imbalanced datasets [24]. The model demonstrated better results (F1, AUC-ROC, AUC-PR) compared to seven reference methods, effectively dealing with the class imbalance problem. A deep neural network based on a modified EfficientNetV2-M model trained on 58,032 skin cancer images combined with data augmentation demonstrated higher performance in binary and multiclass classification compared to existing deep learning models [25]. Comparative analysis of classical machine learning (ML) models and pre-trained models (VGG16, Xception, ResNet50) for skin lesion diagnosis shows better accuracy results of deep models (88%) compared to classical models (75%) [26]. These results clearly indicate that, in the context of biomedical image classification, there is no single universal model that guarantees the highest performance. Therefore, it is worthwhile to compare the performance of different architectures to select the optimal one for a given task, which was undertaken in this study.
In the context of this study, the discussed deep learning strategies were directly applied to evaluate their diagnostic utility for the niacin skin flush test (NSFT). By linking architecture-specific performance with the temporal dynamics of skin reactions, the analysis demonstrates how CNN models can enhance the objective interpretation of NSFT outcomes. This connection reinforces the primary aim of the work, namely, assessing the feasibility and effectiveness of AI-driven evaluation of NSFT in psychotic disorders.
This study aims to characterize the temporal performance dynamics of five commonly used convolutional neural network architectures to facilitate their potential implementation in clinical settings. The study does not aim to introduce a novel deep learning architecture. Instead, we focus on evaluating and comparing established convolutional neural networks (CNNs) in a novel clinical application: automated temporal assessment of niacin-induced skin flush responses using the SKINREMS system. Therefore, the contribution of this work is primarily application-oriented.

2. Materials and Methods

This section provides information about the study group, patient, and control group inclusion and exclusion criteria, place, and conditions under which the measurements were conducted. It also includes a detailed description of the equipment used to perform the NSFT, as well as a comprehensive technical description of the classification implemented in the study.

2.1. Eligibility Criteria for Study Participants

Table 1 presents the inclusion and exclusion criteria applied to both patient and control groups, defining the medical, demographic, and behavioral parameters used to ensure the homogeneity and reliability of the study sample.

2.2. Characteristics of Study Participants

Table 2 presents percentage information on the characteristics of the study group and the differences between patients and healthy controls.
The research group consisted of 188 individuals: 105 psychotic patients (with diagnosis of schizophrenia or bipolar disorder according to DMS-5 criteria) and 83 healthy controls. Among the patients, there were 52 women (49.52%), 22 individuals with somatic diseases (20.95%) and 31 cigarette smokers (29.52%). In the healthy controls’ group, there were 51 women (61.45%), 23 (27.71%) individuals with somatic diseases and 11 individuals (13.25%) admitted to smoking. The median age in the patient group was 26 years (15-54 years), while in the group of healthy controls it was 24 years (19–32 years). The significant statistical difference, p = 0.002, was presented by the body mass index (BMI) variable. Among patients, the median BMI was 24.82 kg/m2, while the HC group showed a BMI of 22.79 kg/m2. Another significant difference was demonstrated in the level of physical activity by p = 0.005, expressed in minutes per week. In the patient’s group, it was 0 min, while in the study group, the median was 47 min per week.
The median duration of the disease in patients was 5 years, the median number of hospitalizations was 2, the equivalent of olanzapine concerning the used antipsychotic drugs was 26 mg, and the median score on the PANSS (Positive and Negative Syndrome Scale) was 73 points.

2.3. Measurement of Skin Reaction Measurement and Image Processing in the Niacin Skin Flush Test

The study was conducted under controlled laboratory conditions at the 1st Department of Psychiatry, Psychotherapy, and Early Intervention, Medical University of Lublin. The study aimed to record skin reactions induced by the topical application of an aqueous solution of methyl nicotinate (NSFT, Niacin Skin Flush Test) [27]. Aqueous niacin solutions of three different concentrations were used in the NSFT: 0.1 M, 0.01 M, and 0.001 M (Sigma Chemical, St. Louis, MO, USA). Patches soaked in the appropriate solutions were applied to the skin of the participant’s forearm for 90 s. After removing the patches, the upper limb was placed in a specially designed measurement system enabling the recording of skin reactions under repeatable lighting and geometric conditions [28].
The skin reactions were recorded using a Redmi Note 9 Pro mobile phone (Xiaomi Inc., Beijing, China), equipped with a 64-megapixel quad camera (main sensor: Samsung ISOCELL GW1, 1/1.7″ CMOS, pixel size 0.8 μm, aperture f/1.89, focal length 26 mm, PDAF autofocus). The mobile device used in this study was equipped with a Qualcomm Snapdragon 720G SoC integrating the Adreno 618 GPU (≈750 MHz), which provides mid-range graphics processing capabilities suitable for stable image rendering and computationally efficient execution of the applied algorithms. Images were automatically acquired at regular intervals using a dedicated application, allowing for reproducible and comparable visual data. Immediately after patch removal, image acquisition began, capturing one image every 30 s for 15 min (30 images per participant). Images analyzed in this study correspond to four physiologically meaningful stages: 0 min (frame_01), ~5 min (frame_10), ~10 min (frame_20), and ~15 min (frame_30). Each participant contributed exactly one image per analyzed time point, resulting in 188 images per frame (1 × 188 subjects), including 83 images from the disease group (PG) and 105 from the healthy control group (HC).
The recorded video sequences were further analyzed using image processing algorithms. The videos were divided into individual frames, which served as the starting material for the quantitative assessment of skin lesions—including the appearance, disappearance, and intensity of the erythematous reaction. All image sequences used for the analysis contained all three niacin concentrations (0.1 M, 0.01 M, 0.001 M) applied simultaneously on separate marked skin areas within the same frame. This approach ensured identical lighting, white balance, and temporal dynamics across concentrations, allowing direct comparative assessment of concentration-dependent flushing. The selected range reflects the standard NSFT protocol and captures both the typical response threshold (0.1 M) and its attenuated lower-dose equivalents.
The final input data were acquired in the form of images taken with a portable camera under the conditions described previously. Image acquisition was performed for 15 min with 30 s intervals, resulting in a set of 30 images for each patient. Images taken at the same, evenly distributed time points were selected for comparative analysis: immediately after removal of the reagent patches (frame_01), after 5 min (frame_10), after 10 min (frame_20), and after 15 min of patch removal (frame_30). These time points correspond to physiologically meaningful stages of the niacin skin flush response: baseline prior to erythema development (frame_01), early response phase (frame_10), peak vasodilatory/erythema activity typically observed in NSFT (frame_20), and sustained or declining response (frame_30). Each frame was analyzed independently to evaluate the performance of CNN architectures at distinct stages of the biological process.
Each time point was processed as an independent input sample, meaning that the images were not modeled as a continuous time series. The purpose of this design was to evaluate how different convolutional neural network architectures perform at distinct physiological stages of the skin-flush response, rather than to perform temporal sequence learning. Figure 1 presents an example comparison of images obtained at subsequent stages of the study in two randomly selected patients from both groups.
Although no image post-processing beyond resizing was applied, several measures were implemented to minimize the potential impact of white balance, illumination, and skin tone variability. All recordings were performed under standardized laboratory lighting conditions using the same 64-megapixel camera, fixed exposure parameters, and constant camera-to-skin distance. The SKINREMS system ensured uniform illumination through controlled LED light sources with a stable color temperature, minimizing spectral fluctuations. Moreover, each participant’s forearm region was recorded under identical geometric and environmental settings, which reduced variability related to individual skin pigmentation or local vascular features. Consequently, these precautions limited the influence of external optical factors on model training and classification outcomes.
It is worth noting that the images were not subjected to any additional graphic processing, other than changing their resolution to match the input layer of the selected neural networks. Details of this process are discussed in the next chapter.
The SKINREMS (Skin Reaction Measurement System) platform, previously developed and validated by Karakuła-Juchnowicz et al. [27], served as the reference framework for the present study. While the original SKINREMS system was designed for automated quantitative assessment of erythema intensity following niacin application, the current work extends its functionality by implementing a deep learning–based analysis of time-series skin images. In this way, the proposed AI model complements and advances the SKINREMS methodology, transforming static colorimetric evaluation into a dynamic, architecture-specific interpretation of temporal dermatological responses. This integration represents a natural continuation of the SKINREMS concept and allows for comprehensive, automated assessment of niacin-induced skin reactivity.

2.4. Deep Learning Classification Using Transfer Learning

A transfer learning approach was used to perform binary classification of skin images of healthy patients and those diagnosed with mental disorders, using five pre-trained deep convolutional networks: ResNet50 [29], ResNet101 [29], EfficientNetB0 [30], InceptionV3 [31], and DenseNet121 [32]. These models were selected due to their documented effectiveness in image classification tasks, including medical images [33,34,35,36]. In [37], a system for classifying chest X-ray images for identifying SARS-CoV-2 infections was presented, based on transfer learning models, including InceptionV3, achieving classification accuracy exceeding 90%. In turn, models from the ResNet family demonstrated high performance in classifying histopathological images of breast cancer, achieving an accuracy of 85% [38]. In another study, the use of the DenseNet model in a similar diagnostic task contributed to an increase in the efficiency of the automatic classification system [39]. The comparison of ResNet50 and InceptionV3 architectures in the context of mammographic image classification showed the advantage of the first model—the classification accuracy on the test set was 97.5% for ResNet50 and 91.25% for InceptionV3, respectively [40].
As previously mentioned, transfer learning enables the effective application of deep neural models in situations with limited training data. This method utilizes the weights of models previously trained on large datasets (e.g., ImageNet) and then adapts them to a new classification task through fine-tuning or partial reconstruction of the final network layers.
The advantage of this approach is a significant reduction in training time while maintaining high classification accuracy, even with a limited dataset.
The study compared the effectiveness of selected deep learning network architectures developed by leading research centers in the field of artificial intelligence:
  • ResNet50 and ResNet101 (Microsoft Research)—classic, deep residual networks known for their stable training even with a large number of layers. They are often used as a benchmark in many classification tasks.
  • EfficientNetB0 (Google AI)—a modern, lightweight architecture optimized for high computational efficiency, making it particularly attractive in clinical applications where both accuracy and model speed are essential.
  • InceptionV3 (Google Brain)—thanks to its design, it is characterized by the ability to capture features at various scales (both local and distributed), making it useful in the context of medical image analysis.
  • DenseNet121 (Facebook AI Research)—can effectively use information between layers through dense connections, which can translate into better representation of subtle differences in diagnostic images.
To ensure reliable assessment of classifier performance and minimize the risk of overfitting, five-fold cross-validation (k = 5) was used. Independent training and validation sets were created for each fold. Images were resized to appropriate input sizes, consistent with the requirements of the individual networks (224 × 224 or 299 × 299 pixels). In each iteration of the experiment, the network architecture was modified by replacing the input layer with a new one adapted to the appropriate image size, and by removing the original classification layers and replacing them with a new fully connected layer adapted to the number of classes in the dataset. The training process was performed using the Adam optimizer, with the following parameters: number of epochs: 20, mini-batch size: 32, initial learning rate: 0.0001, loss function: cross-entropy, and validation every 30 iterations. Training was performed in the MATLAB R2024b environment on a workstation equipped with an AMD Ryzen 7700 processor, 32 GB DDR5 RAM, and an NVIDIA GeForce RTX 3060 graphics card with 12 GB VRAM, which significantly reduced the computational time. Additionally, L2 regularization was used to prevent overfitting.
The selection of the five CNN architectures: ResNet50 [41], ResNet101 [42], DenseNet121 [43], InceptionV3 [44], and EfficientNetB0 [45] was based on their complementary design philosophies and well-documented performance in medical image analysis tasks. ResNet and DenseNet families are known for stable gradient propagation and superior feature reuse in limited datasets, which is particularly relevant for biomedical imaging. InceptionV3 was included for its capability to capture multi-scale features, while EfficientNetB0 represents a computationally efficient baseline optimized for deployment in resource-constrained environments. Although lightweight models such as MobileNet and ShuffleNet offer faster inference, preliminary tests showed that their reduced representational depth led to noticeably lower classification stability across temporal frames. Therefore, the chosen architectures provided a balance between diagnostic accuracy, robustness, and computational feasibility, ensuring fair evaluation across models with distinct architectural paradigms.

2.5. Measures for Evaluating the Quality of Classifiers

In order to evaluate the effectiveness of each model, fundamental classification metrics were computed for every fold, enabling a detailed analysis of classifier performance. The most relevant metrics include [46,47,48,49,50]:
1.
Accuracy is one of the most commonly used classification metrics. It measures the percentage of correctly classified cases relative to the total number of cases in the test set:
A c c u r a c y = T P + T N T P + T N + F P + F N
where
  • TP (True Positives)—the number of true positives (correctly classified as positive),
  • TN (True Negatives)—the number of true negatives (correctly classified as negative),
  • FP (False Positives)—the number of false positives (incorrectly classified as positive),
  • FN (False Negatives)—the number of false negatives (incorrectly classified as negative).
2.
Precision—measures the accuracy of the model’s positive predictions. It determines what proportion of cases classified as positive are actually positive:
P r e c i s i o n = T P T P + F P
3.
Recall/Sensitivity—measures the model’s ability to detect true positives. It determines the proportion of true positives that the model correctly recognizes:
R e c a l l = T P T P + F N
4.
F1-Score is the harmonic mean of precision and sensitivity. As a harmonized measure, it is particularly useful for imbalanced classes where precision or sensitivity can be misleading when considered individually:
F 1 S c o r e = 2 · P r e c i s i o n · R e c a l l P r e c i s i o n + R e c a l l
5.
Area Under the Curve (AUC) is a measure of classifier performance that considers all possible classification threshold values. It is calculated by plotting the Receiver Operating Characteristic (ROC) curve based on the sensitivity (TP rate) and specificity (FP rate) values for various decision thresholds.

3. Results

The values of the above metrics were calculated in each experiment evaluation, in this case, for each fold. The final values can be calculated as their arithmetic mean, as presented in Table 3, Table 4, Table 5 and Table 6.
Table 3 presents the results for the experiment on time frame_01. The ResNet50 model achieved the highest accuracy (0.87 ± 0.04), and the ResNet50 model had the highest AUC (0.94 ± 0.01). The DenseNet121 and InceptionV3 models also showed high and similar values for all metrics (~0.86).
For time frame_10 (Table 4), the InceptionV3 model achieved the best results, achieving the highest accuracy (0.89 ± 0.01) and the highest values for the other metrics, with a very low standard deviation. EfficientNetB0 exhibited larger standard deviations (~0.08), indicating less stable results between folds.
For the frame_20 experiment (Table 5), the ResNet50 model again achieved the highest results with accuracy (0.87 ± 0.02) and AUC (0.94 ± 0.01). The results of the DenseNet121 and EfficientNetB0 models were comparable, but slightly lower than those of ResNet50.
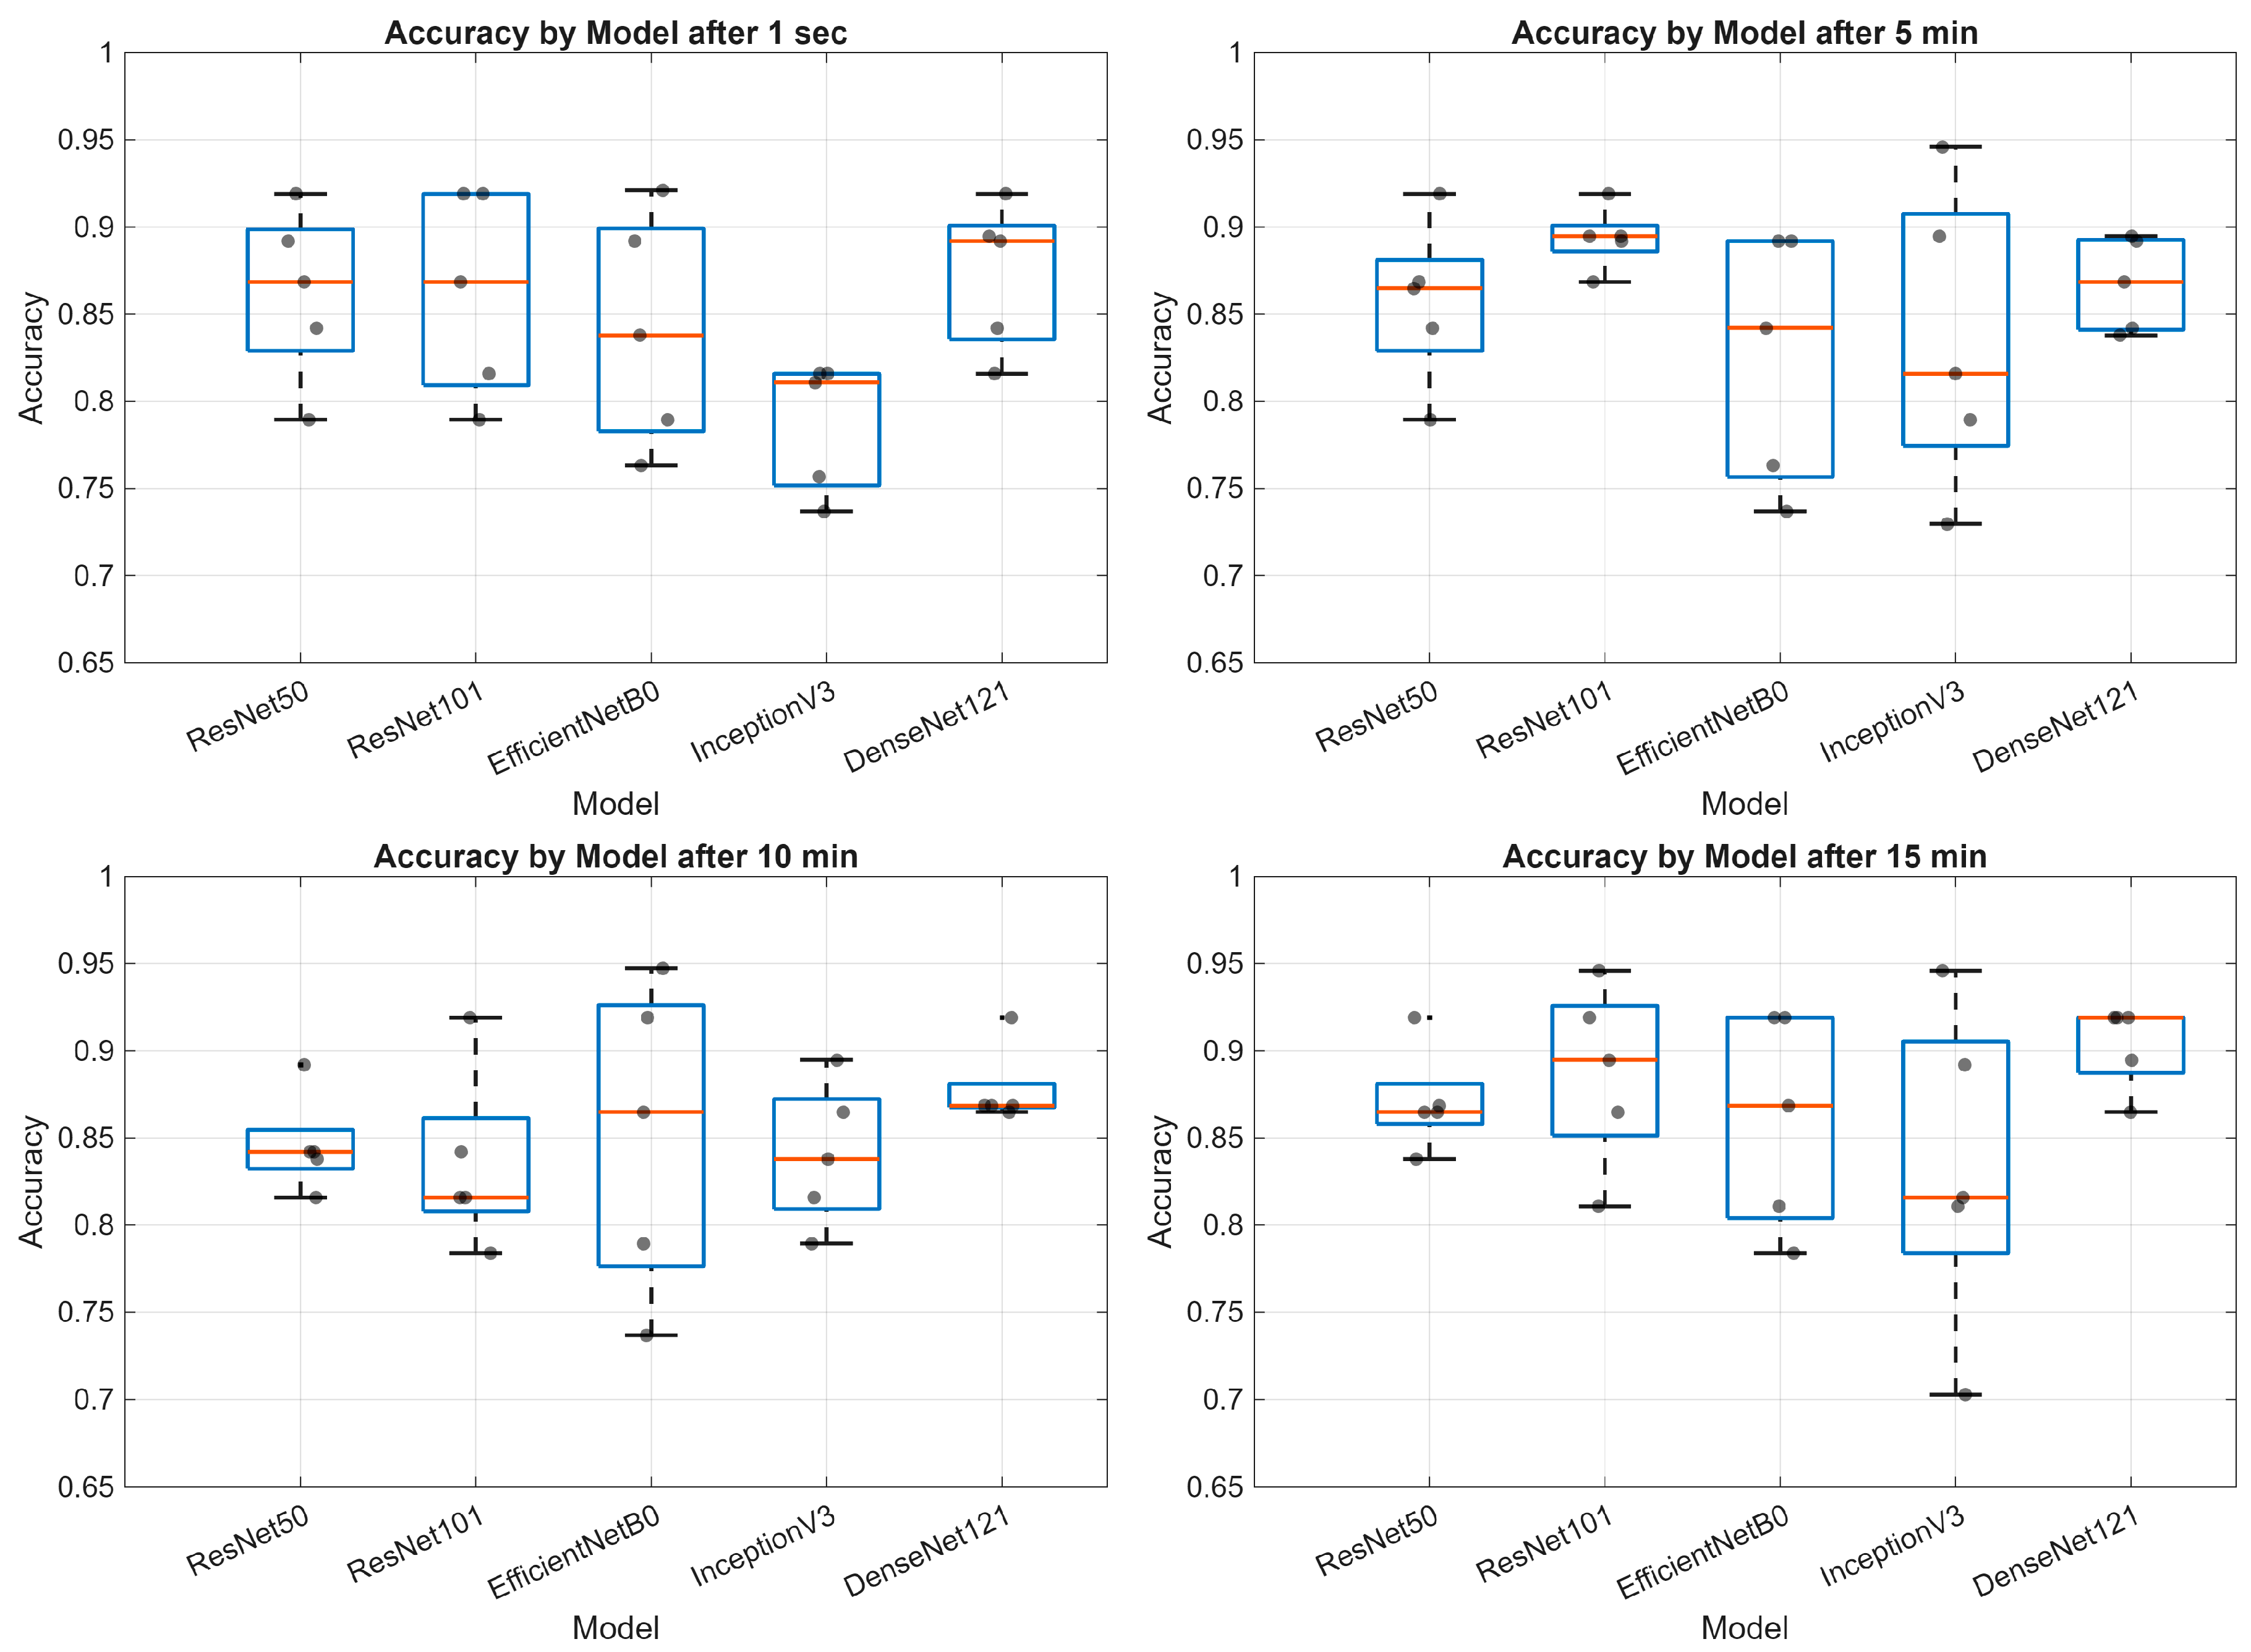
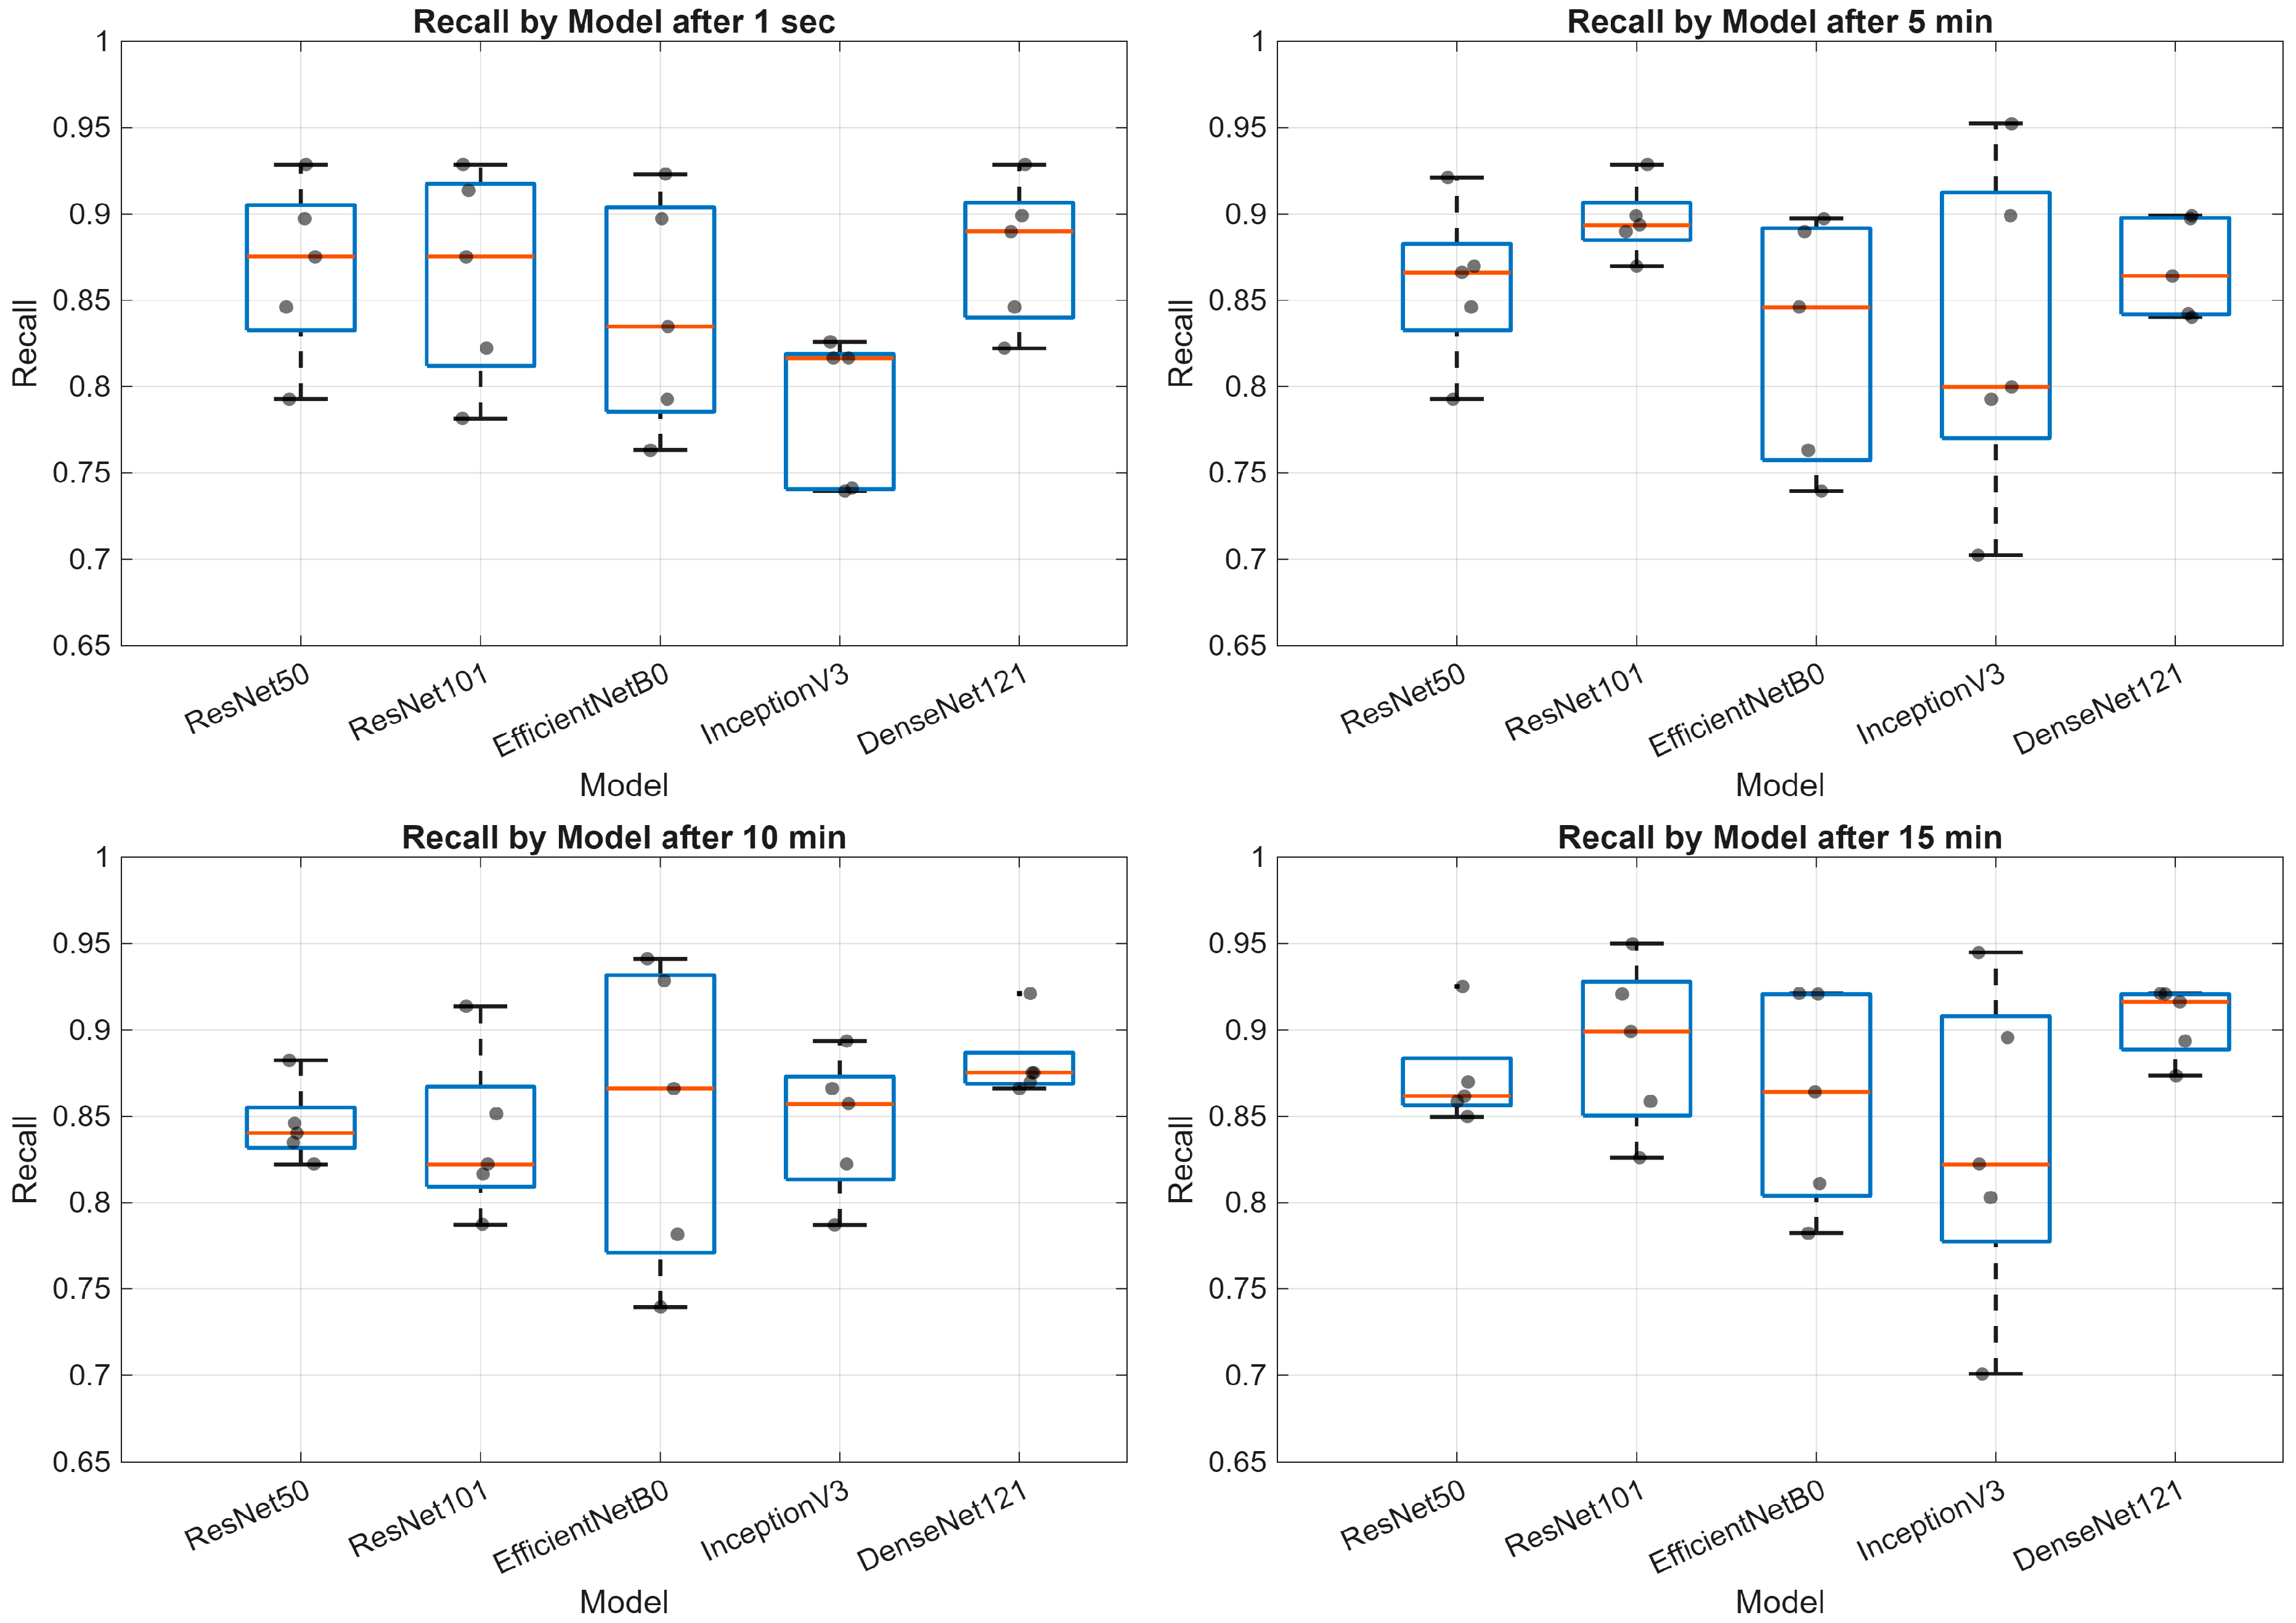
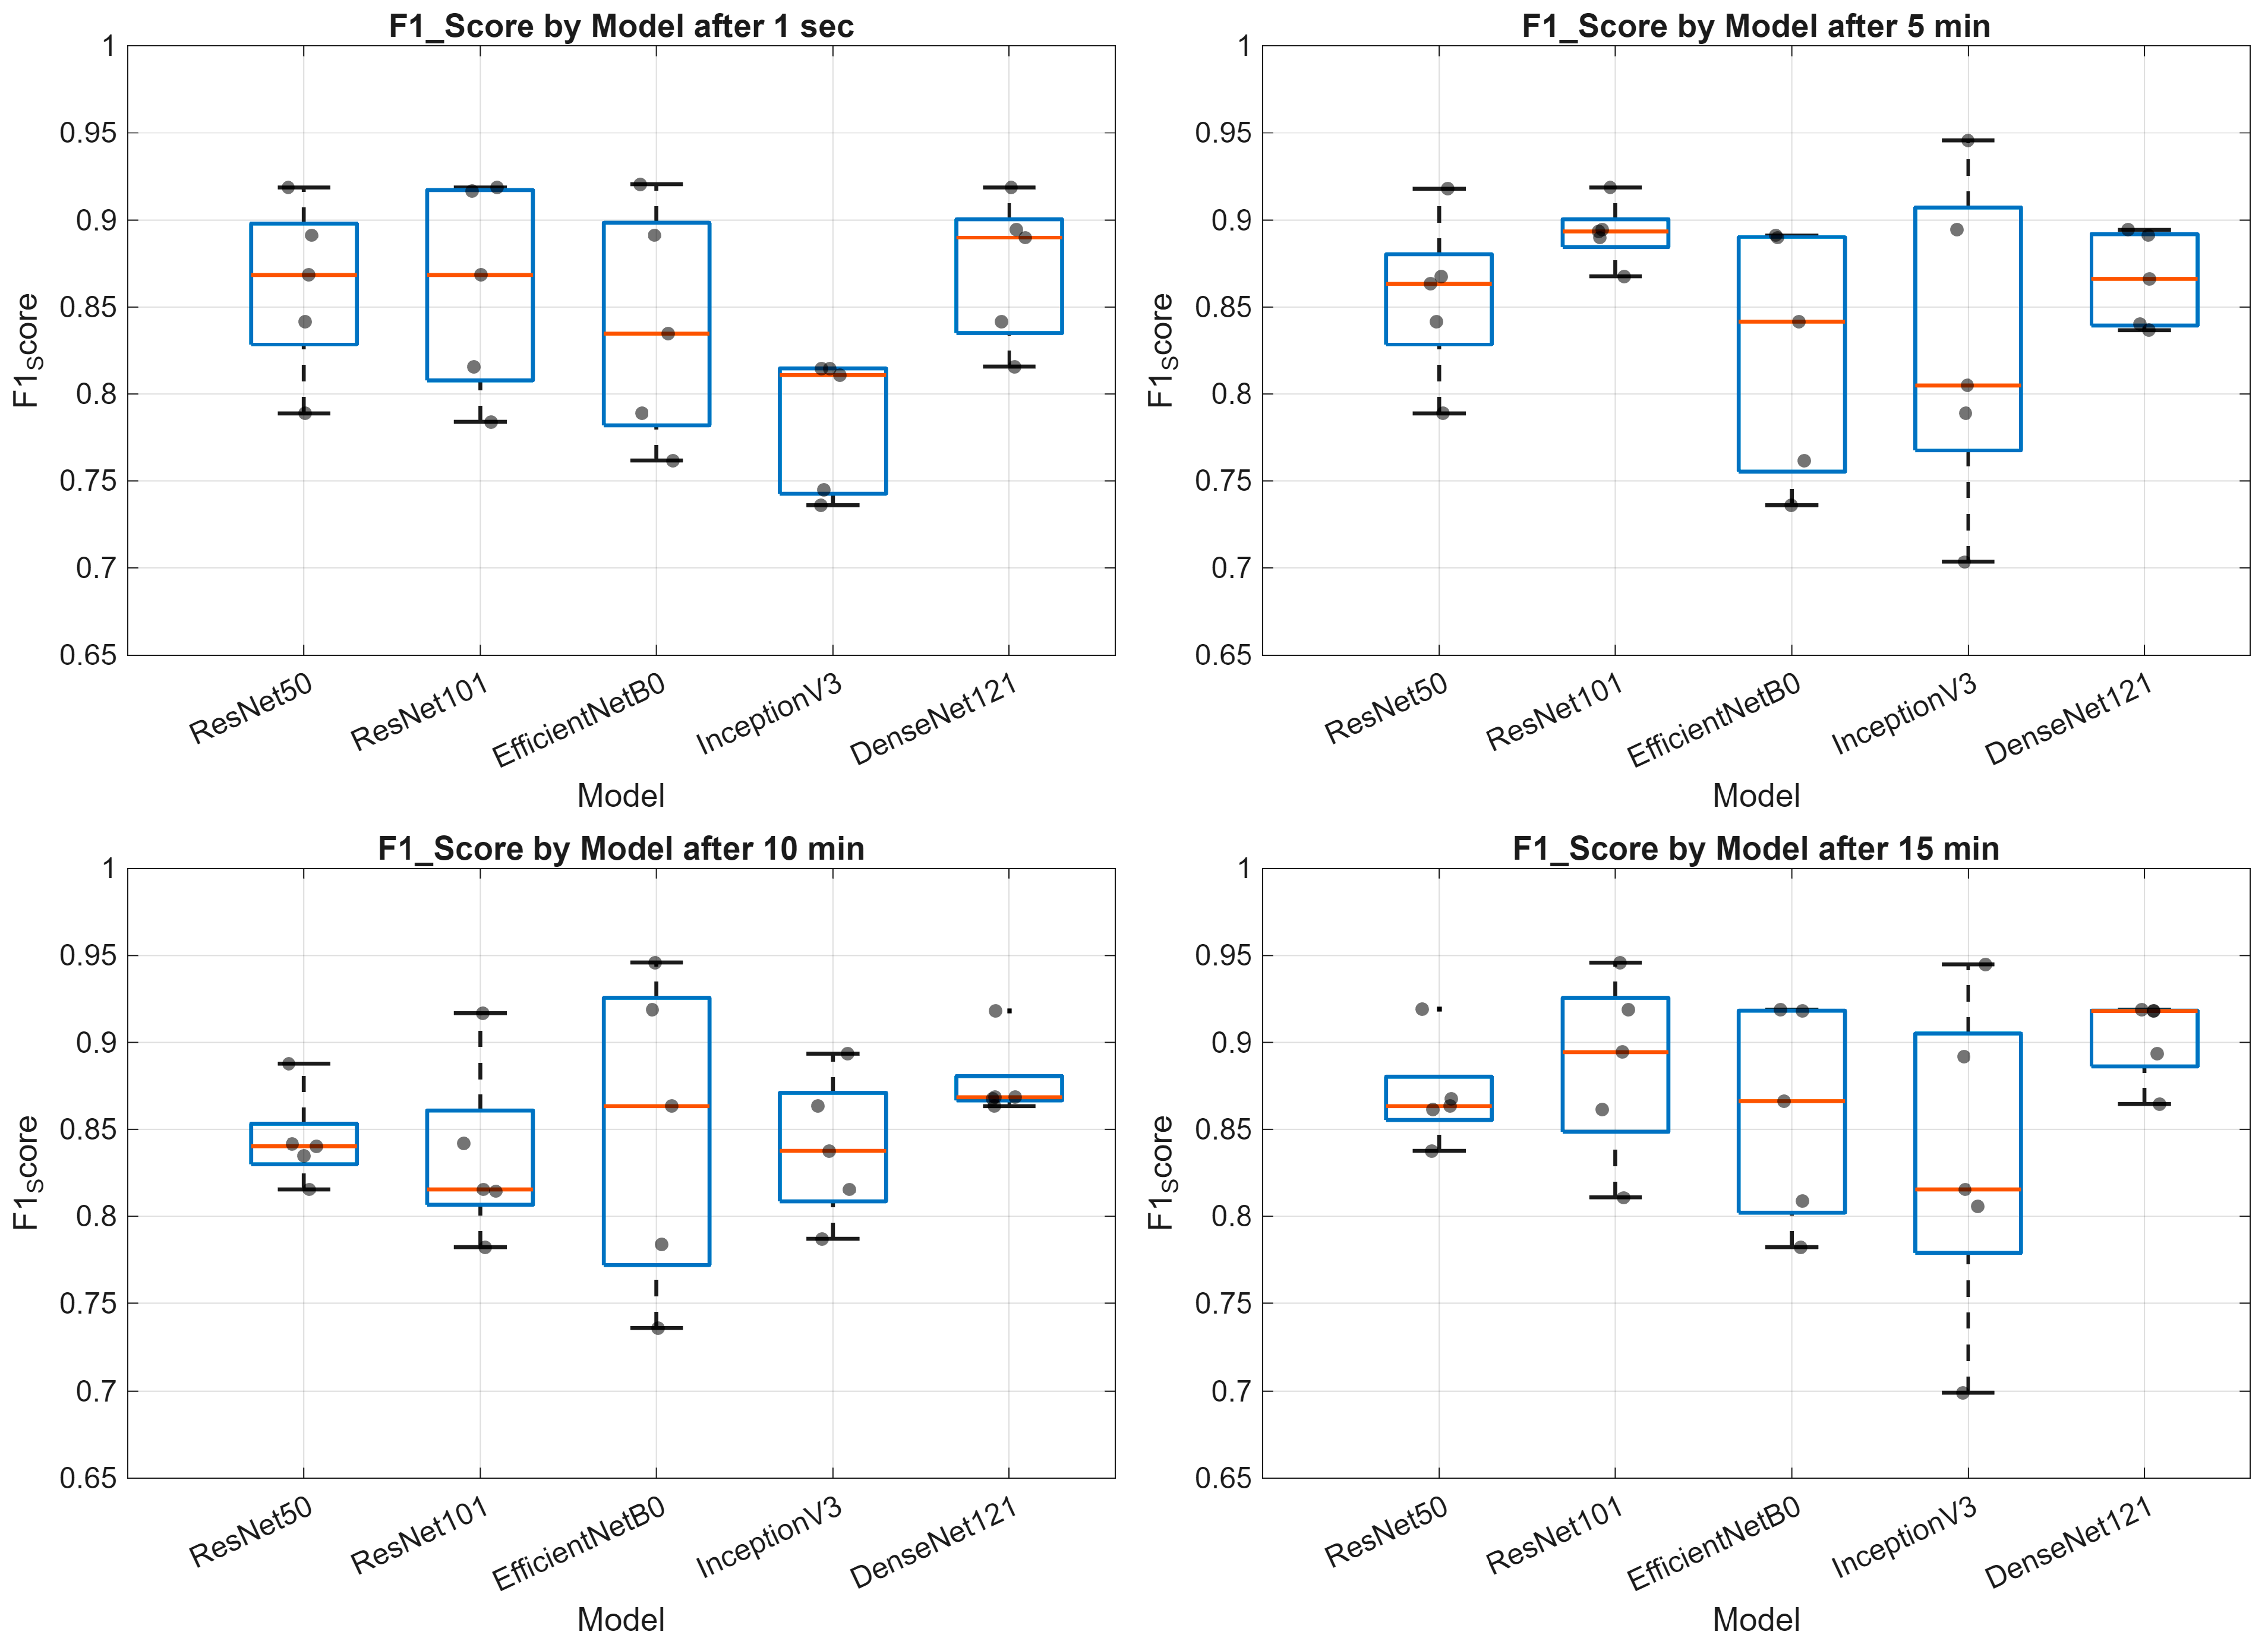
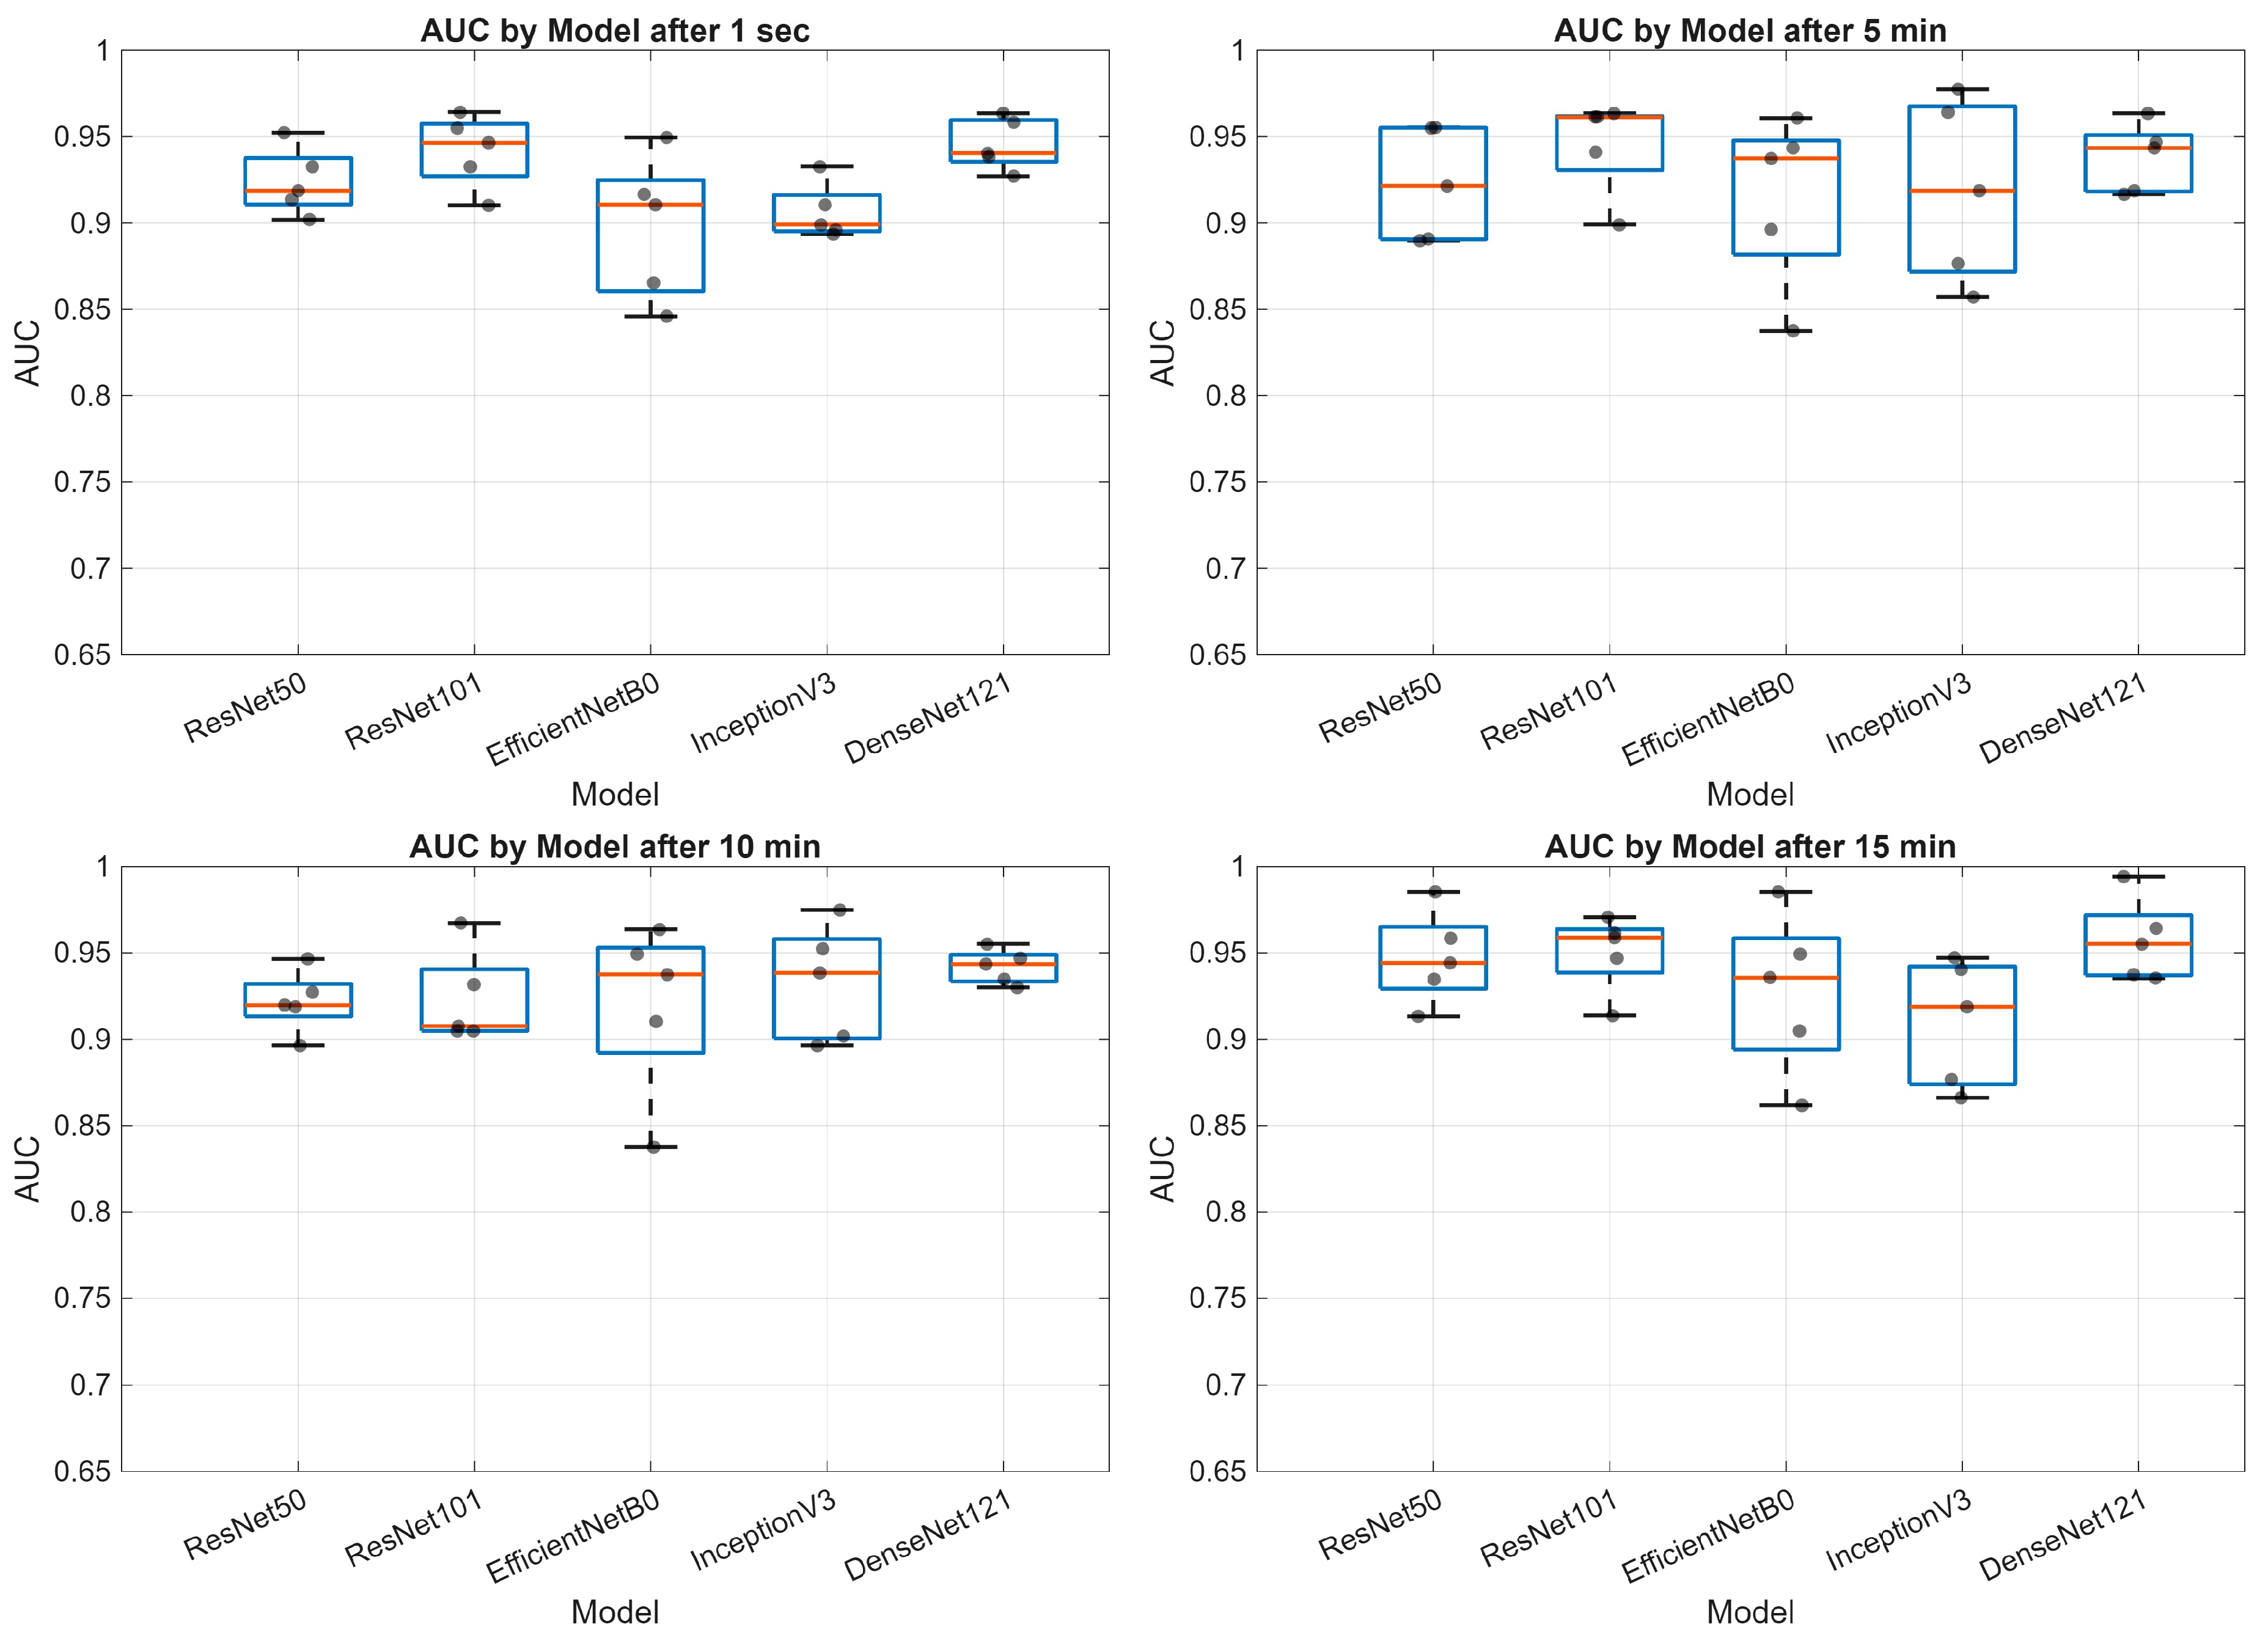
Analyzing the results for frame_30 (Table 6), ResNet50 again achieved the highest accuracy (0.90 ± 0.02) and AUC (0.95 ± 0.02). InceptionV3 also achieved high metric values, especially for AUC (0.95 ± 0.02). DenseNet121 achieved very stable results with a low standard deviation, indicating the model’s repeatability. To illustrate the variability of model performance across folds and the four analyzed time frames (frame_01, frame_10, frame_20, frame_30), boxplots of all performance metrics were generated for each model (Figure 2, Figure 3, Figure 4, Figure 5 and Figure 6). To enable assessment of fold-to-fold variability, jittered individual data points were added to each box plot, allowing readers to inspect the internal distribution of results rather than only the summary statistics.
The presented boxplots show the distribution of Accuracy values obtained by five selected deep learning models (ResNet50, ResNet101, EfficientNetB0, InceptionV3, DenseNet121) depending on the time elapsed after patch removal (1 s, 5 min, 10 min, and 15 min). The results indicate that the ResNet50 and DenseNet121 models demonstrated the highest predictive stability, as evidenced by relatively narrow interquartile ranges and high median Accuracy values at all time points. The EfficientNetB0 and InceptionV3 models showed greater variability, especially in the later measurements (10 and 15 min after patch removal). The ResNet101 model showed an increase in Accuracy values with each subsequent time measurement, reaching the highest values after 15 min. It is also worth noting that for models with higher variability (EfficientNetB0, InceptionV3), there were single outliers that could indicate the influence of random factors on the classification process.
Analysis of the Precision metric statistics presented in Figure 3 indicates that the ResNet50 and DenseNet121 models achieved high and stable values in each of the analyzed time intervals, with a small interquartile range. ResNet101 was distinguished by an increasing median Precision, achieving the best results 15 min after patch removal. Greater variability was observed in the EfficientNetB0 and InceptionV3 models, especially in measurements performed after longer time periods (10 and 15 min), indicating their susceptibility to variable factors affecting classification. The presence of outliers in some cases, especially for the EfficientNetB0 and InceptionV3 models, suggests occasional deterioration of prediction performance in some validation folds.
The results (Figure 4) indicate that the ResNet50 and DenseNet121 models achieved consistently high Recall values across all time frames. The ResNet101 model showed a significant increase in median Recall over time, achieving the best results after 15 min. Significant variations were observed for the EfficientNetB0 and InceptionV3 models—visible through wider interquartile ranges and the presence of outliers—especially in measurements taken after longer time periods. Despite the observed fluctuations, median Recall values remained above 80% for most models, indicating high performance of the models in detecting positive cases.
The mean F1-Score values (Figure 5) show very similar trends to the mean values of the previously presented metrics, confirming the highest stability of the ResNet101 models after 5 min of patch removal and of the ResNet50 and DenseNet121 models after 10 min of testing. The mean AUC values (Figure 6) present a different picture, demonstrating high stability between folds in virtually all cases, with the model achieving the highest AUC values and the lowest variability across all test phases being the DenseNet121 model. It should be noted that for this model, the highest AUC value for the split based on data from the last test phase (15 min after patch removal) is very close to the maximum value at 0.99, while in the previous phases (up to 10 min after the start), it visibly lower (lowest value 0.84) but still very high (highest value 0.97).
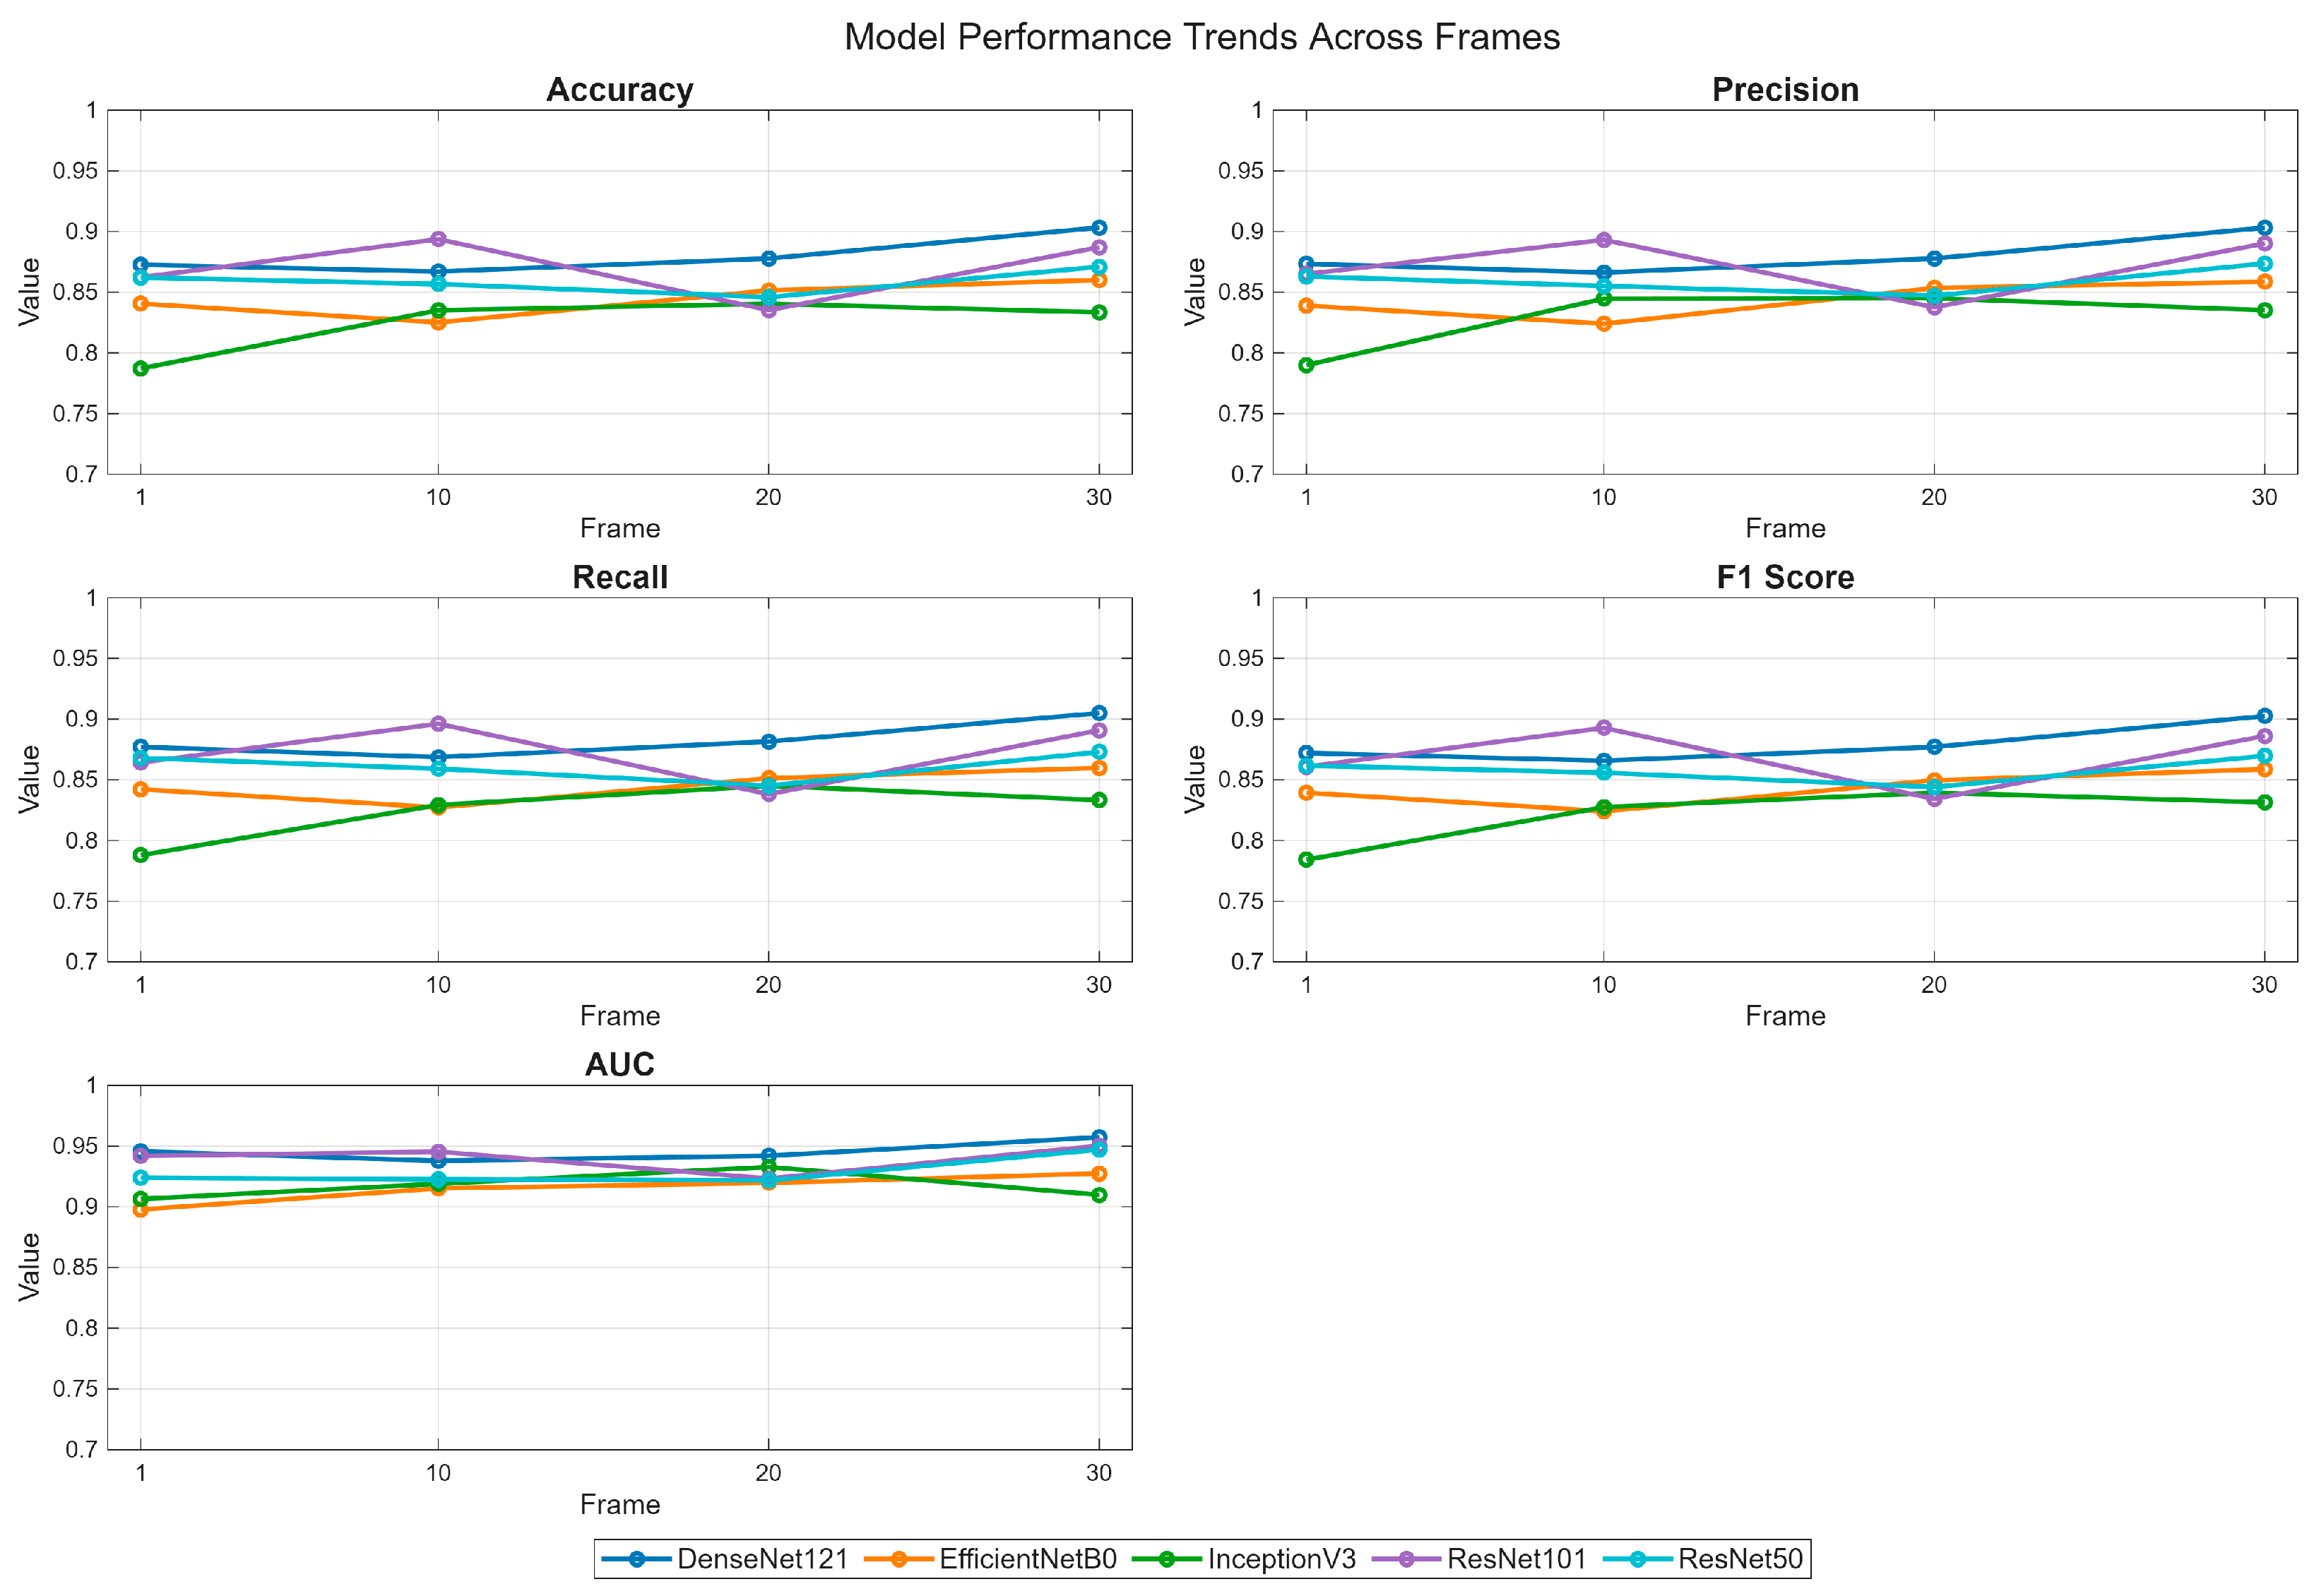
It is also worth analyzing the changes in metrics (their mean values) in the individual study phases corresponding to the length of reagent exposure time (after 1 s, 5 min, 10 min, and 15 min, as presented in the graph in Figure 7.
Comparing the changes in individual metrics across the study phases reveals distinctive performance trajectories for each model. DenseNet121 demonstrates consistent performance improvement across all time points, with moderate initial metrics that gradually increased, ultimately achieving the best performance by frame 30 across all measured parameters.
ResNet101 exhibits more complex dynamics, characterized by a significant performance increase between frames 1 and 10, followed by a pronounced decline at frame 20 and a subsequent partial improvement up to frame 30. This distinct nonlinear pattern is consistent across accuracy, precision, sensitivity, and F1-score measurements, although noticeably absent in AUC metrics, where performance remains stable. EfficientNetB0 shows gradual but consistent improvement across frames, starting from a relatively lower baseline performance but demonstrating steady increases with each subsequent time point. This consistent upward trajectory suggests reliable learning from sequential data with minimal performance fluctuations.
InceptionV3 shows the most significant improvement between frames 1 and 10, starting from the lowest initial performance values but achieving competitive intermediate results. However, performance stabilizes after frame 10, with minimal changes observed at later time points.
ResNet50 maintains stable performance across all time points and metrics, exhibiting the smallest fluctuations of all models tested.
Interestingly, while most performance metrics showed similar patterns within each model, AUC measurements demonstrated noticeably higher stability across all models and time points. All architectures maintained AUC values above 0.90 throughout the entire sequence, with significantly less variability between models compared to other metrics. This suggests that the discriminative ability of these models, as measured by AUC, may be less sensitive to temporal depth than other aspects of performance.
To quantitatively compare the architectures, we performed the Friedman test (non-parametric repeated-measures ANOVA) on fold-level AUC results for each time frame. The analysis showed a borderline significant difference between models at frame_01 (p = 0.0497), indicating slightly higher divergence in performance immediately after reagent removal. For all subsequent time points, no statistically significant differences were observed between the architectures (frame_10: p = 0.4283; frame_20: p = 0.6339; frame_30: p = 0.1241). These findings suggest that while model performance varies more at the earliest stage of the skin flush response, the architectures converge as the erythema becomes more pronounced, ultimately achieving comparable discriminative capability at later time frames.

4. Discussion

Our findings demonstrate that deep learning models exhibit distinct temporal performance profiles in classifying niacin-induced skin reactions, with ResNet50 maintaining consistent accuracy across all time points and DenseNet121 excelling in longer-term analyses through progressive AUC improvement. These results extend prior evidence suggesting the diagnostic value of the niacin skin flush test (NSFT) in differentiating psychiatric disorders [1,51], and align with existing observations on architecture-specific dynamics in medical image classification tasks [52,53].
The observed temporal patterns carry important implications for the implementation of deep learning in sequential medical imaging, where model selection should be tailored to the temporal demands of the clinical context. What should be emphasized is that, by incorporating multiple psychiatric diagnoses into the training set, the proposed approach enhanced the discriminatory capacity of NSFT—enabling the detection of subtle, condition-specific alterations in lipid metabolism among disorders with overlapping pathophysiological backgrounds. This strategy advances the use of NSFT beyond binary classifications (e.g., healthy vs. diseased) and addresses previous methodological limitations associated with subjective assessment and diagnostic overlap [51,54]. In scenarios with limited time frames or when early diagnostic decisions are crucial, ResNet101 may offer an advantage due to its excellent performance in the early phase. Conversely, applications analyzing extended time sequences would likely benefit from the progressive performance improvements of DenseNet121.
The performance instability exhibited by ResNet101 between frames 10 and 20 deserves further investigation, as it may indicate sensitivity to specific data features that emerge at intermediate time points. This phenomenon may reflect either a model-specific limitation or potentially significant biological or physiological transitions captured during this imaging phase.
The steady performance improvement of EfficientNetB0 suggests that it may be a sustainable choice for applications where computational efficiency must be balanced against performance, particularly when processing time or resources are limited. Meanwhile, the remarkable stability of ResNet50 across all time points may be particularly valuable in clinical settings, where consistency of performance is prioritized over marginal improvements in absolute metrics. Collectively, these findings underscore the importance of tailoring deep learning architecture selection to the temporal and clinical characteristics of the task, rather than relying on a one-size-fits-all approach.
Taking characteristics of the study individuals into consideration, although the overall age range of participants in the study is 15 to 54 years, the average age in both groups is approximately 20 years old. There are scientific studies indicating that age is not a factor influencing niacin test results [55,56,57,58].
Regarding the division of the study group into specific subgroups with different diagnoses, it is important to note that psychotic disorders include schizophrenia, bipolar disorder, and schizoaffective disorder. Therefore, it is reasonable to search for a common physiological basis by identifying biological markers that differentiate these subgroups of patients, as this could enable further research on treatment effectiveness, disease risk, and the presumed course of the disease. Psychotic disorders constitute a spectrum characterized by the varied development and course of psychosis. Increasing evidence indicates that psychosis may have a biological basis [1,4]. The next steps in our study also focus on identifying such factors.

5. Conclusions

This study demonstrated the feasibility and clinical potential of applying deep learning models to the temporal analysis of niacin-induced skin reactions in patients with psychiatric disorders. By evaluating multiple neural network architectures across different time points, we identified distinct performance profiles that may inform the optimal selection of models for time-sensitive or resource-constrained diagnostic applications. Importantly, our contribution is application-oriented: rather than proposing a new architecture, we systematically assess how established CNN models perform in this novel clinical context. The key findings are summarized below:
  • Deep learning models demonstrate varying performance trajectories in the analysis of sequential skin reaction images. Each architecture exhibits a unique performance profile depending on the measurement time.
  • The ResNet50 model proved to be the most stable overall, achieving high scores across all time points, making it a good candidate for clinical applications requiring consistent classification quality.
  • DenseNet121 demonstrated progressive performance improvement, achieving the highest AUC values (up to 0.99) in the final phase of the study (15 min), suggesting its suitability for longer-term analyses.
  • ResNet101 demonstrated high performance in the early phases (up to 5 min) but was less stable in the middle measurement period, which may be important for applications requiring rapid diagnostics.
  • EfficientNetB0 demonstrated a systematic, albeit moderate, improvement in performance and may be valuable where computational efficiency is important (e.g., mobile devices and limited resources).
  • InceptionV3 had the greatest improvement between minutes 1 and 10, but then reached a plateau, indicating its limited usefulness in late measurement phases.
  • The stability of the AUC metric across all architectures and time points suggests that the models’ ability to differentiate classes (e.g., clinical vs. non-clinical groups) is less susceptible to temporal variation than other metrics, such as accuracy or sensitivity.
Our findings demonstrate that convolutional neural network architectures exhibit distinct temporal performance signatures when processing sequential medical images. These differences go beyond simple accuracy comparisons and manifest as distinctive patterns of performance evolution across frames. Understanding these temporal dynamics should inform model selection for specific clinical applications, considering the relative importance of early performance, final accuracy, and consistency across the entire temporal sequence. Future work should focus on correlating these temporal performance patterns with specific pathological features to optimize architecture selection for specific diagnostic tasks.

5.1. Clinical Significance Information

The temporal performance characteristics identified in this study have direct implications for real-time diagnostic systems, monitoring applications, and sequential imaging protocols. Model selection should be tailored to the temporal requirements of specific clinical scenarios, with different architectures offering different benefits depending on whether the priority is early detection, accuracy of final assessment, or consistency throughout the study.

5.2. Limitations and Future Perspectives

It should be noted that the presented study also has certain limitations. First, the cross-sectional nature of the study precludes the observation of longitudinal changes that occur in the skin as a result of exposure to niacin and/or their potential relationship to the course of the disease, treatment effects, or symptom variability over time. Second, the relatively small study sample size may contribute to limitations in statistical power and the generalizability of the results, particularly in the context of machine learning model training and validation. Another significant limitation of the study is the comparison of binary groups—that is, psychotic patients versus healthy individuals—without further stratification of the clinical group according to specific diagnostic categories (for example, comparing patients with schizophrenia with those diagnosed with bipolar disorder). This approach may have obscured diagnosis-specific patterns that could be important for precise phenotyping. Additionally, the case–control sampling design may introduce spectrum bias, potentially inflating performance estimates compared with real-world, diagnostically heterogeneous populations. Moreover, the study did not include biological markers (e.g., cytokines, lipid panels) that would allow for a more direct correlation between skin reaction changes and underlying metabolic and/or immunological changes. The lack of external validation using an independent dataset also limits the assessment of the model’s generalizability. Furthermore, despite standardized image acquisition, potential confounding variables such as medication type, smoking status, diet, and environmental influences on skin microcirculation were not fully controlled for or analyzed. Skin phenotype (e.g., Fitzpatrick phototype, baseline vascularity/pigmentation) was not explicitly controlled for, which may affect the visibility and quantification of flush responses. BMI, age and lifestyle factors (diet and physical activity) were not systematically accounted for, which may confound NSFT responses and model outputs; future work should include and adjust for these covariates. An additional limitation of the study is its single-center nature. It would be worthwhile to expand this study to other centers and attempt to use different cameras and lighting conditions from those used in the study.
Future studies should undoubtedly incorporate a longitudinal design with larger and diagnostically diverse samples of study subjects, and biological markers, along with external validation of the model to enhance the clinical utility of AI-based assessment in psychiatric populations. Future research directions may also include the integration of multimodal data, combining image-based NSFT responses with biochemical, neuroimaging, and genetic biomarkers to improve diagnostic specificity and interpretability of AI decisions. The introduction of recurrent or hybrid deep learning architectures, such as CNN–LSTM or Vision Transformers, could enhance the temporal modeling of dynamic vascular responses. Furthermore, the development of portable, mobile-based versions of the SKINREMS system connected to cloud-based analytical platforms would enable large-scale population screening and longitudinal monitoring of disease progression or treatment response. Such integration of clinical, biological, and computational domains could ultimately transform the niacin skin flush test from a research tool into a scalable and clinically validated digital biomarker platform for precision psychiatry.

Author Contributions

Conceptualization, R.S., A.S., R.K., A.M., J.R., K.K., D.J. and H.K.-J.; methodology, R.S., A.S., R.K., A.M., J.R. and H.K.-J.; formal analysis R.S., A.S., R.K., A.M.; investigation R.S., R.K., A.M., J.R., K.K., D.J. and H.K.-J.; writing—original draft preparation; R.S., A.S., R.K., A.M., J.R., K.K., D.J. and H.K.-J.; writing—review and editing; R.S., A.S., R.K., A.M., J.R., K.K., D.J. and H.K.-J.; visualization; A.S., R.K., A.M.; supervision, H.K.-J.; project administration, R.S.; funding acquisition, R.S., R.K. and H.K.-J. All authors have read and agreed to the published version of the manuscript.

Funding

The study was financed from the grant registered under number GW/PB/6/2022, PBsd101 based on the provisions of Annex No. 2 to Order No. 12/2021 of the Rector of the Medical University of Lublin of 27 January 2021.

Institutional Review Board Statement

The study was conducted according to the guidelines of the Declaration of Helsinki and approved by the Ethics Committee of the Medical University of Lublin, Poland (project identification code: KE-0254/213/2021, 30 September 2021).

Informed Consent Statement

Informed consent was obtained from all individuals involved in the study.

Data Availability Statement

The raw data supporting the conclusions of this article will be made available by the authors on request.

Conflicts of Interest

The authors declare no conflicts of interest.

Abbreviations

The following abbreviations are used in this manuscript:
NSFTniacin skin flush test
SCHschizophrenia
CSchronic schizophrenia
SAschizoaffective disorder
BDbipolar affective disorder
C&RTclassification and regression tree
ROCreceiver operating characteristic curve

References

  1. Nadalin, S.; Buretić-Tomljanović, A.; Rubeša, G.; Tomljanović, D.; Gudelj, L. Niacin Skin Flush Test: A Research Tool for Studying Schizophrenia. Psychiatr. Danub. 2010, 22, 14–27. [Google Scholar]
  2. Zhang, T.; Xu, L.; Wei, Y.; Tang, X.; Gan, R.; Zhang, D.; Yi, Z.; Liu, X.; Liu, H.; Wang, Z.; et al. Efficiency and Extent of Niacin-Induced Skin Flushing Patterns in Early Stages of Psychosis. J. Clin. Psychiatry 2025, 86, 24m15559. [Google Scholar] [CrossRef]
  3. Ju, M.; Long, B.; Wei, Y.; Tang, X.; Xu, L.; Gan, R.; Cui, H.; Tang, Y.; Yi, Z.; Liu, H.; et al. Cognitive Impairments in First-Episode Psychosis Patients with Attenuated Niacin Response. Schizophr. Res. Cogn. 2025, 40, 100346. [Google Scholar] [CrossRef]
  4. Thaker, G.K. Neurophysiological Endophenotypes Across Bipolar and Schizophrenia Psychosis. Schizophr. Bull. 2007, 34, 760–773. [Google Scholar] [CrossRef]
  5. Lyu, X.; Goperma, R.; Wang, D.; Wan, C.; Zhao, L. An Open Dataset and Machine Learning Algorithms for Niacin Skin-Flushing Response Based Screening of Psychiatric Disorders. BMC Psychiatry 2025, 25, 757. [Google Scholar] [CrossRef]
  6. Wyatt, R.J. Early Intervention for Schizophrenia: Can the Course of the Illness Be Altered? Biol. Psychiatry 1995, 38, 1–3. [Google Scholar] [CrossRef]
  7. McGorry, P.D.; Nelson, B.; Goldstone, S.; Yung, A.R. Clinical Staging: A Heuristic and Practical Strategy for New Research and Better Health and Social Outcomes for Psychotic and Related Mood Disorders. Can. J. Psychiatry 2010, 55, 486–497. [Google Scholar] [CrossRef]
  8. Zhang, T.; Xiao, X.; Wu, H.; Zeng, J.; Ye, J.; Gao, Y.; Hu, Y.; Xu, L.; Wei, Y.; Tang, X.; et al. Association of Attenuated Niacin Response with Inflammatory Imbalance and Prediction of Conversion to Psychosis from Clinical High-Risk Stage. J. Clin. Psychiatry 2023, 84, 47954. [Google Scholar] [CrossRef] [PubMed]
  9. Aucoin, M.; LaChance, L.; Cooley, K.; Kidd, S. Diet and Psychosis: A Scoping Review. Neuropsychobiology 2020, 79, 20–42. [Google Scholar] [CrossRef] [PubMed]
  10. Robinson, D.G.; Gallego, J.A.; John, M.; Hanna, L.A.; Zhang, J.-P.; Birnbaum, M.L.; Greenberg, J.; Naraine, M.; Peters, B.D.; McNamara, R.K.; et al. A Potential Role for Adjunctive Omega-3 Polyunsaturated Fatty Acids for Depression and Anxiety Symptoms in Recent Onset Psychosis: Results from a 16 Week Randomized Placebo-Controlled Trial for Participants Concurrently Treated with Risperidone. Schizophr. Res. 2019, 204, 295–303. [Google Scholar] [CrossRef] [PubMed]
  11. Bradbury, J. Docosahexaenoic Acid (DHA): An Ancient Nutrient for the Modern Human Brain. Nutrients 2011, 3, 529–554. [Google Scholar] [CrossRef]
  12. Sarris, J.; Ravindran, A.; Yatham, L.N.; Marx, W.; Rucklidge, J.J.; McIntyre, R.S.; Akhondzadeh, S.; Benedetti, F.; Caneo, C.; Cramer, H.; et al. Clinician Guidelines for the Treatment of Psychiatric Disorders with Nutraceuticals and Phytoceuticals: The World Federation of Societies of Biological Psychiatry (WFSBP) and Canadian Network for Mood and Anxiety Treatments (CANMAT) Taskforce. World J. Biol. Psychiatry 2022, 23, 424–455. [Google Scholar] [CrossRef]
  13. Jones, H.J.; Borges, M.C.; Carnegie, R.; Mongan, D.; Rogers, P.J.; Lewis, S.J.; Thompson, A.D.; Zammit, S. Associations between Plasma Fatty Acid Concentrations and Schizophrenia: A Two-Sample Mendelian Randomisation Study. Lancet Psychiatry 2021, 8, 1062–1070. [Google Scholar] [CrossRef] [PubMed]
  14. Esteva, A.; Kuprel, B.; Novoa, R.A.; Ko, J.; Swetter, S.M.; Blau, H.M.; Thrun, S. Dermatologist-Level Classification of Skin Cancer with Deep Neural Networks. Nature 2017, 542, 115–118. [Google Scholar] [CrossRef]
  15. Tajbakhsh, N.; Shin, J.Y.; Gurudu, S.R.; Hurst, R.T.; Kendall, C.B.; Gotway, M.B.; Liang, J. Convolutional Neural Networks for Medical Image Analysis: Full Training or Fine Tuning? IEEE Trans. Med. Imaging 2016, 35, 1299–1312. [Google Scholar] [CrossRef]
  16. Shin, H.-C.; Roth, H.R.; Gao, M.; Lu, L.; Xu, Z.; Nogues, I.; Yao, J.; Mollura, D.; Summers, R.M. Deep Convolutional Neural Networks for Computer-Aided Detection: CNN Architectures, Dataset Characteristics and Transfer Learning. IEEE Trans. Med. Imaging 2016, 35, 1285–1298. [Google Scholar] [CrossRef] [PubMed]
  17. Mahbod, A.; Schaefer, G.; Wang, C.; Dorffner, G.; Ecker, R.; Ellinger, I. Transfer Learning Using a Multi-Scale and Multi-Network Ensemble for Skin Lesion Classification. Comput. Methods Programs Biomed. 2020, 193, 105475. [Google Scholar] [CrossRef]
  18. Codella, N.; Cai, J.; Abedini, M.; Garnavi, R.; Halpern, A.; Smith, J.R. Deep Learning, Sparse Coding, and SVM for Melanoma Recognition in Dermoscopy Images. In Machine Learning in Medical Imaging; Zhou, L., Wang, L., Wang, Q., Shi, Y., Eds.; Lecture Notes in Computer Science; Springer International Publishing: Cham, Switzerland, 2015; Volume 9352, pp. 118–126. ISBN 978-3-319-24887-5. [Google Scholar]
  19. Romero-Lopez, A.; Giro-i-Nieto, X.; Burdick, J.; Marques, O. Skin Lesion Classification from Dermoscopic Images Using Deep Learning Techniques. In Proceedings of the Biomedical Engineering, Innsbruck, Austria, 20–21 February 2017; ACTA Press: Calgary, AB, Canada, 2017. [Google Scholar]
  20. Khan, M.A.; Akram, T.; Zhang, Y.-D.; Sharif, M. Attributes Based Skin Lesion Detection and Recognition: A Mask RCNN and Transfer Learning-Based Deep Learning Framework. Pattern Recognit. Lett. 2021, 143, 58–66. [Google Scholar] [CrossRef]
  21. Hasan, M.K.; Dahal, L.; Samarakoon, P.N.; Tushar, F.I.; Martí, R. DSNet: Automatic Dermoscopic Skin Lesion Segmentation. Comput. Biol. Med. 2020, 120, 103738. [Google Scholar] [CrossRef]
  22. El-Khatib, H.; Popescu, D.; Ichim, L. Deep Learning–Based Methods for Automatic Diagnosis of Skin Lesions. Sensors 2020, 20, 1753. [Google Scholar] [CrossRef]
  23. Tahir, M.; Naeem, A.; Malik, H.; Tanveer, J.; Naqvi, R.A.; Lee, S.-W. DSCC_Net: Multi-Classification Deep Learning Models for Diagnosing of Skin Cancer Using Dermoscopic Images. Cancers 2023, 15, 2179. [Google Scholar] [CrossRef] [PubMed]
  24. Qureshi, A.S.; Roos, T. Transfer Learning with Ensembles of Deep Neural Networks for Skin Cancer Detection in Imbalanced Data Sets. Neural Process. Lett. 2023, 55, 4461–4479. [Google Scholar] [CrossRef]
  25. Venugopal, V.; Raj, N.I.; Nath, M.K.; Stephen, N. A Deep Neural Network Using Modified EfficientNet for Skin Cancer Detection in Dermoscopic Images. Decis. Anal. J. 2023, 8, 100278. [Google Scholar] [CrossRef]
  26. Bechelli, S.; Delhommelle, J. Machine Learning and Deep Learning Algorithms for Skin Cancer Classification from Dermoscopic Images. Bioengineering 2022, 9, 97. [Google Scholar] [CrossRef]
  27. Karakula-Juchnowicz, H.; Rog, J.; Wolszczak, P.; Jonak, K.; Stelmach, E.; Krukow, P. SKINREMS—A New Method for Assessment of the Niacin Skin Flush Test Response in Schizophrenia. JCM 2020, 9, 1848. [Google Scholar] [CrossRef]
  28. Sitarz, R.; Juchnowicz, D.; Karakuła, K.; Forma, A.; Baj, J.; Rog, J.; Karpiński, R.; Machrowska, A.; Karakuła-Juchnowicz, H. Niacin Skin Flush Backs—From the Roots of the Test to Nowadays Hope. J. Clin. Med. 2023, 12, 1879. [Google Scholar] [CrossRef]
  29. He, K.; Zhang, X.; Ren, S.; Sun, J. Deep Residual Learning for Image Recognition. In Proceedings of the 2016 IEEE Conference on Computer Vision and Pattern Recognition (CVPR), Las Vegas, NV, USA, 26 June–1 July 2016; IEEE: New York, NY, USA, 2016; pp. 770–778. [Google Scholar]
  30. Tan, M.; Le, Q.V. EfficientNet: Rethinking Model Scaling for Convolutional Neural Networks. In Proceedings of the 36th International Conference on Machine Learning (PMLR), Long Beach, CA, USA, 9–15 June 2019. [Google Scholar] [CrossRef]
  31. Szegedy, C.; Vanhoucke, V.; Ioffe, S.; Shlens, J.; Wojna, Z. Rethinking the Inception Architecture for Computer Vision. In Proceedings of the 2016 IEEE Conference on Computer Vision and Pattern Recognition (CVPR), New York, NY, USA, 26 June–1 July 2016; IEEE: Las Vegas, NV, USA, 2016; pp. 2818–2826. [Google Scholar]
  32. Huang, G.; Liu, Z.; Van Der Maaten, L.; Weinberger, K.Q. Densely Connected Convolutional Networks. In Proceedings of the 2017 IEEE Conference on Computer Vision and Pattern Recognition (CVPR), Honolulu, HI, USA, 21–26 July 2017; IEEE: New York, NY, USA, 2017; pp. 2261–2269. [Google Scholar]
  33. Machrowska, A.; Karpiński, R.; Maciejewski, M.; Jonak, J.; Krakowski, P.; Syta, A. Multi-Scale Analysis of Knee Joint Acoustic Signals for Cartilage Degeneration Assessment. Sensors 2025, 25, 706. [Google Scholar] [CrossRef]
  34. Matysiak, M.; Podkowiński, A.; Chorągiewicz, T.; Karpiński, R.; Dolecki, M.; Stęgierski, R.; Zimenkovskyy, A.; Shybinskyy, V.; Jonak, K.E.; Rejdak, R. AI-Assisted Fundus Image Analysis for Medical Diagnostics in Conflict Zones. Adv. Sci. Technol. Res. J. 2025, 20, 510–524. [Google Scholar]
  35. Gęca, J.; Głuchowski, D.; Podkowiński, A.; Chorągiewicz, T.; Wróbel-Dudzińska, D.; Karpiński, R.; Syta, A.; Jonak, K.; Wolińska, A.; Rejdak, R. Keratoconus Diagnosis Based on Dynamic Corneal Imaging Using 3D Convolutional Neural Networks. Adv. Sci. Technol. Res. J. 2025, 19, 257–272. [Google Scholar] [CrossRef]
  36. Syta, A.; Podkowiński, A.; Chorągiewicz, T.; Karpiński, R.; Gęca, J.; Wróbel-Dudzińska, D.; Jonak, K.E.; Głuchowski, D.; Maciejewski, M.; Rejdak, R.; et al. Machine Learning-Assisted Early Detection of Keratoconus: A Comparative Analysis of Corneal Topography and Biomechanical Data. Sci. Rep. 2025, 15, 24399. [Google Scholar] [CrossRef] [PubMed]
  37. Minaee, S.; Kafieh, R.; Sonka, M.; Yazdani, S.; Soufi, G.J. Deep-COVID: Predicting COVID-19 from Chest X-Ray Images Using Deep Transfer Learning. Med. Image Anal. 2020, 65, 101794. [Google Scholar] [CrossRef] [PubMed]
  38. Ahmad, H.M.; Ghuffar, S.; Khurshid, K. Classification of Breast Cancer Histology Images Using Transfer Learning. In Proceedings of the 2019 16th International Bhurban Conference on Applied Sciences and Technology (IBCAST), Islamabad, Pakistan, 8–12 January 2019; IEEE: New York, NY, USA, 2019; pp. 328–332. [Google Scholar]
  39. Jiménez Gaona, Y.; Rodriguez-Alvarez, M.J.; Espino-Morato, H.; Castillo Malla, D.; Lakshminarayanan, V. DenseNet for Breast Tumor Classification in Mammographic Images. In Bioengineering and Biomedical Signal and Image Processing; Rojas, I., Castillo-Secilla, D., Herrera, L.J., Pomares, H., Eds.; Lecture Notes in Computer Science; Springer International Publishing: Cham, Switzerland, 2021; Volume 12940, pp. 166–176. ISBN 978-3-030-88162-7. [Google Scholar]
  40. Vesal, S.; Ravikumar, N.; Davari, A.; Ellmann, S.; Maier, A. Classification of Breast Cancer Histology Images Using Transfer Learning. In Image Analysis and Recognition; Lecture Notes in Computer Science Series; Springer: Berlin/Heidelberg, Germany, 2018. [Google Scholar]
  41. Behar, N.; Shrivastava, M. ResNet50-Based Effective Model for Breast Cancer Classification Using Histopathology Images. Comput. Model. Eng. Sci. 2022, 130, 823–839. [Google Scholar] [CrossRef]
  42. Zhang, Q. A Novel ResNet101 Model Based on Dense Dilated Convolution for Image Classification. SN Appl. Sci. 2022, 4, 9. [Google Scholar] [CrossRef]
  43. Chhabra, M.; Kumar, R. A Smart Healthcare System Based on Classifier DenseNet 121 Model to Detect Multiple Diseases. In Mobile Radio Communications and 5G Networks; Marriwala, N., Tripathi, C.C., Jain, S., Kumar, D., Eds.; Lecture Notes in Networks and Systems; Springer Nature Singapore: Singapore, 2022; Volume 339, pp. 297–312. ISBN 978-981-16-7017-6. [Google Scholar]
  44. Aggarwal, S.; Sahoo, A.K.; Bansal, C.; Sarangi, P.K. Image Classification Using Deep Learning: A Comparative Study of VGG-16, InceptionV3 and EfficientNet B7 Models. In Proceedings of the 2023 3rd International Conference on Advance Computing and Innovative Technologies in Engineering (ICACITE), Greater Noida, India, 12–13 May 2023; IEEE: New York, NY, USA, 2023; pp. 1728–1732. [Google Scholar]
  45. Patel, C.H.; Undaviya, D.; Dave, H.; Degadwala, S.; Vyas, D. EfficientNetB0 for Brain Stroke Classification on Computed Tomography Scan. In Proceedings of the 2023 2nd International Conference on Applied Artificial Intelligence and Computing (ICAAIC), Salem, India, 4–15 May 2023; IEEE: New York, NY, USA, 2023; pp. 713–718. [Google Scholar]
  46. Chicco, D.; Jurman, G. The Advantages of the Matthews Correlation Coefficient (MCC) over F1 Score and Accuracy in Binary Classification Evaluation. BMC Genom. 2020, 21, 6. [Google Scholar] [CrossRef]
  47. Cao, C.; Chicco, D.; Hoffman, M.M. The MCC-F1 Curve: A Performance Evaluation Technique for Binary Classification. arXiv 2020, arXiv:2006.11278. [Google Scholar] [CrossRef]
  48. Diallo, R.; Edalo, C.; Awe, O.O. Machine Learning Evaluation of Imbalanced Health Data: A Comparative Analysis of Balanced Accuracy, MCC, and F1 Score. In Practical Statistical Learning and Data Science Methods; Awe, O.O., Vance, E.A., Eds.; STEAM-H: Science, Technology, Engineering, Agriculture, Mathematics & Health; Springer Nature Switzerland: Cham, Switzerland, 2025; pp. 283–312. ISBN 978-3-031-72214-1. [Google Scholar]
  49. Karpiński, R.; Krakowski, P.; Jonak, J.; Machrowska, A.; Maciejewski, M. Comparison of Selected Classification Methods Based on Machine Learning as a Diagnostic Tool for Knee Joint Cartilage Damage Based on Generated Vibroacoustic Processes. Appl. Comput. Sci. 2023, 19, 136–150. [Google Scholar] [CrossRef]
  50. Machrowska, A.; Karpiński, R.; Maciejewski, M.; Jonak, J.; Krakowski, P.; Syta, A. Application of Recurrence Quantification Analysis in the Detection of Osteoarthritis of the Knee with the Use of Vibroarthrography. Adv. Sci. Technol. Res. J. 2024, 18, 19–31. [Google Scholar] [CrossRef]
  51. Lin, S.-H.; Liu, C.-M.; Chang, S.-S.; Hwu, H.-G.; Liu, S.K.; Hwang, T.J.; Hsieh, M.-H.; Guo, S.-C.; Chen, W.J. Familial Aggregation in Skin Flush Response to Niacin Patch Among Schizophrenic Patients and Their Nonpsychotic Relatives. Schizophr. Bull. 2007, 33, 174–182. [Google Scholar] [CrossRef]
  52. Ansarey, S.H. Inflammation and JNK’s Role in Niacin-GPR109A Diminished Flushed Effect in Microglial and Neuronal Cells with Relevance to Schizophrenia. Front. Psychiatry 2021, 12, 771144. [Google Scholar] [CrossRef]
  53. Feng, J.; Min, W.; Wang, D.; Yuan, J.; Chen, J.; Chen, L.; Chen, W.; Zhao, M.; Cheng, J.; Wan, C.; et al. Potential of Niacin Skin Flush Response in Adolescent Depression Identification and Severity Assessment: A Case-Control Study. BMC Psychiatry 2024, 24, 290. [Google Scholar] [CrossRef] [PubMed]
  54. Maroufi, M.; Tabatabaeian, M.; Tabatabaeian, M.; Mahaki, B.; Teimoori, G. Comparison of Niacin Skin Flush Response in Patients with Schizophrenia and Bipolar Disorder. Iran J. Psychiatry Behav. Sci. 2016, in press. [CrossRef]
  55. Nilsson, B.M.; Hultman, C.M.; Wiesel, F.-A. Niacin Skin-Flush Response and Electrodermal Activity in Patients with Schizophrenia and Healthy Controls. Prostaglandins Leukot. Essent. Fat. Acids 2006, 74, 339–346. [Google Scholar] [CrossRef]
  56. Nilsson, B.M.; Holm, G.; Hultman, C.M.; Ekselius, L. Cognition and Autonomic Function in Schizophrenia: Inferior Cognitive Test Performance in Electrodermal and Niacin Skin Flush Non-Responders. Eur. Psychiatry 2015, 30, 8–13. [Google Scholar] [CrossRef]
  57. Yao, J.K.; Dougherty, G.G.; Gautier, C.H.; Haas, G.L.; Condray, R.; Kasckow, J.W.; Kisslinger, B.L.; Gurklis, J.A.; Messamore, E. Prevalence and Specificity of the Abnormal Niacin Response: A Potential Endophenotype Marker in Schizophrenia. Schizophr. Bull. 2016, 42, 369–376. [Google Scholar] [CrossRef] [PubMed]
  58. Sun, L.; Yang, X.; Jiang, J.; Hu, X.; Qing, Y.; Wang, D.; Yang, T.; Yang, C.; Zhang, J.; Yang, P.; et al. Identification of the Niacin-Blunted Subgroup of Schizophrenia Patients from Mood Disorders and Healthy Individuals in Chinese Population. Schizophr. Bull. 2018, 44, 896–907. [Google Scholar] [CrossRef] [PubMed]
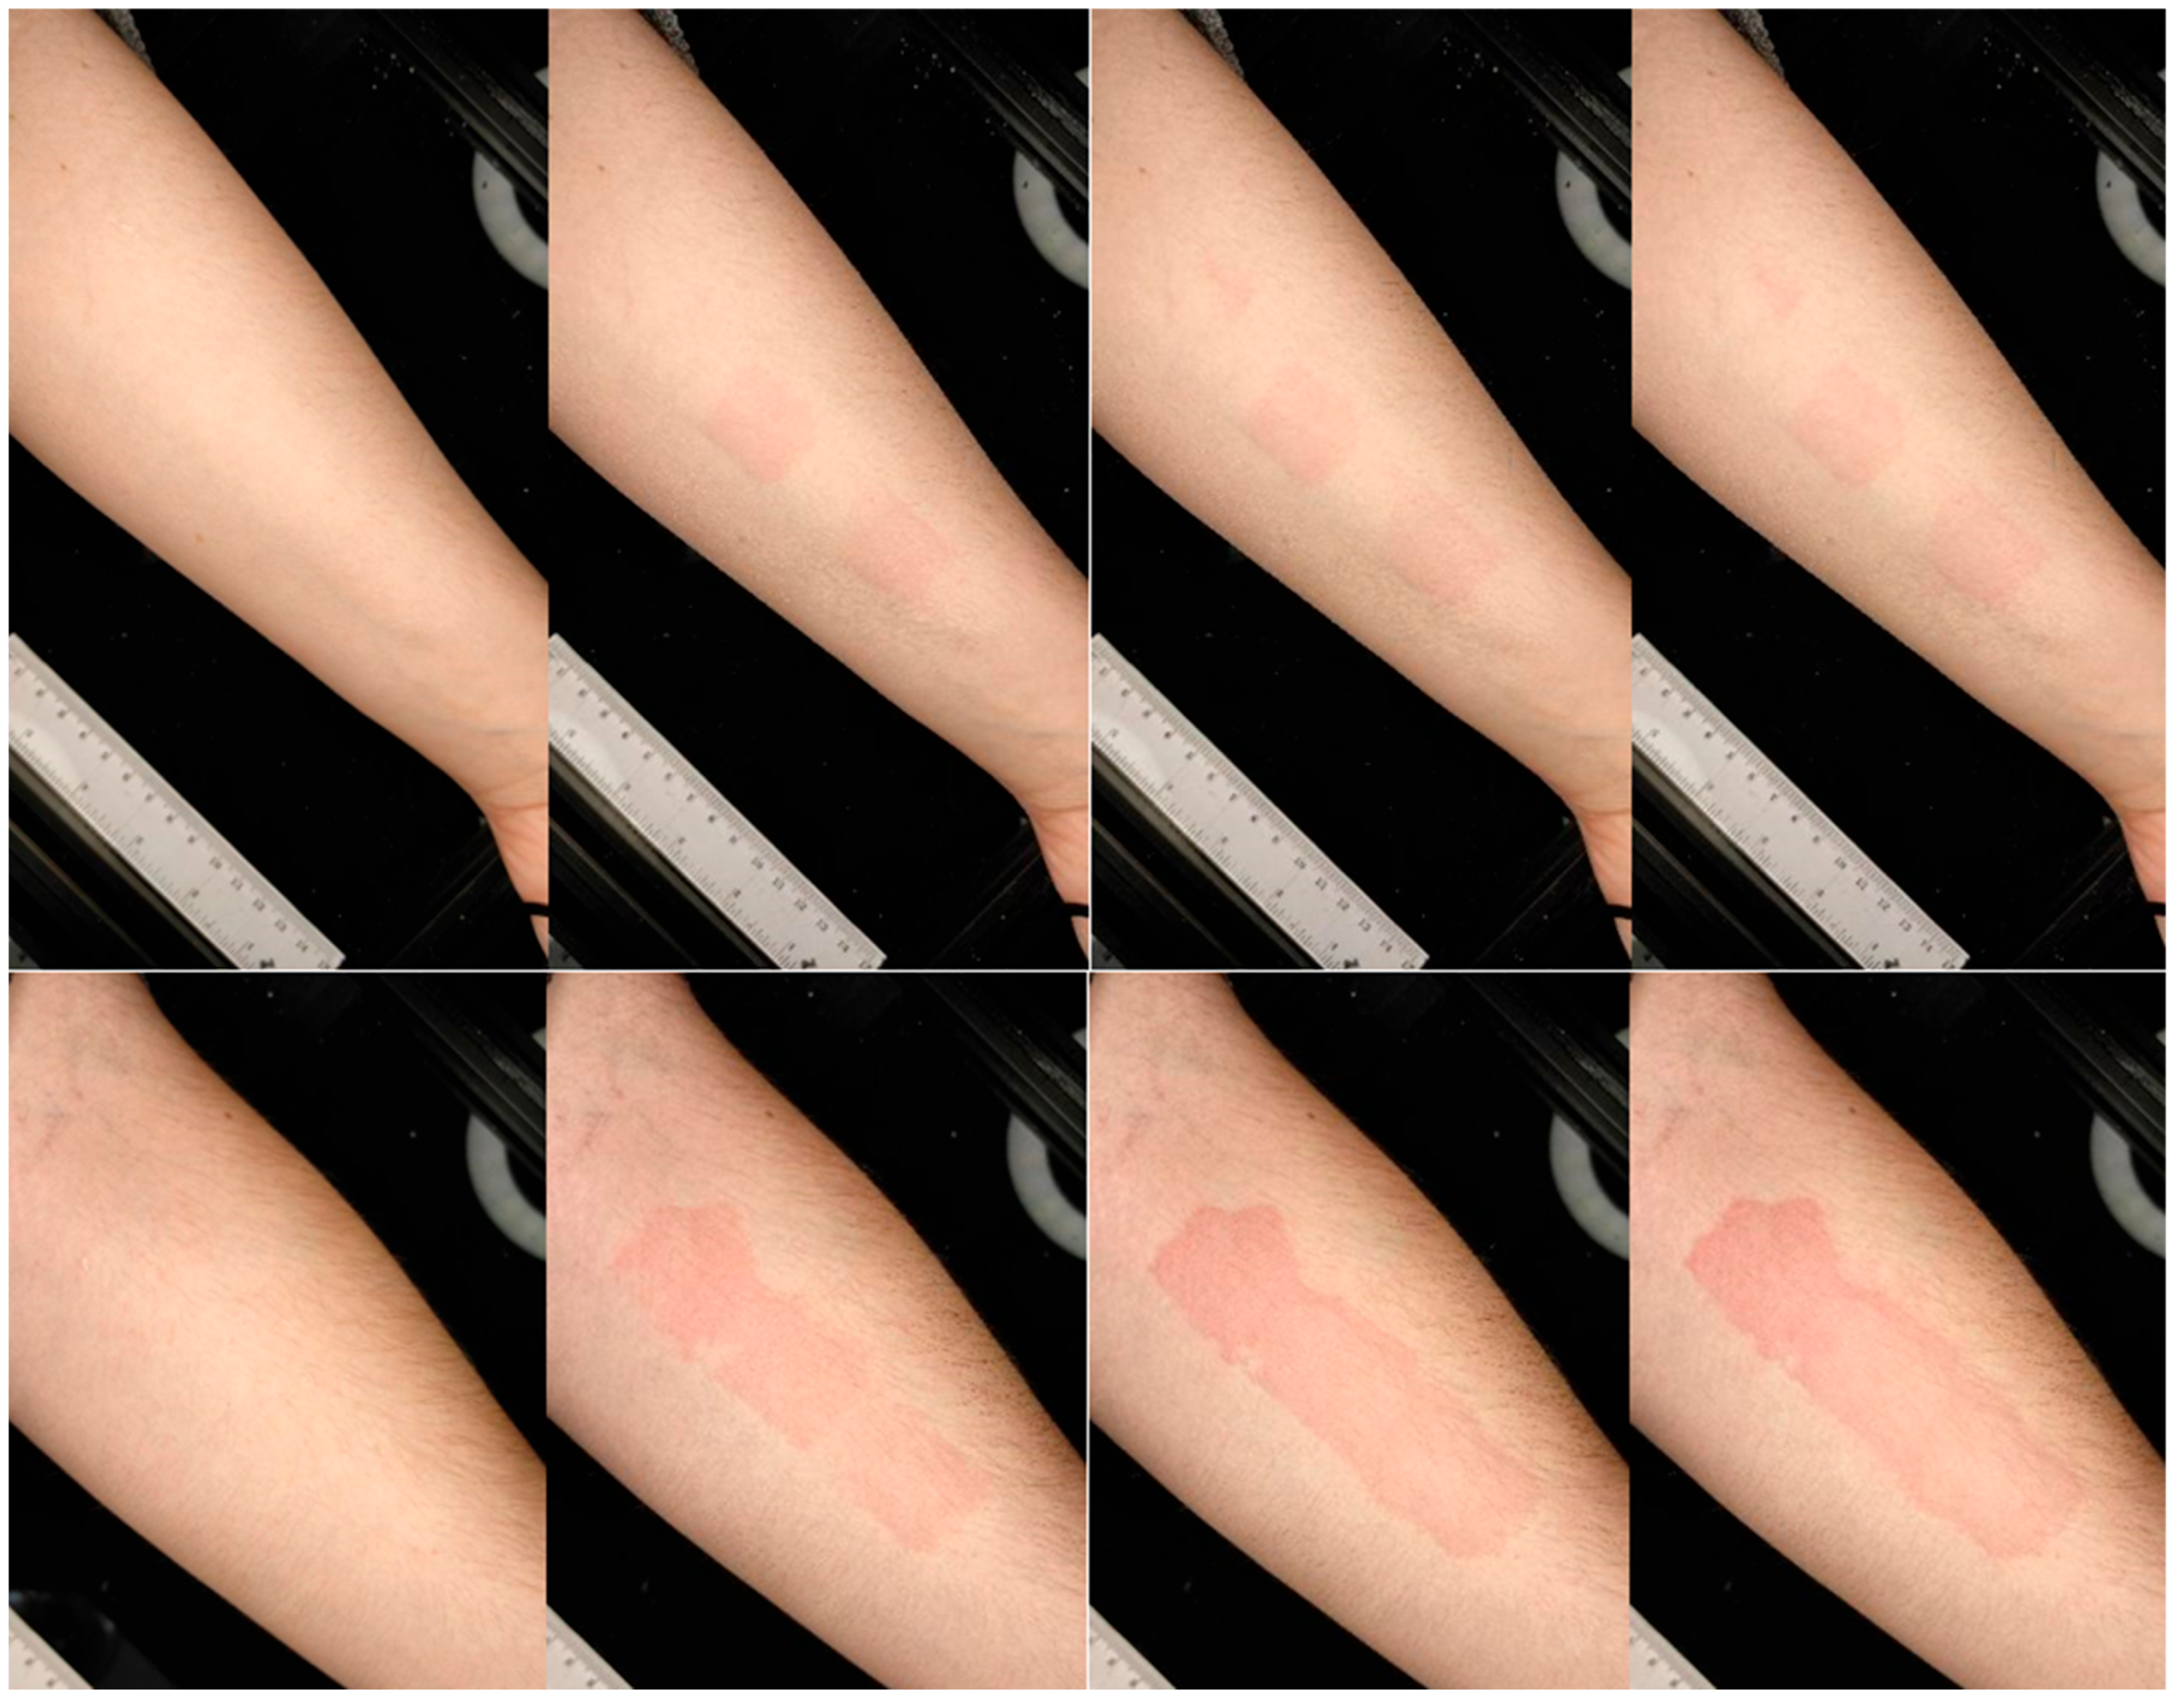
Figure 1. Sample images of patients for the control group (HC)—(upper panel) and the patient group (PG)—(lower panel) in individual phases of the study (in order from left to right).
Applsci 15 12368 g001
Figure 2. Accuracy distribution depending on model and time since patch removal.
Applsci 15 12368 g002
Figure 3. Precision distribution depending on model and time since patch removal.
Applsci 15 12368 g003
Figure 4. Recall distribution depending on model and time since patch removal.
Applsci 15 12368 g004
Figure 5. F1-Score distribution depending on the model and time since patch removal.
Applsci 15 12368 g005
Figure 6. Distribution of AUC depending on the model and time after patch removal.
Applsci 15 12368 g006
Figure 7. Trends in performance metrics across the study phases for five deep learning models.
Applsci 15 12368 g007
Table 1. Eligibility Criteria for Study Participation in Patient and Control Groups.
Inclusion Criteria
Group of patientsControl group
  • Informed written consent to participate in the study
  • Women and men aged 18–50
  • Diagnosis of schizophrenia or bipolar disorder according to DSM-5 criteria
  • Informed written consent to participate in study
  • Women and men aged 18–50
Exclusion criteria
  • Lack of consent to the examination
  • The presence of diseases that may affect vascular tone (e.g., diabetes, vasculitis, chronic hypertension), skin diseases, autoimmune, cancer, cardiovascular diseases, and other somatic diseases in an unstable phase or active inflammation
  • Current use of antibiotics, lipid-lowering drugs, antihistamines, anti-inflammatory drugs, and drugs that change the calcium metabolism
  • Use of supplements such as omega-3 fatty acids or other substances/isolated nutrients affecting lipid metabolism” within the three months before study
  • Use of vitamins or a dietary supplement containing niacin dose above 100 mg/day
  • Allergies, including known allergy to the test compound
  • Presence of diagnosed neurodegenerative or structural brain disease (e.g., epilepsy, multiple sclerosis, traumatic brain injury with residual symptoms
  • Addiction other than to nicotine and/or caffeine
  • The occurrence of major mental disorders other than schizophrenia or bipolar disorder according to DSM-5
  • Pregnancy or breastfeeding
  • Lack of consent to the examination
  • The presence of diseases that may affect vascular tone (e.g., diabetes, vasculitis, chronic hypertension), skin diseases, autoimmune, cancer, cardiovascular diseases, and other somatic diseases in an unstable phase or active inflammation
  • Current use of antibiotics, lipid-lowering drugs, antihistamines, anti-inflammatory drugs, and drugs that change the calcium metabolism
  • Use of supplements such as omega-3 fatty acids or other substances/isolated nutrients affecting lipid metabolism” within the three months before study
  • Use of vitamins or a dietary supplement containing niacin dose above 100 mg/day
  • Allergies, including known allergy to the test compound
  • Presence of diagnosed neurodegenerative or structural brain disease (e.g., epilepsy, multiple sclerosis, traumatic brain injury with residual symptoms)
  • Addiction other than to nicotine and/or caffeine
  • Major mental disorders according to DSM-5
  • The prevalence of mental illness in the family
  • Pregnancy or breastfeeding
Table 2. Demographic and clinical characteristics of the study participants, including statistical differences between the patient group (schizophrenia and bipolar disorder) and healthy controls.
Patients
N = 105
Healthy Control
N = 83
Differences
(p-Value)
N (%)
Gender [females]52 (49.52)51 (61.45)0.134
Cigarettes [smokers]31 (29.52)11 (13.25)0.178
Somatic conditions [yes]22 (20.95)23 (27.71)0.388
Psychoactive substances [users]26 (24.76)25 (30.12)0.521
Median (Min–Max)
Age [years]26 (15–54)24 (19–32)0.342
BMI [kg/m2]24.82 (17.64–37.89)22.79 (18.07–35.38)0.002
Physical activity [min/week]0 (0–1370)47 (0–642)0.005
Duration of illness [years]5 (1–29)N/AN/A
Hospitalizations [number]2 (0–17)N/AN/A
OLA equivalents
[to 1 mg OLA]
26 (0.71–129)N/AN/A
PANSS [total points]73 (34–144)N/AN/A
N—number, OLA equivalents—Total daily antipsychotic dose converted to olanzapine equivalents (mg/day), PANSS—Positive and Negative Syndrome Scale, BMI—Body Mass Index, N/A—not available, p-value—probability value.
Table 3. Mean values of model evaluation metrics for frame_01.
AccuracyPrecisionRecallF1-ScoreAUC
ResNet500.87 ± 0.040.87 ± 0.040.87 ± 0.040.87 ± 0.040.94 ± 0.01
ResNet1010.84 ± 0.060.83 ± 0.060.84 ± 0.060.83 ± 0.060.89 ± 0.04
EfficientNetB00.78 ± 0.030.79 ± 0.030.78 ± 0.040.78 ± 0.040.90 ± 0.01
InceptionV30.86 ± 0.050.86 ± 0.050.86 ± 0.060.86 ± 0.060.94 ± 0.02
DenseNet1210.86 ± 0.040.86 ± 0.050.86 ± 0.050.86 ± 0.040.92 ± 0.01
Table 4. Mean values of model evaluation metrics for frame_10.
AccuracyPrecisionRecallF1-ScoreAUC
ResNet500.86 ± 0.020.86 ± 0.020.86 ± 0.020.86 ± 0.020.93 ± 0.01
ResNet1010.82 ± 0.070.82 ± 0.070.82 ± 0.070.82 ± 0.070.91 ± 0.04
EfficientNetB00.83 ± 0.080.84 ± 0.070.82 ± 0.090.82 ± 0.090.91 ± 0.05
InceptionV30.89 ± 0.010.89 ± 0.010.89 ± 0.020.89 ± 0.010.94 ± 0.02
DenseNet1210.85 ± 0.040.85 ± 0.040.85 ± 0.040.85 ± 0.040.92 ± 0.03
Table 5. Mean values of model evaluation metrics for frame_20.
AccuracyPrecisionRecallF1-ScoreAUC
ResNet500.87 ± 0.020.87 ± 0.020.88 ± 0.020.87 ± 0.020.94 ± 0.01
ResNet1010.85 ± 0.080.85 ± 0.090.85 ± 0.080.84 ± 0.080.91 ± 0.04
EfficientNetB00.84 ± 0.040.84 ± 0.040.84 ± 0.040.83 ± 0.040.93 ± 0.03
InceptionV30.83 ± 0.050.83 ± 0.050.83 ± 0.040.83 ± 0.050.92 ± 0.02
DenseNet1210.84 ± 0.020.84 ± 0.030.84 ± 0.020.84 ± 0.020.92 ± 0.01
Table 6. Mean values of model evaluation metrics for frame_30.
AccuracyPrecisionRecallF1-ScoreAUC
ResNet500.90 ± 0.020.90 ± 0.020.90 ± 0.020.90 ± 0.020.95 ± 0.02
ResNet1010.86 ± 0.060.85 ± 0.060.85 ± 0.060.85 ± 0.060.92 ± 0.04
EfficientNetB00.83 ± 0.090.83 ± 0.090.83 ± 0.090.83 ± 0.090.91 ± 0.03
InceptionV30.88 ± 0.050.89 ± 0.040.89 ± 0.040.88 ± 0.050.95 ± 0.02
DenseNet1210.87 ± 0.020.87 ± 0.030.87 ± 0.030.86 ± 0.020.94 ± 0.02
Disclaimer/Publisher’s Note: The statements, opinions and data contained in all publications are solely those of the individual author(s) and contributor(s) and not of MDPI and/or the editor(s). MDPI and/or the editor(s) disclaim responsibility for any injury to people or property resulting from any ideas, methods, instructions or products referred to in the content.