Article

Investigation of the Wheel Power and State of Charge of Plug-In Hybrid Electric Vehicles (PHEVs) on a Chassis Dynamometer in Various Driving Test Cycles

1
Department of Mechanical Engineering, Faculty of Engineering, Princess of Naradhiwas University, Narathiwat 96000, Thailand
2
Department of Aeronautical Engineering and Commercial Pilot, International of Academy Aviation Industry, King Mongkut’s Institute of Technology Ladkrabang, Bangkok 10520, Thailand
*
Author to whom correspondence should be addressed.
Appl. Sci. 2025, 15(22), 12320; https://doi.org/10.3390/app152212320
Submission received: 25 March 2025 / Revised: 17 November 2025 / Accepted: 17 November 2025 / Published: 20 November 2025

Abstract

The purpose of this study is to monitor the battery performance of plug-in hybrid electric vehicles (PHEVs) on a chassis dynamometer using the US06, NEDC, and EPA highway driving cycles. The chassis dynamometer simulates vehicle operation and driving conditions and allows for precise simulation of pre-defined driving cycles, including simulations of acceleration, deceleration, stopping, and re-acceleration on the road. In the case of the US06 driving cycle, the results for (EV mode) compared with energy consumption during electric testing revealed a consistent decrease in the SOC (state of charge) due to the rapid response of the electric motor distribution to the changing power, as well as electric power fluctuations during driving conditions. Under the NEDC, the test results for electric power (EV) compared with energy consumption during electric testing revealed that the SOC gradually decreased at the start of the test due to low driving speeds. Towards the end, at around 800 s, an increase in driving speed resulted in a noticeable drop in SOC. The electric power varied during the driving cycle in this test due to the motor’s rapid response to changes in power distribution while driving. For the EPA Highway driving cycle test, the test results for electric power (EV) compared with energy consumption during continuous electric testing indicated a gradual decrease in the SOC at first due to low driving speeds. As the driving speed increased after about 300 s, the SOC rapidly decreased. Because of the motor’s quick response to changes in the power distribution while driving, the electric power varied according to the driving cycle.

1. Introduction

Recent climate change issues have been largely driven by pollution from combustion engines. This has become an increasingly important topic of concern. Due to high oil prices, oil dependency, and climate change, both policymakers and the automobile industry have been evaluating alternative strategies for passenger transportation. Carbon dioxide, a major greenhouse gas, contributes to heat retention and atmospheric degradation, increasing global temperatures, and thus leading to climate change. To address this, electric motors have been developed to work in parallel with traditional engines, resulting in plug-in hybrid electric vehicles (PHEVs). These vehicles are designed to have reduced fuel consumption and to lower the emission of exhaust gas into the atmosphere via the use of rechargeable storage batteries, offering a possible approach to reducing lifecycle GHG emissions and the dependency on oil as a transportation fuel [1,2]. Additionally, small-capacity PHEVs are less expensive and emit fewer greenhouse gases than hybrid electric vehicles (HEVs) or conventional vehicles when they are powered by US electricity and need to be recharged every 32 km or less. While PHEVs release less Greenhouse Gases (GHGs) during moderate charging intervals of 32–160 km, HEVs have reduced lifetime costs. Small-capacity PHEVs would be cost-competitive for a broad spectrum of drivers if high petroleum prices, low-cost batteries, and high carbon taxes were combined with low-carbon electricity generation [3]. Toyota introduced the Prius in 1997, which was the first successful commercial hybrid vehicle. It has an internal combustion engine coupled with an electric motor which is rechargeable when in motion. The SAE J1711 test standard [4] defines testing procedures to enhance the accuracy of the test, and the updated testing procedure named S-factor adjustment to reduce the requirement of multiple test rounds to do due to varying energy in the battery. This reflects the advancements in HEV and PHEV technology. Other test procedures include chassis dynamometer tests designed to simulate public road conditions for HEVs and PHEVs. Exhaust emissions can be measured and fuel efficiency can be calculated using test cycles such as the complex US06 cycle, which emphasizes precision in each driving cycle. When the vehicle enters into a charge-sustaining (CS) mode according to the End-of-Test (EOT) criteria, the test is terminated and allows a comprehensive evaluation of the hybrid or electric system functionality. In case of any problems during the testing like the vehicle is not functioning or a low warning on the rechargeable energy storage system (RESS), they are considered to be inaccurate and are supposed to be retested again to resolve the problem. Once the testing is completed, it is mandatory that the charging processes be initiated within a period of 3 h and last at least 12 h or until they are complete. The total amount of AC energy used for charging is recorded in detail to ensure comprehensive data. The aim of this process is to simplify vehicle testing, particularly for electric energy and charging test, by allowing data to be reused in subsequent tests without having to repeat certain steps. Test results have shown that the state of charge (SOC) decreases with each US06 driving cycle, with brief pauses allowing for some recovery. The SOC eventually enters a charge-sustaining mode, in which a stable charge level is maintained near the end of the testing process.
Xinglong et al. [5] discussed the transition from the New European Driving Cycle (NEDC) to the Worldwide Harmonised Light Vehicle Test Procedure (WLTP) and how it affects the energy consumption of Plug-in Hybrid Electric Vehicles (PHEVs), finding that it impacts NEV (New Energy Vehicle) credit regulations and PHEV support policies in the Chinese market. Six PHEVs received partial subsidies after their All-Electric Range (AER) decreased to 43 km due to increased Fuel Consumption (FC) in Charge-Sustaining (CS) mode, rendering them ineligible for full subsidies, according to qualitative analysis and quantitative calculations. Other four PHEVs failed to comply with the requirements: two of them failed due to their lower AER of less than 43 km, the rest performed too much FC in CS mode. Comparison of NEDC and WLTP showed that there are major differences. To begin with, the new testing conditions drastically lowered the AER of PHEVs, implying that they did not comply with the PHEV policies of China, which influenced their eligibility to qualify as NEV credits and subsidies. Second, the new test process was found to consume more energy in CD and CS modes, which once more disqualified PHEVs to receive NEV credit multipliers and subsidies. Nevertheless, Chinese government has remained favorable to the development of PHEVs and has revised the AER test to 43 km, which allows PHEVs to meet the technical specifications and that the vehicles qualify to drive under the NEV conditions and subsidies of the new testing process. Chen et al. [6] applied reinforcement learning to research an energy management approach to a power split plug-in hybrid electric vehicle (PHEV). It was found that the best solution was found with the RL approach that relies on the Markov decision process (MDP) after a control-oriented power-split PHEV model was built. The probability of power being transferred as a result of a power demand was calculated by the Markov chain as different driving patterns are evaluated. Thereafter, the optimum control strategy in relation to energy allocation between the battery cell and the petrol engine was computed based on the Q-learning (QL) technique. Compared to the similar consumption minimization strategy (ECMS) and charging depletion/charging maintenance (CD/CS) method, the RL-based control strategy has the ability to constrain the maximum discharge power of the battery and can minimize fuel consumption in a wide range of driving conditions. These findings were supported by the simulation findings. In 2018, Xiao [7] and colleagues compared and contrasted a number of different approaches to energy management for a parallel plug-in hybrid electric vehicle (PHEV).
Quadratic convex functions are used to characterize the nonlinear relationships that exist between the engine fuel rate and the battery charging power for a variety of vehicle velocities and power demands. This relationship is determined by an analysis of the vehicle driveline. Both the simulated annealing (SA) approach and the convex optimization algorithm have been utilized to estimate the engine on power threshold and achieve battery power command, respectively. In comparison with the methods that are based on dynamic programming (DP) and charge depleting–charge sustaining (CD/CS), the goal of this method is to improve fuel economy. In addition, control methods have been assessed for a number of different initial battery state of charge (SOC) values in preparation for the potential expansion of the application in the future. In an unexpected turn of events, the results of the simulation revealed that the proposed convex optimization technique was able to lower the computing cost and conserve gasoline.
Kan Chaisuwan [8] conducted research analyzing the energy usage of two PHEV models in Bangkok, comparing the BMW 330e (referred to as PHEV1) and the Mercedes-Benz C350e (referred to as PHEV2). They concluded that using PHEVs can significantly save energy: PHEV1 showed an energy saving of 67.6%, depending on the charging frequency, while PHEV2 saved 53.9% when public charging stations were available. Electric vehicles (BEVs) demonstrated up to 86% energy savings compared with conventional vehicles. Without charging, PHEV1 and PHEV2 could still save 30.9% and 32.6% of energy, respectively, while charging daily or once before driving provided energy savings of 35.7% for PHEV1 and 18.5% for PHEV2. To maximize PHEV benefits, charging at least once a day was recommended.
S.I. Ehrenberger et al. [9] tested the actual energy consumption and emissions of plug-in hybrid electric car models (PHEV) and found the complicated outcomes in various driving settings. Three PHEV models were tested in different conditions of operation and temperature, and the initial state of charge (SOC) was discovered to have a strong influence on CO2 emissions and reduced with the percentage of electric driving in the model. The hybrid driving strategy also influenced the fuel efficiency as the emission level was determined by the conditions in which the internal combustion engine operated. In certain situations, the electric driving proportion was higher when the emissions were more in Real Driving Emissions (RDE) tests. Moreover, the laboratory testing results were not as different as real-world driving emission measurements. The decision to use alternative driving modes and engine cold starts when driving in electric mode added complexity to PHEVs and rendered it difficult to evaluate the benefits of using this technology in terms of the emissions. Roads under RDE tests were categorized into three, namely urban, rural, and motorway roads that were characterized by differences in speed, thereby exhibiting differences in CO2 emissions. In WLTC tests, the driving cycle was segmented into parts on which classification was done. There were some consistencies in the findings of both testing methods. To illustrate, CO2 emissions of one of the models of PHEV were higher than the approved NEDC of 36 g/km and were in the range of 60–150 g/km. It is important to note that the CO2 emissions also grew rapidly as the test progressed, starting with a fully charged battery, and, thereby, higher CO2 emissions were observed.
The hybrid (HEV), plug-in hybrid (PHEV), and electric (EV) vehicles were developed and tested by Michael Duoba [10], to compare their performance and emission characteristics, range of which is the efficiency of the electric driving. The aim was to establish correct driving test standards to determine the performance of HEV, PHEV and EV in the real world situation. They analyzed the battery energy consumption (kWh) and fuel consumption (fuel volume) of PHEVs in different driving conditions, such as UDDS (urban driving), HWY (highway driving), and US06 (high-energy driving with a high acceleration rate). The results showed that the US06 mode consumed the most energy for both electricity and fuel, whereas UDDS and HWY used less energy when covering the same distance.
Nevius et al. [11] collected exhaust samples from PHEVs under real-world driving conditions using partial-flow sampling systems such as the Bag Mini-Dilutor (BMD), maintaining a 5:1 dilution ratio throughout testing. The BMD dilutes exhaust with clean air, reducing the need for adjustment due to environmental pollutants. However, problems arose with the BMD because the internal combustion engine did not always run properly during tests, resulting in insufficient exhaust samples for accurate gas analysis.
To improve the accuracy of PHEV testing, improvements were made to the hardware and software of the Constant Volume Sampling (CVS) model CVS-7200SLE system and BMD. The partial-flow sampling system comprises a BMD-1000 bag minidiluter in conjunction with an EXFM-1000 ultrasonic exhaust flow meter. The emission data from the improved equipment were compared with standard CVS and BMD sampling results. Post-test data showed that the BMD successfully recovered 100% of the predicted CO2 mass at diluted exhaust volumes of at least 2.5 dm3 and recovered over 99% at 2.5 dm3, with high efficiency even at dilution ratios of up to 35%.
While robust methodologies for physically characterizing PHEV emissions in various driving states have been established in the preceding work, achieving optimal real-world efficiency and minimal emissions also requires dynamic, intelligent control over the vehicle’s powertrain and energy storage system Machine learning (ML) [12,13] techniques are increasingly being used to manage power and charge states in plug-in hybrid and electric vehicles to enable more accurate, adaptive, and optimized battery management and energy distributions. ML models can analyze vast amounts of real-time and historical vehicle and battery data including voltage, current, temperature, and driving patterns—to predict the battery’s state of charge (SOC) and state of health (SOH) with high precision. These predictions help to optimize charging cycles and power distribution between the battery and internal combustion engine while accounting for dynamic conditions such as temperature changes, battery aging, and varying driving demands. Advanced ML approaches such as deep reinforcement learning, neural networks, and multi-agent learning have been applied to improve energy management strategies, resulting in reduced fuel consumption, enhanced battery longevity, and increased overall vehicle efficiency. For instance, recent studies demonstrate that multi-agent deep reinforcement learning can optimize multi-mode PHEV energy management, achieving significant energy savings compared with conventional rule-based systems. ML also supports adaptive charging strategies that adjust charging rates in real time based on the predicted SOC, grid load, and renewable energy availability, thereby maximizing battery health and minimizing energy waste. These capabilities position ML as a transformative tool for next-generation battery management systems for electric and hybrid vehicles, improving their performance and sustainability.
The review of previous research has highlighted key factors that affect the operation range of engines considering reducing energy use in electric motors. Analyses and tests have focused on the energy consumption of internal combustion engines and electric motors, as well as their emissions while driving on flat and elevated roads, with most of them highlighting their environmental impacts. To date, no studies have tested plug-in hybrid electric vehicles (PHEVs) under the US06 and NEDC standards [14] using a chassis dynamometer under simulated real-world driving conditions. Such tests can measure vehicle performance and emissions, including CO, CO2, HC, and NOx, in different driving modes: internal combustion engine (ICE), hybrid (HEV), and electric (EV). Most research has been predictive or focused on comparing driving at various temperatures, and there are no relevant studies in Thailand. Therefore, the objectives of this research study are to examine the performance of PHEVs as an alternative to conventional fuel vehicles, understand their power accessibility, analyze the net energy changes in an internal combustion engine, and analyze the battery’s state of charge in simulated scenarios on a chassis dynamometer.
The study also aims to quantitatively compare the maximum and average sustained wheel power of the PHEV’s powertrain across the high-load (US06) and moderate-load (NEDC) driving cycles, particularly focusing on the powertrain’s ability to meet peak demand in a charge-sustaining (CS) model and to quantify and compare the resulting state of charge (SOC) and wheel horse power operational modes of the chassis dynamometer under the US06 NEDC and EPA driving cycles.

2. Research Methodology

This part moves out of the description of the comparative objectives of the study and into the description of the particular tools and procedures applied in the experiment. A logical approach is used to achieve a quantitative evaluation of the powertrain maximum and sustained wheel power in both high-load (US06) and moderate-load (NEDC) driving cycles and also to assess its capabilities to sustain charges. Strict and repeatable chassis dynamometer testing procedures are used, at which the accurate measurement of state of charge (SOC) and wheel horsepower output have been obtained in the case of US06, NEDC, and EPA driving cycles. The study provides an opportunity to compare work modes validly and analyze powertrain performance efficiently by setting the specific procedures and control parameters.

2.1. Experimental Tools

The research technique used in this study consisted of conducting trials on a plug-in hybrid electric vehicle (PHEV) with the technological specifications listed in Table 1. Fuel easily accessible in the market (gasoline) was used to power the vehicle’s drivetrain. The test vehicle is a 2022 plug-in hybrid electric vehicle (PHEV) with a sophisticated powertrain architecture. It has a curb weight of 1800 kg and features a dual-power configuration comprising a turbocharged 1.5 cm3 three-cylinder benzene engine (180 PS/5800 rpm, 265 Nm torque) coupled with an 82 PS electric motor. The lithium-ion traction battery provides a 10.7 kWh capacity, enabling a combined system output of 262 PS. Notably, the drivetrain utilizes seven-speed dual-clutch automatic transmission with geartronic technology. It has E10 fuel compatibility, 1.477 cm3 displacement, and emits 52 g/km of CO2 emissions, demonstrating the vehicle’s efficiency, and these factors were considered in performance evaluation. This comprehensive setup enabled systematic evaluation of vehicle performance. The experiments were carried out on a chassis dynamometer that was located inside a climate-controlled chamber under real-world road conditions in the city of Rzeszow, Poland. Bench experiments were carried out in the Automotive Emissions Laboratory, which is part of the Department of Mechanical Engineering within the Faculty of Engineering at Princess of Naradhiwas University in Thailand. These experiments were carried out between October and December of 2024. A Maha MSR 500 chassis dynamometer interface with MAHA driving simulation software version VZ 911150 were placed into the climate chamber. This dynamometer has the capacity to generate a force of 6000 Newtons and a resistance of up to 260 kilowatts. The engine was subjected to hot start conditions while the bench experiments were conducted, and the coolant temperature was kept at 94 ± 2 °C by OBD data throughout the process.
The temperature in the room was maintained in the range of 30–33 °C and the atmospheric pressure was in the range of 1003–1006 hPa. The air entering the intake manifold was cooled by air conditioning to an inlet temperature of 25 ± 2 °C. A chassis dynamometer was used to test the vehicle’s performance, efficiency in controlled settings. The experiment tested two important components: the on-board diagnostics (OBD) system, Autel Model MS505 16 pin connector, the chassis dynamometer gathering data for each component is critical for vehicle assessment. Before beginning the test, the car was firmly positioned on the dynamometer rollers to prepare the vehicle and connect the on-board diagnostics (OBD). The OBD system was then linked to an electronic control unit (ECU) to monitor metrics such as engine speed, fuel consumption, sensor, and SOC data in real time.
This system provides critical information on vehicle performance, which was displayed on a monitor for analysis.
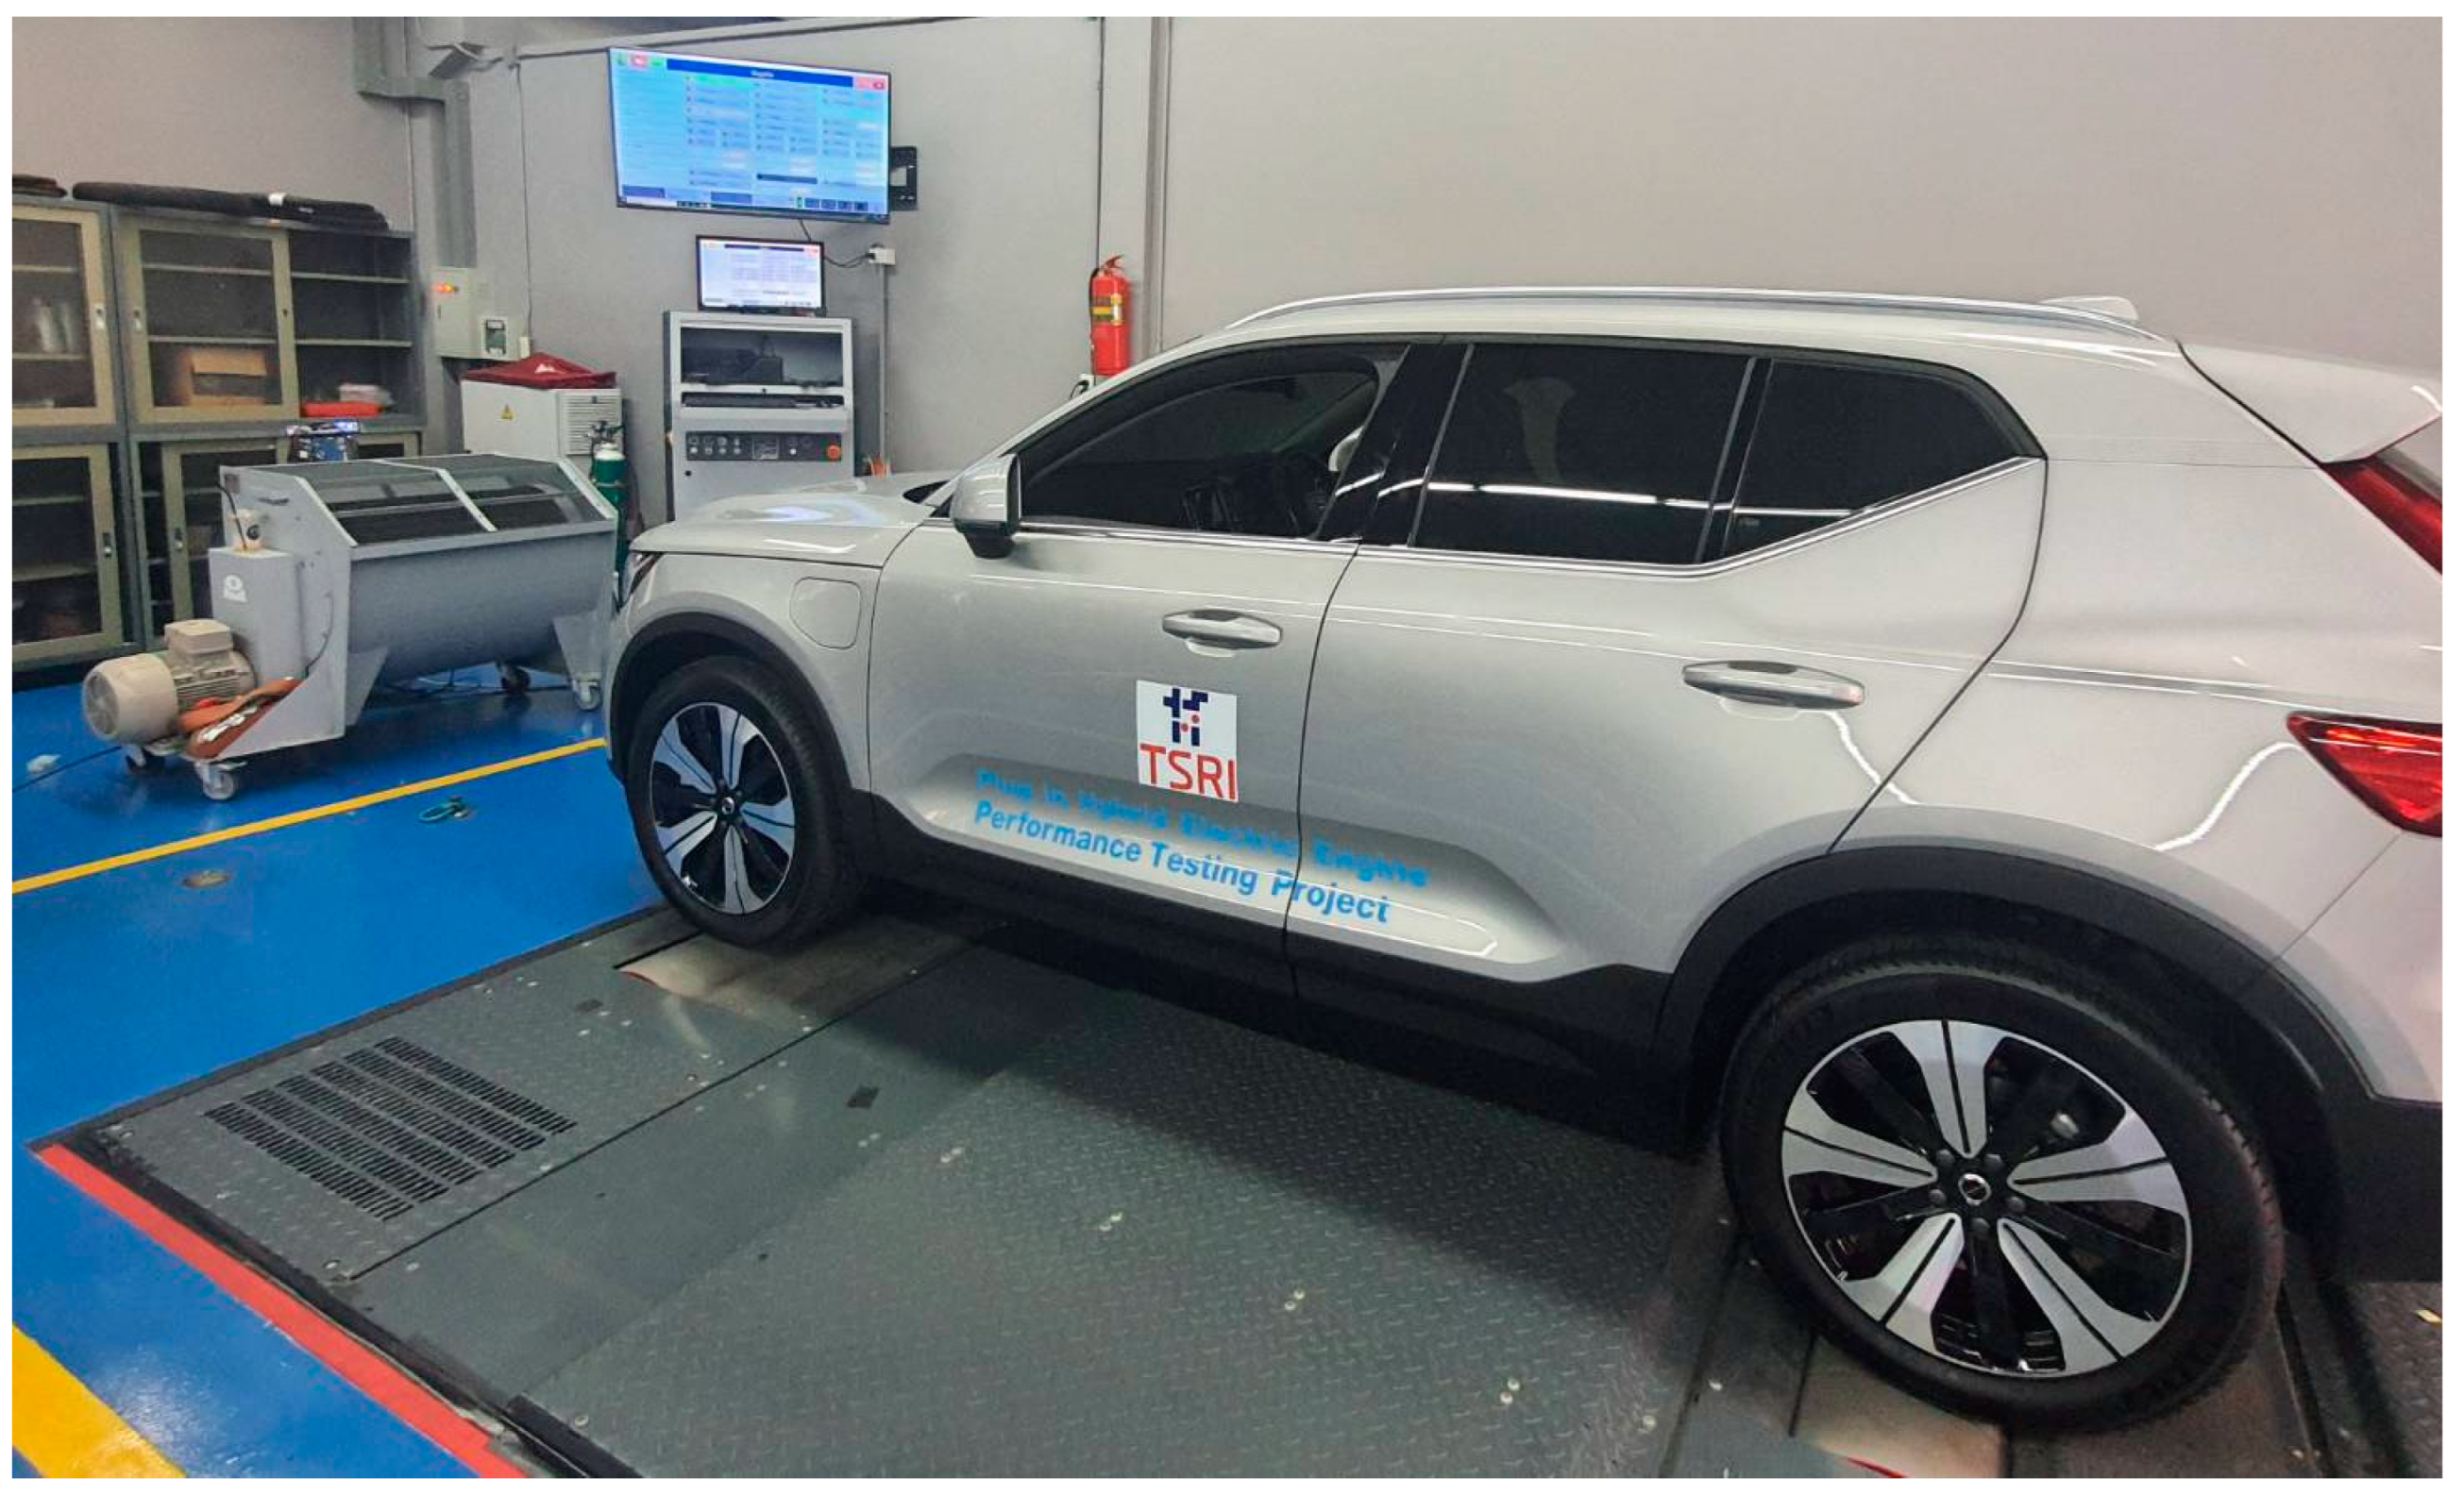
The chassis dynamometer testing procedure is shown in Figure 1. Once the vehicle is in position, the dynamometer (1) simulates actual road conditions by allowing the wheels to rotate on a set of rollers with variable resistance. A driver operates the vehicle, following a predefined speed and load based on various driving cycles, enabling consistent and repeatable experiments. Throughout this process, torque, power output, acceleration, and braking performance are recorded to assess overall efficiency and mechanical response. The analyzer transmits the results to a display unit for review. (2) indicates the air-conditioning system integrated with a fan, used to ensure thermal consistency during testing, while (3) is an on-board diagnostics (OBD) system that monitors the vehicle’s operational parameters, including the state of charge (SOC), providing real-time data for analysis. Finally, (4) is a dynamometer system, programmed to simulate road resistance and driving conditions via a computer, ensuring accurate replication of real-world scenarios. The test PHEV is shown in Figure 2. It was positioned on the dynamometer testing platform within a controlled laboratory environment to precisely measure its power delivery under standardized driving cycles, providing comprehensive data for performance evaluation.

2.2. Experimental Setup and Test Conditions

Dynamometer Configuration

The chassis dynamometer is a dual-roll electric dynamometer with road-load simulation capabilities. The road load was calibrated by applying coast-down coefficients derived from MAHA road coast-down procedures to match the inertial mass to the vehicle’s test weight using flywheels or electronic simulation. Environmental controls: The lab temperature was maintained at 20–30 °C with ±2 °C stability with air conditions. The battery was preconditioned using manufacturer-specified protocols to ensure the PHEV battery was fully charged, while fuel/fluid conditioning was performed using certification gasoline and engine oil meeting the EPA Tier 3 standards [14]. Before vehicle testing, 12 h of thermal stabilization at 20–25 °C was performed for each test and test cycle. The SOC was recorded using an OBD-II/CAN bus at 10 Hz resolution under test conditions.
The driving cycle tests, in which the distance, time, and speed are set according to emission testing standards, are designed to measure emissions and fuel efficiency under realistic driving simulations. The three driving cycles—US06, NEDC, and EPA Highway [12] correspond to both urban and highway driving scenarios, as shown in Table 2.
In this test, two modes were examined—the hybrid or HEV mode and the electric vehicle (EV) mode under the speed conditions specified in Table 2. The measurements for the evaluation and analysis of the PHEV included wheel power output and state of charge (SOC).
In this experiment, the tests were repeated 4 times for each 95% engineering confidence level to ensure the reliability of mean value in the experimental results.

3. Results and Discussion

3.1. US06 Driving Cycle

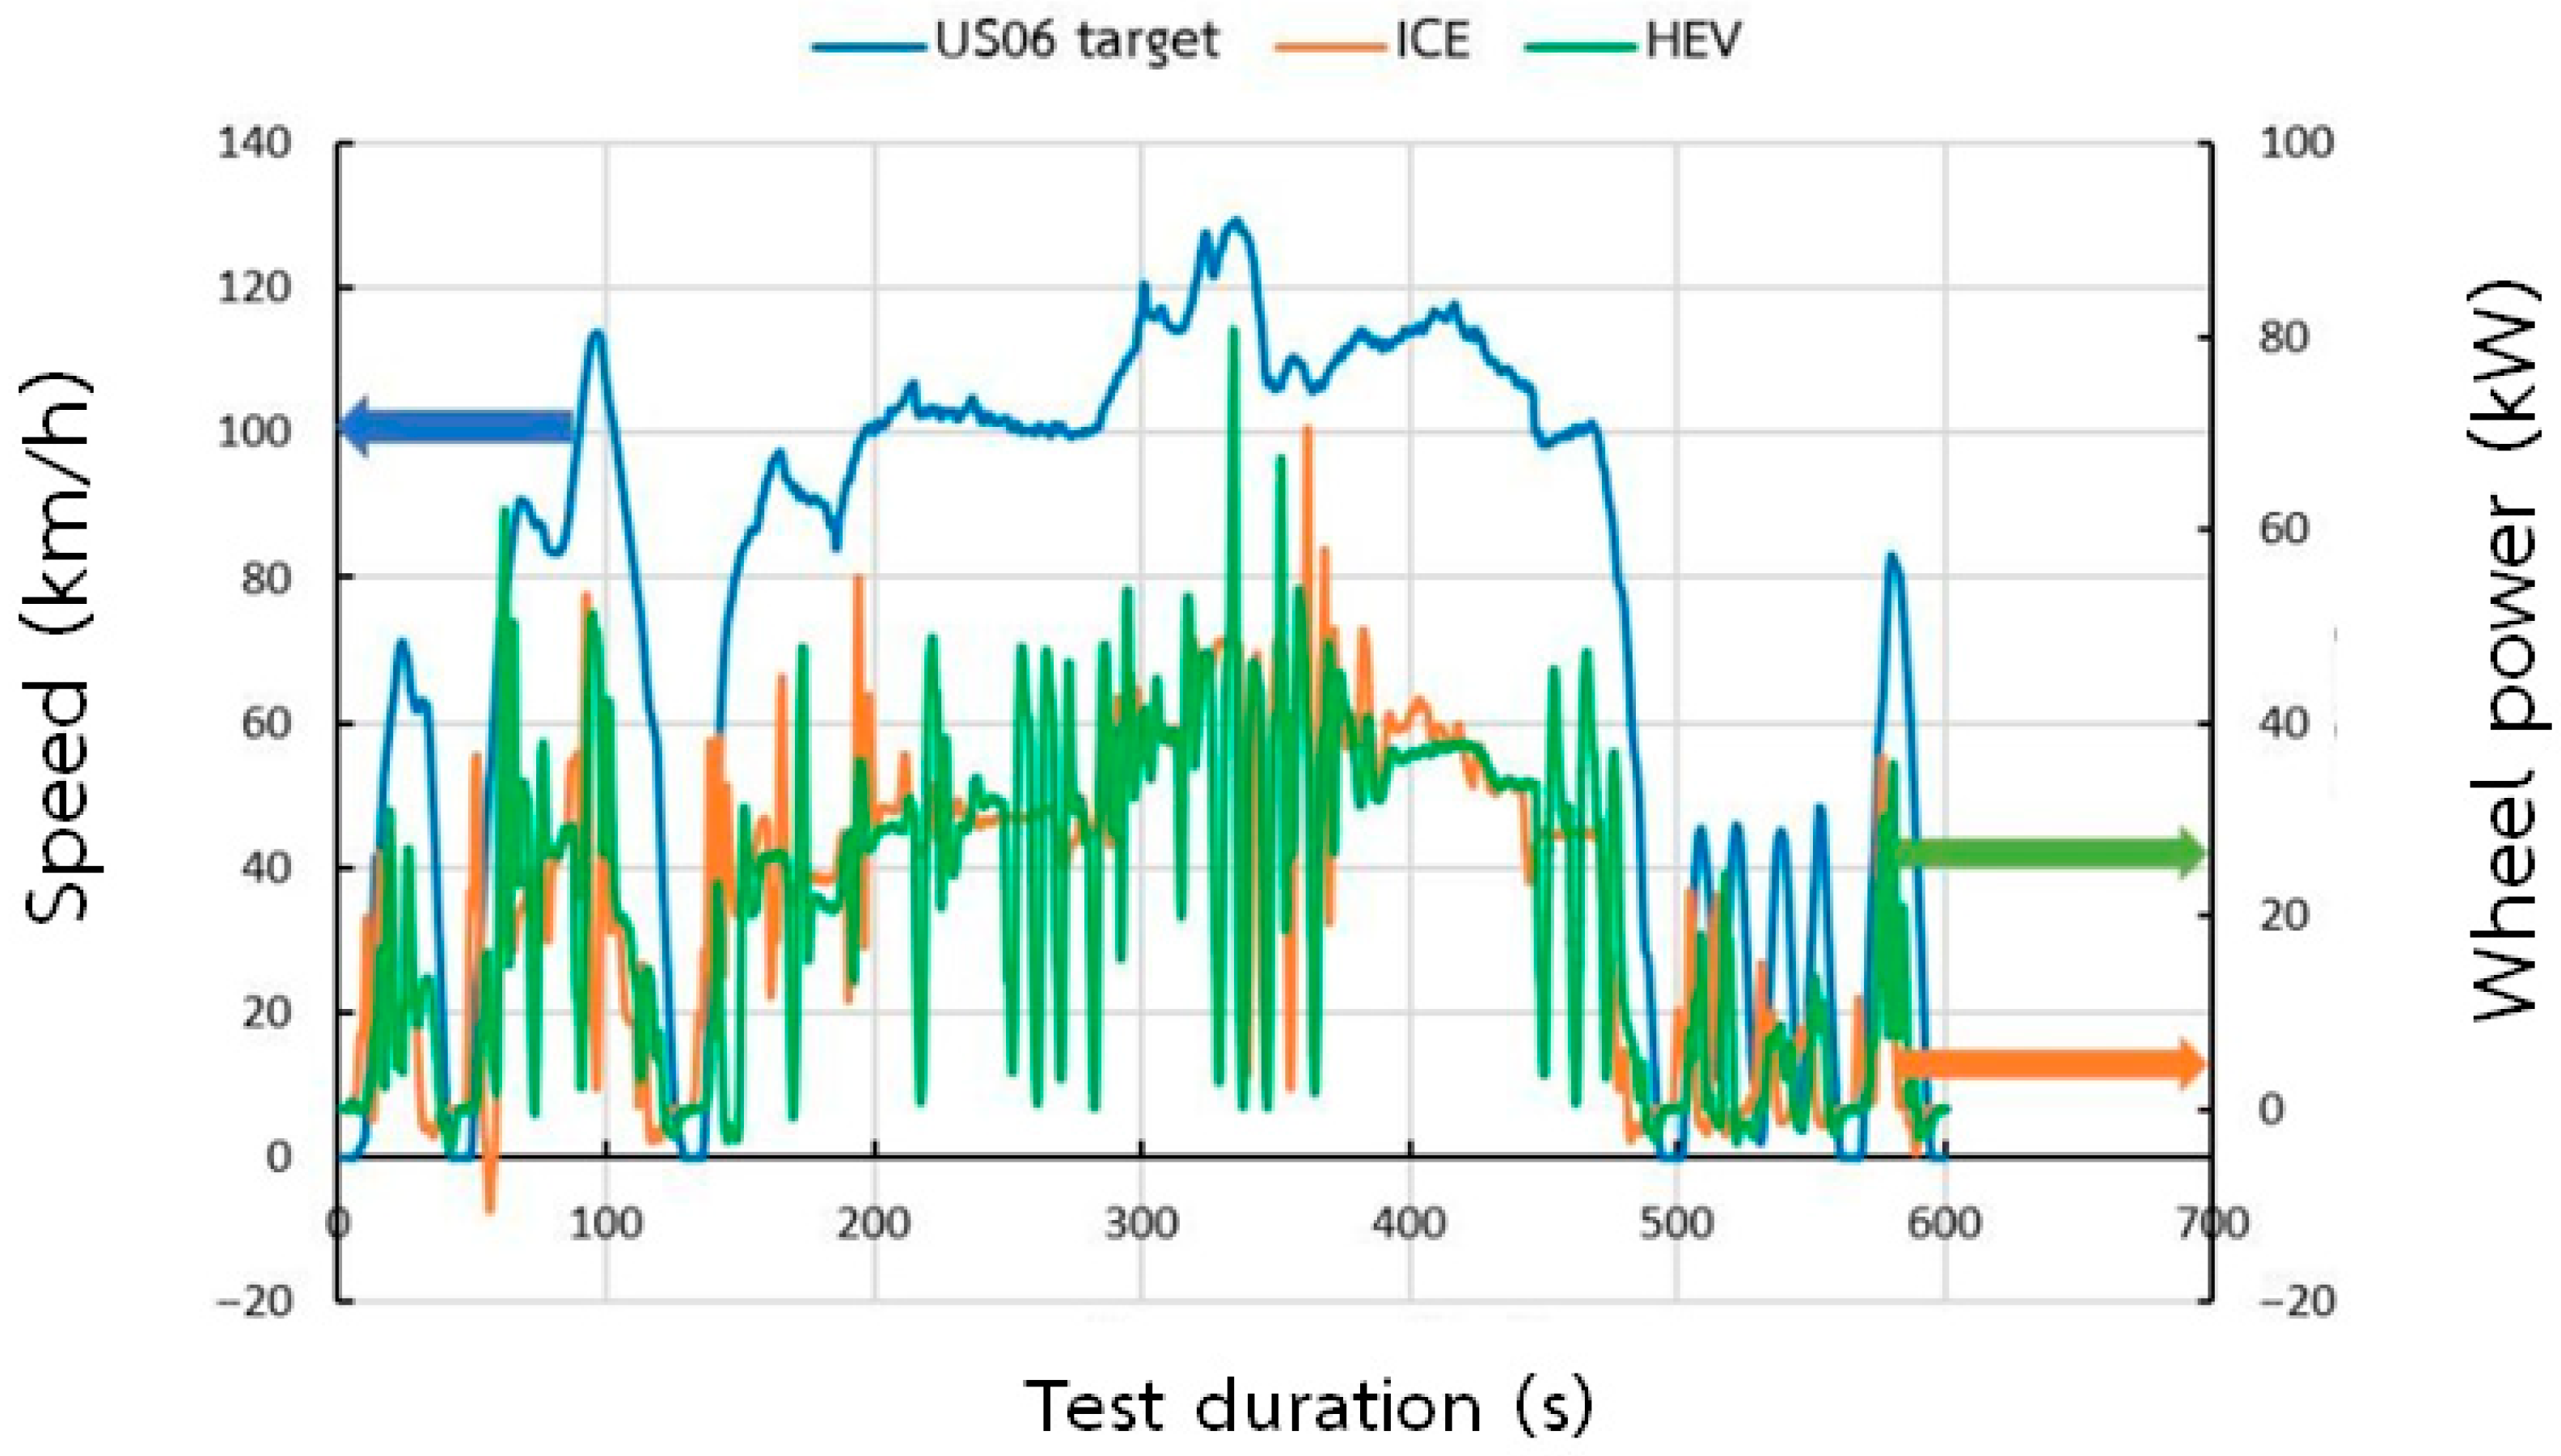
The engine power (ICE) in HEV mode was compared with hybrid mode power (HEV) under the speed and time conditions of the US06 driving cycle (Figure 3). It was observed that the engine power response was slower due to the time needed for the engine RPM to increase. In contrast, the hybrid mode, which features an electric motor for additional power, showed faster response times.
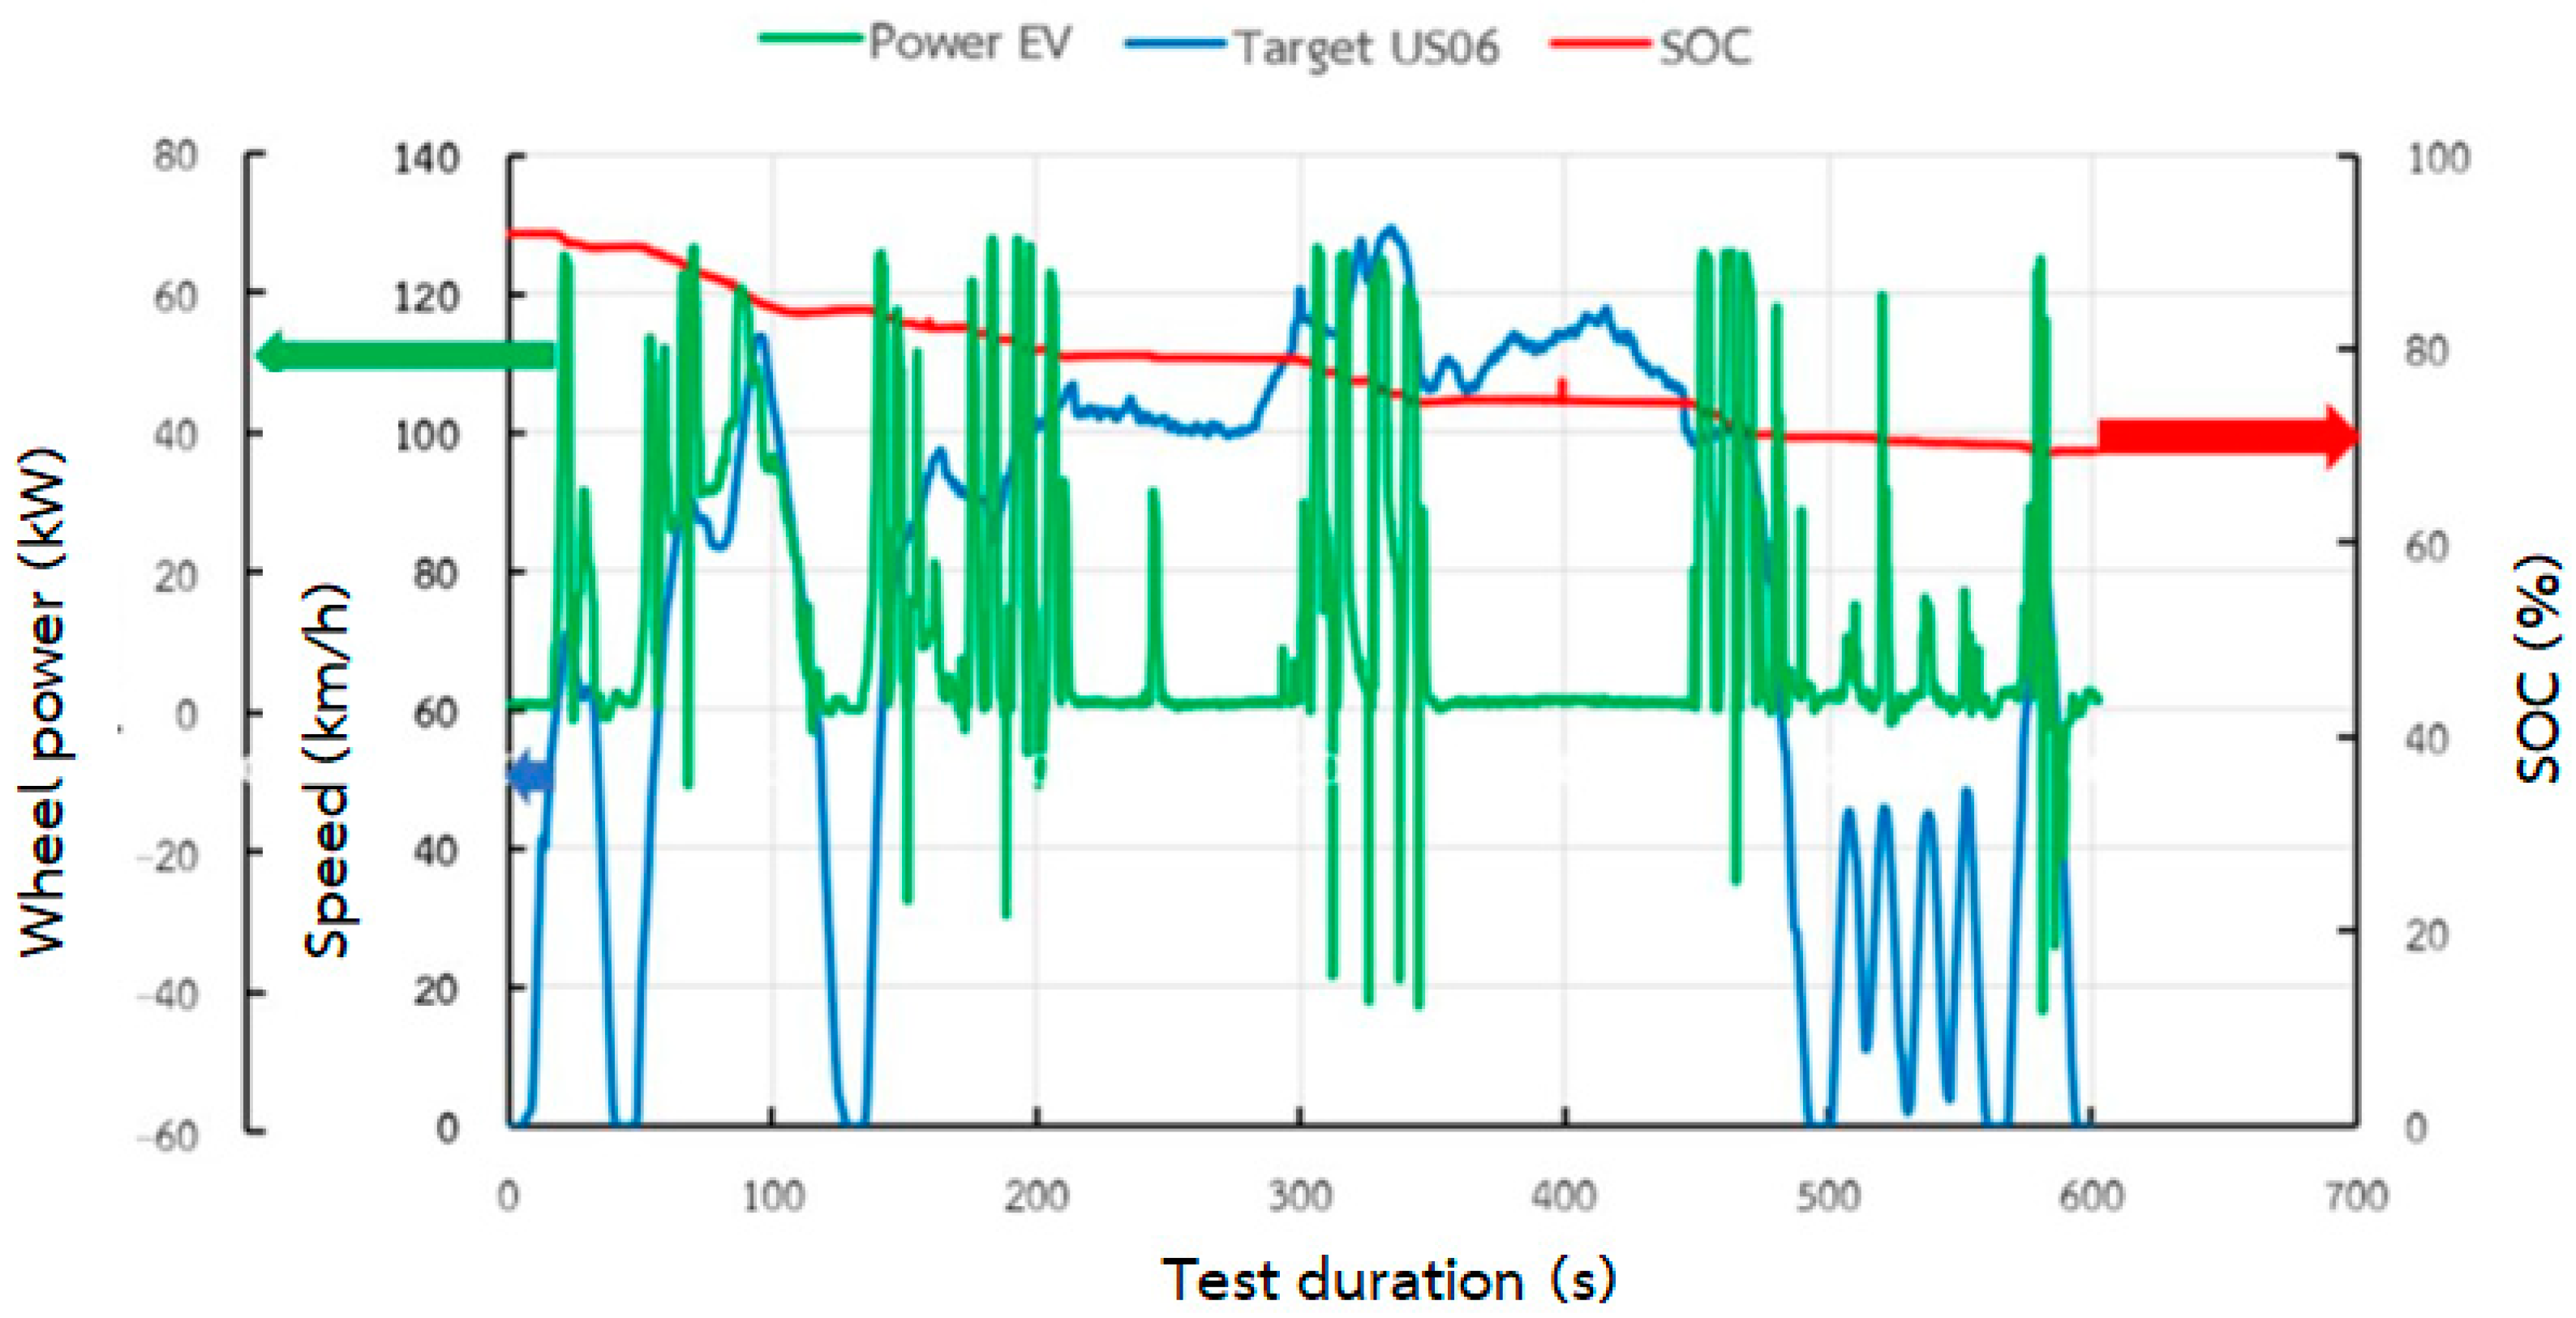
The electric power was compared with energy consumption (SOC) in electric vehicle (EV) mode under the speed and time parameters of the US06 driving cycle, as shown in Figure 4. The results show that wheel power changes depending on the driving conditions. This is because the electric motor quickly adjusts to variations in energy supply while driving, which means that SOC is always affected; about 22.6% of charge was used in this test. Roland et al. [15] conducted research with the aim of reducing CO2 emissions from cars by 37.5% and mitigating the greenhouse effect to meet Euro 6d standards [14], focusing on two PHEV models and comparing them with both diesel and gasoline internal combustion engines. Tests were carried out in both laboratory (chassis dynamometer) and real-world settings using standard and alternative fuels in both charge and charge-sustaining modes. They found that PHEV performance depends upon various conditions, such as the laboratory temperature during testing, the initial battery state of charge, driving distance, and charging frequency. When the battery is fully charged, the vehicle consumes less fuel and uses more electric power, particularly in cold weather, where additional energy is needed for conditioning the battery and cabin. However, for longer driving distances, electricity usage decreases and fuel consumption increases. The results also highlighted the significance of battery sizes ranging from 2 to 35 kWh and different charging intervals (0.5–10 days) for both diesel and gasoline vehicles.

3.2. NEDC

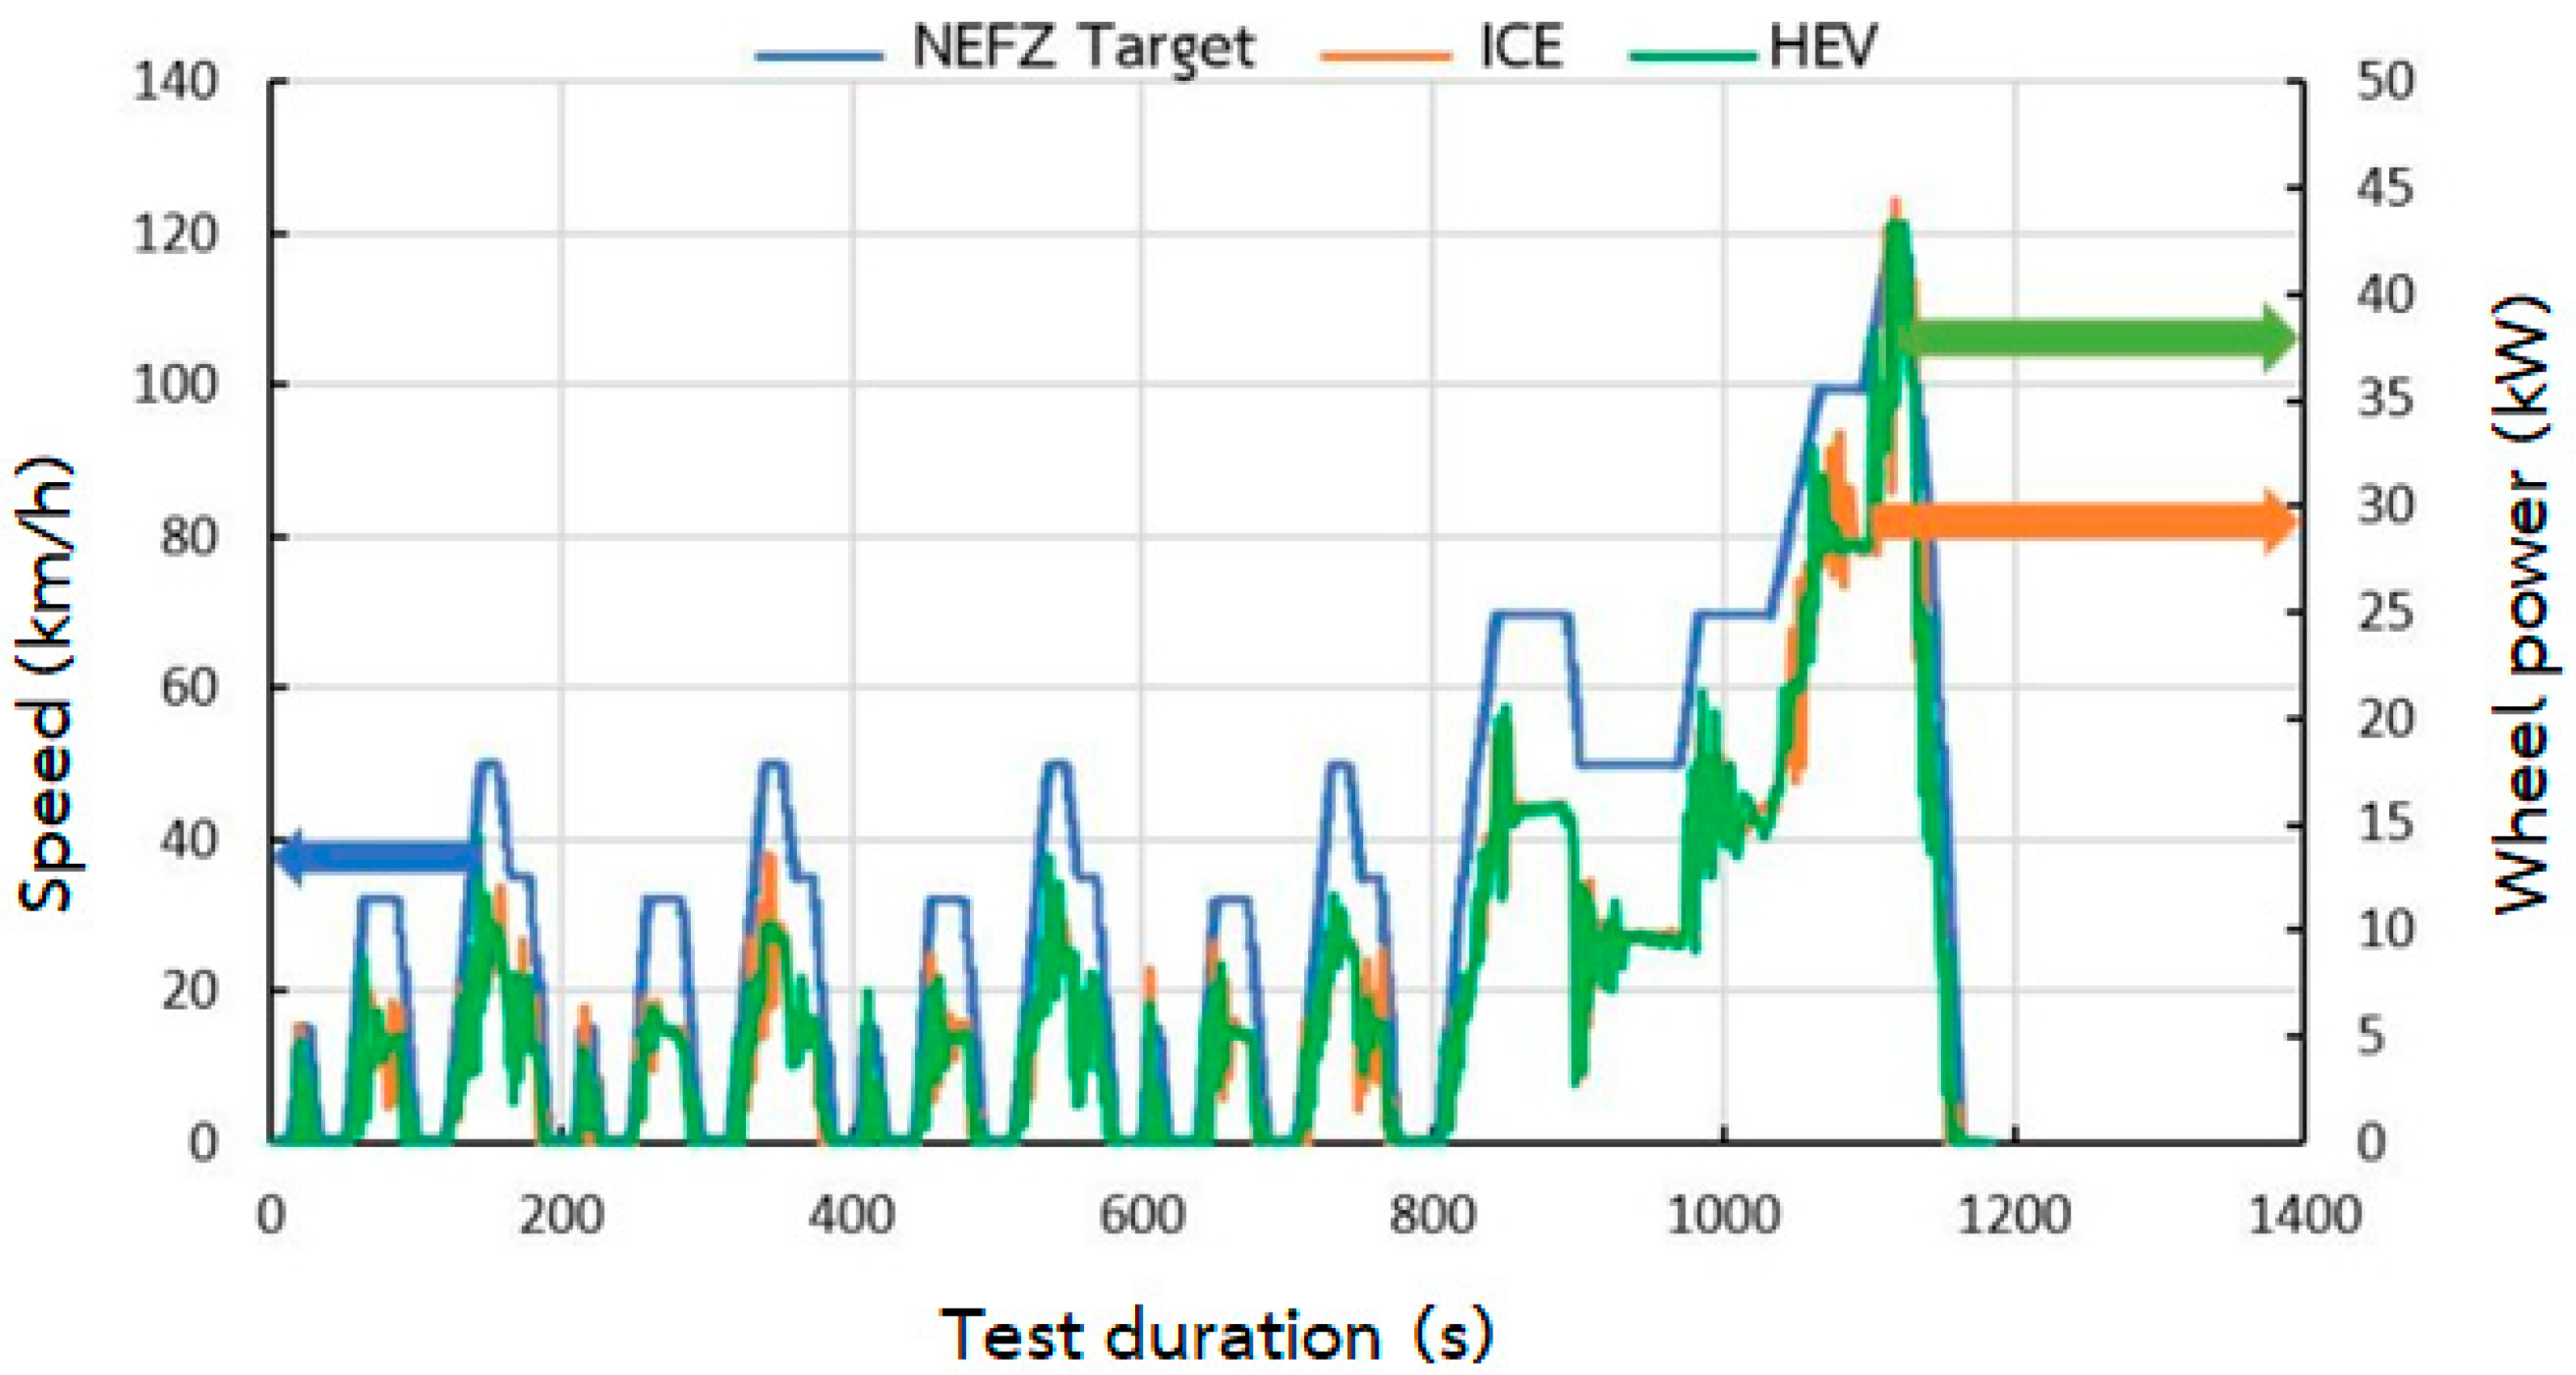
Experiments comparing internal combustion engine (ICE) power with hybrid (HEV) power were conducted using the speed and time conditions of the NEDC. The results (Figure 5) indicate that the ICE power response is slower due to the time needed for the engine to increase its RPM. In contrast, hybrid power, assisted by the electric motor, responds more quickly, resulting in a faster overall power response.
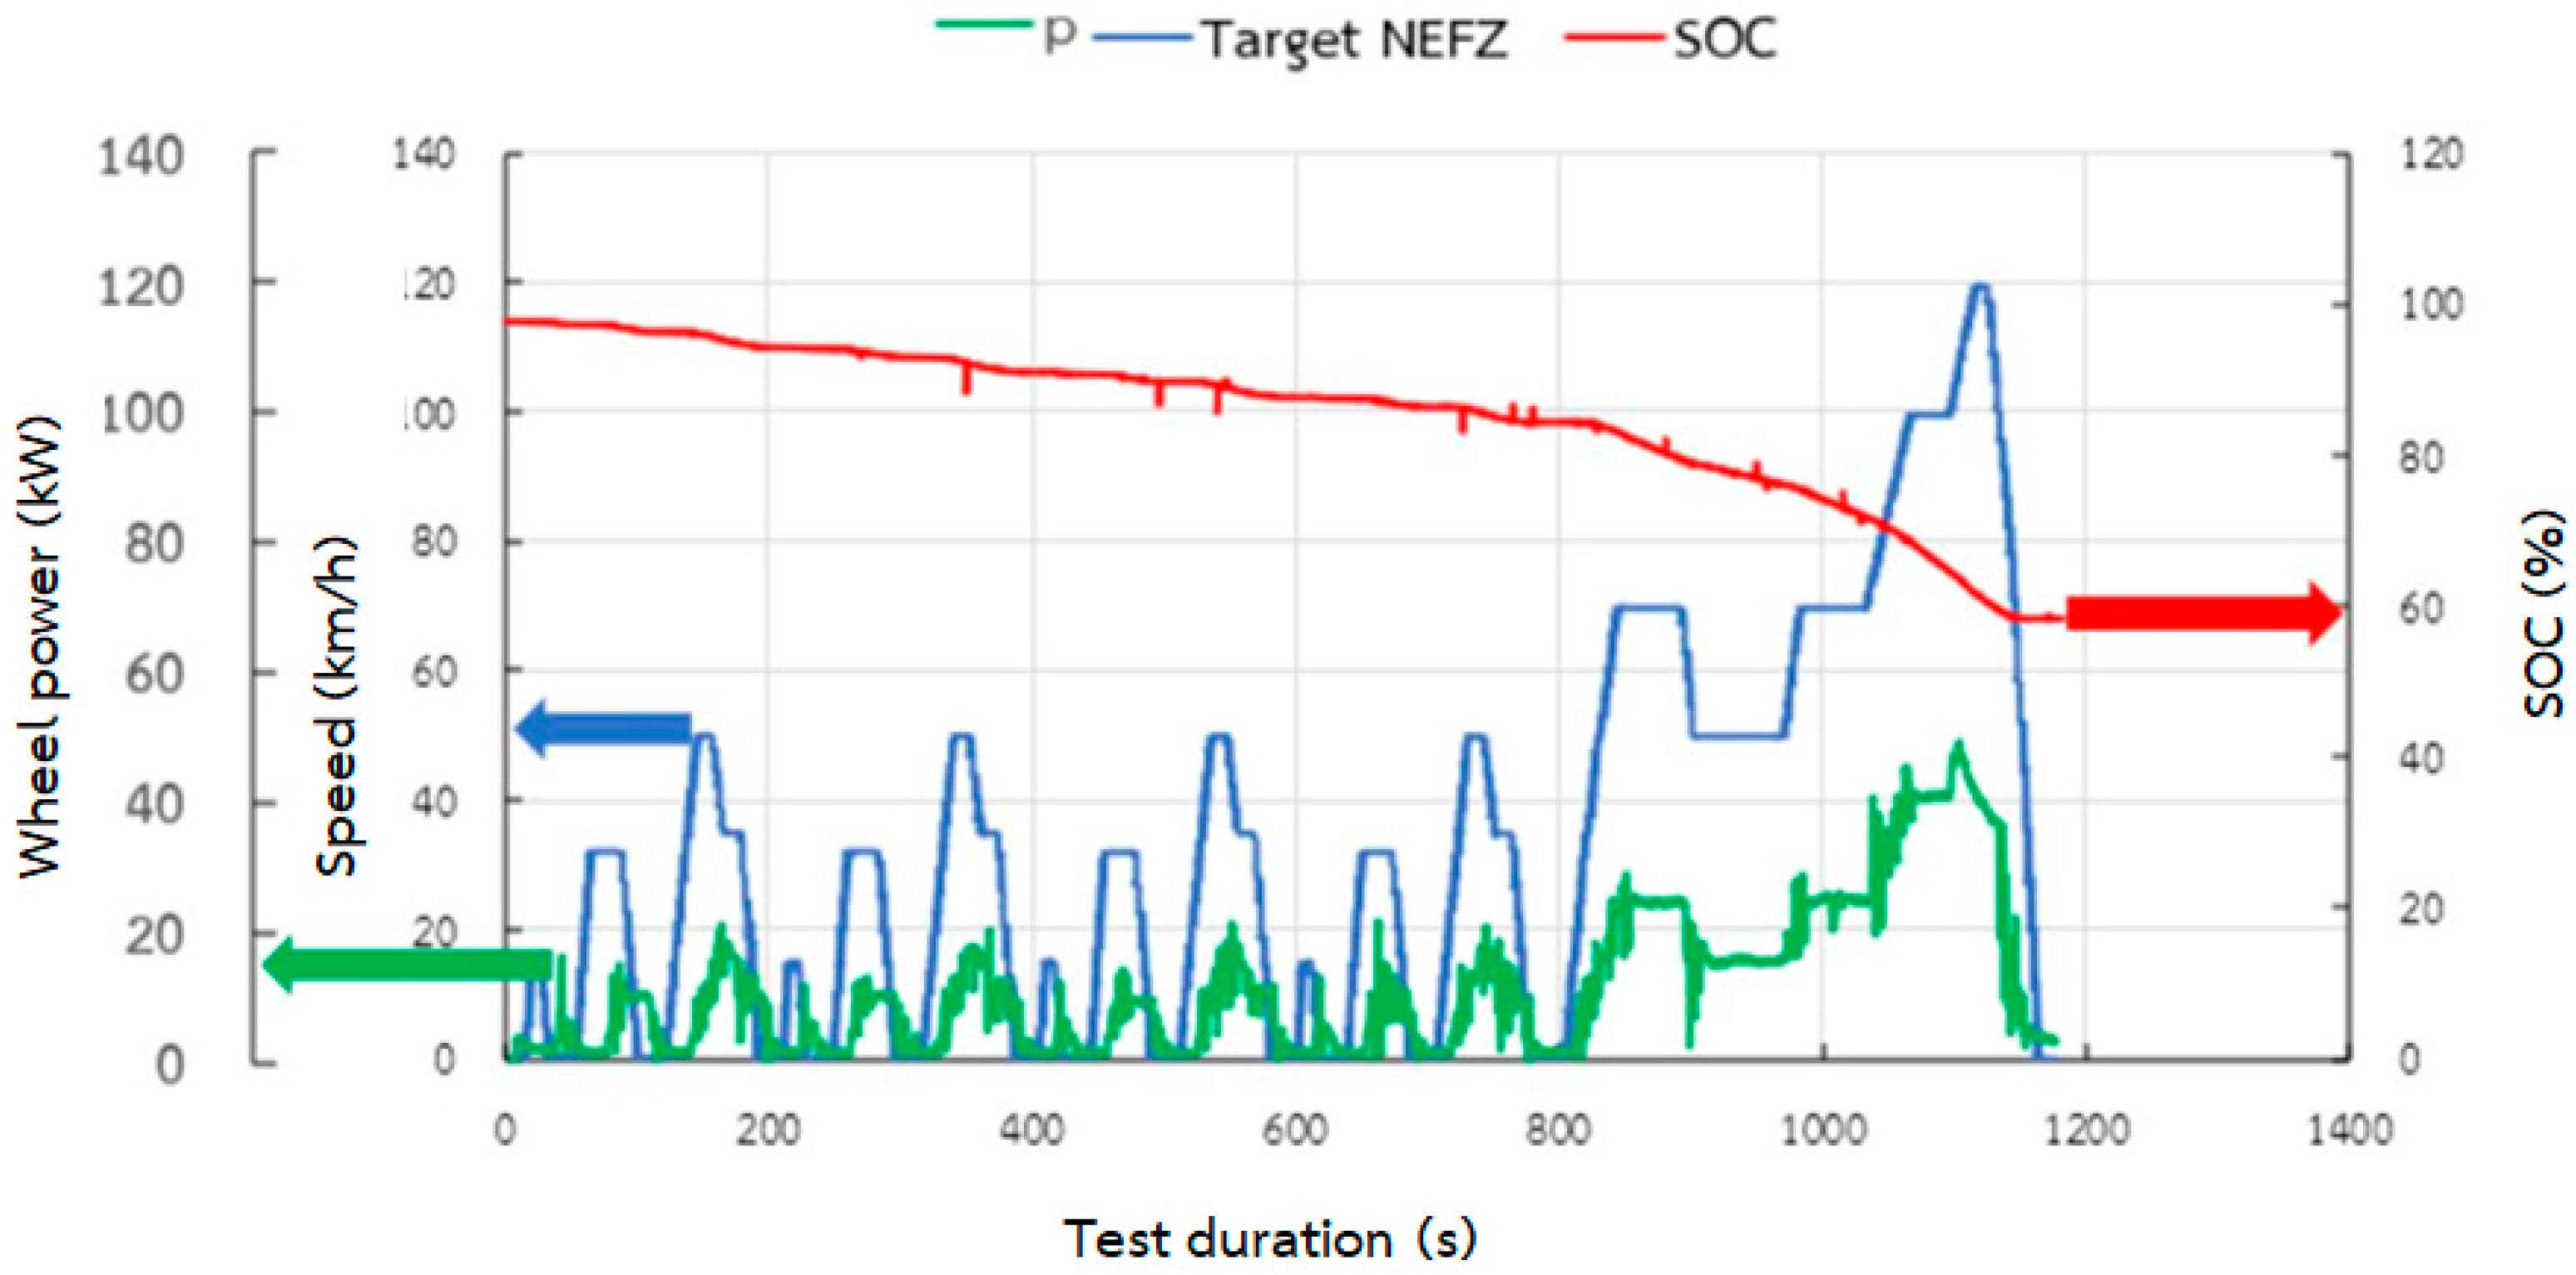
Experiments were conducted to compare electric power with energy use (SOC) in electric mode (EV) based on the speed and time circumstances of the NEDC in Figure 6. The results, given in Figure 6, show that the SOC gradually reduced at the start of the test due to the low speed. By the end of the test, at 800 s, there was a significant drop in charge as the vehicle required more energy at higher speeds. During this test, the electric power remained constant since the NEDC involves gradual speed increments. The total charge used in this test was approximately 39.69%.

3.3. EPA Highway Driving Cycle

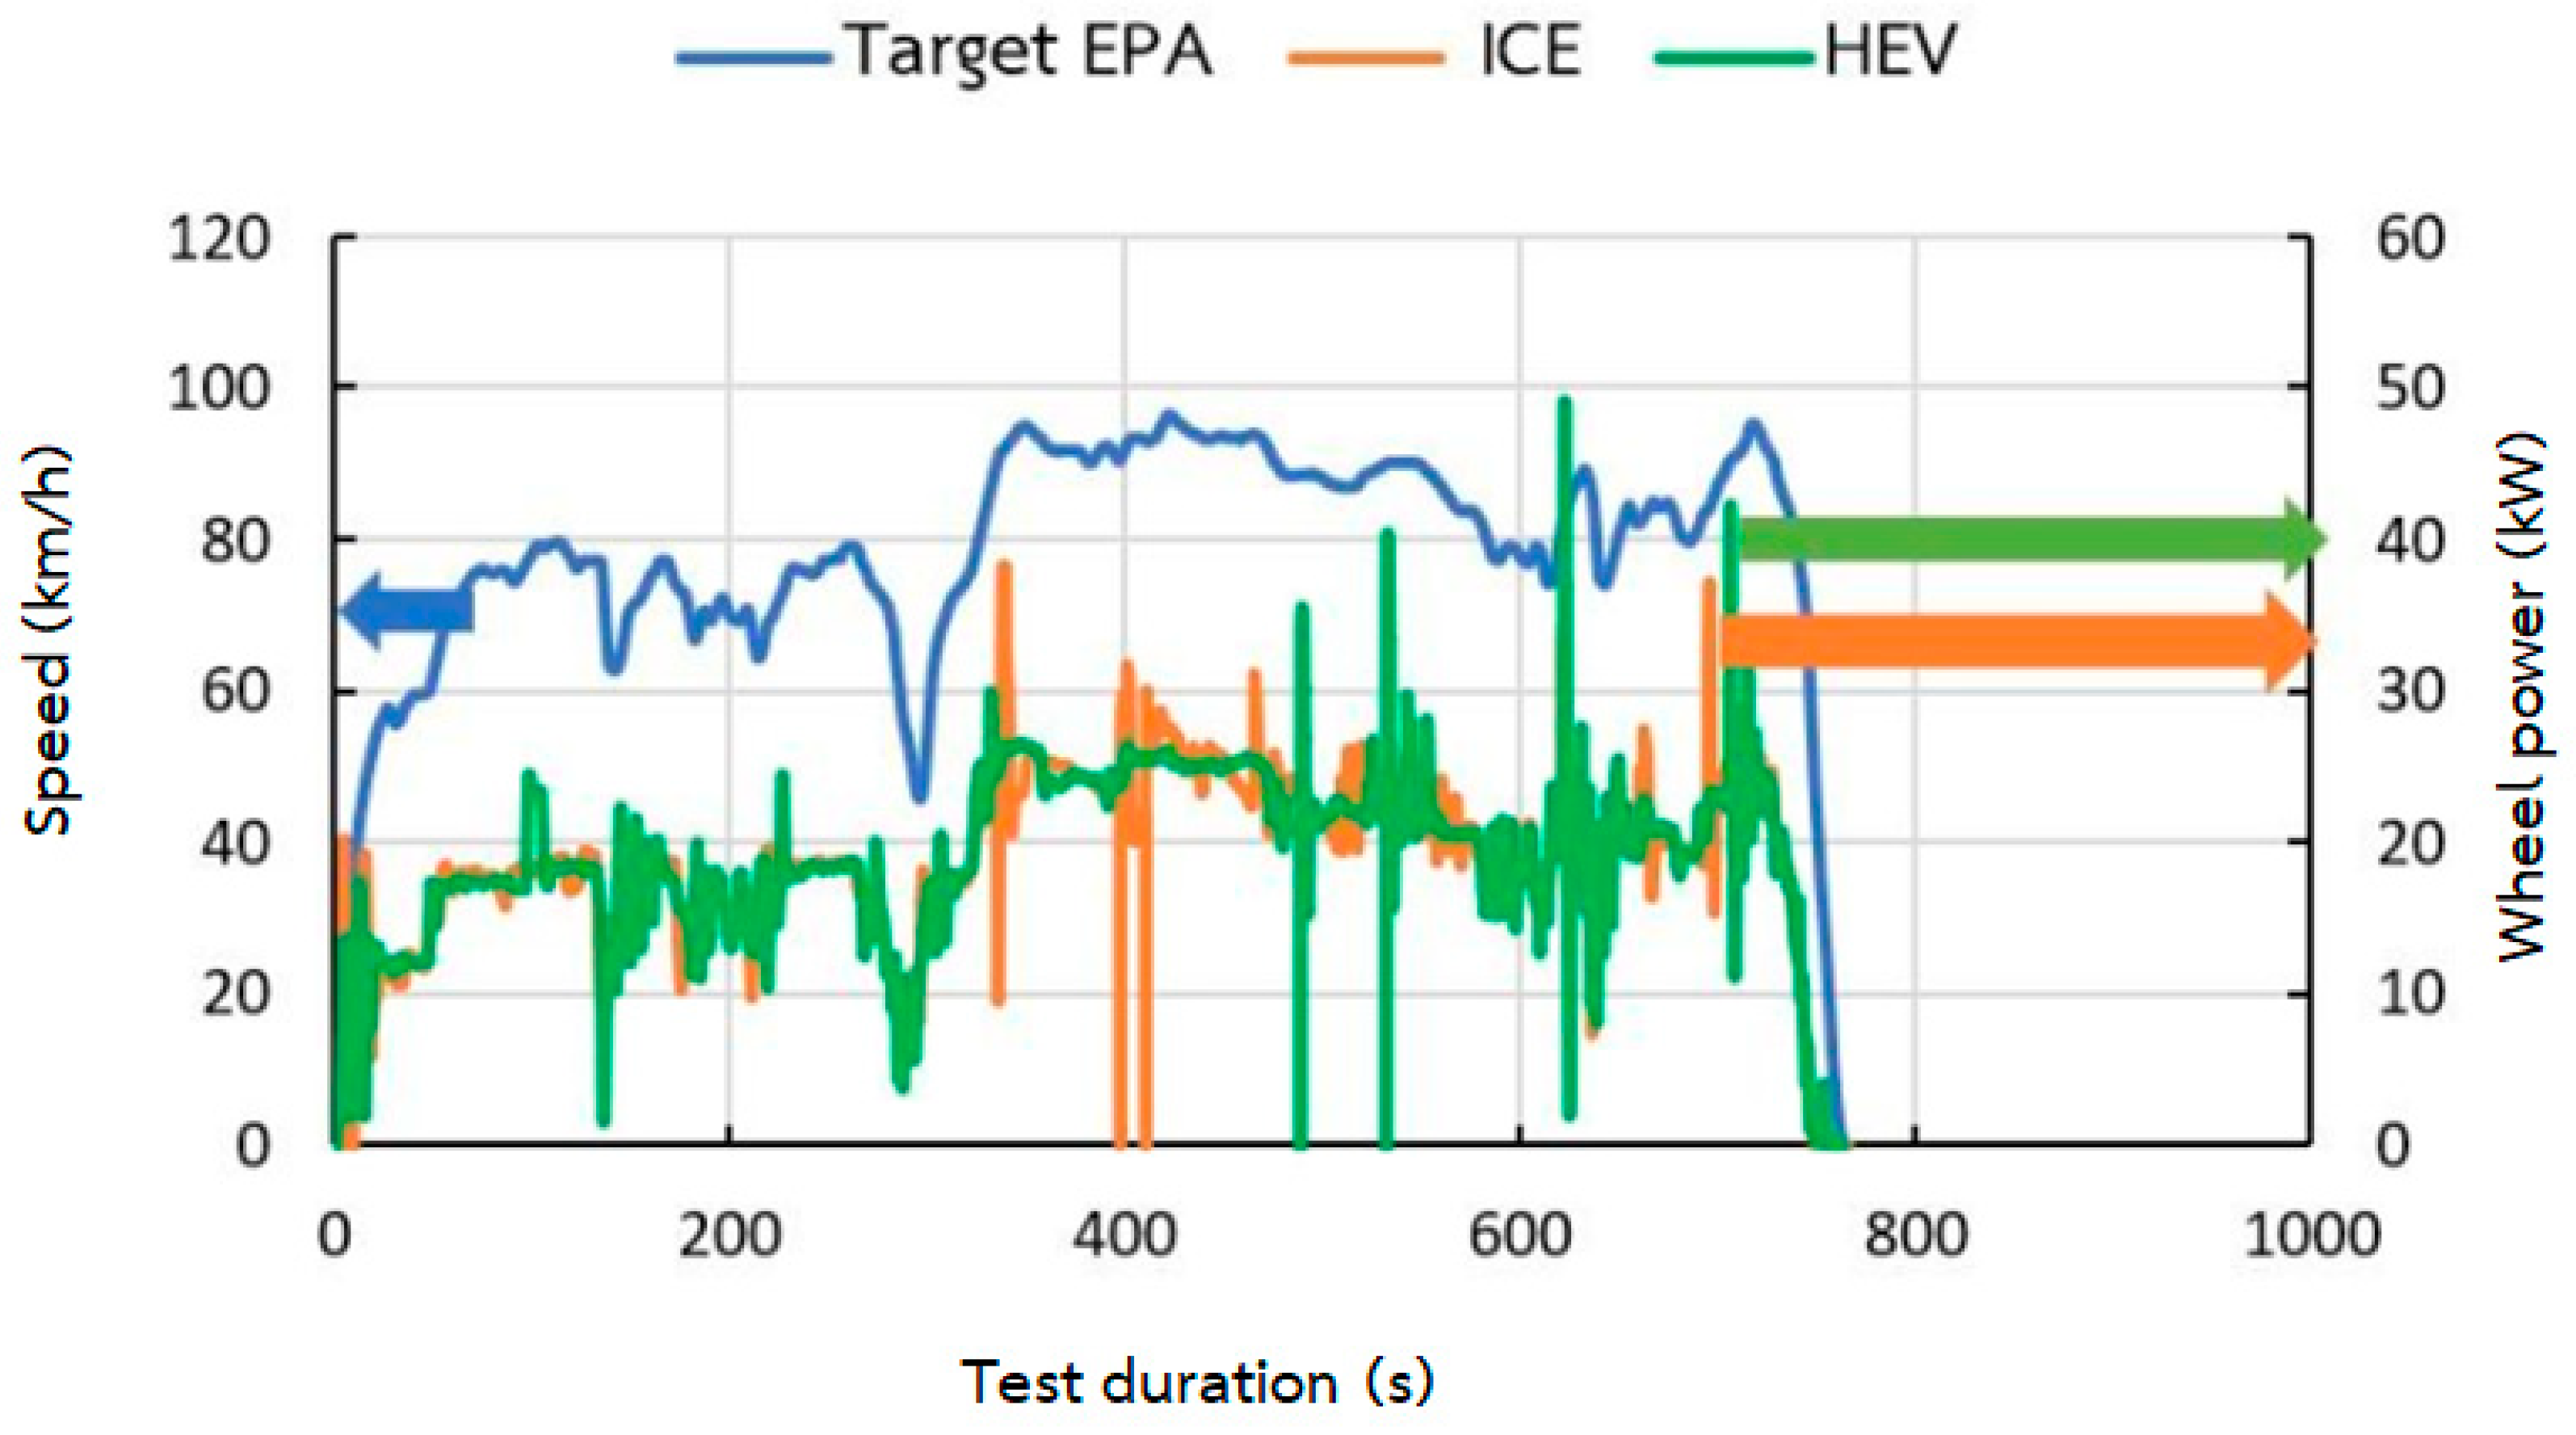
The workload results for the internal combustion engine (ICE) were compared with those for the hybrid mode (HEV) under the speed and time conditions of the EPA Highway driving cycle, and are shown in Figure 7. It was found that the engine workload accounted for 61% of the operation, as it was running continuously throughout the test. In contrast, in the hybrid mode, the engine was not engaged at the beginning due to speeds being below 100 km/h; during this time, the motor operated instead. The engine operated for a total duration of 334.65 s. The relationship between brake energy return, state of charge (SOC) reduction, and vehicle speed was determined during a PHEV chassis dynamometer test under the conditions of the EPA Highway cycle. The SOC (red line) exhibits a clear downward trend over the test duration, dropping sharply from the start to the end, with a reduction of almost 60%. This substantial decrease implies a high energy consumption during sustained high-speed driving, which is typical for EPA Highway cycles. Notably, the graph does not show significant plateaus or SOC recovery during periods in which the speed decreases or the wheel power is negative, which would suggest regenerative braking events.
This observation indicates limited or infrequent brake energy recovery in this cycle, suggesting that either the opportunities for regeneration were minimal (due to the nature of the cycle) or the energy capture efficiency of the PHEV’s system was not optimal.
The results of the in-depth analysis of the graph support the need for more detailed quantification of brake energy return’s contributions to the SOC, especially under highway scenarios where regeneration opportunities are limited compared with urban conditions. The vehicle speed (blue line) remains predominantly above 80 km/h throughout much of the test, reflecting the high-speed conditions of the EPA Highway cycle. There are periods of brief acceleration and deceleration, which theoretically present opportunities for regenerative braking to contribute to the workload. Jaworski et al. [16] conducted a study evaluating the energy efficiency and emissions of plug-in hybrid electric vehicles (PHEVs) under real-world driving conditions, which are inherently complex due to various factors, one of which is the powertrain complexity, which combines thermal and electric power. Another factor is the high sensitivity of the assessment results to usage patterns, including driving conditions (such as travel distance) and pre-driving behavior, such as battery charging. The aim of the Jaworski and co-workers was to provide data on PHEV energy usage and greenhouse gas (GHG) emissions in real driving scenarios under different usage patterns. CO2 emissions from different fuels—E10, E20, B7, and HVO—were evaluated at the tailpipe. The results showed that in charge-sustaining mode, the CO2 emissions of the diesel engine were reduced by 15.5% compared with those of the gasoline engines; this value increased to 22.3% when adjusted for ISO SOC CS conditions. These findings align with previous data on volumetric fuel consumption and CO2 emissions for different fuel types. Additionally, it was found that using renewable fuels like E20 did not significantly impact CO2 emissions in comparison with E10. However, HVO led to 3.6% and 2.0% reductions in CO2 emissions in charge-sustaining mode after adjustments compared with B7. HVO also had a lower CO2 emissions factor. Interestingly, vehicle weight reduction in HEV mode did not affect CO2 emissions for either gasoline or diesel engines, a noteworthy result when considering CO2 reduction strategies.
In 2020, Pielecha and associates used Real Driving Emissions (RDEs) road tests to compare and assess the energy consumption and exhaust emissions of cars with different propulsion systems, including internal combustion engine, plug-in hybrid, and electric vehicles. For contemporary cars, one of the most significant concerns that must be taken into consideration is the evaluation of energy consumption and efficacy under actual operating conditions. We also evaluated the differences in energy consumption as a result of driving on highways and in non-urban and metropolitan areas. An indicator known as the state of charge (SOC) was utilized to determine the battery’s current charge level. The impact of fluctuating energy use in the battery during the early stages of charging on the internal energy balance of a plug-in hybrid vehicle should be taken into consideration. Even if there are fluctuations in the energy consumed by the combustion engine, the external energy balance does not change. According to the results of the RDE test, the vehicle that was equipped with a combustion engine displayed the largest accumulated energy demand. In the case of the plug-in hybrid, energy consumption was lowered by around twenty percent on average. The electric car exhibited roughly thirty percent lower energy consumption than the combustion engine and approximately ten percent lower energy consumption than the plug-in hybrid—the vehicle with the lowest energy consumption. A chassis dynamometer was used by Jaworski and colleagues in 2023 to determine resistance functions, which can be used to simulate the resistance that the vehicle faces while driven on a road under real-world traffic circumstances. The vehicle’s motion resistance can be measured during coast-down tests, which are carried out by automobile manufacturers on specific roads on testing grounds. On the other hand, motion resistance value functions are normally not available, which necessitates the utilization of different techniques to calculate their value. The major purpose of Jaworski et al. [16] was to examine the impact of traffic resistance functions, computed using multiple approaches, on the emissions and energy consumption of a hybrid automobile. The experiment was conducted in a laboratory setting and on an urban real road cycle (URRC) in Rzeszow. According to the results, the traffic resistance values utilized in braking tests are crucial when compared with the resistance that is exerted on the vehicle in real-world road conditions and during the driving cycle. It is possible that emissions and fuel consumption tests on a chassis dynamometer do not adequately represent the conditions that are encountered in real-world driving. According to the findings of this research, the resistance to motion has a substantial impact on measurements of exhaust gas pollution and fuel consumption in the analyzed cycle. It was found that the measured emission values of the pollutants were significantly different from those that were acquired from road tests as a consequence of using a resistance function based on road coasting tests. The values of CO2, THC, CO, and NOx emissions were roughly 19, 8, 38, and 7% higher, respectively, during road testing than those calculated using the road load resistance function in the dynamometer tests. This was the case from the beginning of the road tests. The fuel consumption calculated using the road load-calculated resistance function was roughly twenty percent greater compared with the value obtained in the experiment conducted in the laboratory. This indicates that all of the additional traffic resistances related to road gradient, wind resistance, and other elements that are present when driving on roads cannot be taken into account in chassis dynamometer tests. It is therefore vital to incorporate supplemental motion resistance forces connected with the change in altitude on a chassis dynamometer to obtain results that are more reflective of reality.
A comparison of electric power with energy use (SOC) in electric vehicle mode was conducted using the speed and time conditions of the EPA Highway driving cycle. As can be seen in Figure 8, the electric power remained constant at the beginning of the test as a result of the rise in speed, which, in turn, resulted in a steady decline in SOC. From one hundred seconds, the electric power fluctuated depending on the driving conditions and speed, which led to an even greater decrease in the state of charge. The total amount of charge that was utilized in this test was approximately 59.95%. This analysis is supported by the findings of Bielaczyc et al. [17], who demonstrated that conventional and hybrid vehicles both perform well in the conducted tests. Carbon dioxide and carbon monoxide emissions were much lower in the HEV, but hydrocarbon and nitrogen oxide emissions were low and somewhat similar. Furthermore, Machado et al. (2020) [18] carried out a comprehensive examination of the road transport infrastructure in a particular region of São Paulo State, Brazil, with the objective of determining the theoretical maximum reduction in greenhouse gas (GHG) emissions and pollutants. They found that hydrogen fuel-cell electric vehicles, Battery Electric Vehicles (BEVs), and plug-in hybrid electric vehicles (HEVs) were able to effectively cut emissions of greenhouse gases and pollutants. The findings of this study provide evidence that hybrid vehicles are a viable option regarding reducing emissions and requiring less power to operate.
State of Charge (SOC) Depletion and Energy consumption. The most significant difference across the three tests lies in the total charge consumption, which directly reflects the energy demand of each cycle.
The highest energy consumption was observed under EPA Highway conditions, with an SOC drop of ≈60% from ≈100% to ≈40%. The sustained high speed and power required for highway driving result in continuous, high-rate battery use and limited regenerative opportunities, leading to the largest overall reduction in electric range.
SOC consumption under NEDC conditions was intermediate 39.69%. While this test duration is the longest, the lower average speed and number of repeated cycles suggest the demand is less power-intensive per unit of time than that of the highway or aggressive cycles, resulting in a more moderate total energy consumption.
The least amount of energy was consumed under US06 conditions, with an SOC drop of 59.56%. Despite the aggressive nature of this cycle (high peaks in power and speed), its shorter total duration of 600 s is the primary reason for the lowest total SOC consumption. This highlights that while the instantaneous power demand is high, the overall time spent drawing power is limited.
Implications for PHEV system operation: The different cycles underscore the varying roles of the electric powertrain in real-world driving conditions.
High-speed cycles (such as in EPA Highway) necessitate a high and continuous energy output, rapidly draining the battery. The results show that the engine workload accounted for 61% of the operation in HEV mode for this cycle, indicating that the PHEV relies heavily on the internal combustion engine (ICE) for sustained high-speed travel once the battery is depleted.
Aggressive cycles (US06) require the electric motor for a rapid response and a high peak power in order to meet sudden acceleration demands, validating the motor’s quick reaction compared with the ICE’s slower RPM response, as observed in the NEDC.
Urban cycles (NEDC) demonstrate a steady, gradual SOC decline due to lower, more consistent power draws and gradual speed increments. This cycle is where the PHEV’s full-electric capability is most efficient, given the lower speeds and potential for regeneration during deceleration phases.

4. Conclusions

This study evaluated the wheel horsepower of a plug-in hybrid electric vehicle (PHEV) using a chassis dynamometer through three experiments. First, the internal combustion engine (ICE) data was compared with hybrid electric vehicle (HEV) data; then, the electric vehicle (EV) and hybrid electric vehicle (HEV) data were analyzed. The two methods involved in the determination of the results included the use of chassis dynamometer and OBD data. To conduct this study, three driving cycles were used to conduct the trials.
The SOC is always minimized because, when driving, the electric motor responds very quickly to changes in the energy supply, and thus causes variations in the electric power, depending on the driving conditions. The outcome of the tests between the electric power (EV) and the energy usage showed that the SOC was constantly decreasing throughout the US06 driving cycle.
Due to the low driving speed during the NEDC, the findings of the comparison of the electric power (EV) with the energy usage showed that the state of charge (SOC) was rapidly decreasing. A faster speed led to a measurable reduction in SOC upon completion of the test that occurred after approximately 800 s. To conduct this test, the electric power was varied according to the driving cycle since the motor is sensitive to changes in the supply of energy during the driving process. For the EPA Highway driving cycle, the results of a comparison between electric power (EV) and energy usage showed that the SOC gradually and continuously decreased at the beginning due to low driving speeds. Around 300 s into the test, the SOC dropped sharply due to higher driving speeds. The electric power varied according to the driving cycle as the motor responded rapidly to changes in energy supply during driving.
Practical implications for PHEV optimization and usage: These findings offer direct guidance for PHEV design and driver behavior. Designs should be optimized to focus on high-speed efficiency and regeneration.
The EPA Highway results (60% SOC use) show that the electric range is severely compromised at sustained high speeds. PHEV designers should focus on minimizing aerodynamic and rolling resistance to preserve the electric range on the highway. Enhancing the regenerative braking efficiency is also critical, especially in the US06 and NEDCs, where deceleration events are frequent. Optimal battery charging control during regeneration is key to maximizing energy recovery in these dynamic scenarios.

4.1. The Driver Usage Pattern Maximizes EV Mode in Urban Settings

Electric use for city driving (like under the NEDC test conditions) should be prioritized. Since lower-speed urban cycles are less demanding on the battery per distance covered compared with highway cycles, drivers seeking to maximize their electric range should save their battery charge for low-speed, stop-and-go driving conditions.
Aggressive acceleration (as in US06) should be minimized. Although the US06 test has the lowest total SOC use due to its short duration, the high instantaneous power peaks stress the battery and can reduce overall system efficiency. Smooth acceleration and deceleration are essential for maximizing the electric range in daily driving.

4.2. Key Findings

The experimental data of the three standardized driving cycles (US06, NEDC and EPA highway) have repeatedly proven that there is a distinct correlation between the vehicle speed, driving cycle requirements and battery performance in the plug-in hybrid electric vehicle (PHEV).
Across all three test cycles, the electric motor exhibited a rapid and dynamic response to fluctuations in the energy supply during driving. This rapid response confirms the system’s ability to instantaneously meet the varying power demands encountered under diverse driving conditions (urban highway, and US06).
The rate of battery state of charge (SOC) depletion was directly correlated with the intensity and duration of high-speed periods.
In the US06 driving cycle test, the high-demand profile led to a continuous decrease in the SOC due to the sustained rapid energy expenditure.
In the NEDC (urban/moderate) and EPA Highway cycles, the SOC was depleted gradually at lower speeds but underwent a sharp, noticeable drop, directly corresponding to phases where driving speeds significantly increased (e.g., around 800 s in NEDC and 300 s in EPA Highway).
Consistency in EV power variation: For all tested cycles, the electric power output consistently varied in accordance with the profile of the respective driving cycle, confirming that the vehicle’s control system efficiently utilized electric power to follow the target speed.

4.3. Limitations of This Study

Based on the described experimental methodology, the following limitations should be considered when interpreting the results:
Small vehicle range: The scope of the vehicle used in the study was only one model of PHEV. The obtained efficiency features and SOC characteristics might not be applicable to other PHEV systems, battery capacity and energy management approaches that other manufacturers introduce.
Dynamometer-only testing: Experiments were done only on chassis dynamometer tester. Although this guarantees a controlled and repeatable environment, it has the inherent disadvantage in that it excludes real world conditions like road grade and wind resistance, thermal effects due to different ambient temperature conditions and driver specific variations, which may strongly affect real-world PHEV performance. Lack of comparative detail: Although the methodology included comparisons of ICE, HEV, and EV data, the tests focused almost exclusively on the EV mode (electric power and SOC changes).
Future Work Study Limitations Overcoming The limitations of the present study, especially the scope of vehicles, testing conditions, and the comparison in detail, lead to the clear way forward in future research in this field. It is possible to strategically plan future research to address these limitations, which will substantiate the existing results and expand them. Limited Vehicle Scope Future Work: With the variety of vehicles focused on one Plug-in Hybrid Electric Vehicle (PHEV) model, it is possible to address this limitation with the help of a large-scale, multi-vehicle test program. Research directions in the future should contain a minimum of three different PHEV architectures which differ in battery size, motor arrangement (series or parallel) and manufacturer-specific Energy Management Strategies (EMS). This would allow a comparative sensitivity analysis to reveal what observed efficiency and State-of-Charge (SOC) behaviors are generic and what are unique to different designs, leading to more generalized conclusions about the performance of PHEVs. Dynamometer-Only Testing Future Work: The artificial but controlled character of chassis dynamometer testing is an issue that can be resolved by introducing much on-road testing in the laboratory work. In subsequent studies, the results of the dynamometer would be compared to the data gathered on the same cars that would be used in the real-world driving scenario (RWD). This involves the deployment of Portable Emission Measurement Systems (PEMS) and data loggers to capture the variables such as road grade, real time thermal management information, and the ambient temperatures. The laboratory and field data would be combined to form correction factors or high-fidelity simulation models that would perfectly reflect the real world operational factors that affect PHEV efficiency. Deficiency in Comparative Detail Future Work: To conquer the major concern of the present study, namely the Electric Vehicle (EV) mode, future work needs to include detailed, quantitative energy balance and efficiency breakdown of all three operating modes, namely EV, Internal Combustion Engine (ICE), and Hybrid Electric Vehicle (HEV). This requires the total energy consumption of each mode in terms of the tank-to-wheel energy consumption to be calculated and discussed using the same drive cycles. Comparative data in future research must be applied to develop measurable efficiency trade-off matrix to determine the best duty cycles or thresholds to switch EV to ICE or HEV mode and achieve the maximum total energy savings or CO2 reduction.

Author Contributions

Investigation, P.T. and T.K.; Writing—review & editing, P.S. and I.C.; Funding acquisition, W.P. All authors have read and agreed to the published version of the manuscript.

Funding

The author extend sincere gratitude to the Science, Fundamental Fund (FF), Thailand Science Research and Innovation (TSRI), in the fiscal year 2024 for their financial support of this research project.

Institutional Review Board Statement

Ethical review and approval were waived for this study due to REASON. This study did not include research involving human subjects or animals. All experiments were performed within a laboratory environment utilizing a plug-in hybrid electric vehicle (PHEV).

Informed Consent Statement

This study does not contain any research involving human participants.

Data Availability Statement

The original contributions presented in the study are included in the article, further inquiries can be directed to the corresponding author.

Conflicts of Interest

The authors declare no conflicts of interest.

Abbreviations

sSeconds
SOCState of charge
PHEVPlug-in hybrid electric vehicle
OBDOn-board diagnostics
ICEInternal combustion engine
HEVHybrid mode power
RLReinforcement learning
CDCharge-depleting mode

References

  1. Bradley, T.H.; Frank, A.A. Design, Demonstrations and Sustainability Impact Assessments for Plug-in Hybrid Electric Vehicles. Renew. Sustain. Energy Rev. 2009, 13, 115–128. [Google Scholar] [CrossRef]
  2. Samaras, C.; Meisterling, K. Life Cycle Assessment of Greenhouse Gas Emissions from Plug-in Hybrid Vehicles: Implications for Policy. Environ. Sci. Technol. 2008, 42, 3170–3176. [Google Scholar] [CrossRef] [PubMed]
  3. Ching-Shin, N.S.; Constantine, S.; Richard, H.; Jeremy, J.M. Impact of Battery Weight and Charging Patterns on the Economic and Environmental Benefits of Plug-in Hybrid Vehicles. Energy Policy 2009, 37, 2653–2663. [Google Scholar] [CrossRef]
  4. SAE International. SAE J1711™—Recommended Practice for Measuring the Exhaust Emissions and Fuel Economy of Hybrid-Electric Vehicles, Including Plug-in Hybrid Vehicles; SAE International: Warrendale, PA, USA, 2023. [Google Scholar]
  5. Liu, X.; Zhao, F.; Hao, H.; Chen, K.; Liu, Z.; Babiker, H.; Amer, A.A. From NEDC to WLTP: Effect on the Energy Consumption, NEV Credits, and Subsidies Policies of PHEV in the Chinese Market. Sustainability 2020, 12, 5747. [Google Scholar] [CrossRef]
  6. Chen, Z.; Hu, H.; Wu, Y.; Xiao, R.; Shen, J.; Liu, Y. Energy Management for a Power-Split Plug-In Hybrid Electric Vehicle Based on Reinforcement Learning. Appl. Sci. 2018, 8, 2494. [Google Scholar] [CrossRef]
  7. Xiao, R.; Liu, B.; Shen, J.; Guo, N.; Yan, W.; Chen, Z. Comparisons of Energy Management Methods for a Parallel Plug-In Hybrid Electric Vehicle between the Convex Optimization and Dynamic Programming. Appl. Sci. 2018, 8, 218. [Google Scholar] [CrossRef]
  8. Chaisuwan, K. Real-World Energy Consumption of Plug-in Hybrid Electric Vehicle Adoption Scenario in Bangkok. Master’s Thesis, Chulalongkorn University, Bangkok, Thailand, 2017. [Google Scholar]
  9. Ehrenberger, S.I.; Konrad, M.; Philipps, F. Pollutant Emissions Analysis of Three Plug-in Hybrid Electric Vehicles Using Different Modes of Operation and Driving Conditions. Atmos. Environ. 2020, 234, 117612. [Google Scholar] [CrossRef]
  10. Duoba, M. HEV, PHEV, EV Test Standard Development and Validation. Available online: https://www.energy.gov (accessed on 10 September 2023).
  11. Navius, A.T.; Rooney, T.R. Improved PHEV Emission Measurements in a Chassis Dynamometer Test Cell. SAE Int. J. Engines 2013, 3, 1113–1123. [Google Scholar] [CrossRef]
  12. Li, X.; Zhou, Z.; Wei, C.; Gao, X.; Zhang, Y. Multi-objective optimization of hybrid electric vehicles energy management using multi-agent deep reinforcement learning framework. Energy AI 2025, 20, 100491. [Google Scholar] [CrossRef]
  13. Lu, L.; Zhao, H.; Xv, F.; Luo, Y.; Chen, J.; Ding, X. GA-LSTM speed prediction-based DDQN energy management for extended-range vehicles. Energy AI 2024, 17, 100367. [Google Scholar] [CrossRef]
  14. Dynamometer Drive Schedules, U.S. Environmental Protection Agency. Available online: https://www.epa.gov/vehicle-and-fuel-emissions-testing/dynamometer-drive-schedules (accessed on 17 May 2024).
  15. Roland, D.; Vivien, P.; Philippe, D.; Joris, M.; Corrado, F.; Alastair, S.; Cyrille, C.; Sofia, C.; Renate, U.; Kenneth, K. Evaluation of Plug-in Hybrid Vehicles in Real-World Conditions by Simulation. Transp. Res. Part D 2023, 119, 103721. [Google Scholar]
  16. Jaworski, A.; Kuszewski, H.; Lew, K.; Wojewoda, P.; Balawender, K.; Woś, P.; Longwic, R.; Boichenko, S. Assessment of the Effect of Road Load on Energy Consumption and Exhaust Emissions of a Hybrid Vehicle in an Urban Road Driving Cycle—Comparison of Road and Chassis Dynamometer Tests. Energies 2023, 16, 5723. [Google Scholar] [CrossRef]
  17. Bielaczyc, P.; Merkisz, J.; Pielecha, J.; Woodburn, J. A Comparison of Gaseous Emissions from a Hybrid Vehicle and a Non-Hybrid Vehicle Under Real Driving Conditions; SAE Technical Paper 2018-01-1272; SAE International: Warrendale, PA, USA, 2018. [Google Scholar]
  18. Machado, P.G.; Teixeira, A.C.R.; de Almeida Collaço, F.M.; Hawkes, A.; Mouette, D. Assessment of Greenhouse Gases and Pollutant Emissions in the Road Freight Transport Sector: A Case Study for São Paulo State, Brazil. Energies 2020, 13, 5433. [Google Scholar] [CrossRef]
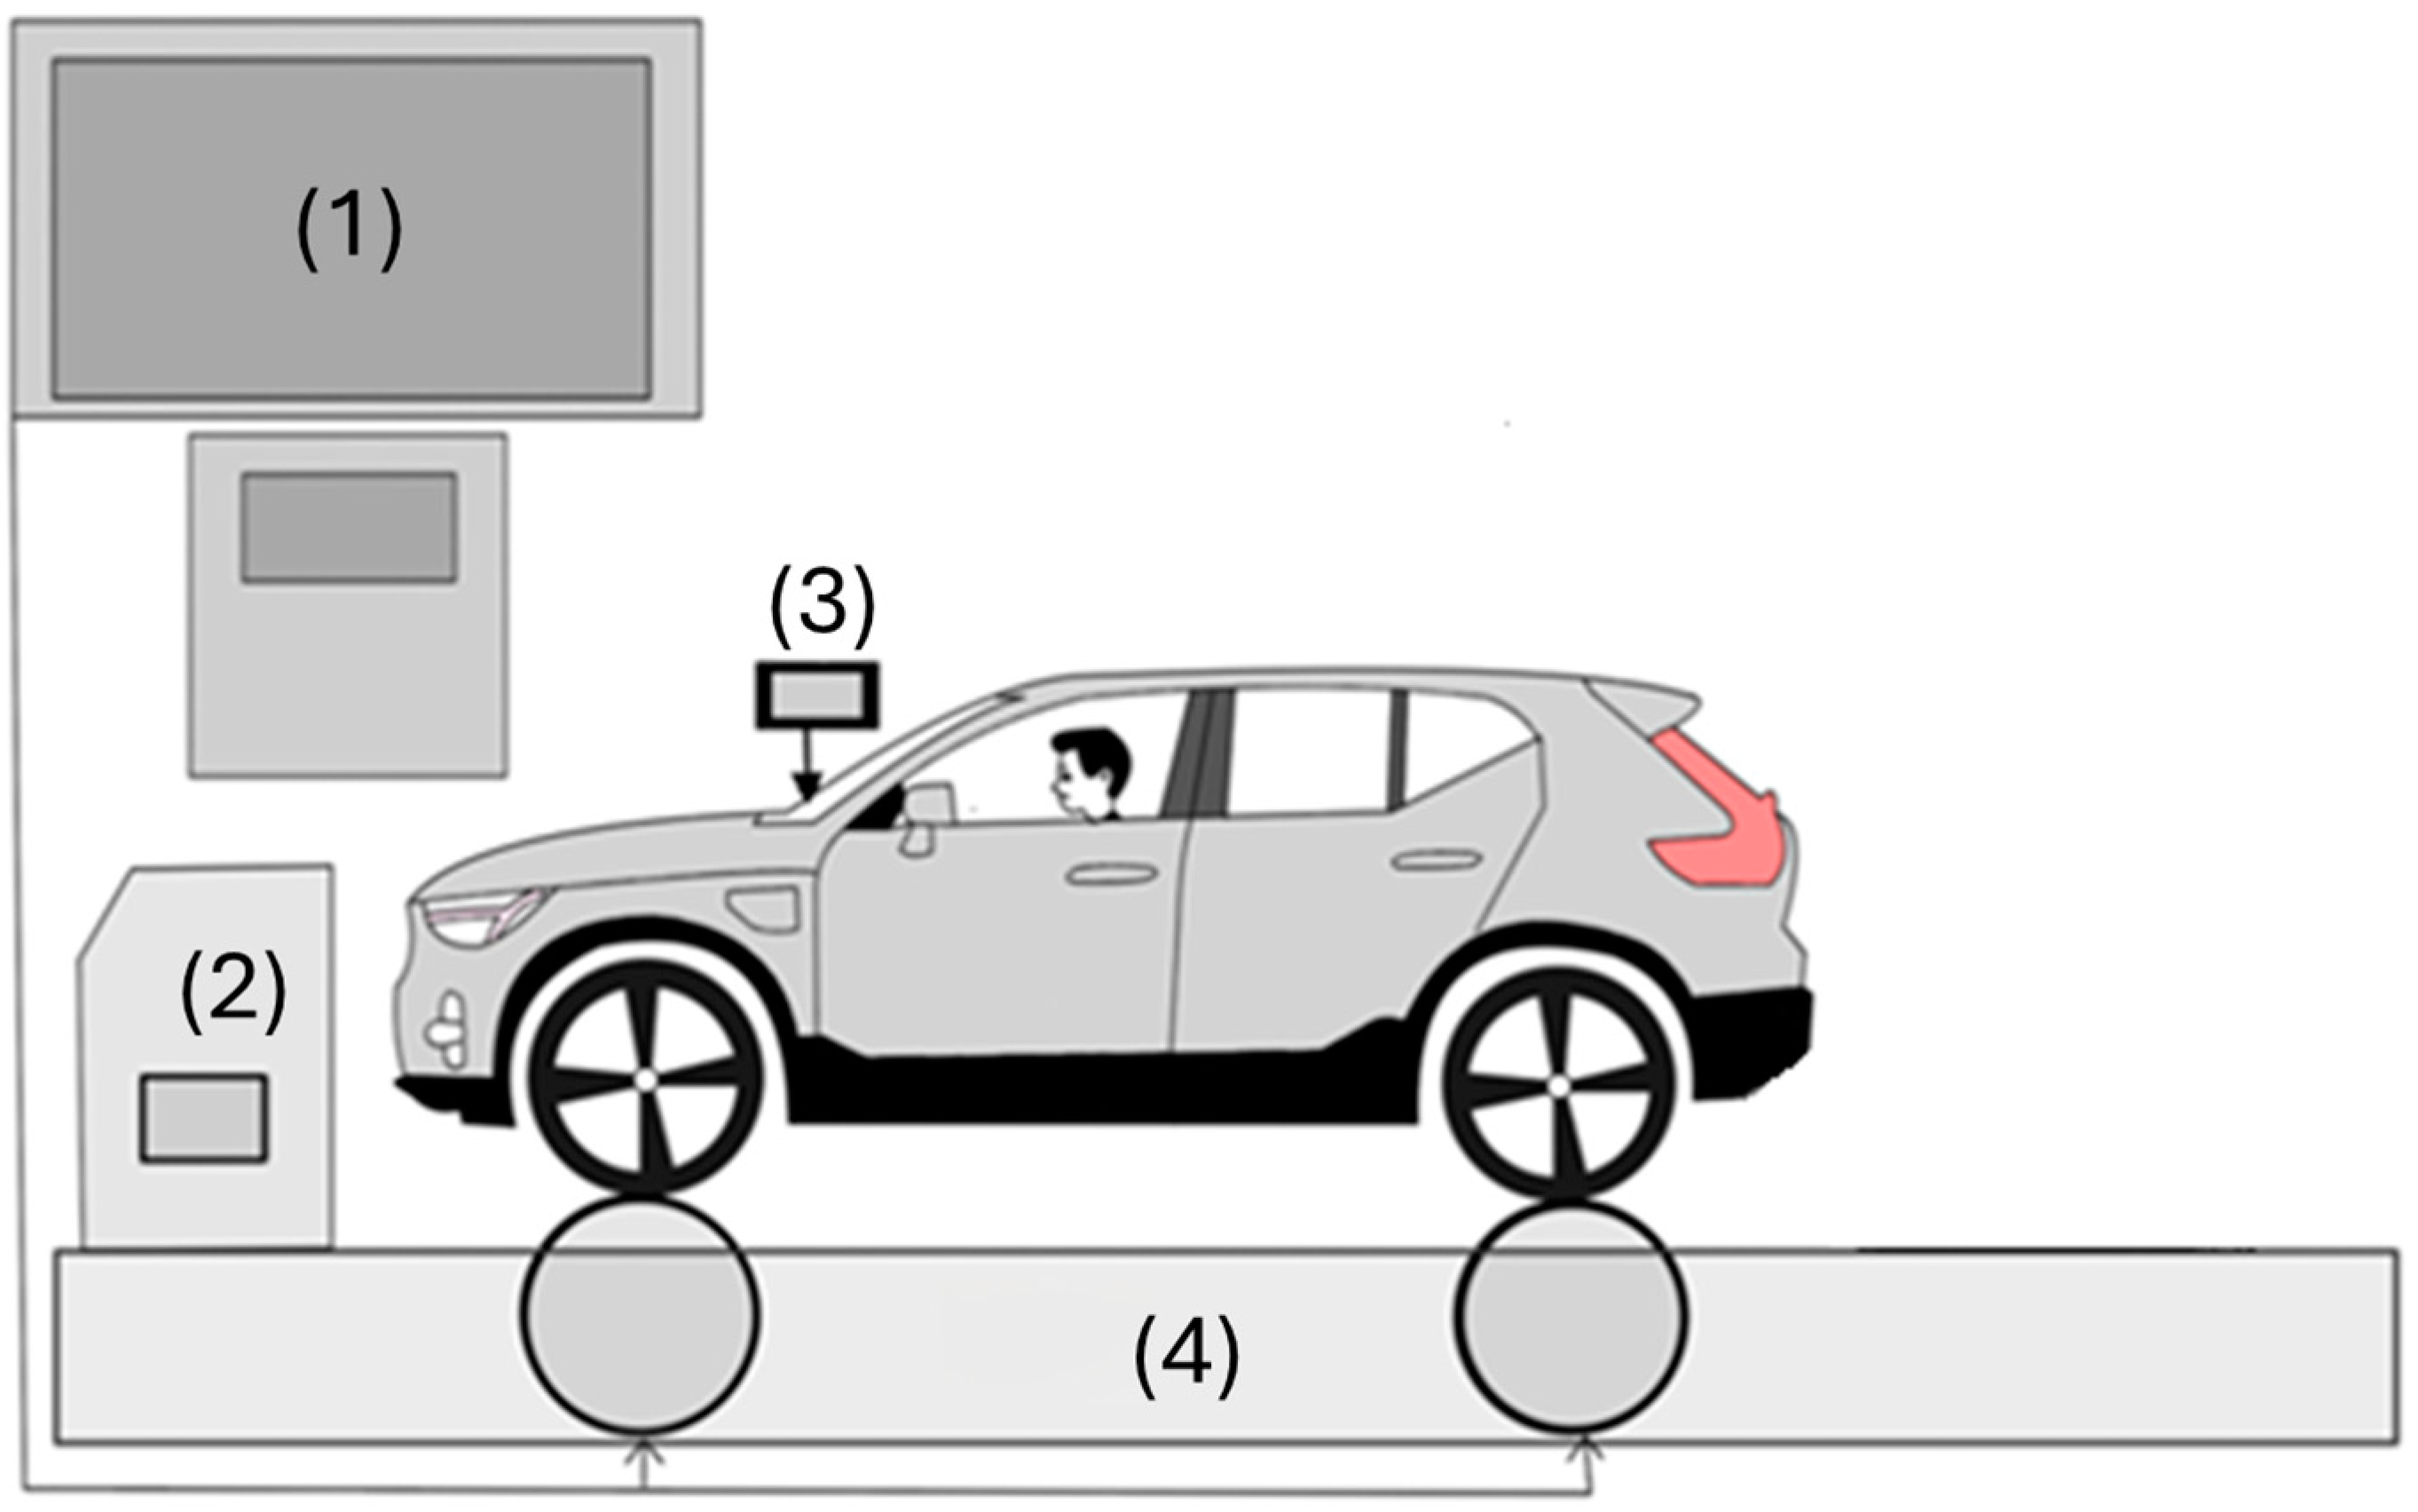
Figure 1. Experimental diagram. (1) Control Chassis dynamometer. (2) Air-conditioning system. (3) OBD. (4) Chassis dynamometer.
Applsci 15 12320 g001
Figure 2. Experimental PHEV test rig.
Applsci 15 12320 g002
Figure 3. Relationship between vehicle speed power and time in engine (ICE) and hybrid (HEV) mode under the US 06 driving cycle.
Applsci 15 12320 g003
Figure 4. Relationship between vehicle speed, power, SOC, and time on engine (ICE) and hybrid (HEV) modes under the US 06 driving cycle.
Applsci 15 12320 g004
Figure 5. Relationship between vehicle speed, power, and time on engine (ICE) and hybrid (HEV) modes under the NEDC.
Applsci 15 12320 g005
Figure 6. Relationship between vehicle speed, power, SOC, and time on engine (ICE) and hybrid (HEV) modes under the NEDC.
Applsci 15 12320 g006
Figure 7. Relationship between vehicle speed, power, and time on engine (ICE) and hybrid (HEV) modes under the EPA highway.
Applsci 15 12320 g007
Figure 8. Relationship between vehicle speed, power, SOC, and time on engine (ICE) and hybrid (HEV) modes under the EPA highway driving cycle.
Applsci 15 12320 g008
Table 1. PHEV specifications.
ParameterUniteData
Year of production 2022
Curb weight (kg)1800
Engine type-Plug-in hybrid with 1.5 L, three-cylinder turbocharged benzene engine and an electric motor
Traction battery-Lithium-ion
Traction battery capacity (kWh)10.7
Fuel Type E10 Benzene 95 and Gasohol E10
Max. engine power (PS/rpm)180/5800
Max. electric power (PS/rpm)82/4000
Max. engine torque (PS/rpm)
(newton meter/rpm)
265/1500–3000
Max. electric torque (Nm)160
Max. combined power(PS)262
Displacement (cm3)1.477
Odometer (km)2000
Transmission
type/no. of gears
-Seven-speed dual-clutch/automatic with Geartronic
CO2 emission (g/km)52
Table 2. Driving cycle test conditions [14].
Driving CycleDistance
(km)
Time
(s)
Average Speed
(km/h)
Maximum Speed
(km/h)
US 0612.859677.9129.2
NEDC11118033.6120
EPA Highway26.476577.796.6
Disclaimer/Publisher’s Note: The statements, opinions and data contained in all publications are solely those of the individual author(s) and contributor(s) and not of MDPI and/or the editor(s). MDPI and/or the editor(s) disclaim responsibility for any injury to people or property resulting from any ideas, methods, instructions or products referred to in the content.