Article

Daily Light Integral (DLI) Mapping Challenges in a Central European Country (Slovakia)

1
Institute of Cartography and Geoinformatics, Faculty of Informatics, Eötvös Loránd University, 1117 Budapest, Hungary
2
Agricultural Engineering Laboratory, Institute of Technology, Hungarian University of Agriculture and Life Sciences, 2100 Gödöllő, Hungary
3
Department of Postharvest, Supply Chain, Commerce and Sensory Science, Institute of Food Science and Technology, Hungarian University of Agriculture and Life Sciences, 1118 Budapest, Hungary
4
Centre for Economic and Regional Studies, Eötvös Loránd University, 1097 Budapest, Hungary
*
Author to whom correspondence should be addressed.
Appl. Sci. 2025, 15(22), 12254; https://doi.org/10.3390/app152212254
Submission received: 15 October 2025 / Revised: 11 November 2025 / Accepted: 12 November 2025 / Published: 18 November 2025
(This article belongs to the Special Issue Emerging Technologies for Precision Agriculture)

Featured Application

It was demonstrated how customized Daily Light Integral (DLI) maps with 1 mol·m−2·d−1, 2 mol·m−2·d−1 and 5 mol·m−2·d−1 can support optimized lighting strategies in both greenhouse and open-field crop production. These maps help plan supplemental lighting, shading, and efficient use of photosynthetically active radiation (PAR) throughout the year. The results provide a practical tool for improving light management in horticultural and agricultural systems.

Abstract

The role of customized DLI maps in optimizing lighting strategies for controlled and open field crop production is gradually increasing, resulting in the creation of specialized DLI maps for more countries. Daily Light Integral (DLI) [mol·m−2·d−1] is an accumulation or integration of quantum flux measurements per second over one day (24 h), its spatial distribution will be visualized on maps. Our research objectives are: (1) to create 1 mol·m−2·d−1 resolution Slovakia DLI map and explore the seasonal and regional characteristics, (2) to create 2 and 5 mol·m−2·d−1 resolution DLI maps to show how the spatial resolution capabilities change in a local (country) and regional (Europe) context, (3) to summarize and compare the seasonal patterns for mountainous and lowland areas with characteristic DLI values (minimum, maximum, average, range). The current study shows how much light was available at different times of the year using monthly DLI threshold maps for 1 mol·m−2·d−1, 2 mol·m−2·d−1, and 5 mol·m−2·d−1. The data present a clear seasonal and regional pattern. In the seasons, the monthly total DLI maximum and minimum differences reached: 21 DLI units (38–17 mol·m−2·d−1) in spring, 17 DLI units (46–17 mol·m−2·d−1) in summer, 20 DLI units (26–6 mol·m−2·d−1) in autumn, 9 DLI units (13–4 mol·m−2·d−1) in winter. Slovakia is an East–West oriented country, which explains the use of the 1 mol·m−2·d−1 DLI map. DLI maps are of particular importance for plant cultivation technologies that are sensitive to the amount of light and its temporal and spatial distribution, such as greenhouse vegetables or certain fruit species. Spatial DLI data support lighting strategy and design, supplemented by lighting, shading management, and photosynthetically active radiation (PAR) availability and efficient use.

1. Introduction

Light is a fundamental environmental factor required for plant growth and development, functioning not only as an energy source but also as a regulatory signal [1,2,3,4]. Phototropic responses direct plant growth toward the light source, a phenomenon governed by specific photoreceptors sensitive to light quality and direction [5,6,7,8]. Only a certain part of the radiation spectrum (qualitative) can be utilized by plants; at the same time, it is equally important how much photon flux (quantitative) reaches the surface of the plant’s leaves [9]. Qualitative components are characterized by spectral ranges such as photosynthetically active radiation (PAR 400–700 nm), extended photosynthetically active radiation (ePAR 400–750 nm) or photobiologically active radiation (PBAR 280–800 nm) [10,11,12,13] and dedicated wavelengths influencing other photobiological mechanisms, such as photosynthesis, photomorphogenesis, phototropism, stress responses, and metabolic processes [14]. The quantitative parameters are described by photosynthetic photon flux (PPF) [µmol s−1], photosynthetic photon flux density (PPFD) [µmol m−2 s−1], or daily light integral (DLI) [mol·m−2·d−1]. The photosynthetic photon flux (PPF) [µmol s−1] is the total number of photons in the photosynthetically active radiation (PAR) range (400–700 nm) emitted by a light source per second. The photosynthetic photon flux density (PPFD) [µmol m−2 s−1] defines the number of photons in the PAR range that actually arrive at a specific surface area per second [10,15]. Optimal light intensity, photoperiod, and spectral composition can enhance cellular functions and metabolic activity in crops [16,17,18]. Each plant species exhibits a specific light intensity threshold that maximizes photosynthetic efficiency and biomass accumulation [19,20].
Daily Light Integral (DLI) [mol·m−2·d−1] is an accumulation or integration of quantum flux measurements per second over 1 day (24 h). The standard unit for DLI is expressed in mol·m−2·d−1, and it is calculated using the following formula: DLI (photosynthetic photon flux density) = (μmol·m−2·s−1) × photoperiod (h·d−1) × 3600 (s·h−1) × 10−6 [21,22,23,24,25,26]. Using the search terms (‘daily light integral’ and ‘map’), entered into the Web of Science platform, the search returned a total of 10 publications (as of 11 November 2025). For some countries, DLI maps exist in the USA [22], China [27], Hungary, and Spain [25,26]. Methodologically, DLI maps are based on the concepts of Faust and Logan [22], Blonquist and Bugbee [28], who suggested that 45% of the total solar radiation falls within the PAR range, and they used a conversion factor of 4.484 μmol·m−2·s−1. This concept is widely adopted by the scientific community and used in DLI mapping.
DLI maps represent crucial information layers in precision farming. A country-scale DLI map could be useful for understanding regional and seasonal light distribution. DLI maps are not commonly and widely used because of their limited availability and accessibility. Several researchers emphasized the importance of customized DLI maps to optimize lighting strategies in controlled and open-field crop production [21,22,26,29,30,31,32].
Factors that fundamentally influence DLI values include geolocation, seasonal variation, weather conditions, and topographic diversity. Slovakia, located in the continental temperate climate zone [33], exhibits considerable climatic variability shaped by these factors. Average annual temperatures range from 5 to 8.5 °C, with July being the warmest month (average 25 °C) and January the coldest (average 1 °C), resulting in an annual temperature amplitude of approximately 24 °C. The country receives an average annual precipitation of about 648 mm, with the highest rainfall occurring during June–August (approximately 213 mm in total) [34]. July is typically the wettest month, averaging 77 mm of precipitation. Annual sunshine duration ranges from 1600 to 2000 h, with the Southern lowlands receiving the most solar radiation. The Southern lowlands represent the most fertile agricultural zones, benefiting from higher solar radiation, longer growing seasons, and elevated Daily Light Integral (DLI) values [35]. Therefore, developing a detailed DLI map for Slovakia is a crucial step toward agricultural practices to support sustainable lighting strategy, resource efficiency, and climate-resilience. By accurately assessing the spatial and seasonal variability of light availability, farmers and growing consultants can make profound decisions about crop selection, supplemental lighting or shading, and production management.
Present research and studies show that there is an existing gap in DLI mapping for European countries; no publications related to this topic have been found for Slovakia. As one of the smallest countries in Eastern Europe, Slovakia serves as a prototype area for testing different DLI mapping scales and demonstrating their usability. Our research objectives are:
(i)
to create a 1 mol·m−2·d−1 resolution Slovakia DLI map and explore the seasonal and regional characteristics,
(ii)
to create 2 and 5 mol·m−2·d−1 resolution DLI maps to show how the spatial resolution capabilities change in a local (country) and regional (Europe) context,
(iii)
to summarize and compare the seasonal patterns for mountainous and lowland areas with characteristic DLI values (minimum, maximum, average, range).

2. Materials and Methods

2.1. Study Area

Located in Central Europe, Slovakia—total area 49,035 km2, latitudes between ~47°44′ N and 49°36′ N, and longitudes between ~16°51′ E and 22°34′ E—has diverse geographical zones from the high-altitude Tatra Mountains in the North to fertile lowlands along the Danube River in the South, presenting complex topographic and climatic gradients that demand detailed light climate assessment. Approximately 50.2% of the country’s territory consists of woodland and scrubland, 24.7% of croplands, 17.9% of grassland, 4.1% of water areas and wetland, and 3.1% of artificial land [36]. Lowlands are concentrated mainly in the Southern and Southwestern regions, such as the Danube Lowland (area: 14,993 km2, altitude ranges: 100–350 m), the Eastern Slovak Lowland (area: 6752 km2, altitude ranges: 150–200 m), and the Záhorie Lowland (area: 570 km2, altitude ranges: 100–300 m). These lowland regions stand in contrast to Slovakia’s mountainous highlands, shaping the country’s agricultural capacity and climate variation [37] (Figure 1).

2.2. Spatial Sampling, Data Acquisition, and Automation

A 30 m resolution grid was used for spatial sampling, generated from 1 arcsec global digital elevation data, which was derived from the Shuttle Radar Topography Mission (SRTM) for Slovakia [38]. The coordinates were saved (CSV format) for further processing, and these sampling points were referenced by the WGS 84 horizontal datum and the EGM96 geoid for vertical referencing. Because of the large amount of spatial data, manual access to a country-level DLI map is not available automatically.
To increase the efficiency of data retrieval, an automated script-based pipeline was implemented. This was developed using PHP (version 8.2). To send API calls and to retrieve DLI values to each grid point, the Sun Tracker remote server was remotely integrated [39]. This was made with Linux Mint 21 on an Ubuntu server 20.4 LTS hosted by Oracle Virtual Box. The acquired values were in JSON format, which were converted and stored as CSV files for further analysis. The script also included verification to handle missing or malformed data. Such responses were recorded with the “xxxx” string and created a secondary script (repeat.php) in case of running these incomplete entries again. Furthermore, the validation checks ensured that in the final CSV files, there is no incomplete, corrupt, or repetitive data without any loss of values.
DLI values retrieved were georeferenced, processed, and analyzed in QGIS 3.30 [40]. Three separate thematic maps were created from the raw monthly data. Specific thresholds such as 1 mol·m−2·d−1, 2 mol·m−2·d−1, and 5 mol·m−2·d−1 were used to study the monthly DLI distribution in space. DLI data was acquired from the Sun Tracker DLI calculator (Sun Tracker Technologies Ltd.), which is an online website where we can retrieve the cumulative daily DLI values received over a 24 h period. Pyranometric data from 1991 to 2020 were used, following the standards of the World Meteorological Organization (WMO). This system builds hybrid data techniques that are based on the World Meteorological Organization’s (WMO) ground weather stations, as well as NOAA (National Oceanic and Atmospheric Administration) GOES (Geostationary Operational Environmental Satellite) satellite data. The geographic coordinate-based DLI calculations were made by internationally accepted methods using the following formula: DLIPAR (photosynthetic photon flux density in PAR range (400–700 nm) = (μmol·m−2·s−1) × photoperiod (h·d−1) × 3600 (s·h−1) × 10−6. The incoming PAR photon flux density (μmol·m−2·s−1) is calculated by taking 45% of the solar spectrum (300–3000 nm) and multiplying by the factor of 4.484 [22].

3. Results

3.1. High Precision 1 mol·m−2·d−1 DLI Map

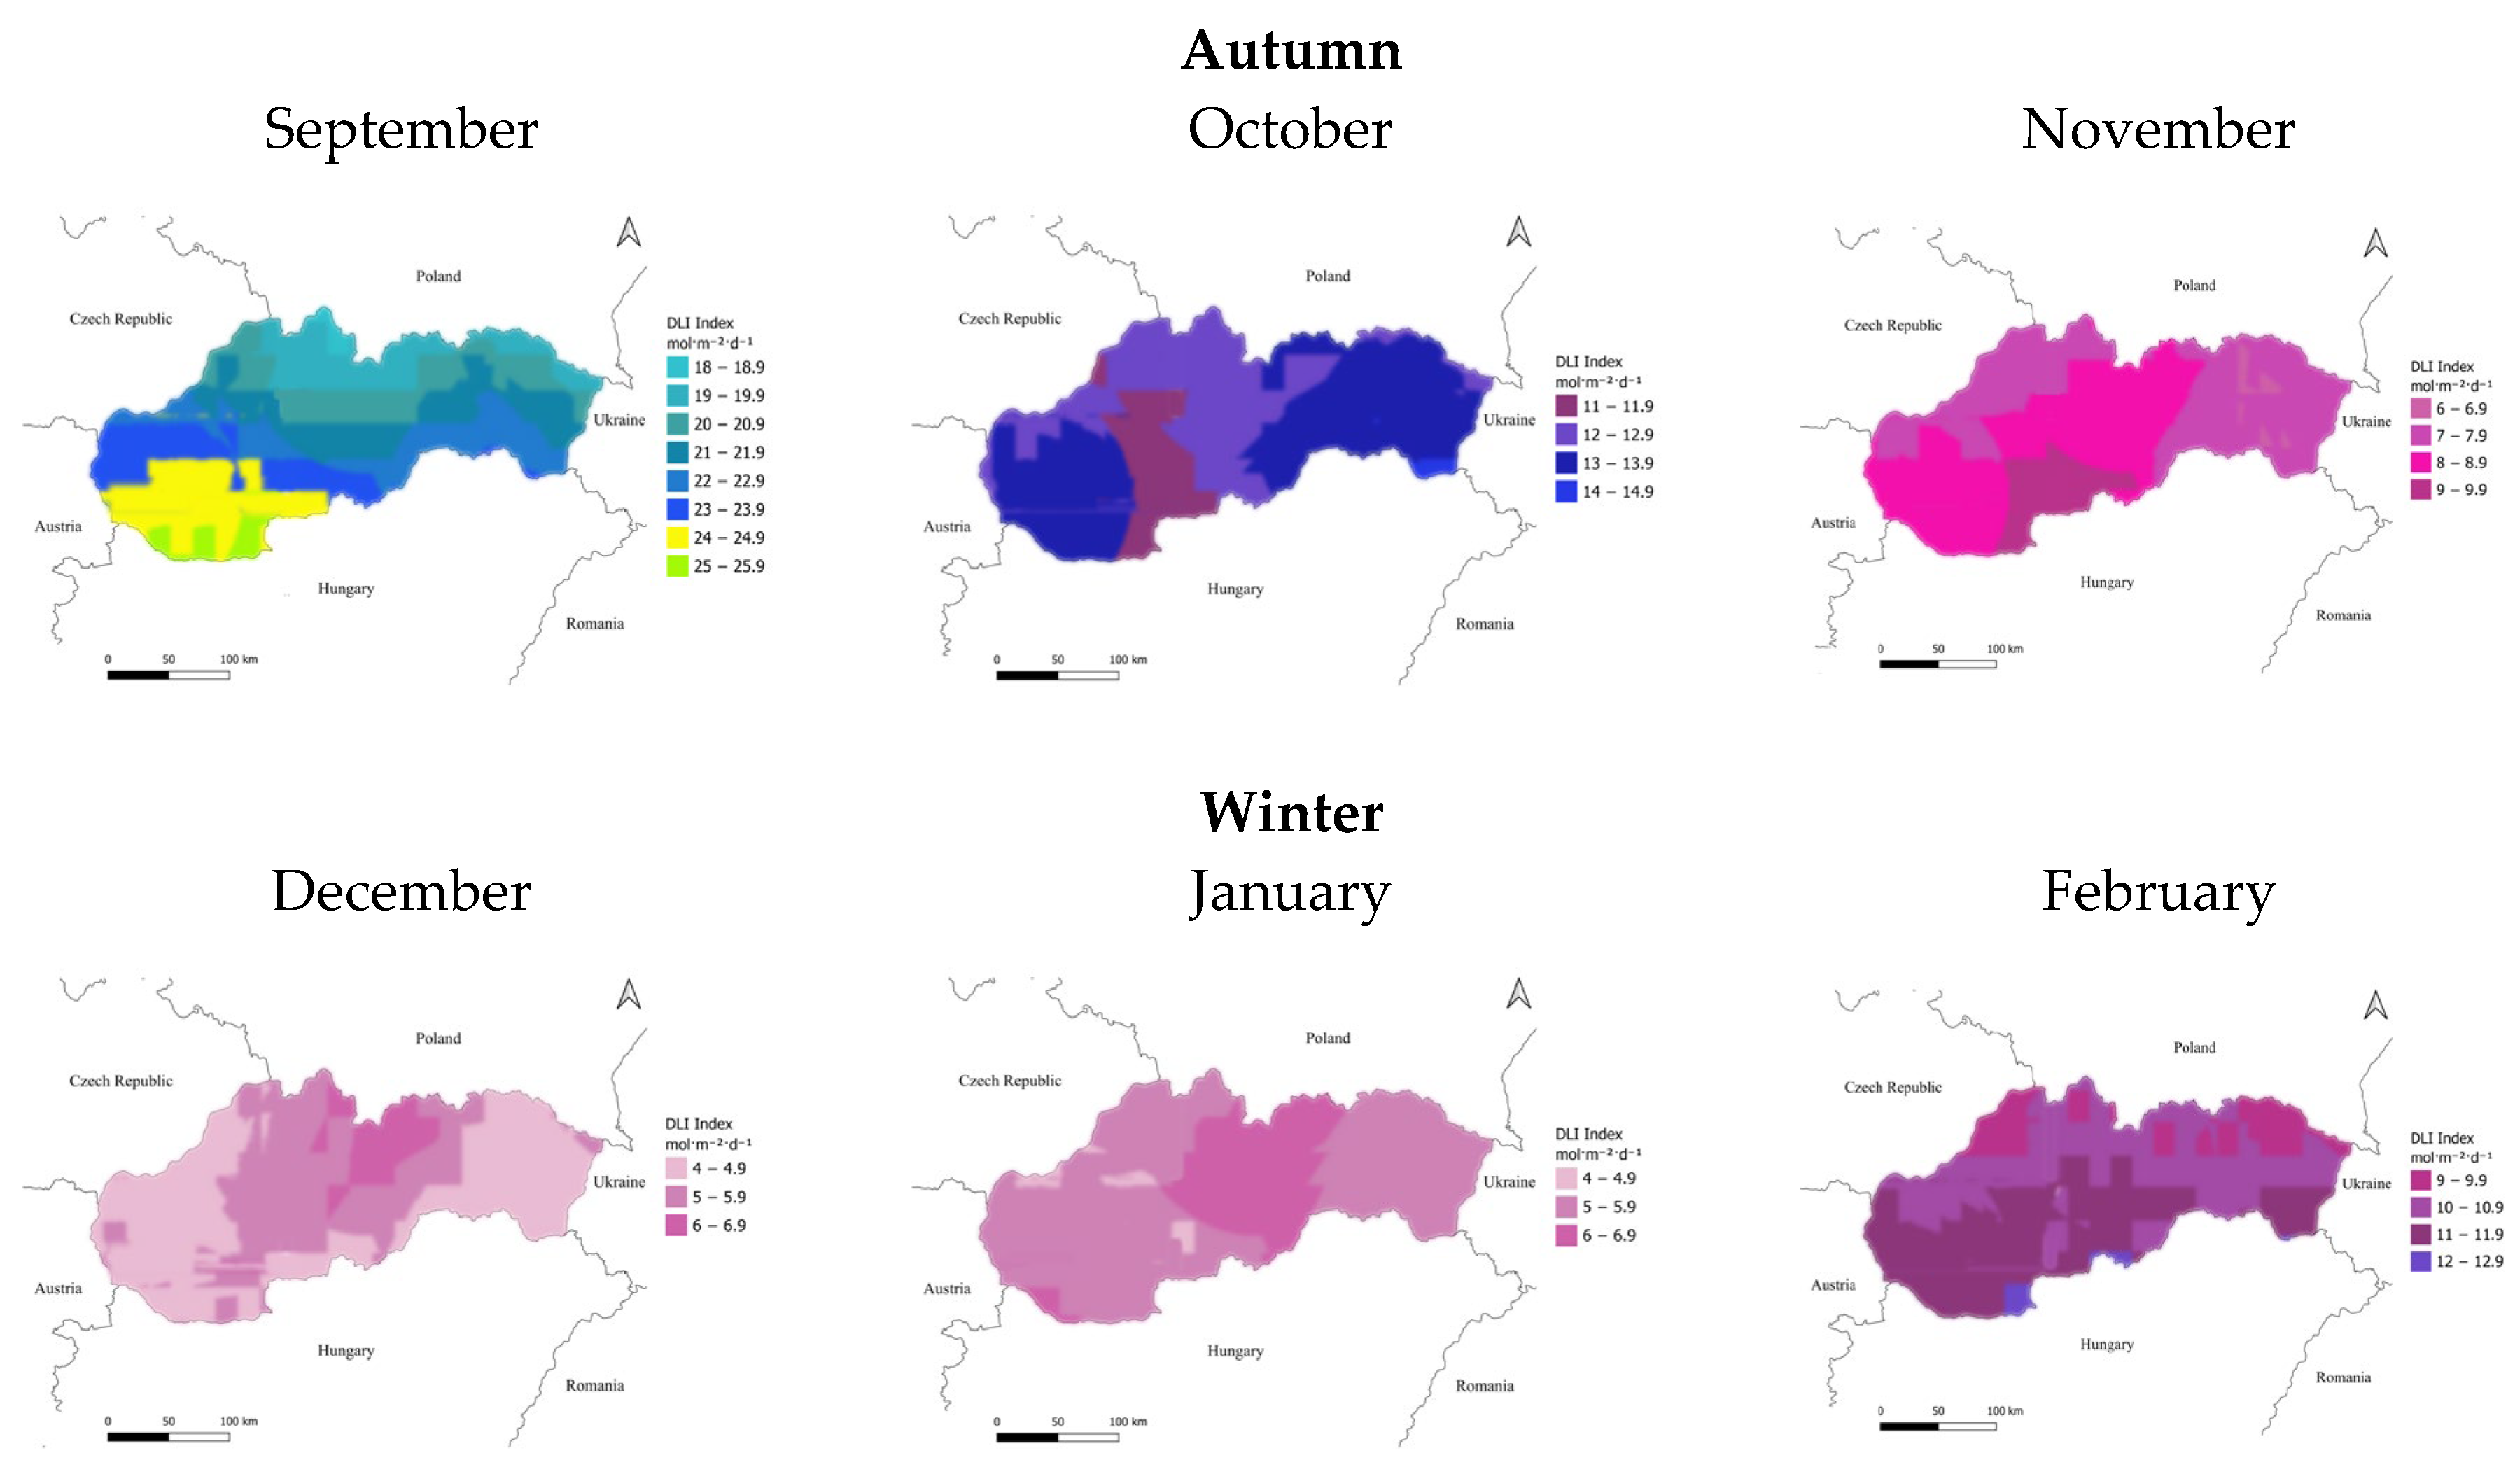
The ranges of minimum DLI values in the spring months (March, April, and May) are in a moderate range, spanning 11 DLI units. It begins with a minimum value of 17 mol·m−2·d−1 in March and 24 mol·m−2·d−1 in April, and increases to a minimum value of 28 mol·m−2·d−1 in May. The range of maximum DLI values in the same period spans 16 DLI units. It begins with a maximum value of 22 mol·m−2·d−1 in March and 37 mol·m−2·d−1 in April and increases to a maximum value of 38 mol·m−2·d−1 in May. In the spring season, the monthly total DLI minimum and maximum differences reached 21 DLI units.
The ranges of minimum DLI values in the summer months (June, July, and August) are in the second narrowest range, spanning 8 DLI units. It begins with a minimum value of 33 mol·m−2·d−1 in June and 29 mol·m−2·d−1 in August, and increases to a minimum value of 36 mol·m−2·d−1 in July. The range of maximum DLI values in the same period spans 7 DLI units. It begins with a maximum value of 39 mol·m−2·d−1 in August and 44 mol·m−2·d−1 in June, and increases to a maximum value of 46 mol·m−2·d−1 in July. In the summer season, the monthly total DLI minimum and maximum differences reached 17 DLI units.
The ranges of minimum DLI values in the autumn months (September, October, and November) are in the broadest range, spanning 12 DLI units. It begins with a minimum value of 6 mol·m−2·d−1 in November and 11 mol·m−2·d−1 in October, and increases to a minimum value of 18 mol·m−2·d−1 in September. The tendency is showing a shift to the winter months. The range of maximum DLI values in the same period spans 17 DLI units. It begins with a maximum value of 10 mol·m−2·d−1 in November and 15 mol·m−2·d−1 in October, and increases to a maximum value of 26 mol·m−2·d−1 in September. In the autumn season, the monthly total DLI minimum and maximum differences reached 20 DLI units.
Analyzing the seasonal changes in DLI maps, there are some recognizable patterns to observe. The ranges of minimum DLI values in the winter months (December, January, and February) are the narrowest, spanning 5 DLI units. It begins with a minimum value of 4 mol·m−2·d−1 in December and January and increases to a minimum value of 9 mol·m−2·d−1 in February. The ranges of maximum DLI values in the same period also span 6 DLI units. It begins with a maximum value of 7 mol·m−2·d−1 in December and January and increases to a maximum value of 13 mol·m−2·d−1 in February. In the winter season, the monthly total DLI minimum and maximum differences reached 9 DLI units (Figure 2).
The DLI ranges show a characteristic pattern. The most variable are the spring months: on 5 March, DLI units; on 13 April, DLI units; and on 10 May, DLI units. Summer months are balanced: on 11 June, DLI units; on 10 July, DLI units; and on 10 August, DLI units. In autumn, a DLI range narrowing is observed, with September having 8 DLI units, October having 4 DLI units, and November having 4 DLI units. The smallest and most balanced DLI months are in the winter months; December has 3 DLI units, January has 3 DLI units, and February has 4 DLI units.
The Carpathian Mountain ridge includes the high peaks of the High and Low Tatras, the Western Carpathians, the Slovak Ore Mountains, and the Eastern Carpathians. The Slovak Ore Mountains border Northern Hungary, known for its mineral resources and caves. The higher parts of the Western Carpathians and Eastern Carpathians are characterized by forested areas and valleys. Generally, DLI tendencies are recognizable in Slovakia as well, with narrow DLI ranges and values in winter, and broader ranges and higher values in summer. Slovakia’s terrain and topography are dominated by mountains, which is a very influential factor and a powerful modifier of spatial and temporal DLI values. In spring, the DLI values are 17–20 mol·m−2·d−1 in March 24–30 mol·m−2·d−1 in April, and 28–34 mol·m−2·d−1 in May. The mountain areas show an approximate DLI range of 17 units, with a peak of 34 mol·m−2·d−1 in May and a minimum of 17 mol·m−2·d−1 in March. In summer, the DLI values are 33–39 mol·m−2·d−1 in June, 36–40 mol·m−2·d−1 in July, and 29–35 mol·m−2·d−1 in August. In the mountains, a very narrow DLI range of 11 units is observed, with a peak of 40 mol·m−2·d−1 in July and a minimum of 29 mol·m−2·d−1 in August. In autumn, the DLI values are 18–23 mol·m−2·d−1 in September, 11–13 mol·m−2·d−1 in October, and 6–8 mol·m−2·d−1 in November. The mountainous DLI range in fall is 17 units, with a maximum of 23 mol·m−2·d−1 in September and a minimum of 6 mol·m−2·d−1 in November. In winter, the DLI values are 4–7 mol·m−2·d−1 in December, 4–7 mol·m−2·d−1 in January, and 9–12 mol·m−2·d−1 in February. In the mountains, a DLI range of 8 units is observed, with a peak of 12 mol·m−2·d−1 in February and a minimum of 4 mol·m−2·d−1 in December and January. It is worth mentioning that in the mountains, DLI values are typically lower in the summer months (June, July, August), but in the winter months (December, January), DLI values can be relatively higher in the mountains within a narrow 2 DLI units DLI range with 5–7 mol·m−2·d−1 lower values. In Summer, the DLI values are generally lower in the mountains, within a 6 DLI unit range, with 33–39 mol·m−2·d−1. The winter DLI values are often higher in mountains than in lowlands because higher elevations receive more sunlight due to a thinner atmosphere, cleaner air, and snow reflection. In contrast, valleys frequently experience fog, haze, and cloud cover from temperature inversions, which block and diffuse light, reducing DLI (Table 1).
The Slovak Lowlands include the Danube Basin (area: 14,993 km2), the Eastern Slovak Lowland (area: 6752 km2), and the Záhorie Lowland (area: 570 km2). The Danube Basin and Záhorie Lowland are geographically close to each other and have similar DLI values, while the Eastern Slovak Lowland is located on the other side of the country. In spring, DLI values in the lowlands range from 19 to 22 mol·m−2·d−1 in March 30–37 mol·m−2·d−1 in April, and 33–38 mol·m−2·d−1 in May. This corresponds to an approximate DLI range of 19 units, with a minimum of 19 mol·m−2·d−1 in March and a peak of 38 mol·m−2·d−1 in May. In summer, DLI values are 40–43 mol·m−2·d−1 in June, 40–46 mol·m−2·d−1 in July, and 34–39 mol·m−2·d−1 in August. The lowlands exhibit a DLI range of 12 units, with a minimum of 34 mol·m−2·d−1 in August and a peak of 46 mol·m−2·d−1 in July. In autumn, DLI values are 22–26 mol·m−2·d−1 in September 12–15 mol·m−2·d−1 in October, and 8–10 mol·m−2·d−1 in November. The DLI range in the lowlands is 18 units, with a maximum of 26 mol·m−2·d−1 in September and a minimum of 8 mol·m−2·d−1 in November. In winter, DLI values are 4–5 mol·m−2·d−1 in December 5–7 mol·m−2·d−1 in January, and 11–12 mol·m−2·d−1 in February. The lowlands show a DLI range of 8 units, with a minimum of 4 mol·m−2·d−1 in December and a peak of 12 mol·m−2·d−1 in February.

3.2. Comparison of DLI Maps for 1 mol·m−2·d−1, 2 mol·m−2·d−1 and 5 mol·m−2·d−1

The Carpathian Mountain ridge includes the high peaks of the High and Low Tatras, the Western Carpathians, the Slovak Ore Mountains, and the Eastern Carpathians. The Slovak Ore Mountains border Northern Hungary, known for its mineral resources and caves. The spatial distribution and ranges of DLI values are basically defined by spatial-temporal (geolocation) and seasonal conditions (geometry), but they are influenced by other factors. From a meteorological point of view (cloud and precipitation forms, surface reflectance/albedo) and from a topographical point of view (altitude, slope, orientation, horizontal limitations, vegetation volumetric parameters, and human landscape interventions), the DLI values are additionally modified. These effects are accumulated and result in a complex and mosaicked pattern. Slovakia is situated between its Northernmost point at 49°36′48″ N and its Southernmost point at 47°44′21″ N, giving a North–South extent of about 1.87 degrees of latitude. This is an actual distance of approximately 208 km, from west to East, the country extends between 16°50′56″ E and 22°33′53″ E, a difference of about 5.72 degrees of longitude, so the East–West span amounts to nearly 420 km. In general, the North–South orientation has a stronger effect on DLI values than the East–West orientation. This is because the North–South axis influences the daily and seasonal solar path, resulting in more pronounced differences in the duration and angle of incoming radiation. While East–West orientation also contributes to DLI variability, its impact is typically weaker and more dependent on local topography and the specific time of year.
The three scales (1 mol·m−2·d−1, 2 mol·m−2·d−1, and 5 mol·m−2·d−1) are based on the same meteorological field data and spatial sampling strategy, while the DLI resolutions are different. DLI maps with alternative resolutions are useful for different applications; neither one is better nor worse than the other, but each is good for different purposes. Various advantages can be achieved if maps with all three resolutions are created. Although technically feasible, maps above DLI map at 5 mol·m−2·d−1 have not become widespread, and we have not found any published studies on this topic, because the visualization would be too homogeneous and uninformative. An appropriately broad scaling range (over 5 DLI increments) is masking the visual diversity of areas, while they typically have different actual DLI values.
Based on the monthly daily light integral (DLI) maps of Slovakia, comparing three resolutions simultaneously provides detailed monthly differences for a better understanding of DLI variability and complexity. The most detailed DLI map with 1 mol·m−2·d−1 was calculated for Slovakia, which is the highest resolution map available with the current methodology. Data are based on the World Meteorological Organization’s (WMO) ground weather station measurements as well as NOAA (National Oceanic and Atmospheric Administration) GOES (Geostationary Operational Environmental Satellite) satellite values.
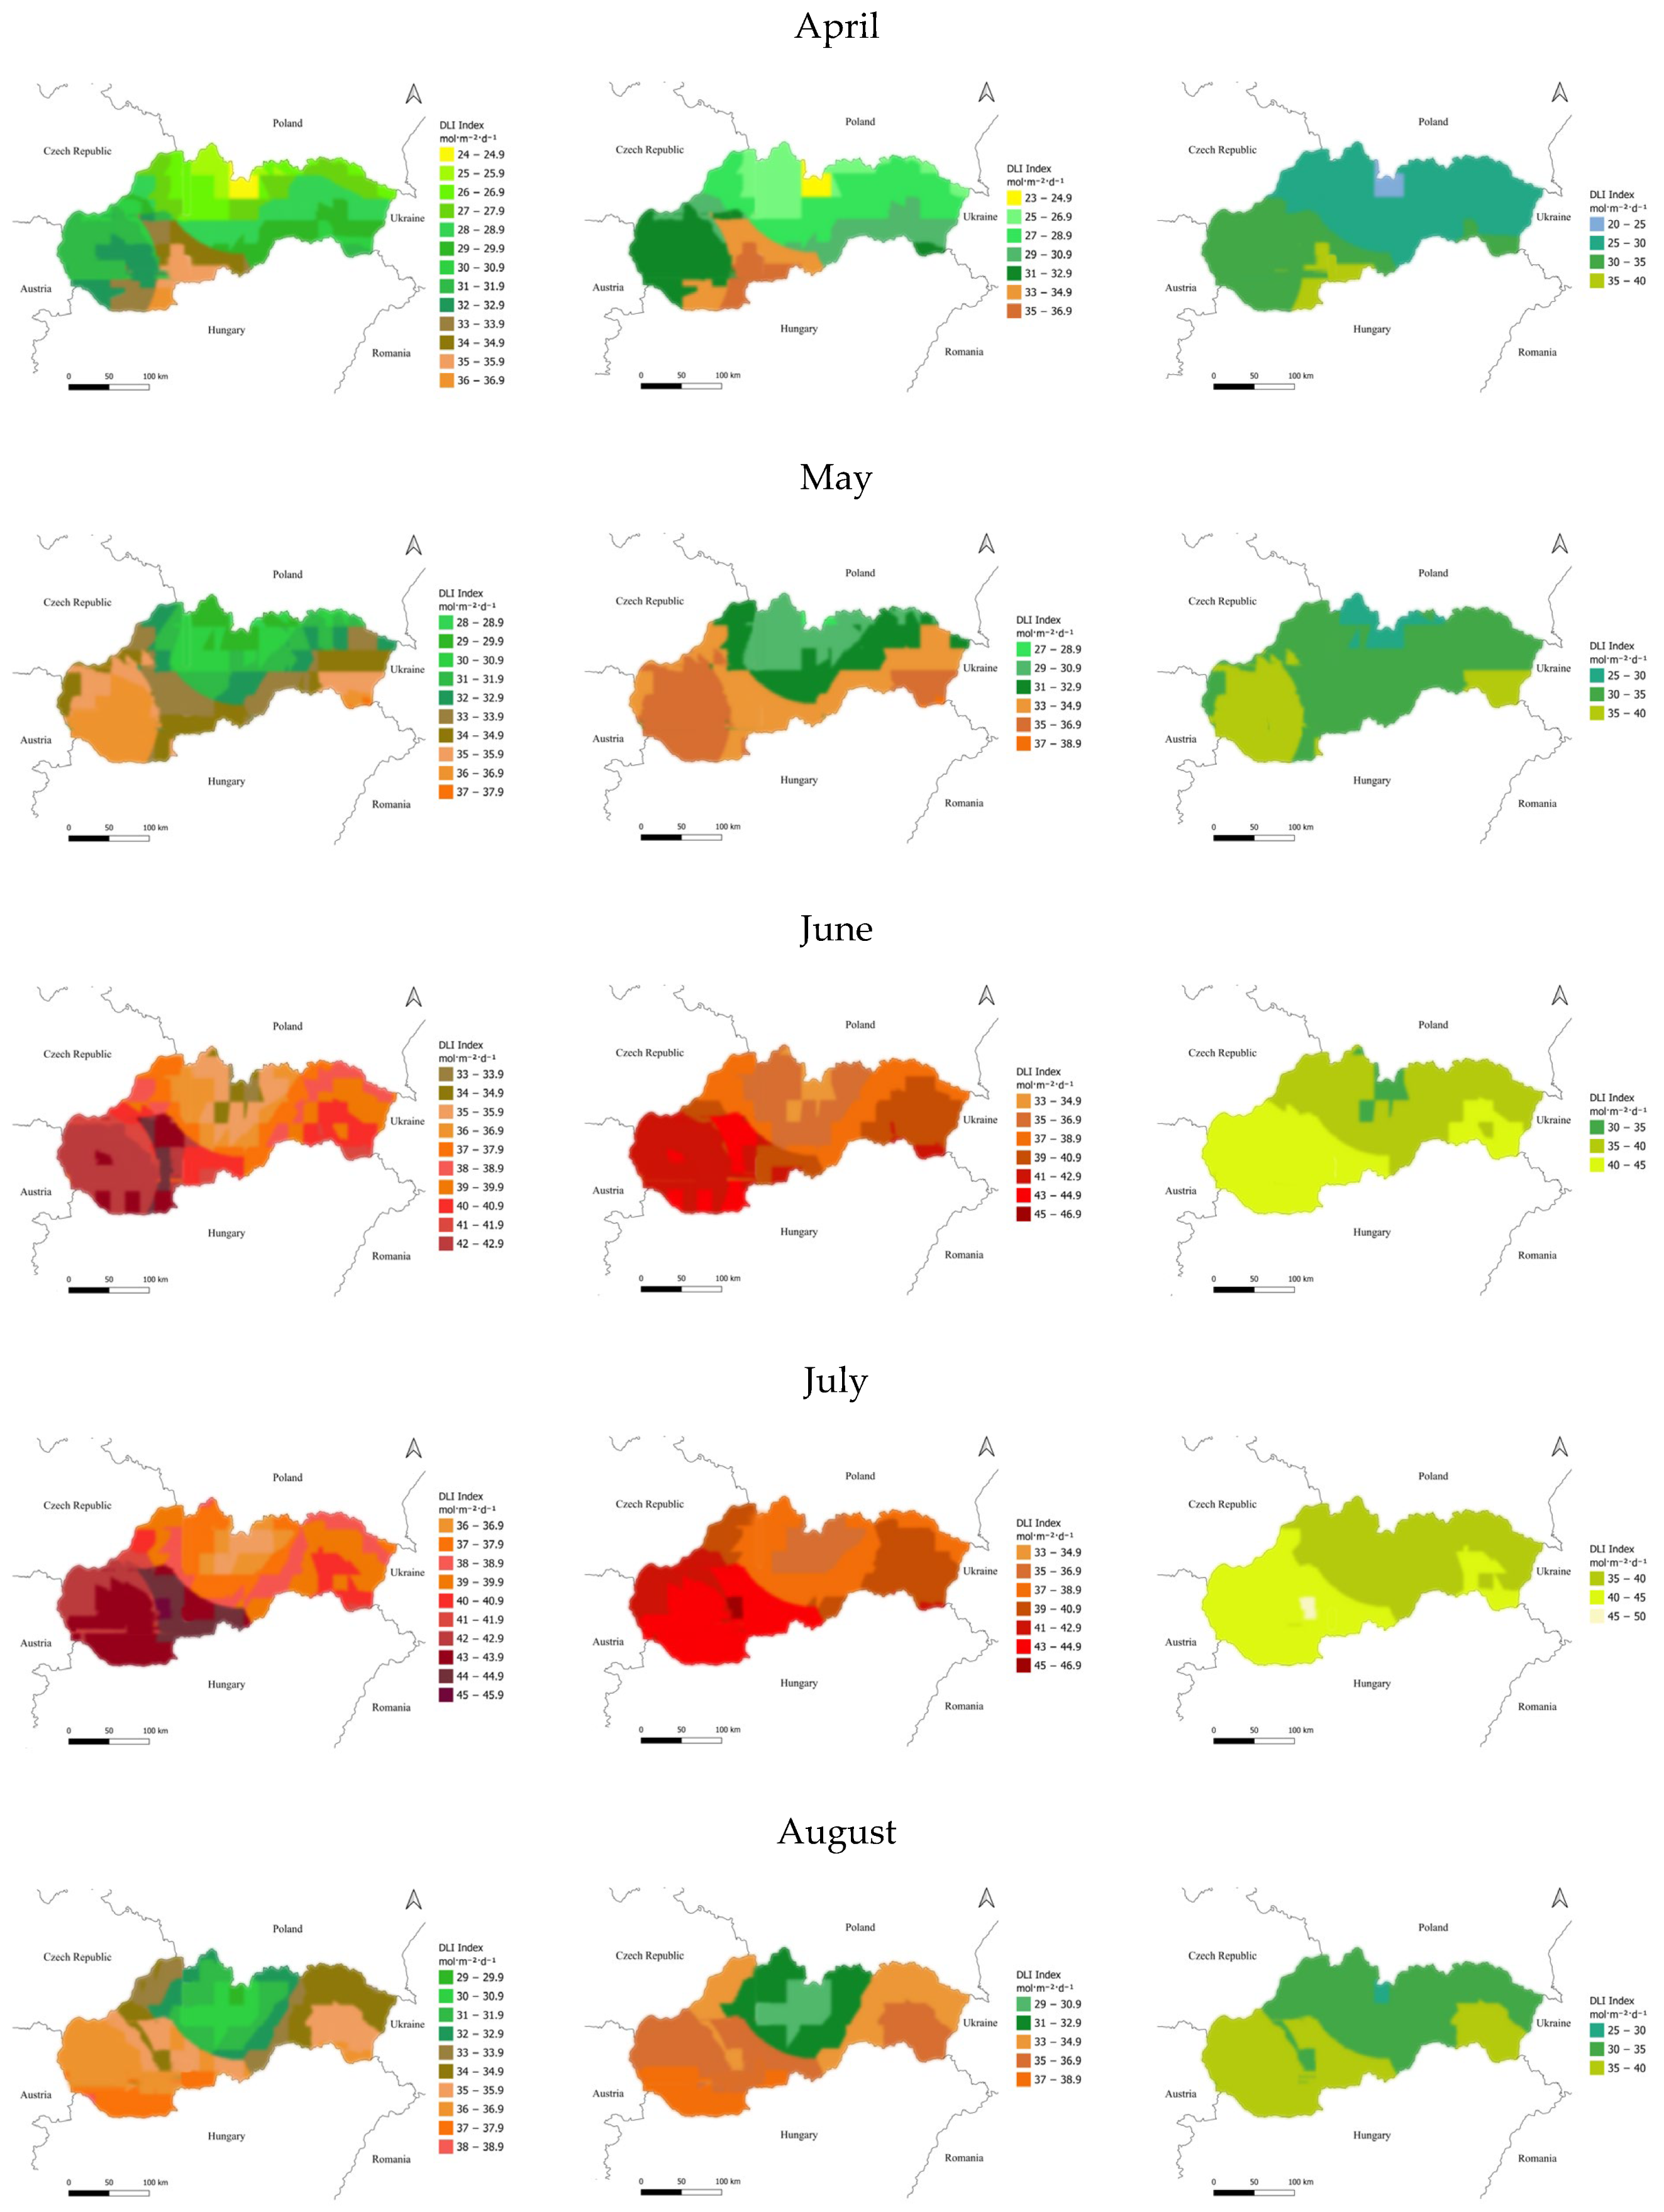
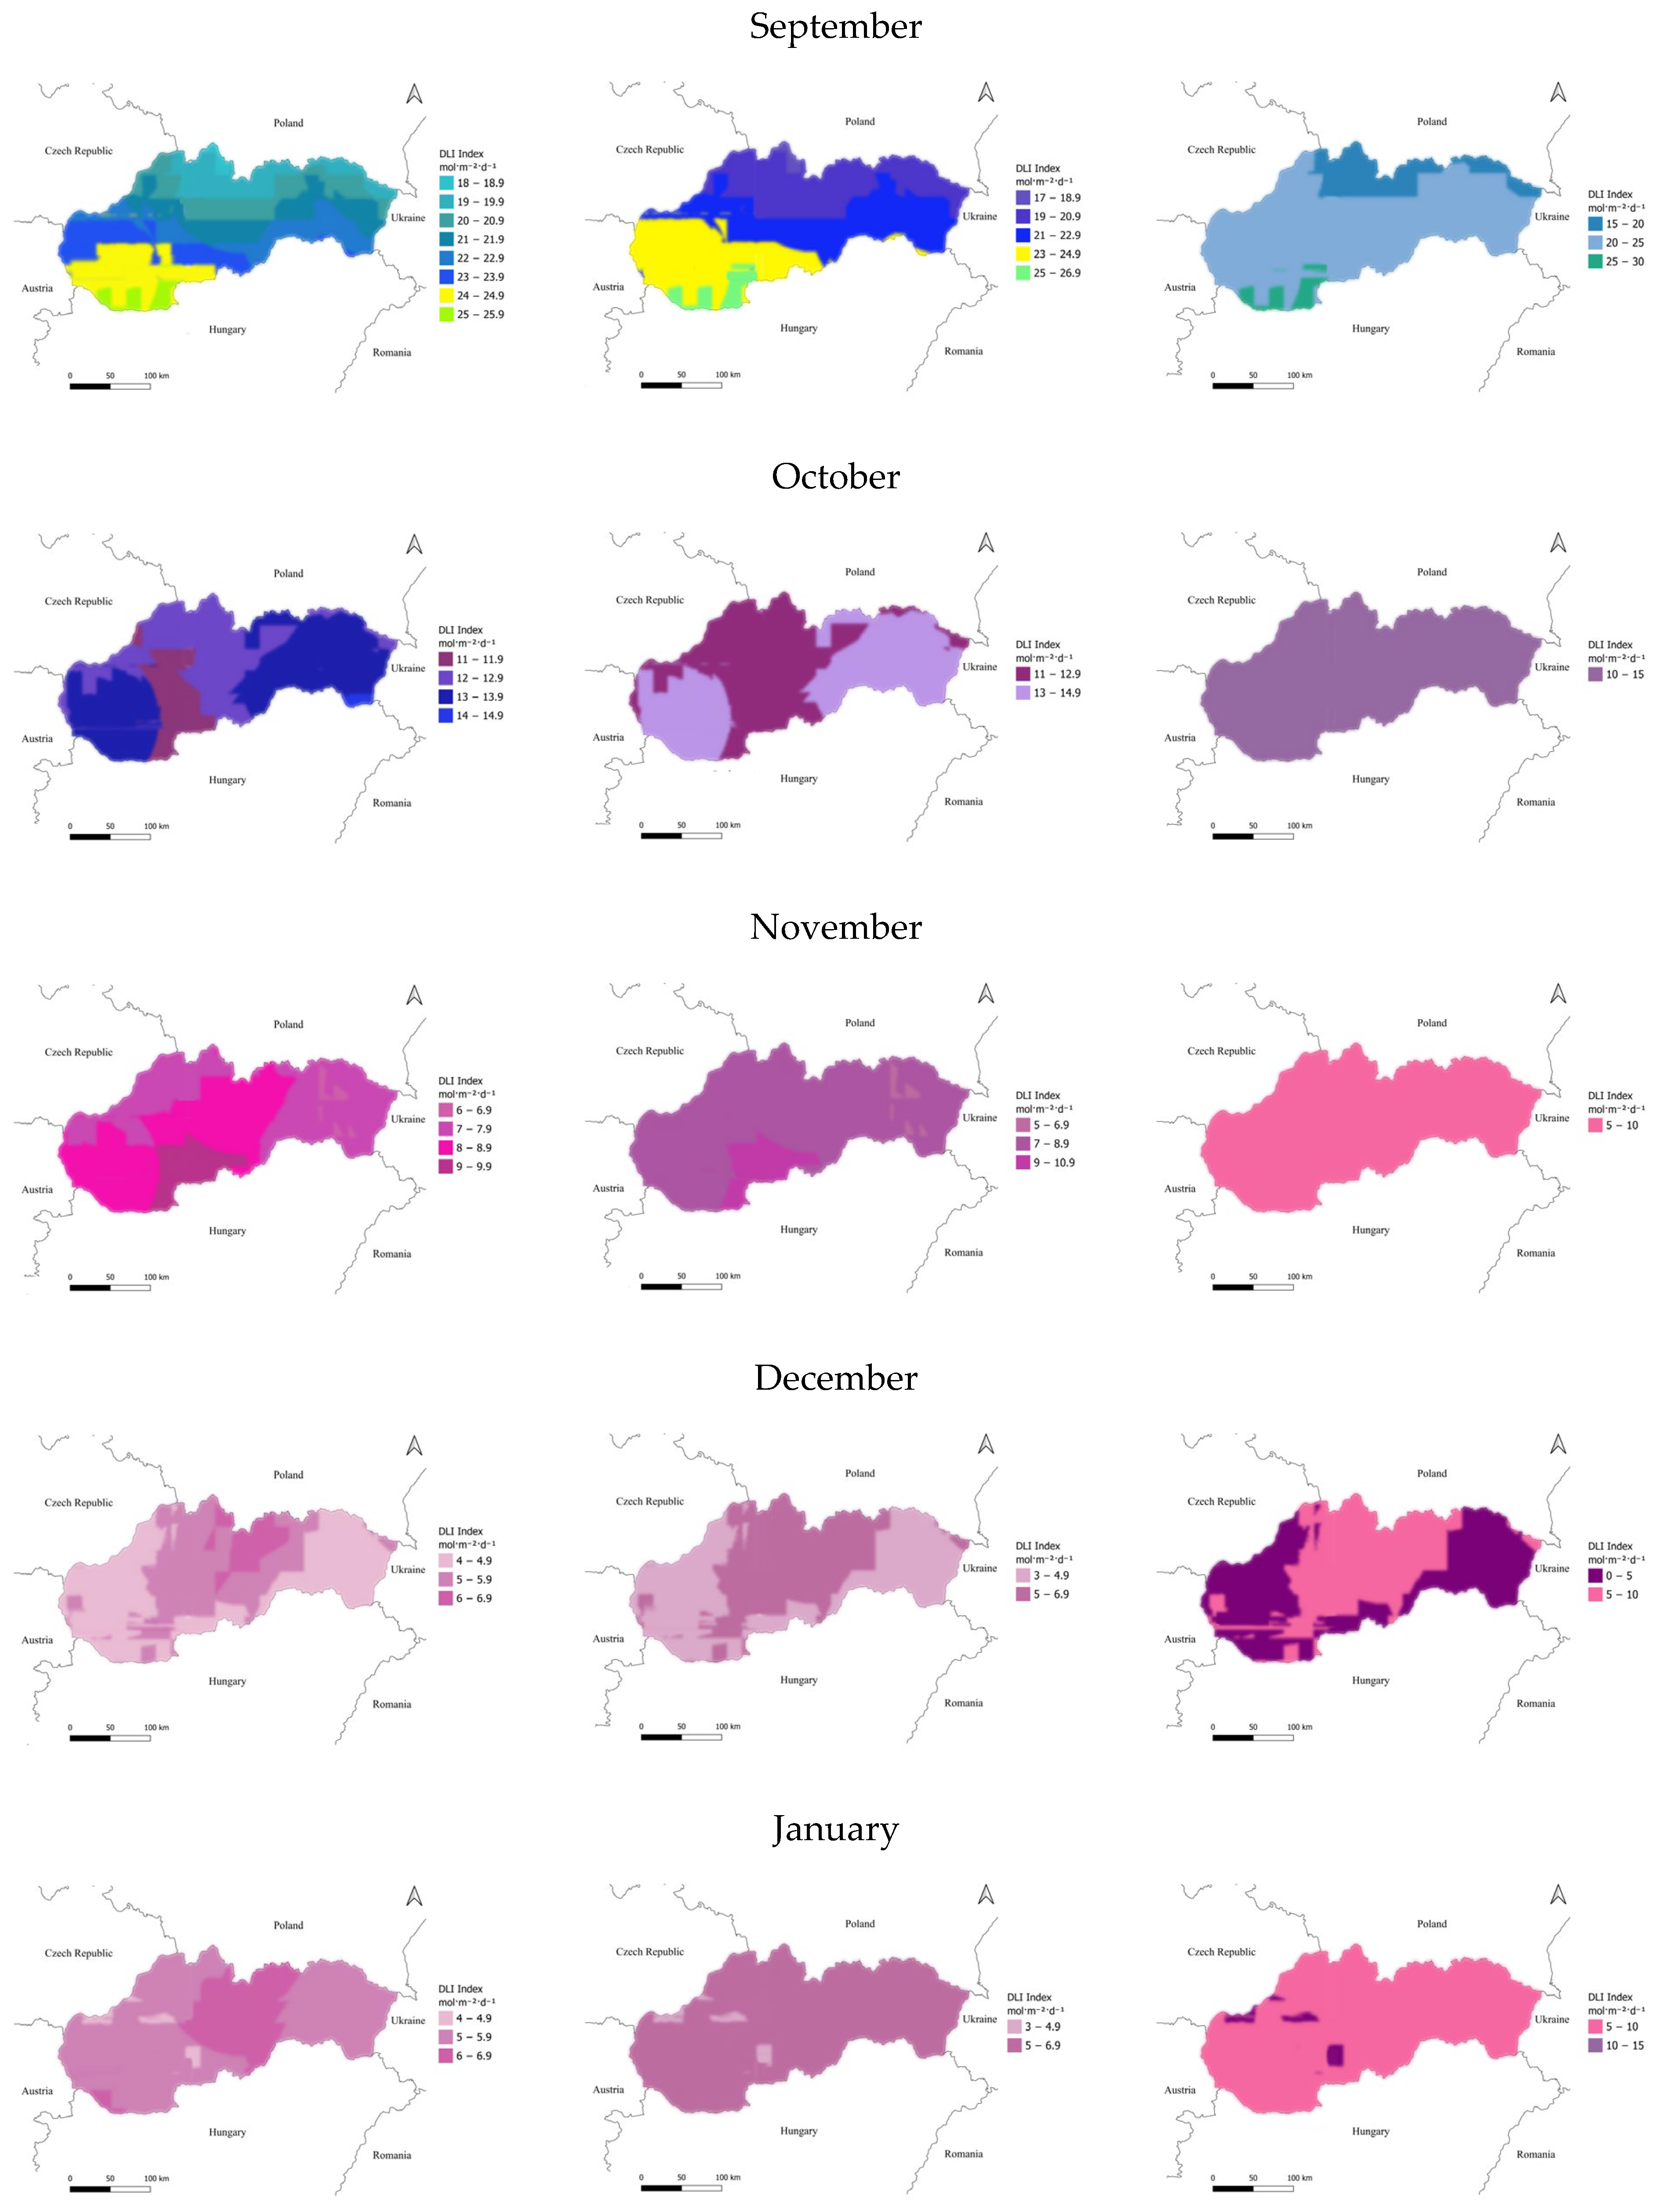
1 mol·m−2·d−1 maps enable farmers to make decisions related to light utilization (plant species selection, supplemental lighting, shading, etc.) based on the needs of their crops using monthly DLI maps. Due to the high resolution, the DLI mosaic structure can be used during cultivation. This is particularly important in the Slovak lowlands (Danube Basin, Eastern Slovak Lowland, Záhorie Lowland), where the majority of cultivation takes place. The significance of DLI heterogeneity is reflected in the differences in monthly DLI values, which are highest in the following order: 7 mol·m−2·d−1 (April), 6 mol·m−2·d−1 (July), 5 mol·m−2·d−1 (May, August), 4 mol·m−2·d−1 (September), 3 mol·m−2·d−1 (March, June, October), 2 mol·m−2·d−1 (November, January), 1 mol·m−2·d−1 (December, February) (Figure 3).
The raw DLI data behind the DLI maps are the same, but the display resolution varies. However, it is important to interpret the potential of visualization correctly using DLI ranges. For instance, in March, the visualization range is 17–22 DLI (1 mol·m−2·d−1 resolution scale), 17–23 DLI (2 mol·m−2·d−1 resolution scale), and 15–25 DLI (5 mol·m−2·d−1 resolution scale). This difference arises not from the measured values themselves but from the rescaling applied during map adjustment. A DLI map with a resolution of 5 mol·m−2·d−1 does not provide deeper spatial information about the distribution of lower resolution values, but if we also prepare maps with resolutions of 2 mol·m−2·d−1 and 1 mol·m−2·d−1, DLI resolution maps, these distributions can also be explored if necessary. In our case, all three maps have been created, so we can obtain more detailed spatial information monthly with the 1 mol·m−2·d−1 and 2 mol·m−2·d−1 maps. The Supplementary Materials contain the monthly DLI maps of Slovakia with 1, 2, and 5 mol·m−2·d−1. Separate maps are also available for comparison in further studies (Figures S1–S3). For the highest resolution, it is recommended to use the 1 mol·m−2·d−1 DLI map.

4. Discussion

The study area experiences four distinct seasons, with a climate predominantly characterized by continental conditions, particularly in the Eastern and Central regions. The Western areas exhibit a slight maritime influence, while alpine effects are observed in the high mountain regions. The Southern part of the country and the neighboring Danubian lowland are warmer and more arid than the more humid Northern regions [41,42]. The determining factors of the country’s climate are its geolocation, altitude above sea level, and exposure, which basically influence DLI values. The Daily Light Integral (DLI) [mol·m−2·d−1], as the accumulation or integration of quantum flux measurements per second over one day (24 h), was visualized on DLI maps with spatial and seasonal aspects. For better understanding and a focused overview, a Summary of seasonal and regional DLI maps with characteristic DLI values (minimum, maximum, average, range) was provided. The analysis of monthly DLI values for Slovakia shows clear seasonal and spatial patterns.
One of the major contributions of this study is the development of a 1 mol·m−2·d−1 resolution DLI map, as finer-resolution mapping provides new insights into high-resolution spatial and temporal light variability and enables more efficient, location- and region-specific agricultural lighting planning. A 1 mol·m−2·d−1 DLI map has not yet been developed for Slovakia, and no related publications are currently available. This advancement also allows for improved temporal and spatial comparisons that support practical applications. The fine-scale mapping reveals microclimatic and topographic influences on light distribution that are not visible in coarser datasets. The new perspective offered by this study is both methodological, demonstrating how high-resolution DLI maps can be generated and what limitations should be considered, and application-oriented, providing tools for more accurate agricultural planning, including crop selection and supplemental lighting strategies. Moreover, this approach establishes a framework applicable to other Central and Eastern European regions. Currently, among the countries in this region, only Hungary has a similarly detailed DLI map available [25]. Slovakia lies North of Hungary and shares around 627 km of border, even though the DLI values show differences because its range varies from 3 to 10 mol·m−2·d−1 in winter and 33–46 in the peak summer period from June to August. DLI in Hungary ranges from 4 to 5 mol·m−2·d−1 in winter and 46–47 mol·m−2·d−1 in summer. So, the availability of DLI in Slovakia in comparison with Hungary is lower [25,26].
All DLI calculations at different scales are based on the same input data sources. The comparison of DLI maps at three resolutions—1, 2, and 5 mol·m−2·d−1—demonstrates the advantages of high-resolution mapping. While coarser 5 mol·m−2·d−1 maps provide an overview of regional trends, the 1 mol·m−2·d−1 maps capture fine-scale heterogeneity critical for local agricultural decision-making, allowing for targeted supplemental lighting, shading, or crop selection. This approach enhances productivity and ensures efficient use of resources. The creation of 5 DLI resolution maps was primarily motivated by the desire to make the results comparable with other DLI maps with the same classification (0–5 mol·m−2·d−1, 5–10 mol·m−2·d−1, 10–15 mol·m−2·d−1, etc.) as this is the most common resolution and classification display [21]. The ideal DLI map resolution depends on the research or practical purpose. Spain’s study underscores that finer-scale increments, such as 2 mol·m−2·d−1, better capture intra-regional gradients, also applicable to Slovakia’s topographically complex terrain. The findings give an insight that ultimately, these reinforce the necessity of regionally tailored lighting strategies in Central and Eastern Europe, considering not just DLI magnitudes but also their spatial-temporal stability. These studies validate that Slovakia, particularly its central and Northern parts, is more limited by low solar input in the winter and thus requires artificial lighting systems or light-assisted horticulture for reliable production during off-peak seasons.
According to the European commission’s data sources [36,43], 50.2% of the country’s territory consists of woodland and scrubland, 24.7% of croplands, 17.9% of grassland, 4.1% of water areas and wetland, and 3.1% of artificial land. Totally, 47% of Slovakia’s territory is used for agricultural purposes. Wheat is a major cereal produced in the region, root crops such as potatoes, sugar beet, and maize, and industrial crops such as red clover and pulp are also common in the area [36,44]. Winter has narrow DLI ranges, while spring and summer are more variable, with spring values spanning 17–38 mol·m−2·d−1. This reflects transitional weather and changing cloud cover. Summer is relatively stable, and autumn shows gradually narrowing DLI ranges, consistent with mid-latitude continental climate patterns and highlighting periods of potential crop light stress or optimal growth. Topography strongly influences local DLI patterns. Mountains, including the Tatras and Carpathians, have lower summer DLI due to shading and elevation, but relatively higher winter DLI from clearer air and snow reflectance. Valleys may experience reduced winter light from fog and inversions. Lowlands, such as the Danube Basin and Eastern Slovak Lowland, receive higher summer DLI, making them suitable for high-light-demand crops, while shade-tolerant species are better suited to mountains and valleys. The North–South axis influences the daily and seasonal solar path, resulting in more pronounced differences in the duration and angle of incoming radiation. While East–West orientation also contributes to DLI variability, its impact is typically weaker and more dependent on local topography and the specific time of year. In such regions, where the North–South orientation has a stronger effect on DLI values than the East–West orientation, the higher DLI resolution is reasonable and necessary. This way, small DLI differences can also be determined and visualized. This study presents the first 1 mol·m−2·d−1 high-resolution DLI map for Slovakia, revealing fine-scale spatial and seasonal light variability and providing a practical framework for precise, region-specific agricultural planning and resource management in Central and Eastern Europe.
The current approach has some limitations, including limited data sources, higher temporal resolution, or real-time data acquisition. DLI resolution can be improved by moving from current single-channel pyranometers (285–2800 nm, W·m−2) to high-resolution spectroradiometers (285–2800 nm in 1 nm steps, W·m−2·nm−1·sr−1), enabling more precise measurement of spectral light distribution. These limitations can be reduced with future methods that could improve accuracy by integrating spectral measurements, microtopographic information (slope, exposure, orientation), and automated supervision (online monitoring, IoT, and variety-specific plant light requirements). Such advanced approaches would enable more precise and adaptable DLI estimation for agricultural and research applications.

5. Conclusions

According to our first objective. The highest-resolution DLI map with 1 mol·m−2·d−1 was created for Slovakia, offering detailed insight into the spatial and temporal variability of photosynthetically active radiation (PAR 400–700 nm). This resolution is necessary for medium-sized countries with an East–West orientation, such as Slovakia. The 1 mol·m−2·d−1 maps capture fine-scale heterogeneity critical for local agricultural decision-making, allowing for targeted supplemental lighting, shading, or crop selection. High-resolution scale influencing conditions are characterized by cloud cover, precipitation forms, surface reflectance/albedo, altitude, slope, orientation, horizontal limitations, mountains, vegetation volumetric parameters, and human landscape interventions.
According to our second objective. The results present a clear seasonal and regional pattern. The 1, 2, and 5 mol·m−2·d−1 DLI maps are based on the same meteorological data. The 2 and 5 mol·m−2·d−1 resolution DLI maps serve different purposes. Coarser maps provide broader trends, which highlight changes in a local (country) and regional (Europe) context. Scale increments such as 2 mol·m−2·d−1 are better suited to capture intra-regional gradients, also applicable to Slovakia’s topographically complex terrain. The findings give an insight that ultimately, these reinforce the necessity of regionally tailored lighting strategies in Central and Eastern Europe, considering not just DLI magnitudes but also their spatial-temporal stability. These studies validate that Slovakia, particularly its central and Northern parts, is more limited by low solar input in the winter and thus requires artificial lighting systems or light-assisted horticulture for reliable production during off-peak seasons. The creation of 5 mol·m−2·d−1 resolution maps was primarily motivated by the desire to make the results comparable with other DLI maps with the same classification. Maps above 5 mol·m−2·d−1 are uncommon, as larger increments mask spatial diversity and make visualization less informative.
According to our third objective. Our research gives a comparative evaluation of Daily Light Integral (DLI) patterns across Slovakia with 1, 2, and 5 mol·m−2·d−1 DLI maps, showing a valuable understanding of seasonal and regional variations. The mountainous and lowland areas of Slovakia were compared and summarized with characteristic DLI values (minimum, maximum, average, range) and monthly DLI maps. The differences between monthly maximum and minimum DLI values reached 21 units in spring (38–17 mol·m−2·d−1), 17 units in summer (46–29 mol·m−2·d−1), 20 units in autumn (26–6 mol·m−2·d−1), and 9 units in winter (13–4 mol·m−2·d−1). Slovakia has an East–West orientation with a difference of about 420 km, while the North–South extent is approximately 208 km.
Future research could combine these high-resolution maps with crop growth models, assess potential shifts under climate change scenarios, and validate findings with in situ measurements, further enhancing precision agriculture and sustainable land management in Slovakia. An improved assessment of the spatial-seasonal variability in light availability can support decision-making on crop selection, lighting strategies, and enhancing resource efficiency and climate resilience.

Supplementary Materials

The following supporting information can be downloaded at: https://www.mdpi.com/article/10.3390/app152212254/s1, Figure S1: Local scale, high precision 1 mol·m−2·d−1 DLI map; Figure S2: Regional scale, moderate precision 2 mol·m−2·d−1 DLI map; Figure S3: Global scale, comparison level 5 mol·m−2·d−1 DLI maps.

Author Contributions

Conceptualization, A.K., Z.V., K.S., L.S., A.J.; methodology, Z.V., L.S., A.J., software, A.K., Z.V.; formal analysis, A.K., L.S., A.J.; investigation, A.K., Z.V., K.S., L.S., A.J.; visualization, A.K., writing—original draft preparation, A.K., K.S., Z.V., K.S., L.S., A.J.; writing—review and editing, L.S., A.J.; supervision, L.S., A.J.; funding acquisition, L.S., A.J. All authors have read and agreed to the published version of the manuscript.

Funding

A.J. and Z.V. were supported by project no TKP2021-NVA-29, which has been implemented with the support provided by the Ministry of Culture and Innovation of Hungary from the National Research, Development and Innovation Fund, financed under the TKP2021-NVA funding scheme, furthermore by the National Research, Development and Innovation Office on behalf of the Prime Minister’s Office—National Authority—through the project RRF-2.3.1-21-2022-00013, titled “National Laboratory for Social Innovation. The research was supported by the National Research, Development and Innovation Office under Grants Advanced-152184 (Sustainable food systems). L.S. was supported by the Research Excellence Program of the Hungarian University of Agriculture and Life Sciences.

Institutional Review Board Statement

Not applicable.

Informed Consent Statement

Not applicable.

Data Availability Statement

Data is available upon request, inquiries can be directed to the corresponding author.

Acknowledgments

Special thanks go to the late Ian Ashdown, senior scientist, and Wallace Scott, the present CEO at SunTracker Technologies Ltd., Canada, for answering our research questions and supporting our initiative.

Conflicts of Interest

The authors declare no conflicts of interest.

References

  1. Takemiya, A.; Inoue, S.; Doi, M.; Kinoshita, T.; Shimazaki, K. Phototropins Promote Plant Growth in Response to Blue Light in Low Light Environments. Plant Cell 2005, 17, 1120–1127. [Google Scholar] [CrossRef]
  2. Bao, Y.; Liu, X.; Feng, C.-H.; Niu, M.-X.; Liu, C.; Wang, H.-L.; Yin, W.; Xia, X. Light and Light Signals Regulate Growth and Development in Woody Plants. Forests 2024, 15, 523. [Google Scholar] [CrossRef]
  3. Peng, Y.; Zhu, H.; Wang, Y.; Kang, J.; Hu, L.; Li, L.; Zhu, K.; Yan, J.; Bu, X.; Wang, X.; et al. Revisiting the Role of Light Signaling in Plant Responses to Salt Stress. Hortic. Res. 2025, 12, uhae262. [Google Scholar] [CrossRef]
  4. Wu, W.; Chen, L.; Liang, R.; Huang, S.; Li, X.; Huang, B.; Luo, H.; Zhang, M.; Wang, X.; Zhu, H. The Role of Light in Regulating Plant Growth, Development and Sugar Metabolism: A Review. Front. Plant Sci. 2025, 15, 1507628. [Google Scholar] [CrossRef]
  5. Goyal, A.; Szarzynska, B.; Fankhauser, C. Phototropism: At the Crossroads of Light-Signaling Pathways. Trends Plant Sci. 2013, 18, 393–401. [Google Scholar] [CrossRef]
  6. Kharshiing, E.; Sinha, S. Plant Productivity: Can Photoreceptors Light the Way? J. Plant Growth Regul. 2014, 34, 206–214. [Google Scholar] [CrossRef]
  7. Liscum, E.; Askinosie, S.K.; Leuchtman, D.L.; Morrow, J.; Willenburg, K.T.; Coats, D.R. Phototropism: Growing towards an Understanding of Plant Movement. Plant Cell 2014, 1, 38–55. [Google Scholar] [CrossRef] [PubMed]
  8. Paik, I.; Huq, E. Plant Photoreceptors: Multi-Functional Sensory Proteins and Their Signaling Networks. Semin. Cell Dev. Biol. 2019, 92, 114–121. [Google Scholar] [CrossRef]
  9. Farhangi, H.; Mozafari, V.; Roosta, H.R.; Shirani, H.; Farhangi, S.; Farhangi, M. Optimizing LED Lighting Spectra for Enhanced Growth in Controlled-Environment Vertical Farms. Sci. Rep. 2025, 15, 30152. [Google Scholar] [CrossRef]
  10. Kelly, N.; Choe, D.; Meng, Q.; Runkle, E.S. Promotion of Lettuce Growth under an Increasing Daily Light Integral Depends on the Combination of the Photosynthetic Photon Flux Density and Photoperiod. Sci. Hortic. 2020, 272, 109565. [Google Scholar] [CrossRef]
  11. Spalholz, H.; Perkins-Veazie, P.; Hernández, R. Impact of Sun-Simulated White Light and Varied Blue:Red Spectrums on the Growth, Morphology, Development, and Phytochemical Content of Green- and Red-Leaf Lettuce at Different Growth Stages. Sci. Hortic. 2020, 264, 109195. [Google Scholar] [CrossRef]
  12. Zhen, S.; van Iersel, M.; Bugbee, B. Why Far-Red Photons Should Be Included in the Definition of Photosynthetic Photons and the Measurement of Horticultural Fixture Efficacy. Front. Plant Sci. 2021, 12, 693445. [Google Scholar] [CrossRef] [PubMed]
  13. Liu, J.; van Iersel, M.W. Photosynthetic Physiology of Blue, Green, and Red Light: Light Intensity Effects and Underlying Mechanisms. Front. Plant Sci. 2021, 12, 619987. [Google Scholar] [CrossRef] [PubMed]
  14. Cope, K.R.; Snowden, M.C.; Bugbee, B. Photobiological Interactions of Blue Light and Photosynthetic Photon Flux: Effects of Monochromatic and Broad-Spectrum Light Sources. Photochem. Photobiol. 2014, 90, 574–584. [Google Scholar] [CrossRef] [PubMed]
  15. Gavhane, K.P.; Hasan, M.; Singh, D.K.; Kumar, S.N.; Sahoo, R.N.; Alam, W. Determination of Optimal Daily Light Integral (DLI) for Indoor Cultivation of Iceberg Lettuce in an Indigenous Vertical Hydroponic System. Sci. Rep. 2023, 13, 10923. [Google Scholar] [CrossRef]
  16. Lauria, G.; Piccolo, E.L.; Ceccanti, C.; Guidi, L.; Bernardi, R.; Araniti, F.; Cotrozzi, L.; Pellegrini, E.; Moriconi, M.; Giordani, T.; et al. Supplemental Red LED Light Promotes Plant Productivity, “Photomodulates” Fruit Quality and Increases Botrytis Cinerea Tolerance in Strawberry. Postharvest Biol. Technol. 2023, 198, 112253. [Google Scholar] [CrossRef]
  17. Moland, S.; Mansoori, M.; Wu, B.S.; Addo, P.W.; MacPherson, S.; Lefsrud, M. Effects of daily light integral for amber and red light on the growth of lettuce using a nutrient film technique hydroponic system. Int. J. Veg. Sci. 2025, 5, 1–18. [Google Scholar] [CrossRef]
  18. Adame-Adame, D.Y.; Alvarado-Camarillo, D.; Valdez-Aguilar, L.A.; Cartmill, A.D.; Cartmill, D.L.; Soriano-Melgar, L.D.A.A. Daily Light Integral and Nutrient Solution Electrical Conductivity for Tomato and Bell Pepper Seedling Production in an Indoor Vertical Farm with Artificial Lighting. Horticulturae 2025, 5, 454. [Google Scholar] [CrossRef]
  19. Paradiso, R.; Proietti, S. Light-Quality Manipulation to Control Plant Growth and Photomorphogenesis in Greenhouse Horticulture: The State of the Art and the Opportunities of Modern LED Systems. J. Plant Growth Regul. 2022, 41, 742–780. [Google Scholar] [CrossRef]
  20. Yan, Z.; Cao, X.; Bing, L.; Lin, D.; Cheng, F.; Wang, K.; Qi, Y.; Yang, Y. Assessment of the growth and quality of pepper seedlings under the combinations of daily light integral and nitrogen concentration. Hortic. Environ. Biotechnol. 2025, 2, 331–346. [Google Scholar] [CrossRef]
  21. Korczynski, P.C.; Logan, J.; Faust, J.E. Mapping Monthly Distribution of Daily Light Integrals across the Contiguous United States. Horttechnology 2002, 1, 12–16. [Google Scholar] [CrossRef]
  22. Faust, J.E.; Logan, J. Daily Light Integral: A Research Review and High-Resolution Maps of the United States. HortScience 2018, 9, 1250–1257. [Google Scholar] [CrossRef]
  23. Wang, Y.; Chu, Y.; Wan, Z.; Zhang, G.; Liu, L.; Yan, Z. Root Architecture, Growth and Photon Yield of Cucumber Seedlings as Influenced by Daily Light Integral at Different Stages in the Closed Transplant Production System. Horticulturae 2021, 7, 328. [Google Scholar] [CrossRef]
  24. Xu, W.; Lu, N.; Kikuchi, M.; Takagaki, M. Continuous Lighting and High Daily Light Integral Enhance Yield and Quality of Mass-Produced Nasturtium (Tropaeolum majus L.) in Plant Factories. Plants 2021, 10, 1203. [Google Scholar] [CrossRef]
  25. Jung, A.; Szabó, D.; Varga, Z.; Pék, Z.; Vohland, M.; Sipos, L. Spatially Scaled and Customised Daily Light Integral Maps for Horticulture Lighting Design. NJAS Impact Agric. Life Sci. 2024, 96, 2349522. [Google Scholar] [CrossRef]
  26. Jung, A.; Szabó, D.; Varga, Z.; Lausch, A.; Vohland, M.; Sipos, L. Daily Light Integral Maps for Agriculture Lighting Design in Spain. Smart Agric. Technol. 2024, 9, 100681. [Google Scholar] [CrossRef]
  27. Sun, Y.; Sun, Y.; Sun, Z.; Li, P.; Li, C. Mapping Monthly Distribution of Daily Light Integrals Across China. In Proceedings of the Annual Conference of ASHS, New Orleans, LA, USA, 7 August 2015. [Google Scholar]
  28. Blonquist, J.M.; Bugbee, B. Solar, net, and photosynthetic radiation. Agroclimatol. Link. Agric. Clim. 2020, 60, 1–49. [Google Scholar]
  29. Armitage, A.M.; Carlson, W.H.; Flore, J.A. The Effect of Temperature and Quantum Flux Density on the Morphology, Physiology, and Flowering of Hybrid Geraniums1. J. Am. Soc. Hortic. Sci. 1981, 106, 643–647. [Google Scholar] [CrossRef]
  30. Huber, B.M.; Louws, F.J.; Hernández, R. Impact of Different Daily Light Integrals and Carbon Dioxide Concentrations on the Growth, Morphology, and Production Efficiency of Tomato Seedlings. Front. Plant Sci. 2021, 12, 615853. [Google Scholar] [CrossRef]
  31. Degni, B.F.; Kone, G.; Gbegbe, R. Mapping of Average DLI Obtained over 17 Years in Different Regions of Côte d’Ivoire: A Sustainable Agricultural Decision-Making Tool. Open J. Appl. Sci. 2025, 5, 1310–1323. [Google Scholar] [CrossRef]
  32. Garcia, C.; Lopez, R.G.; Currey, C.J. Photosynthetic Daily Light Integral Has a Greater Impact on Basil Flowering than Photoperiod. HortScience 2025, 8, 1341–1349. [Google Scholar] [CrossRef]
  33. Melo, M.; Lapin, M.; Pecho, J. Climate in the Past and Present in the Slovak Landscapes—The Central European Context. In Landscapes and Landforms of Slovakia; Springer International Publishing: Cham, Switzerland, 2022; pp. 27–44. [Google Scholar]
  34. Zeleňáková, M.; Vido, J.; Portela, M.; Purcz, P.; Blištán, P.; Hlavatá, H.; Hluštík, P. Precipitation Trends over Slovakia in the Period 1981–2013. Water 2017, 9, 922. [Google Scholar] [CrossRef]
  35. Kišš, V.; Pagáč, J.; Tárník, A.; Čimo, J. Changes in vegetation period length in Slovakia under the conditions of climate change for 1931–2110. Sustainability 2022, 19, 12220. [Google Scholar] [CrossRef]
  36. Land Cover Statistics. Available online: https://ec.europa.eu/eurostat/statistics-explained/index.php?title=Land_cover_statistics (accessed on 12 September 2025).
  37. Ulrych, L.; Guttová, A.; Urban, P.; Hindáková, A.; Kučera, J.; Kučera, V.; Šibík, J.; Mútňanová, M. Biodiversity in Slovakia. In Global Biodiversity; Apple Academic Press: Palm Bay, FL, USA, 2018; Volume 2, pp. 325–374. [Google Scholar]
  38. Braun, A. Retrieval of Digital Elevation Models from Sentinel-1 Radar Data—Open Applications, Techniques, and Limitations. Open Geosci. 2021, 1, 532–569. [Google Scholar] [CrossRef]
  39. DLI Calculator. Available online: https://dli.suntrackertech.com/ (accessed on 23 July 2025).
  40. QGIS Web Site. Available online: https://www.qgis.org/ (accessed on 22 September 2025).
  41. Melo, M.; Lapin, M.; Kapolková, H.; Pecho, J.; Kružicová, A. Climate Trends in the Slovak Part of the Carpathians. In The Carpathians: Integrating Nature and Society Towards Sustainability; Springer: Berlin/Heidelberg, Germany, 2013; pp. 131–150. [Google Scholar]
  42. Zeleňáková, M.; Fendeková, M. Key Facts About Water Resources in Slovakia. In Water Resources in Slovakia: Part I: Assessment and Development; Negm, A.M., Zeleňáková, M., Eds.; Springer International Publishing: Cham, Switzerland, 2019; pp. 3–19. [Google Scholar]
  43. Slovakia—European Commission. Available online: https://agriculture.ec.europa.eu/cap-my-country/cap-strategic-plans/slovakia_en (accessed on 22 September 2025).
  44. Némethová, J.; Vilinová, K. Changes in the Structure of Crop Production in Slovakia after 2004 Using an Example of Selected Crops. Land 2022, 11, 249. [Google Scholar] [CrossRef]
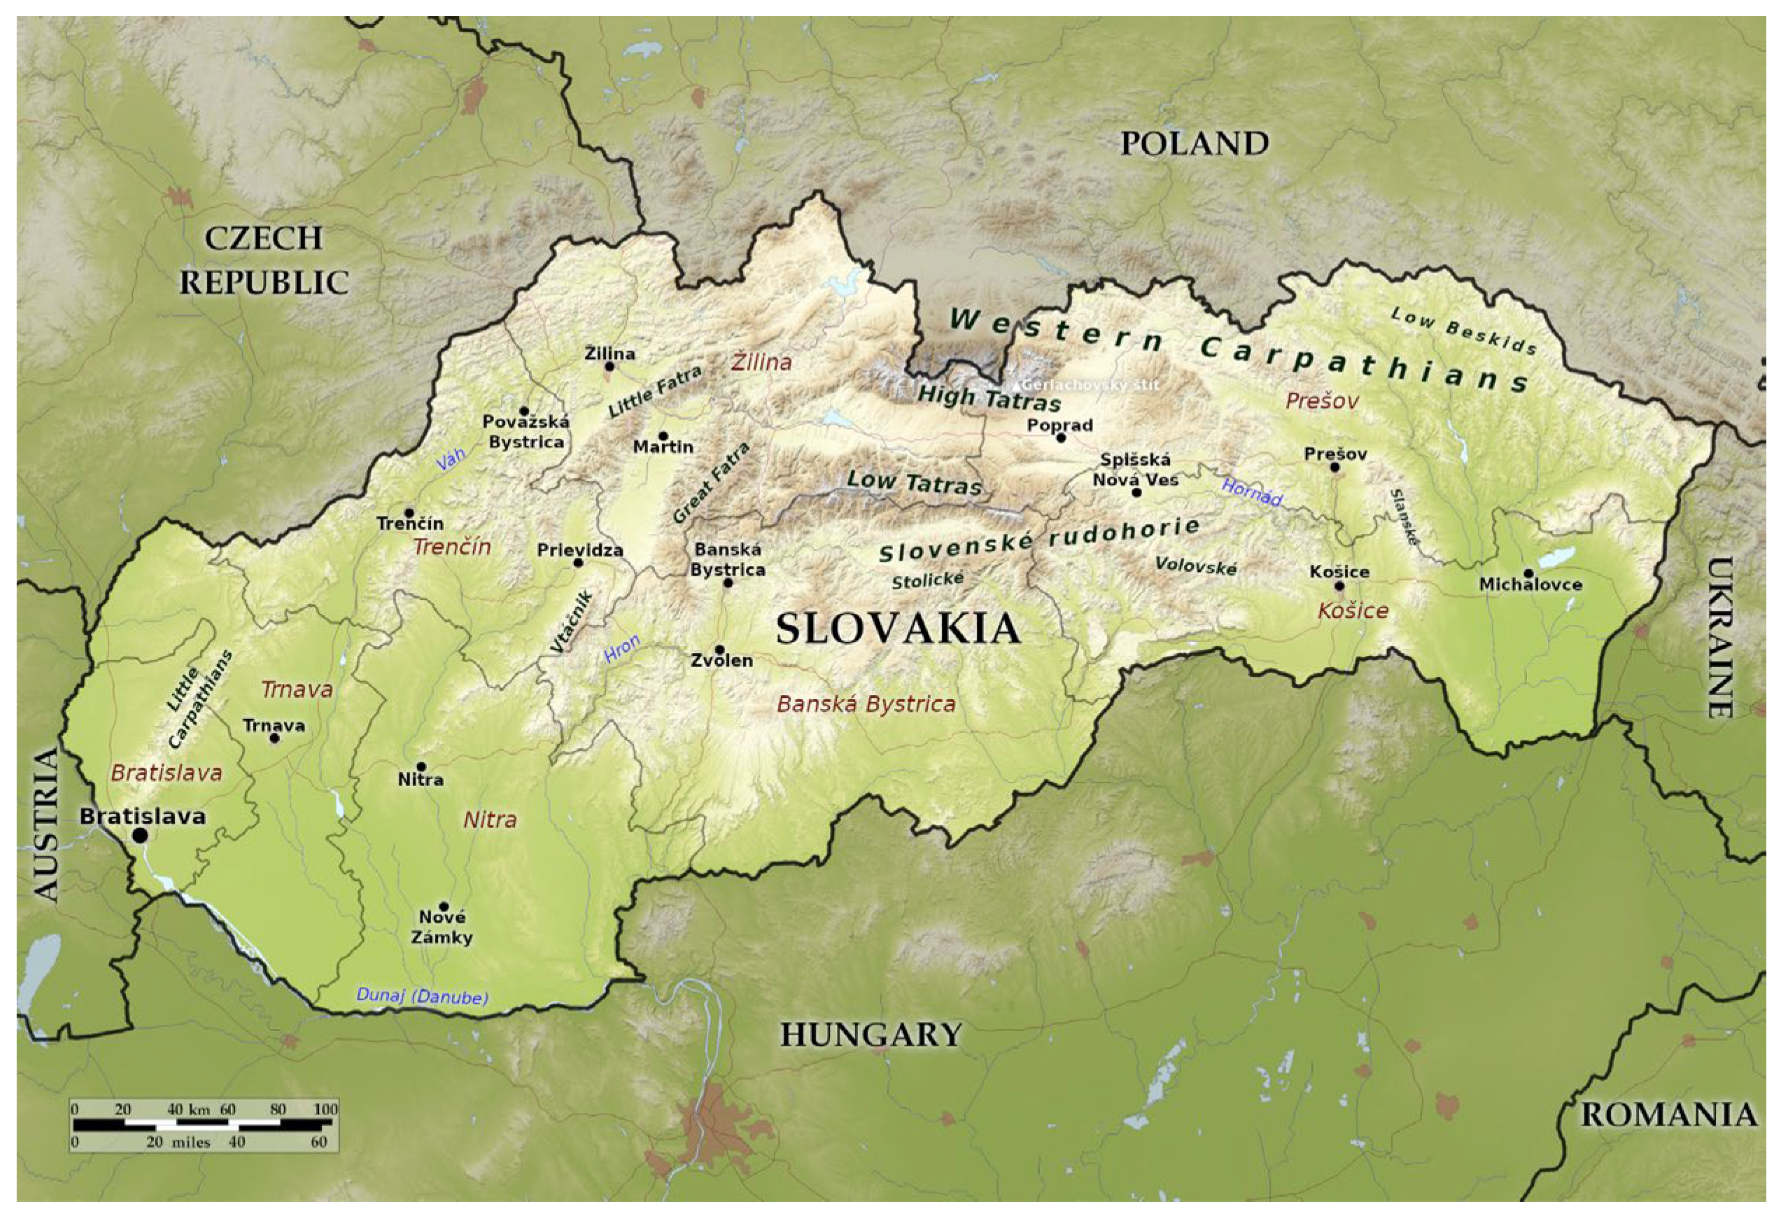
Figure 1. Topographical map of Slovakia (The map is from Blue Green Atlas, data source available at https://www.bluegreenatlas.com. It is distributed under the Creative Commons Attribution–ShareAlike 4.0 International (CC BY-SA 4.0) license.
Applsci 15 12254 g001
Figure 2. Monthly DLI maps of Slovakia, by season, with 1 mol·m−2·d−1. (In the scale, the from and to values are meant to end with two digits, but for practical reasons, they were shortened to one digit after the comma).
Applsci 15 12254 g002aApplsci 15 12254 g002b
Figure 3. Comparison of DLI maps of Slovakia with 1 mol·m−2·d−1, 2 mol·m−2·d−1, and 5 mol·m−2·d−1. (In the scale, the from and to values are meant to end with two digits, but for practical reasons they were shortened to one digit after the comma).
Applsci 15 12254 g003aApplsci 15 12254 g003bApplsci 15 12254 g003cApplsci 15 12254 g003d
Table 1. Summary of seasonal and regional DLI maps with characteristic DLI values (minimum, maximum, average, range).
MountainsLowlandsTotal
Minimum DLIMaximum DLIMean DLIRange DLIMinimum DLIMaximum DLIMean DLIRange DLIDLI Range (Maxima)DLI Range (Minima)DLI Range (Max and Min Differences)
SpringMarch172018.53192220.53225
April2430276303733.577613
May2834316333835.554510
SummerJune3339366404341.534710
July364038440464366410
August2935326343936.554510
AutumnSeptember182320.552226244348
October1113122121513.53214
November687281092224
WinterDecember475.53454.51201
February475.535762013
January91210.53111211.51023
Disclaimer/Publisher’s Note: The statements, opinions and data contained in all publications are solely those of the individual author(s) and contributor(s) and not of MDPI and/or the editor(s). MDPI and/or the editor(s) disclaim responsibility for any injury to people or property resulting from any ideas, methods, instructions or products referred to in the content.