Article

Modelling the Impact of Engineered Barrier Degradation on Radionuclide Release from a Lithuanian Near-Surface Repository

Nuclear Engineering Laboratory, Lithuanian Energy Institute, 3 Breslaujos Str., 44403 Kaunas, Lithuania
*
Author to whom correspondence should be addressed.
Appl. Sci. 2025, 15(22), 12253; https://doi.org/10.3390/app152212253
Submission received: 13 October 2025 / Revised: 7 November 2025 / Accepted: 14 November 2025 / Published: 18 November 2025
(This article belongs to the Section Environmental Sciences)

Abstract

Cementitious materials are widely used as engineered barriers in radioactive waste repositories due to their low permeability and ability to sorb radionuclides. However, the degradation of concrete under detrimental environmental impacts alters its ability to sorb radionuclides and may increase radionuclide release from the repository. The aim of this work was to investigate the effect of concrete barrier degradation on radionuclide migration in the near field of the Lithuanian near-surface repository. At first, changes in geochemical conditions in the repository were evaluated, and concrete degradation stages were defined using a reactive transport model. Then, sorption values (Kd values) corresponding to concrete degradation stages at different locations in the repository were selected, and radionuclide migration from the repository was modelled. Temporal as well as spatial changes in radionuclide sorption were taken into account. Long-lived weakly, moderately and strongly sorbed radionuclides (129I, 59Ni and 239Pu, respectively) were considered. It was found that, under the assumed conditions, changes in sorption values had no impact on 129I flux from the repository. Considering concrete degradation, 59Ni release was twice as high as in the case of non-degrading concrete, while 239Pu flux was similar to that obtained assuming constant sorption, as in degraded concrete.

1. Introduction

Radioactive waste constitutes a particular class of waste that must be managed with great care and attention due to its long-term and harmful impacts on human health and the environment. The final step in the radioactive waste (RAW) management process is RAW disposal. The method of RAW disposal and the type of repository depend on the characteristics and quantities of the waste. For example, low-level RAW can be disposed of in near-surface disposal facilities consisting of engineered trenches or vaults; geological disposal is considered for high-level RAW; and borehole disposal may be an option for small amounts of waste [1]. Disposal facilities should be designed to ensure the isolation of waste and the containment of radionuclides associated with RAW for as long as the waste remains hazardous. The safety of such disposal facilities is demonstrated by safety assessments, where the behaviour of the disposal system and safety indicators are evaluated.
A radioactive waste repository is a highly complex system that comprises different materials and is influenced by internal and external physical and chemical processes over long periods of time (tens of thousands of years). This makes safety assessment a challenging task. Appropriate model abstraction can render the system more amenable to numerical representation [2]; however, the abstracted models should be constructed to maintain the main features of the system and provide good insight into its evolution.
Short-lived low- and intermediate-level radioactive waste generated during the operation and decommissioning of the Ignalina nuclear power plant (INPP) in Lithuania will be disposed of in a near-surface repository (NSR) at the Stabatiškė site, near the INPP. The safety of the repository is assured by a multibarrier system, where cementitious materials play an essential role. Besides their low permeability, cement-based materials are known for their ability to retard radionuclide migration [3,4]. However, due to continuous contact with the surrounding environment, the degradation of cementitious materials may change their ability to sorb radionuclides. In general, four concrete degradation stages can be distinguished based on the evolution of the pH, pore water chemistry and cement mineralogical composition [5,6]. Fresh concrete usually has a pH greater than 12.5 (stage I), which soon decreases to a value of about 12.5 and remains constant until portlandite is leached (stage II). Stage III is associated with the leaching of calcium silicate hydrate (C-S-H) phases. In this stage, the pH decreases from 12.5 to about 10.5 and then the last concrete degradation stage (stage IV) is reached.
Radionuclide sorption plays an important role in radionuclide migration; thus, an appropriate representation of this phenomenon must be selected in the performance assessment [7]. In the most common approach, radionuclide sorption is modelled as a linear relationship between the radionuclide concentration in solution and its amount in the solid phase (the Kd concept) [7,8,9]. In the case of a conservative approach or screening calculations, appropriately selected constant sorption coefficients (Kd values) are widely used. However, it is recognised that radionuclide sorption strongly depends on the geochemical conditions [6,10], and, for a more detailed performance assessment, the level of accuracy should be increased. The scientific basis for the selection of Kd values can be provided through geochemical modelling [8,11]. This approach is usually based on surface complexation and ion exchange models and requires a set of parameters, including reaction equilibrium constants (logK values), ion exchange parameters and material properties (mineral surface, exchange sites) [11]. There are several publications discussing the evolution of Kd values in space and time for soils and rock (e.g., [8,12,13]). However, in the case of cementitious materials, due to the complexity of the system and insufficient data on the parameter values needed for thermodynamic sorption models, changes in radionuclide sorption usually are introduced in performance assessments using the Kd approach, with values varying according to the stage of concrete degradation.
A few studies have examined the impact of concrete degradation on radionuclide sorption and release from a near-surface repository within the context of performance assessment [14,15]. The approach proposed in [14] consists of two steps: (1) first, a geochemical step is performed, and the evolution of geochemical state variables is derived as a function of reaction progress; (2) then, the evolution of sorption is calculated based on the evolution of the pH and the weight fractions of minerals. It should be noted that, for geochemical modelling, a “mixed tank reactor” approach was implemented in [14], where the degradation of a cementitious barrier was spatially uniform. The durations of the concrete degradation stages were estimated based on the amount of percolated water needed to reach each degradation stage and the water flux infiltrating into the facility. In [15], approximate durations of the concrete degradation stages were taken from [16,17]. Considering that the first concrete degradation stage is very short (a few years) and the sorption values of selected radionuclides are very similar in stages II and III, the modelling of radionuclide migration was performed in two runs: in one case, constant Kd values for concrete degradation stage II were assumed, and, in the other case, the Kd values for stage IV were selected. Therefore, both studies considered the spatially uniform degradation of the entire concrete barrier.
The aim of this study was to investigate the impact of engineered barrier degradation on radionuclide migration in the near field of a near-surface repository, taking into account temporal as well as spatial changes in radionuclide sorption. For this purpose, changes in the geochemical environment in the planned NSR in Lithuania were evaluated and the appropriate Kd values were selected. Then, radionuclide migration from the repository was assessed. A distinctive feature of this work is the modelling of concrete barrier degradation using the repository scale reactive transport model. This approach enables the identification of differences in concrete degradation depending on its location and is considered potentially more realistic than the spatially uniform degradation model used in [14,15]. Based on the outcomes of concrete degradation modelling, spatial and temporal changes in radionuclide sorption could be introduced in the assessment of radionuclide migration. In total, four cases with different sorption representations were analysed. Two cases considered constant sorption: Kd values for non-degraded or for degraded concrete (bounding Kd values) were selected. Additionally, two cases took into account changes in Kd values depending on the concrete degradation stage at different locations in the repository. Three radionuclides of different sorption capacities were considered in the assessment: 129I (weak sorption), 59Ni (moderate sorption) and 239Pu (strong sorption). The results showed that the consideration of concrete degradation had almost no impact on the flux of 129I from the repository, whereas, for 59Ni and 239Pu, the effect might be of concern.

2. Materials and Methods

The investigations presented in this paper followed the stepwise approach, consistent with the methodology used in the safety analysis of disposal facilities, as recommended by the International Atomic Energy Agency (IAEA) [18]. The first step—the identification of the assessment context and the aim of the investigations—is described in Section 1. The current section presents the next steps, namely a description of the analysed system (repository), engineered barrier degradation, the radionuclide migration scenario, the developed conceptual and mathematical models and their implementation in a computer tool and the data required to perform the calculations. The results obtained and their interpretation are presented in Section 3. Finally, the main findings are summarised in Section 4.

2.1. Repository Description

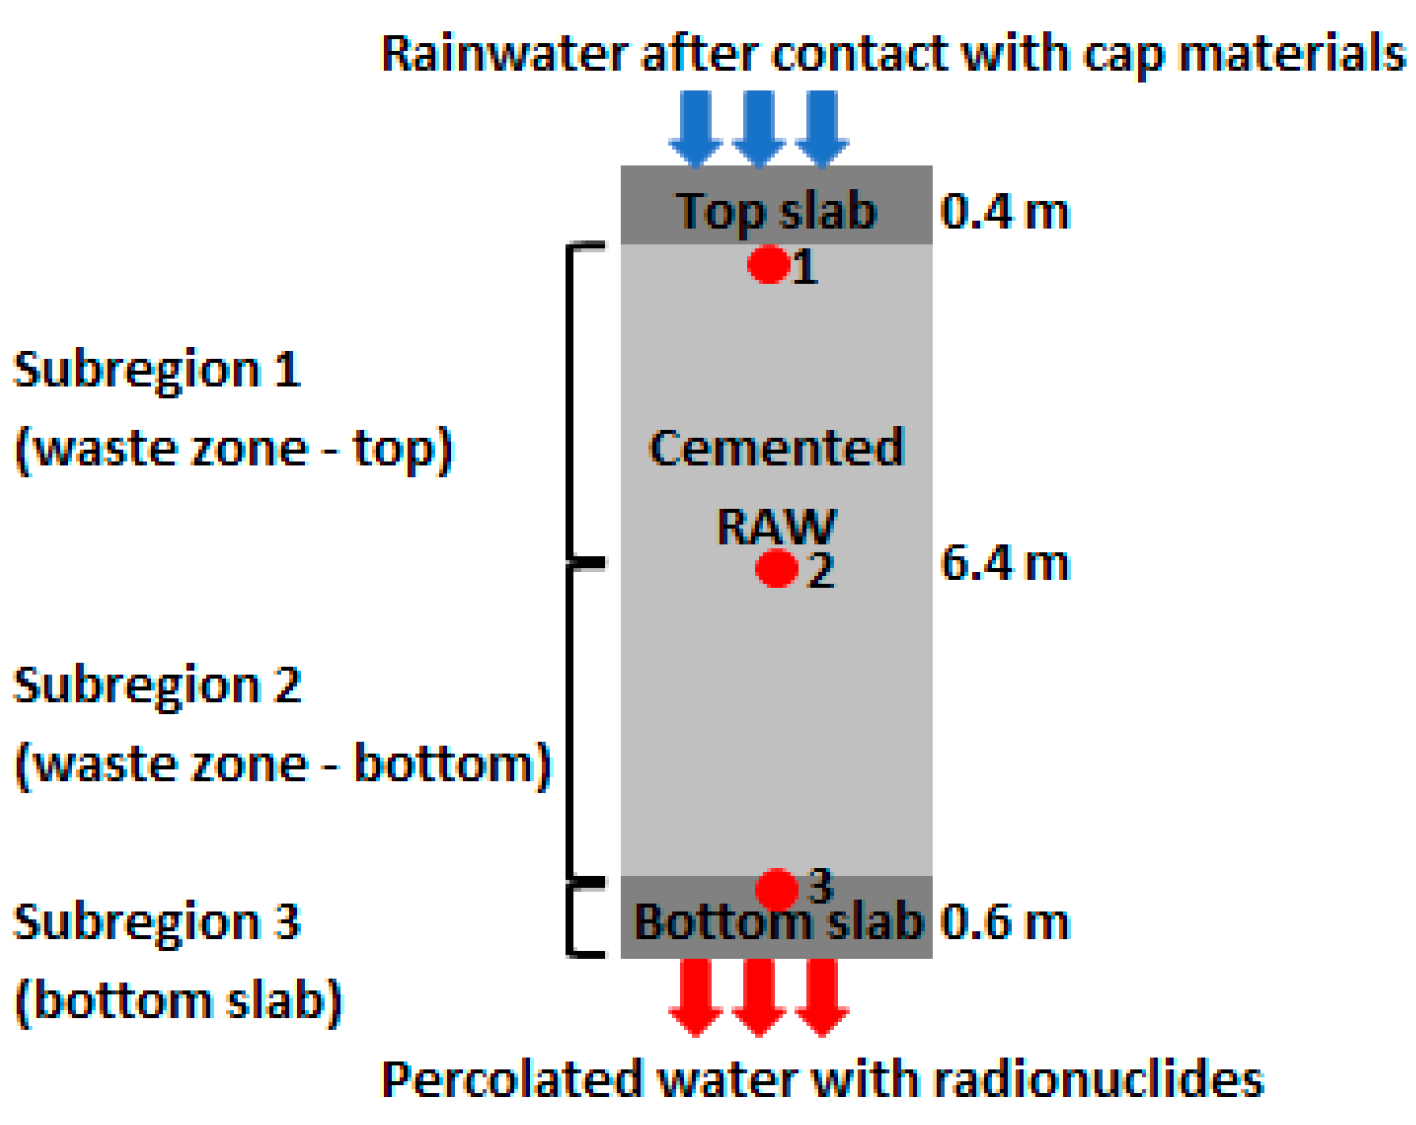
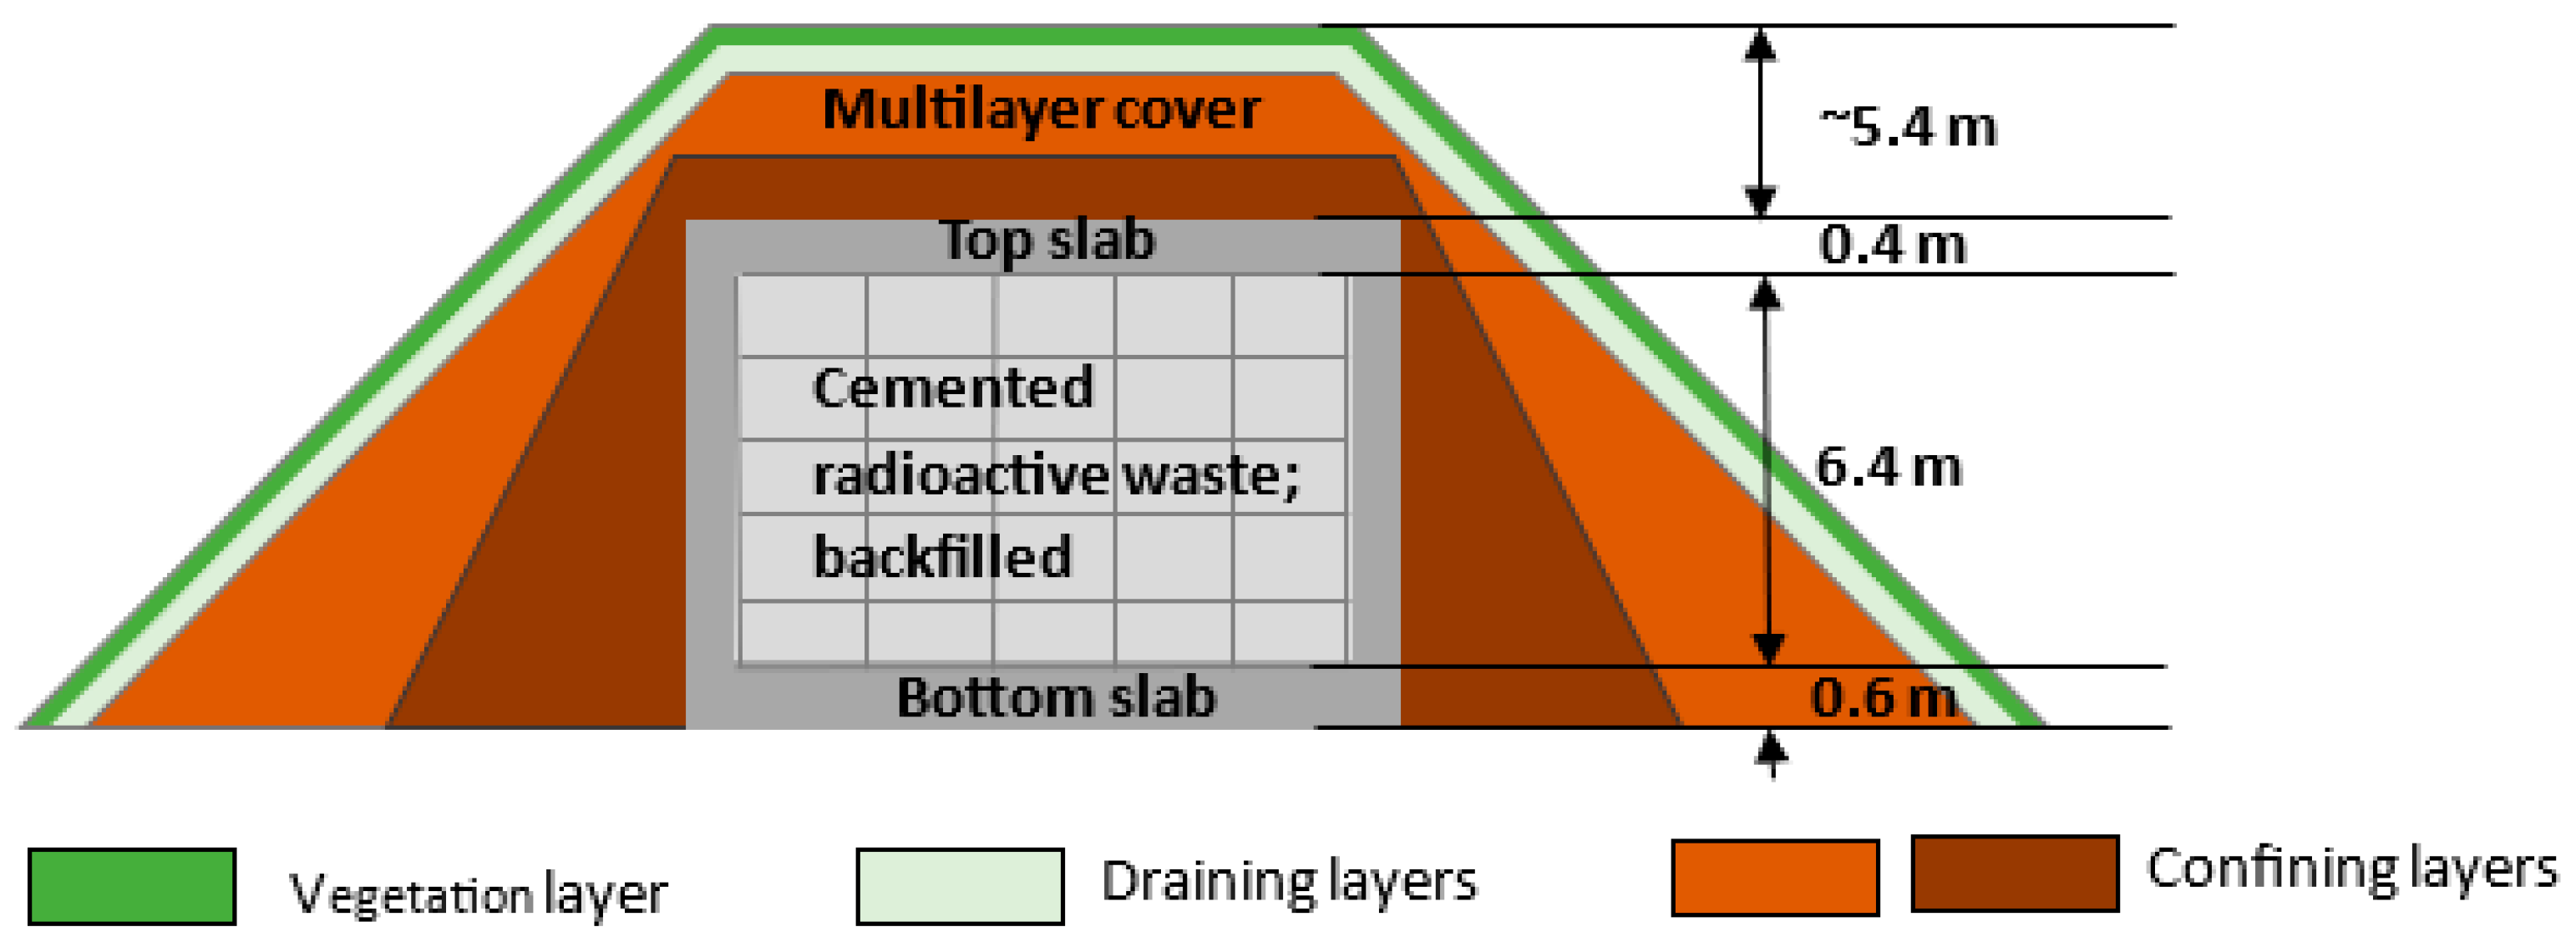
The effect of the approach adopted to evaluate the impact of engineered barrier degradation on radionuclide release from a near-surface repository was investigated considering the planned NSR in Lithuania. This repository is designed as a modular-type facility consisting of 36 aboveground reinforced concrete vaults. The projected capacity of the repository is up to 100,000 m3 of conditioned short-lived low- and intermediate-level radioactive waste generated during the operation and decommissioning of the Ignalina nuclear power plant (INPP) [19,20]. Cemented RAW in reinforced concrete containers will be loaded into the vault in four layers. The thickness of the bottom slab is 0.6 m and the inner height of the vault is 6.4 m. The gaps between the layers and the empty space at the top of the vault will be backfilled with cement-based material. At the top of the vault, a reinforced concrete slab of 0.4 m thickness will be installed. When all vaults are loaded and covered with reinforced concrete slabs, the final multilayer cover of several layers of clay, gravel, sand, pebbles and vegetative ground will be formed. The total thickness of the cover will be about 5–6 m. The main elements of the repository are presented in Figure 1.
Three long-lived radionuclides were considered in this work: 129I (half-life 1.57 × 10⁷ years), 59Ni (half-life 7.50 × 10⁴ years) and 239Pu (half-life 2.41 × 10⁴ years). All three radionuclides are of interest as they are present in the waste from nuclear power plants, including the INPP [20,21], and are differently sorbed on cement minerals. 129I is poorly sorbed and migrates rapidly out of the repository. The sorption of 59Ni can be characterised as moderate, and 239Pu is well retarded in cementitious materials.
The repository will be located at the Stabatiškė site in the eastern part of Lithuania, close to the Ignalina NPP. The site is characterised by moraine till deposits with sporadically distributed sand lenses in the upper part of the vadose zone. The first semi-confined aquifer lies at a depth of about 8 m. Based on [20], and taking into account the most recent meteorological data [22], the average yearly amount of precipitation at the site is about 690 mm, evapotranspiration amounts to about 480 mm, and the surface run-off is about 127 mm; therefore, infiltration amounts to about 83 mm per year.

2.2. Engineered Barrier Degradation and Radionuclide Migration Scenario

This work concerns the long-term evolution of the disposal system and is limited to the period after the repository’s closure, assuming that the engineered barriers were arranged according to their design.
A near-surface repository is in continuous contact with the surrounding environment, and the climatic conditions play a significant role in its performance. One potential phenomenon that can lead to a detrimental impact on the engineered barrier system and radionuclide migration is the infiltration of rainwater. The cap, formed after repository closure, will minimise the infiltration of water. However, after the completion of the active institutional control of the site, no recovering actions will be taken in the event of cap damage. This could lead to increased water flow through the repository and cause the more rapid degradation of the concrete barriers, including chemical (e.g., leaching of cement components, carbonation) and mechanical (e.g., cracking) degradation, as well as the increased leaching of radionuclides from the waste, transport through the barriers of the repository and, consequently, release to the geosphere.
Radionuclide transport in a repository depends greatly on the ability of the repository’s materials to retard radionuclides. Cement-based materials are widely used in low- and intermediate-level waste repositories due to their durability, low permeability and high radionuclide sorption potential [4,6,14,23]. However, infiltrated rainwater is in thermodynamic non-equilibrium with the engineered barriers, and the imposed chemical reactions lead to changes in the concrete’s pore water chemistry and mineralogical composition. These changes also affect the barriers’ ability to sorb radionuclides.
Therefore, this work considers the infiltration of rainwater through the cap into the repository, the alteration of cementitious barriers due to contact with the infiltrated water, the leaching of radionuclides from the cemented waste, the downward transport of these radionuclides to the bottom of the repository and their release into the environment.

2.3. Conceptual Models

The modelling of the behaviour of large-scale systems over a time period of up to tens of thousands of years and considering their physical and chemical processes is a challenging task that requires huge computational resources and periods of time. Therefore, based on the assessment context, a number of assumptions were introduced during the system’s conceptualisation to make it suitable for mathematical representation and the analysis of the results. In the absence of repository-specific data, and in case of uncertainties in features and processes, conservative (i.e., more penalising) assumptions were made.

2.3.1. Rainwater

The rates of degradation of concrete barriers and radionuclide release from the repository depend on the amount of infiltrated water and its chemical composition. It was indicated in the system description that the average yearly water infiltration amounts to about 83 mm. As pointed out in the scenario description, the cap over the vault will minimise water infiltration as long as it performs as designed. In the case of damage, the maintenance of the cap is ensured only during the active institutional control period of the site. The foreseen duration of active institutional control of the NSR site in Lithuania is 100 years after the repository’s closure [20]. After this period, the integrity of the engineered structures cannot be guaranteed. Therefore, it is assumed that, after 100 years, the cap will be degraded and no longer limit water infiltration. It should be noted that concrete degradation is a slow process, and the period of active institutional control (100 years) is a very short time span in comparison with the time needed for the considerable degradation of engineered barriers. Therefore, it is assumed in this study that the water inflow rate to the top slab is constant and equals 83 mm/y or 2.63 × 10⁻⁹ m/s immediately after the repository’s closure.
The chemical composition of rainwater was determined from the local rainfall chemical composition data provided by the Environmental Protection Agency [24]. Yearly rainfall data over a 10-year period (2010–2019) were analysed to provide a picture of the long-term average rainwater composition. Average component concentrations were calculated as weighted average values in order to take into account different amounts of yearly precipitation. The weighted concentrations were calculated according to the following equation:
C = (∑pici)/(∑pi),
where C is the weighted average concentration of the component (mg/L), pi is the amount of precipitation in year i (mm/y), and ci is the concentration of the component in the precipitation in year i (mg/L).
The obtained weighted average concentration for each component was adjusted to take into account the fact that the concentration of the component in the infiltrated water can increase due to evaporation.
The chemical composition of the infiltrated water can change during the percolation of the rainwater through the cap due to (micro)biological respiration and soil weathering processes [5]. A detailed analysis of concrete degradation during leaching with different types of water was conducted in relation to the near-surface disposal project in Belgium [25]. The investigated water types included rainwater and several of its modifications, accounting for biological processes as well as rainwater contact with soil and clay materials. The effect of the water composition on cement degradation was evaluated by comparing the amount of each water type required to complete degradation stages I, II and III in 1 dm3 of concrete. It was found that the completion of stages I and II was relatively insensitive to the composition of the infiltrating water. Regarding stage III, biological transformations and weathering in 1 m deep sandy soil had only a minimal effect on water aggressiveness. However, considering percolating water in contact with the clay layer revealed that weathering in clay contributes positively to concrete durability—in this case, a larger volume of water was needed to reach the end of stage III. Since rainwater contact with soil and clay has only a minor and, in some cases, beneficial impact on concrete degradation, and in order to remain on the conservative side during the assessment, changes in rainwater composition due to weathering are not considered in this study. Microbiological respiration causes an increase in the partial pressure of carbon dioxide gas in the soil compared to the atmospheric CO2 gas pressure [5]. The developed partial CO2 gas pressure can be estimated as follows [5,26]:
log(PCO2) = −3.47 + 2.09(1 − e−0.00172·AET),
where PCO2 is the partial CO2 gas pressure in the soil (atm), and AET is the amount of actual evapotranspiration (mm/y).
In this work, another assumption was made regarding nitrogen species. The information about the chemical rainwater composition presented in [24] provides separate concentrations of nitrate and ammonium. Due to biological processes, ammonium (NH4+) in soil is rapidly converted to nitrate (NO3) [27]. Therefore, this study assumed the complete nitrification of ammonium to nitrate during the percolation of the rainwater through the cover, and the sum of the nitrate and ammonium amounts was considered to represent nitrate.
The final chemical composition of the infiltrated water that was in contact with the concrete barriers (i.e., the chemical composition of the water after passing the cap), obtained by taking into account all the abovementioned assumptions, is presented in Table 1.

2.3.2. Conceptual Model of the Repository

Taking into account the aim of this work (as described in Section 1), the main focus in the investigations was the degradation of cementitious barriers, changes in their ability to sorb radionuclides and the implementation of these processes in radionuclide migration analysis. The effect of the cap is taken into account through the modification of the rainwater composition, as it described in the previous section. Therefore, the analysed system is limited to concrete barriers, i.e., the top and bottom concrete slabs, as well as the waste zone (inner volume of the vault).
The physical properties of the top and bottom slabs are selected based on [20] and are as follows: the porosity is 0.15 (unitless), the hydraulic conductivity is 10−9 m/s and the effective diffusion coefficient is 10−11 m2/s.
The waste zone is a very complex part of the system, consisting of different materials, including waste, grout, concrete containers and vault backfill. For the purpose of this work, and consistent with [20], this zone is considered as a cement-based homogeneous medium with porosity of 0.25 (unitless) and hydraulic conductivity corresponding to degraded concrete, i.e., 5 × 10⁻⁵ m/s [6]; the effective diffusion coefficient is assumed to be the same as in free water (10−9 m2/s). High hydraulic conductivity and diffusion coefficient values are selected for the homogenised waste zone to account for small unfilled spots and gaps, as well as cracks, in the vault (e.g., between the container and the backfill), which increase the waste zone’s permeability (conservative approach).
The mineralogical compositions of the concrete slabs and the backfill were obtained by performing cement hydration calculations. The composition of the cementitious barriers is based on ordinary Portland cement CEM I 42.5 N (the normative composition of CEM I 42.5 N can be found in [28]). The modelling was performed using the computer tool PHREEQC (v. 3.7.0) [29] and the thermodynamic database CEMDATA v18 [30]. PHREEQC is designed to perform a wide variety of aqueous geochemical calculations. The CEMDATA database is specifically designed for cementitious materials and contains thermodynamic data for hydrated solids in the Portland cement system and other related systems. For the top and bottom slabs, 350 g of cement, 175 g of water and 1691 g of aggregates per 1 dm3 of concrete were used, while, for the backfill, the amounts were 300 g of cement, 165 g of water and 1507 g of aggregates. The calculated density was 2216 kg/m3 for the concrete slabs and 1972 kg/m3 for the backfill, which are in line with the data provided in the [20]. The mineralogical compositions of the vault slabs and the backfill are provided in Table 2; the pore water composition is presented in Table 3. The obtained pore water and concrete compositions are consistent with the ones reported in [31] for a similar type of concrete. The properties of the backfill are attributed to the entire waste zone.

2.3.3. Conceptual Model for Changes in Radionuclide Sorption

In the performance assessment of a radioactive waste repository, the sorption of radionuclides is usually described as the ratio of the concentration of a sorbed radionuclide to its concentration in solution (Kd concept). In this approach, the effects of numerous heterogeneous reactions of radionuclides with solid surfaces (e.g., chemisorption, physisorption, precipitation and ion exchange) are combined into a single sorption factor, Kd [6]. In general, sorption processes can be described by non-linear relationships. However, in practice, a linear isotherm, which assumes the complete reversibility of ion adsorption, is extensively used to describe the relationships between radionuclide concentrations in solution and in the solid phase, since radionuclide concentrations are typically low and the Kd approach provides some conservatism in the assessment as slow desorption kinetics are ignored [32]. The most common assumption used in safety assessments is that this ratio remains constant across the range of application [6]. Despite its simplicity, the Kd concept is recognised as an appropriate approach for the modelling of sorption in the framework of safety assessments as it builds conservatism into the analysis [6,32]. Most commonly, the Kd values are assumed constant over the modelled period of time. Depending on the purpose of the modelling (e.g., best estimate, conservative assessment), appropriate Kd values are selected.
The degradation of concrete and changes in the geochemical environment in the repository affect the mobility of radionuclides. These changes must be accounted for in order to achieve a more realistic assessment of the potential radionuclide release from the repository. Cement leaching leads to changes in the mineralogical composition and pore water chemical composition, including the pH, which determine the sorption capacities of cementitious materials.
The change in radionuclide sorption in this work is linked to the change in the pore water pH in the cement. As indicated above, four concrete degradation stages may be distinguished, and they are characterised by the different pH values of the cement water [5,6]. There are several studies that report the dependence of radionuclide sorption on the pore water pH and present corresponding Kd values, (e.g., [6,16,17,32,33]). The selection of Kd values in a safety assessment is usually based on a literature review and analysis of experimental data (e.g., [6,32,34]). In the present study, the Kd values for fresh concrete were taken from the Environmental Impact Assessment Report prepared for the Lithuanian NSR [20]. However, radionuclide migration and the radiological impact assessment presented in [20] are based on a single-value Kd approach. In order to introduce changes in Kd values depending on the concrete degradation stage, the trend in Kd changes reported in [6] was adopted. In stages I and II, the Kd values are the same as those for fresh concrete, while, during stage III, the Kd values decrease by one order of magnitude for radionuclides 129I and 59Ni and by a factor of five for 239Pu.
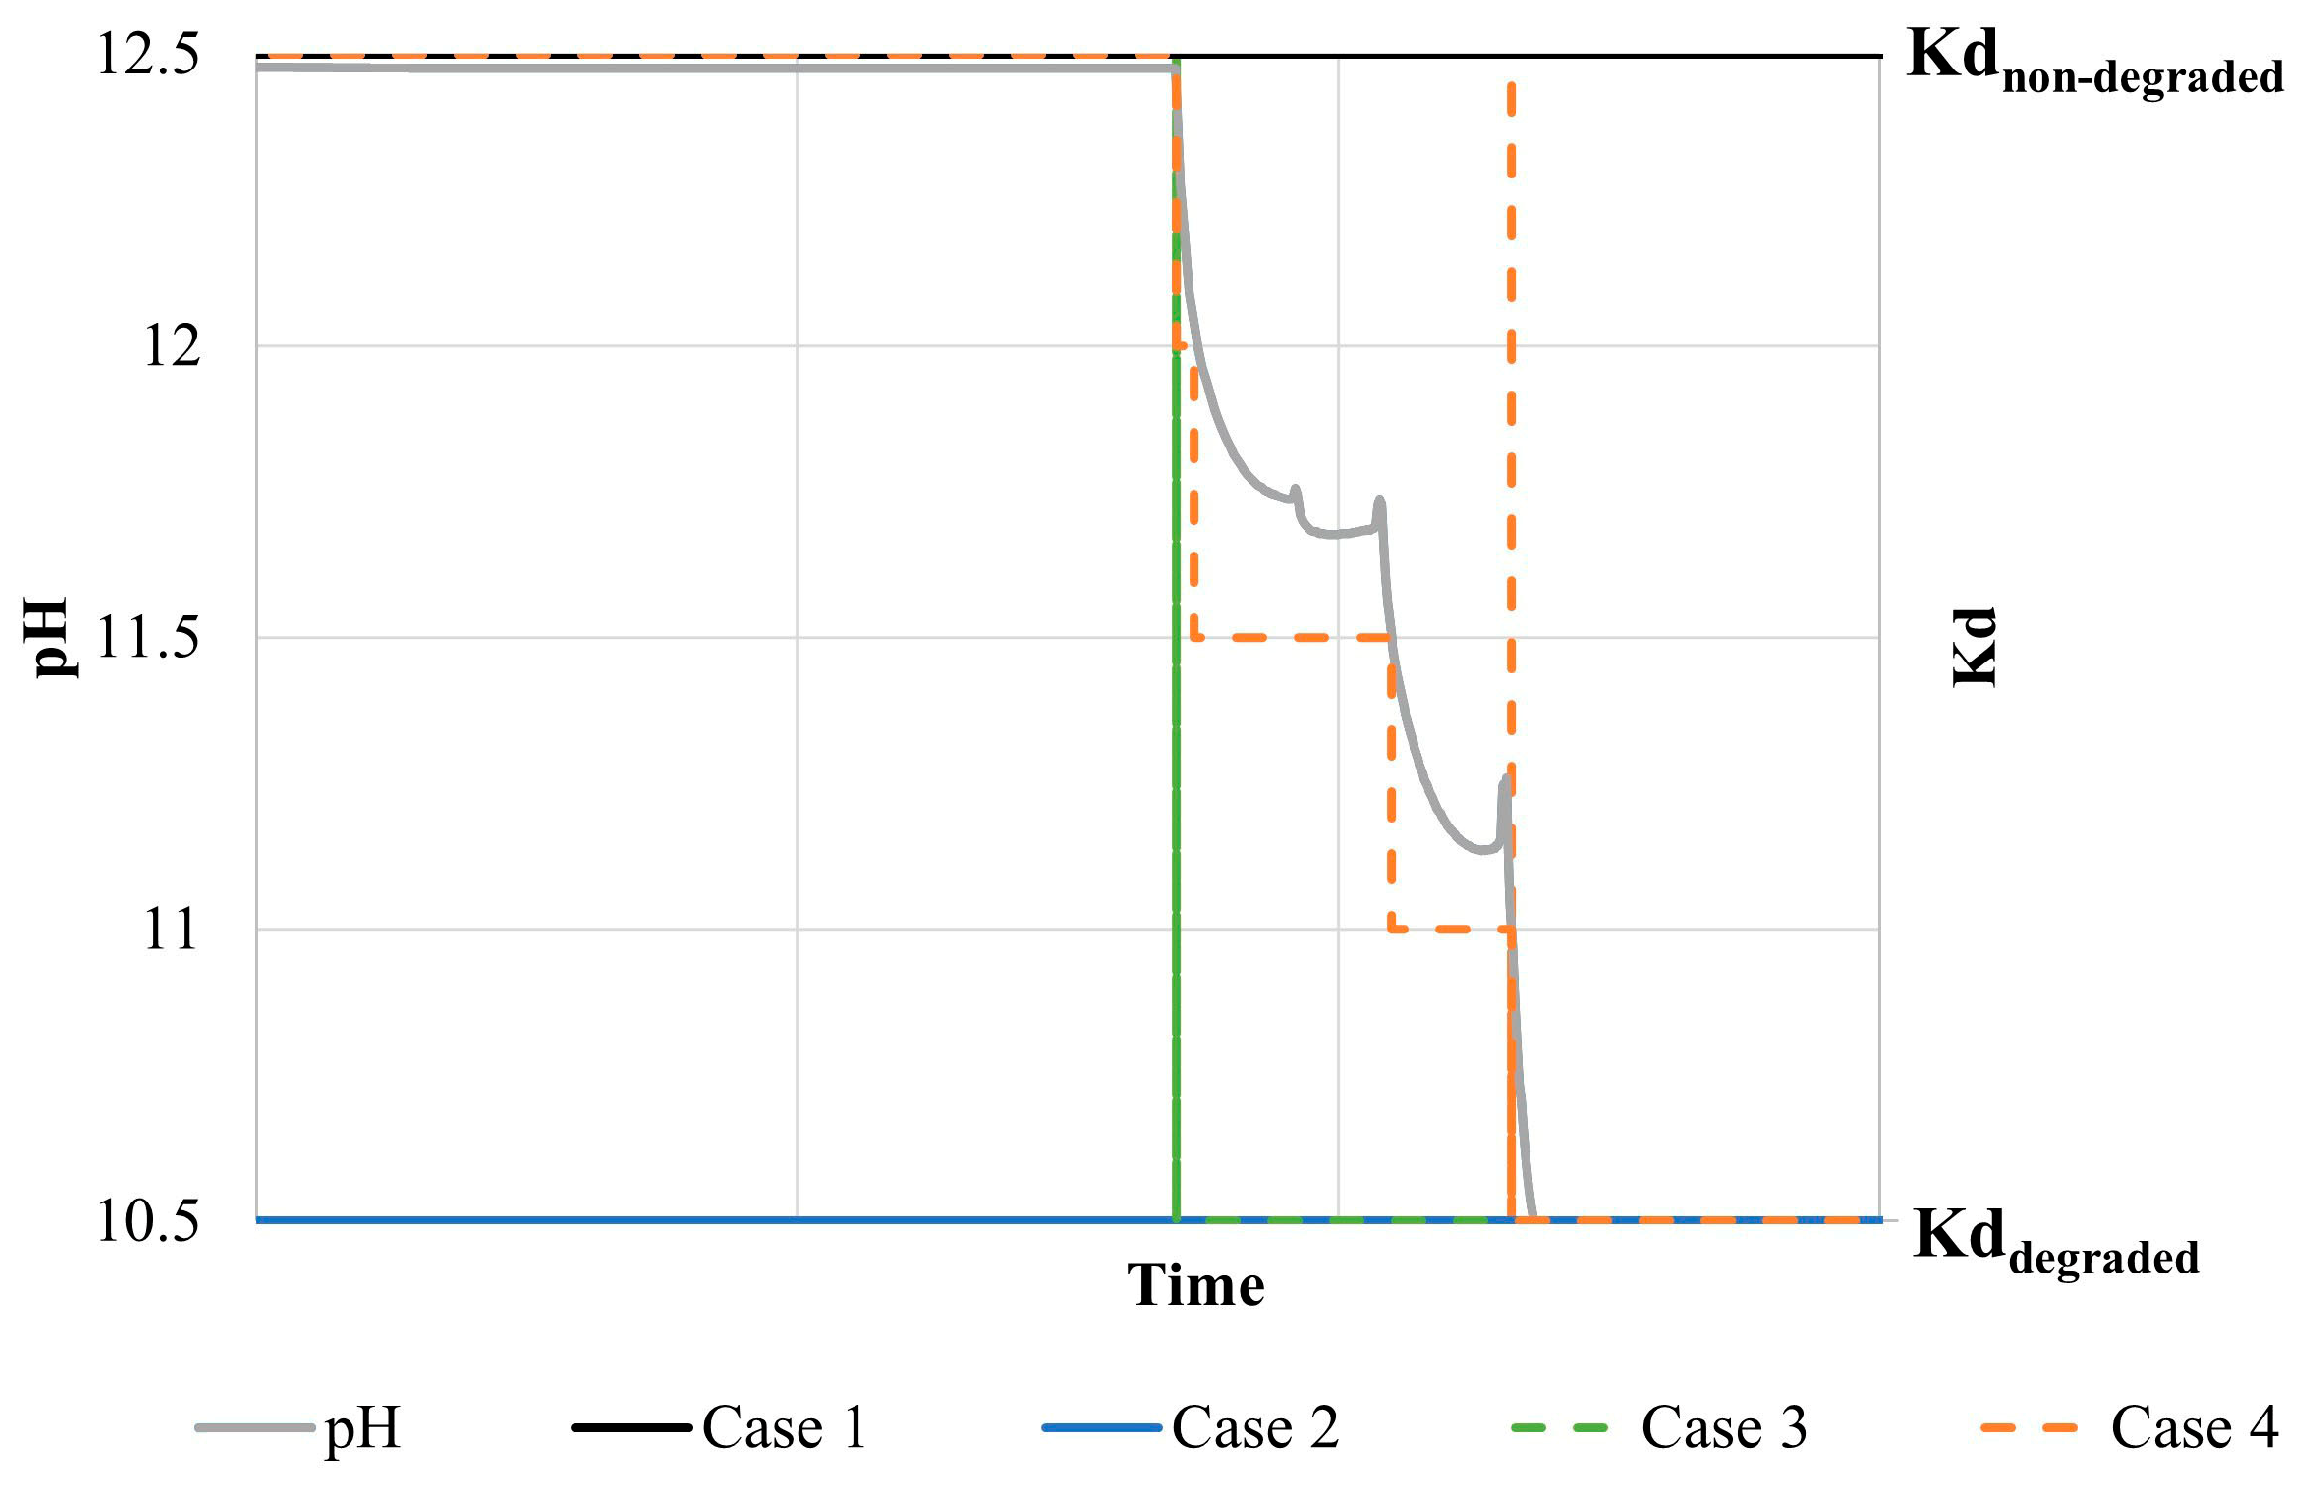
The effect of concrete degradation on radionuclide migration from the NSR was investigated by applying two different conceptual models. In addition, two bounding cases with constant Kd values were considered for comparison purposes. Therefore, four cases were analysed as follows.
  • Case 1. Constant Kd values corresponding to non-degraded concrete over the modelled period of time.
  • Case 2. Constant Kd values corresponding to degraded concrete over the modelled period of time.
  • Case 3. Concrete degradation stages are assumed to be four discrete periods of time, and, for each period, an appropriate Kd value is selected. Therefore, the Kd values change in a stepwise manner as soon as the concrete reaches the next degradation stage.
  • Case 4. Takes into account gradual changes in the Kd values that follow the changes in the pH in the repository and represents the nature of the degradation process more accurately. This is mostly relevant for concrete degradation stage III, where gradual changes in pH are observed. Therefore, changes in the Kd values during stage III are modelled in a multi-step manner: the Kd value changes when the pH drops by 0.5 units.
The selected Kd values for the radionuclides under consideration for each cement degradation stage are presented in Table 4. It should be noted that the selection of the Kd values in this study follows a conservative approach. For each concrete degradation stage, the Kd value is selected as the value at the end of that stage. Therefore, the Kd values in stage III (in case 3) and stage IIIb (in case 4) are the same as those in stage IV. The differences between the assumptions regarding the selection of Kd values for cases 1–4 are visualised in Figure 2.
Another specific feature of cases 3 and 4 is the consideration of the non-homogeneous degradation of concrete. The top slab of the vault is in direct contact with infiltrated rainwater; therefore, here, concrete degradation proceeds more rapidly in comparison with deeper layers of the repository. To take this into account, the repository was divided into 3 subregions: the upper part of the waste zone, the lower part of the waste zone and the bottom slab. The concrete degradation stage for the whole bottom slab was assigned based on its upper 1 cm layer, i.e., as soon as the top 1 cm of the slab enters the next concrete degradation stage, this stage is assigned to the whole slab. In the case of the waste zone, it was divided into two equal subregions due to its large dimensions. The concrete degradation stage of each waste zone subregion was assumed based on its top 1 cm layer. This approach is considered conservative because it tends to overestimate the impact, as the deeper layers of the region degrade more slowly and can retain radionuclides for a longer period. It should be noted that the top vault slab is assumed to be initially degraded in terms of radionuclide sorption, since, after repository closure, there are no radionuclides present in the top slab, and only a small amount can be transported into it by diffusion over time. Therefore, Kd changes in the top slab are of minor importance.
The conceptual model of the analysed system and the observation points for pH changes, required to identify the concrete degradation stage of each subregion, are presented in Figure 3.

2.4. Mathematical Model and Implementation in Computer Tool

The assessments of radionuclide migration and release from the NSR in cases 1 and 2 were performed with constant parameter values in single runs. In cases 3 and 4, a two-step approach was adopted. At first, concrete degradation was modelled to identify the concrete degradation stages based on pH changes in the concrete. The output of this run provided pH changes over time at specified locations (see Figure 3, top points of subregions 1–3). In the next step, radionuclide migration was modelled assuming appropriate Kd values in the subregions based on the concrete degradation stage. A flowchart illustrating the approach to modelling radionuclide migration with variable sorption in cases 3 and 4 is provided in Figure 4.
The modelling of cementitious material degradation and the migration of radionuclides from the NSR was performed with the computer tool HP1 [35]. The same computer tool and model were used in both cases in order to avoid any discrepancies due to differences in model implementation and solvers. HP1 is a reactive transport modelling tool that couples (1) the finite element code HYDRUS (v. 4.18) to simulate the movement of water, heat and multiple solutes in variably saturated media and (2) the geochemical code PHREEQC (v. 3.7.0) [29]. The modelling of the degradation of concrete barriers was performed using the thermodynamic database CEMDATA v18 [30] (as mentioned earlier in Section 2.3.2, this database contains the required thermodynamic data for hydrated solids in the Portland cement system).
A 1D reactive transport model was developed to follow alterations in the concrete and to identify degradation stages. The solute transport model accounted for transfer by advection and diffusion, as well as geochemical reactions. In the one-dimensional case, the solute transport equation can be written as follows (based on [36]):
c i t = x ( θ D i c i x )   q c i x + R i
where c i is the aqueous concentration of the ith component (mol/m3), θ is the porosity (unitless), Di is the molecular diffusion coefficient of the ith component (m2/s), q is the water flow rate (m/s), Ri is the term describing the chemical reactions, t is the time (s) and x is the coordinate (m).
Chemical processes in concrete were modelled as equilibrium reactions based on mass action equations that relate activities of species to an equilibrium constant K [37]:
  K = products a p ν p reactants a r ν r ,
where ap and ar are activities, and dνp and νr are the stoichiometric coefficients of the products and reactants, respectively.
Thermodynamic parameters for the considered cement minerals are provided in Table 5.
In transport calculations, radionuclide sorption was modelled as a radionuclide reaction with a surface following the approach proposed in [37]. This approach is based on the appropriate definition of the number of surface sites and equilibrium constants that can accurately represent linear sorption. The mass action equation for the radionuclide R’s reaction with a surface Surf can be written as
Surf + R = SurfR,
and the reaction constant is
K = ( SurfR ) R · ( Surf )   or
log(K) = log(SurfR) − log(R) − log(Surf),
where (Surf), (R) and (SurfR) indicate activities. It is assumed that the activity (R) is equal to the radionuclide concentration (mol/L), and the activity of surface species is equal to the mole fraction. When a very large number of surface sites Surftot is defined, the Surf mole fraction is close to 1. Taking this into account, and considering that Kd is defined as the ratio between the concentration of sorbed radionuclides (mol/kg_soil) and the concentration in solution (mol/L), the final expression of the reaction constant is
log ( K ) = log ( Kd · ρ Surftot ) ,
where Kd is the sorption coefficient (L/kg), ρ is the solid material density (kg/L) and Surftot is the number of surface sites (assumed as 1010 mol (based on [37])).
The implementation of the above-described approach was checked in [38] by comparing the results of a simple solute transport model where sorption was described directly with a Kd value with the results of a model where sorption was represented as a surface reaction. Good agreement between the results was found.
Radioactive decay was modelled as a kinetic reaction with the following decay constants: 4.41 × 10⁻⁸ 1/year for 129I, 9.24 × 10⁻⁶ 1/year for 59Ni and 2.88 × 10⁻⁵ 1/year for 239Pu.
While implementing the model in the computer tool, the following assumptions were made, and both initial and boundary conditions were defined.
  • Radionuclides are initially homogeneously distributed in the waste zone. The initial inventory of each radionuclide is arbitrarily assumed to be 10−6 mol in 1 dm3 of porous medium. The distribution of the radionuclides between the solid and liquid phases corresponds to the initial Kd value (see Table 4, concrete degradation stage I). No radionuclides are present in the concrete top and bottom slabs.
  • For water flow, a constant flux boundary condition is applied at the top and the bottom of the modelled region, with the flow direction from top to bottom. The water flux is 83 mm/y, as indicated in Section 2.3.1. A third-type (Cauchy or solute flux) boundary condition is applied at these boundaries to specify the solute flux. The chemical composition of the inflowing solution at the top of the region corresponds to the modified rainwater composition (see Section 2.3.1). The concentration of components in the outflowing solution from the modelled region corresponds to the pore water concentration at the bottom of the repository.
  • The modelled region was discretised into 1 cm finite elements. The initial time step was 100 s, and the minimal and maximal time step limits were set to 1 s and 0.1 years, respectively.
  • In cases 3 and 4, the calculations were performed in steps. The model was run until the time step at which the sorption value in the concrete had to be updated. Information about the system’s final state at the end of this period was saved and used as input to a subsequent run with updated Kd values.

3. Results and Discussion

Firstly, this section presents the modelling results regarding the potential degradation of concrete barriers and changes in the pH in the repository in order to identify concrete degradation stages. Based on these results, the time steps at which radionuclide sorption needs to be updated are identified. Then, the radionuclide migration modelling results for the considered cases 1–4 (see Section 2.3.3) are analysed. The effect of engineered barrier degradation on radionuclide migration in the near field of the repository was studied by comparing the radionuclide concentration distribution in the repository (concentration profiles) and the radionuclide flux into the surrounding environment. The changes in the radionuclide concentration are presented as relative changes (unitless), i.e., the calculated concentration (Bq/L_solution) is scaled to the initial concentration in the repository (Bq/L_media). Similarly, the radionuclide flux from the repository (Bq/y) is scaled to the initial radionuclide activity in the repository (Bq) and is presented as relative flux (1/year).

3.1. pH Evolution in the Repository

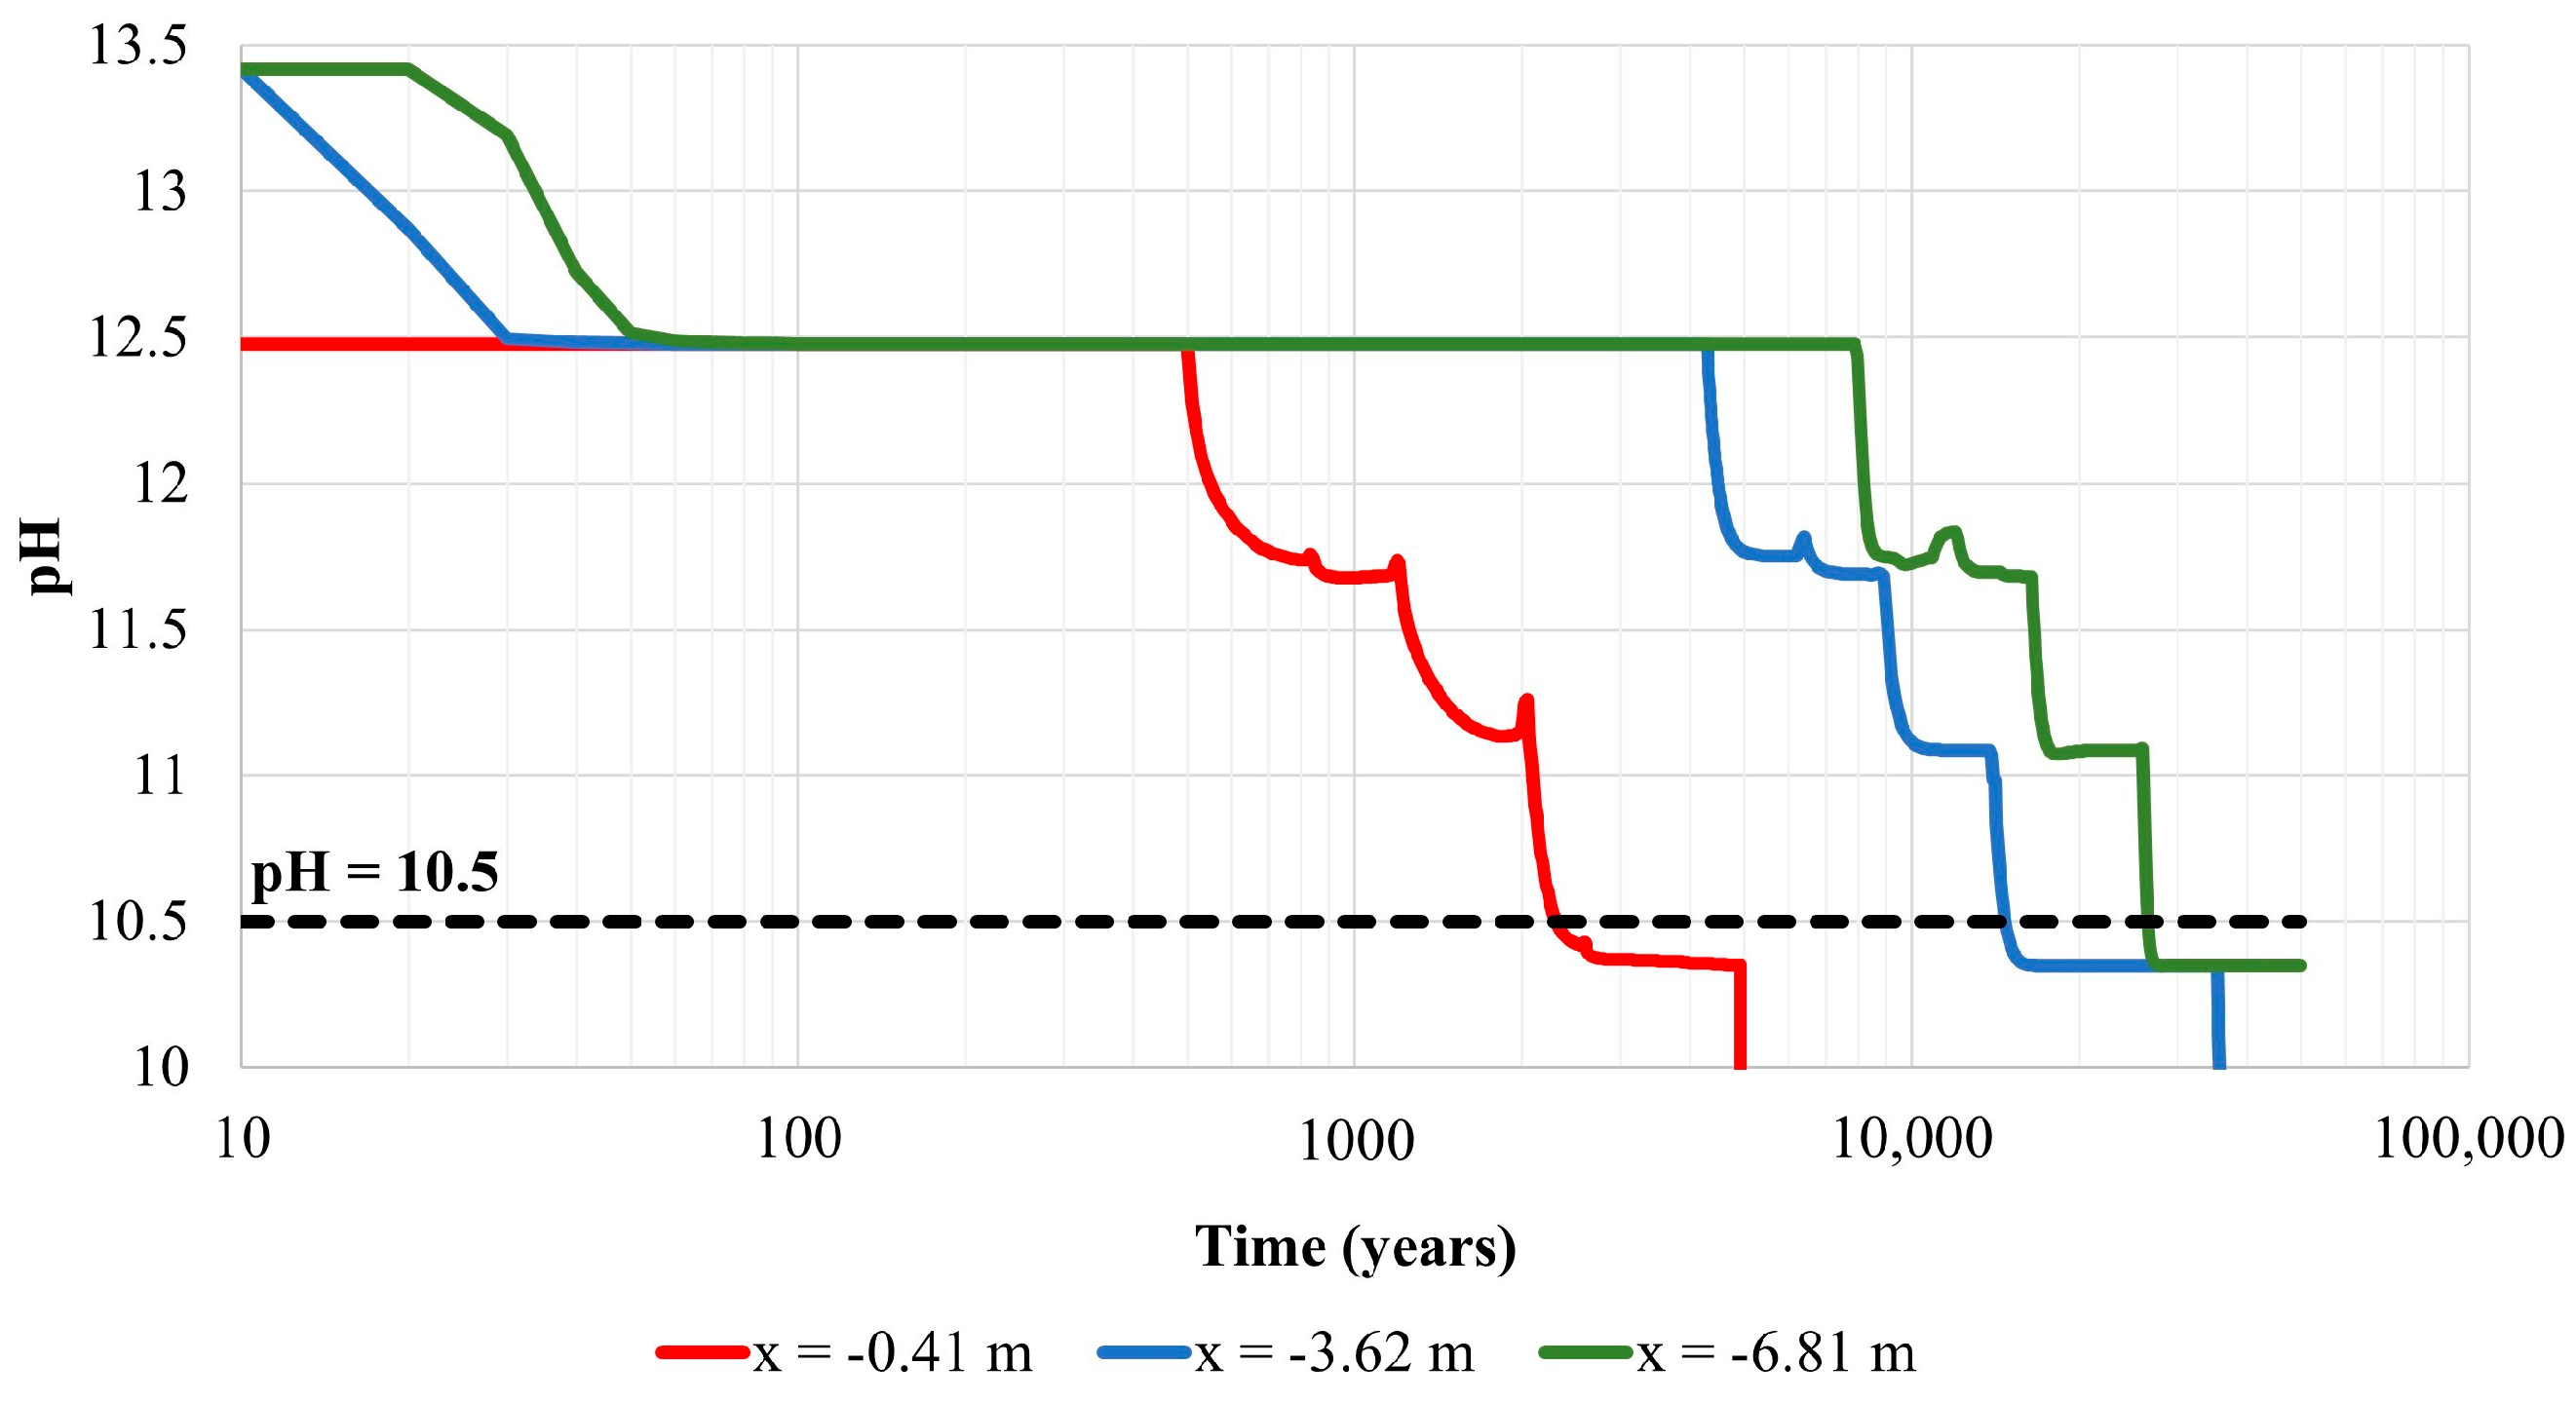
Changes in the pH at specific locations, namely at the top of the waste zone, in the middle of the waste zone and at the top of the bottom slab (see observation points in Figure 3), are presented in Figure 5.
As Figure 5 demonstrates, the pH changes obtained in the repository are very similar at all three observation points and only shifted in time. The first cement degradation stage (characterised by a pH greater than 12.5, related to the large amount of alkalis) in the repository is shorter than 100 years. At the top of the waste zone, this period is shorter than 10 years, and it is not presented in Figure 5. The second cement degradation stage, with a constant pH value of about 12.5 at the top of the waste zone, lasts about 500 years. This period is much longer for the bottom part of the waste zone (about 4000 years) and the bottom slab (about 8000 years). The third cement degradation stage, which is governed by the dissolution/precipitation of calcium silicate hydrates (C-S-H) and AFm and Aft phases, is characterised by a pH decrease from 12.5 to about 10.5. At the top of the waste zone, this stage ends in about 5000 years after repository closure, while, in the bottom part of the waste zone, the end of this stage is in about 35,000 years. For the bottom slab, the third stage may last for more than 50,000 years.
The pH profiles obtained were compared with the pH profiles from other similar works [5,14,17,39]. It was found that the pH changes in the repository were consistent in nature with the pH profiles in these studies. However, the duration of each cement degradation stage is case-specific and depends on the analysed system, including the concrete composition, inflowing solution composition, water flow rate and physical material properties. Nonetheless, the main trend in the durations of the cement degradation stages is maintained: a short duration for stage I (a few years), stage II lasting several thousands of years and stage III lasting tens of thousands of years.
The results of the modelled pH changes in the repository were subsequently used to identify the time steps and locations at which the Kd values should be updated in the radionuclide migration model in case 3 and case 4. The time (year) of changes, the location and the Kd values associated with the cement degradation stages are summarised in Table 6 (for case 3) and Table 7 (for case 4). In case 3, four runs were required, and, in case 4, the number of required runs was 13.

3.2. Radionuclide Concentration in the Repository

The radionuclide concentration in the repository is a good indicator with which to follow the effects of concrete degradation and associated changes in its ability to sorb radionuclides. The modelling results are presented as relative concentrations, i.e., the estimated concentration in pore water scaled to the initial radionuclide concentration in 1 L of the homogenised waste zone.
The Kd values in the cementitious materials in the analysed cases 1 and 2 were assumed to be constant throughout the modelled period of time. In cases 3 and 4, the degradation of cementitious materials and, consequently, changes in their sorption were taken into account. Moreover, cases 3 and 4 considered the fact that the degradation of cementitious barriers is non-homogeneous, i.e., more rapid degradation is expected in the upper part of the repository, while the degradation process at the bottom of the repository is considerably slower.

3.2.1. Concentration Profiles, Case 3

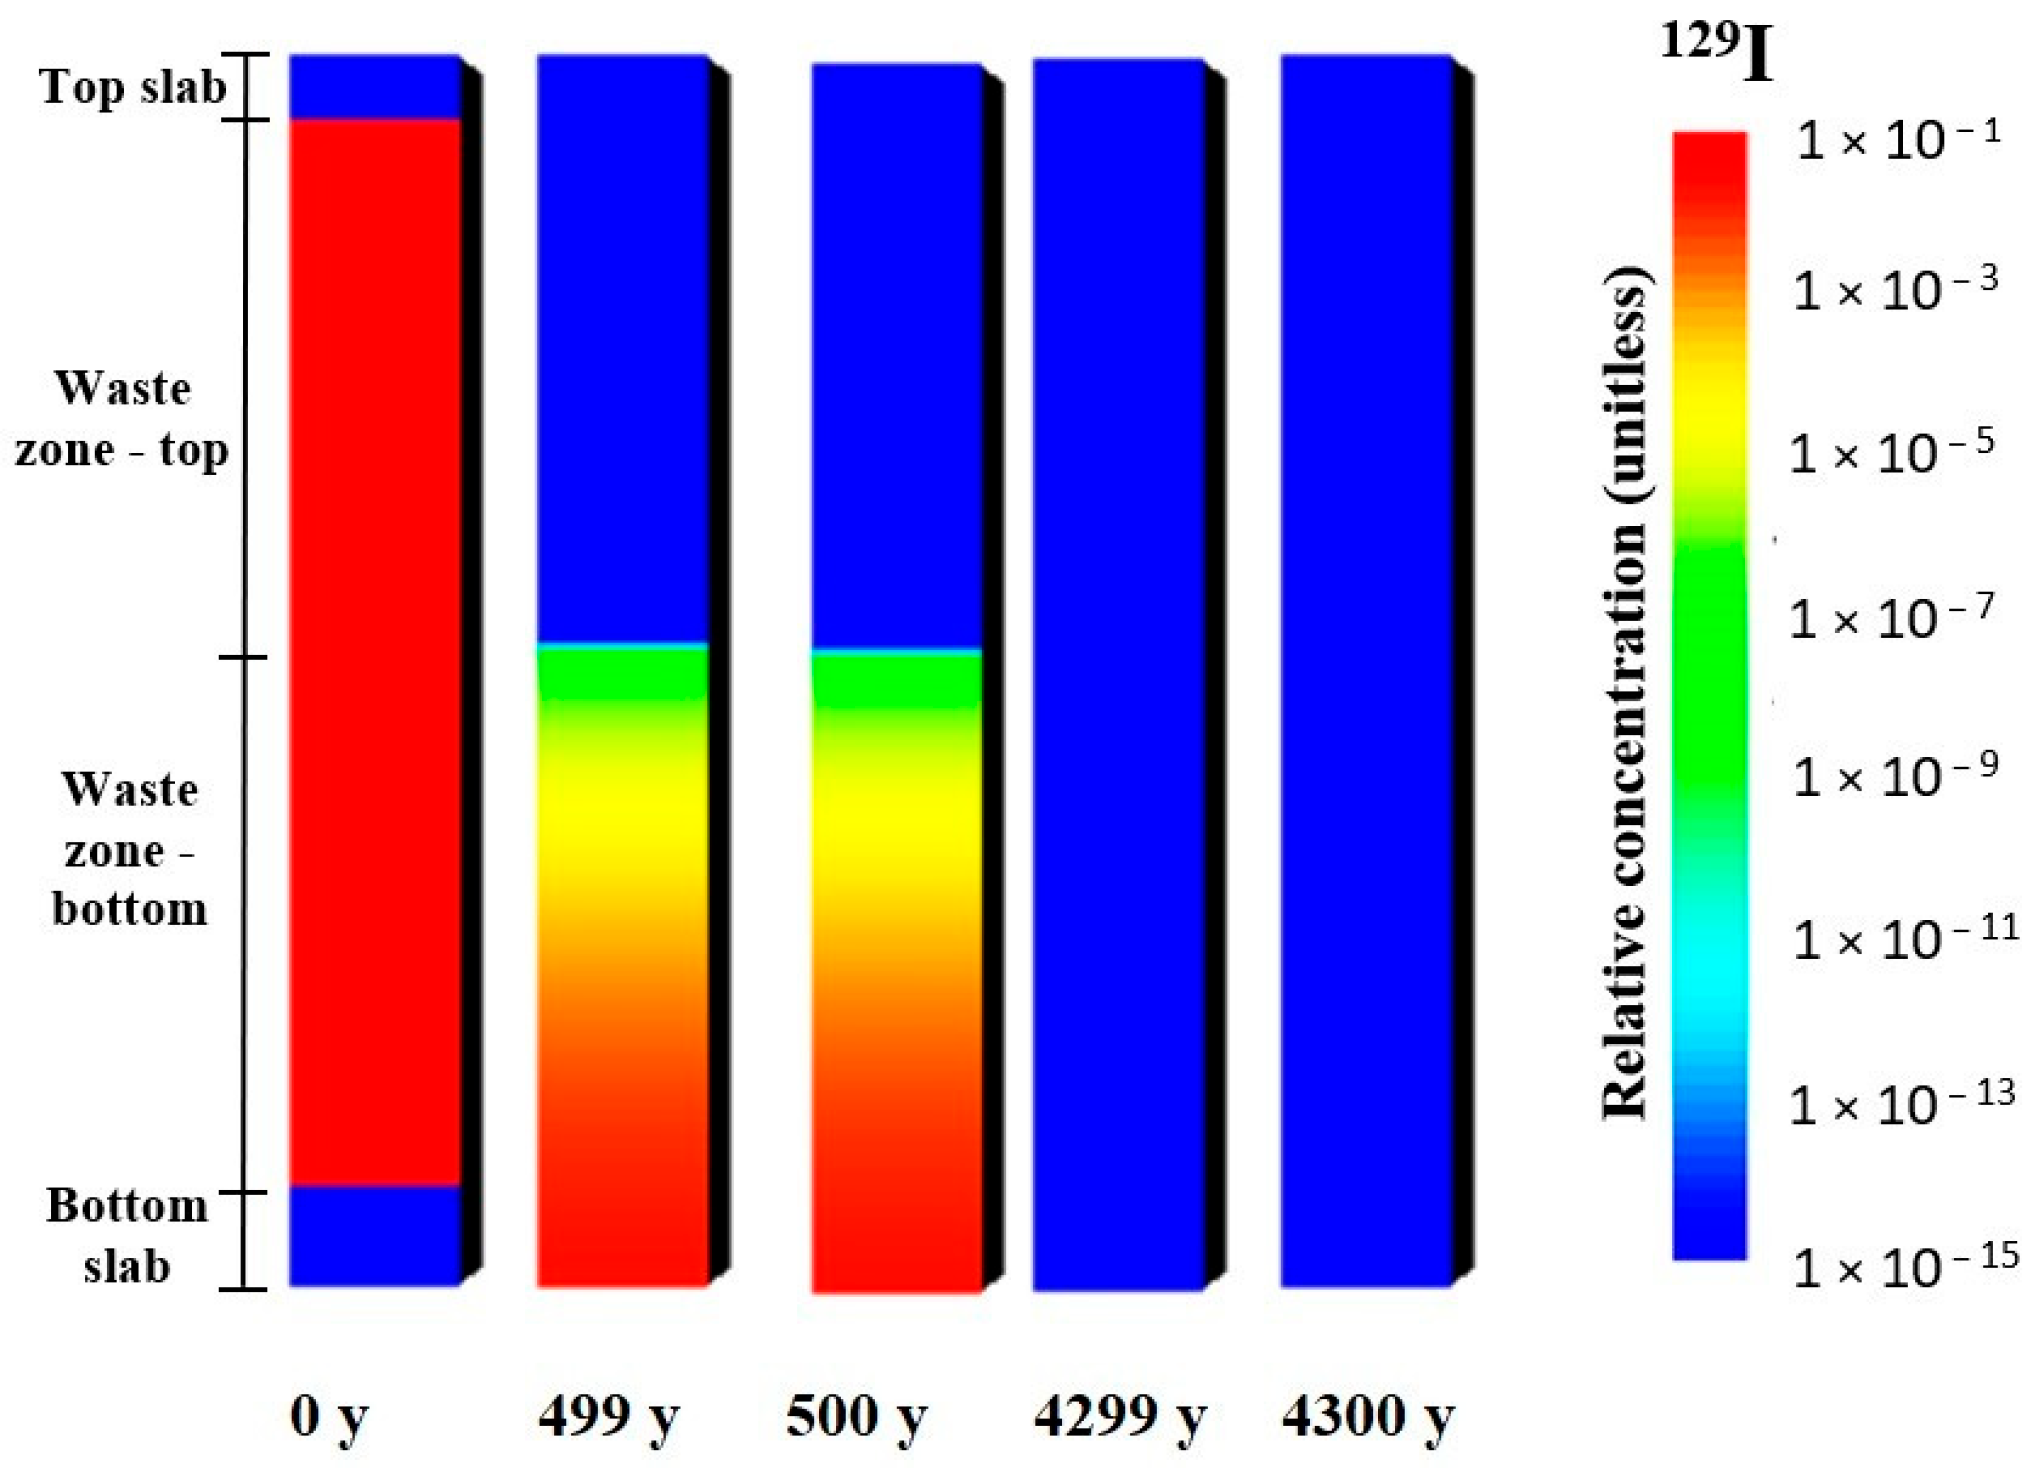
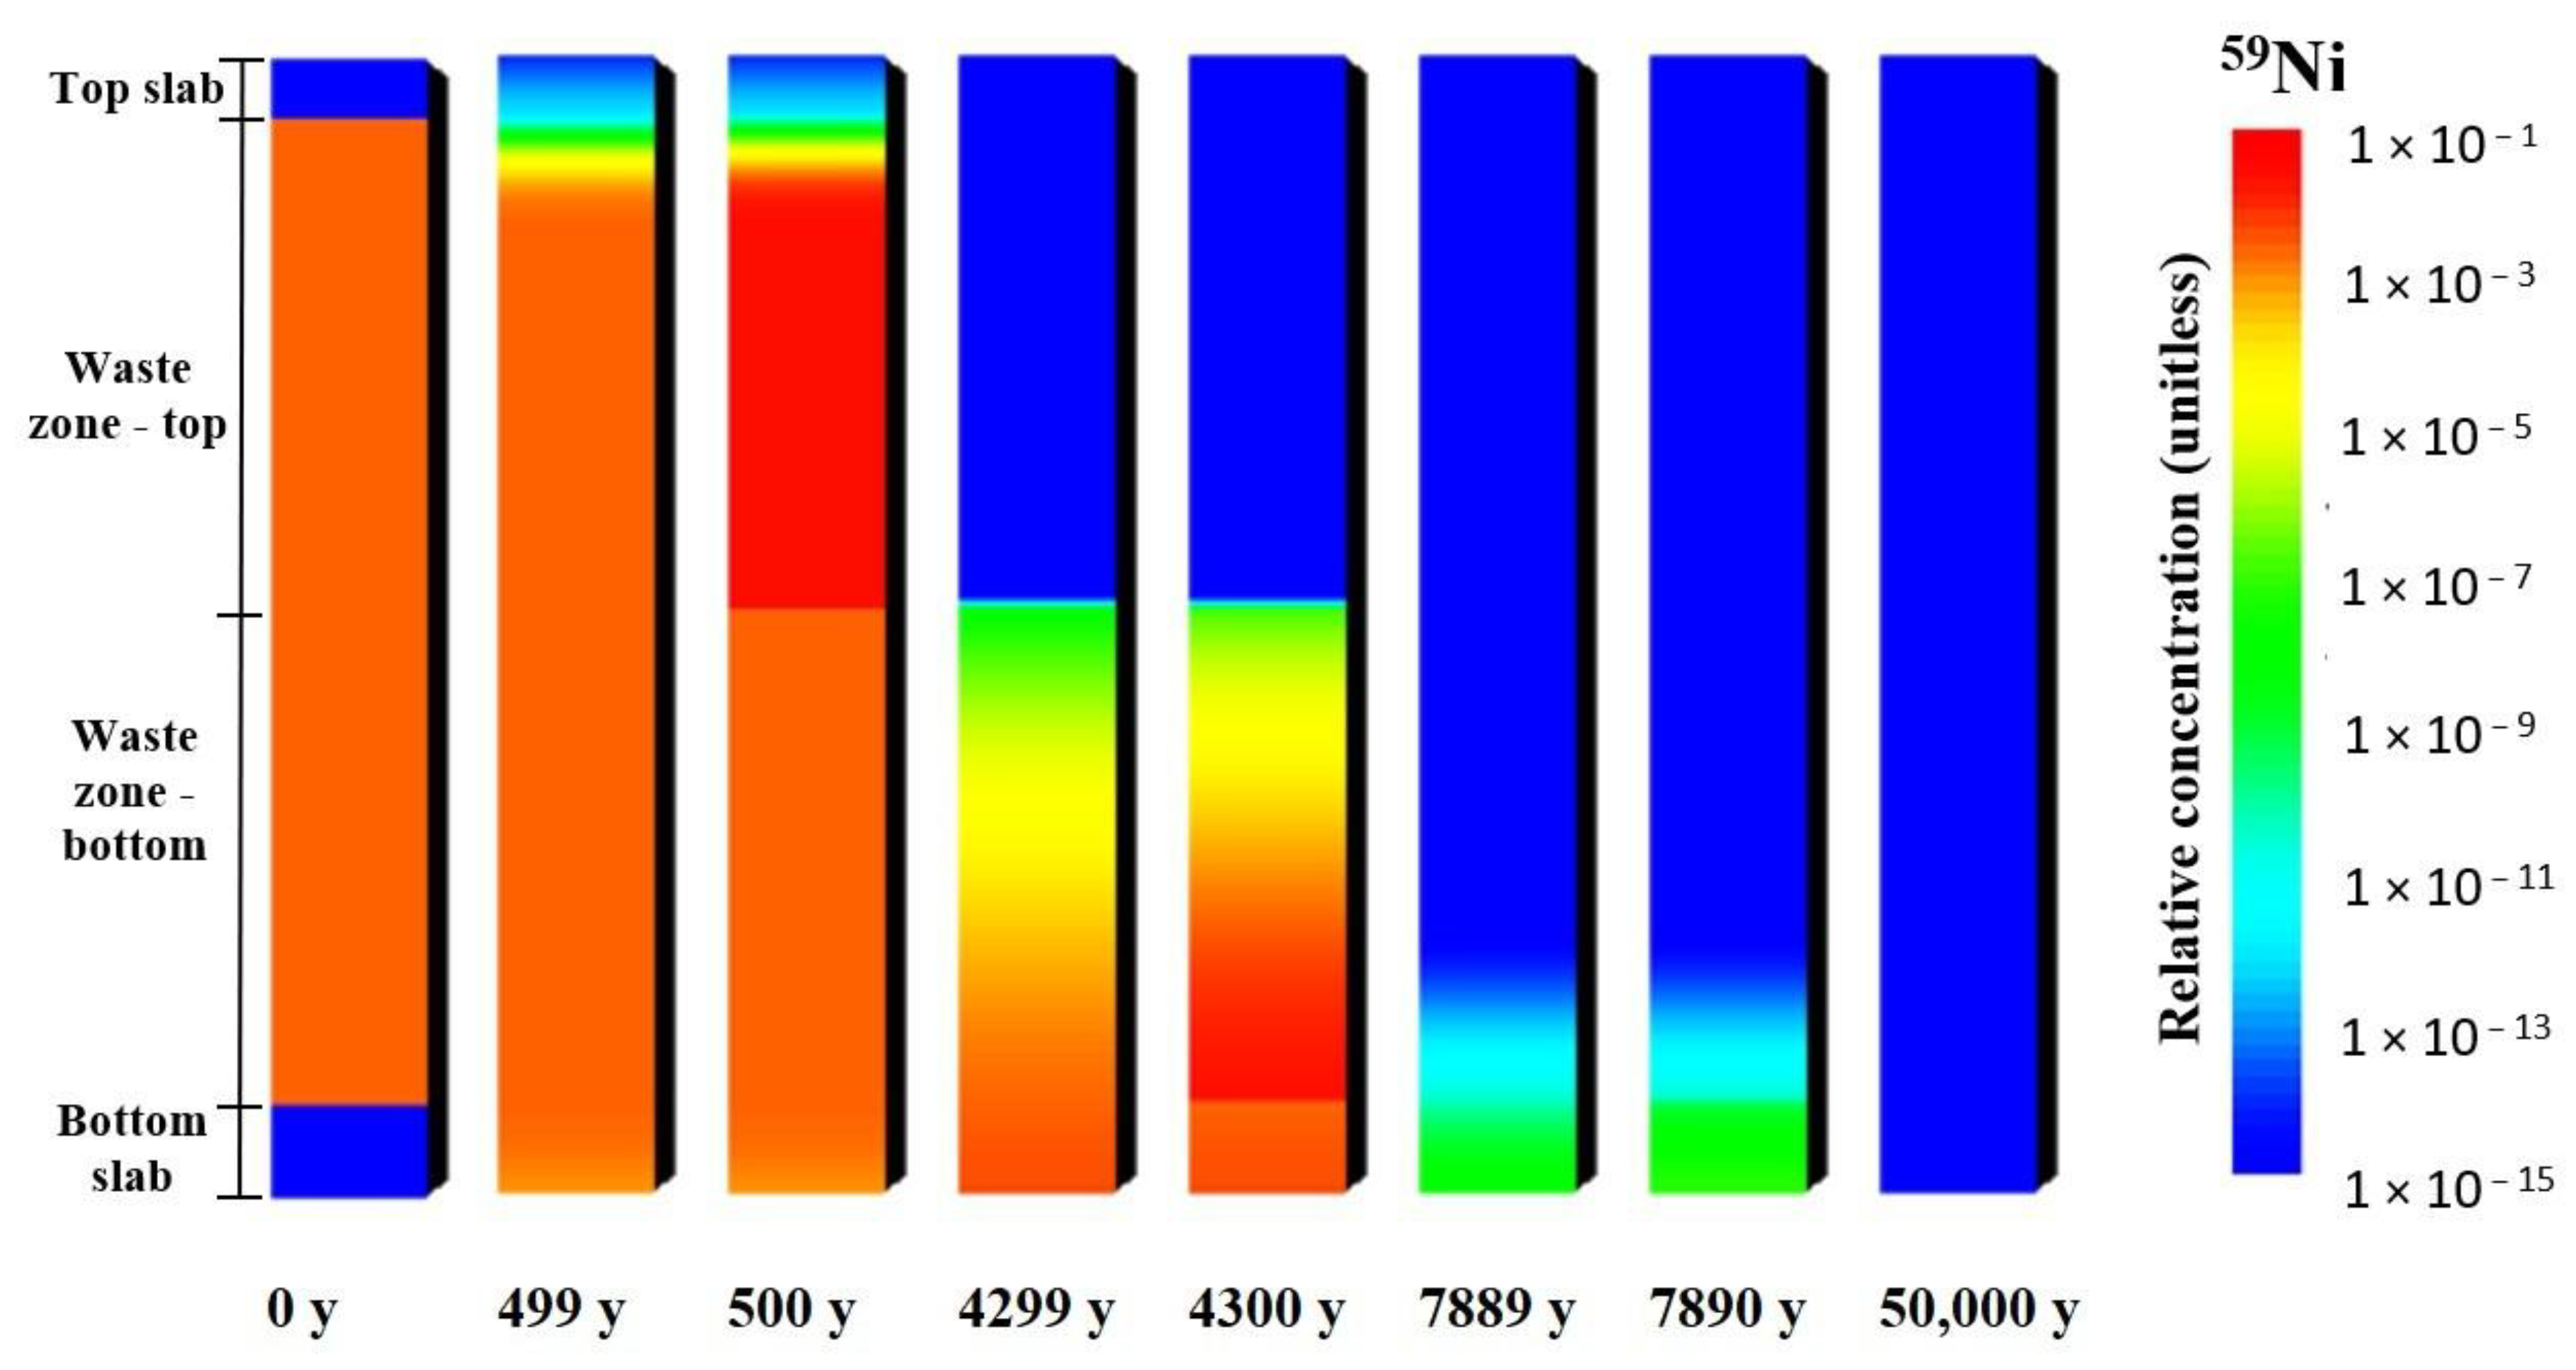
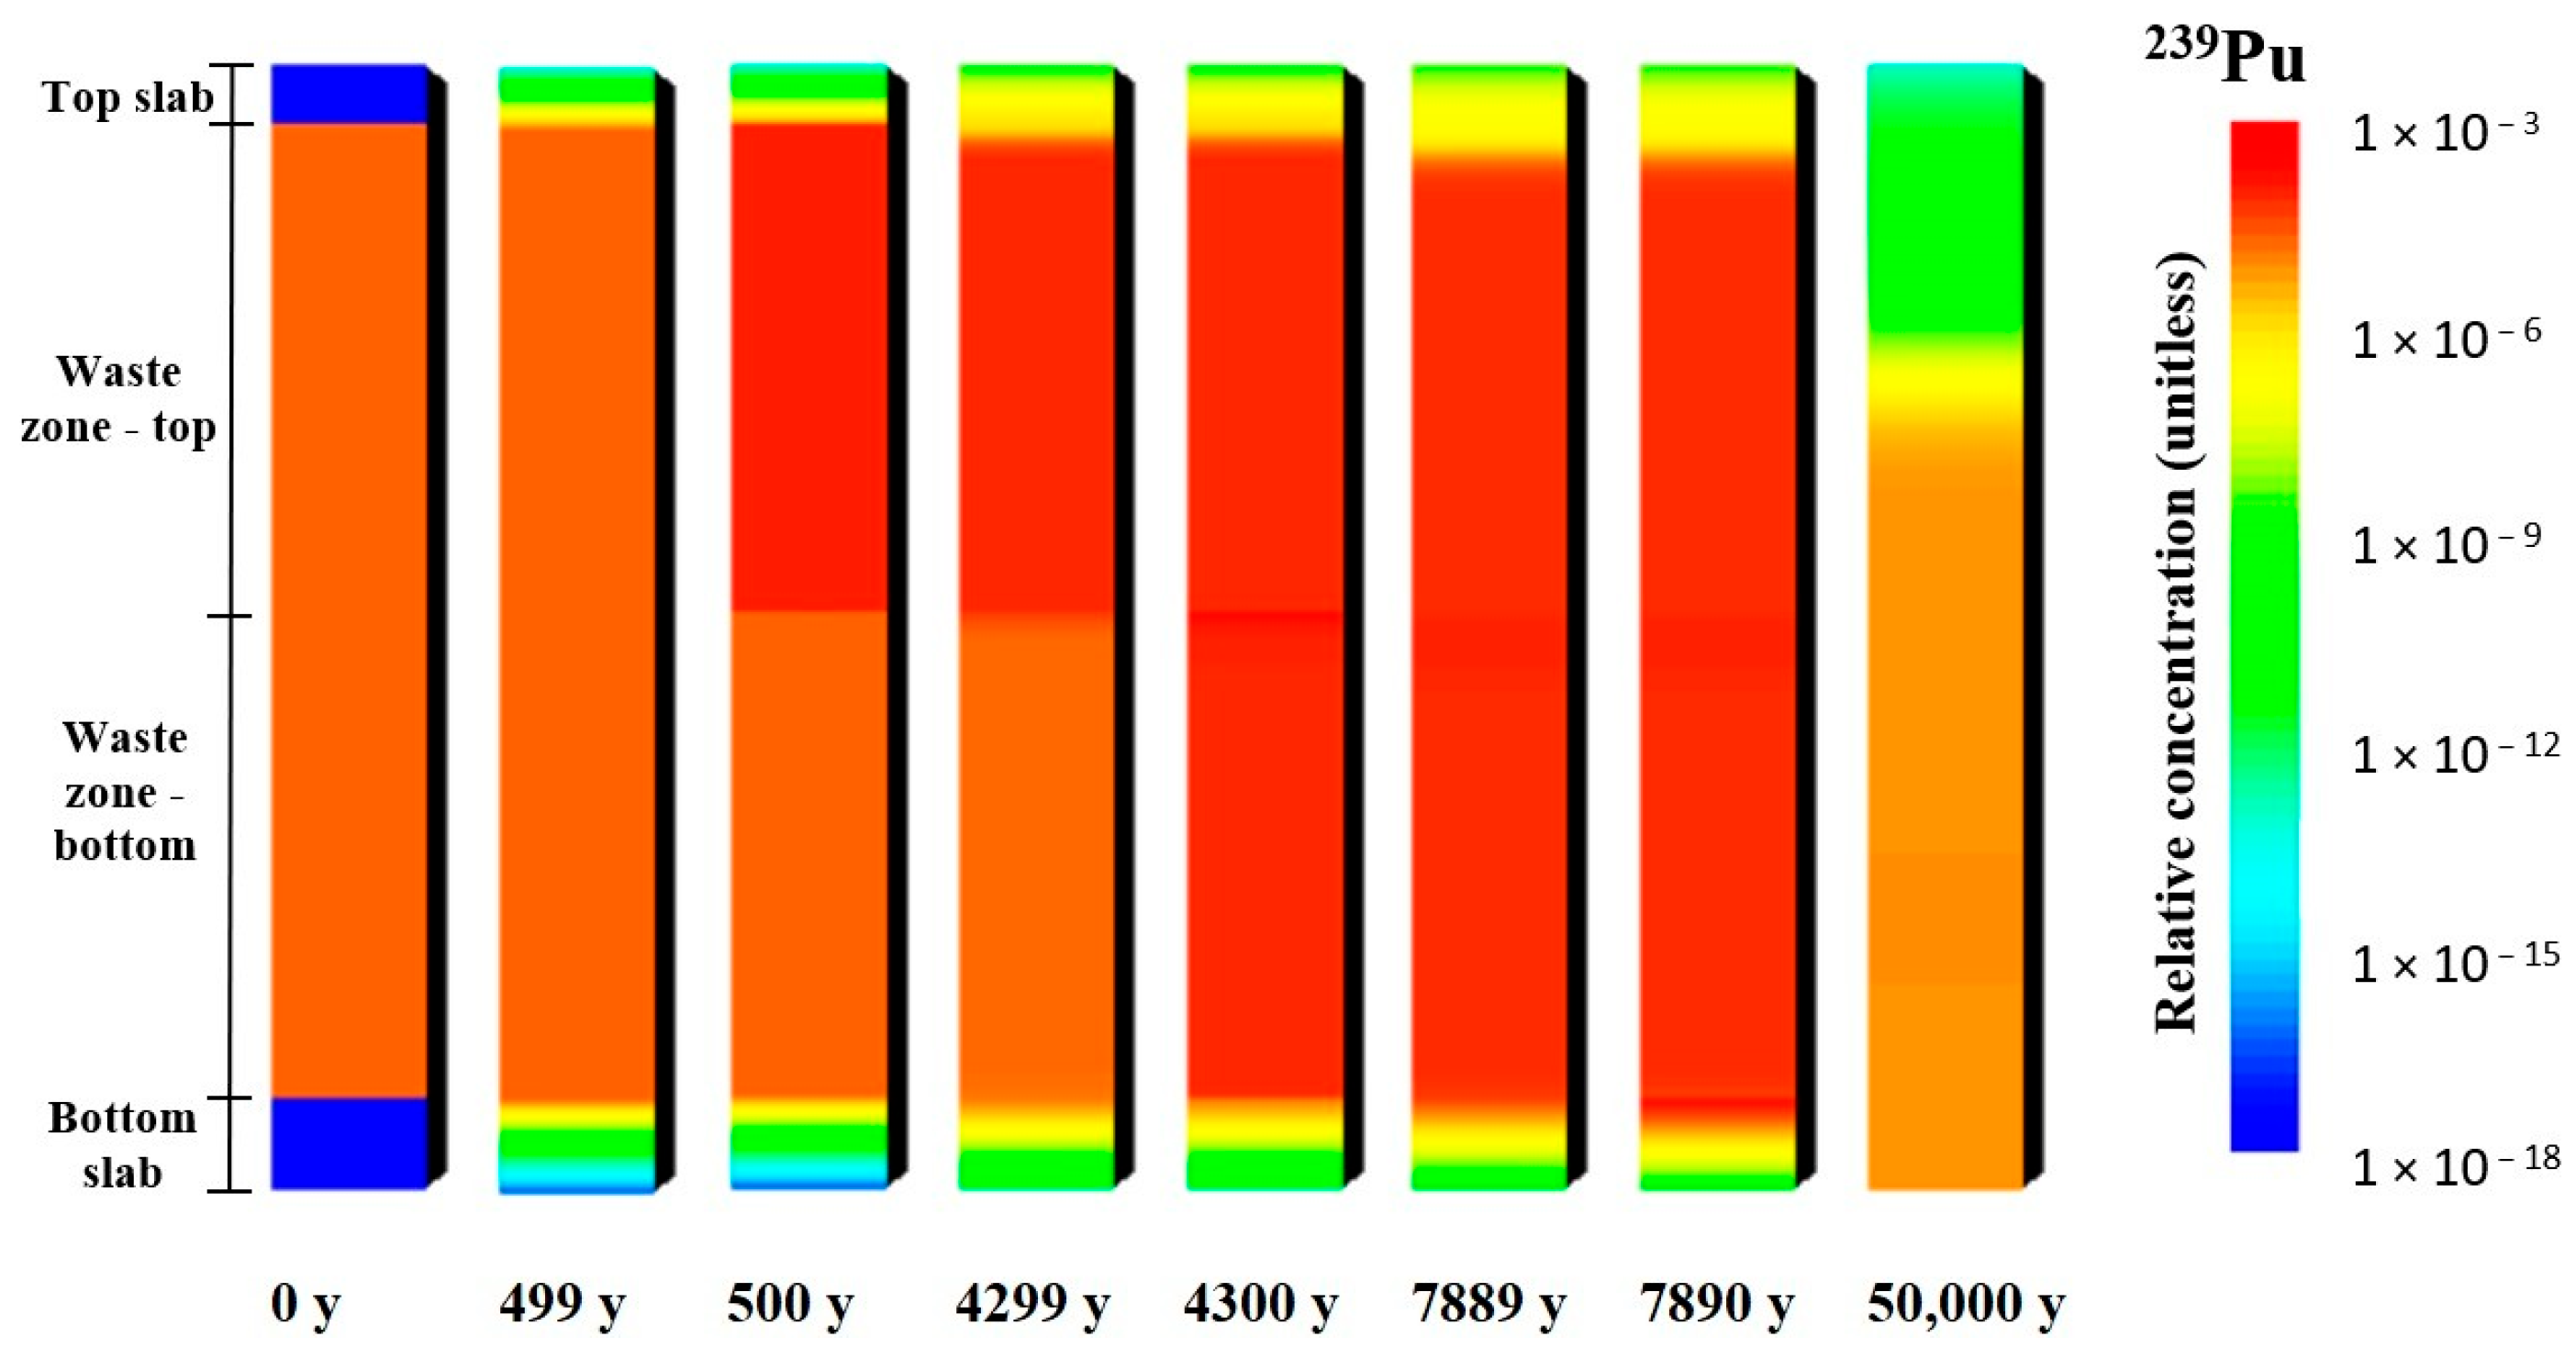
The effect of the suggested stepwise approach to account for the changes in sorption on the radionuclide concentration in the analysed system is presented in Figure 6 (for radionuclide 129I), Figure 7 (for radionuclide 59Ni) and Figure 8 (for radionuclide 239Pu). The relative concentration profiles in case 3 (the case with a single degradation step for each subregion, as presented in Figure 3) are provided as colour bars for the time steps corresponding to the times before and immediately after the change in the Kd value. In addition, the initial relative concentration in the system, as well as the relative concentration at the end of the modelled period of time, is included. The concentration profiles in case 4 are similar and thus not provided in this paper.
The first colour bar in Figure 6, Figure 7 and Figure 8 corresponds to the initial state of the system, and the waste zone region with homogeneously distributed radionuclides is clearly seen. There are no radionuclides in the top and bottom slabs. The first change in the Kd value happens at 500 years after repository closure. The comparison of the 129I relative concentration profiles before and after the first change (499-year and 500-year bars in Figure 6) indicates no changes. The first change is attributed to the degradation of the upper part of the waste zone. The results indicate that, by around 500 years, the relative concentration of 129I has decreased significantly. Therefore, the update of the Kd value has almost no effect. Radionuclide 129I shows similar behaviour at around 4300 years, when the degradation of the bottom part of the waste zone is assumed. By this time, radionuclide 129I has almost leached from the repository and any changes in concrete sorption are of minor importance.
The situation is different for radionuclides 59Ni and 239Pu. The decrease in sorption in the upper part of the waste zone for both radionuclides can be easily distinguished by looking at the colour bars at 499 and 500 years in Figure 7 and Figure 8. However, at the later time steps, the trend in relative concentration changes between these radionuclides is slightly different. By about 4300 years after repository closure—i.e., at the time when the Kd value changes in the bottom part of the waste zone—the relative concentration of 59Ni has gradually developed a distribution within this zone, showing a lower concentration in the upper part and a higher concentration near the bottom slab. Therefore, the decrease in the Kd value results in a proportional increase in concentration. In the case of the well-sorbed radionuclide 239Pu, its concentration is almost constant at the bottom part of the waste zone, and its value is close to the initial relative concentration. Following the decrease in the Kd value, a significant increase in the relative concentration of 239Pu is observed throughout the entire bottom part of the waste zone, with a slightly higher relative concentration at the interface between the upper and bottom parts of the waste zone. By about 7890 years (the time of degradation of the bottom slab), the relative concentration of 59Ni has significantly decreased in the entire system in case 3, and changes in the Kd value are of lesser importance (see Figure 7). By the end of the modelled period of time (50,000 years), 59Ni has been leached out from the repository. For 239Pu, due to good sorption, the high relative concentration remains in the waste zone until the time of degradation of the bottom slab (7890 years, see Figure 8). The slow transport of 239Pu means that, by this time, the relative concentration in the bottom slab is significantly lower than in the waste zone and remains so even after the decrease in the Kd value in the bottom slab. It can be observed that, at the end of the modelled period (the last bar in Figure 8), the relative concentration of 239Pu in the upper part of the system has already significantly decreased, and the relative concentration throughout the whole bottom slab is similar to the concentration throughout the bottom part of the waste zone. It should be noted that a small amount of radionuclides appears in the top vault slab as a result of the diffusion process.

3.2.2. Concentration Changes over Time

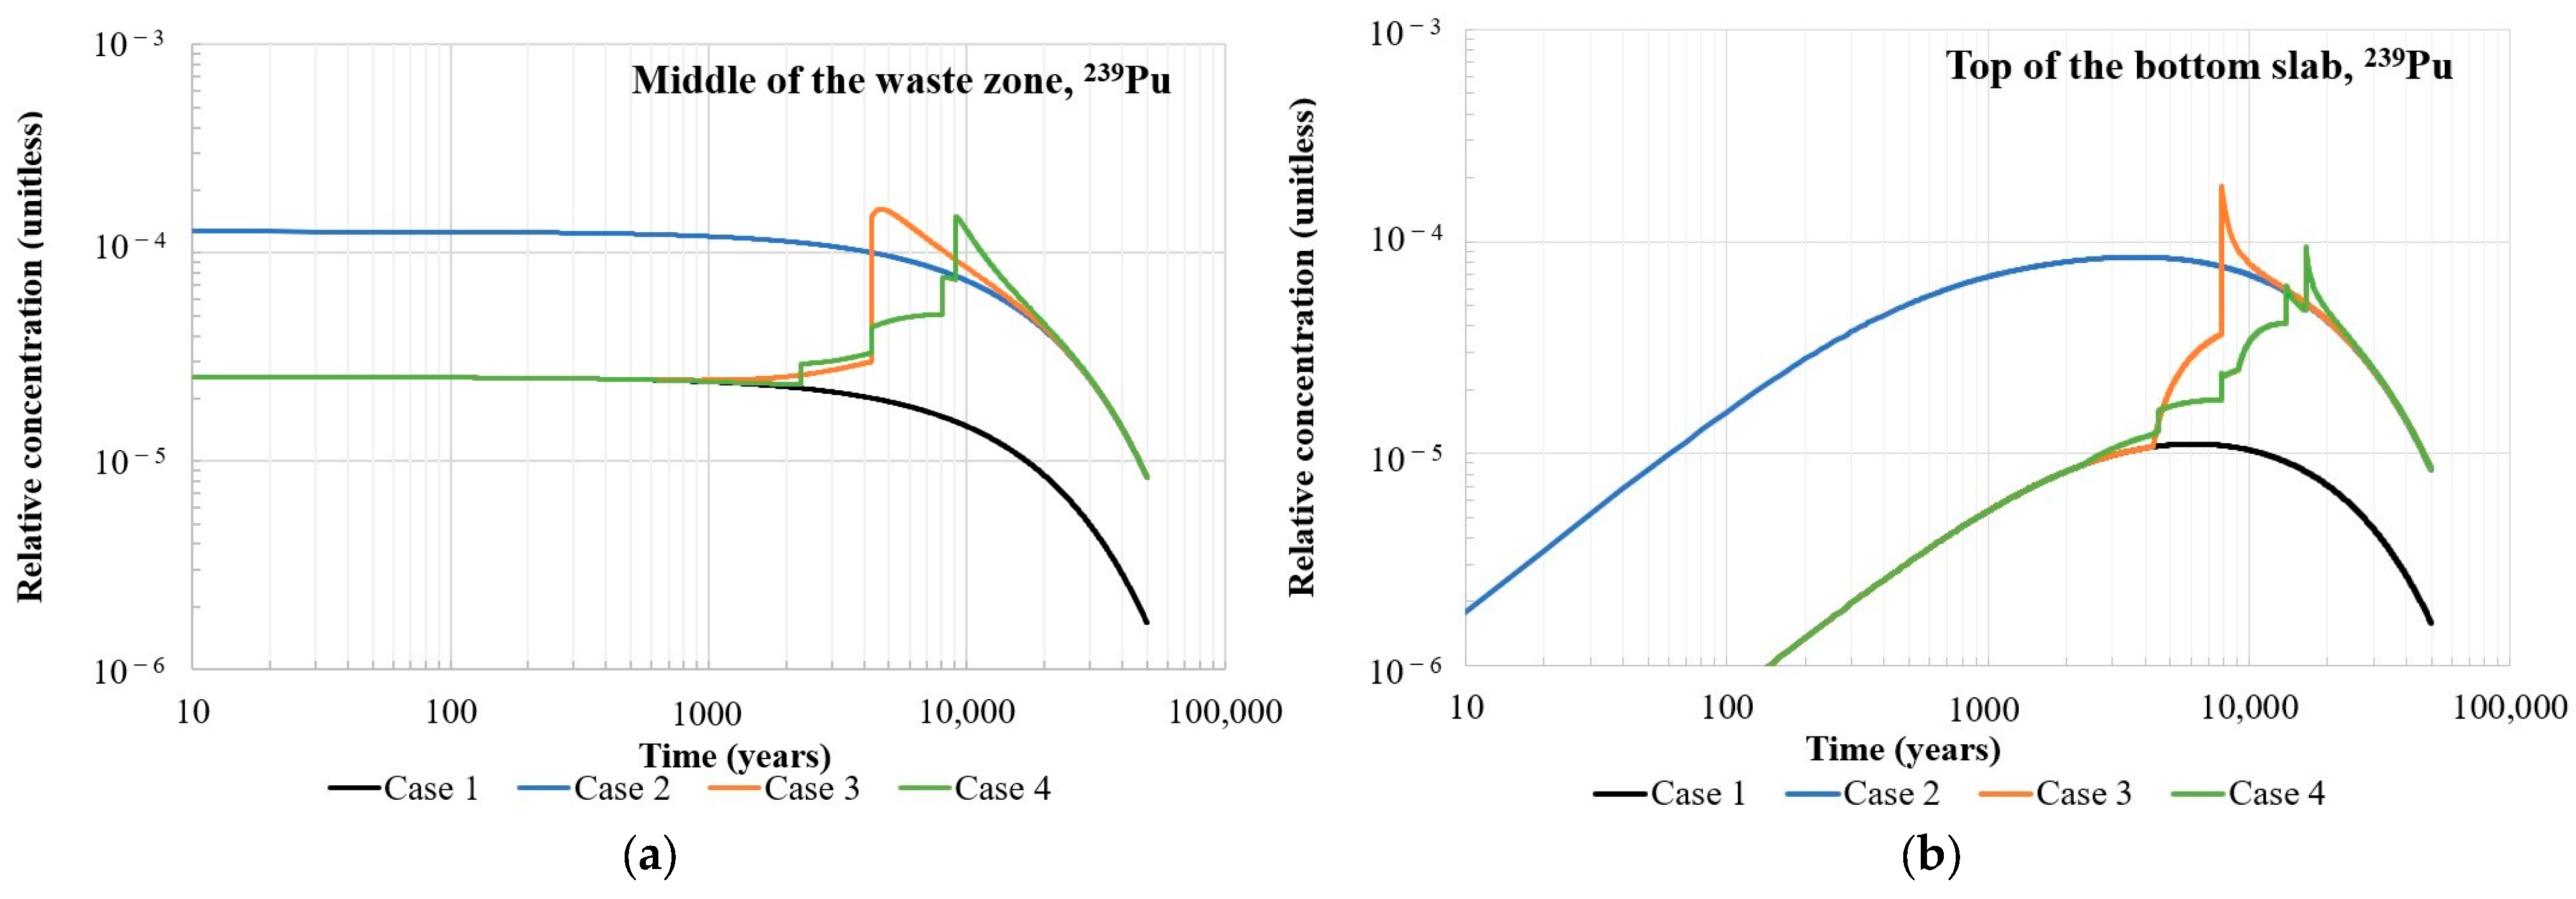
The evolution of the relative concentration over time when modelling cases 1–4 is compared at the middle point of the waste zone (point no. 2, see Figure 3) and at the top of the bottom slab (point no. 3, see Figure 3). A summary of the peak concentrations and the time of their appearance for each radionuclide and modelling case at both locations is provided in Table 8.
129I. The evolution of the relative concentration over time for radionuclide 129I is presented in Figure 9. Figure 9a shows that the initial relative concentration in the waste zone is about 4.1 × 10⁻² in cases 1 and 3 and about 3.0 × 10⁻¹ in case 2. This is due to the sorption behaviour of 129I: in case 2, the Kd value was selected to represent degraded concrete, which resulted in a higher relative concentration. For a non-sorbing radionuclide (Kd = 0 m3/kg), the relative concentration would be equal to 1. The vault bottom slab initially contains no radionuclides. However, due to poor retardation, 129I is rapidly transported from the waste zone down into the bottom slab, and, in a decade, its concentration in the bottom slab becomes similar to that in the waste zone. In cases 1 and 3, the relative concentration of 129I in the middle of the waste zone decreases significantly after several hundred years (Figure 9a), whereas the decrease in the upper part of the vault bottom slab occurs at approximately 1000 years (Figure 9b). In case 2, 129I is even more rapidly transported from the repository: a significant decrease in the relative concentration is observed by around 100 years. Taking into account that the change in the Kd value in the middle of the waste zone occurs by around 4300 years, it has no effect on the evolution of the relative concentration in the waste zone. The same situation is seen in the bottom slab: the change in the Kd value occurs at the time when the 129I relative concentration decreases to an insignificant amount. This explains the overlap of the relative concentration lines in case 1 and case 3. The changes in the relative concentration are the same in case 4; therefore, the results for 129I in case 4 are not provided.
59Ni. The evolution of the relative concentration over time for radionuclide 59Ni is presented in Figure 10. The initial relative concentration in the waste zone in cases 1, 3 and 4 is about 3 × 10⁻³ and that in case 2 is about 3 × 10⁻². It can be observed from Figure 10a that the relative concentration in the middle of the waste zone in cases 1 and 2 (i.e., the cases with constant Kd values) remains close to the initial level until the amount of 59Ni leached from this zone is compensated for by the amount transferred from the upper part of the waste zone. In case 1, this period lasts approximately 3000 years, and, in case 2, it lasts about 300 years. The cases involving the degradation of cementitious materials (cases 3 and 4) follow the pattern of case 1 until the first change in the Kd value in the upper part of the waste zone at 500 years. This change results in an increase in the relative concentration of 59Ni in the bottom part of the waste zone: in case 3, the peak in the relative concentration is higher by a factor of 7.5 in comparison with case 1; in case 4, the increase is somewhat smoother and the maximum relative concentration is about three times higher than in case 1 (see Table 8). The decrease in the Kd value in the bottom part of the waste zone—i.e., the zone with the observation point—has only a minor impact on the relative concentration of 59Ni. The spike in Figure 10a for case 3 at about 4300 years (corresponding to this change) occurs when the relative concentration of 59Ni in the middle of the waste zone has already significantly decreased. This is also in line with the profiles provided for case 3 in Figure 7 (see the colour bar at 4300 years), where the relative concentration in the middle of the waste zone is in the order of 10−7.
Looking at the changes in the 59Ni relative concentration in the bottom slab (Figure 10b), it can be observed that the concentration gradually increases due to the migration of 59Ni from the waste zone. The two peaks in the relative concentration in cases 3 and 4 correspond to the decrease in the Kd value in the upper and bottom parts of the waste zone, respectively. It can be noticed that the maximum relative concentration in the upper part of the bottom slab in case 3 is reached after the complete degradation of the waste zone. This is also in agreement with the results in Figure 7: the decrease in the Kd value in the bottom part of the waste zone (around 4300 years) has a minor impact on changes in the relative concentration in the middle point, but it significantly affects the region near the waste zone and the bottom slab interface.
239Pu. Figure 11 presents the changes in relative concentration over time for radionuclide 239Pu. The initial relative concentration of 239Pu in the waste zone is about 2.5 × 10⁻⁵ in cases 1, 3 and 4 and about 1.3 × 10⁻⁴ in case 3 (see Figure 11a). In general, the trend in concentration changes at the selected output points is similar to that of the 59Ni case. However, the effect of the graded approach for the Kd changes in case 4 can be much better identified. Another notable point is that the relative 239Pu concentration at both locations shown in Figure 11 is strongly affected by changes in the Kd values, and its maximum exceeds the concentration obtained under the assumption of Kd values corresponding to degraded concrete (case 2).

3.2.3. Comparison of Cases 1–4

The differences between the analysed cases (1 to 4) in the distribution of radionuclides in the repository can be observed in the relative concentration profiles at representative time steps, selected based on the radionuclide transfer rate and the timing of Kd updates. It should be noted that, for radionuclide 129I, due to its rapid transport from the repository, there is no difference in the relative concentration profiles between cases 1, 3 and 4 (e.g., see Figure 9). Therefore, no comparison of the 129I profiles is provided.
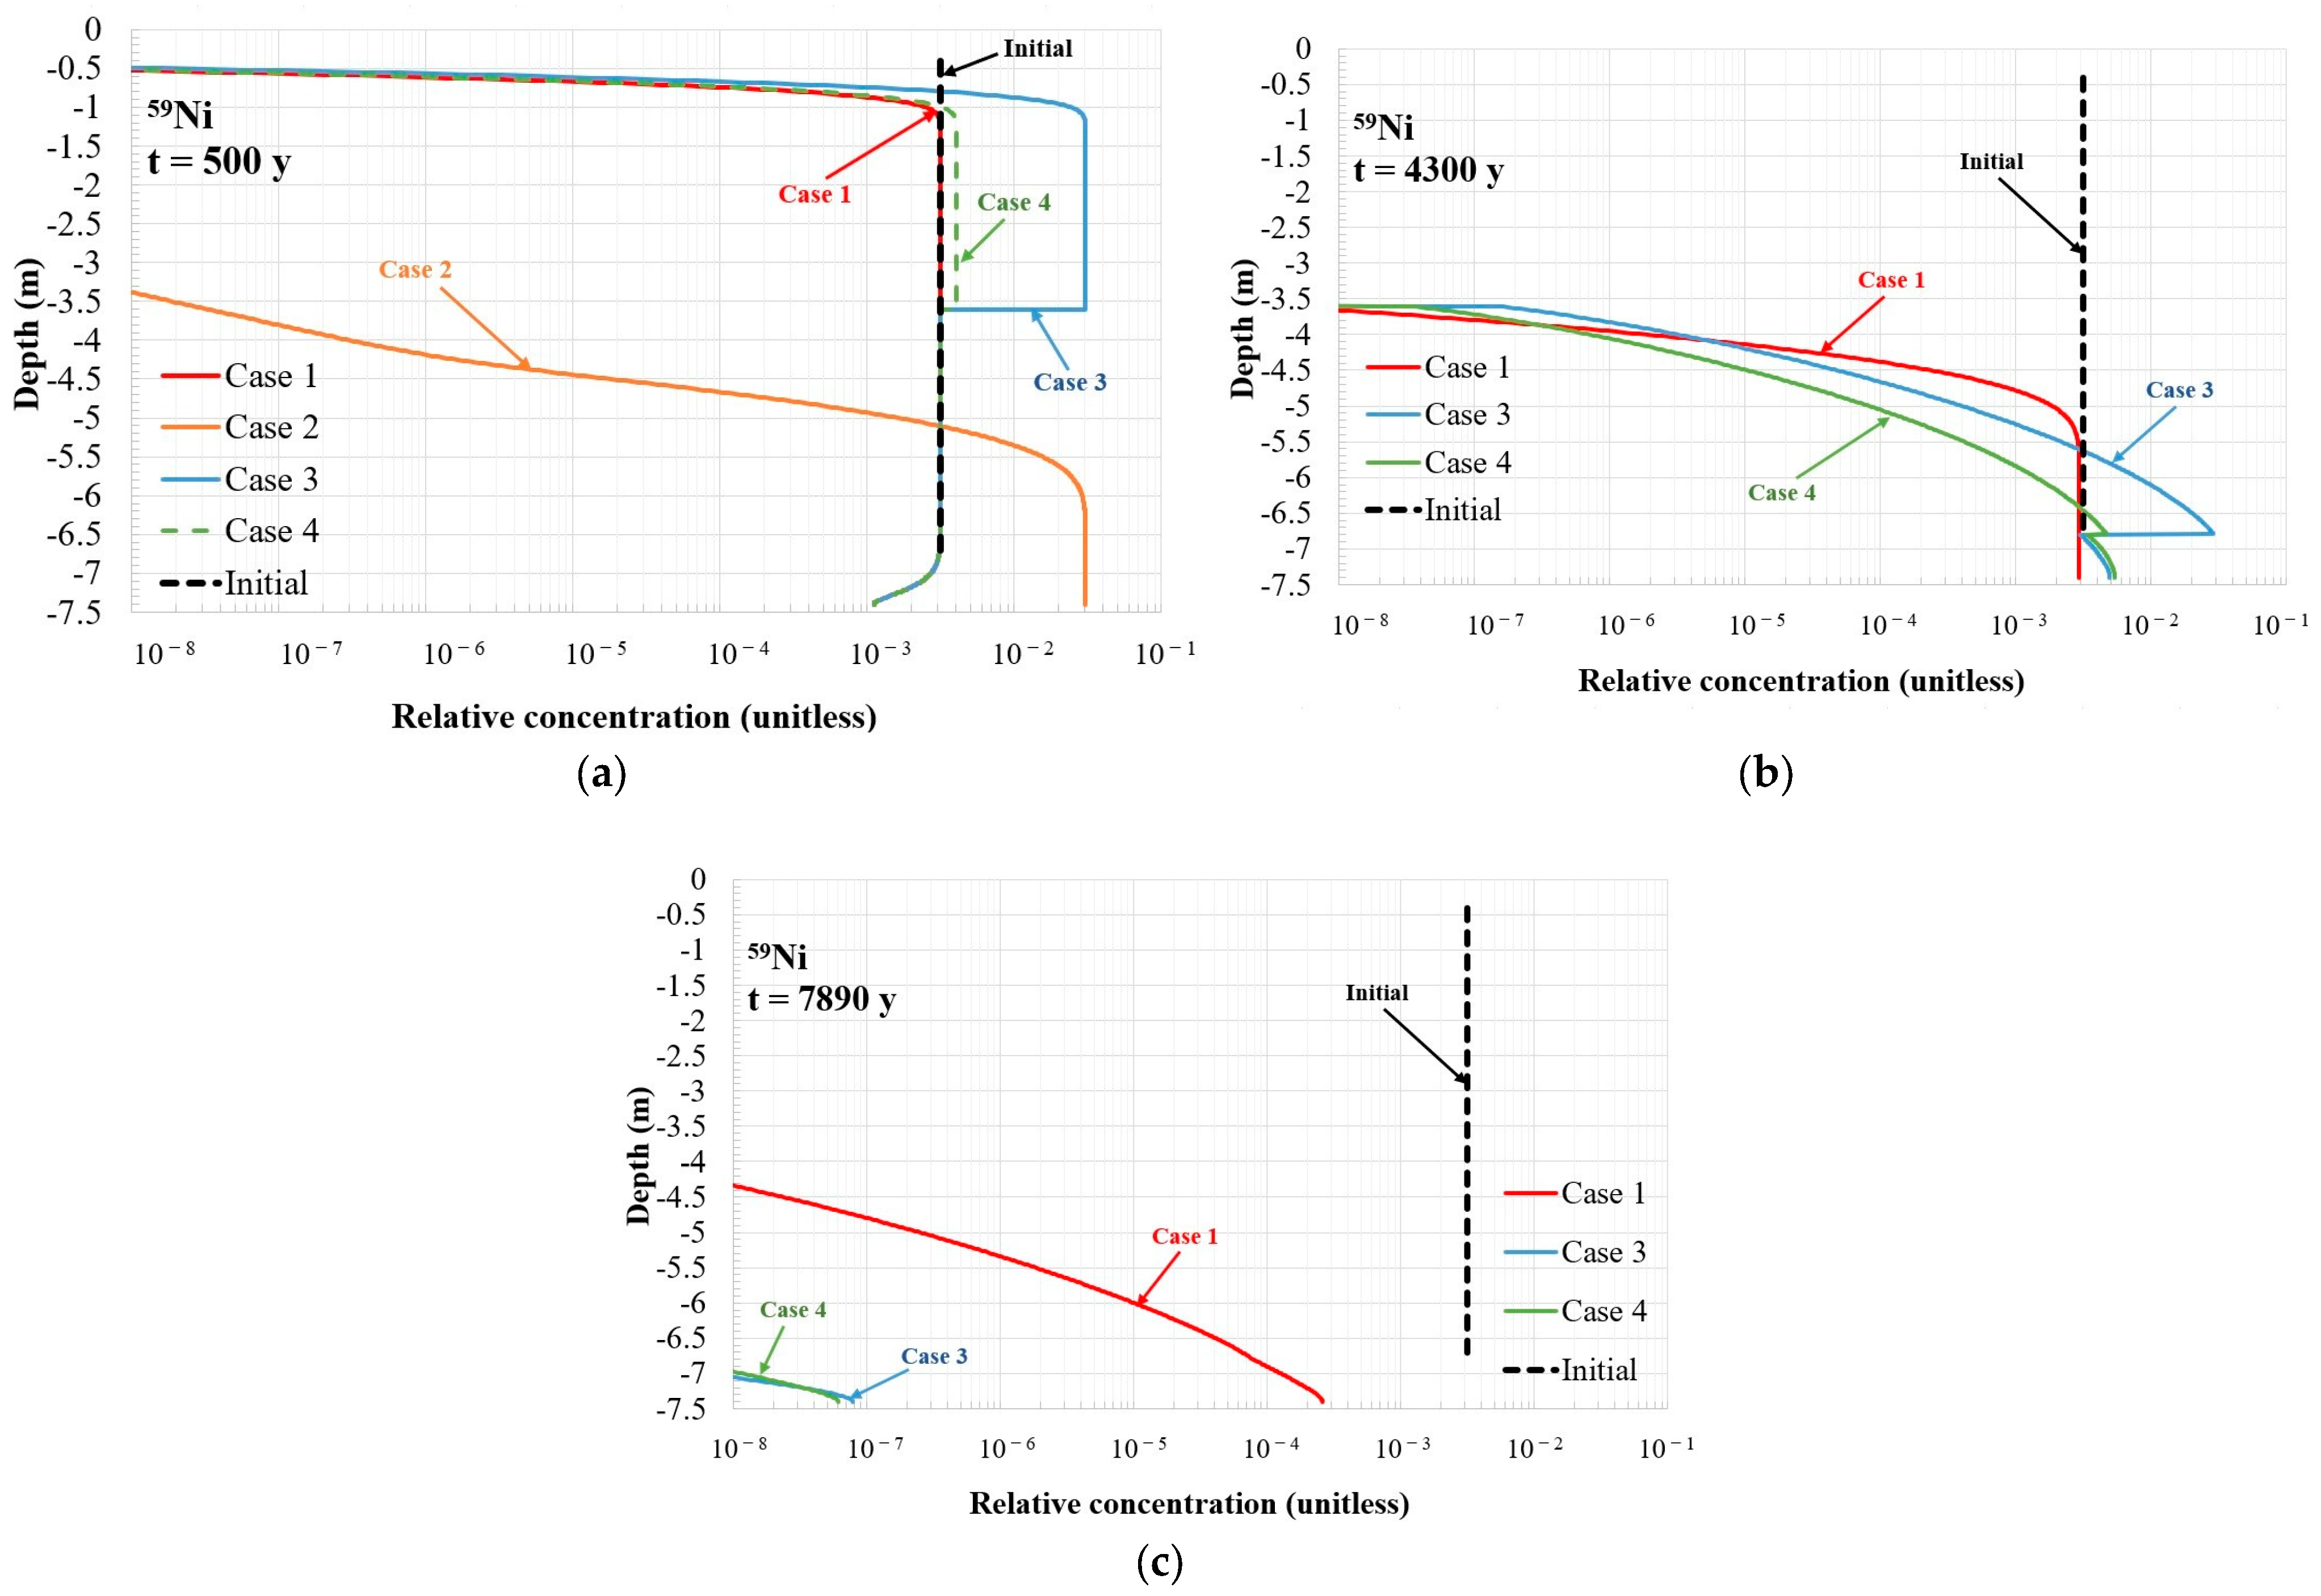
59Ni. The comparison of the relative concentration profiles among cases 1–4 for radionuclide 59Ni is presented in Figure 12. The differences between the modelling cases after the decrease in the Kd value in the upper part of the waste zone for 59Ni can be observed in Figure 12a. By this time, the relative 59Ni concentration in this subregion in case 1 remains close to the initial value, but, in cases 3 and 4, an increase is observed. The relative concentration in case 3 becomes higher than the initial value by about one order of magnitude (the increase corresponds to the total degradation of the upper part of the waste zone), whereas, in case 4, the increase is only about 30% (the increase corresponds to the first step in the Kd decrease sequence and is related to the pH decrease from 12.5 to 12.0). The relative concentrations in the bottom part of the waste zone in cases 1, 3 and 4 are close to the initial value. Regarding case 2, the 59Ni inventory has decreased over 500 years to an insignificant amount up to a depth of 3.5 m. The next 59Ni profile at 4300 years (Figure 12b) presents results only for cases 1, 3 and 4. The 59Ni relative concentration in the system in case 2 is less than 10−8 and is not provided. The 59Ni profile at 4300 years indicates that, following the decrease in the Kd value in the bottom part of the waste zone, the relative concentration exceeds the initial concentration only at depths greater than approximately 5.5 m, including the bottom slab. At the time of degradation of the bottom slab (7890 years, Figure 12c), the relative concentration in the system in cases 3 and 4 is insignificant, and it remains higher only in case 1 in the bottom slab.
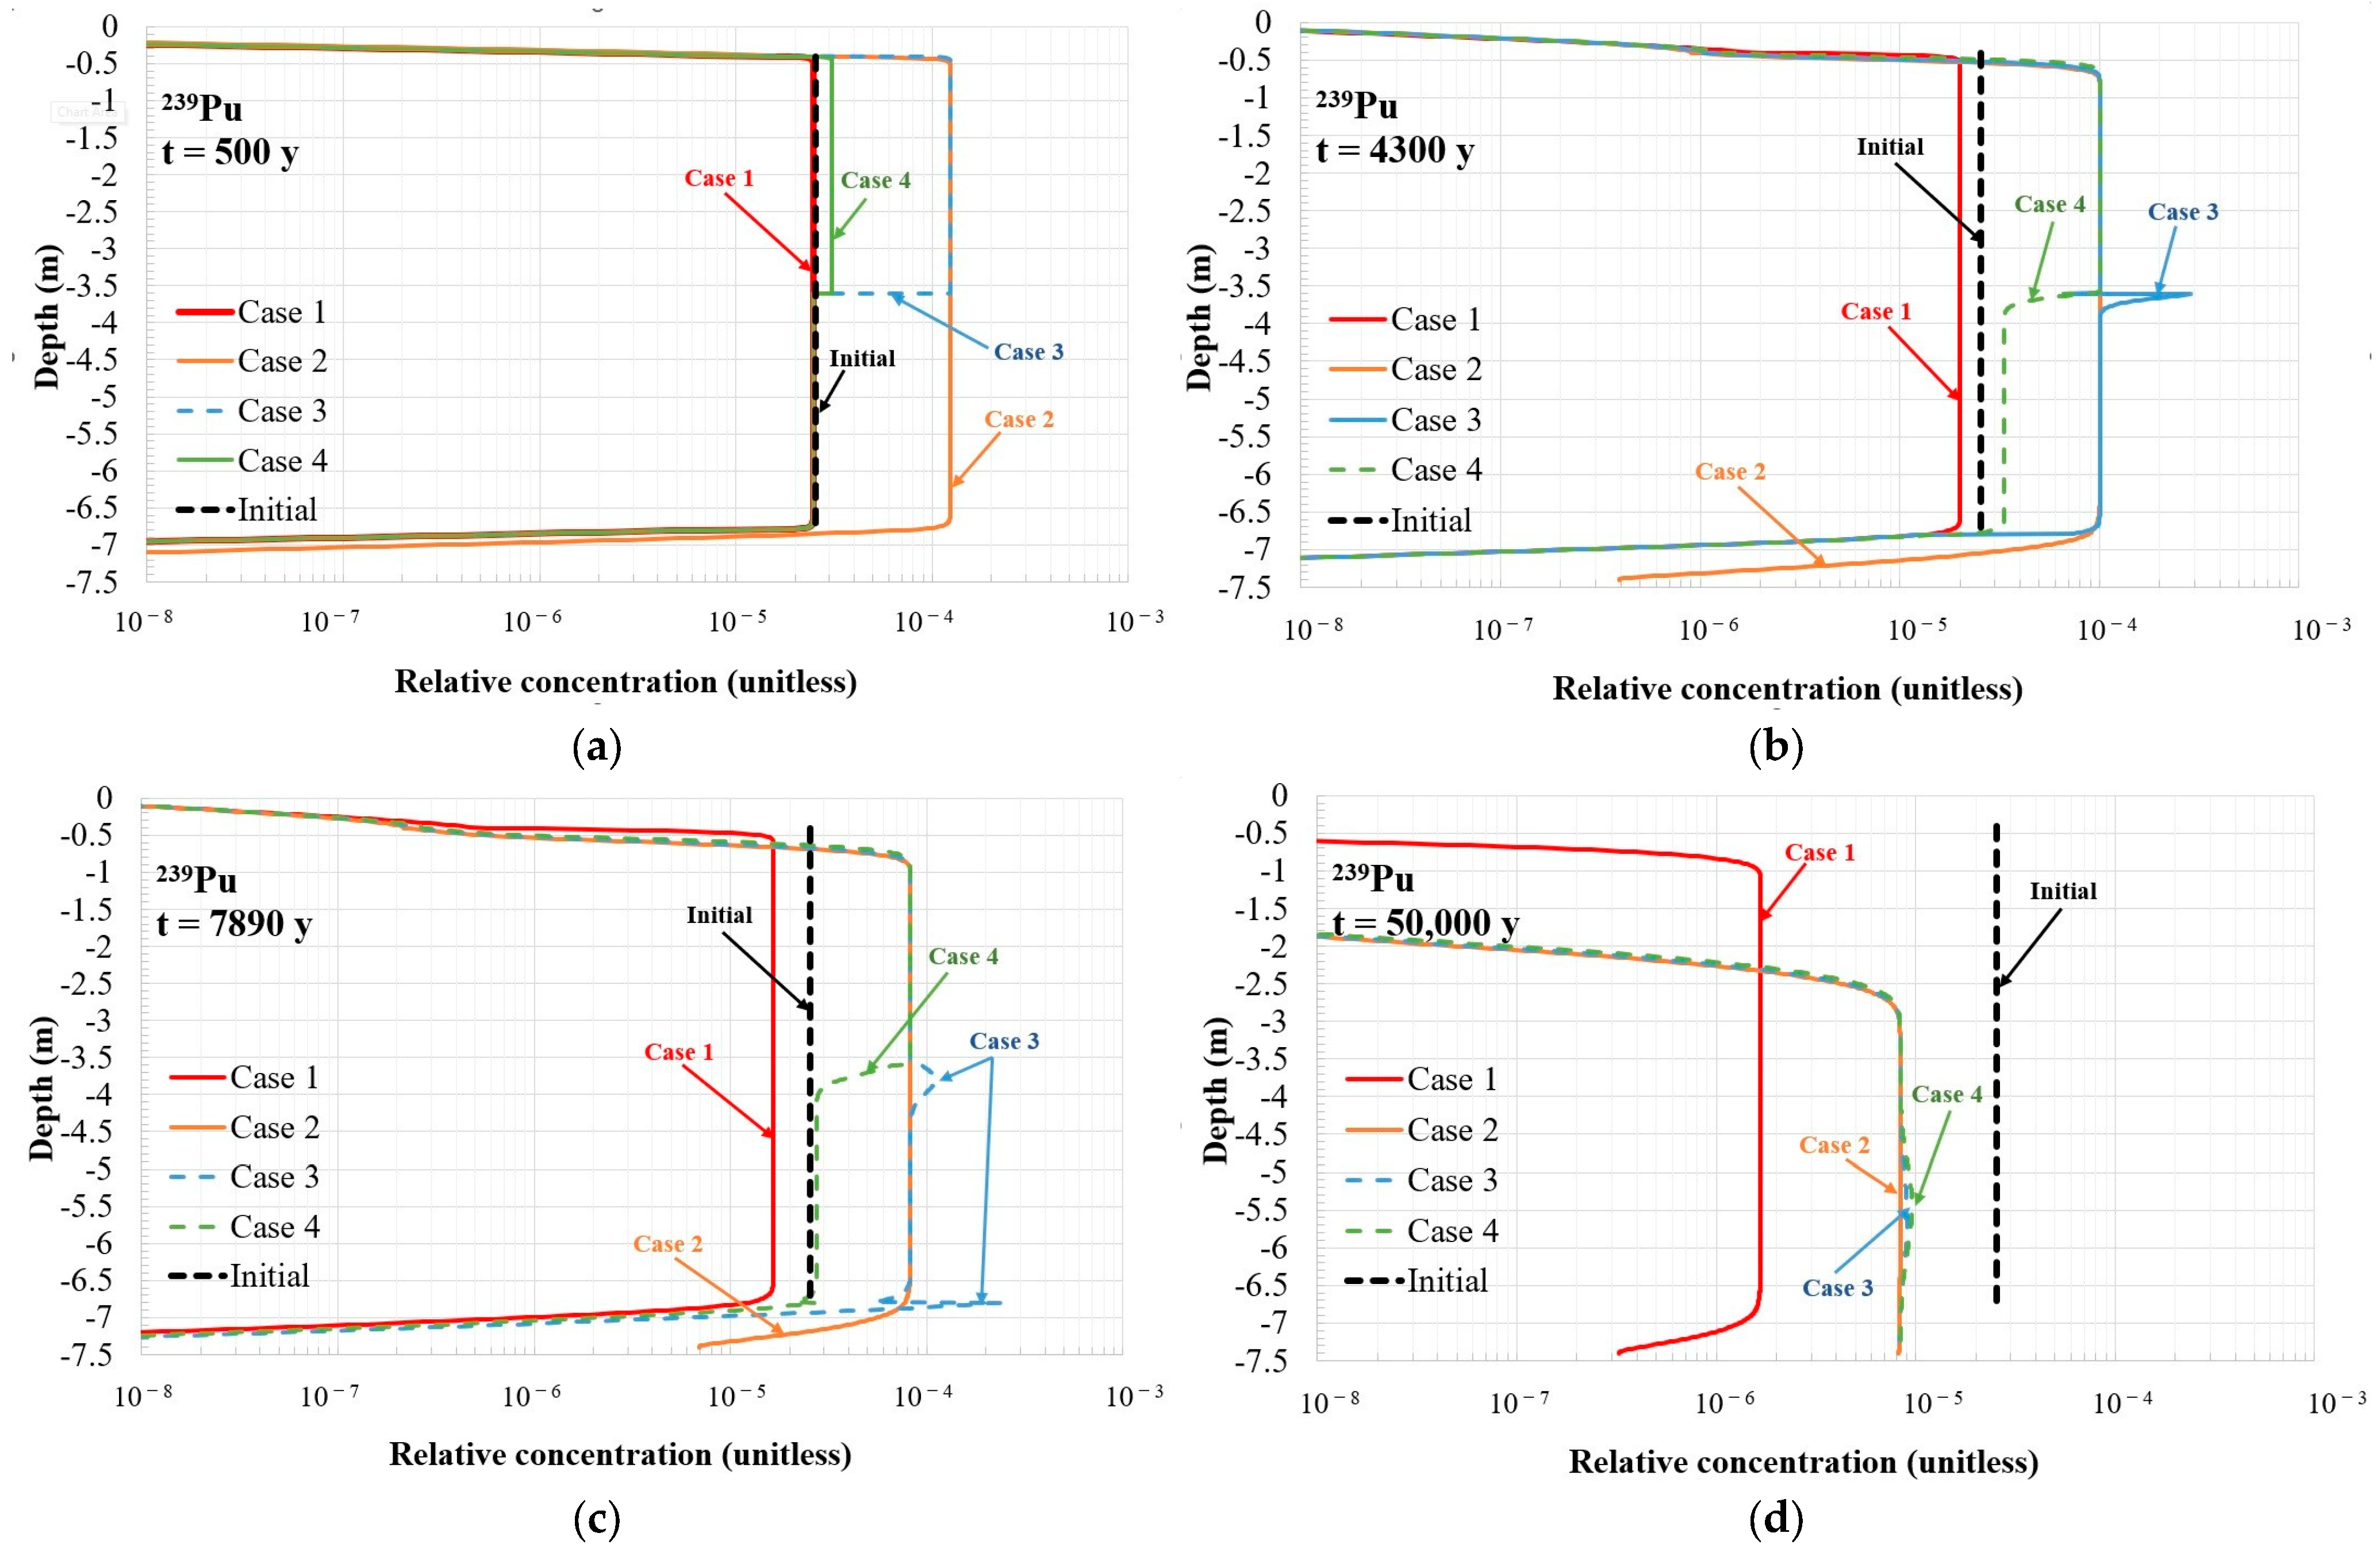
239Pu. The change in the 239Pu relative concentration profiles (see Figure 13) is, by nature, similar to that of 59Ni. However, some points must be highlighted. First, 239Pu’s migration is very slow, and a significant increase in the concentration at the bottom of the repository is observed at 4300 years (case 2) or later (cases 1, 3, 4). Second, a noticeable concentration of 239Pu can be observed in the top vault slab; therefore, diffusion is an important transport mechanism for 239Pu. Third, the increase in the relative concentration in the bottom part of the waste zone is mostly seen near the upper part of the waste zone (between depths of 3.5 and 4.0 m, see Figure 13b). This zone experiences a “double” effect: a larger amount of 239Pu transported from the upper part of the waste zone and a local increase in concentration due to the change in the Kd value.

3.3. Radionuclide Flux into the Environment

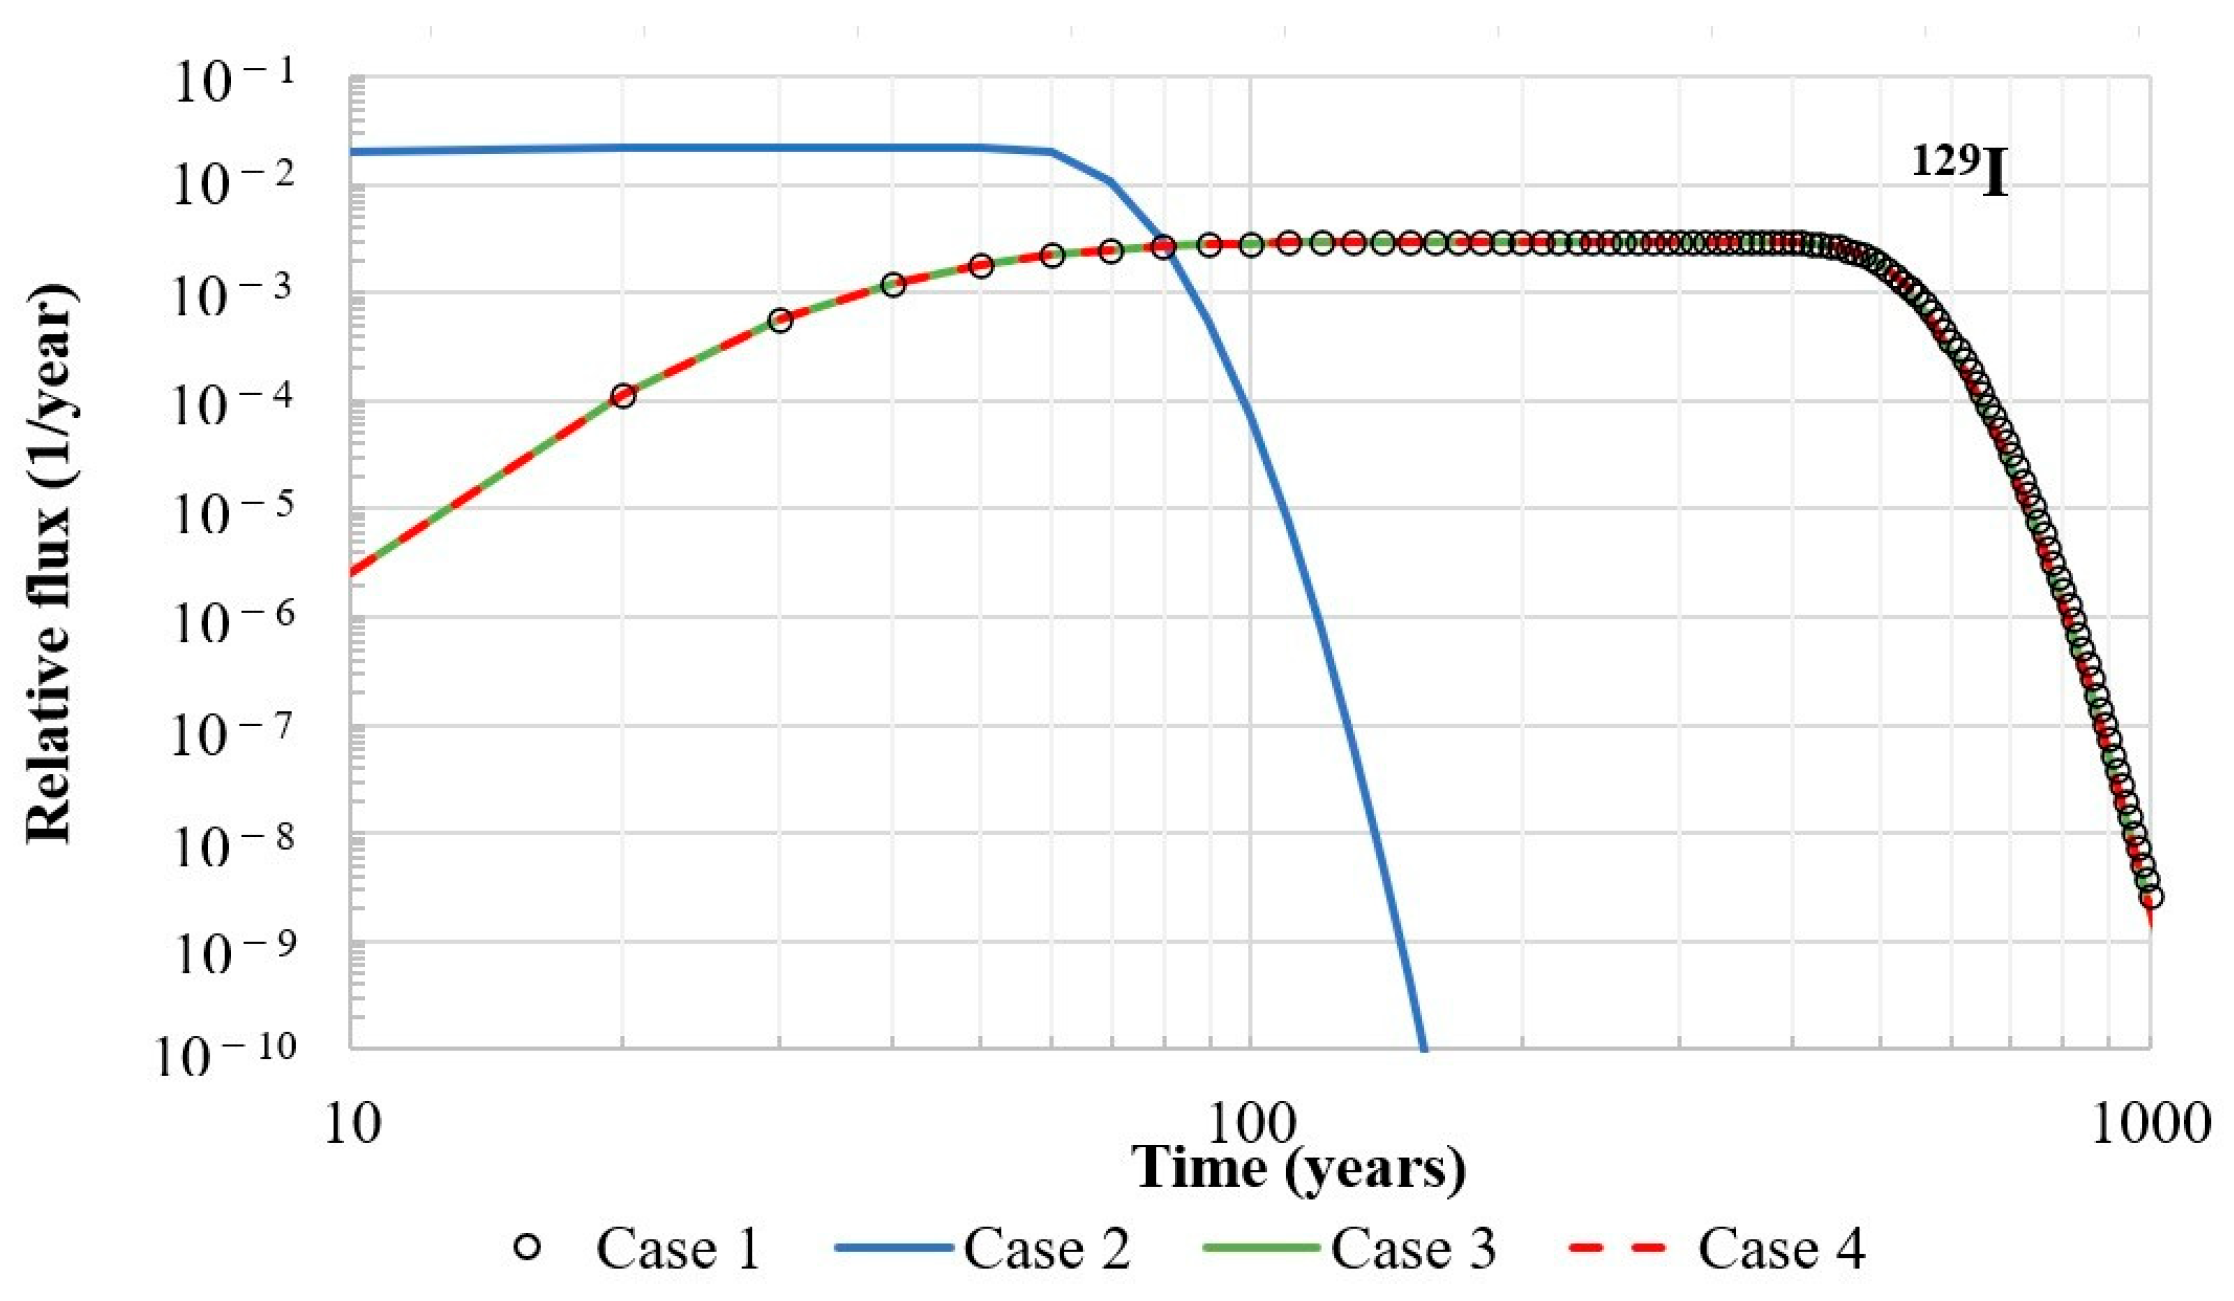
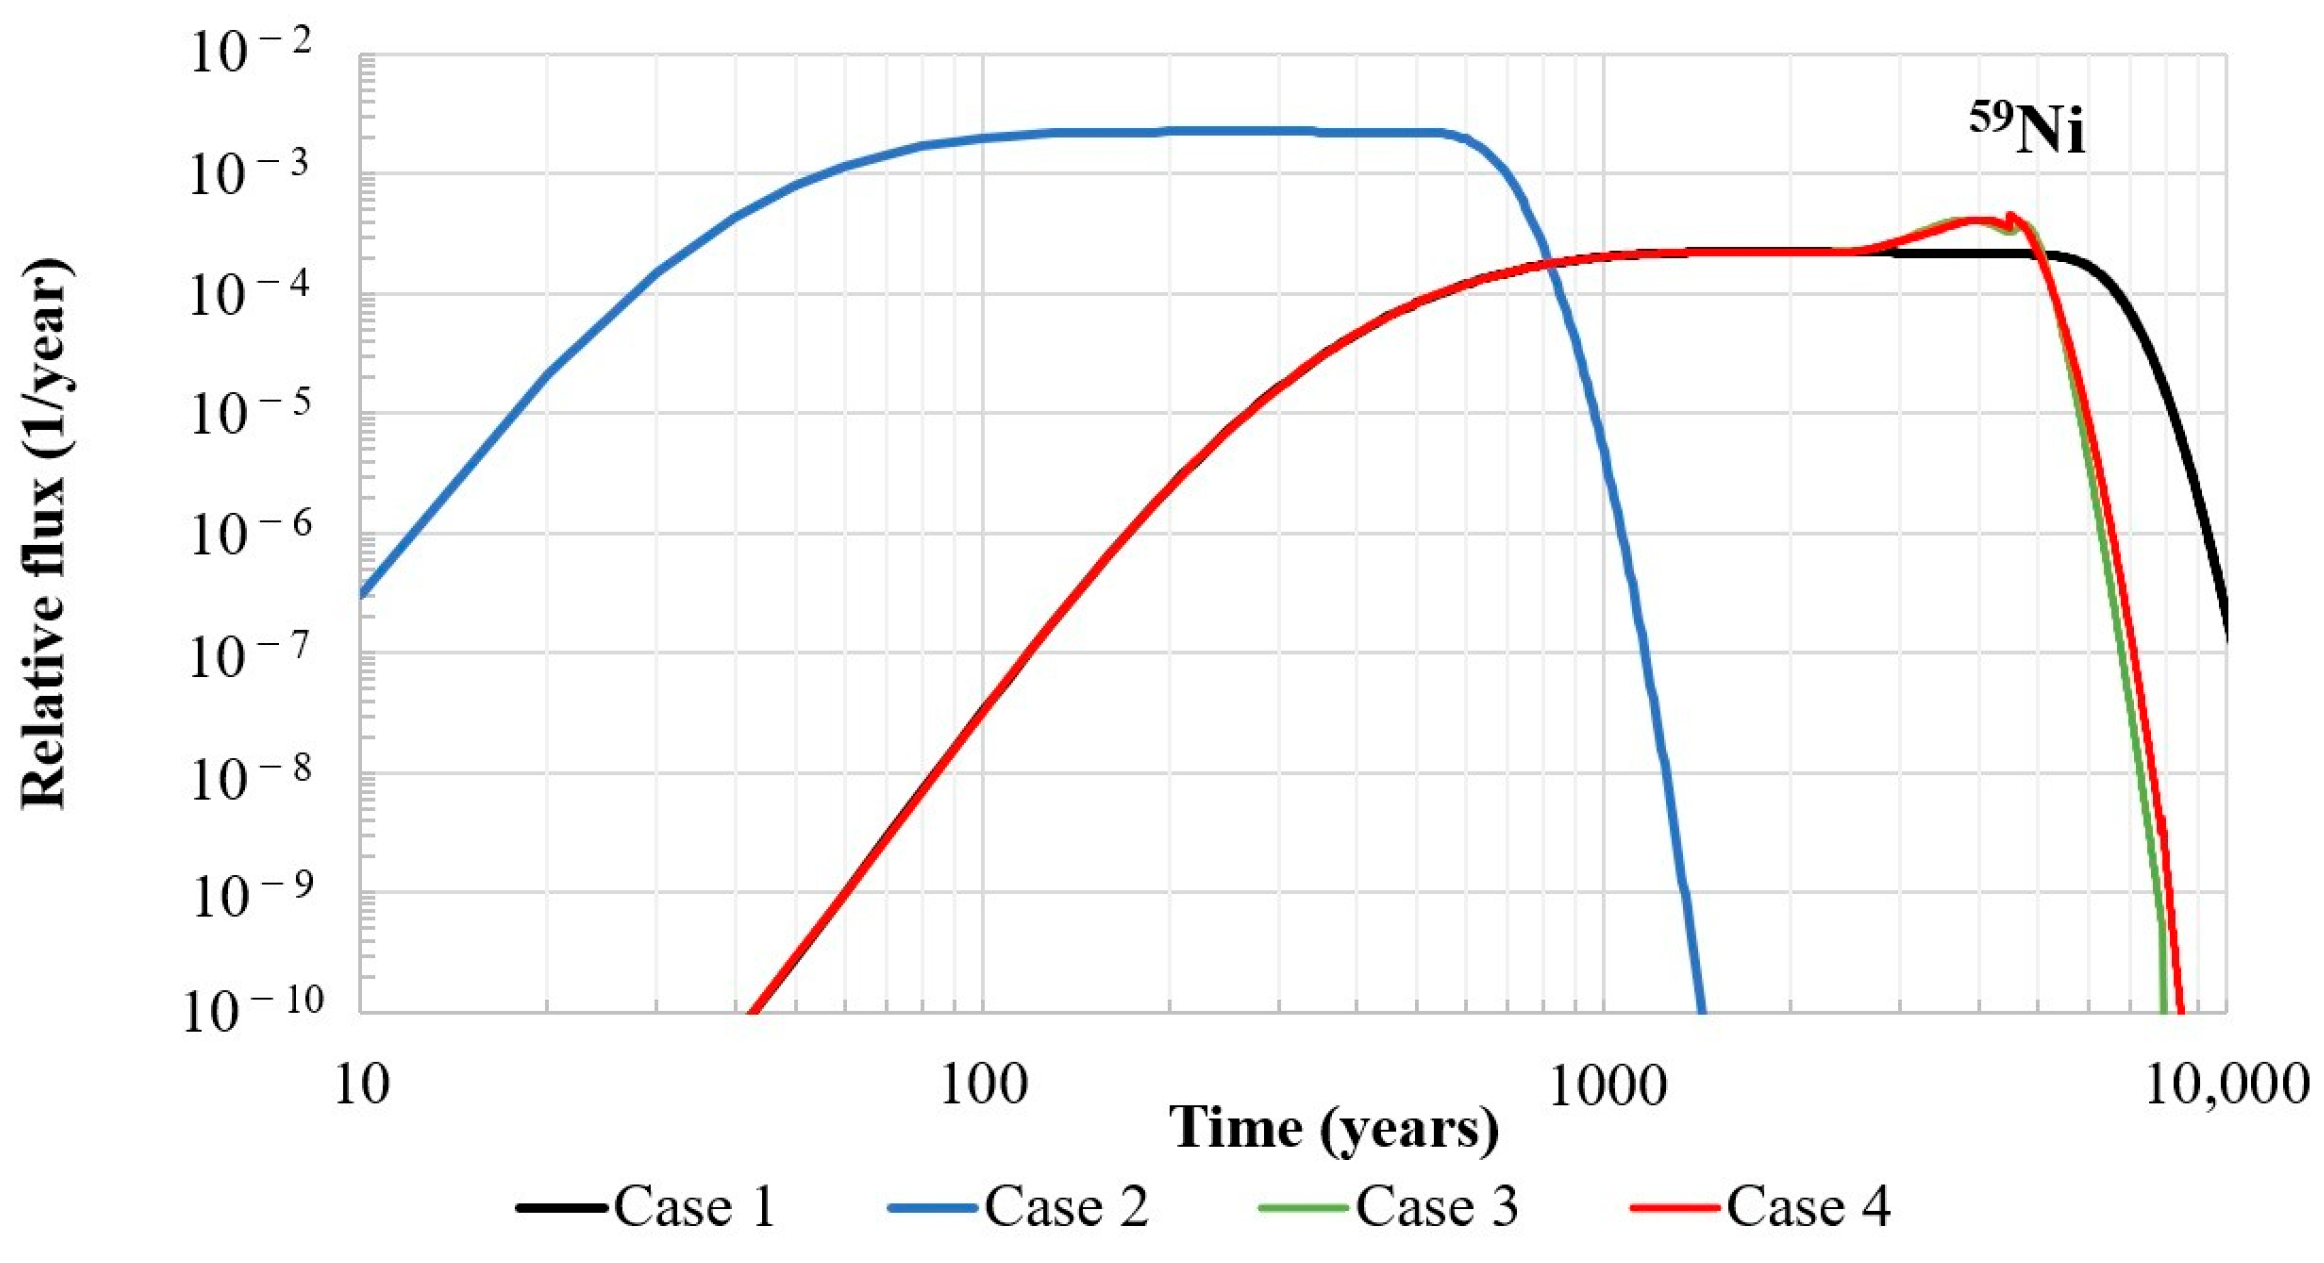
Radionuclide flux from the repository is the basis for the assessment of its impact on humans (and non-human biota). This section provides a comparison of the radionuclide relative fluxes from the NSR between the considered cases 1–4. Figure 14, Figure 15 and Figure 16 present changes in flux over time for radionuclides 129I, 59Ni and 239Pu, respectively. The peak flux and the time of its appearance for each case and radionuclide are summarised in Table 9.
129I. Cases 1 (constant Kd values as in non-degraded concrete) and 2 (constant Kd values as in degraded concrete) define the bounding intervals of the potential radionuclide relative flux from the repository: case 1 corresponds to the lower limit of relative flux, and case 2 indicates the upper bound. In the case of radionuclide 129I, it can be seen from Figure 14 that the maximum relative flux in case 2 is about 2 × 10⁻² 1/y, and it is higher than the maximum relative flux in case 1 by a factor of 7. In addition, the flux line in case 1 (Kd value as in non-degraded concrete) is shifted to later times by a few hundred years. It can be noticed that the relative flux in cases 3 and 4 coincides with that in case 1. The maximum relative flux in this case is reached at approximately 150 years after repository closure and is slightly less than 3 × 10⁻³ 1/year (see Table 9). The flux decreases significantly (by six orders of magnitude) at around 1000 years. Table 6 and Table 7 show that the first changes in the Kd values occur in the upper part of the waste zone at around 500 years. However, there is no significant increase in relative flux by this time. This confirms the results obtained from the relative concentration profiles: the increase in the Kd value in the upper part of the waste zone has an insignificant impact on the relative flux, as the increase in the Kd value occurs at a time at which 129I has almost been leached out. Similarly, the increase in the Kd value at the bottom part of the waste zone occurs when the relative flux has already decreased significantly. This means that the degradation of the concrete barriers has an insignificant impact on 129I release from the repository. This is also in line with the relative concentration profiles, as discussed in Section 3.2. These findings indicate that, for long-lived mobile radionuclides, the chemical degradation of concrete barriers is of minor importance because the larger part of the inventory is transported out of the repository before the effect of concrete degradation manifests.
59Ni59Ni is a moderately sorbed radionuclide. The difference in the maximum relative flux from the repository between the bounding cases, case 1 and case 2, for 59Ni is about one order of magnitude (see Figure 15). Similarly to radionuclide 129I, the relative flux of 59Ni in cases 1, 3 and 4 is the same for about 4000 years. After this point, a difference in the release of 59Ni into the environment is observed between case 1 and cases 3 and 4. The changes in the Kd values in the upper part of the waste zone correspond to the first peak in relative flux; see Figure 15, case 3 and case 4. Due to the moderate sorption of 59Ni and the distance from the upper part of the waste zone to the release point (bottom of the repository), the effect of this change is shifted in time, and the maximum relative flux is reached by around 4000 years after repository closure. The second peak in relative flux in cases 3 and 4 is observed approximately 600 years later. This peak is attributed to the degradation of the bottom part of the waste zone. The changes in relative flux in cases 3 and 4 follow the changes in the relative concentration over time at the top of the vault bottom slab (see Figure 10b). The difference is that the increases in the flux are not so sharp and are more extended in time. The last peak in 59Ni release from the repository can be expected when the bottom slab degrades. It can be seen from Figure 15 that the relative flux of 59Ni decreases significantly a few thousand years after the second peak in cases 3 and 4. Therefore, similarly to radionuclide 129I, the Kd change in the bottom slab has only a minor effect on 59Ni flux.
The observed differences in 59Ni relative flux from the repository indicate that, for long-lived, moderately sorbed radionuclides, the degradation of cementitious barriers and, consequently, changes in their ability to retard radionuclides could be important factors when performing safety assessments of the NSR. The maximum relative flux from the repository with constant Kd values, as in non-degraded concrete (case 1), can lead to the underestimation of the radionuclide flux into the environment. The inclusion of concrete degradation effects in the analysed system led to a relative flux that was twice as high as in case 1. On the other hand, the assessment of the repository’s safety when assuming constant Kd values, as in degraded concrete (case 2), gives very conservative estimations (for the system under consideration, the difference in relative flux in case 2 and case 3 was a factor of 5), which could lead to the inefficient use of resources and higher costs while planning radioactive waste disposal.
239Pu. Differences between the approaches implemented in the model to represent the degradation of cementitious materials in the repository and, consequently, changes in their ability to sorb radionuclides can be clearly observed when analysing the relative flux into the environment for the well-sorbed radionuclide 239Pu—see Figure 16. At first, it can be noticed that the peaks in relative flux from the repository in the bounding cases, case 1 and case 2, are reached significantly later compared to other analysed radionuclides (see Table 9). When constant Kd values, as in non-degraded concrete, are assumed over the modelled period (case 1), the maximum relative flux of 239Pu is reached after more than 50,000 years. Assuming constant Kd values, corresponding to degraded concrete (case 2), the maximum flux may occur in less than 20,000 years. The difference in the relative flux peak values between case 1 and case 2 is about two orders or magnitude. It should also be noted that the peak in relative flux from the repository in cases 3 and 4 is closer to that in case 2 in terms of its magnitude and time of appearance, and this is different from the case of radionuclide 59Ni, where the peaks in cases 3 and 4 were closer to that in case 1.
An analysis of the relative flux of 239Pu in case 3 (the case with a single degradation step for each subregion, as presented in Figure 3) indicates a sharp increase at about 8000 years after repository closure, which coincides with the decrease in 239Pu sorption in the concrete slab (see Figure 16). As the bottom slab is the last barrier before entering the surrounding environment, there is almost no delay in the change in the Kd value and the increase in the relative flux of 239Pu. The peak in relative flux in case 3 is about 2 × 10⁻⁶ 1/y (about 15% lower compared to case 2) and appears at about 22,000 years after repository closure.
Several stepwise increases in 239Pu’s relative flux are observed in case 4, as shown in Figure 16, indicating the more gradual chemical degradation of concrete compared to case 3. The peak in relative flux is reached by around 27,000 years and is about 1.9 × 10⁻⁶ 1/y, which is about 20% lower than in case 2. The clearly visible increase in relative flux at around 8000 years and the two increases between 10,000 and 20,000 years correspond to the gradual degradation of the concrete slab. There are also very small peaks, which are almost undetectable, shortly after 8000 years and at around 9000 years, which are related to the final degradation of the bottom part of the waste zone. The increase in the 239Pu concentration in the bottom part of the waste zone has only a minor effect, as the released 239Pu must migrate through the bottom slab, which still retains its initial sorption capacity for radionuclides. This significantly delays the translation of the concentration increase into an increase in relative flux. It should be noted that radioactive decay could also play a significant role over such long time frames.
The findings from the modelling of 239Pu migration indicate that changes in the Kd values within the waste zone are of lesser importance for the migration of long-lived, well-sorbed radionuclides, at least while the bottom barriers retain their initial sorptive properties. The radioactive waste zone is a very complex part of the repository, with different types of waste, containers, waste immobilisation and vault backfill materials. Therefore, it is a challenging task to define the appropriate sorption value representing radionuclide sorption in this zone. The obtained results suggest that, for the safety assessment of the repository, the selection of a conservative Kd value in the waste zone for long-lived, well-sorbed radionuclides could be a reasonable option, and further efforts are needed regarding the specification of the bottom barrier’s properties.
The comparison of radionuclides based on their relative flux sensitivity to concrete degradation indicates that 129I flux is insensitive to concrete degradation (see Figure 14 and Table 9). The leaching of concrete minerals is a slow process, and the weakly sorbed 129I is transported out of the repository before the effect of concrete degradation becomes significant. Therefore, the relative flux of 129I remains the same as that when assuming non-degrading concrete.
The fluxes of radionuclides 59Ni and 239Pu are both affected by concrete degradation, although to different extents. For the moderately sorbed radionuclide 59Ni, the effect of concrete degradation occurs when radionuclide release has reached a plateau and a large amount of the inventory has already been leached. Consequently, the increase in flux after the update of the Kd values is limited—it is approximately twice as high as in the case of non-degraded concrete (see Table 9).
239Pu is released from the repository very slowly due to its strong sorption in concrete. The degradation of the concrete barriers occurs before the peak in 239Pu flux is reached, meaning that a large amount of 239Pu is still present in the repository. Consequently, after concrete degradation and the associated decrease in sorption, the 239Pu flux rapidly increases to a peak value, which is similar to that for constant sorption in the case of degraded concrete and about two orders of magnitude higher than that for constant sorption in the case of non-degraded concrete.
The radionuclides analysed in this study represent weakly, moderately and strongly sorbed radionuclides on cementitious materials. The results obtained may indicate trends in the migration of other radionuclides that exhibit similar changes in Kd values during concrete degradation. The behaviour of weakly sorbing radionuclides, such as 99Tc, is expected to be similar to that of 129I, whereas the migration of strongly sorbing radionuclides, such as U and Nb, is expected to resemble that of Pu. However, it should be noted that each disposal system is unique, and radionuclide sorption may evolve differently as concrete degrades. Therefore, the results should be interpreted with caution.
4. Conclusions

Radionuclide migration modelling in the near field of the planned near-surface repository in Lithuania was carried out to quantify the effects of engineered barrier degradation on radionuclide flux into the environment. A distinctive feature of this work is the modelling of concrete degradation at the repository scale using a reactive transport model. This approach enabled the identification of differences in concrete degradation at selected locations in the repository. As a result, spatial and temporal changes in radionuclide sorption are introduced in the model—unlike in approaches where the same concrete degradation stage is assumed throughout the entire barrier or repository. Although spatial variation was somewhat limited, the modelling offered valuable insights into the trends in system evolution.
The migration of three radionuclides with different sorption behaviour in cementitious materials was investigated: 129I (weak sorption), 59Ni (moderate sorption) and 239Pu (strong sorption). The example of radionuclide 129I demonstrates that, for long-lived mobile radionuclides, the chemical degradation of cementitious materials is of minor importance, because the larger part of the inventory is transported out of the repository before the effect of concrete degradation manifests.
The assessment of radionuclide 59Ni flux from the repository indicates a moderate impact of concrete barrier degradation on its flux. According to the modelling results, 59Ni release when considering concrete degradation was twice as high as in the case of non-degrading concrete but lower by approximately a factor of five compared to the case of constant sorption as in degraded concrete.
The modelling of 239Pu migration in the near field of the planned NSR revealed that the release of strongly sorbed radionuclides mainly depends on the integrity of the non-degraded barrier (the bottom slab in the considered case). In the absence of data, the selection of a constant conservative Kd value could lead to a flux that is approximately 20% higher than that obtained using a more detailed concrete degradation model.
The assessment presented in this study was performed for the planned near-surface repository in Lithuania; however, the findings could be of interest to other countries planning or operating radioactive waste repositories. In any case, the obtained results should be taken with careful consideration, as each disposal system is unique and has distinct features.

Author Contributions

Conceptualisation, D.G. and P.B.; investigation, P.B. and D.G.; writing—original draft preparation, P.B.; visualisation, P.B. and G.B.; writing—review and editing, D.G., G.B. and P.P. All authors have read and agreed to the published version of the manuscript.

Funding

This research has received funding from the State Budget under programme No 1201.

Institutional Review Board Statement

Not applicable.

Informed Consent Statement

Not applicable.

Data Availability Statement

The original contributions presented in the study are included in the article; further inquiries can be directed to the corresponding author.

Conflicts of Interest

The authors declare no conflicts of interest. The funders had no role in the design of the study; in the collection, analyses or interpretation of the data; in the writing of the manuscript; or in the decision to publish the results.

Abbreviations

The following abbreviations are used in this manuscript:
INPPIgnalina nuclear power plant
NSRNear-surface repository
RAWRadioactive waste

References

  1. International Atomic Energy Agency (IAEA). Disposal of Radioactive Waste; IAEA Safety Standards Series No. SSR-5; IAEA: Vienna, Austria, 2011. [Google Scholar]
  2. Govaerts, J.; Jacques, D.; Samper, J.; Neeft, E.; Montaya, V. Model Abstraction Methods for Upscaling and Integration of Process Knowledge in Reactive Transport Models for Geological Disposal of Radioactive Waste. Final Version as of 10.01.2022 of Deliverable D2.18 of the HORIZON 2020 Project EURAD. EC Grant Agreement No: 847593. Available online: https://igdtp.eu/wp-content/uploads/2022/06/EURAD-D2.18-Report-on-Model-Abstraction-Techniques.pdf (accessed on 7 November 2025).
  3. Jantzen, C.; Johnson, A.; Read, D.; Stegemann, J.A. Cements in waste management. Adv. Cem. Res. 2010, 22, 225–231. [Google Scholar] [CrossRef]
  4. Ma, B.; Provis, J.L.; Wang, D.; Kosakowski, G. The essential role of cement-based materials in a radioactive waste repository. npj Mater. Sustain. 2024, 2, 21. [Google Scholar] [CrossRef]
  5. Jacques, D.; Wang, L.; Martens, E.; Mallants, D. Modelling chemical degradation of concrete during leaching with rain and soil water types. Cem. Concr. Res. 2010, 40, 1306–1313. [Google Scholar] [CrossRef]
  6. International Atomic Energy Agency (IAEA). Safety Assessment Methodologies for Near Surface Disposal Facilities; Results of a Coordinated Research Project, Vol. 1 & 2; IAEA: Vienna, Austria, 2004. [Google Scholar]
  7. OECD/NEA. Thermodynamic Sorption Modelling in Support of Radioactive Waste Disposal Safety Cases: NEA Sorption Project Phase III; OECD Publishing: Paris, France, 2012. [Google Scholar] [CrossRef]
  8. Domenech, C.; Garcia, D.; Pękala, M. Decreasing Kd uncertainties through the application of thermodynamic sorption models. Sci. Total Environ. 2015, 527–528, 297–305. [Google Scholar] [CrossRef] [PubMed]
  9. Weetjens, E.; Martens, E.; Jacques, D. Quantifying Conservatism of Performance Assessment Calculations by Sorption Model Reduction: Case Study on Near Field Cs Migration in Callovo-Oxfordian Clay. MRS Online Proc. Libr. 2009, 1193, 381. [Google Scholar] [CrossRef]
  10. EPA (United States Environmental Protection Agency). Understanding Variation in Partition Coefficient, Kd Values; EPA 402-R-99–004A; EPA: Washington, DC, USA, 1999; Volume I.
  11. Payne, T.E.; Brendler, V.; Ochs, M.; Baeyens, B.; Brown, P.L.; Davis, J.A.; Ekberg, C.; Kulik, D.A.; Lutzenkirchen, J.; Missana, T.; et al. Guidelines for thermodynamic sorption modelling in the context of radioactive waste disposal. Environ. Model. Softw. 2013, 42, 143–156. [Google Scholar] [CrossRef]
  12. Stockmann, M.; Schikora, J.; Becker, D.A.; Flügge, J.; Noseck, U.; Brendler, V. Smart Kd-values, their uncertainties and sensitivities—Applying a new approach for realistic distribution coefficients in geochemical modeling of complex systems. Chemosphere 2017, 187, 277–285. [Google Scholar] [CrossRef] [PubMed]
  13. Trinchero, P.; Painter, S.; Ebrahimi, H.; Koskinen, L.; Molinero, J.; Selroosll, J.O. Modelling radionuclide transport in fractured media with a dynamic update of Kd values. Comput. Geosci. 2016, 86, 55–63. [Google Scholar] [CrossRef]
  14. Jacques, D.; Perko, J.; Seetharam, S.C.; Mallants, D. A cement degradation model for evaluating the evolution of retardation factors in radionuclide leaching models. Appl. Geochem. 2014, 49, 143–158. [Google Scholar] [CrossRef]
  15. Mutoni, A.; Kim, J. Impact of Concrete Degradation on the Long-Term Safety of a Near-Surface Radioactive Waste Disposal Facility in Korea. Appl. Sci. 2022, 12, 9009. [Google Scholar] [CrossRef]
  16. Mallants, D.; Ochs, M.; Wang, L.; Land, C.; Road, W.; Sa, G.O. A new radionuclide sorption database for cementitious materials accounting for geochemical evolution—18477. In Proceedings of the Waste Management 2018 Conference, Phoenix, AZ, USA, 18–22 March 2018. [Google Scholar]
  17. Ochs, M.; Mallants, D.; Wang, L. Radionuclide and Metal Sorption on Cement and Concrete; Topics in Safety, Risk, Reliability and Quality; Springer International Publishing: Cham, Switzerland, 2016; Volume 29. [Google Scholar]
  18. International Atomic Energy Agency (IAEA). The Safety Case and Safety Assessment for the Disposal of Radioactive Waste; Specific Safety Guide No. SSG-23; IAEA: Vienna, Austria, 2012. [Google Scholar]
  19. Ignalina Nuclear Power Plant (IAE). Near Surface Repository for Low and Intermediate Level Short-Lived Radioactive Waste—Project B25. Available online: https://iae.lt/en/b25-project.-near-surface-repository-for-low-and-intermediate-level-short-lived-radioactive-waste/470 (accessed on 29 July 2025).
  20. Radioactive Waste Management Agency (RATA). Supplemented Environmental Impact Assessment Report for Construction of Near Surface Repository for Radioactive Wastes, Version 3-2; RATA: Vilnius, Lithuania, 2007; (In Lithuanian with Summaries in English and Russian).
  21. International Atomic Energy Agency (IAEA). Disposal Approaches for Long Lived Low and Intermediate Level Radioactive Waste; IAEA Nuclear Energy Series No. NW-T-1.20; IAEA: Vienna, Austria, 2010. [Google Scholar]
  22. Lithuanian Hydrometeorological Service (LHMS). Climate. Available online: https://www.meteo.lt/en/climate/lithuanian-climate/precipitation/ (accessed on 29 July 2025).
  23. Koťátková, J.; Zatloukal, J.; Reiterman, P.; Karel Kolář, K. Concrete and cement composites used for radioactive waste deposition. J. Environ. Radioact. 2017, 178–179, 147–155. [Google Scholar] [CrossRef] [PubMed]
  24. Environmental Protection Agency (EPA). Studies of the Main Chemical Species Background Concentrations and Physical Parameters in Atmospheric Precipitation and Precipitation Under Tree Canopy Under the EMEP and ICP IM Programmes. 1998–2020. (In Lithuanian). Available online: https://aaa.lrv.lt/lt/veiklos-sritys/aplinkos-monitoringas/ekosistemu-monitoringas/pagrindiniu-cheminiu-priemaisu-foniniu-koncentraciju-bei-fiziniu-parametru-atmosferos-iskritose-ir-polajiniuose-krituliuose-tyrimai-pagal-emep-ir-icp-im-programas/ (accessed on 10 September 2024).
  25. ONDRAF/NIRAS. Evolution of Concrete Pore Water and Solid Phase Composition During Leaching with Different Types of Water; Project Near Surface Disposal of Category A Waste at Dessel. Scientific and Technical basis—Near-Field (STB-NF). NIROND-TR Report 2008–24 E Version 2; ONDRAF/NIRAS: Brussel, Belgium, 2011.
  26. Brook, G.A.; Folkoff, M.E.; Box, E.O. A world model of soil carbon dioxide. Earth Surf. Process. Landf. 1983, 8, 79–88. [Google Scholar] [CrossRef]
  27. Norton, J.M. Nitrification in Agricultural Soils. In ASA Monograph Nitrogen in Agricultural Soils; Raun, W., Schepers, J., Eds.; Agronomy Monograph 49; ASA CSSA SSSA, Inc.: Madison, WI, USA, 2008. [Google Scholar]
  28. Lothenbach, B.; Matschei, T.; Möschner, G.; Glasser, F.P. Thermodynamic modelling of the effect of temperature on the hydration and porosity of Portland cement. Cem. Concr. Res. 2008, 38, 1–18. [Google Scholar] [CrossRef]
  29. Parkhurst, D.L.; Appelo, C.A.J. Description of Input and Examples for PHREEQC Version 3—A Computer Program for Speciation, Batch-Reaction, One-Dimensional Transport, and Inverse Geochemical Calculations. In Techniques and Methods, Book 6; U.S. Geological Survey: Reston, VA, USA, 2013; Chapter A43; p. 497. [Google Scholar]
  30. Lothenbach, B.; Kulik, D.A.; Matschei, T.; Balonis, M.; Baquerizo, L.; Dilnesa, B.; Miron, G.D.; Myers, R.J. Cemdata18: A chemical thermodynamic database for hydrated Portland cements and alkali-activated materials. Cem. Concr. Res. 2019, 115, 472–506. [Google Scholar] [CrossRef]
  31. Samper, J.; Montenegro, L.; De Windt, L.; Montoya, V.; Garibay-Rodríguez, J.; Grigaliuniene, D.; Narkuniene, A.; Poskas, P.; Cochepin, B. Conceptual Model Formulation for a Mechanistic Based Model Implementing the Initial SOTA Knowledge (Models and Parameters) in Existing Numerical Tools. Final Version as of 15.07.2022 of Deliverable D2.16 of the HORIZON 2020 Project EURAD. EC Grant Agreement No: 847593. 2022. Available online: https://igdtp.eu/wp-content/uploads/2025/02/EURAD-D2.16-Conceptual-model-formulation-for-a-mechanistic-based-model.pdf (accessed on 7 November 2025).
  32. Wang, L.; Martens, E.; Jacques, D.; De Cannière, P.; Berry, J.; Mallants, D. Review of Sorption Values for the Cementitious Near Field of a Near Surface Radioactive Waste Disposal Facility, Project Near Surface Disposal of Category A Waste at Dessel, NIROND-TR 2008-23 E. April 2009, p. 457. Available online: https://docs.google.com/file/d/0BxkVI2_HeRwxYi1uWmVmWHA4dEE/edit?resourcekey=0-XfzPg3dl2bzATKtzWRXdFw (accessed on 7 November 2025).
  33. Swedish Nuclear Fuel and Waste Management Co (SKB). Data Report for the Safety Assessment SR-PSU; Technical Report TR-14-10; SKB: Stockholm, Sweden, 2014; p. 168. [Google Scholar]
  34. Swedish Nuclear Fuel and Waste Management Co (SKB). Project SAFE. In Compilation of Data for Radionuclide Transport Analysis; SKB Report R-01-14; SKB: Stockholm, Sweden, 2001. [Google Scholar]
  35. Jacques, D.; Simunek, J.; Mallants, D.; van Genuchten, M.T. The HPx software for multicomponent reactive transport during variably-saturated flow: Recent developments and applications. J. Hydrol. Hydromech. 2018, 66, 211–226. [Google Scholar] [CrossRef]
  36. Jacques, D.; Šimůnek, J. User Manual of the Multicomponent Variably-Saturated Flow and Transport Model HP1. Description, Verification, and Examples. Version 1.0. Open Report of the Belgian Nuclear Research Centre, SCK•CEN-BLG-998. 2005, p. 91. Available online: https://www.pc-progress.com/Documents/hp1.pdf (accessed on 7 November 2025).
  37. Parkhurst, D.L.; Kipp, K.L.; Charlton, S.R. PHAST Version 2: A Program for Simulating Ground-Water Flow, Solute Transport, and Multicomponent Geochemical Reactions; Techniques and Methods 6–A35; U.S. Geological Survey: Denver, CO, USA, 2010; p. 249.
  38. Balcius, P.; Grigaliuniene, D. Modelling radionuclide transport using different representations of sorption. In Book of Abstracts, Proceedings of the Twelfth International Conference on Radiation, Natural Sciences, Medicine, Engineering, Technology and Ecology (RAD 2024), Herceg Novi, Montenegro, 17–21 June 2024; Goran, S.R., Ed.; RAD Centre: Niš, Serbia, 2024. [Google Scholar] [CrossRef]
  39. Samper, J.; Mon, A.; Montenegro, L.; De Windt, L.; Govaerts, J.; Laloy, E.; Jacques, D.; Grigaliuniene, D.; Balcius, P.; Poskas, P.; et al. Report on Comparison of Model Abstraction Results. Final Version as of 18.03.2024 of Deliverable D2.19 of the HORIZON 2020 Project EURAD. EC Grant Agreement No: 847593. 2024. Available online: https://igdtp.eu/wp-content/uploads/2025/02/EURAD-D2.19.pdf (accessed on 7 November 2025).
Figure 1. The main elements of the repository.
Applsci 15 12253 g001
Figure 2. Differences in the approaches among cases 1–4 in the implementation of changes in the Kd values.
Applsci 15 12253 g002
Figure 3. Conceptual model of the analysed system and observation points (red dots) for pH changes: “1” marks the top of the waste zone, “2” marks the middle of the waste zone and “3” marks the top of the bottom slab.
Applsci 15 12253 g003
Figure 4. A flowchart illustrating the approach to modelling radionuclide migration with variable sorption in cases 3 and 4.
Applsci 15 12253 g004
Figure 5. pH evolution in the repository.
Applsci 15 12253 g005
Figure 6. Radionuclide 129I relative concentration profiles, case 3.
Applsci 15 12253 g006
Figure 7. Radionuclide 59Ni relative concentration profiles, case 3.
Applsci 15 12253 g007
Figure 8. Radionuclide 239Pu relative concentration profiles, case 3.
Applsci 15 12253 g008
Figure 9. Changes in relative concentration over time, radionuclide 129I: (a) in the middle of the waste zone; (b) at the top of the vault bottom slab.
Applsci 15 12253 g009
Figure 10. Changes in relative concentration over time, radionuclide 59Ni: (a) in the middle of the waste zone; (b) at the top of the vault bottom slab.
Applsci 15 12253 g010
Figure 11. Changes in relative concentration over time, radionuclide 239Pu: (a) in the middle of the waste zone; (b) at the top of the vault bottom slab.
Applsci 15 12253 g011
Figure 12. Comparison of 59Ni profiles among cases 1–4 at (a) 500 y, (b) 4300 y and (c) 7890 y. (Case 1—constant Kd values corresponding to non-degraded concrete, case 2—constant Kd values corresponding to degraded concrete, case 3—Kd values change at the beginning of each concrete degradation stage, case 4—gradual change in Kd values).
Applsci 15 12253 g012
Figure 13. Comparison of 239Pu profiles among cases 1–4 at (a) 500 y, (b) 4300 y, (c) 7890 y and (d) 50,000 y. (Case 1—constant Kd values corresponding to non-degraded concrete, case 2—constant Kd values corresponding to degraded concrete, case 3—Kd values change at the beginning of each concrete degradation stage, case 4—gradual change in Kd values).
Applsci 15 12253 g013
Figure 14. 129I relative flux from the repository.
Applsci 15 12253 g014
Figure 15. 59Ni relative flux from the repository.
Applsci 15 12253 g015
Figure 16. 239Pu relative flux from the repository.
Applsci 15 12253 g016
Table 1. The composition of the percolation water.
ElementConcentration (mol/L)
C3.60 × 10−4
Ca2.41 × 10−5
Cl3.31 × 10−5
K2.19 × 10−5
Mg1.27 × 10−5
N7.22 × 10−5
Na3.40 × 10−5
S2.74 × 10−5
pH5.64
Table 2. Mineralogical composition of 1 dm3 of cementitious materials (mol/dm3).
MineralVault SlabBackfill
CSHQ-JenD 15.58 × 10−14.79 × 10−1
CSHQ-JenH 13.59 × 10−13.08 × 10−1
CSHQ-TobD 14.20 × 10−13.60 × 10−1
CSHQ-TobH 11.77 × 10−21.53 × 10−2
KSiOH 11.10 × 10−18.66 × 10−2
NaSiOH 12.19 × 10−21.84 × 10−2
C3FS0.84H4.325.48 × 10−24.70 × 10⁻²
Calcite9.00 × 10−27.71 × 10⁻²
Portlandite1.43 × 1001.22 × 100
Ettringite4.37 × 10−23.74 × 10⁻²
Hydrotalcite3.04 × 10−22.61 × 10⁻²
Monocarbonate7.70 × 10−26.60 × 10⁻²
1 The end member in an ideal solid solution model CSHQ for C-S-H [30].
Table 3. Pore water chemical composition (mol/L).
ElementVault SlabBackfill
Al8.44 × 10−57.71 × 10⁻⁵
C1.62 × 10−41.36 × 10⁻⁴
Ca8.66 × 10−49.52 × 10⁻⁴
Cl6.71 × 10−85.29 × 10⁻⁸
Fe1.23 × 10−71.13 × 10⁻⁷
K3.56 × 10−13.25 × 10⁻¹
Mg1.33 × 10−91.43 × 10⁻⁹
Na8.31 × 10−38.66 × 10⁻³
S4.48 × 10−33.61 × 10⁻³
Si7.43 × 10−56.72 × 10⁻⁵
pH13.4513.42
Table 4. Selected Kd values (L/kg) (based on [6,20]).
Radionuclide/CasepH
≥12.512.5 > pH ≥ 1212 > pH ≥ 11.511.5 > pH ≥ 1111 > pH ≥ 10.5pH < 10.5
129I
Case 1333333
Case 20.30.30.30.30.30.3
Case 330.30.30.30.30.3
Case 432.3251.650.9750.30.3
59Ni
Case 1404040404040
Case 2444444
Case 34044444
Case 44031221344
239Pu
Case 1500050005000500050005000
Case 2100010001000100010001000
Case 3500010001000100010001000
Case 4500040003000200010001000
Corresponding concrete degradation stage
IIIaIIIbIIIcIIId
Stage I, IIStage IIIStage IV
Table 5. Thermodynamic parameters for cement minerals [30].
PhaseEquationLog(K)
CSHQ-JenD 1(CaO)1.5(SiO2)0.6667(H2O)2.5 + 3H+ = 1.5Ca2+ + 4H2O + 0.6667SiO228.730362
CSHQ-JenH 1(CaO)1.3333(SiO2)1(H2O)2.1667 + 2.6666H+ = 1.3333Ca2+ + 3.5H2O + SiO222.179305
CSHQ-TobD 1((CaO)1.25(SiO2)1(H2O)2.75)0.6667 + 1.66675H+ = 0.833375Ca2+ + 2.6668H2O + 0.6667SiO213.655314
CSHQ-TobH 1(CaO)0.6667(SiO2)1(H2O)1.5 + 1.3334H+ = 0.6667Ca2+ + 2.1667H2O + SiO28.286642
KSiOH 1((KOH)2.5SiO2H2O)0.2 + 0.5H+ = 0.7H2O + 0.2SiO2 + 0.5K+5.763688
NaSiOH 1((NaOH)2.5SiO2H2O)0.2 + 0.5H+ = 0.5Na+ + 0.7H2O + 0.2SiO25.64873
C3FS0.84H4.32(FeFeO3)(Ca3O3(SiO2)0.84(H2O)4.32) + 4H+ = 2FeO2 + 3Ca2+ + 6.32H2O + 0.84SiO219.980634
CalciteCaCO3 = CO32− + Ca2+−8.479966
PortlanditeCa(OH)2 + 2H+ = Ca2+ + 2H2O22.799937
Ettringite((H2O)2)Ca6Al2(SO4)3(OH)12(H2O)24 + 4H+ = 6Ca2+ + 3SO42− + 2AlO2 + 34H2O11.100288
HydrotalciteMg4Al2O7(H2O)10 + 6H+ = 4Mg2+ + 2AlO2 + 13H2O27.981048
MonocarbonateCa4Al2CO9(H2O)11 + 4H+ = CO32− + 4Ca2+ + 2AlO2 + 13H2O24.530285
1 The end member in an ideal solid solution model CSHQ for C-S-H [30].
Table 6. Time (y) of changes in the Kd value in case 3.
Run No.TimeLocation 1Kd Change 2
10Whole systemInitial Kd values (stage II)
2500Waste zone—topFrom stage II to stage III
34300Waste zone—bottomFrom stage II to stage III
47890Bottom slabFrom stage II to stage III
1 See Figure 3. 2 The values are presented in Table 4.
Table 7. Time (y) of changes in the Kd value in case 4.
Run No.TimeLocation 1Kd Change 2
10Whole systemInitial Kd values (stage II)
2500Waste zone—topFrom stage II to stage IIIa
3540Waste zone—topFrom stage IIIa to stage IIIb
41250Waste zone—topFrom stage IIIb to stage IIIc
52080Waste zone—topFrom stage IIIc to stage IIId
62290Waste zone—bottomFrom stage II to stage IIIa
74300Waste zone—bottomFrom stage IIIa to stage IIIb
84490Bottom slabFrom stage II to stage IIIa
97890Bottom slabFrom stage IIIa to stage IIIb
108090Waste zone—bottomFrom stage IIIb to stage IIIc
119090Waste zone—bottomFrom stage IIIc to stage IIId
1213,900Bottom slabFrom stage IIIb to stage IIIc
1316,500Bottom slabFrom stage IIIc to stage IIId
1 See Figure 3. 2 The values are presented in Table 4.
Table 8. Summary of the radionuclide peak concentrations and the time of their appearance for cases 1–4 in the middle of the waste zone and at the top of the vault bottom slab.
Case 1Middle of Waste ZoneTop of Vault Bottom Slab
Peak in Relative Concentration (1/y)Time of Peak (y)Peak in Relative Concentration (1/y)Time of Peak (y)
129I
Case 14.05 × 10−204.05 × 10−290
Case 22.97 × 10−102.97 × 10−110
Case 34.05 × 10−204.05 × 10−290
Case 44.05 × 10−204.05 × 10−290
59Ni
Case 13.16 × 10−303.09 × 10−3810
Case 23.07 × 10−203.06 × 10−280
Case 32.36 × 10−27501.07 × 10−24340
Case 48.56 × 10−315405.95 × 10−33510
239Pu
Case 12.53 × 10−501.11 × 10−55400
Case 21.27 × 10−408.45 × 10−53440
Case 31.62 × 10−446001.83 × 10−47890
Case 41.49 × 10−490909.45 × 10−516,490
1 Case 1—constant Kd values corresponding to non-degraded concrete, case 2—constant Kd values corresponding to degraded concrete, case 3—Kd values change at the beginning of each concrete degradation stage, case 4—gradual change in Kd values.
Table 9. Summary of the radionuclide peak flux and the time of its appearance for cases 1–4.
Case 1129I59Ni239Pu
Peak in Relative Flux (1/y)Time of Peak (y)Peak in Relative Flux (1/y)Time of Peak (y)Peak in Relative Flux (1/y)Time of Peak (y)
Case 12.98 × 10−31502.24 × 10−416502.49 × 10−850,000
Case 22.18 × 10−2202.25 × 10−32002.39 × 10−618,300
Case 32.98 × 10−31504.14 × 10−438002.08 × 10−622,100
Case 42.98 × 10−31504.56 × 10−445001.89 × 10−627,000
1 Case 1—constant Kd values corresponding to non-degraded concrete, case 2—constant Kd values corresponding to degraded concrete, case 3—Kd values change at the beginning of each concrete degradation stage, case 4—gradual change in Kd values.
Disclaimer/Publisher’s Note: The statements, opinions and data contained in all publications are solely those of the individual author(s) and contributor(s) and not of MDPI and/or the editor(s). MDPI and/or the editor(s) disclaim responsibility for any injury to people or property resulting from any ideas, methods, instructions or products referred to in the content.