Abstract
CO2 Geological Storage Leakage (CGSL) poses significant risks to environmental safety and the sustainability of Carbon Capture, Utilization, and Storage (CCUS) projects. While Fault Tree Analysis (FTA) and the Risk Matrix are established risk assessment tools, their combined application to CGSL remains underexplored, particularly in providing a structured, semi-quantitative framework for risk prioritization. This study addresses this gap by developing an integrated FTA-Risk Matrix methodology specifically tailored for CGSL. Firstly, an Analytic Hierarchy Process (AHP) was employed to establish and optimize a comprehensive risk assessment index system, resulting in 17 key indicators derived from expert questionnaires. Subsequently, a fault tree model for CGSL was constructed, identifying 14 basic risk events. By integrating the risk matrix, these factors were quantitatively assessed based on their probability and severity, enabling clear risk classification and the identification of critical vulnerable points. The practical application of this framework to the Jingbian CCUS project in the Ordos Basin demonstrates its efficacy, revealing legacy wells and fault activation as high-risk factors. This research provides a systematic and transferable tool for enterprises to conduct hierarchical risk management and offers a critical reference for enhancing the safety protocols of CCUS projects.
1. Introduction
Global warming and climate change in recent years have been commonly associated with CO2 released from the burn and consumption of fossil fuels [1,2]. CO2 capture, utilization and geological storage (CCUS) refers to the industrial process of separating CO2 from various types of emission sources, including fossil fuels and the atmosphere, to utilize or store in an attempt to achieve CO2 emission reductions [3]. CCUS technology is widely recognized as a necessary and viable option for large-scale mitigation of the CO2 emission problem [4,5,6,7,8]. Safe storage of captured CO2 in geological structures and long-term storage is the core of CCUS technology [9,10,11]. However, the process of CO2 injection and storage can cause corrosion of the cement ring, destruction of the storage cap rock, and thus increase the risk of CO2 leakage due to the change in ground pressure and the decrease in pH value of formation water [12,13]. CO2 Geological Storage Leakage (CGSL) not only causes air pollution but also has a prominent impact on groundwater sources and human life safety [14].
In recent decades, risk assessment has been widely used in various fields of research. In general, the probability and the severity of the consequences of an accident are used in a comprehensive risk assessment. Shuyi Xie developed a bow-tie model combined with a risk matrix for fire and explosion accidents in an oil depot and for quantitative risk assessment [15]. Qiaohong Zheng combined a human factors analysis and classification system with a risk matrix to identify human error factors and risk prioritization in medical devices [16]. Ikwan Favour evaluated the risk of tank leakage based on fault tree analysis and risk matrix analysis [17]. Wen Li created a method based on the fuzzy fault tree analysis method and risk matrix method to predict the fuzzy risk of a roof gasholder to determine whether the risk level of the mine is “high risk and unacceptable” [18]. In past research, the risk matrix has mainly been applied to the research of traditional industries such as hazardous chemicals, and research in the field of CO2 geologic storage is relatively lacking. Therefore, to determine the vulnerability and prevention priorities, and to improve the efficiency of risk prevention and control management, applying the risk matrix to study the risk classification of CGSL is necessary.
Potential CO2 leakage could be a major barrier to the development of CO2 geologic storage [19]. In a CGSL risk analysis study, Wang built a layered model to simulate CO2 leakage during the post-injection phase embedded in a highly permeable fracture zone, which served to predict the percentage of safe CO2 storage at any dimensionless number [13]. Karim Farhat [20] and Andrew Duguid [21] used Bayesian event tree and bowtie models combined with Feature-Event-Process, respectively, to identify and evaluate the CGSL risk. Signe White utilized the National Risk Assessment Partnership’s Integrated Assessment Model for Carbon Storage elements to identify CO2 leakage risk by calculating the physical and chemical properties of all components of a CO2 storage site [22]. Gholami considers that continuous and reliable monitoring techniques must be employed during and after CO2 injection to ensure the integrity of the storage site [23]. Roelofse used an integrated approach based on geology and GIS to assess the risk of capping mature basins in the CCUS [24]. Most existing research on CGSL focuses on the numerical simulation analysis of CO2 leakage, and the research on the risk factors is still incomplete. FTA is a mature technology as an effective risk evaluation method; therefore, this paper studies the CGSL factors based on FTA, which helps to further analyze the CGSL hazard with risk management and control.
Based on the risk assessment theory, this paper identifies the risk factors affecting CGSL. Through the risk significance evaluation method and the improved Analytic Hierarchy Process, the index selection is completed by the questionnaire method, and a risk assessment index system is constructed. Through the case study of the CCUS project in Jingbian, China, the fault tree analysis method is combined with the risk matrix, and experts in the field of carbon dioxide geological storage are invited to evaluate, identify and grade the risk factors affecting carbon dioxide geological storage and determine the weak links. Through research on the risks of CCUS projects, it is conducive to realizing the carbon dioxide geological storage technology, reducing the harm to the surrounding people and the environment, and providing a theoretical basis for improving the safety planning and risk prevention and control of CCUS projects.
2. Materials and Methods
2.1. Selection Basis for Risk Evaluation Indicators
Indicators are parameters and concepts that characterize a system as a whole or partly. Usually, an indicator system is a set of interrelated indicators. The reasonable selection of the risk classification indicator system is directly related to the accuracy of the final risk value. When selecting risk classification indicators, the indicator system is usually established by searching for specifications, reviewing literature and expert advice, combined with the SMART principle, the KPI principle [25] and the 4M element theory.
Selection of reasonable and scientific risk classification evaluation indicators is the priority of risk classification, which makes the risk classification results more reliable. In this paper, the preliminary selection of indicators is mainly based on the relevant literature of CGSL, and standards at home and abroad, such as the Technical Guidelines for Environmental Risk Assessment of CO2 Capture, Utilization and Sequestration (for Trial Implementation) (Ministry of Environmental Protection of the People’s Republic of China 2016) [26], carbon dioxide capture, transportation and geological storage, geological storage (ISO. 2017) [27] and so on.
Based on the above principles and bases, it is necessary to remove the indicators with little importance or accessibility and adopt the risk importance evaluation method to optimize the indicator system. The steps of indicator optimization are as follows.
- (1)
- Determine the importance of the evaluation indicators: the importance classification of the evaluation indicators and the principle of assigning points are shown in Table 1.
 Table 1. Importance classification and assigning values.
 - (2)
- Make and distribute questionnaires according to the results of the questionnaire survey, calculate the importance coefficient of the evaluation indicators and the coefficient of variation of the indicators, as shown in Equations (1)–(3).where is the total number of experts participating in the questionnaire, is the total number of indicators in the primary election, is the importance assigned by the th expert to the th indicator, is the importance coefficient of the th indicator, is the coefficient of variation in the i-th indicator, and is the standard deviation of the i-th indicator.
- (3)
- Filter the evaluation indicators and keep the indicators that are and .
2.2. Calculation of Indicator Weights
Based on the optimized evaluation index system, determining the index weights is very important. In this paper, the determination of the weights of indicators for risk classification of CGSL adopts the hierarchical analysis method [25,28] with the following steps.
- (1)
- Establishment of a hierarchical structure for the research question.
First analyze the object of judgment from the hierarchy, according to the risk evaluation index system of each indicator affiliation according to the subordinate relationship for sorting; each indicator constitutes a fixed hierarchical structure.
- (2)
- Construction of a judgment matrix.
Generally, when constructing the judgment matrix in the Analytic Hierarchy Process (AHP), the importance of each element at each level is compared with the indicators of the previous level based on the hierarchical relationship among the indicators, and the corresponding scales are quantified in Table 2. However, this method has a certain degree of subjectivity. To avoid overly strong subjectivity, this paper has improved the Analytic Hierarchy Process (AHP).
Table 2.
Judgment matrix scale and meaning.
First, by pairwise comparison of the risk importance coefficients RF of each indicator, , a comparison judgment matrix A was constructed, and the values were assigned according to the scale given in Table 3. The core of our improved method is the mapping function defined in Table 3. This function translates the quantitative difference in importance (ΔRF) into the qualitative AHP scale (α). The logic is that a larger difference in RF should correspond to a stronger preference on the standard AHP scale. The judgment matrix constructed in this paper mainly compares the risk importance coefficients of each index pairwise. Then, the constructed matrix A is examined one by one. If there are obvious situations that do not conform to the actual project, the method shown in Table 2 is used to supplement the data.
Table 3.
Assignment table of
- (3)
- Use a sum-product method of judgment matrix to get hierarchical single ordering.The process of determining the ranking weights of the factors of the same level with the relative importance of a factor of the level above it is called hierarchical single ranking. The specific steps are as follows.
- Multiply each row of the judgment matrix.where is the product of the elements of the th row; is the matrix element of the -th column of the ith row; and is the order of the matrix.
- Compute the th root ofwhere is the th root of the product of the elements of each row.
- The normalization process yields a feature vector
- (4)
- Consistency tests were performed to ensure scientific validity.where is the largest eigenvalue, is the random consistency ratio, in the case of , it is the consistency of this judgment matrix to meet the requirements, that is, through the consistency test, the smaller the value of , the smaller the matrix deviation, the closer to the reality of the situation; is the random consistency conditions, the average of the consistency indicators, the value of which is related to the number of matrices , as shown in Table 4.
Table 4. Randomized consistency Tables.
2.3. Risk Matrix Method
Fault tree analysis (FTA) is a method to find the causes of accidents based on the information provided by possible accidents or already occurred accidents in a system, thus taking effective precautions to prevent the recurrence of similar accidents. FTA is an effective and mature risk assessment method, widely used in risk assessment research, which can qualitatively identify and analyze the identification of risk factors, and quantitatively assess the possibility of undesired events [29,30]. By analyzing the importance of each basic cause event from the structure of the fault tree, we can take countermeasures according to the priority and determine the safety measures to prevent accidents.
The risk matrix is usually expressed as a two-dimensional diagram of the accident probability and the consequence impact severity [20]. In this paper, the possibility and severity of risks of CGSL are delimited by reference to domestic and foreign CO2 geological storage-related regulations, standards and risk evaluation-related theories.
The possibility of CO2 leakage accidents during CO2 geological storage is classified into five levels: almost impossible, unlikely, probable, very probable and almost certain, as shown in Table 5.
Table 5.
Delimit possibility.
The consequence severity of CO2 leakage accidents during CO2 geological storage is classified into five levels: no effect, mild, moderate, severe and very severe, as shown in Table 6.
Table 6.
Delimit consequence severity.
Twelve experts in the field of CO2 geological storage from Sinopec Petroleum Exploration and Production Research Institute (SPEPRI) were invited to conduct the evaluation. Based on the principle of equal weight of experts, the arithmetic average of experts’ scores is used to represent the probability of risk occurrence, which is calculated as Equation (8).
where is the scoring result of the -th expert and is the number of experts participating in the process.
The risk level can be calculated by coupling the probability and severity according to Equation (9).
where is the probability, is the severity of the consequences, and the risk matrix is referenced in Figure 1.
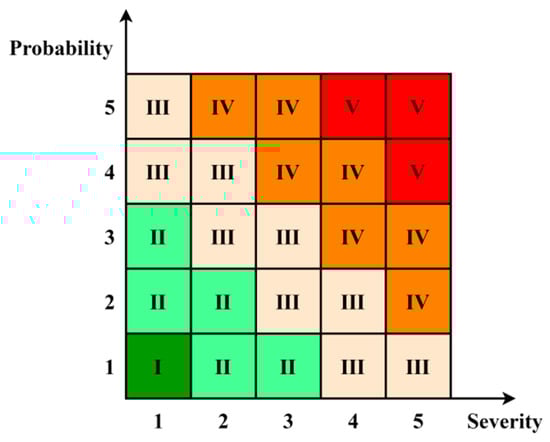
Figure 1.
Risk matrix. Note: RI is ultra-low risk, which suggests that no measures need to be taken. RII is low risk, which suggests that the project can be operated and only requires additional monitoring and maintenance. RIII is medium risk, which suggests that detailed analysis and countermeasures need to be implemented to reduce the risk of the situation. RIV is high risk, which suggests that the project needs to be maintained shortly to avoid an incident. RV is an ultrahigh risk, which indicates a continuing risk of leakage and the need to implement a maintenance program as soon as possible.
FTA can intuitively and accurately analyze the causes of accidents, but it is difficult to realize quantitative risk assessment based on the lack of data. Therefore, to quantify the risk of CGSL, it is necessary to combine FTA with a Risk Matrix for identifying accidental weak points and preventive priorities, thus improving the efficiency of risk prevention and control management.
The specific steps of the proposed risk assessment method are shown in Figure 2. Firstly, an improved AHP was employed to establish and optimize a comprehensive risk assessment index system, with indicators derived from expert questionnaires. Subsequently, a CGSL fault tree model was constructed based on actual cases to systematically identify and organize the basic risk events that could lead to potential leaks. The core of this method framework lies in the close integration of the risk assessment and risk identification processes. This integration enables a quantitative assessment of all identified risk factors based on their likelihood and severity, thereby facilitating clear risk classification and prioritization of key control points.
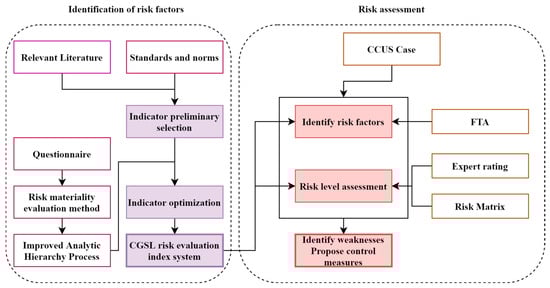
Figure 2.
Framework of the proposed methodology.
3. Results
3.1. CGSL Risk Assessment Indicators
3.1.1. Initial Selection of Indicators
For the initial selection of the risk indicator system for CGSL, the three dimensions including accident possibility, severity and sensitivity, and four aspects including man, machine, medium (environment) and management will be analyzed, extended and summarized to identify indicators at the tier 1, tier 2 and tier 3 levels, as shown in Table 7.
Table 7.
CGSL accident risk initial selection index system.
3.1.2. Optimization of Indicators
After the CGSL accident risk preliminary selection classification index system is determined, based on the risk importance evaluation method in Section 2.1, we designed the risk importance questionnaire for research. The questionnaires were distributed 29 times and 27 questionnaires were effectively recovered. The respondents of the questionnaire are all engineers from different oil companies, with a professional title of intermediate or above, and more than five years of working experience in CCUS. Their job responsibilities cover multiple different CCUS projects. We believe that these people possess a certain level of professional expertise, and the questionnaire is reliable. The specific content of the questionnaire and the demographic table can be seen in the Supplementary Materials.
The results of the questionnaire were collated and the importance coefficient , the standard deviation and the coefficient of variation were calculated for each indicator, retaining those indicators with > 2.5 and (effectively filtering out those indicators that are not important enough or lack expert consensus.) [16,17,18]. Table 8 presents a summary of the results of data processing.
Table 8.
Results of questionnaire data processing summary.
By optimization and analysis of evaluation indexes, we found that indicators of inadequate safety management, air pollution, ecosystem impacts, special time period, and functional area should be deleted because the coefficients of variation are more than 0.25, and the rest of the indicators should be retained to form the final CGSL risk assessment index system, as shown in Table 9.
Table 9.
CGSL risk assessment index system.
3.1.3. Risk Evaluation Indicator Weights
After determining the risk indexes, using hierarchical analysis to evaluate the weights of the indicators, firstly by comparing the risk importance coefficient of each indicator two by two, , , we constructed a comparative judgment matrix and assigned values according to the scale given in Table 3.
By comparison, a 17 × 17 judgment matrix can be constructed.
Compute the judgment matrix eigenvector . The weights obtained for the three-tier indicators are shown in Table 10. The higher the weight , the more important it is that experts consider it to be and the more it should be retained.
Table 10.
Weights of CGSL risk evaluation index system.
In the process of analyzing the questionnaire for indicator optimization, the risk importance evaluation method was used to calculate the importance coefficient, standard deviation and coefficient of variation in each indicator, which makes the final risk classification evaluation indicators have high credibility. In addition, in determining the weights of the indicators by using the hierarchical analysis method, the consistency of the judgment matrix of the indicators , the judgment matrix has a fine consistency, which shows the credibility of this risk classification and evaluation indicator system. The summary results of the consistency test are shown in Table 11.
Table 11.
Summary of results of consistency tests.
The classification and assignment standards for each indicator are formulated in accordance with the “Specification for Leakage Risk Assessment of CO2 Geological Utilization and Storage Projects” (T/CSES71—2022), as shown in Table 12.
Table 12.
The classification and assignment standards for each indicator.
3.2. CGSL Risk Assessment
3.2.1. CCUS Project Description
The Jingbian area is situated on the northeastern slope of the Ordos Basin. During the Late Triassic, northeastern sediment sources led to the development of multiple source–reservoir–caprock assemblages. The region’s Yanchang Formation, a delta plain deposit approximately 1400 m thick, features deltaic sandstones and deep-lacustrine mudstones formed in multiple sedimentary cycles during lake regression, with a gentle dip angle of 0.5–1°. The study focuses on the Chang 6 reservoir, composed of submarine distributary channel sands with lithology dominated by fine sandstone and siltstone. These sand bodies, typically over 300 m wide, exhibit good connectivity [31,32]. The overlying Chang 4 + 5 formation, also of delta plain origin, contains more extensive and thicker mudstones, making it an effective direct seal for the Chang 6 reservoir. Furthermore, the area lacks faults that intersect the reservoir, ensuring its integrity [33].
As a key experimental area for the full-process CCUS technology of Yanchang Petroleum, the Jingbian Qiaojiawa Experimental Area has adopted a “first injection then drive” development approach since 2012. By injecting carbon dioxide into the reservoir, it has not only effectively increased the formation pressure and achieved an increase in crude oil production but also permanently stored carbon dioxide underground. As of 2023, the Jingbian Qiaojiawa Experimental Area has cumulatively stored 29,800 tons of carbon dioxide and has planned a medium-term goal of storing 100,000 tons per year. This paper takes the Jingbian CCUS project as an example for risk assessment.
3.2.2. FTA Construction
Based on the above research on CGSL [34,35,36,37,38,39], the established risk classification index system can be analyzed. At the same time, a fault tree leading to CGSL is constructed in combination with the geological and engineering conditions of the Jingbian CCUS project, as shown in Figure 3. Table 13 presents all the events of this model, where T represents the top-level event of CO2 leakage, M represents intermediate events, and X represents basic events. In this fault tree model, CO2 leakage is identified as the top event. Through the analysis of CO2 storage and leakage mechanisms, it is believed that the existence of free CO2 and leakage channels are two prerequisite conditions for CO2 leakage. Therefore, these two factors are determined as sub-events of CO2 leakage. Free CO2 can leak through both wellbore leakage channels [34] and geological leakage channels [35,36], which are the most common leakage paths observed in CCUS projects.
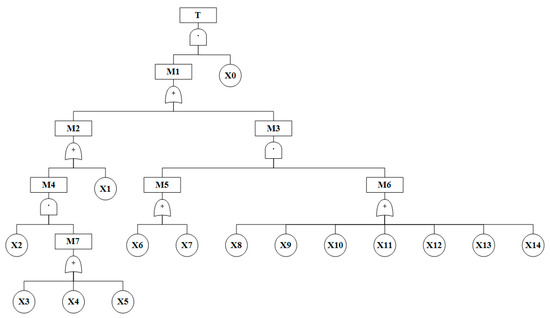
Figure 3.
CGSL fault tree model.
Table 13.
Fault tree events.
The first leakage channel is the wellbore leakage channel, which is divided into injection wells, production wells, and legacy wells. Factors influencing the leakage of injection wells and production wells include external and internal factors. External factors include CO2 injection, such as chemical corrosion, temperature changes, and pressure changes caused by injected CO2. Internal factors are structural defects of the wellbore itself, such as cementing parameters, well completion time, and well deviation. Generally, the leakage risk of injection wells and production wells is relatively low, but if the wellbore is a legacy well, the leakage risk increases. As there are hundreds of legacy wells in the Jingbian area and there is a possibility of long-term deterioration, we believe that legacy wells are one of the most likely leakage routes. For CCUS projects, all legacy wells should be carefully sealed with special cement or other anti-leakage treatment measures. If legacy wells are not treated for leakage prevention or are not properly sealed with CO2-resistant cement, it will affect the safety of CO2 storage.
The second leakage channel is the geological leakage channel, which is the result of the combined effect of faults and the overlying caprock. Faults in the Jingbian area are mostly formed by natural geological activities, but they can also be caused by unreasonable human development activities. Additionally, if the caprock above the fault cannot prevent the upward migration of CO2, CO2 will leak through the geological leakage channel. Caprock failure is the result of the combined effect of caprock integrity failure, high caprock permeability, and CO2 diffusion. Factors affecting caprock integrity include caprock thickness, caprock lithology, caprock-to-reservoir ratio, caprock corrosion, CO2 storage pressure, toughness, and continuous distribution. Caprock thickness is an important factor affecting caprock leakage. When the caprock is thin, gas breaks through rapidly, and the capillary force of the broken caprock to seal the gas is destroyed, resulting in CO2 leakage. Different diagenetic environments of the caprock cause differences in the mineral composition and physical properties of the rocks in the caprock and their ability to seal CO2. The caprock-to-reservoir ratio is defined as the ratio of the thickness of the mudstone to the thickness of the caprock in a caprock composed of multiple interbedded sandstone and mudstone layers. The gas sealing capacity of the caprock increases with the increase in the caprock-to-reservoir ratio. The entry of CO2 into the caprock pores can cause dissolution and precipitation reactions of the rocks and minerals in the caprock, leading to caprock corrosion and increasing the risk of CO2 leakage. CO2 storage pressure is also an important cause of caprock leakage channels. When the storage pressure exceeds the breakthrough pressure of the caprock but is lower than the fracture pressure of the caprock, gas will leak along the caprock. The essence of the influence of rock toughness on caprock sealing is to indirectly control the sealing of the caprock by affecting the difficulty of fracture and crack formation. Compared with brittle rocks, caprocks composed of ductile rocks are less likely to produce fractures and cracks. For CO2 geological storage areas, there must be at least one regional caprock with a distribution area larger than the CO2 plume diffusion range during the design service life to form an effective seal. Therefore, the continuous distribution of the caprock over a large area is beneficial for CO2 geological storage.
3.2.3. Risk Assessment
For the identified risk factors affecting CGSL, an evaluation is conducted based on the possibility and severity of the consequences, followed by risk classification, which can quickly determine the risk hazards. Specifically, the possibility and severity are defined in the form of expert scores. Twelve experts from SPEPRI were invited to assess the possibility and severity of the factors leading to CGSL. All these experts participated in the construction of the Jingbian Qiaojiawa experimental area and held the title of senior engineer or above. We believe they have sufficient understanding of this CCUS project.
In addition, when experts rate the possibility, they are mainly required to refer to the classification and assignment method of the indicators shown in Table 12. The severity is rated based on their own understanding of the project.
The results of the expert group’s scoring of the probability of influencing factors leading to CGSL are shown in Table 14.
Table 14.
Possibility expert scorecard.
The results of the expert group’s scoring of the severity of the factors influencing the CGSL are shown in Table 15.
Table 15.
Severity expert scorecard.
The risk level of each risk factor is obtained after coupling, as shown in Table 16.
Table 16.
CGSL risk factor evaluation classification.
The combined scoring of the expert group’s comments resulted in 14 risk factors, of which 2 were high risk, 10 were medium risk and 2 were low risk. Legacy wells and fault activities are two high-risk factors for CGSL in the Jingbian area, which is consistent with the actual situation. The current mining history of the Jingbian area exceeds 25 years, with more than 300 legacy wells [40]. Legacy wells were one of the main leakage risks considered in the early stage of this project. In addition, although there are not many visible faults within the area, deep basement faults are very well developed. These ancient and concealed faults may be reactivated in later tectonic movements and extend upward, controlling the formation of low-level faults and the development of fractures in the overlying sedimentary cover, so fault activation is also one of the high-risk factors for CGSL.
4. Discussion
This study has developed a comprehensive risk assessment framework for CO2 Geological Storage Leakage (CGSL) by integrating Fault Tree Analysis (FTA) with a Risk Matrix, supported by an improved Analytic Hierarchy Process (AHP) for indicator selection and weighting. The proposed methodology was applied to the Jingbian CCUS project in the Ordos Basin, revealing critical risk factors and their relative significance. The results indicate that legacy wells and fault activation represent the most significant high-risk factors, consistent with the geological and operational context of the study area. This alignment with real-world conditions underscores the practical relevance and robustness of the proposed framework.
The identification of natural geologic activity leading to faults and unfavorable capping lithology as vulnerable components of the CGSL system highlights the inherent challenges in ensuring long-term storage integrity. These factors are largely influenced by subsurface characteristics that are difficult to alter once a storage site is selected. This finding emphasizes the importance of thorough site characterization and selection during the pre-injection phase. Given that CO2 geological storage technology is still under development and key technologies are not yet fully mature, decision-makers must prioritize rigorous site screening and risk-informed design standards. For instance, engineering controls such as injection pressure management, well integrity assurance, and caprock monitoring should be tailored to site-specific risk profiles.
From a managerial perspective, the study provides an actionable basis for developing safety protocols and monitoring strategies. The fact that legacy wells emerged as a high-risk factor underscores the need for robust well-plugging and abandonment practices, as well as periodic integrity assessments. Similarly, the high risk associated with fault activation calls for continuous geomechanical monitoring and possibly pressure management to avoid inducing seismicity or fault reactivation. Moreover, the medium-risk factors—which collectively represent the majority of identified risks—suggest that a comprehensive risk management plan should include regular monitoring, maintenance, and contingency planning.
The integration of FTA and the Risk Matrix offers a structured and semi-quantitative approach to risk prioritization, which is particularly valuable in contexts where quantitative data are scarce. The FTA provides a logical and visual representation of potential leakage pathways, while the Risk Matrix enables a clear classification of risks based on expert judgment. This combined approach facilitates the identification of not only high-probability events but also those with severe consequences, thereby supporting targeted risk mitigation. For example, the medium-risk factors identified—such as high storage pressure, discontinuous caprock distribution, and poor rock toughness—require detailed analysis and proactive management, though they may not demand immediate intervention like high-risk factors.
The application of the improved AHP method in this study also merits discussion. By deriving the judgment matrix from the risk importance coefficients obtained through expert surveys, the method reduces subjectivity in weight assignment. The consistency ratio (CI = 0.075, CR = 0.047) confirms the reliability of the pairwise comparisons and the overall hierarchy. This methodological refinement enhances the transparency and reproducibility of the risk assessment process, which is often criticized for its reliance on expert opinion. Table 17 compares the method proposed in this paper with typical CCUS risk assessment methods. Overall, although this method cannot conduct a complete quantitative risk analysis, it achieves a relatively balanced trade-off among data requirements, interpretability of results, identification of systemic risks, and handling of uncertainties. It is particularly suitable for the early and mid-stages of CCUS projects, when there is often a lack of extensive historical data for probabilistic statistics or training complex machine learning models.
Table 17.
Comparison between typical CCUS risk analysis methods and the method proposed in this paper.
Despite some research findings in this study, there are still some challenges and limitations of the proposed methodological framework. Due to its broad applicability, the risk matrix can reveal areas where safety risks are relatively poorly understood [41]. Therefore, applying it to the study of CGSL, risk is of great significance in establishing and improving the theoretical system of CCUS safety management and reducing project risks. However, at the same time, we observed the subjectivity of the probability assignment and interpretation of the risk matrix; this challenge is not unique to the risk matrix but common in probabilistic assessment models [20]. Therefore, a more objective approach could be used to evaluate the CGSL risk with the further maturity of the CO2 geological storage technology in the subsequent studies. Another limitation is that the basic events in the FTA may have mutual influences, but this cannot be reflected in our risk framework. When there is sufficient data, choosing Bayesian networks or other methods to better discuss the mutual influences of basic events may be more accurate.
5. Conclusions
This study investigates the risk of CGSL, takes the safety management of the CCUS project as the target, builds a risk assessment index system and a leakage accident risk assessment model for CO2 geological storage to realize advanced control of accidents and ensure the long-term and safe geological storage of CO2. The main conclusions are as follows.
The CGSL risk assessment index system was established. Based on the risk factors of CGSL and referring to the relevant standards and norms, the primary indicator system for risk classification was constructed in terms of possibility, severity and sensitivity, applying the risk importance evaluation method to determine the CGSL risk evaluation indicator system containing 17 three-level indicators.
Based on the Jingbian CCUS project, a fault tree for CGSL was constructed. Through the analysis of the leakage mechanism of CO2, 14 risk factors affecting the geological storage leakage of CO2 were identified using the fault tree analysis method, including the permeability of the caprock.
The leakage risk of the Jingbian CCUS project was evaluated, and its weaknesses were determined. Among the 14 risk factors, faults caused by natural geological activities and legacy wells are the weak links of CGSL, which are not conducive to CO2 storage and must be subject to maintenance engineering for risk control as soon as possible.
Supplementary Materials
The following supporting information can be downloaded at: https://www.mdpi.com/article/10.3390/app152212175/s1. Table S1. Index Screening Questionnaire; Table S2. Sample demographic table; Table S3. Main Reliability Statistics; Table S4. Item-Total Statistics.
Author Contributions
Conceptualization, L.P. and T.Y.; methodology, L.P. and Q.D.; software, T.Y. and Q.D.; validation, Q.D., R.W., and X.W.; formal analysis, T.Y.; investigation, L.P.; resources, L.P. and T.Y.; data curation, L.P. and T.Y.; writing—original draft preparation, R.W., L.P., and T.Y.; writing—review and editing, R.W. and X.W.; visualization, Q.D.; supervision, R.W. and X.W.; project administration, R.W. and X.W.; funding acquisition, R.W., X.W., and Q.D. All authors have read and agreed to the published version of the manuscript.
Funding
This research was funded by the National Science and Technology Major Project of China (Grant number 2024ZD1004300), and Open Fund of SINOPEC Key Laboratory of Carbon Capture, Utilization and Storage (Grant number 33550000-22-ZC0613-0324).
Institutional Review Board Statement
Not applicable.
Informed Consent Statement
Not applicable.
Data Availability Statement
The data presented in this study are available upon request from the corresponding author.
Acknowledgments
The authors are grateful to the anonymous reviewers for their constructive comments.
Conflicts of Interest
The authors declare no conflicts of interest.
References
- Hasan, M.M.F.; First, E.L.; Boukouvala, F.; Floudas, C.A. A multi-scale framework for CO2 capture, utilization, and sequestration: CCUS and CCU. Comput. Chem. Eng. 2015, 81, 2–21. [Google Scholar] [CrossRef]
- Zhang, Z.; Wang, T.; Blunt, M.J.; Anthony, E.J.; Park, A.-H.A.; Hughes, R.W.; Webley, P.A.; Yan, J. Advances in carbon capture, utilization and storage. Appl. Energy 2020, 278, 115627. [Google Scholar] [CrossRef]
- Lin, Q.; Zhang, X.; Wang, T.; Zheng, C.; Gao, X. Technical Perspective of Carbon Capture, Utilization, and Storage. Engineering 2022, 14, 27–32. [Google Scholar] [CrossRef]
- Jiang, K.; Ashworth, P. The development of Carbon Capture Utilization and Storage (CCUS) research in China: A bibliometric perspective. Renew. Sustain. Energy Rev. 2021, 138, 110521. [Google Scholar] [CrossRef]
- Tapia, J.F.D.; Lee, J.-Y.; Ooi, R.E.H.; Foo, D.C.Y.; Tan, R.R. Planning and scheduling of CO2 capture, utilization and storage (CCUS) operations as a strip packing problem. Process Saf. Environ. Prot. 2016, 104, 358–372. [Google Scholar] [CrossRef]
- Wei, N.; Li, X.; Liu, S.; Lu, S.; Jiao, Z. A strategic framework for commercialization of carbon capture, geological utilization, and storage technology in China. Int. J. Greenh. Gas Control 2021, 110, 103420. [Google Scholar] [CrossRef]
- Xu, Y.; Zhu, L.; Chang, D.; Tsimplis, M.; Greig, C.; Wright, S. International chains of CO2 capture, utilization and storage (CCUS) in a carbon-neutral world. Resour. Conserv. Recycl. 2021, 167, 105433. [Google Scholar] [CrossRef]
- Yan, J.; Zhang, Z. Carbon Capture, Utilization and Storage (CCUS). Appl. Energy 2019, 235, 1289–1299. [Google Scholar] [CrossRef]
- Bump, A.P.; Bakhshian, S.; Ni, H.; Hovorka, S.D.; Olariu, M.I.; Dunlap, D.; Hosseini, S.A.; Meckel, T.A. Composite confining systems: Rethinking geologic seals for permanent CO2 sequestration. Int. J. Greenh. Gas Control 2023, 126, 103908. [Google Scholar] [CrossRef]
- Cheng, Y.; Liu, W.; Xu, T.; Zhang, Y.; Zhang, X.; Xing, Y.; Feng, B.; Xia, Y. Seismicity induced by geological CO2 storage: A review. Earth-Sci. Rev. 2023, 239, 104369. [Google Scholar] [CrossRef]
- Liu, Y.; Hu, T.; Rui, Z.; Zhang, Z.; Du, K.; Yang, T.; Dindoruk, B.; Halfdan Stenby, E.; Torabi, F.; Afanasyev, A. An Integrated Framework for Geothermal Energy Storage with CO2 Sequestration and Utilization. Engineering 2023, 30, 121–130. [Google Scholar] [CrossRef]
- Song, X.; Wang, F.; Ma, D.; Gao, M.; Zhang, Y. Progress and prospect of carbon dioxide capture, utilization and storage in CNPC oilfields. Pet. Explor. Dev. 2023, 50, 229–244. [Google Scholar] [CrossRef]
- Wang, Z.; Li, H.; Liu, S.; Xu, J.; Liu, J.; Wang, X. Risk evaluation of CO2 leakage through fracture zone in geological storage reservoir. Fuel 2023, 342, 127896. [Google Scholar] [CrossRef]
- Yue, P.; Yang, H.; Yu, G.; Yang, Z.; Sheng, J.J.; Jia, B. Leakage Risk Evaluation Model for Single Wells of CO2: A case study. Energy Sources Part A Recovery Util. Environ. Eff. 2022, 44, 2637–2650. [Google Scholar] [CrossRef]
- Xie, S.; Dong, S.; Chen, Y.; Peng, Y.; Li, X. A novel risk evaluation method for fire and explosion accidents in oil depots using bow-tie analysis and risk matrix analysis method based on cloud model theory. Reliab. Eng. Syst. Saf. 2021, 215, 107791. [Google Scholar] [CrossRef]
- Zheng, Q.; Liu, X.; Wang, W. A consensus model-based risk matrix for human error factors risk analysis in medical devices by considering risk acceptability. Reliab. Eng. Syst. Saf. 2023, 238, 109446. [Google Scholar] [CrossRef]
- Ikwan, F.; Sanders, D.; Hassan, M. Safety evaluation of leak in a storage tank using fault tree analysis and risk matrix analysis. J. Loss Prev. Process Ind. 2021, 73, 104597. [Google Scholar] [CrossRef]
- Li, W.; Ye, Y.; Wang, Q.; Wang, X.; Hu, N. Fuzzy risk prediction of roof fall and rib spalling: Based on FFTA–DFCE and risk matrix methods. Environ. Sci. Pollut. Res. 2020, 27, 8535–8547. [Google Scholar] [CrossRef]
- Zhang, Z.; Huisingh, D. Carbon dioxide storage schemes: Technology, assessment and deployment. J. Clean. Prod. 2017, 142, 1055–1064. [Google Scholar] [CrossRef]
- Farhat, K.; Benson, S.M. Translating risk assessment to contingency planning for CO2 geologic storage: A methodological framework. Int. J. Greenh. Gas Control 2016, 52, 410–431. [Google Scholar] [CrossRef]
- Duguid, A.; Glier, J.; Heinrichs, M.; Hawkins, J.; Peterson, R.; Mishra, S. Practical leakage risk assessment for CO2 assisted enhanced oil recovery and geologic storage in Ohio’s depleted oil fields. Int. J. Greenh. Gas Control 2021, 109, 103338. [Google Scholar] [CrossRef]
- White, S.; Carroll, S.; Chu, S.; Bacon, D.; Pawar, R.; Cumming, L.; Hawkins, J.; Kelley, M.; Demirkanli, I.; Middleton, R.; et al. A risk-based approach to evaluating the Area of Review and leakage risks at CO2 storage sites. Int. J. Greenh. Gas Control 2020, 93, 102884. [Google Scholar] [CrossRef]
- Gholami, R.; Raza, A.; Iglauer, S. Leakage risk assessment of a CO2 storage site: A review. Earth-Sci. Rev. 2021, 223, 103849. [Google Scholar] [CrossRef]
- Roelofse, C.; Alves, T.M.; Gafeira, J.; Omosanya, K.d.O. An integrated geological and GIS-based method to assess caprock risk in mature basins proposed for carbon capture and storage. Int. J. Greenh. Gas Control 2019, 80, 103–122. [Google Scholar] [CrossRef]
- Podgórski, D. Measuring operational performance of OSH management system—A demonstration of AHP-based selection of leading key performance indicators. Saf. Sci. 2015, 73, 146–166. [Google Scholar] [CrossRef]
- Ministry of Environmental Protection of the People’s Republic of China. Technical Guidelines for Environmental Risk Assessment of Carbon Dioxide Capture, Utilization and Storage (Trial); Ministry of Ecology and Environment of the People’s Republic of China: Beijing, China, 2016. (In Chinese)
- ISO 27914: 2017; Carbon Dioxide Capture, Transportation and Geological Storage. Geological Storage. International Organization for Standardization: Geneva, Switzerland, 2017.
- Gao, Z.; Ding, M.; Huang, T.; Liu, X.; Hao, Z.; Hu, X.; Chuanjie, X. Landslide risk assessment of high-mountain settlements using Gaussian process classification combined with improved weight-based generalized objective function. Int. J. Disaster Risk Reduct. 2022, 67, 102662. [Google Scholar] [CrossRef]
- Lu, L.; Liang, W.; Zhang, L.; Zhang, H.; Lu, Z.; Shan, J. A comprehensive risk evaluation method for natural gas pipelines by combining a risk matrix with a bow-tie model. J. Nat. Gas Sci. Eng. 2015, 25, 124–133. [Google Scholar] [CrossRef]
- Shahriar, A.; Sadiq, R.; Tesfamariam, S. Risk analysis for oil & gas pipelines: A sustainability assessment approach using fuzzy based bow-tie analysis. J. Loss Prev. Process Ind. 2012, 25, 505–523. [Google Scholar] [CrossRef]
- Tang, J.; Zhan, Y.; Zhao, G.Z.; Deng, Q.H.; Wang, J.J.; Chen, X.B.; Zhao, J.M.; Xuan, F. Electrical conductivity structure of the crust and upper mantle in the northeastern margin of the Qinghai-Tibet plateau along the profile Maqen-Lanzhou-Jingbian. Chin. J. Geophys. Chin. Ed. 2005, 48, 1205–1216. [Google Scholar] [CrossRef]
- He, X.Y.; Shou, J.F.; Shen, A.J.; Wu, X.N.; Wang, Y.S.; Hu, Y.Y.; Zhu, Y.; Wei, D.X. Geochemical characteristics and origin of dolomite: A case study from the middle assemblage of Ordovician Majiagou Formation Member 5 of the west of Jingbian Gas Field, Ordos Basin, North China. Pet. Explor. Dev. 2014, 41, 417–427. [Google Scholar] [CrossRef]
- Yang, Z.G.; Wang, A.G.; Meng, P.Y.; Chen, M.; Guo, K.; Zhu, N. Combined use of in-reservoir geological records for oil-reservoir destruction identification: A case study in the Jingbian area (Ordos Basin, China). Front. Earth Sci. 2023, 11, 1133539. [Google Scholar] [CrossRef]
- Kiran, R.; Teodoriu, C.; Dadmohammadi, Y.; Nygaard, R.; Wood, D.; Mokhtari, M.; Salehi, S. Identification and evaluation of well integrity and causes of failure of well integrity barriers (A review). J. Nat. Gas Sci. Eng. 2017, 45, 511–526. [Google Scholar] [CrossRef]
- Cui, G.; Wang, Y.; Rui, Z.; Chen, B.; Ren, S.; Zhang, L. Assessing the combined influence of fluid-rock interactions on reservoir properties and injectivity during CO2 storage in saline aquifers. Energy 2018, 155, 281–296. [Google Scholar] [CrossRef]
- Jing, J.; Yang, Y.; Cheng, J.; Ding, Z.; Wang, D.; Jing, X. Analysis of the effect of formation dip angle and injection pressure on the injectivity and migration of CO2 during storage. Energy 2023, 280, 128021. [Google Scholar] [CrossRef]
- Vitali, M.; Zuliani, C.; Corvaro, F.; Marchetti, B.; Tallone, F. Statistical analysis of incidents on onshore CO2 pipelines based on PHMSA database. J. Loss Prev. Process Ind. 2022, 77, 104799. [Google Scholar] [CrossRef]
- Wang, Y.; Zhang, L.; Ren, S.; Ren, B.; Chen, B.; Lu, J. Identification of potential CO2 leakage pathways and mechanisms in oil reservoirs using fault tree analysis. Greenh. Gases Sci. Technol. 2020, 10, 331–346. [Google Scholar] [CrossRef]
- Zhang, K.; Sang, S.; Zhou, X.; Liu, C.; Ma, M.; Niu, Q. Influence of supercritical CO2-H2O-caprock interactions on the sealing capability of deep coal seam caprocks related to CO2 geological storage: A case study of the silty mudstone caprock of coal seam no. 3 in the Qinshui Basin, China. Int. J. Greenh. Gas Control 2021, 106, 103282. [Google Scholar] [CrossRef]
- Yu, T.L.; Gao, J.Q.; Yang, H.; Wu, X. Risk assessment and management strategy of geologic carbon storage in multi-well site. Process Saf. Environ. Prot. 2024, 192, 822–836. [Google Scholar] [CrossRef]
- Axon, C.J.; Darton, R.C. The causes of risk in fuel supply chains and their role in energy security. J. Clean. Prod. 2021, 324, 129254. [Google Scholar] [CrossRef]
Disclaimer/Publisher’s Note: The statements, opinions and data contained in all publications are solely those of the individual author(s) and contributor(s) and not of MDPI and/or the editor(s). MDPI and/or the editor(s) disclaim responsibility for any injury to people or property resulting from any ideas, methods, instructions or products referred to in the content. |
© 2025 by the authors. Licensee MDPI, Basel, Switzerland. This article is an open access article distributed under the terms and conditions of the Creative Commons Attribution (CC BY) license (https://creativecommons.org/licenses/by/4.0/).