Article

Vertical vs. Horizontal Integration in HBM and Market-Implied Valuation: A Text-Mining Study

1
Seoul Business School, aSSIST University, Seoul 03767, Republic of Korea
2
Department of Management Information Systems, Dong-A University, Busan 49236, Republic of Korea
*
Author to whom correspondence should be addressed.
Appl. Sci. 2025, 15(22), 12127; https://doi.org/10.3390/app152212127 (registering DOI)
Submission received: 17 October 2025 / Revised: 13 November 2025 / Accepted: 14 November 2025 / Published: 15 November 2025
(This article belongs to the Special Issue Big Data Technology and Its Applications)

Abstract

High-bandwidth memory (HBM) has become a strategic bottleneck in AI-centric systems, shifting competitive advantage from computing power alone to a design that is orchestrated by memory and packaging. We investigate whether publicly available information about companies’ integration decisions—vertical integration by Samsung Electronics and horizontal partnerships by SK Hynix—is included in market-expected valuation. We create a Korean-language news corpus spanning January 2023 to September 2025 and use seed-guided topic models to obtain firms’ vertical and horizontal integration. We verify qualitative distinguishability with t-SNE embeddings and use firm-specific ordinary least squares specifications to link topic intensities to equity prices. According to research findings, for Samsung, consolidation-oriented vertical indicators (M&A and risk ring-fencing) positively correlate with valuation, whereas supplier-enablement or operational vertical topics are not reliably factored into their valuation. Vendor-assisted scale-up and joint development topics support positive valuation for SK Hynix. This study provides a scalable framework for text evaluation, which distinguishes between general sentiment and strategic architecture, as well as evidence that capital markets reward consolidation and alliance execution differently depending on the management of the HBM bottleneck.

1. Introduction

High-bandwidth memory (HBM) demand has increased dramatically since the commercialization of generative artificial intelligence. With the significant and substantial rise in training and inference workloads for multimodal and large language models, simply increasing computing cores has become insufficient to eliminate system bottlenecks solely. According to research, memory bandwidth and access efficiency influence latency and throughput in inference processes, emphasizing memory-centric design as a key factor in reducing operational costs and increasing productivity [1,2,3,4,5,6]. At the same time, data center operators have prioritized quality and speed improvement of HBM procurement to handle more model requests while maintaining the same power and space constraints. The chiplet growth and high-density packaging have increased the requirement for concurrent optimization across memory, substrate, packaging, and foundry, and industry observations note that coordinated adjustments and joint learning among dependent partners increase performance differentials by developing management, yield trajectories, and delivery reliability [7].
We consider these developments as strategic integration decisions that fall along a spectrum between two extremes: horizontal partnerships and vertical integration. Horizontal alliances aim to collaborate with specialized partners across the HBM value chain, mitigating risk, integrating complementary skills, and sharing data to accelerate experimentation and dissemination of knowledge. Vertical integration focuses on providing key interfaces within a company, like packaging, encompassing memory, and fabrication, to secure proprietary manufacturing processes, enhance timelines of production, and ensure coordination benefits. Traditional governance and industry architecture theories address firms’ trade-off decisions between transaction risks and coordination benefits in make-or-buy [8,9]. Incentives of orchestrating participation, relationship-specific investments, and roles can boost the speed and likelihood of innovation while mitigating information asymmetries and co-specialization risks in modular and ecosystem settings [10,11,12]. Enhancing collaboration and information sharing increases innovation, agility, and value co-creation, and the conversion of external knowledge into outcomes relies on absorptive capacity and environmental uncertainty [13,14,15,16]. Research on supply chains based on empirical evidence reveals that a match between governance and task is associated with collaborative arrangements that enhance resilience and competitive advantage [17,18,19,20,21,22]. Samsung Electronics and SK Hynix are the major players that drive the global HBM industry and reflect the two extreme cases of the integration spectrum in industry discussions [2,23,24,25,26].
Samsung Electronics is frequently viewed as focusing on vertical integration, which strengthens the link between memory, fabrication, and advanced packaging. This method may aid in closed-loop process learning, rapid experimentation, enhanced intellectual property protection, and improved schedule control. On the contrary, SK Hynix is frequently portrayed as prioritizing collaboration with foundries, equipment manufacturers, packaging firms, and main customers to enhance reliability of yield and delivery stability, as well as average selling prices and product fit and mix through information sharing and co-design [8,9,12,13]. No previous research has examined the relationship between these distinct orientations and how they are reflected in market-implied valuation. This research centers on Samsung Electronics and SK Hynix. We quantify the industry narrative linking Samsung to vertical integration and SK Hynix to horizontal alliances and compare how these orientations correspond to market-implied valuations following the start of the generative AI era. Accordingly, we have two research questions, as follows:
RQ1. During the generative AI upcycle (2023–2025), is news-based vertical integration topic intensity associated with higher market-implied valuation for Samsung Electronics?
RQ2. During the generative AI upcycle (2023–2025), is news-based horizontal-alliance topic intensity associated with higher market-implied valuation for SK Hynix?
Capital markets are forward-looking and value these strategic decisions based on expectations about future cash flow. Equity values reflect a manufacturer’s beliefs about how their integration architecture will impact product fit, yield performance over time, delivery reliability, average selling prices and product mix, and ultimately cash generation. Investors’ beliefs change in response to public narratives, and news articles provide firms’ discernible indicators underlying orientations and supply chain vulnerabilities that can be related to stock-price responses and valuation using traditional event-study methods and regression analysis [18,27]. We used news articles about Samsung’s and SK Hynix’s HBM activities and applied probabilistic topic modeling to identify two latent topics related to vertical integration and horizontal alliances. Topic quality is stabilized, and label drift is reduced using seed vocabularies with contextual expansion [28]. We calculate firm-month topic intensities, which provide a summary of the relative importance of integration orientations within public discourse. We then estimate ordinary least squares (OLS) regressions to examine correlations between these topic-based measures and stock prices. We specifically run time-series OLS for each company and compare the coefficients of vertical integration topics for Samsung with those of horizontal alliance topics for SK Hynix. By doing so, this research contributes to literature in four ways:
Measurement innovation beyond orchestration/open-collaboration studies. Prior work typically infers collaboration from internal metrics, surveys, or case studies [10,11,12,15,19,22]. We instead directly operationalize strategic integration from public, Korean-language news at the topic level (vertical-integration; horizontal-alliance), construct firm-time topic-intensity series that are distinct from generic sentiment.
Linking text signals to market-implied valuation. Building on text-based supply chain signals [18] and the financial event-study tradition [27], we connect these topic intensities to market-implied valuation with firm-specific specifications, providing a scalable, market-focused framework for strategic-architecture research.
Context and replicability. We situate the analysis in the HBM ecosystem during the generative AI upcycle (2023–2025) and enhance replicability by documenting the seed lexicons and contextual expansion rules used in topic construction [28].
Within archetype pricing heterogeneity. Beyond the vertical vs. horizontal dichotomy, we disentangle which sub-motifs are actually priced: for Samsung, consolidation-oriented vertical show positive associations with market-implied valuation, whereas operational/supplier-enablement vertical topics do not load reliably; for SK Hynix, vendor-assisted scale-up and joint development are positively associated with valuation. This clarifies which governance mechanisms capital markets reward during the generative AI upcycle.
HBM has become a strategic asset in the generative AI era. The disparities between horizontal alliances and vertical internalization are likely to result in discrepancies in market-implied valuation due to their impact on product compatibility, production efficiency, and on-time delivery performance. This study combines topic-modeled integration signals from news articles with stock price data to identify how different integration designs affect stock valuation and measure the economic value of integration decisions from a technology management viewpoint.
The remainder of this paper proceeds as follows. We first review prior work on integration architecture in the HBM ecosystem and state our research questions for the 2023–2025 generative AI phase. We then describe the data and methods, including how we construct news-based topic intensities and define variables. Next, we report empirical results, followed by a discussion that links the findings to governance, orchestration, and modularity literature while outlining practical implications. We conclude with industry-oriented guidance and avenues for future research.

2. Literature Review

2.1. Vertical Integration Versus Horizontal Alliances

Firms internalize some interfaces while forming alliances on others. The traditional answer begins with transaction and coordination hazards. Original insight linked firm boundaries to the relative costs of organizing via markets versus hierarchies [26]. Further research demonstrated that asset specificity, switching costs, and measurement difficulties strengthen the argument in favor of vertical integration, as illustrated by the findings of Monteverde and Teece [29] in the automotive industry and the boundary of the firm synthesis by Hennart [30]. According to the complementary capabilities perspective, integration is beneficial when tight coupling allows for superior learning and recombination of interconnected processes [31]. Substantial-sample analyses show that transaction risks and firm assets influence organizational performance [32]. This research accumulates previous work by integrating these logics to show that both capabilities and contractual hazards jointly influence governance, and that misalignment incurs significant costs [33]. This is a contingent design problem rather than a one-size rule [29,30,31,33,34,35].
Vertical integration can shorten feedback loops at unstable, interconnected systems, decrease negotiation difficulties between multiple parties, and safeguard secretly held operational expertise. Learning curves are more beneficial when steep and specific to a particular company, along with rapid changes in product specifications and significant interface delays or decreased quality resulting from coordination failures [9,29,31,35]. The literature also links product complexity to a shift toward internalization in settings with complex architectures, as coordination costs and error propagation increase with interdependence [36]. Firms located near critical interfaces, such as memory to advanced packaging in HBM systems, may benefit from incorporating those interfaces into their operations when tight coupling speeds allow learning and schedule management.
Formal contracts and relational mechanisms are complementary, rather than interchangeable, elements in various alliance settings [37]. Alliances provide access to shared risk, specialized expertise, and quicker knowledge dissemination via customer and equipment platforms [38,39]. Governance is important in many alliance settings [37]. Despite diminishing returns and composition effects, firms that align their alliance breadth and depth with their strategic focus typically outperform at the portfolio level [40]. Research indicates that well-managed partner networks can achieve quicker product qualification and a better customer match than relying solely on in-house development, provided under conditions of high uncertainty and rapid changes in product specification, assuming the core company has the flexibility and ability to absorb and integrate new knowledge [35].
The architecture of a system affects its governance. Higher modularity allows components to be externally sourced without incurring prohibitive coordination costs, while tightly connected subsystems promote integration [41]. Even modular systems require integrators to “know more than they make,” as architectural knowledge extends beyond component boundaries [42]. This explains why some companies integrate around bottlenecks while others form alliances around more standardized sectors. In ecosystems, bottleneck location and complementary assets distribution indicate whether a vertical or horizontal stance captures more value at a given moment in time [41,42].
These contingencies map naturally to HBM. In cases where packaging-memory interfaces are unstable and yield-critical, a vertical approach can reduce the loop between design tweak, process data, and re-qualification, preserving tacit know-how and lowering lead times [35,36]. When customer co-design, equipment qualification, and supply assurance rely on different partner resources, a horizontal approach can utilize partner specialization and alliance portfolios to stabilize delivery and align with customer roadmaps more rapidly [37,39,40]. The key takeaway is not that one form is superior, but rather that the alignment between governance and architecture/task determines performance, which also influences how capital markets value firms that specialize vertically versus horizontally in the HBM stack.

2.2. HBM in the Era of Generative AI

The resurgence of the “memory wall” in the generative AI era is not coincidental, but structural. Previous research documented the widening processor–memory gap and its system-level implications [43], whereas modern architecture texts formalize locality, how bandwidth, and interconnect constraints dominate end-to-end throughput as models scale [44]. In this scenario, HBM is best viewed as a system asset rather than a replaceable component. Its value depends on wide I/O, 3D stacking, and extremely short interconnects, but also on how well adjacent modules, such as accelerator logic, advanced packaging, substrates, and interposers, are co-optimized [44]. The shift to chiplets and high-density 3D integration further raises the returns to such co-optimization, with direct implications for yield learning, thermal envelopes, and delivery reliability across the value chain [7,44].
Because these performance and reliability outcomes are mediated across multiple firms, HBM ramp quality is fundamentally an ecosystem coordination issue. Recent strategy research describes this as architecting participation: aligning roles, incentives, and complementarities among interdependent actors so that bottlenecks do not simply migrate elsewhere in the stack [45,46]. The firm’s ability to reconfigure assets and processes as technologies and partners change determines whether integration decisions result in speed and fit [35]. At the limit, absorptive capacity influences how external knowledge is recognized and converted into operational routines that affect qualification speed and supply stability [47]. Industrial evidence connects governance–task fit to resilience: cross-company coordination and trusting information sharing stabilize deliveries, improve qualification, and reduce performance variance when shocks occur [17,19,20,22].
In this environment, industry narratives frequently place Samsung Electronics and SK Hynix at different points on the integration scale. Samsung is frequently portrayed as favoring vertical integration, which tightens the interface between memory, advanced packaging, and fabrication to enable closed-loop process learning, shorter internal development cycles, secure intellectual property, and allows more control over project timelines. This position aligns with contexts in which critical interfaces are volatile, allowing the firm to capture rents by internalizing these coordination costs [45,46]. On the contrary, SK Hynix is known as co-developing horizontal collaboration, like co-developing products with foundries, equipment manufacturers, packaging houses, and core customers, sharing information for joint debugging, and utilizing customer co-design to adjust product composition and fit. The theory suggests that this posture will be successful if the firm’s capabilities are supplemented by external sources and the partner network facilitates the spread and adaptation of new information under uncertain conditions, as long as the firm can effectively absorb and utilize external knowledge [45,46,47].
These postures suggest different technical routes to achieving HBM ramp success. A more vertically integrated architecture can potentially compress feedback cycles at sensitive interfaces, thereby enhancing yield learning and schedule adherence through tighter process control. Conversely, a more horizontally aligned architecture can leverage partner specialization to improve alignment with customer roadmaps, reduce qualification time, and enhance delivery reliability, particularly when ecosystem tools and standards lower coordination costs [17,20,22,45,46]. The key outcomes to consider, such as yield trajectories, thermal stability, and on-time delivery, are the very ones that capital markets pay close attention to when forecasting cash conversion in HBM-centric systems.
Comparing Samsung’s vertical integration narrative with SK Hynix’s horizontal integration narrative goes beyond descriptive analysis. It establishes testable predictions about the relationship between public narratives and market-assessed value in the context of large-scale generative AI development. We should expect stronger valuation responses to vertical integration indicators in Samsung-related news if markets believe that internalizing the supply chain will yield greater short-term returns and tighter production control in today’s complex packaging environment. Conversely, under conditions of rapid product-definition change, markets anticipating that partner specialization and customer co-design will dominate should place greater emphasis on horizontal-alliance signals in SK Hynix news. No matter the approach, the existing literature suggests that HBM is the point where interface design and ecosystem governance intersect, allowing firm-level integration decisions to be transparent in a quantifiable manner reflected in text and ultimately valued in the stock market [45,46,47].

2.3. From Strategic Integration to Stock Valuation

Narratives influencing public opinion have a quantifiable impact on pricing. Research in asset-pricing and information-intermediation indicates that a media’s coverage, tone, and attention level influence investors’ perceptions of a firm significantly and the rate at which they incorporate firm-specific news into their valuation of the company, especially when arbitrage is restricted. Media pessimism and finance-specific dictionaries forecast returns and volume, while broader attention proxies also predict price pressure and reversals [48,49,50]. The intensity of coverage is thus incorporated into pricing, consistent with information-friction and investor-recognition effects [49]. At the same time, event-study methods demonstrate how individual disclosures are absorbed into prices during defined announcement windows [48], and operations–finance research links supply chain news—such as disruptions or coordination failures—to long-term performance and equity risk, suggesting that the market treats operational reliability as a key determinant of cash flow [51]. Recent work in text analytics further supports this view, showing that news-based indicators of interfirm coordination and risk are strongly associated with abnormal returns, thereby validating public text as an informative signal of future fundamental values [18].
Research on integration architecture, corporate strategy, and finance further suggests that governance changes with clear implications for cash flow are incorporated into market pricing. Vertical integration and mergers tend to generate positive announcement effects when they credibly reduce transaction risk, protect intellectual property, or shorten production cycles in complex systems [52]; the magnitude of these effects depends on the location of primary constraints and complementary assets [35,36,41]. Studies on horizontal alliances similarly show that well-managed partnerships create shareholder value upon announcement, particularly when partners bring unique competencies and when contractual ties are reinforced by relational governance [53]. Together, these studies indicate a testable relationship within the HBM context: if news articles display persistent vertical integration signals (e.g., tight interface control) for Samsung Electronics and horizontal collaboration signals (e.g., partner specialization and co-design) for SK Hynix, then the respective topic intensities should correspond to firm-specific patterns in market-implied valuation [27,28].
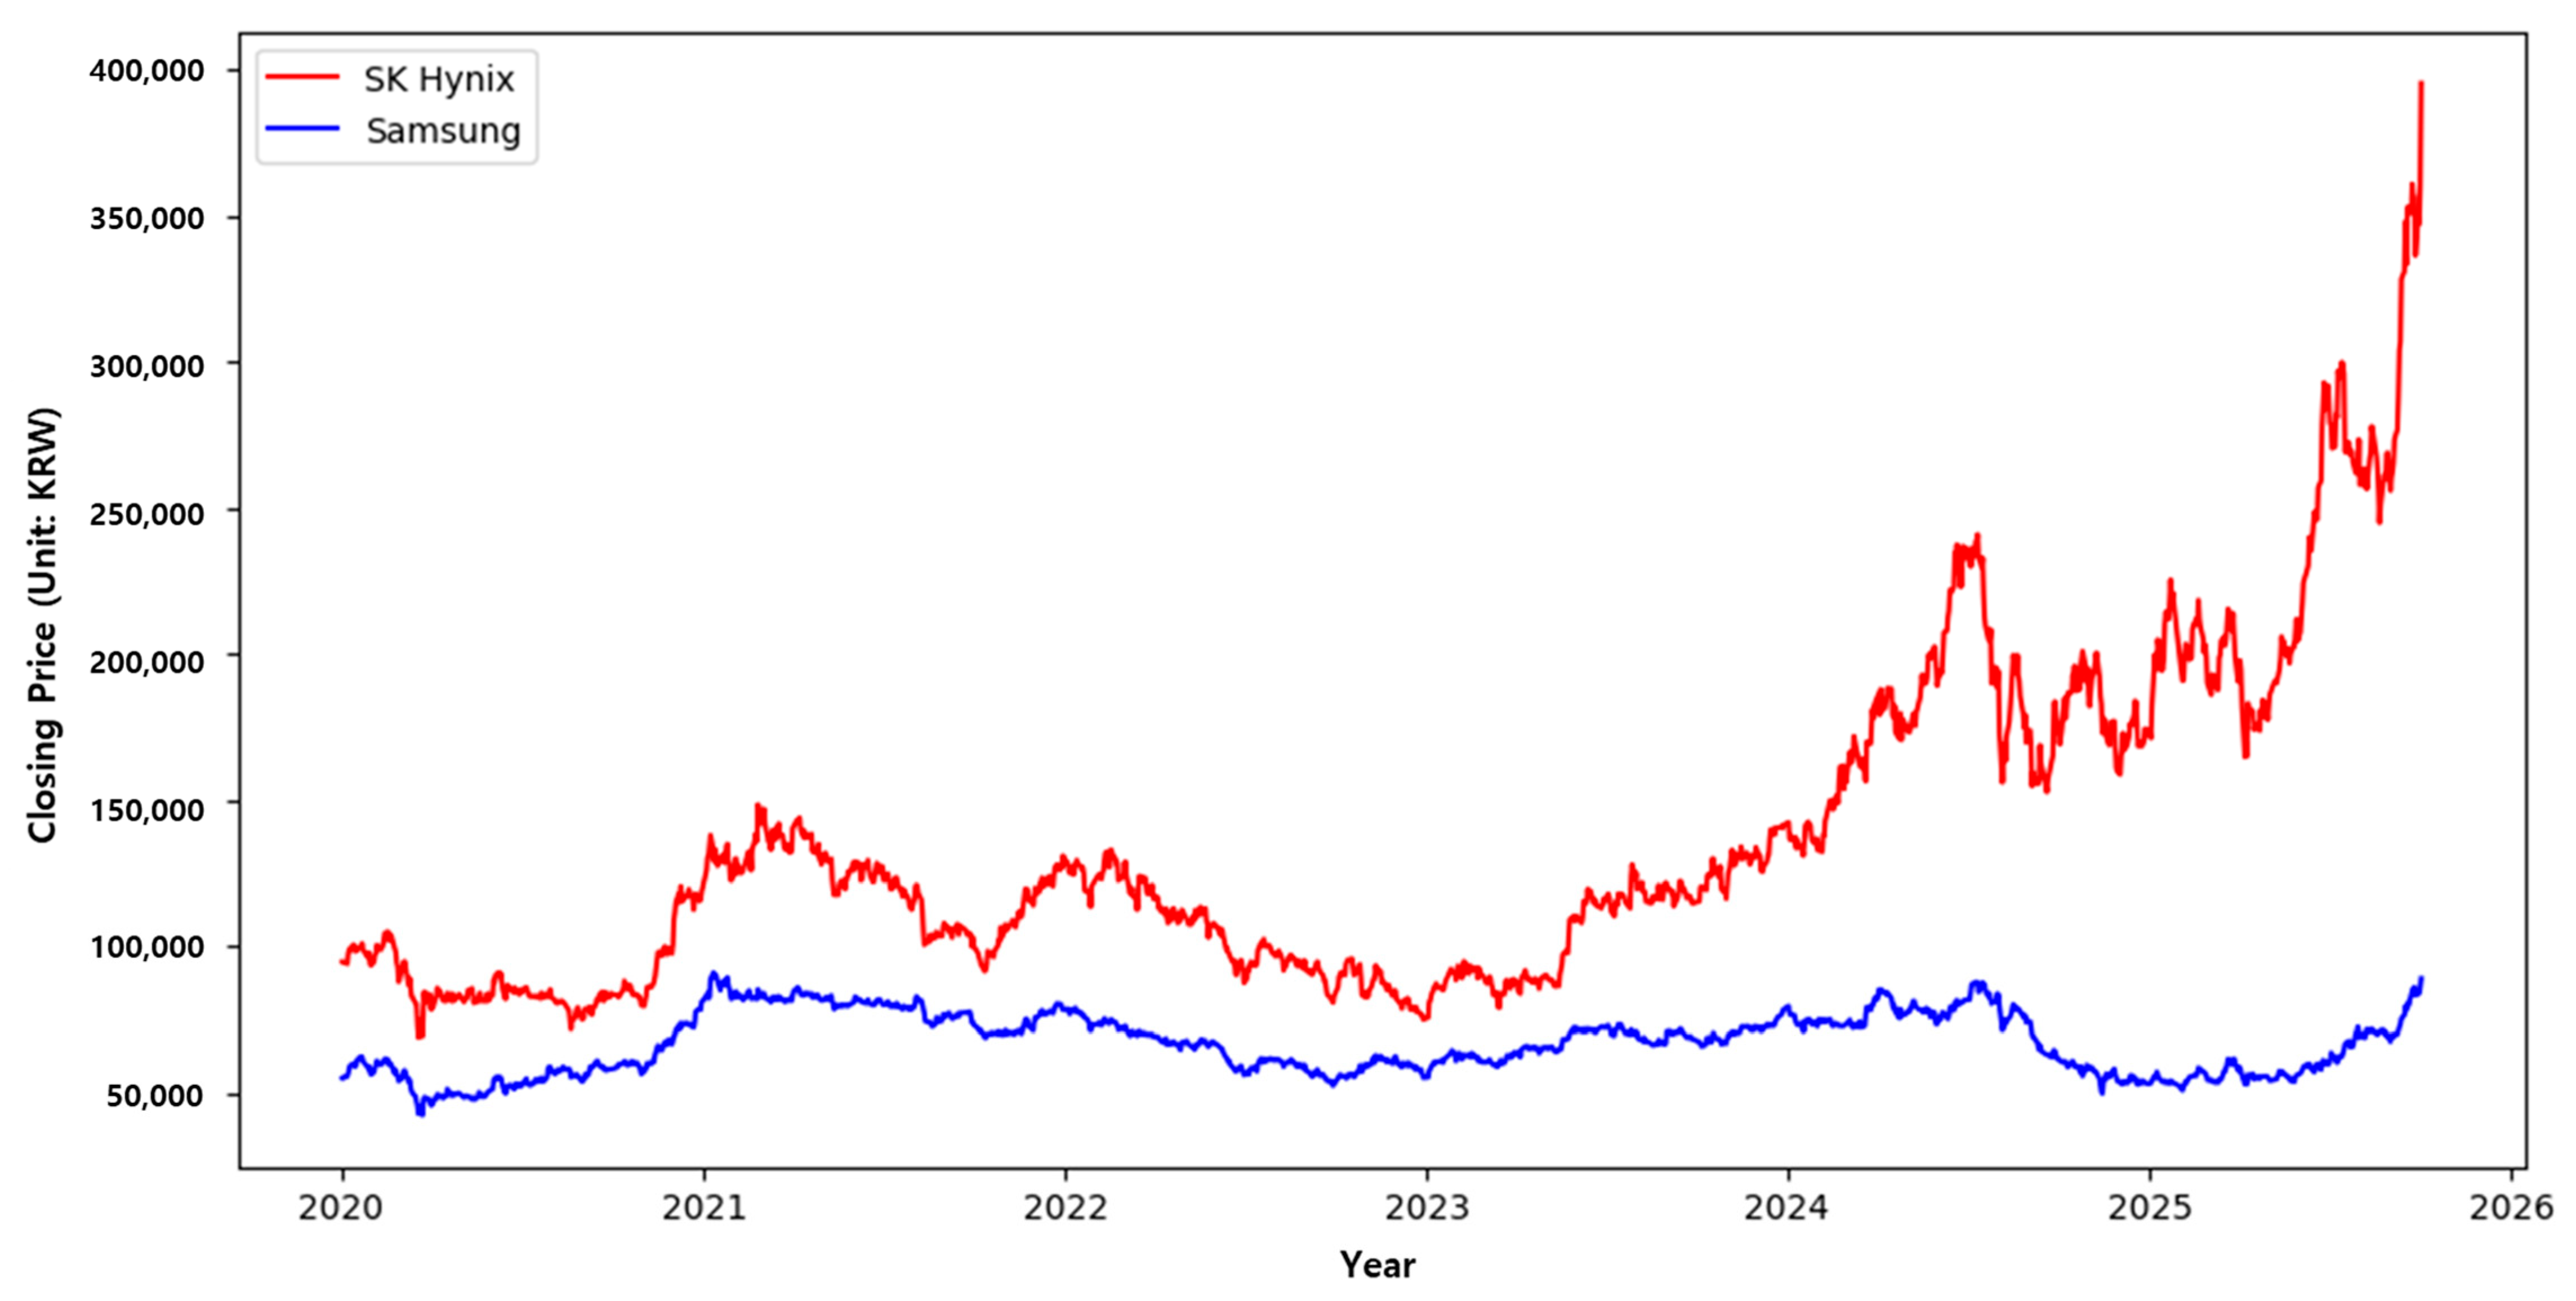
It is evident from the trend observations. Figure 1 shows that interest in HBM stayed relatively stable from 2021 to 2022, with only moderate fluctuations; it then began to increase in 2023. Attention to ChatGPT 4o increases gradually from the beginning of 2023 to 2024–2025, with multiple notable peaks. Starting in mid-2023, the HBM series rises and reaches distinct peaks that correspond to significant increases in ChatGPT’s usage. We do not deem this causal, but the correlation after 2023 supports the interpretation that large models’ widespread use, raised memory bandwidth, and advanced packaging constraints have increased the HBM importance within the broader AI context. Figure 2 shows the closing prices for SK Hynix and Samsung Electronics. SK Hynix prices significantly increased from 2023 through 2025, with incremental improvements that correspond to the periods of increased ChatGPT focus in Figure 1. In comparison to the same period, Samsung’s path is less pronounced, with a more subdued recovery in late 2025. This divergence is consistent with the industry narrative: SK hynix is closer to a horizontally organized, customer-facing HBM supply, where public AI momentum can be more directly expressed in terms of orders and pricing power, while Samsung’s vertically integrated approach focuses on process control and gains of cycle-time, which are less closely related to public attention shocks.

3. Methods

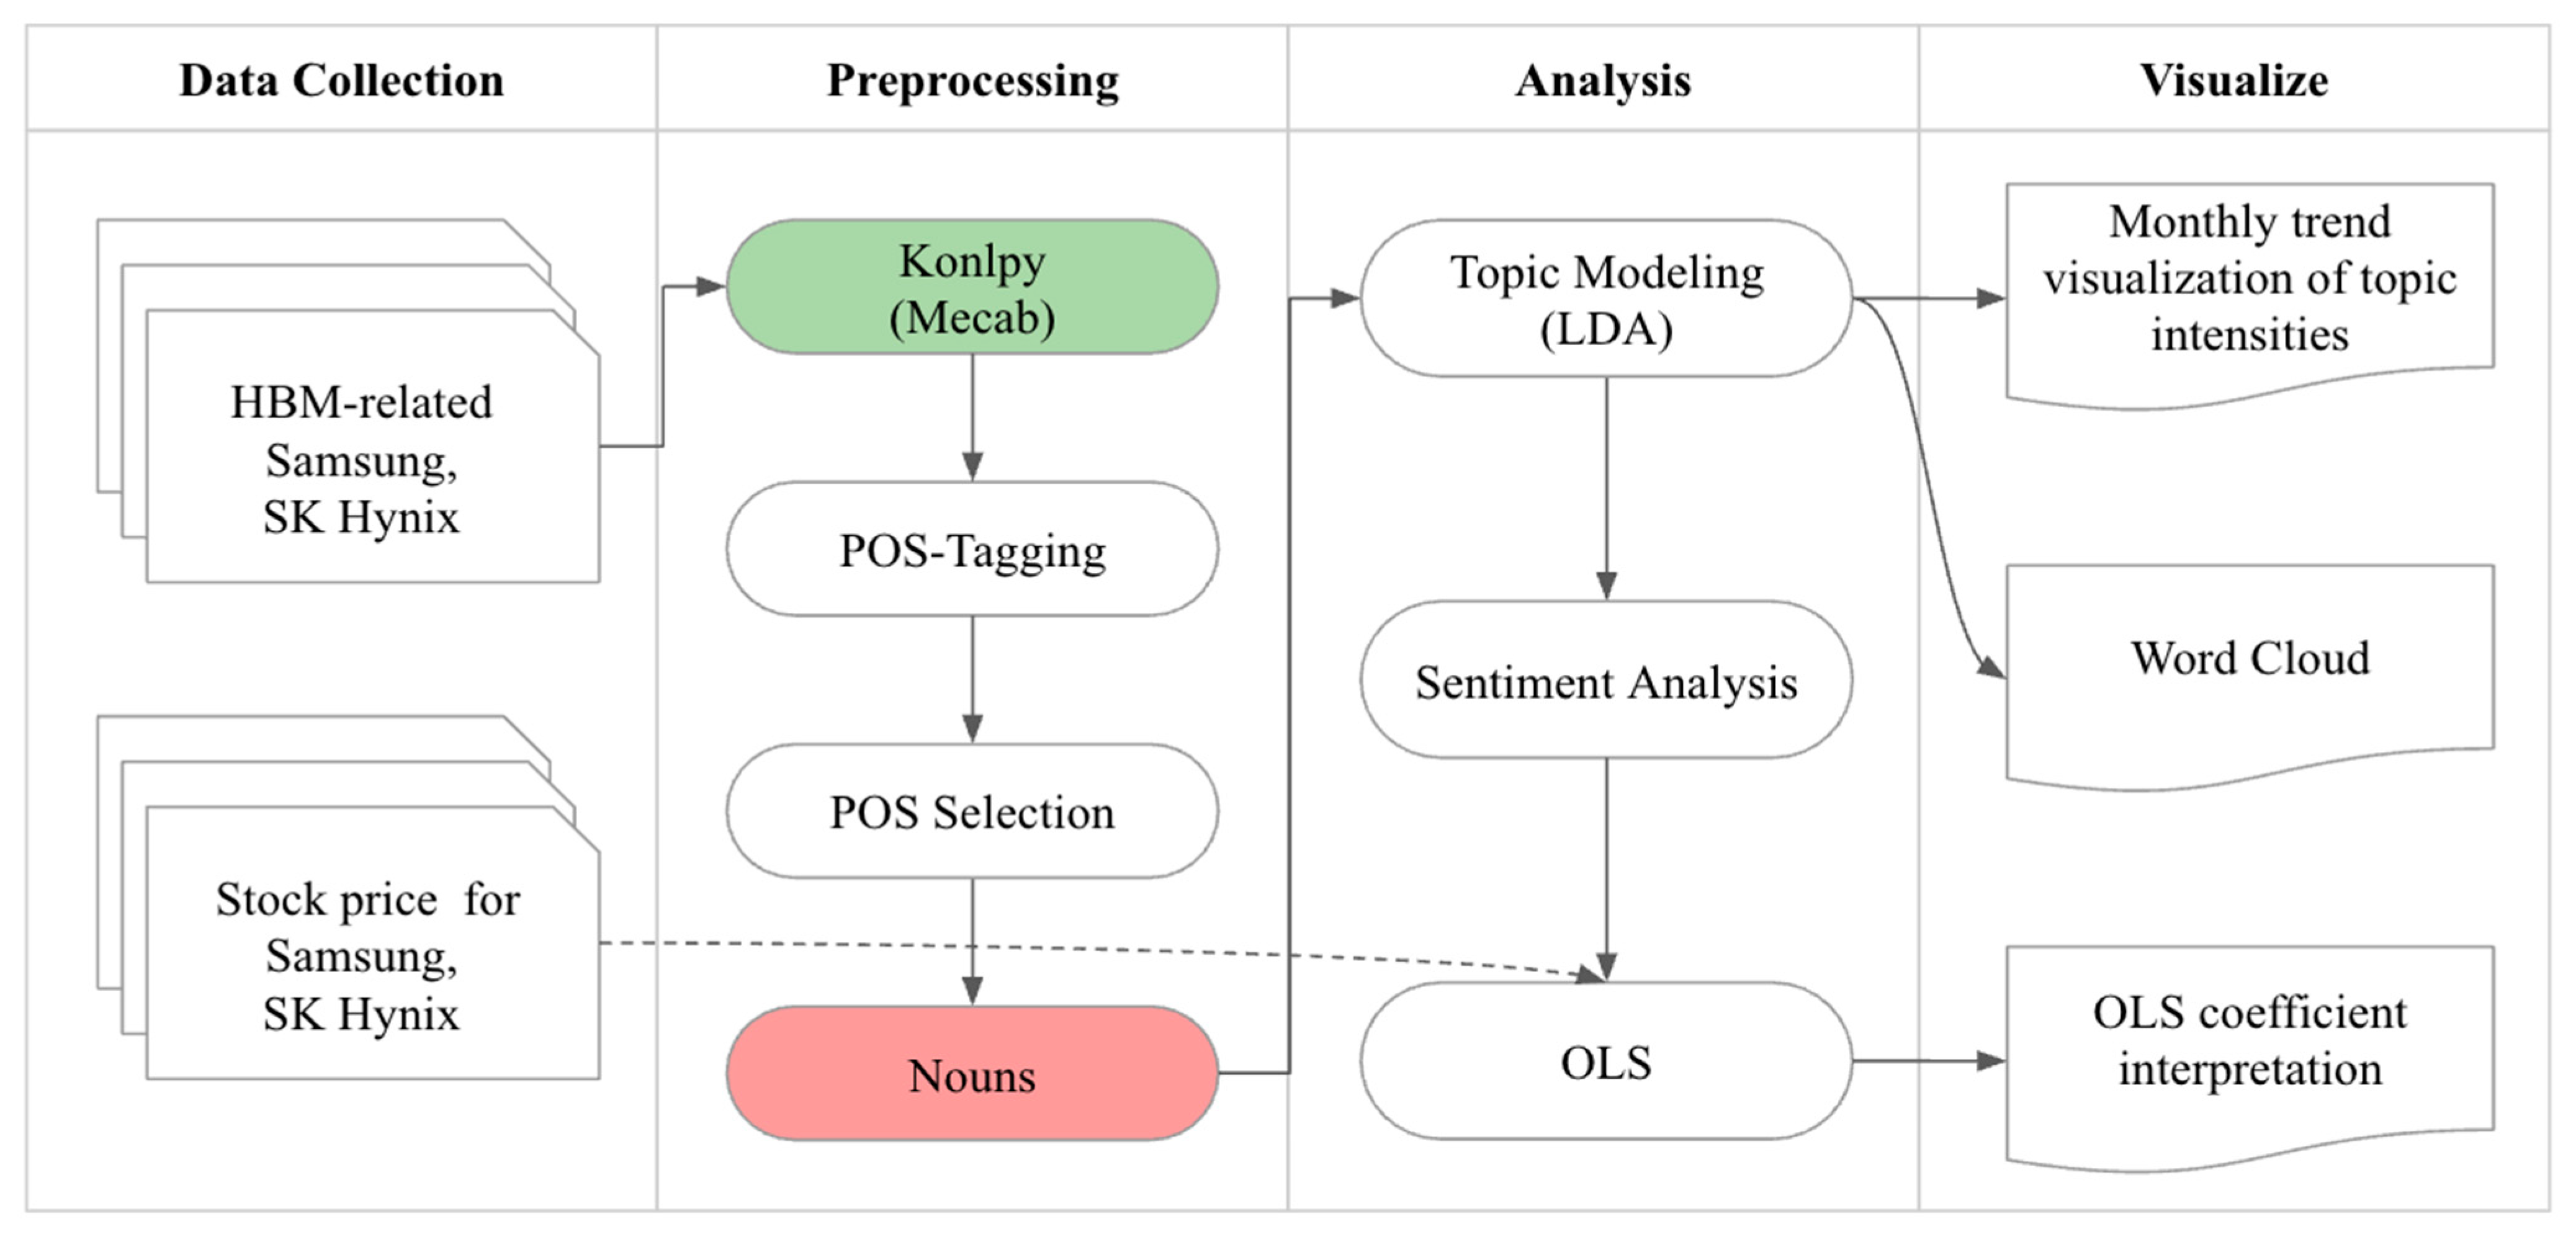
Our objective is to quantify firm-specific associations between news-derived strategic integration orientations and market-implied valuation in the HBM ecosystem during the 2023–2025 generative AI phase. The central research problem is whether topic-level signals constructed from Korean-language news co-move with monthly valuation measures for each firm after standard controls. Concretely, we tried to investigate whether vertical-integration topic intensity is associated with higher valuation for Samsung Electronics and whether horizontal-alliance topic intensity is associated with higher valuation for SK Hynix. We operationalize firms’ strategic integration orientations through a multi-stage text-mining framework combining linguistic preprocessing, probabilistic topic modelling, and supervised sentiment classification. We first construct a firm-tagged corpus of HBM-related news articles for Samsung Electronics and SK Hynix and preprocess the texts using morphological parsing with Mecab, followed by part-of-speech filtering to retain analytically salient noun tokens. Topic modelling is conducted using Latent Dirichlet Allocation (LDA), where the optimal number of topics is selected by jointly evaluating coherence and perplexity and identifying the elbow point. For each document, the posterior topic distribution is computed and the dominant topic—defined as the topic with the highest posterior probability—is assigned. Firm–monthly topic intensities are then derived by aggregating the relative frequencies of dominant topics within each firm–month group, followed by standardization to ensure comparability across topics and time. To verify that topic intensities do not proxy for generic tone, we benchmark several sentiment-classification techniques, including traditional machine-learning models (Random Forest, Support Vector Machine, Naïve Bayes) and Korean pretrained transformer models (KoRoBERTa, KoElectra), using a balanced subset of the corpus. The monthly topic-intensity series extracted from this pipeline form the firm-specific integration signals—vertical integration for Samsung Electronics and horizontal alliances for SK Hynix—which are subsequently incorporated as key explanatory variables in the OLS valuation analysis. Figure 3 shows the general research algorithm used in this study.

3.1. Data Collection and Preprocessing

We compiled a firm-tagged news corpus on Samsung Electronics and SK Hynix, examining HBM activity from January 2023 to September 2025. Articles were sourced from major Korean business and technology news sites using an HBM keyword seed combined with company identifiers. We removed non-news content, de-duplicated nearly identical wire copies, stripped boilerplate (headers, footers, legal text), and normalized punctuation, dates, and numbers. Language remained Korean, and tokenization used a sub-word tokenizer that was consistent with the downstream classifiers. For the topic-modeling pipeline, we created features on the document-level and metadata (firm, outlet, date) and used the cleaned text to estimate the vertical-integration and horizontal-alliance topics. We balanced class counts for the sentiment classifier used to build firm-level tone sets by randomly undersampling the majority class to 50:50 (positive vs. negative). We stratified under-sampling by firm and month to keep temporal composition and avoid drift [54,55]. Note that during the preparation of this paper, we used ChatGPT-4o from Open AI and Trinka (Version 0.2.94) from Enago to paraphrase sentences, enhance readability, and correct grammatical errors.

3.2. Model Performance

To improve transparency regarding corpus construction, we explicitly document the keyword rules used in retrieving HBM-related articles (see Table 1). Because HBM is a proper noun, we adopted a strict co-occurrence rule based on any expression containing the term HBM and a firm identifier. In addition, the HBM seed vocabulary was expanded beyond the core term itself to incorporate process and technology-related terminology frequently used in the semiconductor domain, such as foundry, packaging, TSV, interposer, chiplet, and advanced packaging, to capture broader HBM-related discourse.
Firm identifiers were defined through concise dictionaries reflecting both official names and commonly used variants (see Table 2). Samsung Electronics was identified through Samsung Electronics, Samsung, and SEC, while SK Hynix was identified using SK Hynix, Hynix, and SK. A document was assigned to a firm when at least one HBM-related expression and one of the firm’s identifiers appeared together, ensuring accurate firm-level tagging and preventing cross-contamination between the two companies.
We benchmarked sentiment classifiers for HBM-related news from Korean news articles before locking the pipeline, labelling it as positive or negative for firm prospects between January 2023 and September 2025. The objective is to create a tone series for each firm, which corresponds with the integration-topic intensities utilized in the OLS tests. The models evaluated comprised traditional machine-learning benchmarks (i.e., Random Forest, Support Vector Machine, Naïve Bayes) and Korean pre-trained transformer models (i.e., KoRoBERTa, KoElectra). All models were implemented in Python 3.12.12 and executed on Google Colab Pro (https://colab.research.google.com) using an A100 GPU. Classical machine-learning models were built with scikit-learn 1.6.1, and transformer-based models were fine-tuned using the Hugging Face Transformers 4.57.1 library. To ensure comparability across models, we adopted a unified experimental framework consisting of identical preprocessing and training procedures, including a 70:30 train–test split stratified by firm and month, consistent sentence segmentation, TF–IDF vectorization for classical models, and model-specific subword tokenizers for transformer models. Transformer models were fine-tuned for 5 epochs with a batch size of 16, a learning rate of 5 × 10⁻⁵, and a maximum sequence length of 160 tokens. A consistent threshold of 0.5 was applied for all positive-class predictions. Next, we monitored accuracy, precision, recall, F1, and AUC metrics, as summarized in Table 3, and verified model stability through random-seed control and class-balance checks to ensure that observed performance differences reflected genuine model capabilities rather than sampling artifacts.
KoElectra received the highest scores overall, with an accuracy of 0.9965, precision 0.9965, recall 0.9965, F1 0.9965, AUC 0.9997, indicating the best performance. KoRoBERTa trailed closely behind with an accuracy of 0.9564 and AUC 0.9851, producing consistently lower but still high results than KoElectra. The non-neural baselines produced the following findings: the top performer was a support vector machine with an accuracy of 0.9555 and an AUC of 0.9873, random forest and naïve bayes followed closely, with AUC scores of 0.9500 and 0.9335, respectively. Inspection of errors showed that transformer errors were most common in headlines with excessive sarcasm or domain-specific jargon inversions, whereas classical models struggled with long-range context and negation. Verification of class-balance checks verified that label imbalance did not affect the results; we also confirmed stability with k-fold cross-validation and found negligible variance in KoElectra’s metrics.
According to the benchmark results, we use KoElectra as the production sentiment classifier for the January 2023–September 2025 data set. We used the KoElectra to construct daily and monthly sentiment indices for companies. These indices confirm that integration-topic signals are not stand-ins for broad sentiment and support sensitivity analyses.
From January 2023 to September 2025, the analysis includes word clouds, t-SNE, topic keywords, and OLS, based on Korean news articles about Samsung Electronics and SK Hynix. Following firm tagging, de-duplication, boilerplate removal, and data normalization, we generate firm-specific word clouds to reveal significant lexical fields and support that Samsung’s coverage focuses on internalization and tightly integrated interfaces, while SK Hynix’s coverage centers on partner co-development, customer co-design, and information exchange. A probabilistic topic model is estimated on the cleaned corpus, guided by patterns and integrated with lexicons focused on collaboration, yielding two strategic signals from document-level posteriors: one aligned with Samsung’s narrative, which represents vertical integration, and the other aligned with SK Hynix’s narrative, which represents a horizontal alliance.
Topic intensity series are created by grouping posterior proportions by firm and month [56]. The number of topics K in the LDA model was optimized by jointly evaluating coherence and perplexity scores and selecting the elbow point at which additional topics yielded diminishing improvements in both metrics. After determining the optimal K , the model produced a posterior topic distribution for each document,
θ d = ( θ d 1 , θ d 2 , , θ d K )
from which we assigned each article a dominant topic, defined as the topic with the highest posterior probability. Each document was then tagged to a firm (Samsung or SK Hynix) and to its corresponding month based on publication date. For each firm f and month m , we aggregated the dominant-topic labels of all documents in the set D f , m . The firm–monthly topic intensity for topic k is therefore defined as:
I f , m , k = Number   of   documents   whose   dominant   topic   is   k   in   D f , m D f , m
This measure reflects the proportion of news coverage in month m that emphasizes topic k for firm f . To ensure comparability across topics and months, all intensity series were standardized using z-score normalization. The resulting monthly topic-intensity series form the basis of the vertical-integration signal for Samsung and the horizontal-alliance signal for SK Hynix, which are subsequently used as the key explanatory variables in the OLS valuation tests.
To verify qualitative separability, documents are embedded with a Korean transformer encoder and then projected with t-SNE; the resulting projection is only used to visually confirm that texts related to Samsung cluster around vertically integrated language, whereas texts related to SK Hynix cluster around horizontally collaborative language. The sentiment classifier used for ancillary robustness checks is trained on the same data set, where class balance is preserved through random undersampling to a 50:50 ratio of positive to negative cases, stratified by firm and month; its results are used solely to ensure that topic intensities do not serve as proxies for generic tone. We used pooled ordinary least squares to relate text-derived integration signals to market-implied valuation on a monthly basis, strictly adhering to each firm’s specified channel. Let Price i , t denote the stock price (or its log) of firm i { Samsung ,   SKHynix } in month t , and let Vert i , t and Horiz i , t be the standardized vertical-integration and horizontal-alliance intensities. The equation for the price can be expressed as
Price i , t = β 0 + β V ( Vert i , t 1 { i = Samsung } ) + β H ( Horiz i , t 1 { i = SKHynix } ) + ε i , t
Keys:
  • Price i , t = dependent price measure for firm i on day t
  • β 0 = intercept
  • β V , β H = coefficients on the vertical and horizontal terms
  • V e r t i , t = vertical-integration topic intensity for firm i on day t
  • H o r i z i , t = horizontal-alliance topic intensity for firm i on day t
  • 1 { i = S a m s u n g } = indicator equal to 1 if firm i is Samsung (0 otherwise)
  • 1 { i = S K H y n i x } = indicator equal to 1 if firm i is SK Hynix (0 otherwise)
  • ε i , t = error term
By design, Samsung loads only on the vertical signal and SK Hynix loads only on the horizontal signal. Standard errors are estimated with robustness to heteroskedasticity, and no additional controls are included, with identification remaining tied to the observed variation in the importance of strategic integration.

4. Results

4.1. Word Cloud

Word clouds provide an illustrative first-pass analysis of how each company is represented in HBM news. We utilize the cleaned Korean corpus from January 2023 to September 2025, and perform the following preprocessing steps: converting text to lowercase, removing stopwords and boilerplate, lemmatizing verbs and nouns to handle inflectional variations, and finally merging significant bi-grams to keep domain-specific phrases like “joint venture,” “in-house development,” and “technology acquisition” rather than splitting them. We also remove firm names and generic market terms to prevent unnecessary clues. The clouds for Samsung Electronics and SK hynix are separately generated to have frequency—and therefore font size—directly reflect the persistence with which related concepts appear in their vicinity.
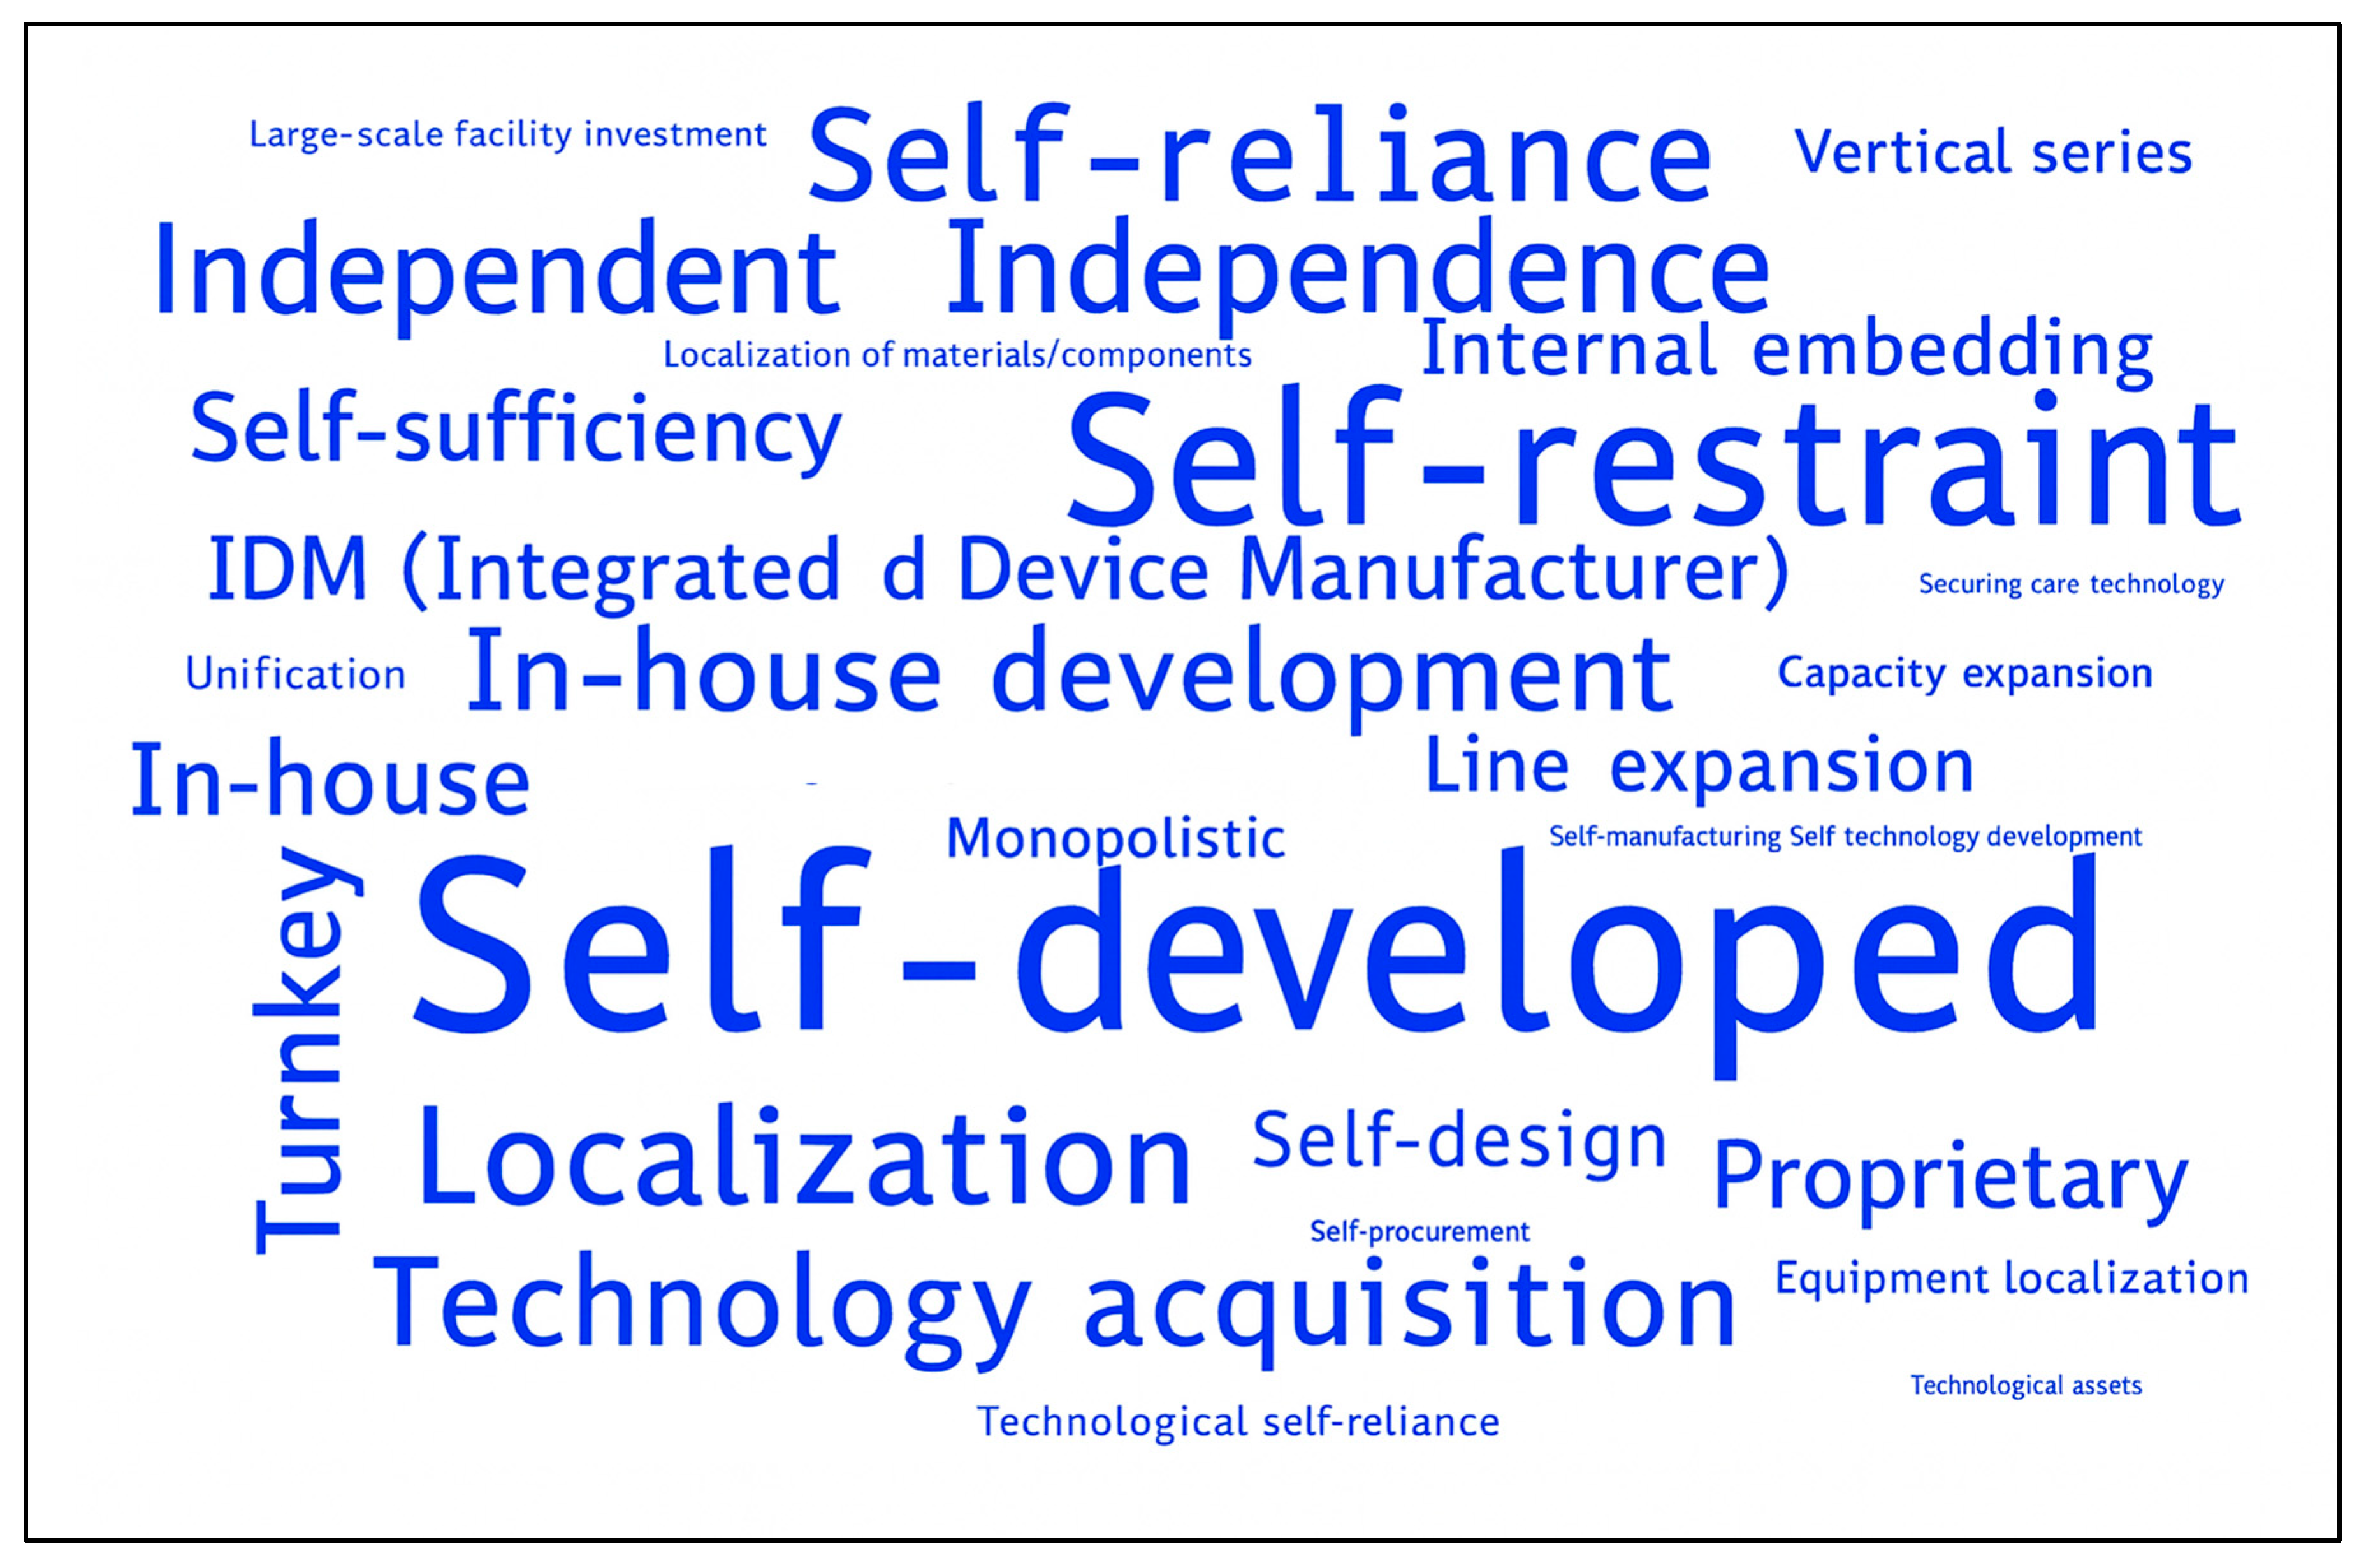
In Figure 4. A word cloud for Samsung highlights vertical integration, with key terms denoting internalization and control over interfaces, including self-developed, in-house development, technology acquisition, localization, proprietary, integrated device manufacturer, turnkey, internal embedding, and vertical integration. Self-reliance, in-house, line expansion, independence, and direct management all point to a closed-loop learning approach, accompanied by tighter integration across memory-packaging-fabs and an emphasis on owning process expertise and scheduling. The inclusion of localization terms along with self-developed and proprietary elements suggests a narrative linking internal capability development to supply reliability and accelerated iteration, characteristics typically related to a vertical business approach.
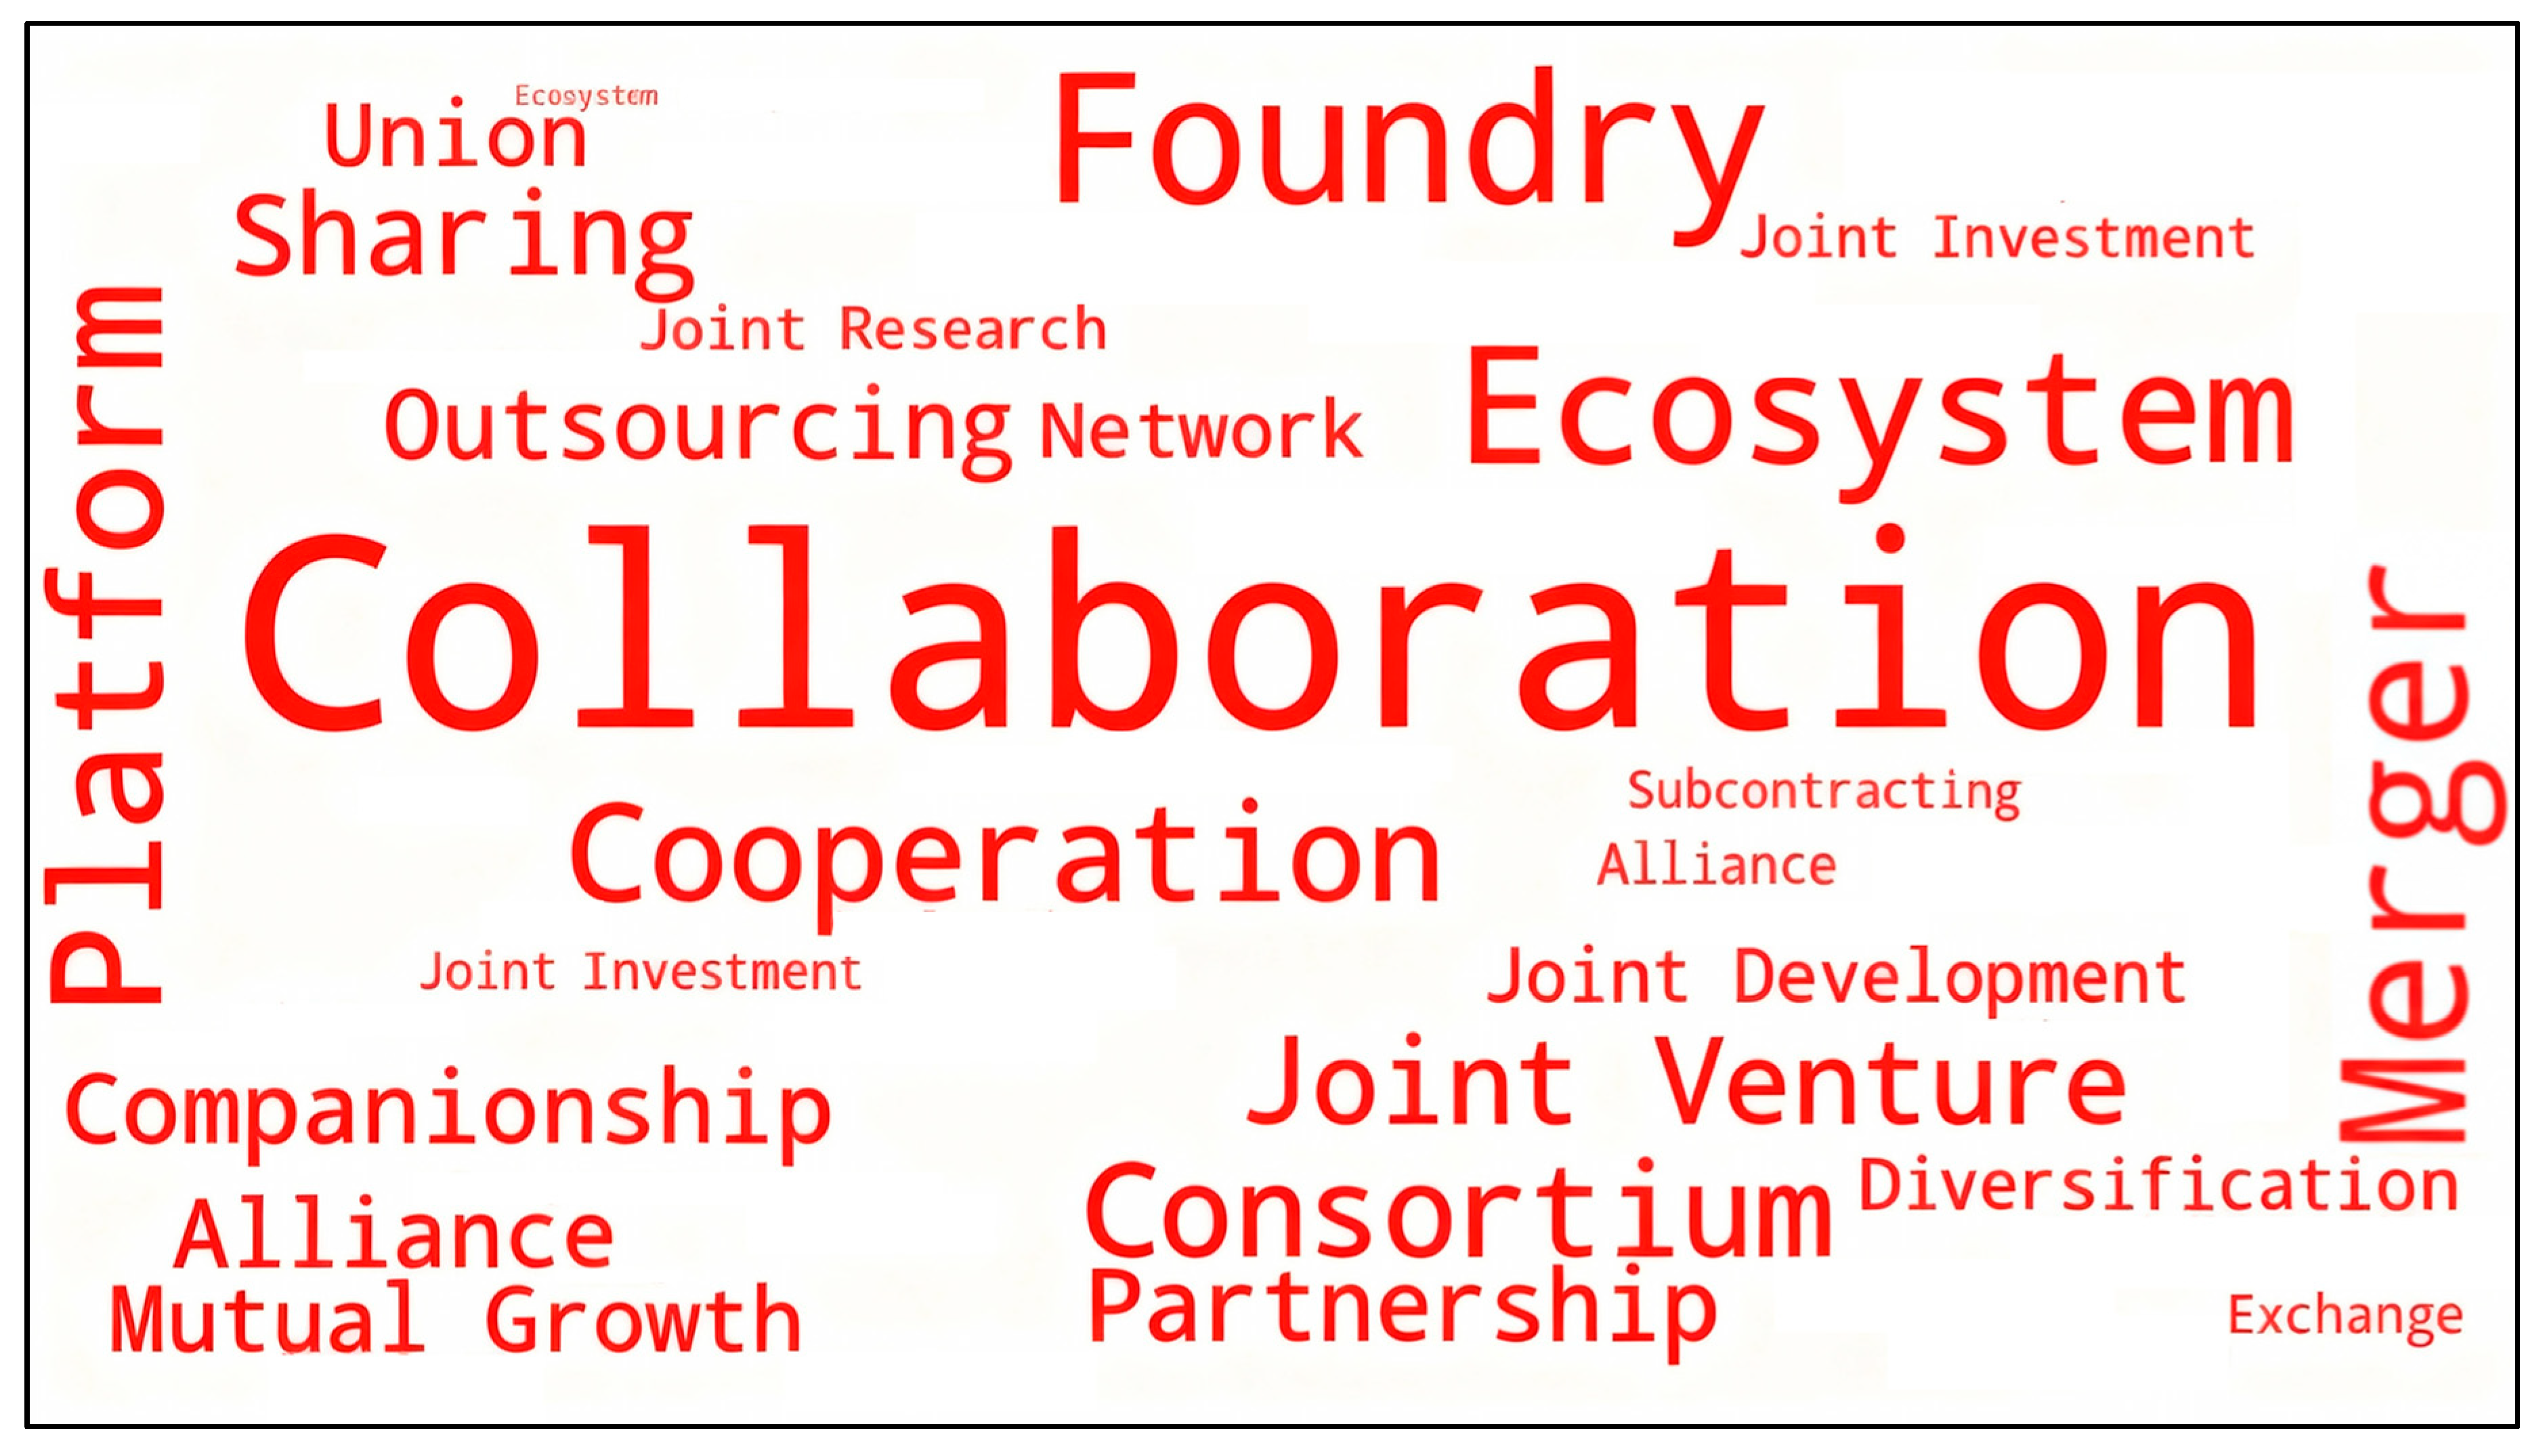
In contrast, Figure 5 Depicts a word cloud highlighting SK Hynix’s focus on horizontal integration, which includes terms like partner-facing and ecosystem language: collaboration, ecosystem, cooperation, foundry, consortium, partnership, joint venture, joint development, platform, outsourcing, mutual growth, and network sharing. The presence of foundry, joint development, and platform, in addition to consortium and partnership, indicates a pattern of collaborative design with external experts, verification using shared equipment and protocols, and diversity across the supply chain. Terms like mergers and diversification emerge, supporting a portfolio strategy in which complementary assets are obtained using partnerships instead of internal integration.
In conjunction, the two clouds act as a visual point of reference, implying that public discourse about Samsung tends to internalize, whereas public discussion of SK Hynix tends to focus on strategic partnerships. We view these clouds as exploratory diagnostics rather than as inferential evidence. The seed lexicons used in our topic model are informed by them; they help to prevent label drift and prompt the creation of monthly topic-intensity series, which are then tested against market-implied valuation in the empirical analysis that follows. By design, Samsung loads only on the vertical signal, and SK Hynix loads only on the horizontal signal. The estimation of standard errors is implemented using robustness to heteroskedasticity, without additional controls, leaving identification dependent on the observed variation in the importance of strategic integration.

4.2. Topic Modeling Results

Table 4 shows that the topic model generates a consistent vertical-integration footprint for Samsung, consisting of ten distinct but complementary thematic clusters. At the higher level of governance, autonomy and localization (Topic 1) emphasizes self-sufficiency and internal supply (autonomy, management, operations), while foundry-centric architecture (Topic 2) and integrated foundry and supply chain (Topic 3) concentrate the organizational core around the foundry-memory interface (foundry, semiconductor, network, supply). These topics work together to support make-vs-buy decisions that eventually prefer internalization and system ownership, positioning Samsung as a coordinator of design, process, and capacity similar to an integrated device manufacturer.
Moving from planning to practice, Topic 7, process control, is the most operationally complex theme. It focuses on stability and ramp across facility, packaging, process, and mass production (production, process, quality, fab/plant, packaging, facilities). The vocabulary used is in line with closed-loop learning and schedule management, as opposed to relying on external sources. In-house design enablement (Topic 10) extends this concept into the design toolchain and platform infrastructure, implying that upstream design enablement is viewed as an internal capability that influences decisions on manufacturing and packaging. These two topics represent the “through-line” of a vertically governed process from stack design to process, process to yield, and yield to volume that is managed within firm boundaries. The supplier and ecosystem references are visible, but the layout orientation is still vertical. Vertical supplier enablement (Topic 4) emphasizes co-growth, industry-academia connections, and terms related to equipment and ecosystems (equipment, test, ecosystem), but the key collocations indicate supplier qualification and enablement based on Samsung’s criteria rather than traditional arm’s-length partnerships.
Topics 8 and 9, internal partner onboarding and internal ecosystem, emphasize collaboration and openness, but only in the context of integrating partners into Samsung’s internal framework (build-out, provision, participation), which aligns with a vertically structured ecosystem instead of a horizontally connected alliance network. Contracts for control (Topic 5) and M&A and risk consolidation (Topic 6) contain numerous governance mechanisms that are consistent with vertical control. The former focuses on formalizing control over key assets and interfaces through contracting, entity setup, and joint-venture structures (contract, establishment, corporation/legal entity), whereas the latter focuses on consolidation and risk management via mergers and joint venture structures (merger, risk, strategy, strengthening). These themes, when read in conjunction with Topics 2–3 and 7, imply that legal and organizational tools are used to strengthen interface control and shorten cycle times.
The ten topics together compose a cohesive narrative structure, encompassing Samsung’s HBM stance that is characterized by internal capability development and localized control (Topic 1), a foundry-based architecture and integrated supply chain (Topics 2–3), operational ownership spanning design enablement to ramp-up and packaging (Topics 10 and 7), and governance mechanisms that synchronize suppliers and partners with internal standards (Topics 4–5, 8–9), as well as consolidating control where necessary (Topic 6). This configuration matches the “vertical empire” construct and provides the textual basis for the firm-month integration signals used in subsequent valuation assessments.
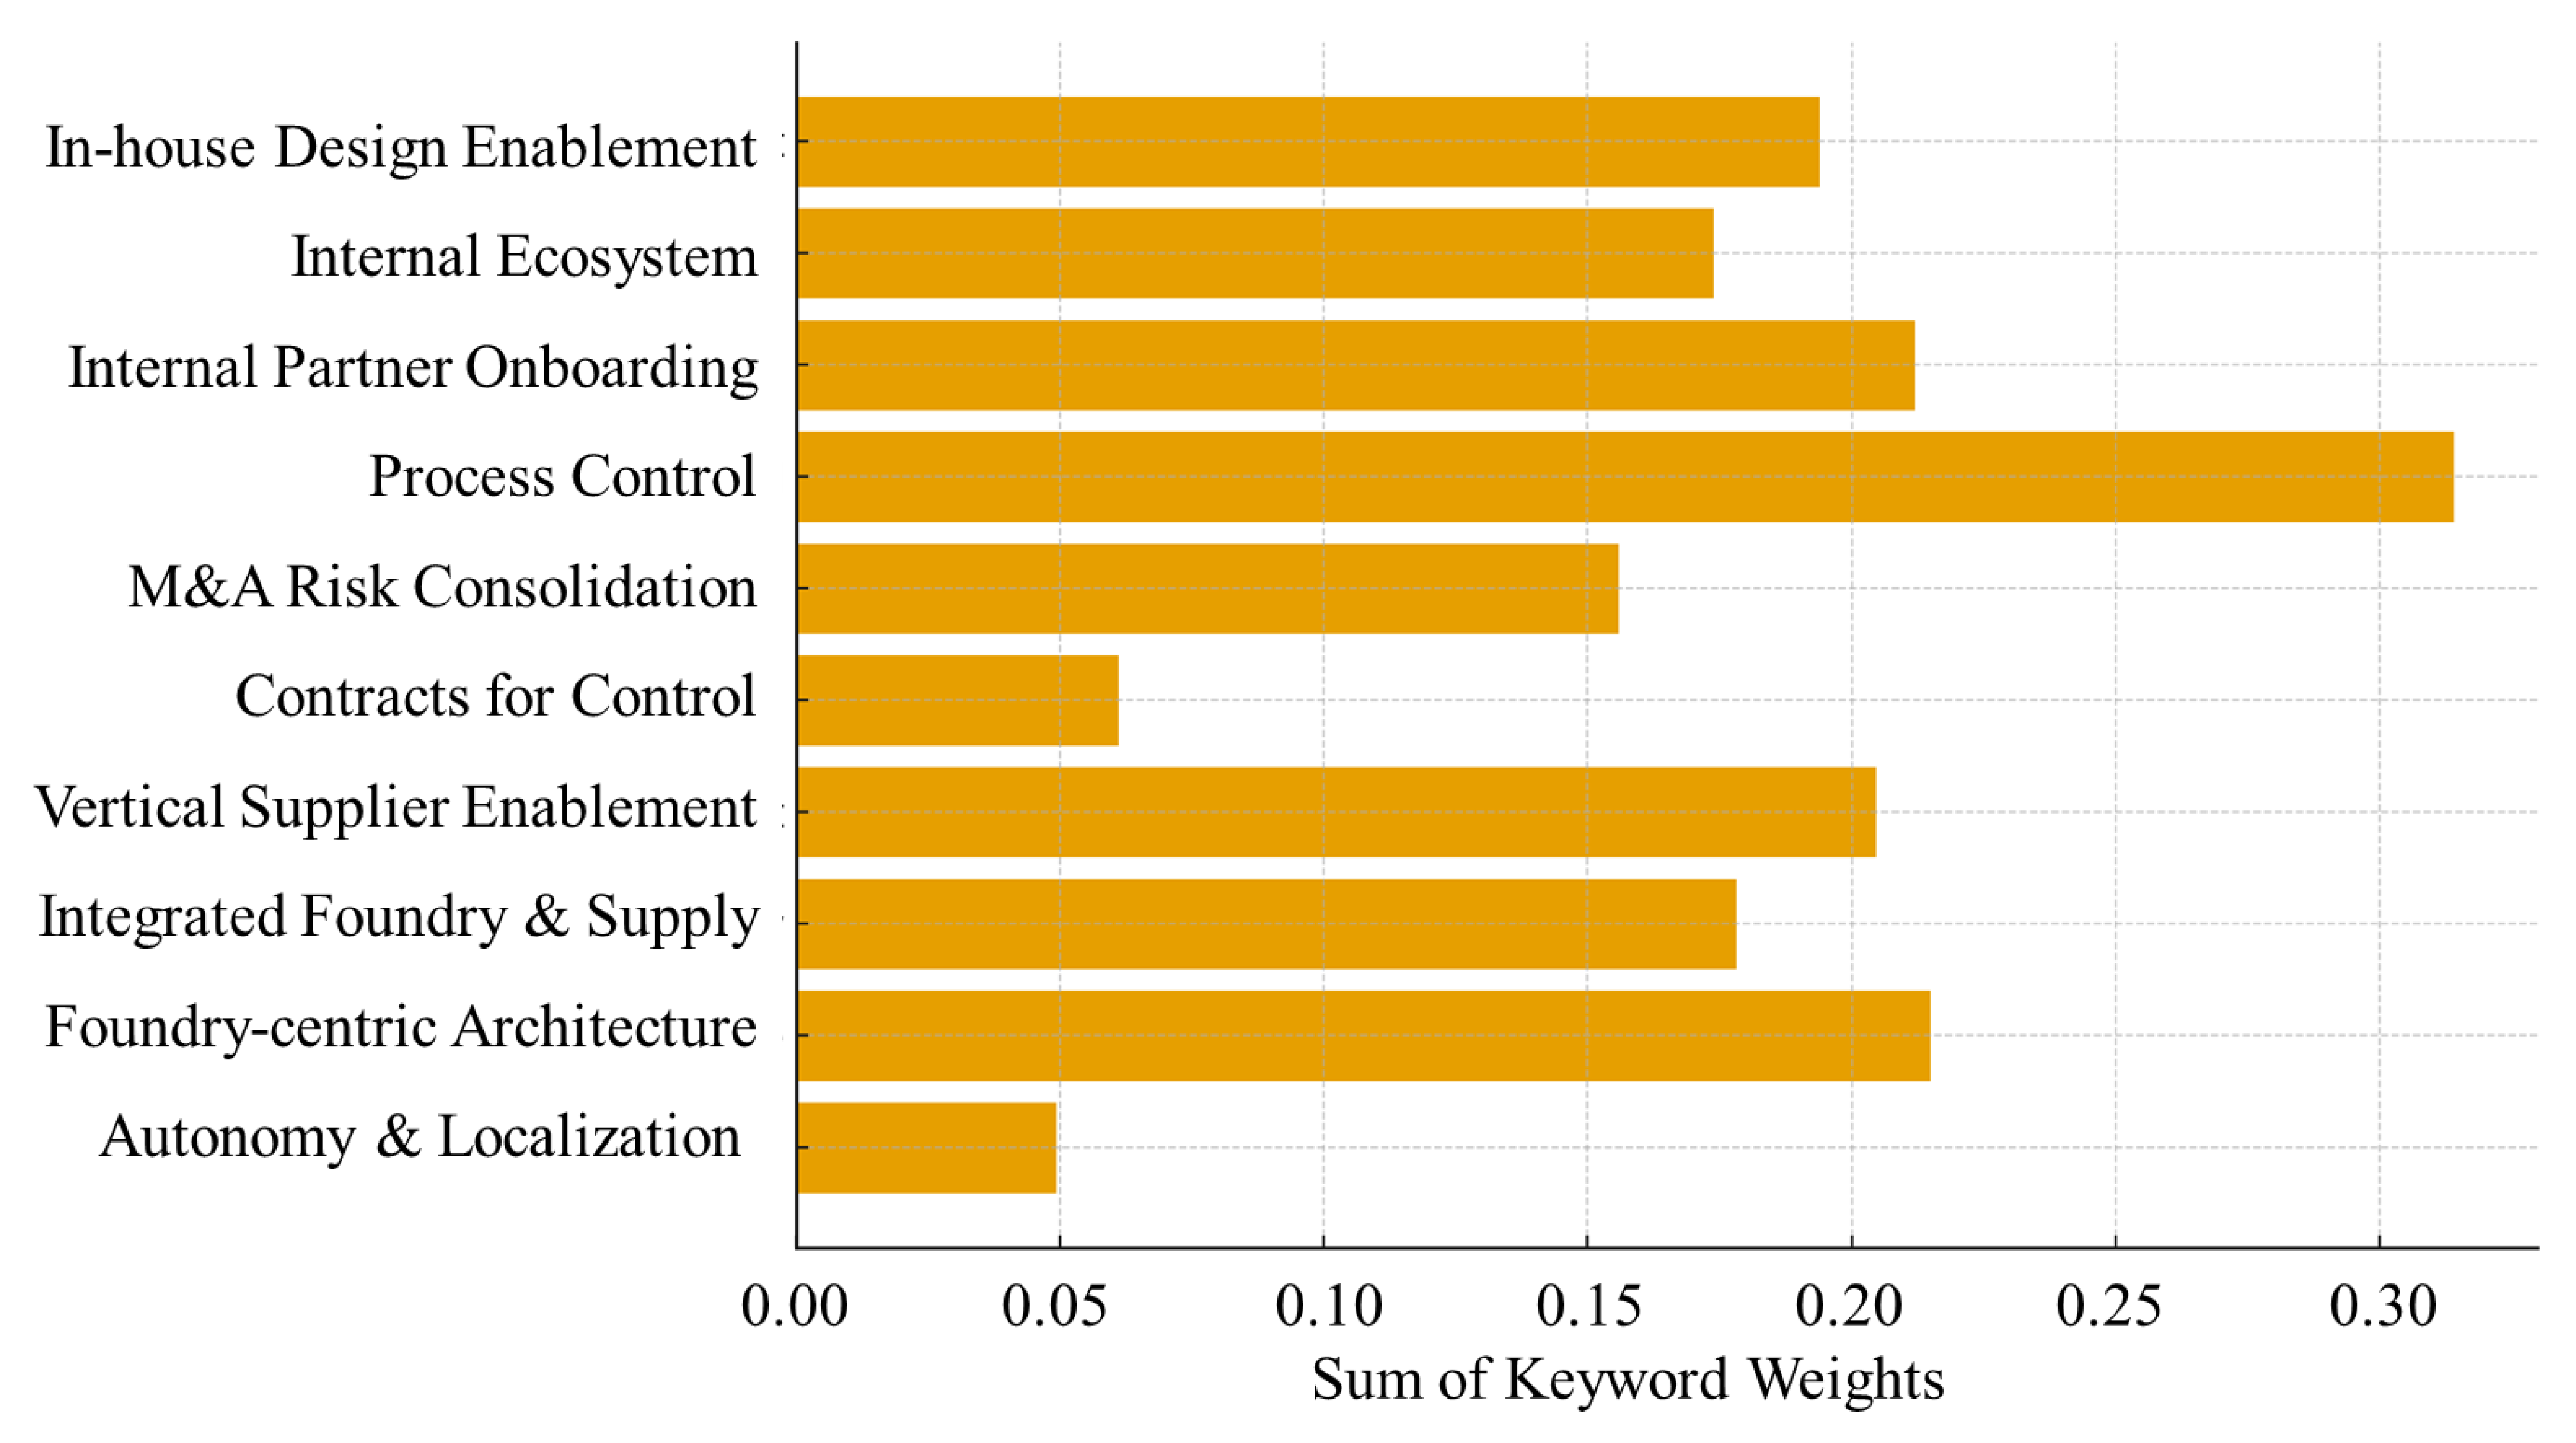
Figure 6 represents the combined weights of Samsung’s topic groups related to vertical integration. The distribution is heavily weighted towards process control, with internal partner onboarding, foundry-centric architecture, and integrated foundry and supply ranking. The public narrative focuses primarily on the operational aspects of ownership, like the ramp and stability of fab/process/packaging, as well as the integration of suppliers and partners into Samsung’s internal stack. In short, managing the memory–advanced-packaging–foundry interface in-house is more important than outside sourcing. Vertical supplier enablement and M&A and risk consolidation are important but secondary elements that align with a governance toolset designed to verify suppliers and equipment according to Samsung’s standards, as well as to standardize control mechanisms (e.g., consolidation or joint venture structures) during times with substantial obstacles or asset specificity. The internal and in-house design enablement gives significant weight to ownership upstream of the platform/design and feeds into the process loop. In contrast, contracts for control and autonomy and localization are less significant; they serve as enabling layers (legal/organizational instruments and localization rhetoric) rather than being the primary focus of news coverage. In general, the profile confirms the “vertical empire” interpretation displayed in Table 2, with narrative significance focused on the operational core (design → process → yield → volume) and the regulated integration of partners into a vertically structured framework. This footprint acts as the basis for Samsung’s firm-month vertical signal, which is used in subsequent valuation assessments.
The topic model for SK Hynix envisions a horizontally orchestrated architecture, in which capability access and scale are achieved through platforms, partnerships, and networked production instead of internalization alone (see Table 5). At its core, the partnered tech platform (Topics 1 and 10) combines technological and operational language with terms such as “platform,” “ecosystem,” and “partner,” indicating that enabling tools, layers, operating interfaces, and joint workflows are intended to integrate external specialists and support core customers. These surrounding clusters contract, expand, and productively leverage partnerships. Topic 2, joint contracts and expansion, focuses on agreements, the expansion, and participation of alliance scope, while Topic 9, solution contracting, connects solution language to integration and signing terms, demonstrating a process for transforming collaborative design to formalized delivery.
Consortium co-design (Topic 3) represents innovation and design co-specialization, with terms like “foundry,” “consortium,” and “joint venture” appearing alongside process and manufacturing terminology. This pattern is consistent with risk sharing during the early stages of development and qualification, as well as the use of multi-party vehicles to combine complementary assets. The global open network (Topic 4) builds on the existing framework by incorporating a large network of collaborating entities, as defined by terms like “ecosystem,” “open,” “partner,” “alliance,” and “sharing,” implying the presence of deliberate governance structures that promote information exchange across companies and geographic regions. Joint development (Topic 7) reinforces the horizontal posture concept by using terms as “solution,” “cooperation,” and “platform” alongside “adoption” and “expansion,” implying that co-development programs are intended to produce repeatable products. The executional scale manifests as scale-up with vendors (Topic 6), which is distinguished by a high concentration in areas such as production, equipment, foundry, packaging, outsourcing, and supply chain. The language indicates that distributed capabilities and vendor-aided throughput, encompassing tooling and materials suppliers, instead of a unified internal basis. Two governance clusters support risk management and capacity assurance. Topic 8, joint entities and risk sharing, emphasizes “legal entity,” “joint venture,” and “risk management” importance, while utilizing corporate structures to manage secure access and exposure. In the meantime, co-growth programs (Topic 5) present an ecosystem development framework that incorporates the terms “platform,” “co-growth,” and “design,” allowing suppliers and customers to collaborate on shared objectives and qualification cycles.
The ten topics, when combined, form a cohesive “horizontal alliance” framework, with contracts and platforms serving as the consortium, interface, and joint development driving innovation, open networks, global dissemination of knowledge, and vendor-based scale and joint venture structures transforming collaborations into substantial volumes with controlled risk. This configuration meets the study’s expectations, reflecting SK Hynix’s emphasis on partner specialization and co-design via its HBM approach, with the monthly horizontal signal extracted from the text used in the subsequent valuation analysis.
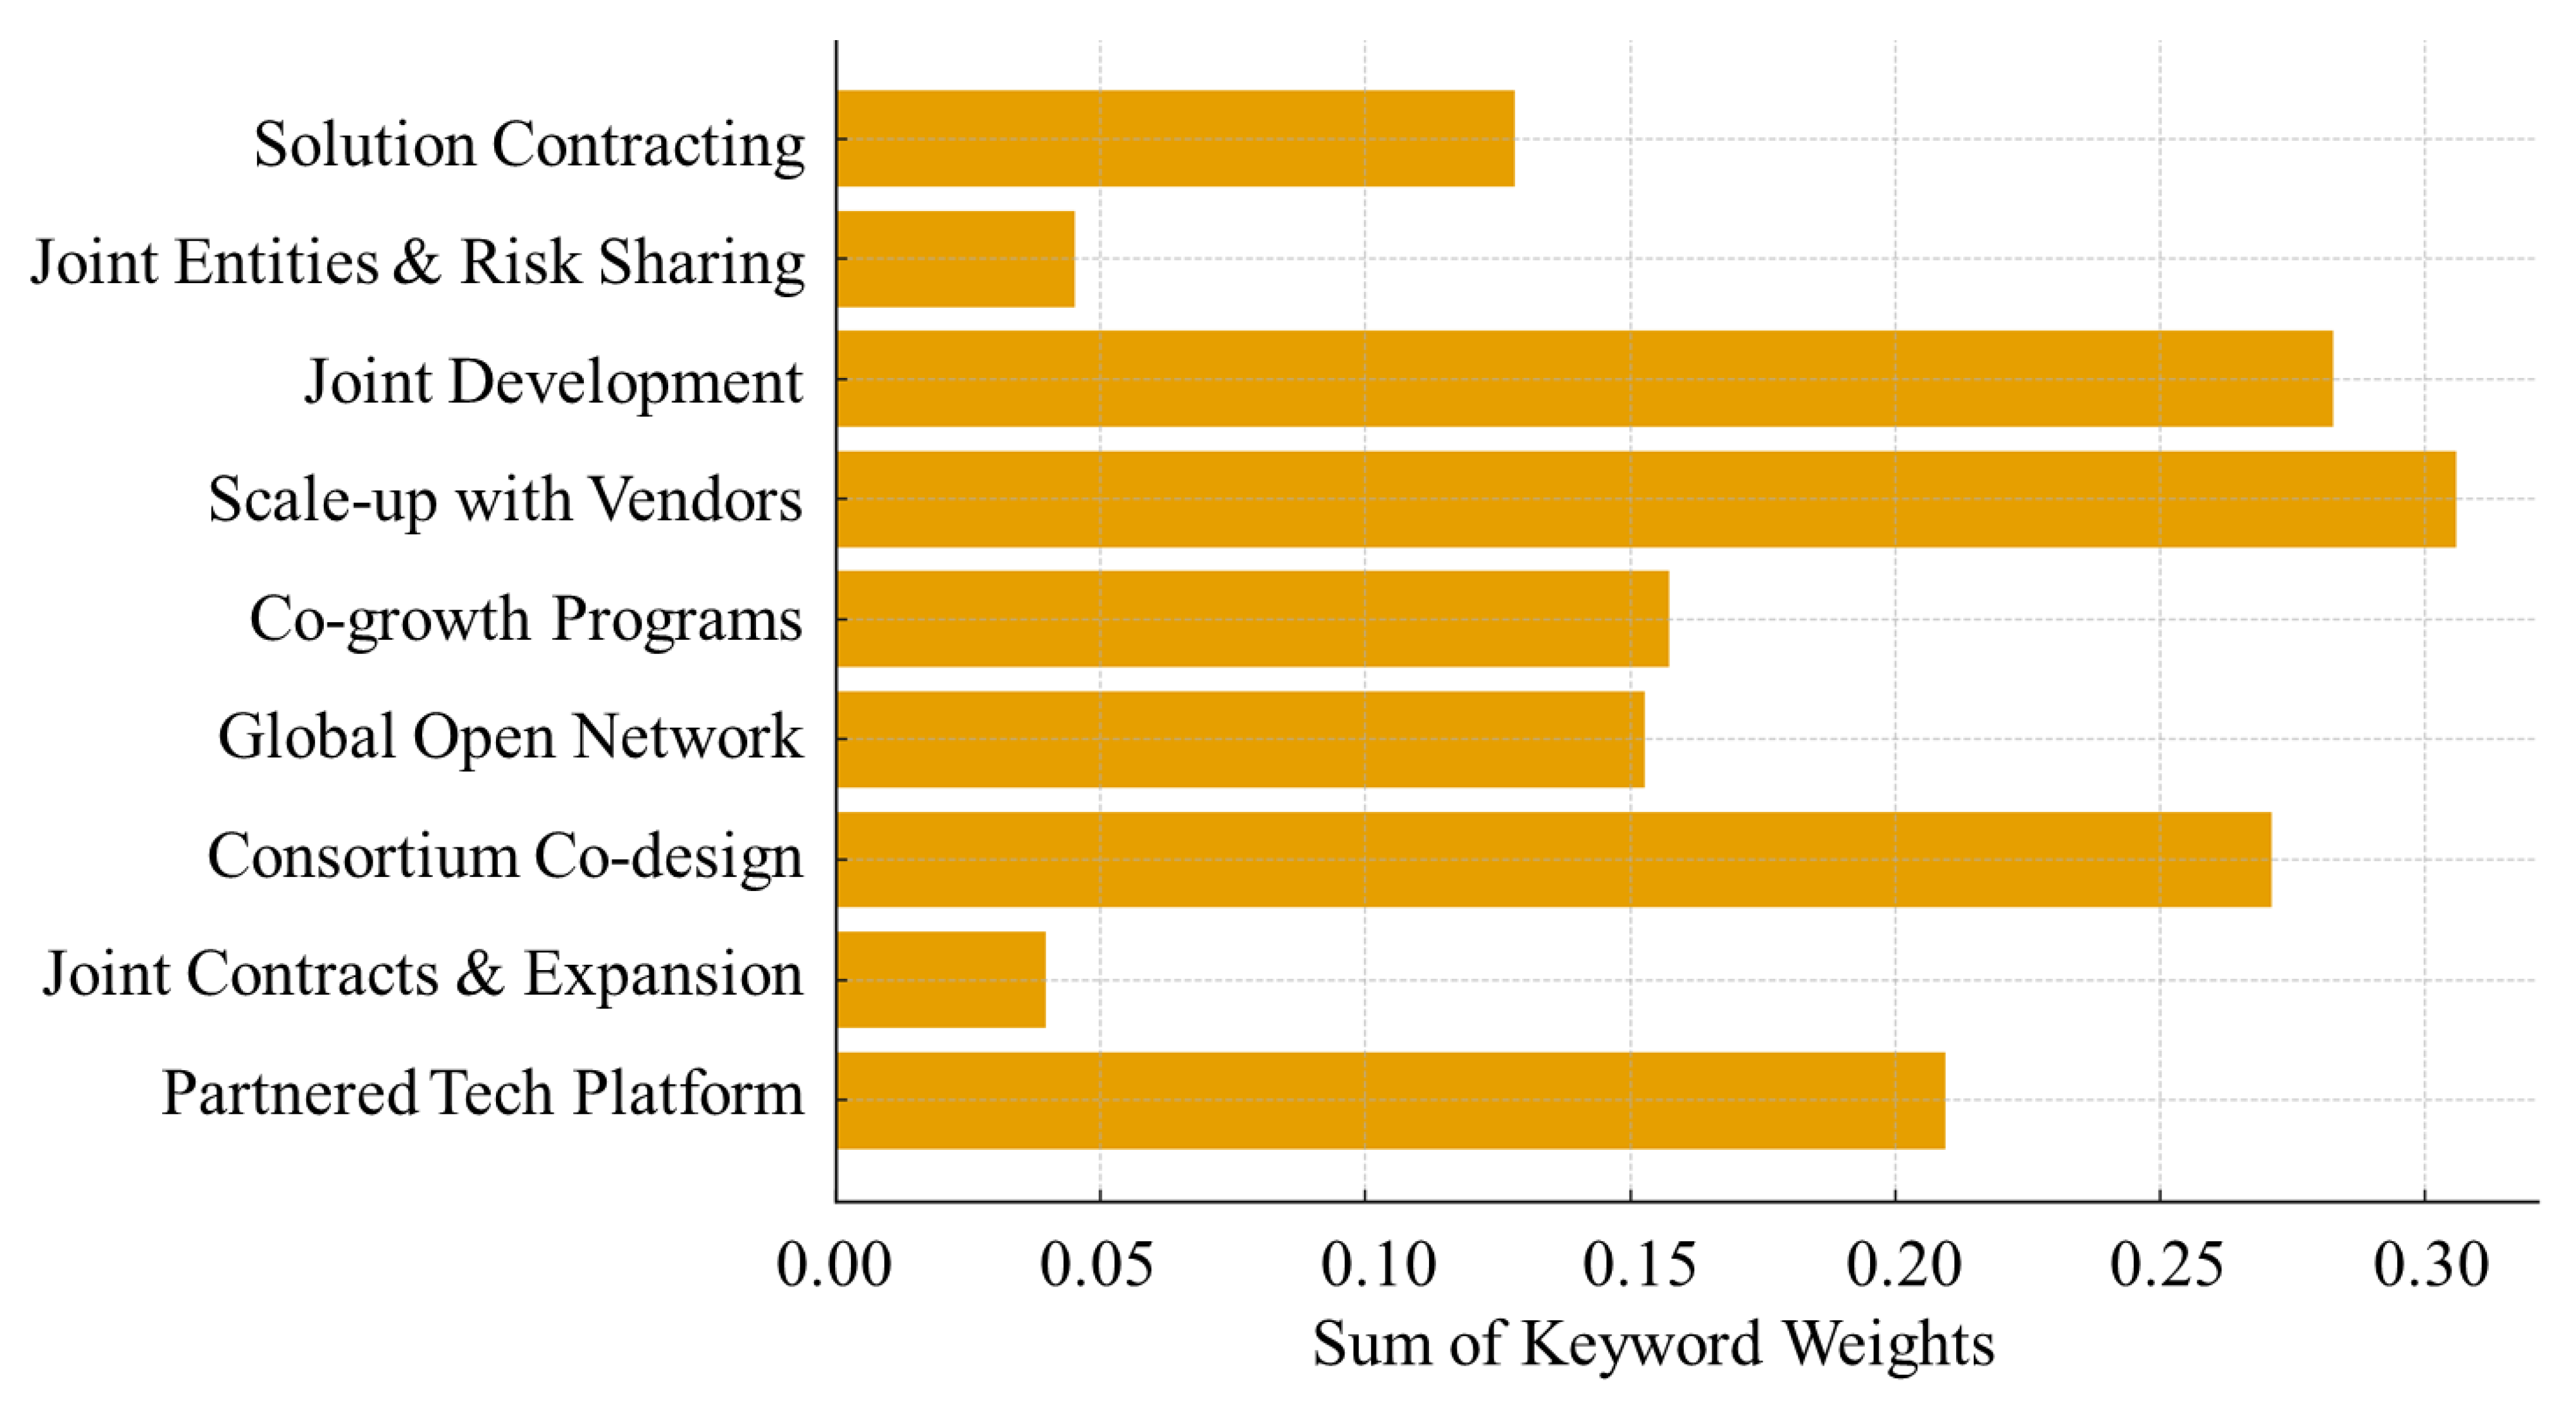
Figure 7 displays SK Hynix’s alliance-oriented topics’ aggregate weights. The majority focuses on scale-up with vendors and joint development, followed by consortium co-design and a partnered tech platform. This overview shows that the public narrative surrounding SK Hynix focuses on execution via a distributed vendor network (packaging, equipment, supply chain capacity) and structured co-development programs that convert partner know-how into producible HBM solutions. The consortium co-design—with “foundry,” “consortium,” and “joint venture” prominence, integrated with process/manufacturing terms—indicates multi-party vehicles for qualification and risk pooling, which is consistent with a horizontal orchestration logic. The mid-tier weight on global open network and co-growth programs indicates intentional information governance of flows and supplier/customer development (partner sharing, open platforms, ecosystem language). Solution contracting is just below this category, recording the deal flow that transforms collaborative solutions into delivery commitments. Joint contracts and expansion and joint entities, and risk sharing, on the contrary, are relatively light in volume, implying that while formal agreements and joint venture structures exist, they serve primarily as enabling mechanisms around the higher-salience pillars of vendor scaling and joint development.
Overall, SK Hynix’s topic-weight profile fits neatly into the study’s “horizontal alliance” framework: platform and consortium activity at the innovation front end; vendor-assisted scaling at the executional front end; and selective contracting and joint venture instruments to manage exposure. This text footprint underpins the firm-month horizontal signal used in the valuation tests and contrasts with Samsung’s vertical emphasis reported in the previous figure.

4.3. T-SNE Results

The t-SNE projection, as shown in Figure 8, provides a qualitative check on the separability of Samsung’s topic assignments in the HBM news archives, for the period January 2023–September 2025. Individual documents are displayed as points that are colored with reference to their dominant topic (see Table 2) and positioned in a two-dimensional space using a 2-D embedding of sentence/document vectors before inferring the topic. It is possible to distinctly distinguish several clusters. Documents tagged as process control are the largest and most contiguous, indicating their highly specific terminology concerning process, fabrication, packaging, and ramping. Foundry-centric architecture and integrated foundry and supply are located in nearby districts that partially surround the process cluster, indicating a gradual shift away from structural narratives (foundry/supply/organization) toward executional narratives (process/volume/yield). In-house design enablement appears as a semi-autonomous entity linked to process through a narrow line of interconnected points, consistent with design-manufacturing feedback narratives. Governance and ecosystems-related topics are on the periphery of these operational areas. Vertical supplier enablement and internal partner onboarding belong to the process/foundry area and clearly overlap with it, which is consistent with their role as interface-management stories that frequently involve production and tooling processes like onboarding, qualification, and standardization. Internal ecosystem lies between onboarding and design, reflecting the platform’s use of “open” terminology in discussions of internal platform integration. In contrast, M&A and risk consolidation and contracts for control are evenly dispersed with smaller clusters, indicating corporate actions and legal/organizational announcements that reuse terms of general governance and thus embed themselves closer with several nearby entities instead of forming a cohesive group.
The initial illustration indicates that the vertical spine exhibits cohesive semantic properties derived from design enablement via process control and a foundry-centric structure within public text. Ecosystem and governance topics serve to supplement rather than replace the main framework: their overlap with operational clusters indicates that cooperation and contracting are mainly used to strengthen internal control, instead of standalone partner-driven initiatives. Visual patterns that are consistent with the vertical-integration interpretation obtained from the topic model support vertically oriented topic-intensity series use by Samsung in subsequent OLS valuation tests.
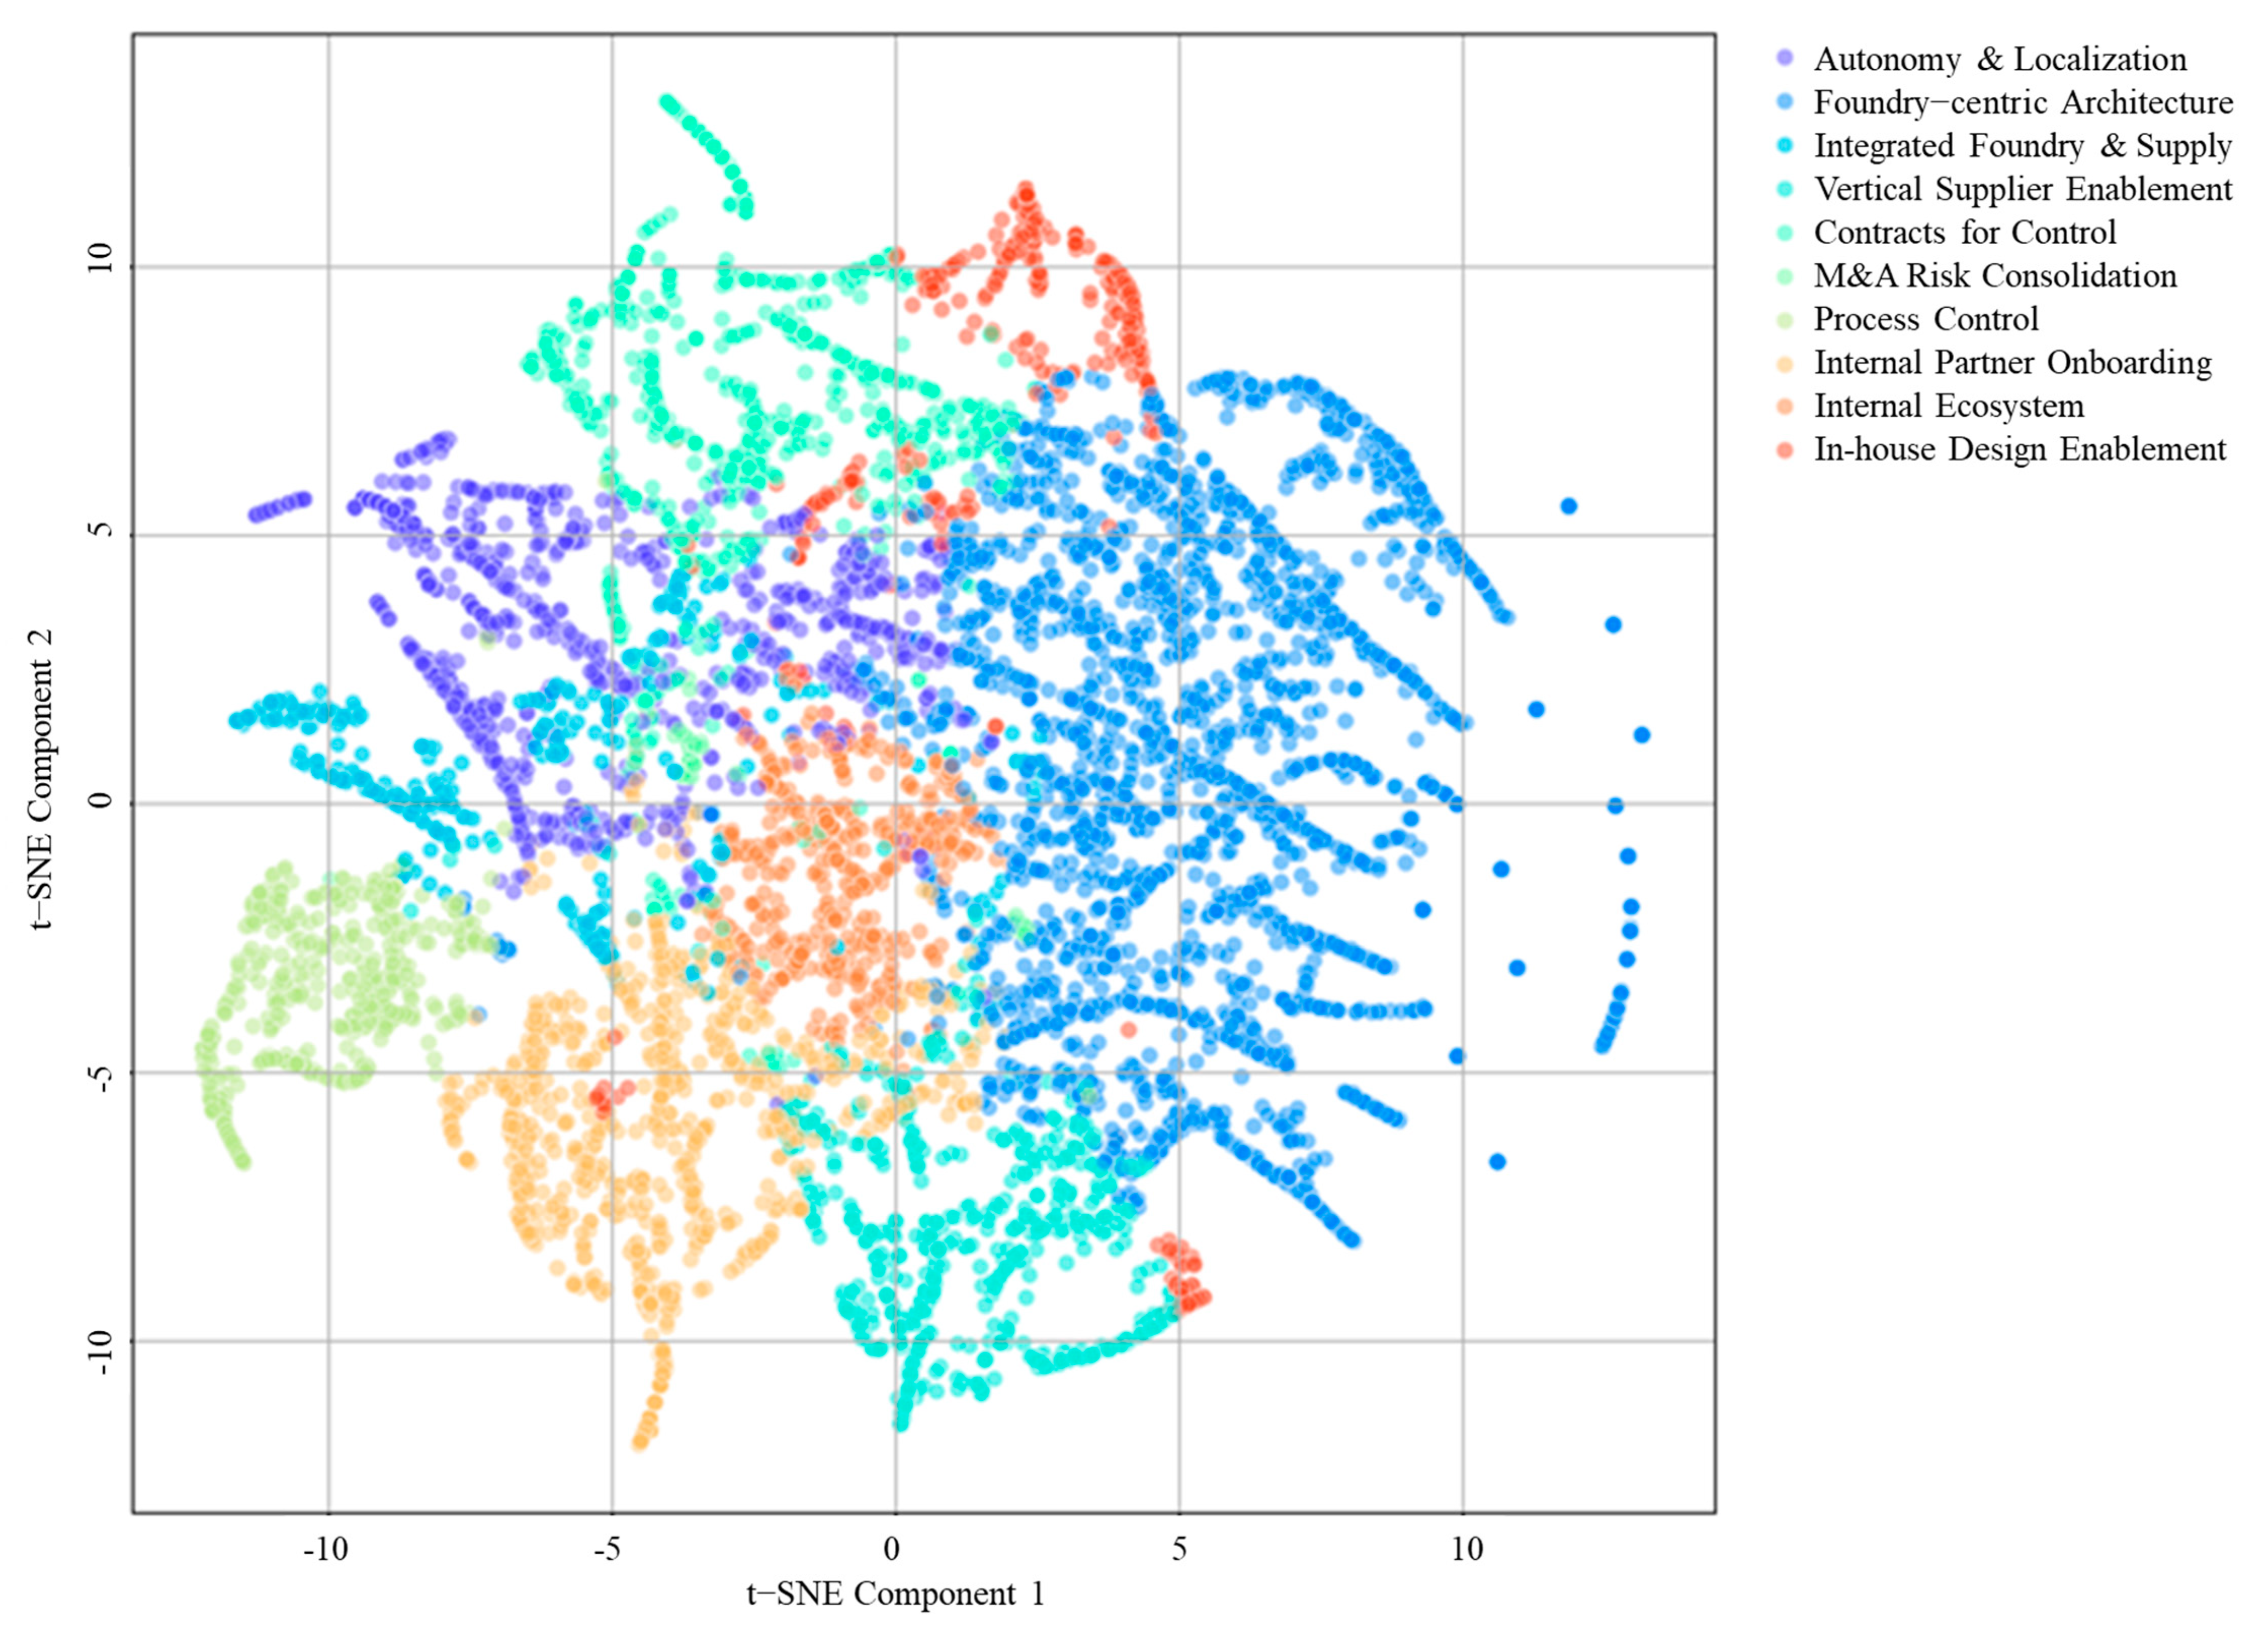
The t-SNE projection (see Figure 9) depicts SK Hynix news documents from January 2023 to September 2025 in two dimensions, with each point colored according to the dominant topic listed in Table 5. Clusters here are more intertwined and ribbon-like, aligning with stories connecting different external locations and partners rather than a centralized, self-contained system, unlike Samsung’s approach. Scale-up with vendors creates a single, unbroken band that spans the right side of the map. Its documents frequently include packaging, equipment, supply chain, and outsourcing terminology, and they often intersect with joint development initiatives, echoing stories about tooling qualification, vendor capacity, and co-development programs in the same publications. Consortium co-design is located throughout this band and intersects with the partnered tech platform, a scenario in which platforms (that include the interface, ecosystem, and partner enablement) and multi-party vehicles (such as consortia and JVs) are used to manage early-stage process and packaging work with founders and anchor customers. Global open network and co-growth programs are located near the center and share a neighborhood with joint development that is connected with short bridges. Local mixing indicates that open-network governance (which includes standards, sharing, and partner roles) is not a standalone narrative; rather, it is embedded in articles detailing specific co-development activities and customer initiatives. On the contrary, joint contracts and expansion and joint entities, and risk sharing look like smaller, dispersed pockets at the border. The dispersion corresponds to the standard organizational and legal terminology used in different collaborations, where t-SNE spots near multiple neighbors rather than forming distinct clusters.
Two conclusions can be reached: the SK Hynix topic space focuses on partner-driven scalability and co-development—vendor ramp-up, consortium arrangements, and platform support are conceptually similar, yielding a horizontally coordinated production approach. Governance artifacts (joint venture entities, contracts) act as a connecting framework rather than a central narrative, linking vendor-scale experiences to development initiatives. This geometry supports our SK Hynix classification as a horizontal-alliance pillar, and it encourages its horizontally oriented topic-intensity series use in future valuation assessments.

4.4. OLS Analysis

The OLS model is statistically significant at the 5% level using weekly data from 2023 to 2025, with a probability (F-value) of 0.0378, as shown in Table 6. The model’s fit is poor (R2 = 0.139), and the Durbin–Watson statistic (2.229) indicates little to no residual autocorrelation. The exchange rate proxy (currency rate) is not significantly different from zero (β = -0.440, p = 0.120). At the topic level, the M&A and risk consolidation topic has a significant positive correlation with market valuation: β = 0.030, SE = 0.011, t = 2.694, p = 0.008, 95% CI [0.008, 0.051].
Control-enhancing news, such as mergers, joint venture structures, and risk ring-fencing, is therefore the vertical theme most consistently priced by the market in Samsung’s case. The significance of internal partner onboarding is on the negative side at the conventional threshold (β = −0.030, p = 0.063), indicating that reports presented as partner onboarding/integration—although part of a vertically governed stack—do not immediately yield investor rewards and may be viewed as execution risk or transitional costs. In this specification, the statistical values for the other vertical topics are all essentially equivalent to zero, with the following results: autonomy and localization (β = 0.029, p = 0.295), foundry-centric architecture (β = −0.008, p = 0.790), integrated foundry and supply (β = 0.023, p = 0.262), vertical supplier enablement (β = 0.002, p = 0.901), contracts for control (β = −0.011, p = 0.468), process control (β = 0.012, p = 0.312), internal ecosystem (β = −0.016, p = 0.277), and in-house design enablement (β = −0.018, p = 0.237).
Estimates for these areas are near zero, with large confidence intervals, implying that after controlling for other topics in the same week, the significance of incremental news in these areas is unreliably associated with the level of prices during this period. In conclusion, the market quickly interprets governance actions that strengthen control (joint venture/M&A/risk consolidation) as essential vertical signals within weeks for Samsung’s vertically structured narrative. Operational and architectural vertical indicators, like process, supplier enablement, foundry-centric structure, or design enablement, do not significantly affect this weekly market assessment. These findings necessitate robustness checks (i.e., alternative scaling of topic intensity and return-based specifications), but the main result is that formal consolidation events will dominate Samsung’s vertical pricing over 2023–2025.
Based on weekly data from 2023 to 2025, the SK Hynix model is jointly significant at the 10% level, with a probability of F-statistic of 0.0620 and an R2 value of 0.129, as presented in Table 7. The residual dependence is small, according to Durbin–Watson statistic of 1.743. The exchange rate variable is not statistically different from zero (β = −0.759, p = 0.118). The scale-up and vendors and valuation relationship is significantly positive, with a coefficient of 0.066, a standard error of 0.019, a t-statistic of 3.420, a p-value of 0.001, and a 95% confidence interval of [0.028, 0.104]. A small positive effect is also supported by joint development at the 5% margin (β = 0.046, SE = 0.023, t = 1.984, p = 0.049), even though the confidence interval is reversed. All other topics, including the partnered tech platform (β = 0.026, p = 0.509), joint contracts and expansion (β = 0.028, p = 0.459), consortium co-design (β = −0.019, p = 0.441), global open network (β = 0.002, p = 0.946), co-growth programs (β = 0.016, p = 0.422), joint entities and risk sharing (β = −0.002, p = 0.947), and solution contracting (β = −0.004, p = 0.846), are statistically indistinguishable from zero in this pooled weekly level specification. The market appears to value SK Hynix’s horizontal strategy mainly based on its scale of execution with vendors and joint development, whereas the use of contracting, platform, and governance language does not influence prices, taking other factors into account. This pattern, combined with the Samsung results, reinforces the paper’s central argument: between 2023 and 2025, investors prefer vendor-supported scaling and co-development for SK Hynix, whereas Samsung’s valuation responds more to consolidation-oriented vertical moves.
Interpreting model fit, we view the relatively low R2 as expected for price-based specifications because our topics capture narrow governance constructs rather than the broad set of forces that move equity prices, text-derived measures introduce attenuation, intra-day reactions can be misaligned with weekly outcomes, residual variance is elevated in a two-issuer setting, and nonlinear or threshold effects during the generative AI upcycle are not fully captured by a time-invariant linear model.

5. Discussion

5.1. Theoretical Implications

The presented evidence suggests a provisional theory of integration, as capital markets use various mechanisms of governance according to the bottleneck location within the HBM framework. In Samsung’s case, consolidation tools—M&A, joint venture restructuring, and risk ring-fencing—impact value instead of process strictness or supplier empowerment general descriptions. This pattern aligns with a transaction-cost and capabilities integration: when critical interfaces are internalized, additional benefits can be obtained by shortening cycle time and strengthening control, instead of enhancing more “soft” coordination. On the contrary, the scale and co-development executed by partners influence SK Hynix’s valuation. This aligns with the notion that assets outside the firm are the limiting factor in an ecosystem-orchestration approach; markets reward alliances demonstrating credible evidence of switching into tangible output and product development. These firm-specific patterns are consistent with classic boundary-of-the-firm logic in complex, interdependent systems: vertical consolidation is valued when it reduces transaction hazards, shortens coupled cycles, or protects co-specialized capabilities [29,30,31,32,33,34,35,36]. Our Samsung result coheres with transaction-cost and capabilities views that predict value when tight interface control accelerates learning and schedule adherence [29,30,31,34,35,36]. Conversely, the SK Hynix result aligns with orchestration/open-collaboration perspectives where value is created by mobilizing and coordinating specialized partners under credible commitments and information-sharing routines [10,11,12,15,19,22]. In this sense, our evidence refines contingency arguments: not all “vertical” or “horizontal” narratives are priced, only those that map to verifiable reductions in coordination risk or bottleneck relief appear to load into valuation during the generative AI HBM cycle.
Our results help reconcile mixed findings in the integration and collaboration literature by clarifying the priced margin. Prior work shows that formal and relational governance often complement each other in innovation settings, but market reactions are uneven when disclosures remain abstract [10,11,12,20,21,22,41]. We show that, in this period, platform/openness language attracts limited pricing unless tied to artifacts of execution (e.g., tool installation, joint qualification logs, co-verified products), while vertical moves are priced when they reallocate control rights or ring-fence risk in ways that plausibly compress time-to-volume [29,30,31,32,33,34,35,36,41]. This distinction also dovetails with modularity arguments: investors differentiate architectural ownership from architectural access [37,38,39,40].
Methodologically, our approach extends text-based supply chain signals to a valuation setting and nests them within an event-study tradition that links media/text to prices under information frictions [18,27,48,49,50,51]. By separating strategic-architecture topics from generic sentiment, we add construct specificity relative to tone/coverage proxies used in prior asset-pricing/media studies [48,49,50], while staying compatible with operations-finance evidence on supply chain news and equity risk [51]. Also, this paper methodologically offers a scalable approach to operationalizing strategic architecture based on public text. Seed-guided topic intensities serve as forward-looking indicators of governance posture, distinguishing them from sentiment metrics. This establishes a link between operational/strategic concepts and asset valuation without relying solely on surveys or case studies. This positioning is consistent with identification cautions in event-study and media-effects research, which emphasize horizon sensitivity and disclosure context [27,48,49,50]. Simultaneously, the design draws attention to endogeneity issues—the prominence of news can shift in tandem with fundamental factors—and suggests future approaches for identification, such as high-frequency stock returns around specific article timestamps, using external media disruptions as an instrument to gauge topic shocks, and expanding data sources to include non-news items such as supplier notes and regulatory filings to decrease measurement errors (e.g., supplier notes, regulatory filings). The Korea-focused period after 2023 indicates that governance is subject to pricing that is time-dependent; as packaging standards evolve or supply decreases, the market may shift its focus towards focused integration signals.

5.2. Practical Implications

The most obvious driver for valuation in the current HBM cycle is credible consolidation at points of congestion, for vertically integrated companies like Samsung. Announcements that alter control rights or strengthen ownership of schedule, acquisitions, asset transfers, restructured joint ventures with defined governance, and legally enforceable risk segmentation all move market prices within weeks. Operational advancements should consequently be translated into concrete, quantifiable evidence that can be used in governance: specific, dated targets for ramp and yield improvement tied to particular assets, measurable reductions in cycle time at the memory–advanced-packaging–foundry interface, and verifiable cases of synergy that link organizational structure to cash conversion. This approach internally requires prioritizing transactions and structures that eliminate handoffs where delays or variances are most significant and sequencing disclosures so that each structural change is accompanied by a near-term, verifiable operating metric. These prescriptions are consistent with evidence that credible commitment devices and verifiable milestones mitigate coordination risk and are rewarded by markets in complex supply chains [10,11,12,20,21,22,51], while mere narrative claims without observable progress attract muted reactions [48,49,50].
Investors will receive executional proof that vertically integrated firms such as SK Hynix convert their networks into capacity and revenue. When vendor-assisted scaling and joint development reach attainable thresholds, the market charges its rates. Alliance announcements should be timed to coincide with qualification milestones (customer co-validation, tool introduction to production, secured capacity blocks), and include specific output, ensure stability, or mix/pricing outcomes. Platform rhetoric is most effective when accompanied by the artifacts that minimize scaling-associated risks, like specifically, standardization outcomes, multi-party qualification logs, and shipping agreements. When forming joint ventures, the emphasis should be on reducing time-to-volume and risk distribution, instead of depending only on vehicle formation. Investor-facing dashboards should show the same priced margins. A vertical dashboard displays interface ownership’s key performance indicators, such as reduced lead times, lower rework cycle counts, and improved cross-module defect closures, in addition to deal progress and tracking integration milestones. A horizontal dashboard displays key performance indicators for partner activation, including vendor capacity online, time to qualification with anchor customers, the conversion rate from joint development to bookable SKUs, and the percentage of volume under collaboration-linked pricing. Boards can use these lenses to create incentive systems, such as compensating vertical teams being compensated based on cycle-time compression and post-deal synergy capture, and horizontal teams based on qualification velocity and partner-to-revenue conversion.
There are implications for the study for both ecosystem actors and policymakers. To comply with SK Hynix’s model, equipment and materials vendors should develop qualification roadmaps and make them publicly available and provide deliverable-based service level agreements that allow for transparent tracking of alliance progress for market adoption. Foundries and outsourced semiconductor assembly and tests can raise the significance of collaboration value by releasing coordinated, time-stamped validation documents at the same time. Regulators assessing consolidation in advanced packaging should recognize that integration can reduce systemic delay variance, increasing factors of effective capacity to consider when weighing competitive effects toward dynamic efficiency. At the same time, consistent with prior caution on consolidation under uncertainty, such benefits are context-dependent and should be weighed against longer-run competition and innovation incentives [29,30,31,41].

5.3. Limitations and Future Research Suggestions

Several limitations indicate a need for further development. Weekly levels provide a broad picture of market activity, but looking at high-frequency returns relative to specific events or using portfolio-sorting methods to isolate certain factors’ impact would provide a more detailed understanding. Topic construction also relies heavily on news sources; incorporating information from earnings calls, supplier disclosures, and regulatory filings would enhance coverage and lower measurement inaccuracies. All strategic takeaways should be read conservatively. They are derived from firm-specific associations observed for Samsung Electronics and SK Hynix during 2023–2025 and may shift as technologies, partners, and market conditions evolve. Accordingly, the recommendations are context-bound and non-prescriptive until validated across additional firms, longer horizons, and identification-oriented designs. Beyond data coverage, the methodological characteristics of text analysis used in this research impose limits. Generic sentiment proxies are weak substitutes for strategic constructs, and dictionary approaches suffer from domain specificity and temporal drift, while supervised models are prone to label leakage and limited portability, and event-window designs remain vulnerable to simultaneity with fundamentals. We acknowledge that our text-based approach remains subject to these limitations. We therefore encourage future work to incorporate human validation, explore alternative topic models (e.g., contextualized topics), pre-register feature lists, expand to multi-source corpora, and pursue cross-corpus replication so that identification and external validity can be more convincingly established. Also, the window is a single phase of generative AI diffusion; structural breaks may alter which integration moves are priced as the technology and supply base mature. Lastly, the study’s focus is centered on Korea and replicating it with other ecosystem actors would be necessary to determine its external validity.

6. Conclusions

This study connects publicly observable signals of strategic integration to market-implied valuation in the HBM ecosystem during the 2023–2025 generative AI upcycle. By constructing firm-time topic intensities for vertical integration and horizontal alliances from Korean-language news and linking them to prices via firm-specific OLS, we find differentiated associations that align with how investors seem to price governance mechanisms: for Samsung Electronics, consolidation-oriented vertical motifs, such as M&A and risk ring-fencing, exhibit a positive association with valuation, while onboarding and integration items do not load reliably; for SK Hynix, partner-enabled scale-up and joint development are the horizontal motifs that the market rewards. These results extend text-based supply chain measurement toward a scalable, market-focused pipeline and translate strategic architecture into execution metrics that matter for capital markets. At the same time, our inferences are intentionally conservative: the explanatory power is modest, the design relies on news-sourced topics, and the window captures a single diffusion phase; expanding sources and horizons and adding additional ecosystem actors are natural next steps before drawing prescriptive guidance. Overall, the paper complements prior work that foregrounds managerial implications from empirical models by offering industry-facing takeaways while clearly separating association from causation.

Author Contributions

Conceptualization, H.J.Y. and C.K.; Data curation, H.J.Y. and C.K.; Formal analysis, H.J.Y. and C.K.; Funding acquisition, H.J.Y. and C.K.; Investigation, H.J.Y. and C.K.; Methodology, H.J.Y. and C.K.; Project administration, H.J.Y. and C.K.; Resources, H.J.Y. and C.K.; Software, H.J.Y. and C.K.; Supervision, C.K.; Validation, H.J.Y. and C.K.; Visualization, H.J.Y. and C.K.; Writing—original draft, H.J.Y. and C.K.; Writing—review & editing, H.J.Y. and C.K. All authors have read and agreed to the published version of the manuscript.

Funding

This work is written with support for research funding from aSSIST University.

Institutional Review Board Statement

Not applicable.

Informed Consent Statement

Not applicable.

Data Availability Statement

The raw data supporting the conclusions of this article will be made available by the authors on request.

Acknowledgments

During the preparation of this work, the authors used ChatGPT-4o and Trinka (Version 0.2.94) to paraphrase sentences, enhance readability, and correct grammatical errors. After using this tool, the authors reviewed and edited the content as needed and took full responsibility for the final version of the published article.

Conflicts of Interest

The authors declare no conflicts of interest.

Abbreviations

The following abbreviations are used in this manuscript:
AIArtificial Intelligence
AUCArea Under the (ROC) Curve
GPUGraphics Processing Unit
HBMHigh-Bandwidth Memory
JVJoint Venture
LDALatent Dirichlet Allocation
LLLog-Likelihood
OLSOrdinary Least Squares
R&DResearch and Development
SKUStock Keeping Unit
SVMSupport Vector Machine
t-SNEt-Distributed Stochastic Neighbor Embedding
TF–IDFterm frequency–inverse document frequency

References

  1. Gholami, A.; Yao, Z.; Kim, S.; Hooper, C.; Mahoney, M.W.; Keutzer, K. AI and memory wall. IEEE Micro 2024, 44, 33–39. [Google Scholar] [CrossRef]
  2. Chae, J.-H. High-bandwidth and energy-efficient memory interfaces for the data-centric era: Recent advances, design challenges, and future prospects. IEEE Open J. Solid-State Circuits Soc. 2024, 4, 252–264. [Google Scholar] [CrossRef]
  3. Lu, A.; Lee, J.; Kim, T.-H.; Karim, M.A.U.; Park, R.S.; Simka, H.; Yu, S. High-speed emerging memories for AI hardware accelerators. Nat. Rev. Electr. Eng. 2024, 1, 24–34. [Google Scholar] [CrossRef]
  4. Lee, S.-H.; Kim, S.-J.; Lee, J.-S.; Rhi, S.-H. Thermal Issues Related to Hybrid Bonding of 3D-Stacked High Bandwidth Memory: A Comprehensive Review. Electronics 2025, 14, 2682. [Google Scholar] [CrossRef]
  5. Silvano, C.; Ielmini, D.; Ferrandi, F.; Fiorin, L.; Curzel, S.; Benini, L.; Conti, F.; Garofalo, A.; Zambelli, C.; Calore, E. A survey on deep learning hardware accelerators for heterogeneous hpc platforms. ACM Comput. Surv. 2025, 57, 1–39. [Google Scholar] [CrossRef]
  6. Liu, Y.-H.; Chang, Y.-C.; Ma, Y.-H. Advancements in Neural Network Acceleration: A Comprehensive Review. ICT Express 2025, in press. [Google Scholar] [CrossRef]
  7. Das Sharma, D.; Pasdast, G.; Tiagaraj, S.; Aygün, K. High-performance, power-efficient three-dimensional system-in-package designs with universal chiplet interconnect express. Nat. Electron. 2024, 7, 244–254. [Google Scholar] [CrossRef]
  8. Williamson, O.E. The economic institutions of capitalism. Political Econ. Read.: Mark. Inst. 2008, 27, 15–38. [Google Scholar]
  9. Teece, D.J. Profiting from technological innovation: Implications for integration, collaboration, licensing and public policy. Res. Pol. 1986, 15, 285–305. [Google Scholar] [CrossRef]
  10. Shen, L.; Shi, Q.; Parida, V.; Jovanovic, M. Ecosystem orchestration practices for industrial firms: A qualitative meta-analysis, framework development and research agenda. J. Bus. Res. 2024, 173, 114463. [Google Scholar] [CrossRef]
  11. Harima, A.; Harima, J.; Freiling, J. Ecosystem orchestration: Unpacking the leadership capabilities of anchor organizations in nascent entrepreneurial ecosystems. Entrep. Theory Pract. 2024, 48, 1404–1450. [Google Scholar] [CrossRef]
  12. Jensen, S.F.; Kristensen, J.H.; Christensen, A.; Waehrens, B.V. An ecosystem orchestration framework for the design of digital product passports in a circular economy. Bus. Strategy Environ. 2024, 33, 7100–7117. [Google Scholar] [CrossRef]
  13. Al-Omoush, K.S.; de Lucas, A.; del Val, M.T. The role of e-supply chain collaboration in collaborative innovation and value-co creation. J. Bus. Res. 2023, 158, 113647. [Google Scholar] [CrossRef]
  14. Sang, B.; Noor, R.M.; Ghazali, E.M.; Aghamohammadi, N. How does supply chain collaboration improve innovation performance of SMEs? The roles of absorptive capacity and business environment. J. Innov. Knowl. 2024, 9, 100607. [Google Scholar] [CrossRef]
  15. Cohen, W.M.; Levinthal, D.A. Absorptive capacity: A new perspective on learning and innovation. Adm. Sci. Q. 1990, 34, 128–152. [Google Scholar] [CrossRef]
  16. Chesbrough, H.W. Open Innovation: The New Imperative for Creating and Profiting from Technology; Harvard Business Press: Watertown, MA, USA, 2003. [Google Scholar]
  17. Zhang, X.; Cui, R.; Ji, Y. Exploring Innovation Ecosystem with Multi-Layered Heterogeneous Networks of Global 5G Communication Technology. Sustainability 2024, 16, 1380. [Google Scholar] [CrossRef]
  18. Sadeek, S.N.; Hanaoka, S. Assessment of text-generated supply chain risks considering news and social media during disruptive events. Soc. Netw. Anal. Min. 2023, 13, 96. [Google Scholar] [CrossRef]
  19. Yin, W.; Ran, W.; Zhang, Z. A configuration approach to build supply chain resilience: From matching perspective. Expert Syst. Appl. 2024, 249, 123662. [Google Scholar] [CrossRef]
  20. Panahifar, F.; Byrne, P.J.; Salam, M.A.; Heavey, C. Supply chain collaboration and firm’s performance: The critical role of information sharing and trust. J. Enterp. Inf. Manag. 2018, 31, 358–379. [Google Scholar] [CrossRef]
  21. Rönnberg Sjödin, D.; Eriksson, P.E.; Frishammar, J. Open innovation in process industries: A lifecycle perspective on development of process equipment. Int. J. Technol. Manag. 2011, 56, 225–240. [Google Scholar] [CrossRef]
  22. Ryzhkova, N. Does online collaboration with customers drive innovation performance? J. Serv. Theory Pract. 2015, 25, 327–347. [Google Scholar] [CrossRef]
  23. Yang, N.; Yun, J.-W. When old institutions pay off: A new entrepreneurial state in South Korea and its limit in incorporating small firms into semiconductor production. Jpn. J. Political Sci. 2023, 24, 270–287. [Google Scholar] [CrossRef]
  24. Chen, G.; Wang, G.; Wang, Z.; Wang, L. Electronic Chip Package and Co-Packaged Optics (CPO) Technology for Modern AI Era: A Review. Micromachines 2025, 16, 431. [Google Scholar] [CrossRef] [PubMed]
  25. Grimes, S.; Du, D. China’s interdependent positioning in the semiconductor global value chain. Area Dev. Policy 2024, 9, 591–613. [Google Scholar] [CrossRef]
  26. Ryu, S.; Kwak, K.; Lee, S. The growth patterns of firms in the industrial value chain using the hidden markov model: Evidence from the Korean semiconductor industry. Comput. Ind. Eng. 2024, 192, 110187. [Google Scholar] [CrossRef]
  27. MacKinlay, A.C. Event studies in economics and finance. J. Econ. Lit. 1997, 35, 13–39. [Google Scholar]
  28. Blei, D.M.; Ng, A.Y.; Jordan, M.I. Latent dirichlet allocation. J. Mach. Learn. Res. 2003, 3, 993–1022. [Google Scholar]
  29. Monteverde, K.; Teece, D.J. Supplier switching costs and vertical integration in the automobile industry. Bell J. Econ. 1982, 13, 206–213. [Google Scholar] [CrossRef]
  30. Hennart, J.-F. Explaining the swollen middle: Why most transactions are a mix of “market” and “hierarchy”. Organ. Sci. 1993, 4, 529–547. [Google Scholar] [CrossRef]
  31. Argyres, N. Evidence on the role of firm capabilities in vertical integration decisions. Strateg. Manag. J. 1996, 17, 129–150. [Google Scholar] [CrossRef]
  32. Leiblein, M.J.; Miller, D.J. An empirical examination of transaction-and firm-level influences on the vertical boundaries of the firm. Strateg. Manag. J. 2003, 24, 839–859. [Google Scholar] [CrossRef]
  33. Mayer, K.J.; Salomon, R.M. Capabilities, contractual hazards, and governance: Integrating resource-based and transaction cost perspectives. Acad. Manage. J. 2006, 49, 942–959. [Google Scholar] [CrossRef]
  34. Coase, R.H. The nature of the firm. In The Roots of Logistics; Springer: Berlin/Heidelberg, Germany, 2012; pp. 317–333. [Google Scholar]
  35. Teece, D.J. Explicating dynamic capabilities: The nature and microfoundations of (sustainable) enterprise performance. Strateg. Manag. J. 2007, 28, 1319–1350. [Google Scholar] [CrossRef]
  36. Novak, S.; Eppinger, S.D. Sourcing by design: Product complexity and the supply chain. Manag. Sci. 2001, 47, 189–204. [Google Scholar] [CrossRef]
  37. Poppo, L.; Zenger, T. Do formal contracts and relational governance function as substitutes or complements? Strateg. Manag. J. 2002, 23, 707–725. [Google Scholar] [CrossRef]
  38. Gulati, R. Alliances and networks. Strateg. Manag. J. 1998, 19, 293–317. [Google Scholar] [CrossRef]
  39. Dyer, J.H.; Singh, H. The relational view: Cooperative strategy and sources of interorganizational competitive advantage. Acad. Manage. Rev. 1998, 23, 660–679. [Google Scholar] [CrossRef]
  40. Lavie, D. Alliance portfolios and firm performance: A study of value creation and appropriation in the US software industry. Strateg. Manag. J. 2007, 28, 1187–1212. [Google Scholar] [CrossRef]
  41. Baldwin, C.Y.; Clark, K.B. Design Rules, Volume 1: The Power of Modularity; MIT Press: Cambridge, MA, USA, 2000. [Google Scholar]
  42. Brusoni, S.; Prencipe, A.; Pavitt, K. Knowledge specialization, organizational coupling, and the boundaries of the firm: Why do firms know more than they make? Adm. Sci. Q. 2001, 46, 597–621. [Google Scholar] [CrossRef]
  43. Wulf, W.A.; McKee, S.A. Hitting the memory wall: Implications of the obvious. ACM SIGARCH Comput. Archit. News 1995, 23, 20–24. [Google Scholar] [CrossRef]
  44. Hennessy, J.L.; Patterson, D.A. Computer Architecture: A Quantitative Approach; Elsevier: Amsterdam, The Netherlands, 2011. [Google Scholar]
  45. Adner, R. Ecosystem as structure: An actionable construct for strategy. J. Manag. 2017, 43, 39–58. [Google Scholar] [CrossRef]
  46. Jacobides, M.G.; Cennamo, C.; Gawer, A. Towards a theory of ecosystems. Strateg. Manag. J. 2018, 39, 2255–2276. [Google Scholar] [CrossRef]
  47. Zahra, S.A.; George, G. Absorptive capacity: A review, reconceptualization, and extension. Acad. Manage. Rev. 2002, 27, 185–203. [Google Scholar] [CrossRef]
  48. Baker, M.; Wurgler, J. Investor sentiment and the cross-section of stock returns. JFin 2006, 61, 1645–1680. [Google Scholar] [CrossRef]
  49. Fang, L.; Peress, J. Media coverage and the cross-section of stock returns. JFin 2009, 64, 2023–2052. [Google Scholar] [CrossRef]
  50. Tetlock, P.C.; Saar-Tsechansky, M.; Macskassy, S. More than words: Quantifying language to measure firms’ fundamentals. JFin 2008, 63, 1437–1467. [Google Scholar] [CrossRef]
  51. Hendricks, K.B.; Singhal, V.R. An empirical analysis of the effect of supply chain disruptions on long-run stock price performance and equity risk of the firm. Prod. Oper. Manag. 2005, 14, 35–52. [Google Scholar] [CrossRef]
  52. Fan, J.P.; Goyal, V.K. On the patterns and wealth effects of vertical mergers. J. Bus. 2006, 79, 877–902. [Google Scholar] [CrossRef]
  53. Chan, S.H.; Kensinger, J.W.; Keown, A.J.; Martin, J.D. Do strategic alliances create value? J. Financ. Econ. 1997, 46, 199–221. [Google Scholar] [CrossRef]
  54. Sadaiyandi, J.; Arumugam, P.; Sangaiah, A.K.; Zhang, C. Stratified sampling-based deep learning approach to increase prediction accuracy of unbalanced dataset. Electronics 2023, 12, 4423. [Google Scholar] [CrossRef]
  55. Roberts, D.R.; Bahn, V.; Ciuti, S.; Boyce, M.S.; Elith, J.; Guillera-Arroita, G.; Hauenstein, S.; Lahoz-Monfort, J.J.; Schröder, B.; Thuiller, W. Cross-validation strategies for data with temporal, spatial, hierarchical, or phylogenetic structure. Ecography 2017, 40, 913–929. [Google Scholar] [CrossRef]
  56. Zhang, Y.; Xiao, Y.; Zhang, Y.; Zhang, T. Video saliency prediction via single feature enhancement and temporal recurrence. Eng. Appl. Artif. Intell. 2025, 160, 111840. [Google Scholar] [CrossRef]
Figure 1. Google Trends for ChatGPT and HBM.
Applsci 15 12127 g001
Figure 2. Stock price comparison: Samsung vs. SK Hynix.
Applsci 15 12127 g002
Figure 3. Research algorithm.
Applsci 15 12127 g003
Figure 4. Word cloud: Samsung-vertical integration.
Applsci 15 12127 g004
Figure 5. Word cloud: SK Hynix-horizontal integration.
Applsci 15 12127 g005
Figure 6. Aggregate topic weights of Samsung’s vertical integration.
Applsci 15 12127 g006
Figure 7. Aggregate topic weights of SK Hynix’s horizontal alliance.
Applsci 15 12127 g007
Figure 8. t-SNE visualization of Samsung’s vertical integration by dominant topic.
Applsci 15 12127 g008
Figure 9. t-SNE visualization of SK Hynix’s horizontal alliance by dominant topic.
Applsci 15 12127 g009
Table 1. HBM keyword seeds.
CategorySeed Terms/ExamplesDescription
Core HBM TermsHBM, HBM2, HBM2E, HBM3, HBM3EAll proper noun expressions containing the term HBM
Process & Technology TermsFoundry, Packaging, 3D stacking, TSV, Interposer, Chiplet, Advanced packagingIncluding capture process, packaging, and technology-level HBM contexts
System & Architecture TermsBandwidth, Wide I/O, DRAM stack, InterconnectTerms related to memory architecture, system bandwidth, and structural design
Yield & Manufacturing TermsYield ramp, Packaging yield, Thermal stabilityIndustry terminology related to HBM manufacturing and yield performance
Table 2. Firm identifiers.
FirmIdentifiers UsedAssignment Rule
Samsung ElectronicsSamsung Electronics, Samsung, SECClassified as a Samsung document when any HBM-related expression and one of these identifiers co-occur in the same article
SK HynixSK Hynix, Hynix, SKClassified as an SK Hynix document when any HBM-related expression and one of these identifiers co-occur in the same article
Table 3. Performance benchmark results.
ModelAccuracyPrecisionRecallF1AUC
Random Forest0.87750.87810.87750.87740.9500
Support Vector Machine0.95550.95550.95550.95550.9873
Naïve Bayes0.85700.85700.85700.85700.9335
KoRoBERTa0.95640.96640.96640.96640.9851
KoElectra0.99650.99650.99650.99650.9997
Table 4. Topic modeling results of Samsung’s vertical integration.
LabelTopicKeywords (All)
Autonomy & Localization1Autonomy, Samsung, Industry, Enterprise, Investment, Management, Global, Integrated/Comprehensive, Operations, Provision, Market
Foundry-centric Architecture2Business, Samsung, Foundry, Semiconductor, Technology, Industry, Strategy, System/Regime, Management, Global, Strengthening, Solution, Manufacturing, Network, Core, Securing
Integrated Foundry & Supply3Foundry, Business, Samsung, Semiconductor, Solution, Integrated/Comprehensive, Core, Market, Supply, Network
Vertical Supplier Enablement4Semiconductor, Samsung, Enterprise, Co-growth/Companion, Cooperation, Investment, Technology, Market, Supply, Industry, Equipment, Ecosystem, Global, Test, Industry–Academia, Mutual Growth, Alliance
Contracts for Control5Management, Contract, Enterprise, Establishment, Co-growth/Mutual Growth, Joint Venture, Corporation/Legal Entity, Global
M&A & Risk Consolidation6Samsung, Merger, Management, Risk, Joint Venture, Corporation/Legal Entity, Strategy, Strengthening
Process Control7Foundry, Semiconductor, Samsung, Production, Process, Fab/Plant, Technology, Market, Outsourcing/Foundry Service, Investment, Business, Enterprise, Securing, Global, Mass Production, Development, Design, Supply, Core, Contract, Packaging, In-house, Manufacturing, Equipment, Strategy, Build-out, Ecosystem, Signing, Facilities, Utilization, Capability
Internal Partner Onboarding8Samsung, Cooperation, Enterprise, Semiconductor, Open, Alliance, Global, Solution, Industry, Investment, Joint, Co-growth, Core, Partner, Build-out, Collaboration, Strategy, Business, Components, Strengthening, Materials, Development, Local/On-site, Signing, Project, Technology, Participation
Internal Ecosystem9Samsung, Cooperation, Semiconductor, Open, Collaboration, Project, Investment, Strategy, Partner, Enterprise, Sharing, Provision, Ecosystem, Participation, In-house, Technology, Supply, Build-out
In-house Design Enablement10Development, Samsung, Technology, Platform, Business, Joint, Design, In-house, Cooperation, Strategy, Operations, Smart, Participation, Solution, Network, Ecosystem, Provision, Utilization, Quality, Consortium, Semiconductor, Project, Collaboration, Partner, Model, Global, Expansion
Table 5. Topic modeling results of SK Hynix’s horizontal alliance.
LabelTopicKeywords (All)
Partnered Tech Platform1Technology, Business, SK Hynix, Development, Strategy, Platform, Global, Management, Industry, Operations, In-house, Components, Market, Production, Quality, Materials, Network, Semiconductor, Corporate Management, Core, Risk, Cooperation
Joint Contracts & Expansion2SK Hynix, Contract, Development, Participation, Joint, Integration, Cooperation, Project, Expansion, Merger, Network
Consortium Co-design3Technology, Enterprise, SK Hynix, Semiconductor, Merger, Business, Process, Innovation, Consortium, Industry, Global, Collaboration, Joint, Participation, Securing, Solution, Foundry, Development, Synergy, Manufacturing, Fab/Plant, Utilization, Provision, Open, Joint Venture, Operations, Original/Core (source), Strengthening, Corporation/Legal Entity, Mass Production, Use, Cooperation, Market, Design, Industry–Academia
Global Open Network4Cooperation, Semiconductor, Enterprise, Global, Samsung, Business, Strengthening, Collaboration, Local/On-site, Open, Ecosystem, Partner, Merger, Technology, Sharing, Investment, Operations, Industry, Alliance, SK Hynix, Strategy, Independent, Corporate Management
Co-growth Programs5SK Hynix, Semiconductor, Co-growth/Companion, Samsung, Investment, Market, Technology, Enterprise, Ecosystem, Integrated/Comprehensive, Platform, In-house, Design, Foundry
Scale-up with Vendors6SK Hynix, Semiconductor, Samsung, Production, Foundry, Enterprise, Investment, Fab/Plant, Cooperation, Supply, Market, Equipment, Business, Packaging, In-house, Development, Supply Chain, Outsourcing/委託, Build-out, Industry, Technology, Process, Materials, Core, Alliance, Control, Test, Local/On-site, Components, Mass Production, Global
Joint Development7Cooperation, SK Hynix, Semiconductor, Development, Enterprise, Technology, Open, Samsung, Market, Global, Collaboration, Industry, Ecosystem, Solution, Strengthening, Provision, Core, Strategy, Alliance, Expansion, Partner, Model, Optimization, Platform, Adoption, Supply
Joint Entities & Risk Sharing8Fab/Plant, Investment, Samsung, Industry, Enterprise, Joint Venture, Integrated/Comprehensive, Global, Contract, Market, Corporation/Legal Entity, Risk, Management
Solution Contracting9Business, Solution, Investment, Integration, Signing, Global, Management, Contract, Industry, Innovation, Operations, Development, Platform, Enterprise, Independence, R&D, Participation, Securing, Provision, Semiconductor, System/Regime, Synergy, Partner
Partnered Tech Platform10Technology, SK Hynix, Cooperation, Partner, Joint, Global, Operations, Ecosystem, Build-out, Solution, Industry, Strategy, Utilization, Collaboration, Sharing, Network, Large-scale, Securing
Table 6. OLS analysis result (Samsung vertical integration, market valuation 2023~2025).
VariableβStandard Errortp95% CI
Constant0.0000.0290.0120.990[−0.058, 0.058]
Autonomy & Localization0.0290.0281.0510.295[−0.026, 0.083]
Foundry-centric Architecture−0.0080.031−0.2670.790[−0.069, 0.052]
Integrated Foundry & Supply0.0230.0201.1270.262[−0.017, 0.062]
Vertical Supplier Enablement0.0020.0140.1250.901[−0.025, 0.029]
Contracts for Control−0.0110.015−0.7280.468[−0.041, 0.019]
M&A & Risk Consolidation0.0300.0112.6940.008[0.008, 0.051]
Process Control0.0120.0111.0150.312[−0.011, 0.034]
Internal Partner Onboarding−0.0300.016−1.8720.063[−0.062, 0.002]
Internal Ecosystem−0.0160.015−1.0920.277[−0.045, 0.013]
In-house Design Enablement−0.0180.015−1.1880.237[−0.049, 0.012]
Currency Rate−0.4400.281−1.5640.120[−0.996, 0.116]
R-squared = 0.139, Durbin–Watson = 2.229, Log-Likelihood = 228.85, Prob (F-statistic) = 0.0378
Table 7. OLS analysis result (SK Hynix Horizontal integration, market valuation 2023~2025).
VariableβStandard ErrorTp95% CI
Constant−0.0250.041−0.6160.539[−0.106, 0.056]
Partnered Tech Platform0.0260.0390.6630.509[−0.051, 0.103]
Joint Contracts & Expansion0.0280.0380.7420.459[−0.047, 0.103]
Consortium Co-design−0.0190.025−0.7730.441[−0.068, 0.030]
Global Open Network0.0020.0230.0680.946[−0.043, 0.046]
Co-growth Programs0.0160.0200.8060.422[−0.024, 0.056]
Scale-up with Vendors0.0660.0193.4200.001[0.028, 0.104]
Joint Development0.0460.0231.9840.049[0.000, 0.091]
Joint Entities & Risk Sharing−0.0020.024−0.0660.947[−0.049, 0.046]
Solution Contracting−0.0040.022−0.1940.846[−0.048, 0.040]
Currency Rate−0.0590.038−1.5710.118[−0.132, 0.014]
R-squared = 0.129, Durbin–Watson = 1.743, Log-Likelihood = 306.57, Prob (F-statistic) = 0.0620
Disclaimer/Publisher’s Note: The statements, opinions and data contained in all publications are solely those of the individual author(s) and contributor(s) and not of MDPI and/or the editor(s). MDPI and/or the editor(s) disclaim responsibility for any injury to people or property resulting from any ideas, methods, instructions or products referred to in the content.