Article

Modelling of Exploitation Influence on Rock Mass Seismicity in Boundary Coal Pillar Areas—A Single-Longwall Option

by
Dariusz Chlebowski
1,* and
Grażyna Dzik
2
1
Faculty of Civil Engineering and Resource Management, AGH University of Krakow, Mickiewicza 30 Av, 30-059 Cracow, Poland
2
State Mining Authority, Poniatowskiego 31 St, 40-055 Katowice, Poland
*
Author to whom correspondence should be addressed.
Appl. Sci. 2025, 15(22), 12126; https://doi.org/10.3390/app152212126 (registering DOI)
Submission received: 21 August 2025 / Revised: 8 November 2025 / Accepted: 10 November 2025 / Published: 15 November 2025

Abstract

The article is devoted to the issues of designing the exploitation of a seam deposit in the boundary areas of underground mines in terms of minimizing the risk of dynamic phenomena. Its main goal was to attempt to demonstrate the relationship between the method of extracting resources trapped in the boundary pillar and the magnitude of the induced seismicity of the rock mass accompanying this process. The substantive considerations concerned the single-wall model and were divided into two main parts—theoretical and verification. As part of the theoretical piece, based on model studies, a geomechanical assessment of the impact of the working face advance on changes in the stress–strain behaviour occurring in the burst-prone layer in terms of the possible loss of continuity of its original structure was carried out. The starting point for the key analyses were the results of numerical simulations based on the algorithms of S. Knothe and W. Budryk’s theories in combination with classical solutions of the mechanics of deformable bodies. Two variants of mining operations in a two-sided environment of goaf were considered, differing in the direction of progress, the degree of constraint of the start and end of the face advance, and mining circumstances in the vicinity of both sides of the advancing face. As part of the verification piece, the results of model analyses were related to an example polygon of a crossing longwall in one of the functioning, rockburst USCB hard coal mines. The scope of the research included a comparison of the experimentally indicated zones of occurrence of tremor-favourable effort processes in the roof of the seam with the actual location of the seismic phenomena foci recorded during the ongoing exploitation. The considerations included in the work formed the basis for formulating conclusions of a cognitive and applicable nature.

1. Introduction

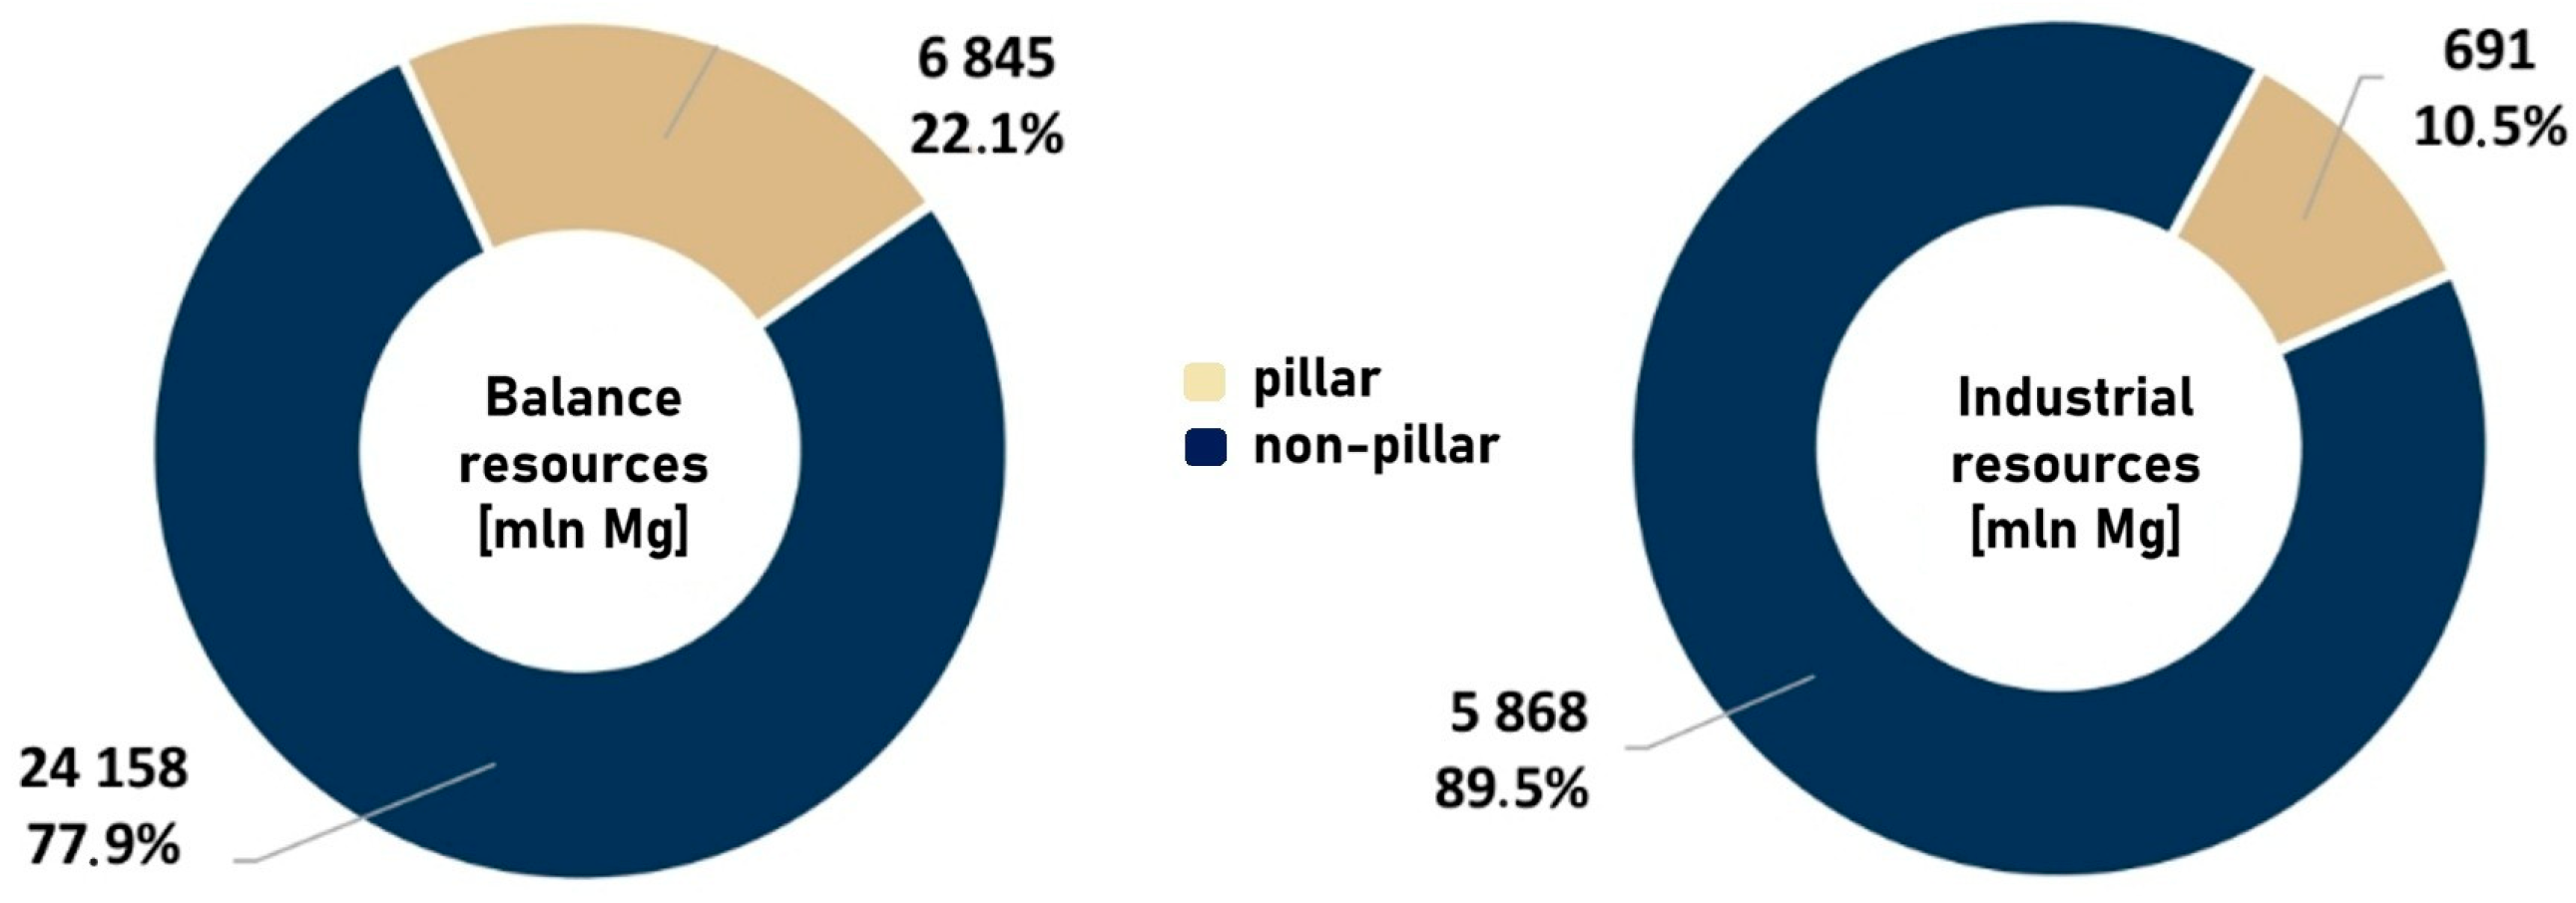
The exploitation of hard coal deposits in the Upper Silesian Coal Basin (USCB) region in Poland is concentrated in 19 combined mines that conduct mining activities in mining areas (MAs) with a total area of ~3000 km2 [1]. At the stage of mine construction, in accordance with the requirements of the licencing authorities, the boundaries of each MA were established, along with the so-called boundary pillars adjacent to them, the dimensions of which have undergone numerous, more or less significant modifications over the decades of operation. The consequence of this state of affairs is the fact that significant coal resources have been trapped within the unmined fragments of deposit massifs with irregular shapes and varied geometry. Available data indicate that, taking into account all types of pillars (protective, boundary, supporting, water) present as of the end of 2020, the total percentage of pillar resources in the USCB was 10.5% of the total industrial resources and 22.1% of the balance resources (Figure 1) [2]. In view of the potentially unfavourable stress–strain behaviours prevailing around the created pillars, the depletion of the discussed resources will generally be associated with an intensification of the scale of natural hazards, creating the risk of water, gas, and seismic disasters. The situation is particularly dangerous in circumstances when we are dealing with complex geological and mining conditions, including, in addition to great depths of occurrence, the presence of tectonic and sedimentary disturbances, as well as edges and remnants left in adjacent seams, or thick and cohesive sandstone–mudstone formations in the main roof, capable of accumulating elastic energy [3]. Therefore, the proper design of mining operations aimed at the possible development of pillar deposit resources in the future is crucial from the point of view of both the safety of the employed crews and the efficiency of the extraction processes.
Considering the subject matter of this work, which focuses on seismic hazards in the vicinity of boundary pillars, it is worth mentioning that in the years 2010–2022, approximately 380 high-energy tremors (≥105 J) were recorded in areas directly adjacent to the MA boundaries, which constituted 10.6% of the total population of tremors within the overall seismic activity recorded in hard coal mines. The discussed group of phenomena included 33 tremors with an energy of 105 J (~5% of all in this energy class), 252 tremors with an energy of 106 J (~10%), 46 with an energy of 107 J (~12%), 5 with an energy of 108 J (~15%), and 2 of 109 J (~33% of all in this energy class) [1]. Interestingly, the presented statistics show that the higher the energy order of high-energy tremors, the greater the observed percentage of these phenomena in the population of analyzed tremors.
Despite the relatively rich literature on the issue of broadly understood induced seismicity, there is a general lack of studies addressing the impact of the method and/or principles of exploitation on the seismic hazard magnitude in relation to constrained geological or mining conditions [4,5]. An important aspect in the design of exploitation of rockbursting seams, and, in particular, in the case of all kinds of pillar remnants (also at the boundaries of the MA), is rock mass state assessment, which is usually conducted on the basis of geomechanical, geophysical, or mining analyses. It seems that in this area, geomechanical solutions (analytical, numerical) generally dominate in bibliographic sources; nevertheless, the number of scientific works that study forecasting in the vicinity of deposit pillars, taking into account their impact on the surrounding rock, is modest. Using geomechanical assessments, the problem of determining the impact of exploitation on the stability of vertical shafts in terms of the requirements related to the establishment of protective pillars for this type of object [6,7] or safety pillars related to water hazard [8,9,10] was undertaken. Solutions that are aimed at establishing the relationship between the geometry of the exploitation parcel and the formation of the stress behaviour along the supporting pillars as a function of different depth horizons can be found [11,12,13]. Modelling studies were carried out on the stability of barrier pillars during the exploitation of two adjacent parcels under conditions of significant seam angles [14,15]. The influence of the structure and properties of the roof and floor formations on the strength of the separated coal pillars was analyzed as a function of different geometries, including the rock body, mine workings, or mining fields [16,17,18,19]. There are more general works indicating the need for an individual approach to the design of deposit pillars, including the necessity to take into account additional, specific factors for specific cases that determine their stability [20,21,22]. A specific group of publications concerns the study on the mechanisms of rock mass fracturing in the vicinity of pillars and irregular remnants, which is also in the circumstance of the possible superposition of the effects of extensive goaf surfaces [23]. Calculations and analyses were carried out in the field of the occurrence of effort processes within the inter-chamber pillars [24,25] and roof layers [26,27], in relation to chamber pillar exploitation systems. Geomechanical methods were used to forecast the rock mass condition and the dimension of unfavourable stress zones associated with the interaction of different configurations of exploitation edges in the context of the formation of rockburst hazards [28,29,30]. They were often form the basis for determining the characteristics of the rock mass, which is prepared for assessing the rockburst propensity of the rock mass (including coal) based on factor procedures [31,32,33].
In the source literature, references can also be found in the geometric-integral theory of S. Knothe and W. Budryk [34] which was used in their work. It is widely used for prognostic calculations of impacts on the ground surface caused by mining activities related to the exploitation of coal deposits [35,36,37], salt [38,39], as well as metal ores [40], also in the areas of protective pillars [41] and shaft areas [42,43]. Based on its assumptions, surface deformations arising during exploitation with caving, protection, and roof deflection systems are predicted, including the effects of salt caverns left without liquidation [44]. There are publications on the accuracy of determining the parameters of the Knothe–Budryk theory, depending on the specifics of local geological and mining conditions and the impact of their values on the quality of forecasts [45,46]. Based on the review presented, we can say that although the theory is quite widely used by many authors, the considerations concern mostly issues related to the surface of mining areas. There are few mentions of its application to deformation processes occurring inside the rock mass.
The article presents the results of model studies, the intention of which is to attempt to confirm the impact of the method of single-wall exploitation in a two-sided environment of goafs, constituting a boundary pillar on the seismic hazard magnitude originating from the burst-prone layer overlying the deposit roof. The possibility of generating seismic phenomena was equated with effort–energy changes occurring in the structure of the layer as a result of the undercutting process caused by the movement of the longwall. Since the observation of these changes based on the developed geomechanical models required knowledge of the components of the displacement and strain state, the solution provided by S. Knothe and W. Budryk [34] was used to define them inside the rock mass. Despite the passage of time, the algorithms of the theory are still relevant and widely used, although usually in a substantively different approach than presented in the article, and namely in the forecasting of terrain surface deformation. Therefore, they have been the subject of many studies and analyses, and thus the results obtained have been verified and confirmed in practice. Also, the basic parameters of the theory have been repeatedly determined in the past and subjected to thorough scientific discussion. It is precisely in reaching back to older methods—that are not dedicated to solving specific tasks of rock mass mechanics but are still used in mining geodesy—that the authors see elements of originality in the approach proposed in the article.
For comparative and verification purposes, the results of the numerical simulation were related to an example polygon of a crossing longwall in one of the operating hard coal mines of USCB, which is threatened by rockbursts. The task of the comparisons was to check the usefulness of the applied forecasting method in engineering practice for the needs of pre-emptive planning and the selection of preventive measures in the field of hazard combating.

2. Materials and Methods

As indicated in the introduction, the main objective of the work was to assess—based on model studies—the impact of exploitation of the deposit in the area of the boundary pillars of underground mines on the formation of dynamic phenomena hazard. Identifying the relationship between induced seismicity of the rock mass and the methods of conducting mining operations is important both from cognitive and applicational perspectives. It allows, among others, for the development of a proper exploitation project, and thus the implementation of long-term rockburst prevention that is appropriately adapted to local geological and mining conditions,.

2.1. Assumptions for the Assessment of the Possibility of Activation of Burst-Prone Formations

From the experiences in hard coal mines, it appears that in the vast majority of cases, the generation of seismic phenomena (in particular, high-energy ones) as a result of mining activities is due to the processes of destruction occurring in the zone of potentially burst-prone roof formations with high strength parameters. These processes are a consequence of changes in the heterogeneous deformation–stress states formed within them, the nature of which is additionally related to specific geological conditions and the physical and mechanical properties of the rock mass. Therefore, the assessment of seismic hazard accompanying exploitation in the vicinity of boundary pillars covered in this article is based precisely on the observation of the variability of deformation–stress distributions on the horizon of the burst-prone layer.
The starting point for defining the state of displacement and strain within the rock mass was the geometric-integral algorithms of the exploitation influence theory by S. Knothe and W. Budryk [34]. The choice of the mentioned theory was dictated by many factors, among which the fact that it is widely used in mining geodesy to predict the effects of underground exploitation on the ground surface should be mentioned foremost. In connection with the above, it has been the subject of many studies and analyses, and consequently, its results have been practically verified and experimentally confirmed. From a mathematical point of view, it is relatively uncomplicated and operates with formulas defined in a closed form, which means it is characterized by excellent numerical efficiency. It requires the acceptance of essentially only three parameters, the values of which have also been repeatedly determined in the past and subjected to thorough scientific discussion. In the case of theoretically more advanced and precise existing numerical tools for calculating strain, stress, and energy states of the rock mass, knowledge of the values for a larger number of strain and the effort parameters of the rock mass is usually required. To obtain them, a more accurate recognition of the rock mass structure is necessary, which may constitute a significant technical problem, effectively blocking the full use of the potentially greater possibilities of numerical methods. Since the result of the calculations cannot be more accurate than the least accurate data that are taken into account, an approach based on verified, although not very complicated, geomechanical models for the needs of engineering forecasts seems fully rational. In contrast to them, numerical studies, especially in situations of multi-variant analyses of large volumes of the rock mass, are also associated with being significantly more time-consuming, both at the stage of model development and the course of computational processes. The Knothe–Budryk theory, like any other, of course, has certain limitations. It involves, among other things, the necessity of adopting appropriate simplifying assumptions within the idealization of the rock mass (homogeneity, continuity, isotropy). Therefore, it may not fully reflect the complex effort processes, the distribution of elastic shear strain energy, and the nature of stress redistribution in the rock mass, in terms of the assessment of seismicity induced by underground exploitation. Due to its standard purpose (impact on the surface), the theory allows for the calculation of deformations of rock formations overlying the exploited seam; therefore, it takes into account the remnants of occurrences located above the level of the seismic layer, and it would be necessary to use its additional extensions and modifications. This does not pose a major problem; therefore, despite the mentioned shortcomings, the theory can undoubtedly be useful in practical applications and has development potential.
The method used is based on geometric relationships concerning the exploited deposit and the resulting deformations of the ground surface, where the main assumption is the adoption of the influence function as a normal (Gaussian) distribution of vertical displacements of the rock mass caused by underground activity. In order to determine the value of this parameter (vertical displacement) in the asymptotic state in the situation of a three-dimensional state of displacement, an elementary operating field in the shape of a rectangle is considered here, and when determining the horizontal components, the assumption regarding the linear relationship between inclinations and horizontal displacements, and consequently also curvatures and horizontal strains [47,48], is taken into account. Applying Hooke’s law, it is possible to move from the state of the strain directly to the expressions defining the individual axial stress tensor components (normal σi, tangential τij, where i, j = x, y, z) at the considered place of the rock mass. In order to determine the principal stresses (σ1, σ2, σ3), one can use a method based on Cardano’s formulas for the roots of the secular equation of Laplace [49]:
σ 3 + J 1 σ 2 J 2 σ + J 3 = 0
The algorithm consists of first determining the appropriate invariants (two J2, J3, are sufficient) for a given stress state tensor described in a fixed Cartesian coordinate system, and then calculating the parameter Δ [50]:
J 2 = 1 6 σ x σ y 2 + σ x σ z 2 + σ y σ z 2 + τ x y 2 + τ z x 2 + τ y z 2
J 3 = σ x p σ y p σ z p + 2 τ x y τ z x τ y z σ x p τ y z 2 σ y p τ z x 2 σ z p τ x y 2
= 1 4 J 3 2 1 27 J 2 3
Due to the symmetry of the stress tensor, the situation where Δ > 0 will not be able to occur; however, refer to the following remaining cases:
If the value of Δ < 0, then the solution of Equation (1) has three different elements, and the expressions defining the principal components describe the following formulas:
σ 1 = 1 3 σ x + σ y + σ z +   4 3 J 2 c o s 1 3 a r c c o s 3 3 2 J 3 J 2 3 / 2
σ 2 = 1 3 σ x + σ y + σ z +   4 3 J 2 c o s 1 3 a r c c o s 3 3 2 J 3 J 2 3 / 2 + 2 π 3
σ 3 = 1 3 σ x + σ y + σ z +   4 3 J 2 c o s 1 3 a r c c o s 3 3 2 J 3 J 2 3 / 2 + 4 π 3
If Δ = 0 and at the same time J3 ≠ 0, then the solution of the equation has one double element and one single element, and the expressions for the principal components are, respectively, as follows:
σ 1 = σ 2 = 1 3 σ x + σ y + σ z   J 3 2 3
σ 3 = 1 3 σ x + σ y + σ z + 2   J 3 2 3
If Δ = 0 and J3 = 0, then the solution of the equation has one triple element, and the principal components are as follows:
σ 1 = σ 2 = σ 3 = 1 3 σ x + σ y + σ z
Since changes in the stress/strain state occurring in deformed rock layers are followed by changes in potential elastic energy, in analyses of the behaviour of the rock mass in terms of conducting deposit exploitation, one can also use (besides principal stresses) the distributions of the density of elastic strain energy of shear change (Af), volumetric change (Av), and total (Ac), which are defined as follows [26,49]:
A f = 1 + ν s 6 E s σ x σ y 2 + σ y σ z 2 + σ z σ x 2 + 6 τ x y 2 + τ z x 2 + τ y z 2
A v = 1 2 ν s 6 E s σ x + σ y + σ z 2
A c = 1 2 E s σ x 2 + σ y 2 + σ z 2 2 ν s σ x σ y + σ y σ z + σ z σ x + 2 1 + ν s τ x y 2 + τ z x 2 + τ y z 2
From the perspective of rock mass mechanics, the condition for the occurrence of effort processes in a rock mass is the achievement of critical effort in a specific area, which is a function of the stress state and strength properties. Therefore, for the purposes of estimations regarding the possibility of the destruction of the original rock structure, Coulomb–Mohr (C-M) hypotheses are commonly used. For the interpretation of critical effort zones within burst-prone roof formations, the C-M criterion was used in this work. For this purpose, an effort factor (Ω) was defined, which, written as a function of the components of the elastic strain energy accumulated in the burst-prone layer (Af, Av, Ac), takes the following form [26,51]:
Ω = 3 E s 1 + ν s R c R r A f + s i g n σ x + σ y + σ z R c R r R c R r 6 E s 1 2 ν s A v
where
Rc, Rr—instantaneous compressive and tensile strength, Pa,
Es, νs—Young modulus and Poisson ratio of the medium, Pa, -.
Since the densities of the elastic energy components are positive definite values (similar to material constants), by referring to the expression which describes the stress indicator (14) in the context of its value as a measure of the effort of the primary structure under circumstances of forced deformation/loading, the two separate cases can essentially be distinguished. The first includes the factor range −1 < Ω < 1, which means that in a given area of the rock mass, the actual effort is less than the critical; therefore, the destruction process will not occur. The second, when Ω ≥ 1 or Ω ≤ −1, is identical to the situation in which, in the considered area, the mentioned factor is greater than the critical one, and therefore the destruction process will occur.
Among the discussed parameters characterizing the changes in the rock mass under the influence of exploitation in the area of the boundary pillar, the formation of the values of the three parameters was selected for observation and analysis, namely the stress component determined for the first principal direction (σ1), the density of elastic shear strain energy (Af), and the effort factor (Ω), with their dimensionless concentration coefficients described by the ratio of a specific parameter for secondary and primary (lithostatic) conditions being used:
k σ 1 = σ 1 s e c σ 1 p r m                       k A f = A f s e c A f p r m                       k Ω = Ω s e c Ω p r m
The primary advantage of using such defined coefficients instead of nominal absolute values was, among others, effectively eliminating the influence of certain deposit characteristics, including deposition depth and dip angle. This made the assessments more universal and allowed for variant analyses and synthetic comparison of the calculation results. Particular attention in the analyses was paid to the maximum values of individual coefficients that determine the state of the rock mass, as well as to the geometry, size, and extent of the anomalous zones described by them. In view of the above, when it came to the stress state, it was decided that its principal components would be used, which are extreme normal stresses regardless of the coordinate system, among which the first direction (σ1) is characterized by stresses of the highest value, and thus is the most conducive to the development of effort processes. In the sphere of elastic strain energy, the focus was on a part responsible for shear strains (Af), the magnitude of which in conditions of an arbitrarily complex, irregular stress state can be treated as the most reliable in the context of the planned geomechanical assessment profile. In turn, the choice of the Coulomb–Mohr strength hypothesis resulted primarily from its wide applicability (and thus versatile verifiability) in soil/rock mechanics for solving engineering problems.
The use of the Knothe–Budryk theory [34] to solve the research task used in the work was driven by the necessity of adopting specific assumptions regarding the rock mass undergoing deformation under the influence of specific mining activities, characterized by the shape/size of the exploitation fields, the depth of foundation, the height of the gate, and the roof control factor. The structural and mechanical properties of the modelled rock mass were therefore described by the tangent of the influence dispersion angle (tgβ) and strain parameters (Young modulus Es, Poisson’s ratio νs), and for the purposes of effort analysis—additionally, the instantaneous compressive strength (Rc) and tensile strength (Rr). Since the discussed method of predicting deformations as a result of underground mining activity was originally developed for the surface, and only later extended to the space inside the rock mass, in connection with the burst-prone layer (above the exploited seam), which is the object of the conducted research, a brief comment is required on the adopted function of the variability of the radius of the main influence range (r(z)). In this work, one of the possible solutions in this area was used, namely the relationship given by Budryk [48] and supplemented over the years by Drzęźla [52] in the following form:
r z = r ( H ) z + z 0 H + z 0 n
Beyond the depth of exploitation (H) and the range of influence on the surface (r(H)), the expression is a function of the vertical distance between the seam and the considered horizon in the rock mass (z), and the parameter (z0) is dependent on the size of the radius of the range of influence in the roof of the exploited seam (rs), according to the mutual relationship:
z 0 = r s r H H n / 1 r s r H n
The interfering exponent (n) in square is the coefficient of the boundary influence area, which determines the shape of the subsidence trough within the rock mass, the value of which varies in the interval 0.41–0.73 [53].

2.2. Geomechanical Models and the Concept of Simulation Studies

As part of the research aimed at determining a possible relationship between the formation of seismic hazards in boundary regions and the method of underground exploitation, a series of numerical simulation analyses was carried out based on a specially developed application programme in the Wolfram Mathematica language (Mathematica package ver. 11.1, [54]). The Wolfram Mathematica software is a comprehensive environment for performing numerical calculations and creating applications. Implementing your own algorithms is relatively simple and involves sending direct commands to the computational system’s kernel, formulated in a symbolic language. In the first instance, mathematical dependencies describing the components of the displacement and strain state (resulting directly from Knothe–Budryk’s theory along with Formulas (16) and (17)) were introduced into the screen editor of the language compiler. Based on this, the values of the stress tensor components (according to spatial Hooke’s law) were calculated, followed by the density of elastic shear strain energy (according to Formulas (11)–(13)). In the next step, principal stresses were determined (Formulas (1)–(10)), followed by the effort factor (14) and defined concentration efforts (15). The correctness of the implementation of the procedures within the validation of the computational module was checked through experiments consisting of comparing the results of numerical calculations performed by the programme with the results of analytical calculations. Tests were conducted for simple examples under conditions of plane strain state, e.g., various configurations of a single, large excavation field with a regular rectangular shape.
According to the adopted research concept, the considerations were divided into several stages. In the first stage, a hypothetical mining situation was modelled, illustrating the process of production in the vicinity of the boundary of the MA of a deposit pillar with a width of 250 m (with a conventional meridian direction) in a coal seam lying at a specific depth, according to the following scheme:
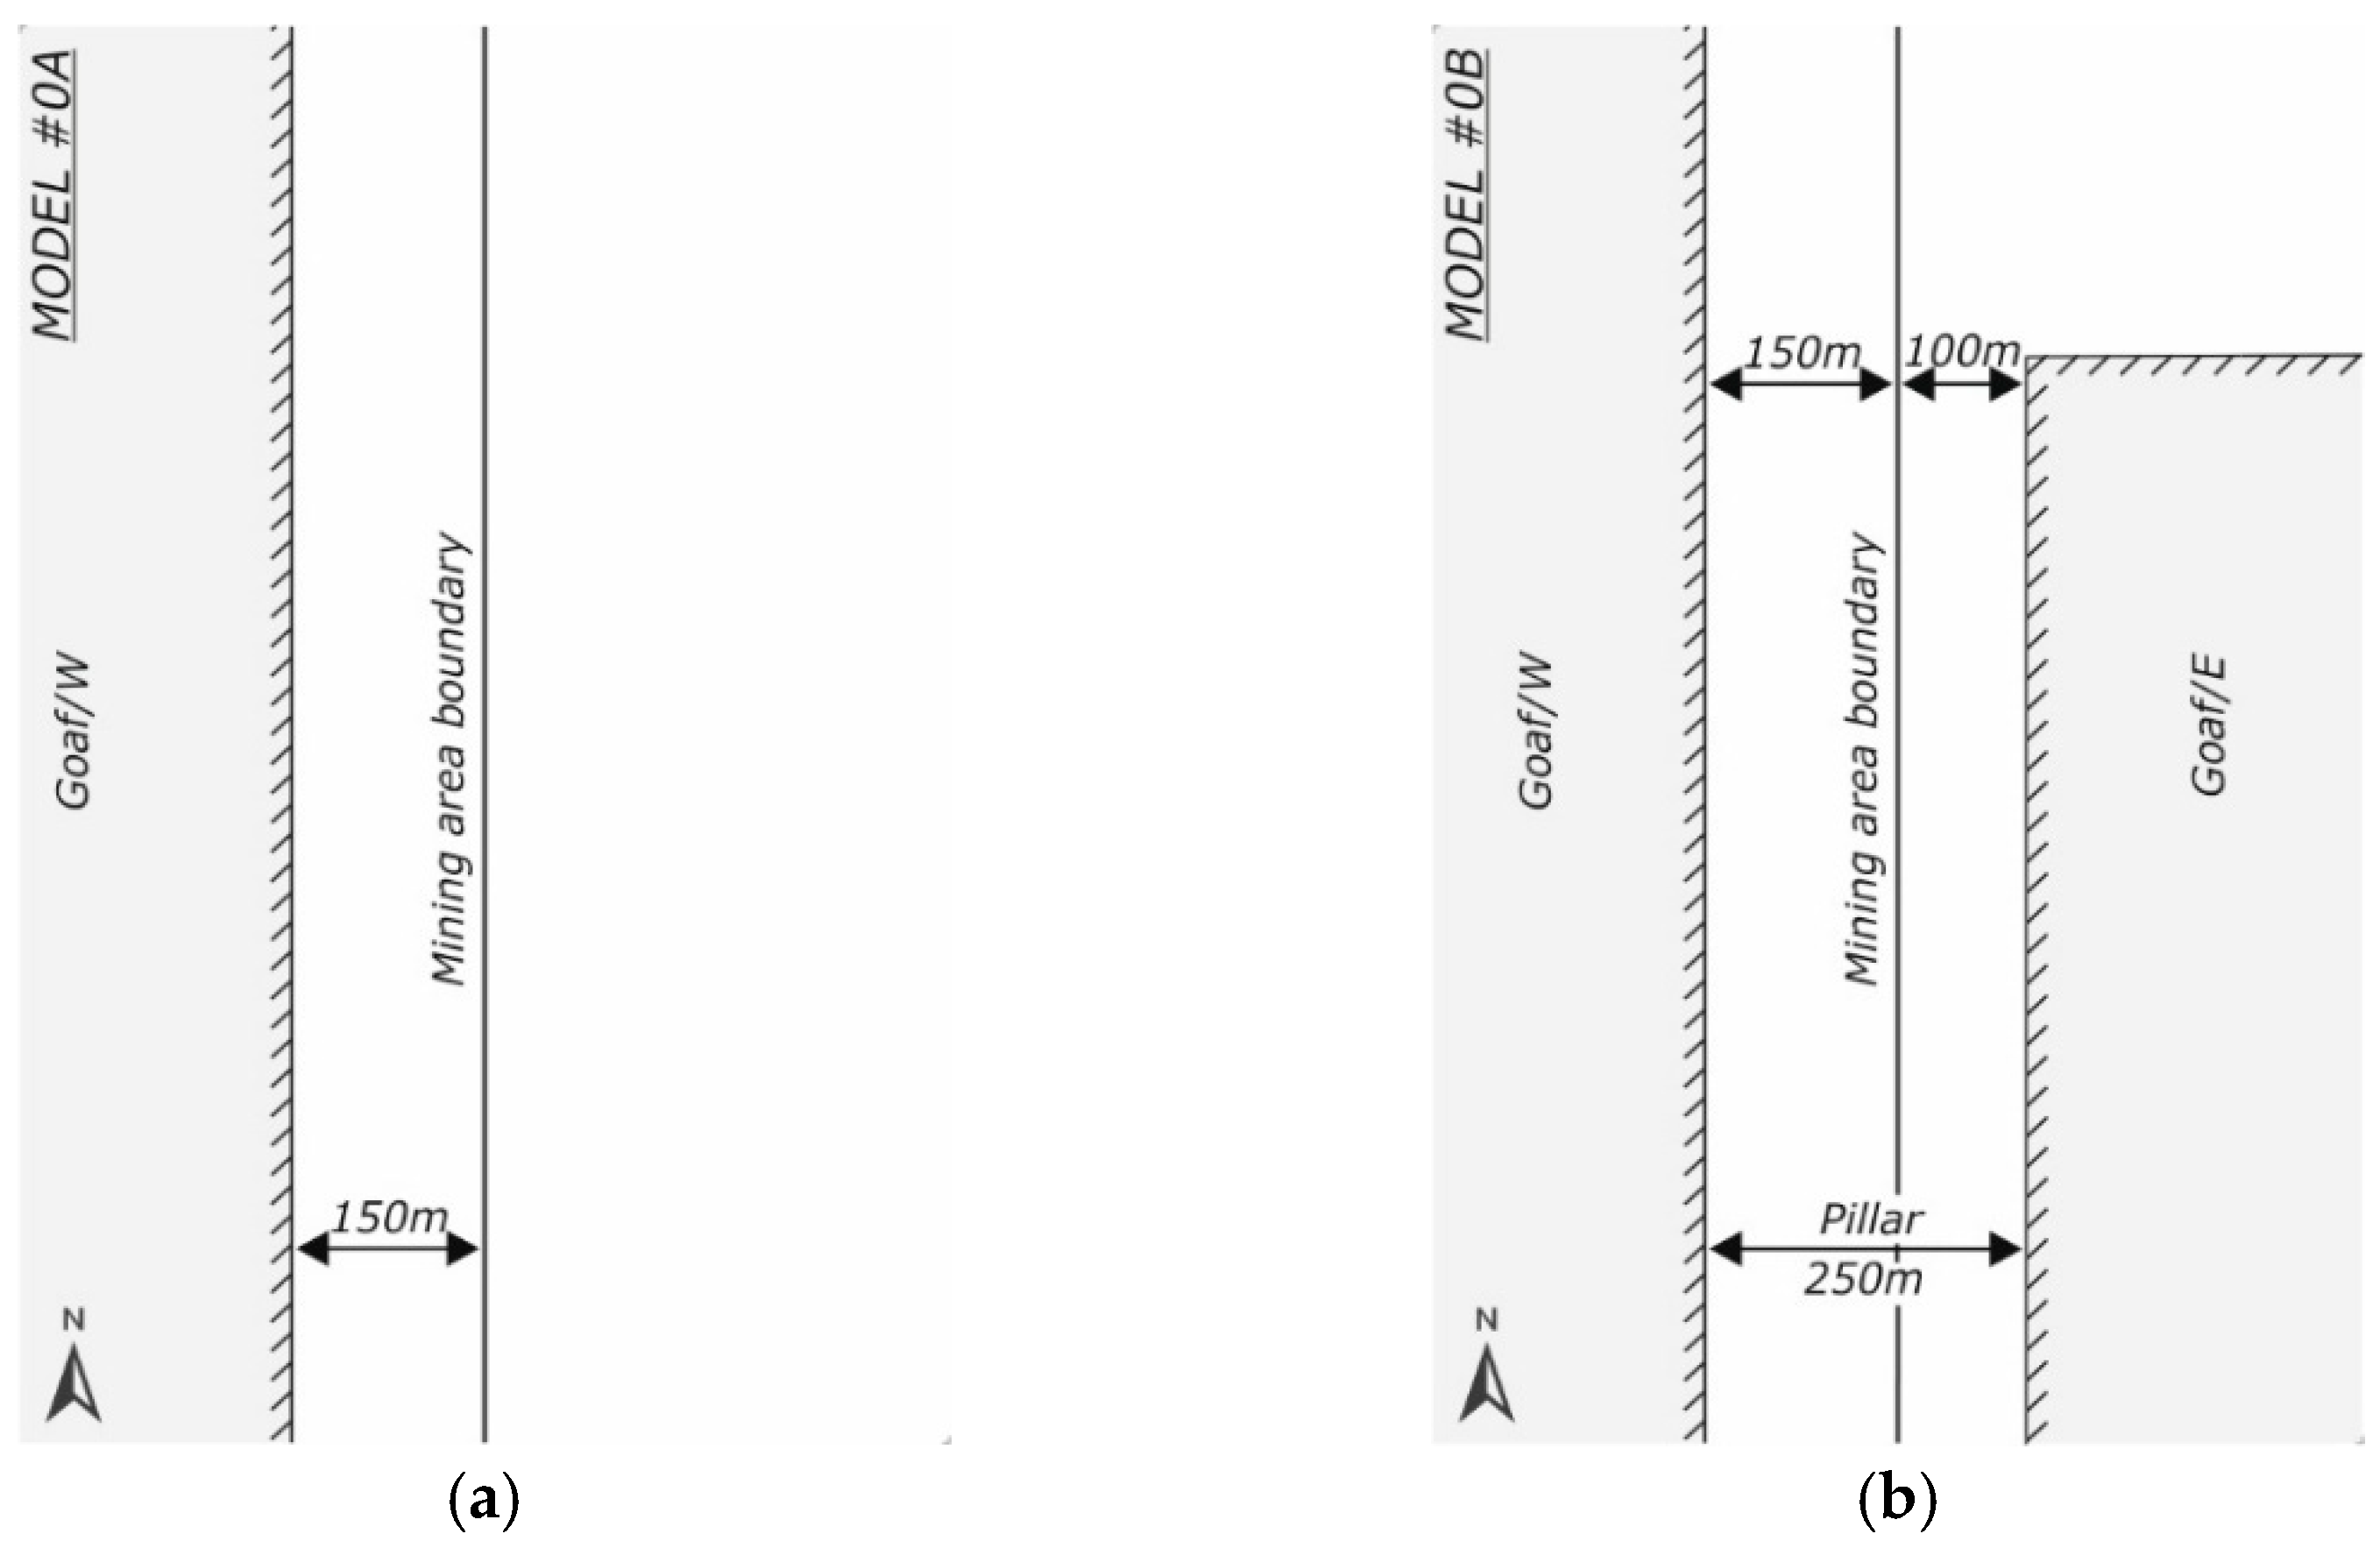
First step: Development of the goaf surface on the western side (goafW), resulting in the final position of the goaf edges at a distance of 150 m from the MA boundary (Model #0A) (Figure 2a).
Second step: Further development of the goaf on the eastern side (goafE), resulting in the final position of their edges at a distance of 100 m from the MA boundary (Model #0B) (Figure 2b).
It was assumed that the geometric dimension of the selected extraction is large enough to cause the formation of an overfull, asymptotic subsidence trough on the ground surface, which should translate into extreme (from the point of view of seismicity, more unfavourable) values of the components of deformation–stress (energy–effort) states, regardless of the calculation level considered. In turn, taking into account the need to present a more complex mining situation in terms of later tracking of changes in the seismic hazard magnitude in the vicinity of the boundary pillar, symmetry of the remnants on both sides of the MA boundary was consciously abandoned (Figure 2b). Given the lack of superposition of influences initially verified for the final mining situation, analyses with the reverse order of creating both goaf surfaces (i.e., first goafE, then goafW) were abandoned. In further stages, the conduct of longwall mining in the area of the isolated (according to Model #0B being treated as a base) deposit belt was simulated, based on all possible and sensible methods of conducting the working faces from a mining point of view. The considered variants of the implementation of mining works, each time aimed at the complete liquidation of the pillar (obtaining the resources trapped there), included single- and multi-face schemes, given different directions of working face advance, working face lengths, and the order of selecting individual parcels. Due to the multitude of the results obtained and the extensive documentation illustrating them, this article is devoted exclusively to the single-face scheme, extracting the resources trapped in the pillar in a two-variant manner:
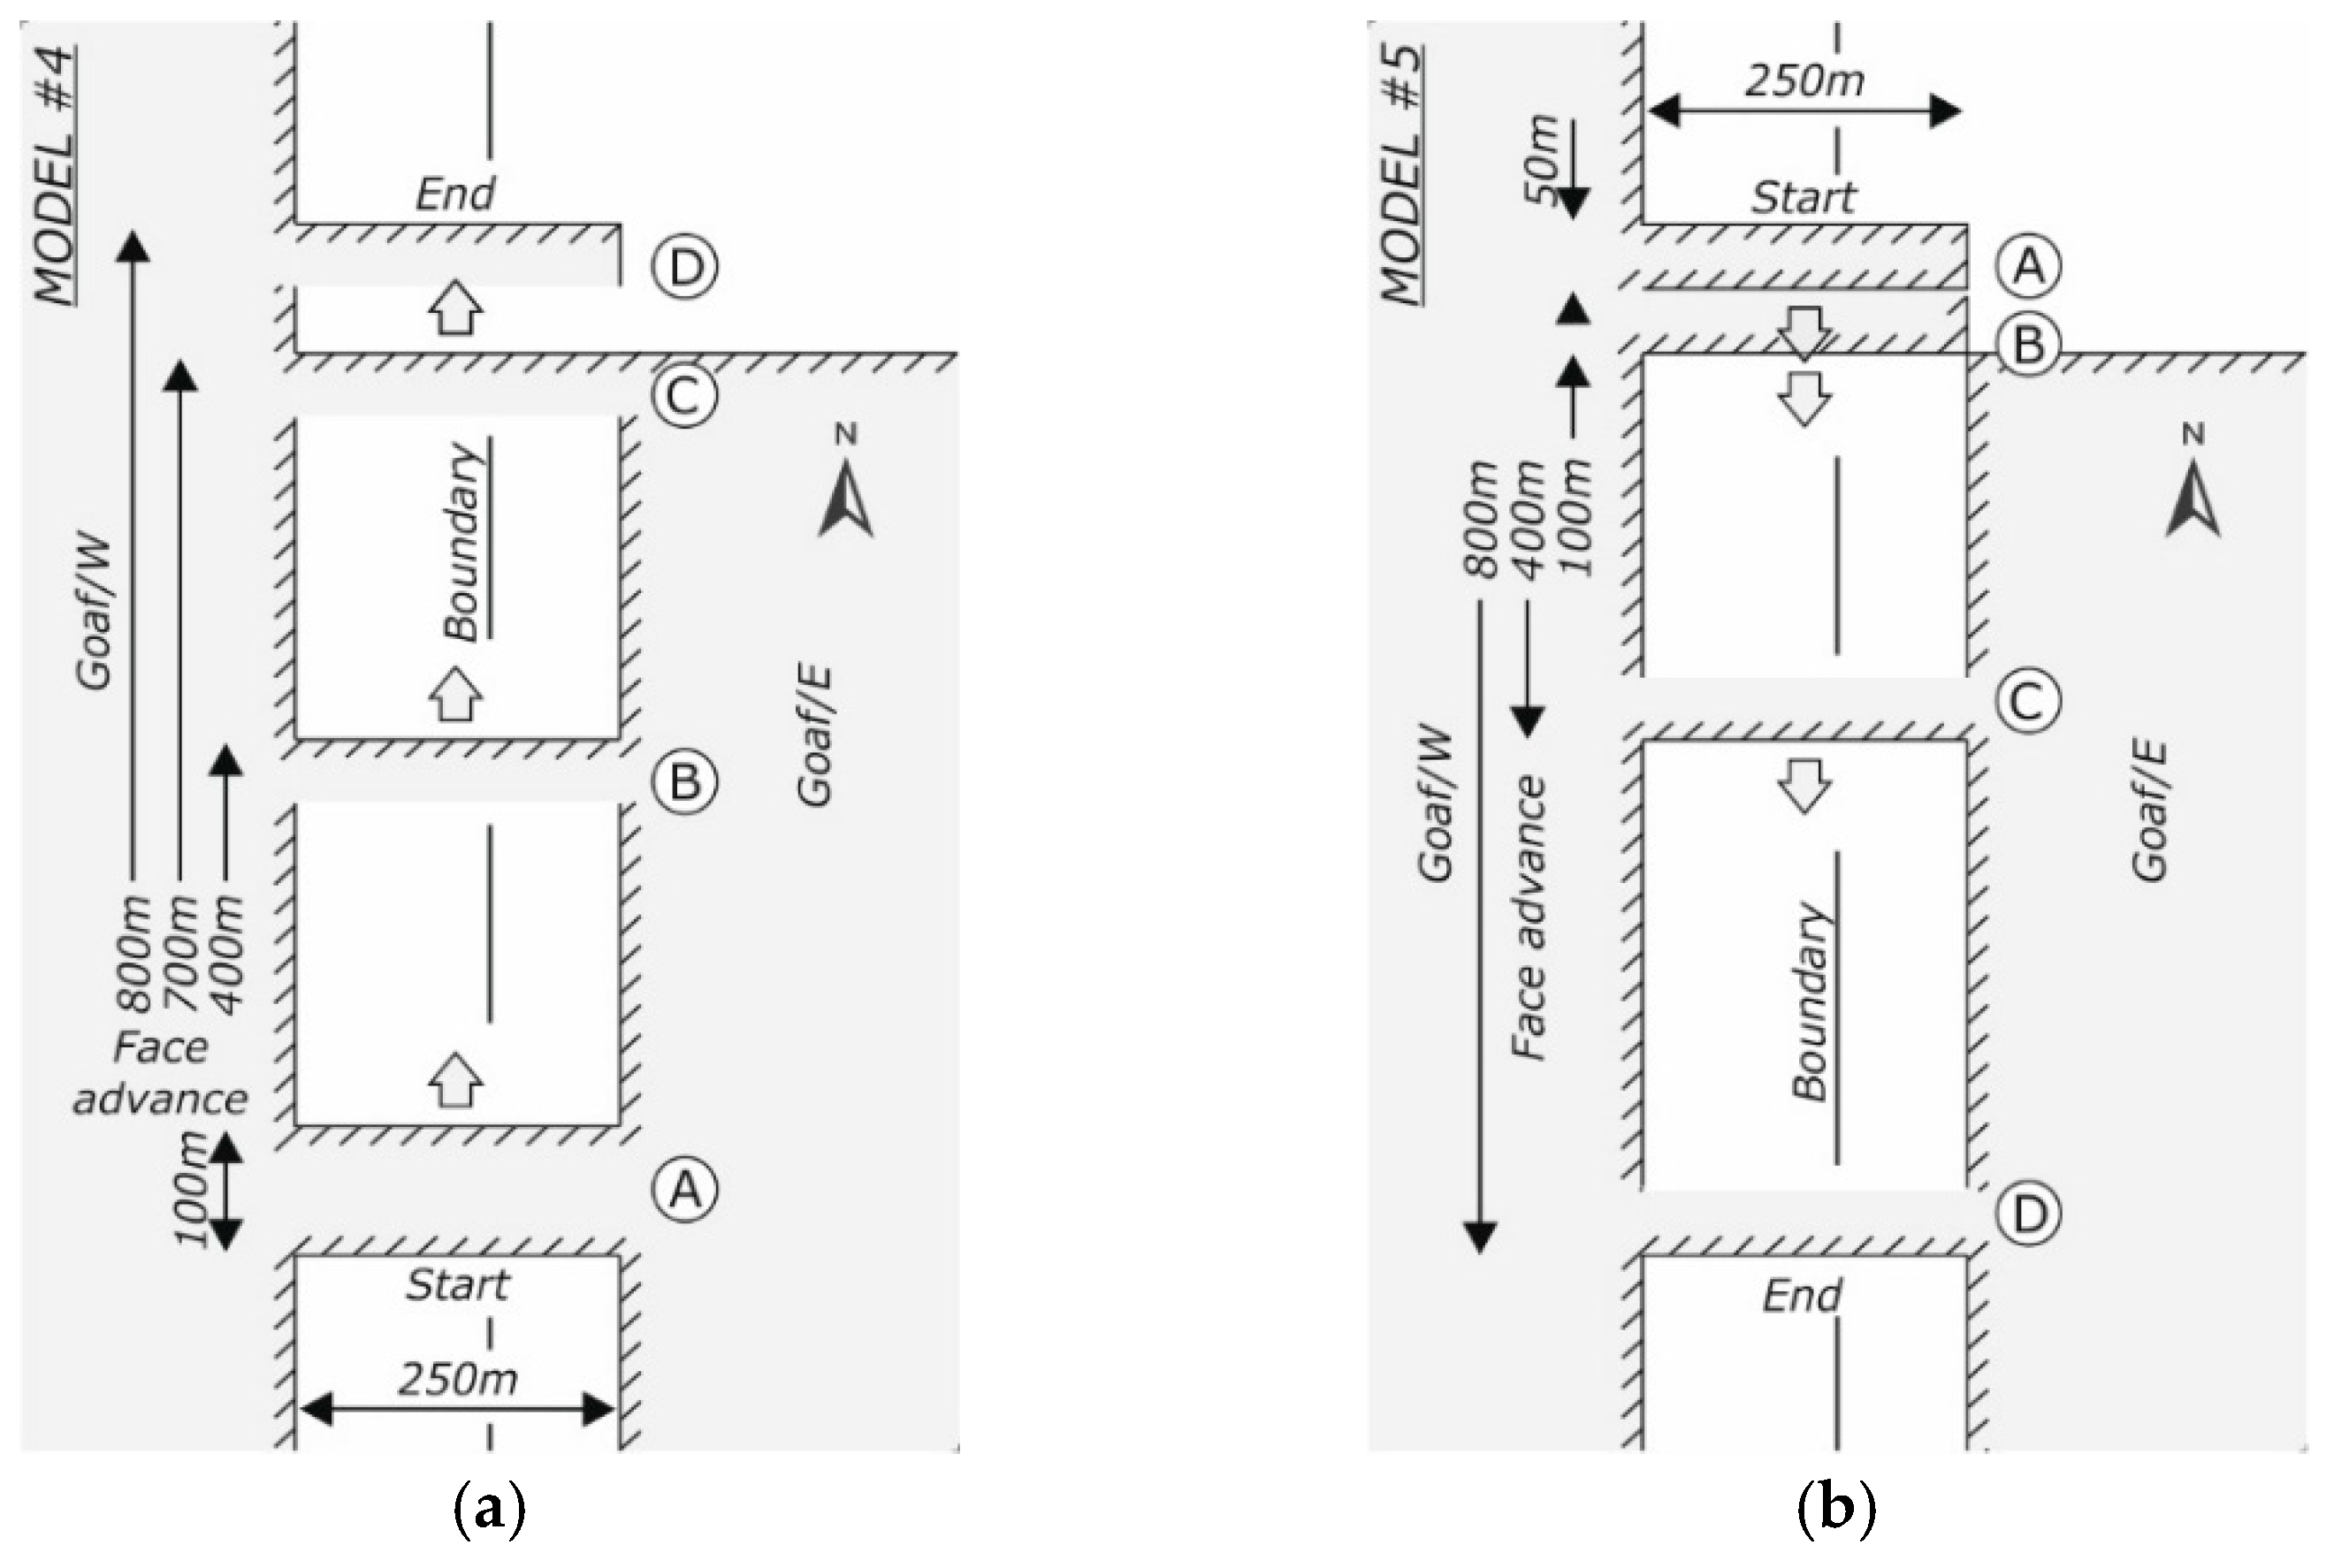
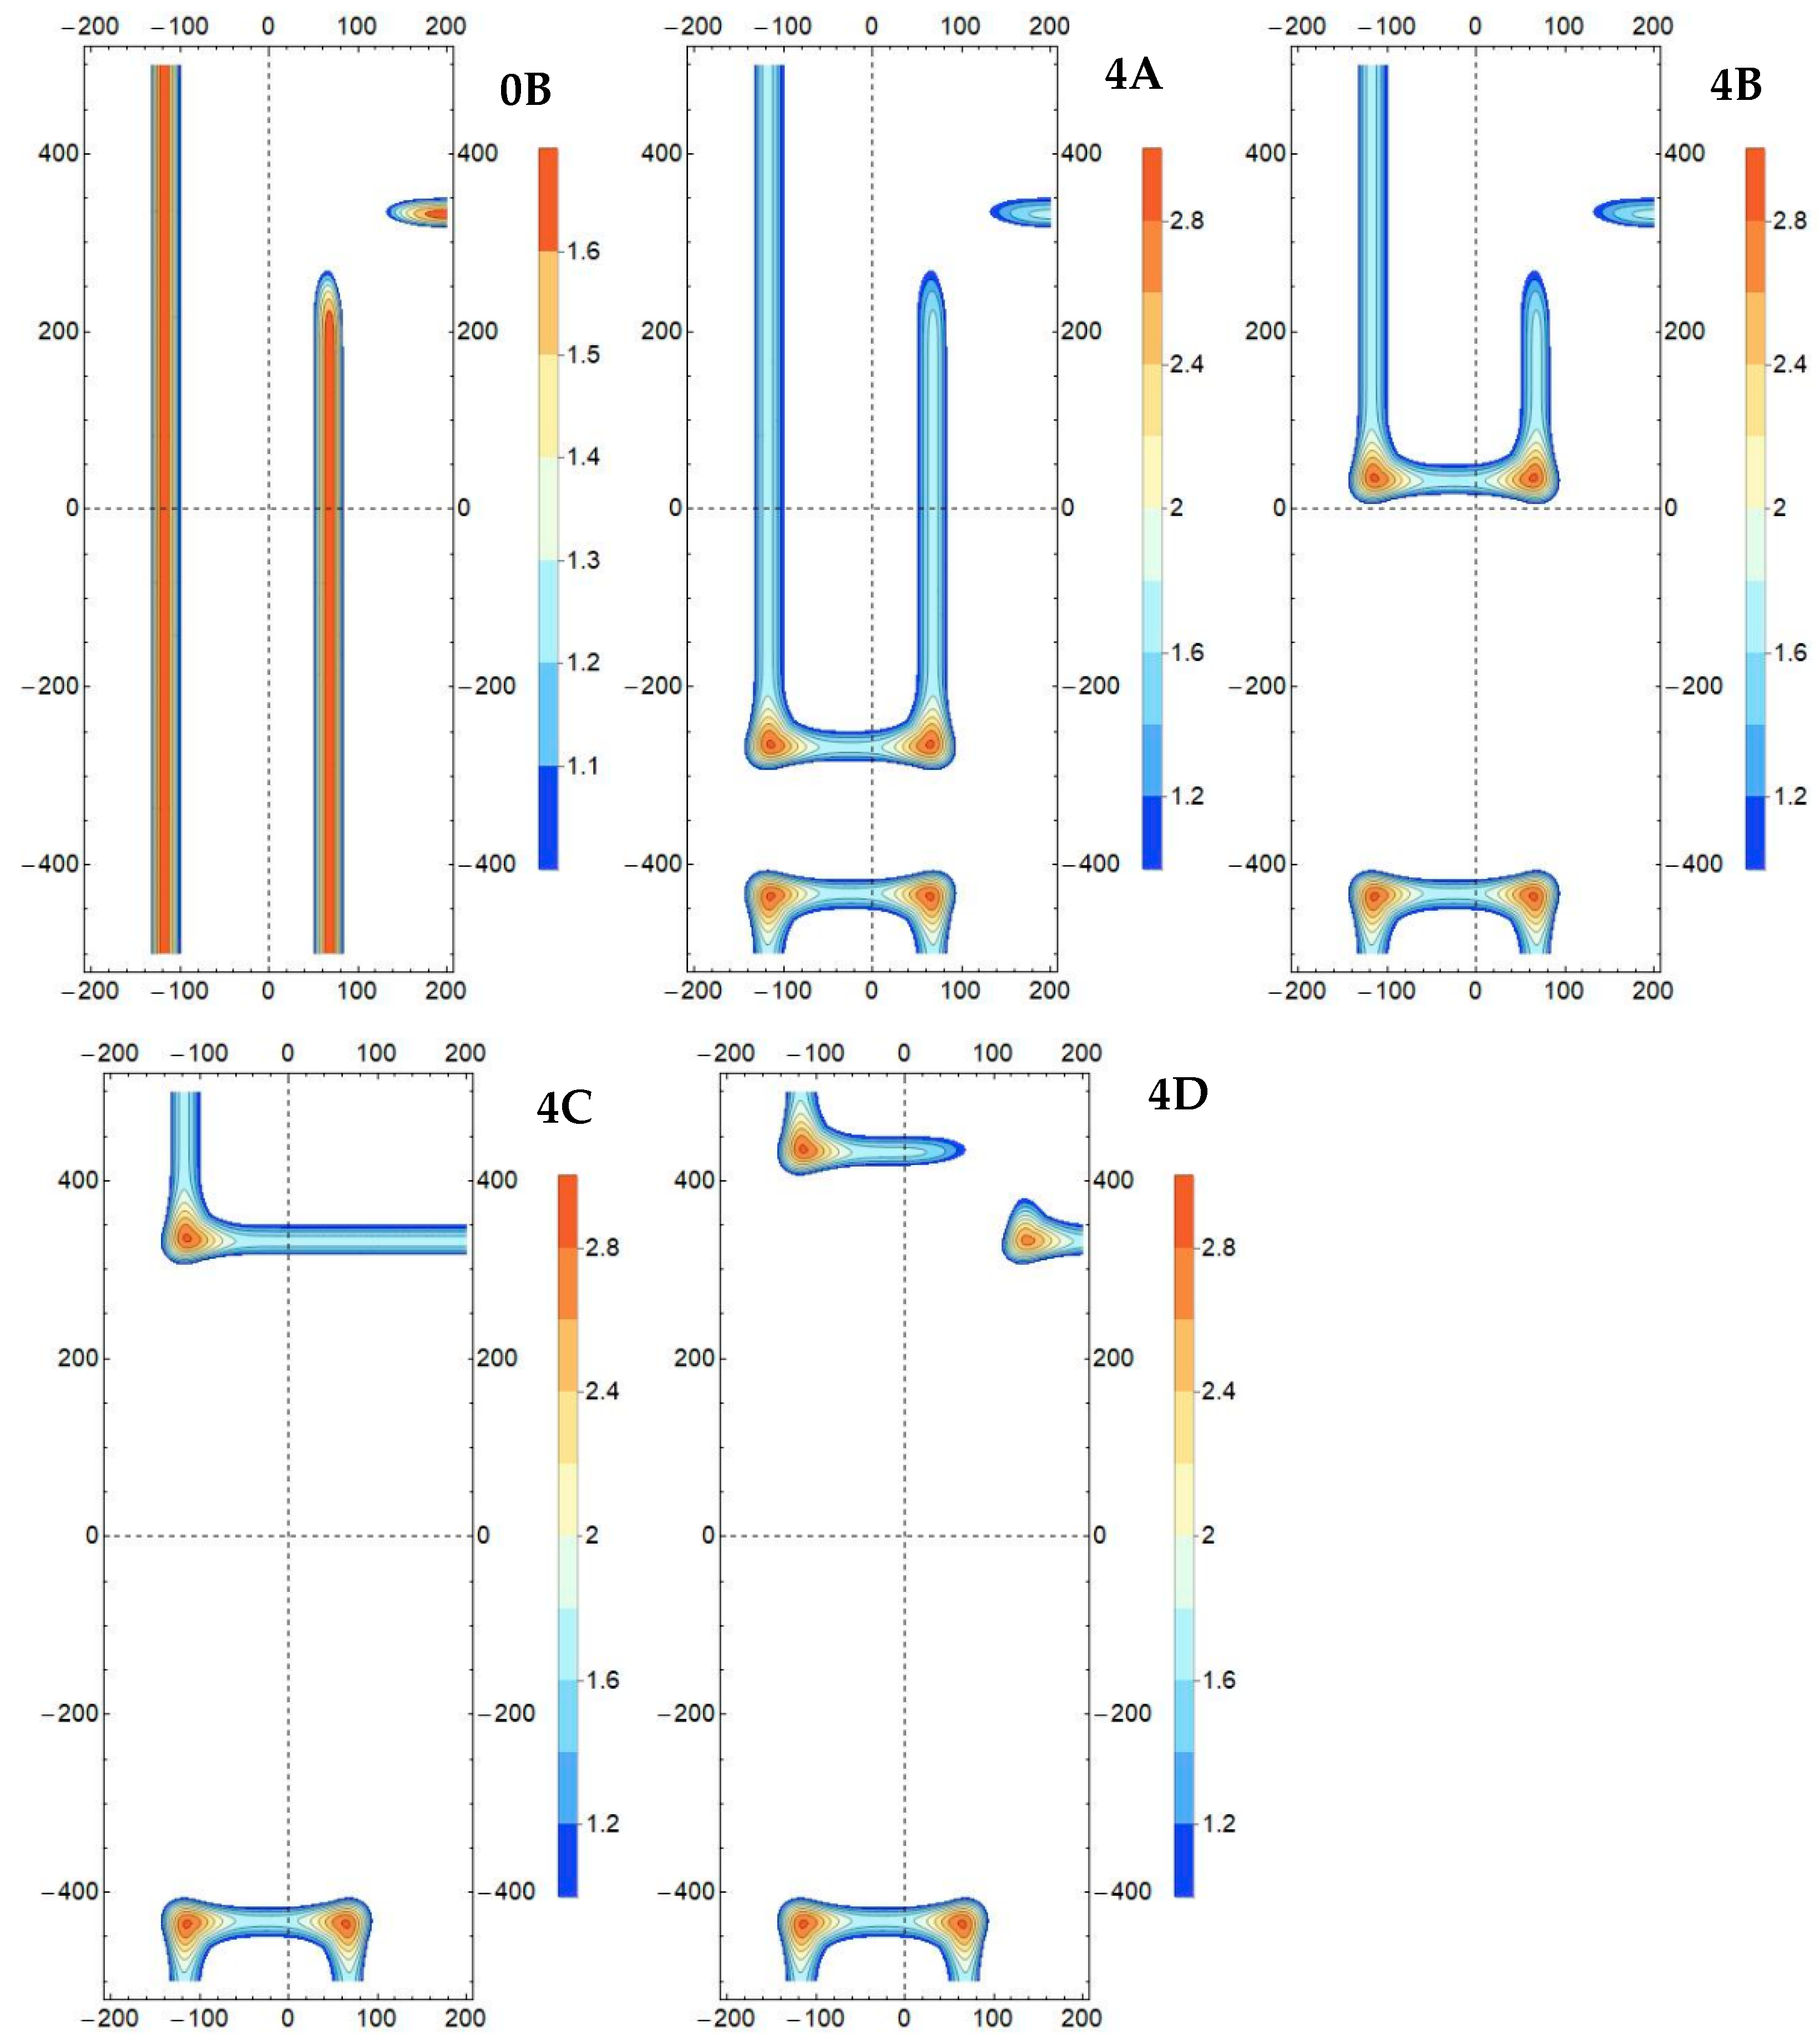
Variant 1: Exploitation of the deposit in a two-sided environment of the goafs with a working face length of 250 m (Model #4) conducted in the (conventional) northern direction, with an illustration of the results for four instantaneous positions—after achieving a face advance of 100 m (Model #4A), 400 m (Model #4B), 700 m (Model #4C), and 800 m (Model #4D) (Figure 3a);
Variant 2: Exploitation of the deposit in a two-sided environment of the goafs with a working face length of 250 m (Model #5) conducted in the (conventional) southern direction, with an illustration of the results for four of its instantaneous positions—after achieving a face advance of 50 m (Model #5A), 100 m (Model #5B), 400 m (Model #5C), and 800 m (Model #5D) (Figure 3b).
Established directions and working face positions (temporary stops) serve to observe changes in the attributes determining the seismic hazard magnitude accompanying the development of mining involvement in the boundary area, while simultaneously attempting to take into account the potentially most unfavourable operating circumstances (e.g., the working face approaching and moving away from the goaf corner on the eastern side). Therefore, considering the assumed asymmetry of the goaf on both sides of the MA boundary, different face advance distances were selected for the northern (100, 400, 700, 800 m, Figure 3a) and southern (50, 100, 400, 800 m, Figure 3b) directions of the working front.
As part of the simulated single-wall exploitation in the boundary pillar created according to Model #0B (Figure 2b), there was a formation of the values of the previously discussed (expressed by Formula (15)) maximum principal stress concentration factors (k(σ1)), density of elastic shear strain energy (k(Af)), and effort factor (k(Ω)) on the horizon of the burst-prone layer overlying the created goaf, and thus the exploited seam was observed. The basis of this approach was the need to take into account the threat from potential high-energy activity (the most dangerous from the point of view of events with consequences in the mining excavations), and this is usually associated with the activation of strong and compact rock packages in the main roof. The analyses were carried out on the basis of graphic illustrations of the results of individual numerical simulations presented in the form of appropriate contour and zone maps of the variability of the defined factors. Numerical calculations were performed for subsequent variants and models of various mining situations relating to the immediate vicinity of the conventional MA boundary and the created deposit pillar. Due to the presentation and the comparative nature of the simulations, it was assumed that the burst-prone layer occurs at a certain distance above the considered part of the seam (50 m), which lies at a given depth (1000 m) and is characterized by a fixed thickness (3.5 m). The choice of the above values was not accidental, as it was closely related to the realities of Polish mining. Currently, the depth of the coal seams within the operating hard coal mines is even over 1200 m (on average ~800 m) and is increasing year by year. In light of the applicable formal regulations, the height of the extraction gate in a deposit classified as prone to rockburst should not exceed 3.5 m. Regarding the distance of the burst-prone layer, a level of 50 m was assumed, taking into account mining experience, according to which the seismicity generated by sandstone/mudstone formations further away from the exploited seam has a limited impact on the magnitude of the rockburst hazard. Regarding the remaining input data, the averaged values of the geomechanical parameters of the USCB carbon rocks and the exploitation factor for the liquidation of the goaf for the caving were used. For all the cases considered, relating to both the stage of creating the boundary pillar and the depletion of resources within it, an analogous observation polygon was designated for the calculations. In the horizontal plane (the horizon of the burst-prone layer), it always covered the area of the rock mass surrounding the expected effects of the modelled mining operations (with dimensions of 400 × 1000 m), with the origin of the coordinate system (x = 0, y = 0) located exactly in the centre of the polygon, which resulted in an axial range of variability in the intervals from −200 to 200 m and from −500 to 500 m, respectively (Figure 4). The step and parameters of the calculation algorithm were selected by the method of successive tests in order to obtain a compromise between the duration of a specific, single simulation and the accuracy of the results obtained.

3. Results and Discussion

3.1. Creating a Boundary Pillar

The case concerns the execution of a range of mining operations and as a result, in the vicinity of the assumed, straight-line MA boundary with an assumed meridian direction (described by the coordinate x = 0), a deposit pillar with a width of 250 m is formed. In accordance with the discussed assumptions, the process of its formation comes down to two consecutive steps described for calculation purposes by two models: Model #0A → Model #0B.
Model #0A presents a mining situation where, as a result of the development of the goaf surface on the western side (Goaf/W), a goaf edge is created at a distance of 150 m from the boundary of the mining area (Figure 2a). The assumed large extraction area is to guarantee the achievement of extreme values of the observed calculation parameters. Model #0B illustrates the case in which, for the mining situation described by Model #0A and as part of the continuation of the mining operations, further development of the goaf surface on the eastern side (Goaf/E) was modelled; this resulted in an edge formed at a distance of 100 m from the boundary of the MA (Figure 2b). The assumed geometry and range of extractions will result in the formation of an incomplete coal pillar (250 m wide) oriented asymmetrically against one of the horizontal (x = 0) axes of the coordinate system and coinciding with the boundary line of the mining area. The proposed configuration will allow for the consideration of a larger number of combinations at the stage of conducting exploitation operations within the pillar, as the discussed case (Model #0B) will be treated as the starting point for further modelling. The simulation results illustrate the contour/zonal maps of changes in the concentration factor of the largest principal stress k(σ1) (Figure 5a), the effort factor k(Ω) (Figure 5b), and the shear strain energy density factor k(Af) (Figure 5c) generated directly in the Wolfram Mathematica programme.
On the maps of the presented variability distributions (Figure 5a–c), the centre of the polygon is marked with a dashed line; the southern course (x = 0) of which corresponds to the location of the MA boundary. Due to the illustrative nature of the simulation results, descriptions of the coordinate system axes and a legend for colour gradations were deliberately omitted from individual distributions. In the context of interpretative criteria, it proves sufficient for the purposes of this article to operate with the rule that when the value of a specific computational parameter is greater, the darker the shade of red on the variability distribution. In turn, areas in a dark blue shade should generally be identified with the smallest values of a given factor.
It is noticeable that as a result of the additional extraction of the deposit on the eastern side of the MA boundary (Model #0B), the non-uniform stress/effort state already covers essentially the entire area of computational polygon. It must be clearly stated that the developed values of the observed parameters are higher compared to the level corresponding to the lithostatic state. Similarly to the previous case (Model #0A), anomalous areas are local in character and correlate with the process of the goafs edges. The shear strain energy density factor k(Af) (Figure 5c) is characterized by the greatest variability, and the changes in the values and locations of the extremes of the selected factors result from the geometry irregularities of the eastern goaf field. On the presented maps (Figure 5a–c), one can observe disturbances (of bigger or smaller significance) in the processes in the immediate vicinity of the corner of the subject goafs, on both sides of the edge (also above the rock body). Regardless of the above, it should be stated that there is no superposition of the effects of exploitation activities on opposite sides of the MA boundary.
Treating the results and observations obtained within Model #0B (Figure 2b) as initial state, further work simulated the execution of mining operations in the area of the isolated boundary pillar according to the previously outlined Model #4 (variant 1, Figure 3a) and Model #5 (variant 2, Figure 3b).

3.2. Deposit Extraction in the Boundary Pillar According to Variant 1

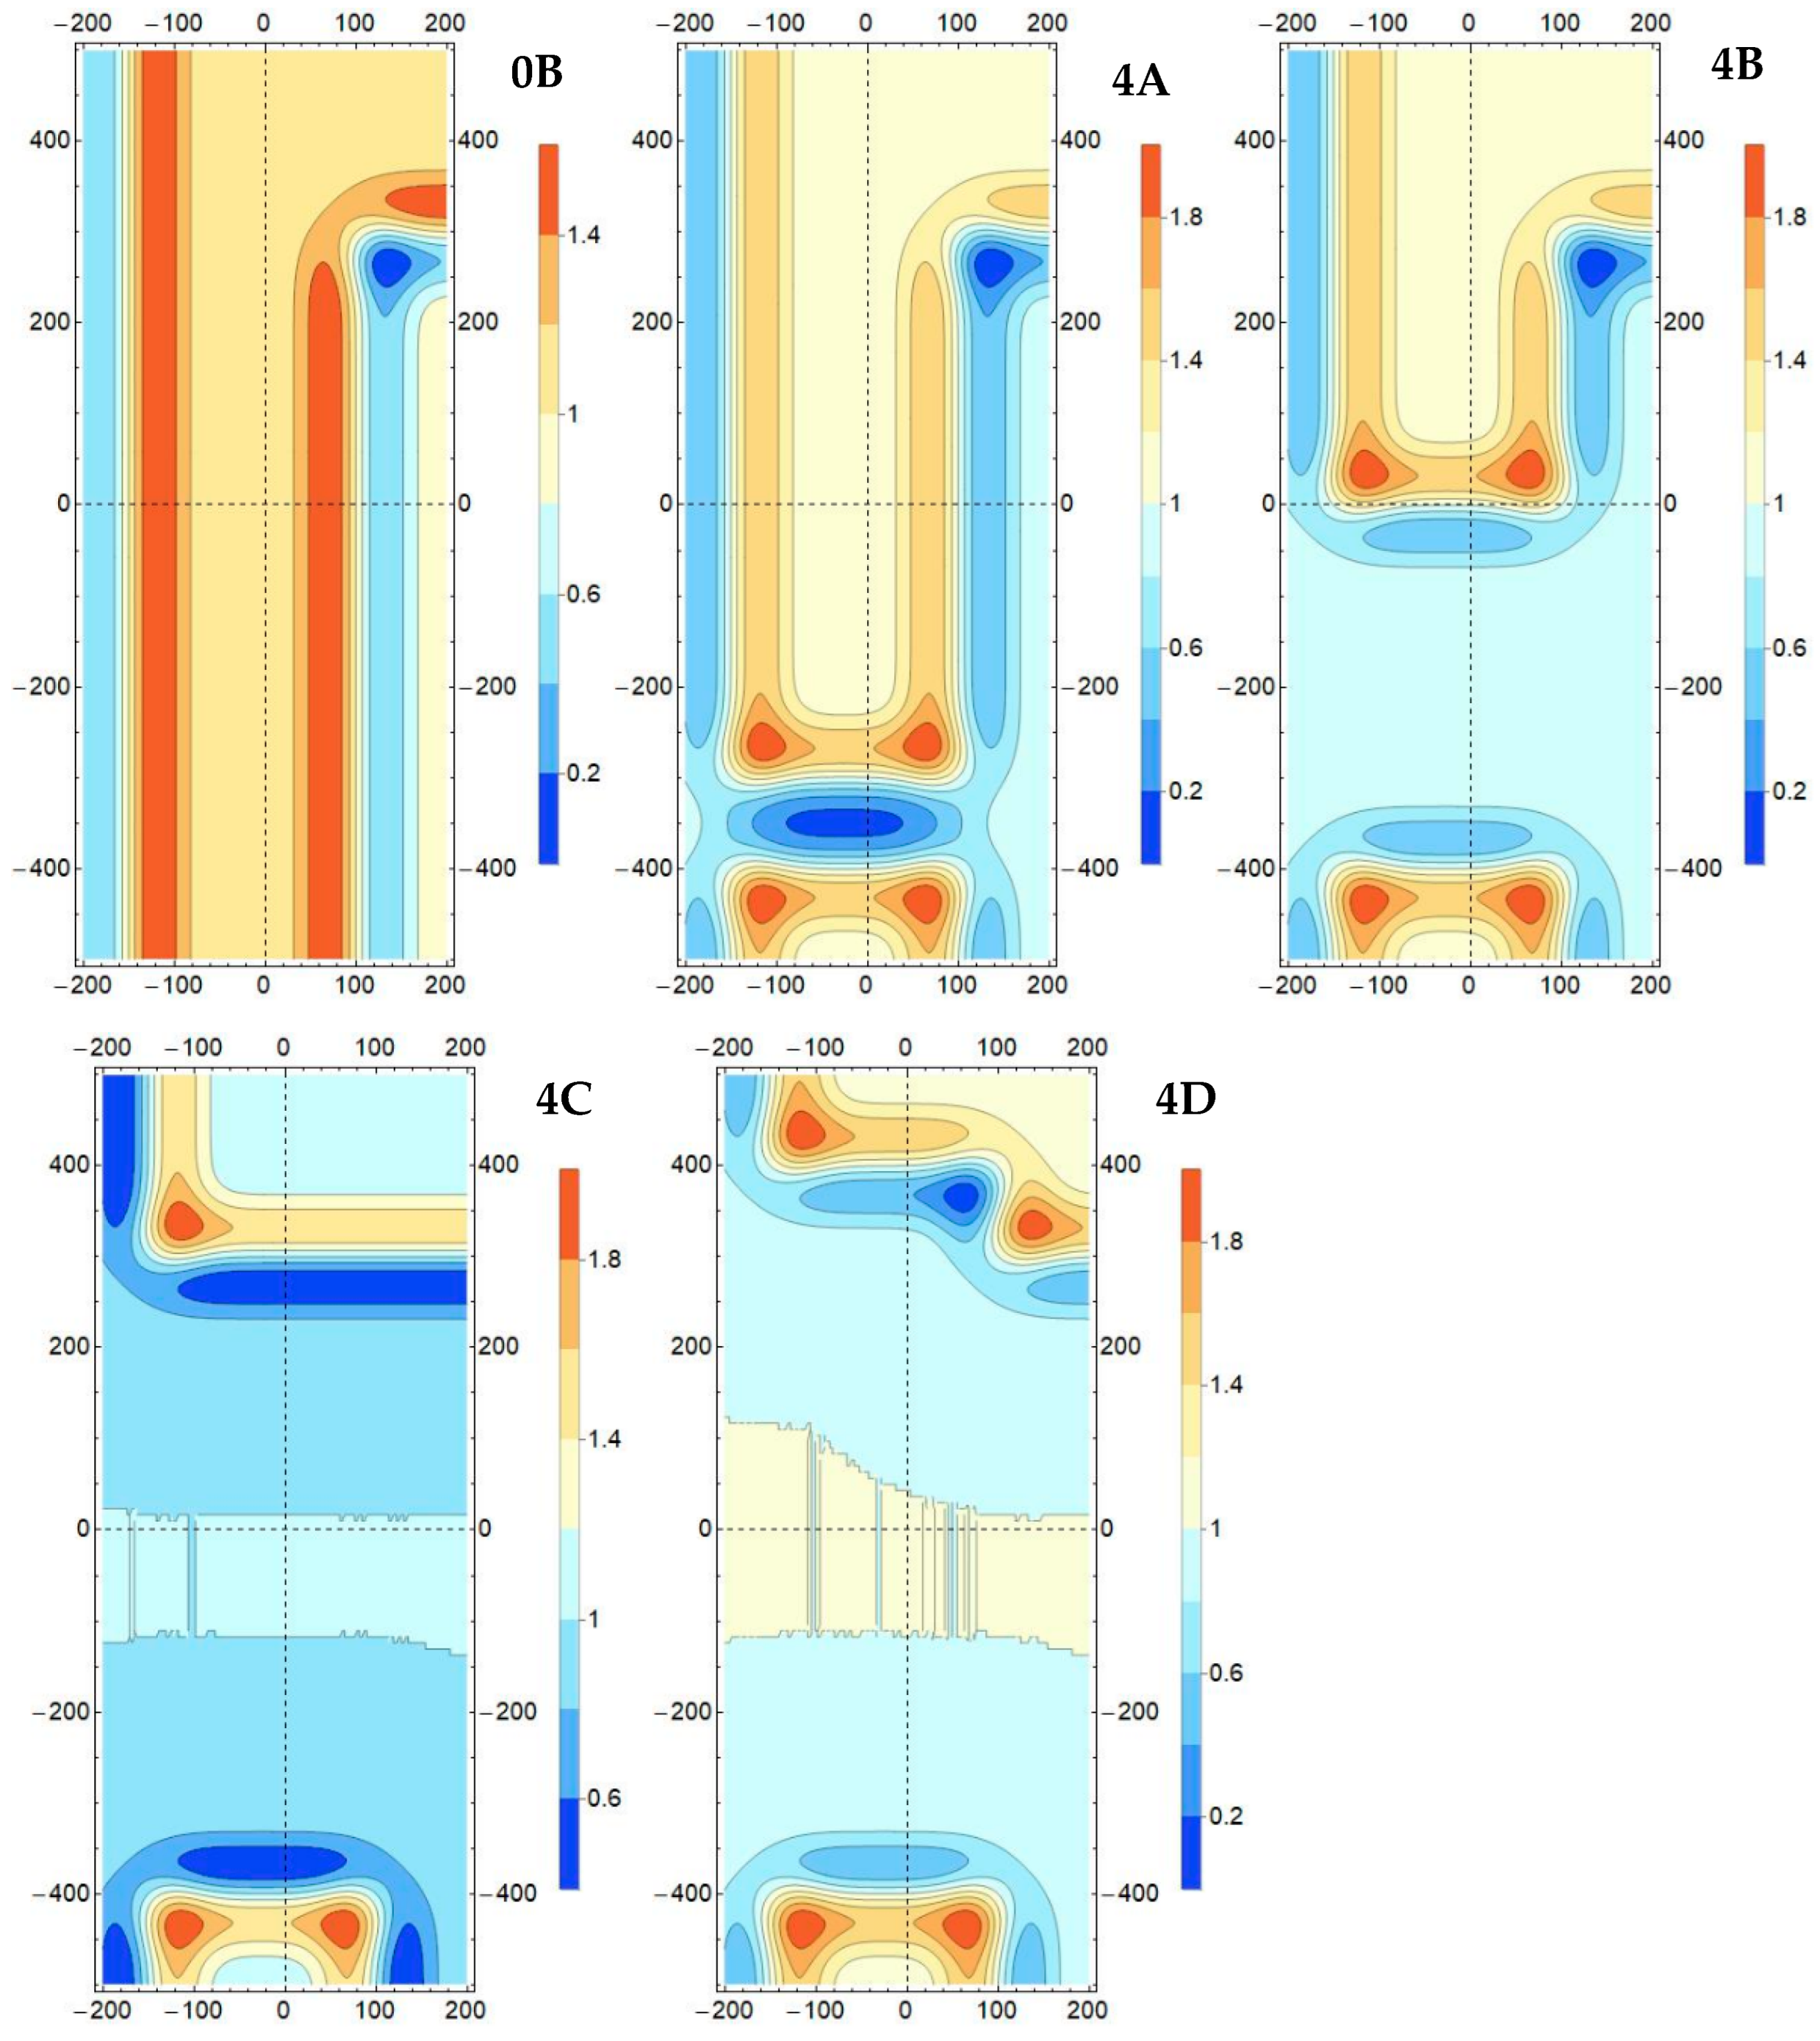
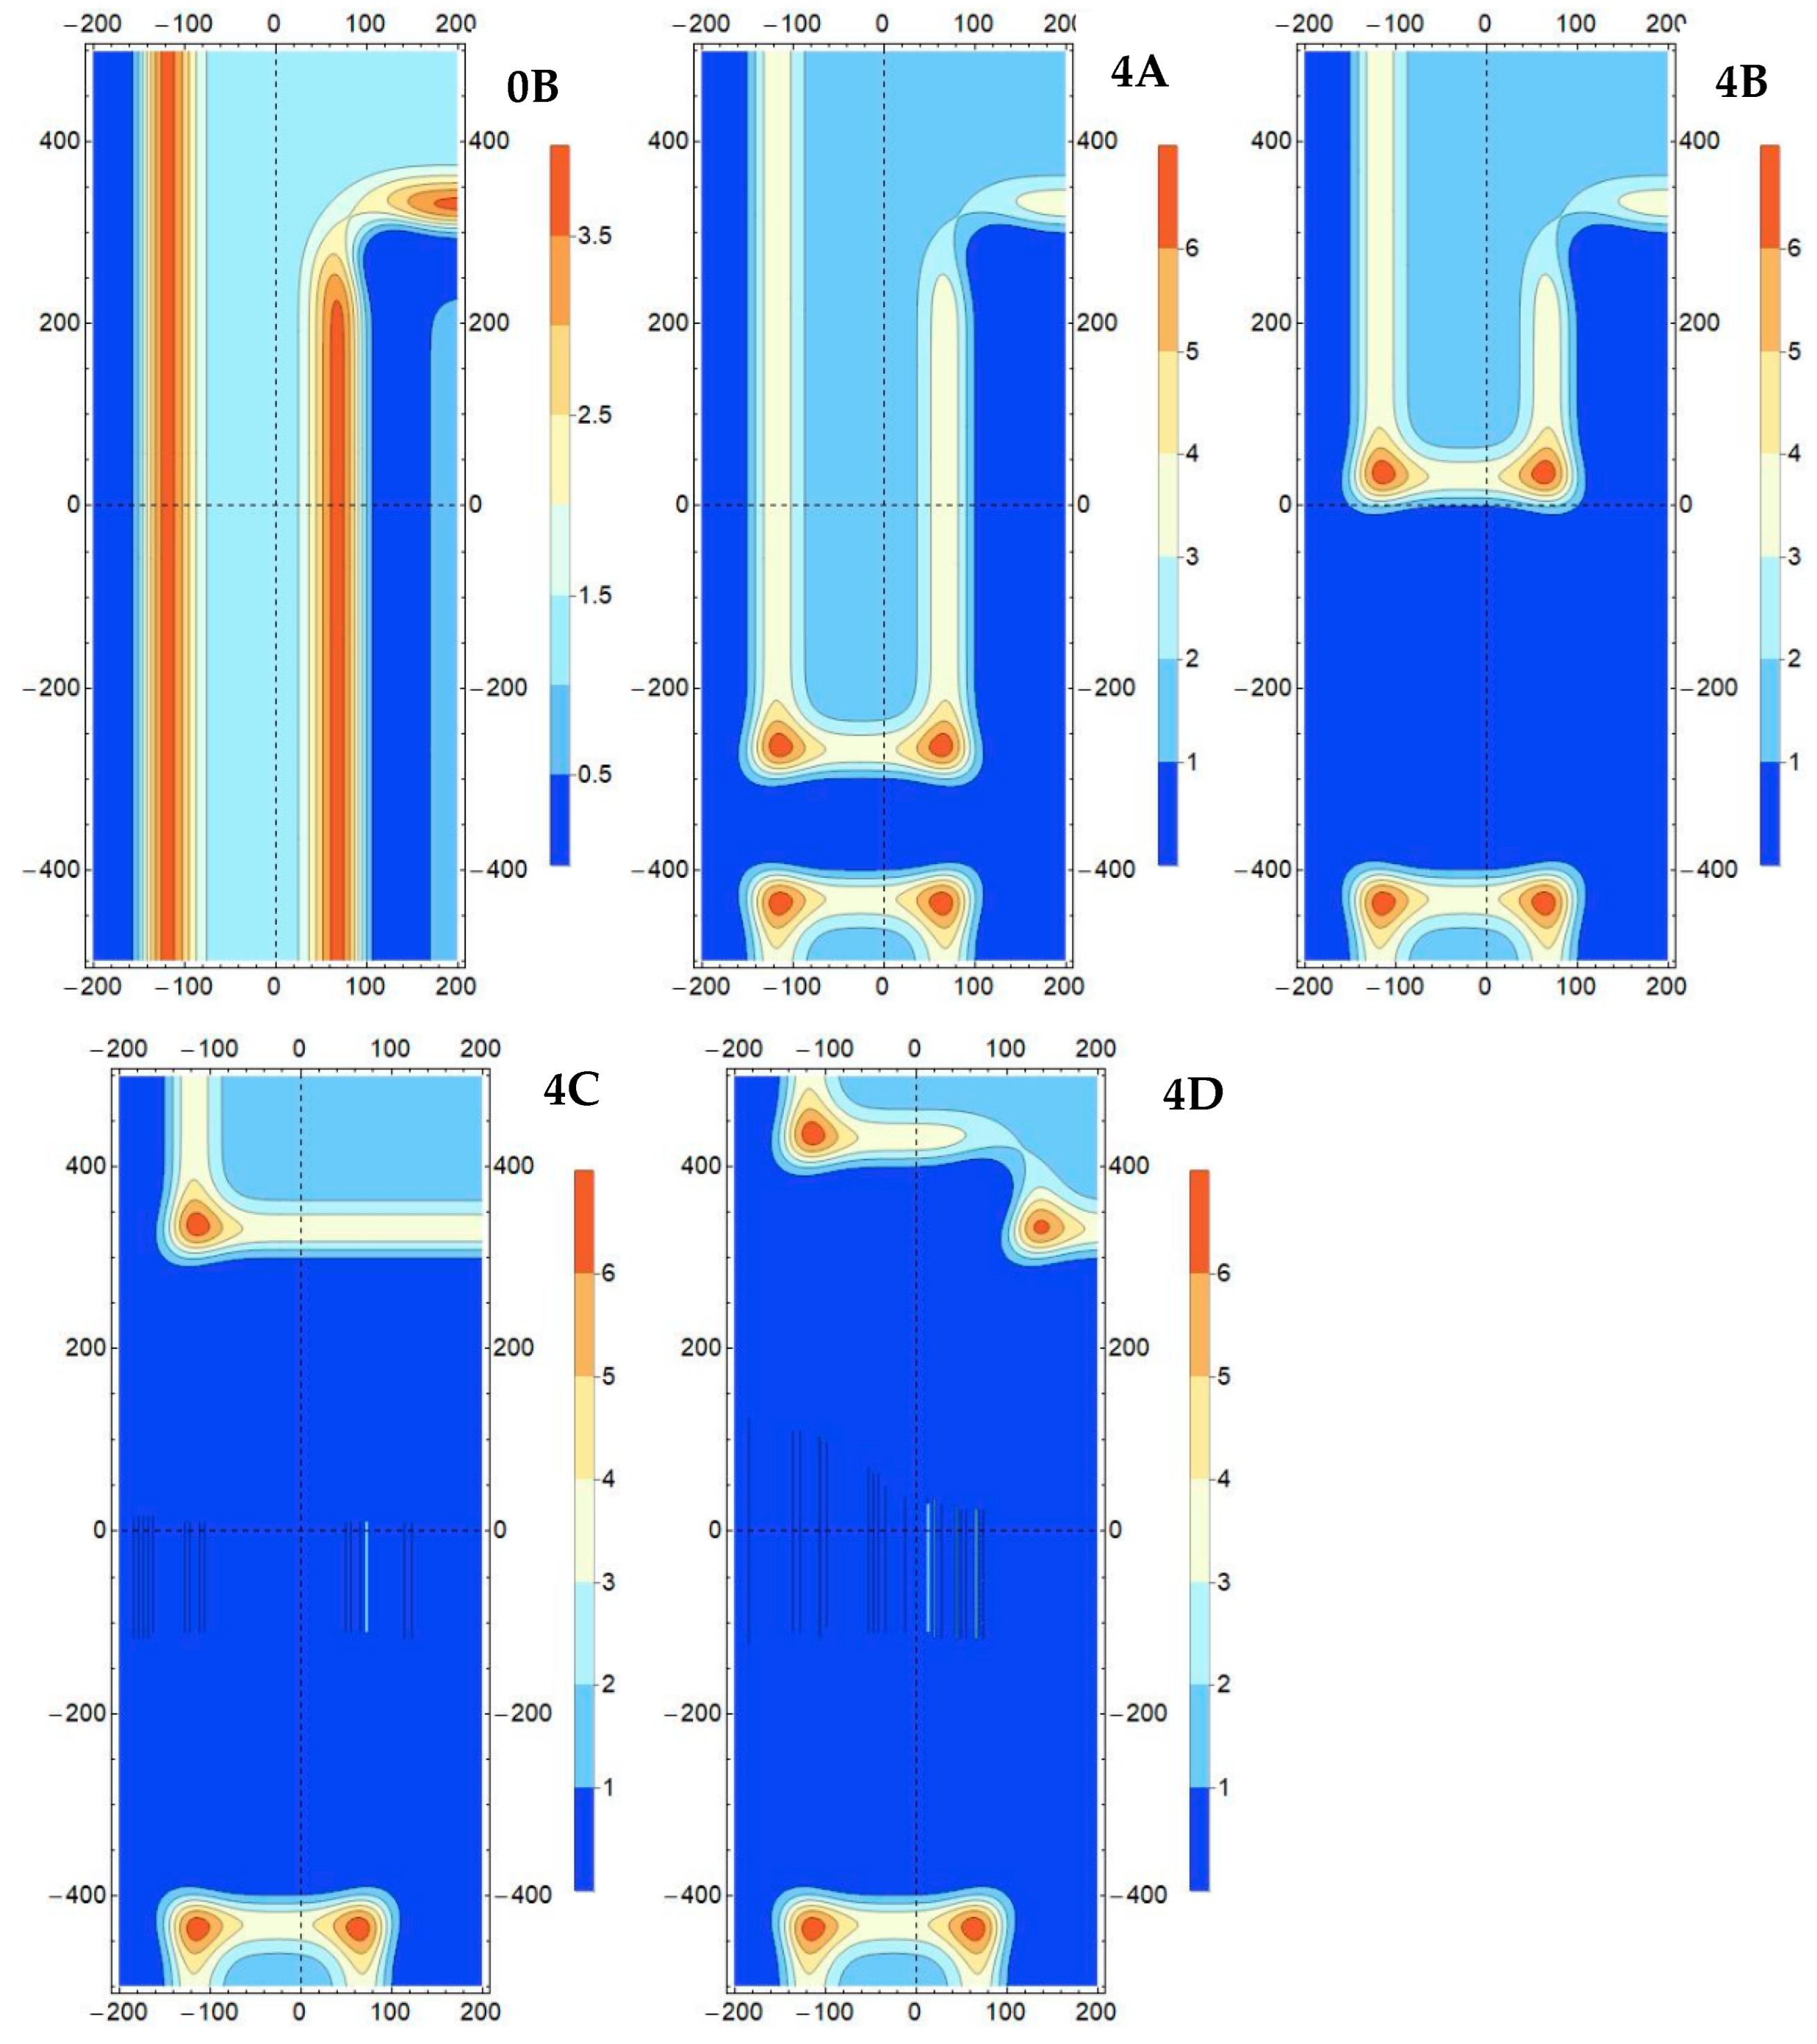
This is the first of the possible concepts for obtaining resources from a pillar (250 m wide), created as a result of excavations described in Model #0B, based on a single working face. The extraction of the deposit was modelled simultaneously on both sides of the virtual MA boundary with a single working face, the length of which is identical to the entire isolated pillar (Model #0B → Model #4). The established direction of the working face advance is assumed to be north, where the exploitation begins (and runs for a significant distance) in conditions constrained by the bilateral surroundings of the extensive goaf surface, and the end of the face advance is located in the unilateral surroundings of the goaf on the western side of the pillar boundary (Figure 3a). The assumed target geometry of the exploitation parcel is a regular rectangle with dimensions of 250 m (working face length) by 800 m (face advance). Due to the desire to observe changes during the ongoing work, the simulation results are presented for four instantaneous working face positions in the sequence (Figure 3a): Model #0B (baseline) → Model #4A (after obtaining a 100 m face advance) → Model #4B (400 m face advance) → Model #4C (700 m face advance) → Model #4D (800 m face advance–final). The proposed intermediate values of the working face process were selected estimates in terms of the potential possibilities of capturing the most unfavourable interactions. For the defined stages of the exploitation, the calculation results are illustrated—analogously as before—in the form of contour/zonal maps of changes in the concentration factors of the largest principal stress k(σ1) (Figure 6), the effort factor k(Ω) (Figure 7), and the shear strain energy density factor k(Af) (Figure 8).
Referring to the presented distributions, it can be concluded that the values of individual factors increase (in relation to the baseline) with the development of the exploitation described by subsequent positions of the longwall face. Particular attention should be paid to their extremes (primarily maxima), as they determine the possible initiation of effort processes occurring in the considered burst-prone layer. Therefore, taking into account the maximum values of the observed factors, their greatest variability is associated with the initial stage of exploitation (Model #0B → #4A) and amounts to ~25% (1.57 → 1.97) for the stress concentration factor k(σ1) (Figure 6), ~68% (1.68 → 2.83) for the effort indicator factor k(Ω) (Figure 7), and ~79% (3.67 → 6.57) for the shear strain energy density factor k(Af) (Figure 8). In the subsequent stages (Model #4A → #4B → #4C → #4D), the maxima stabilize, as their variability is at a trace level (the order of 0.05%), within the limits of computational error. In this context, a characteristic element of the considered variant concerning the differentiated mining conditions accompanying the working face advance over the first 700 m and the last 100 m requires comment. Namely, the analysis shows that in the phase of the working face approaching the line of the planned end of exploitation, which extends beyond the contour of the eastern goaf edges, no significant changes in the values of the determined stress, effort, and energy factors were observed. Therefore, the transition of the working face from the area of bilateral proximity to the goaf to unilateral does not negatively affect the geomechanical condition of the roof formations above the ongoing exploitation. A separate issue is the distribution and extent of anomalous zones described by the largest values of individual factors, (k(σ1), k(Af), k(Ω), as they indicate the places of potential occurrence of effort processes, conducive to the generation of seismic tremors. In the analyzed case, these zones take the form of four regular, strongly local elevations in distributions in a shape similar to a circle. Two of the mentioned zones are permanent and correspond to the place of exploitation start-up, while the remaining two, located in the corners of the rock body of the working face and the goaf edges on both sides, move with the progress of exploitation. An exception is the mining situation in which, after reaching a face advance of 700 m (Model #4C), the position of the working face line equalizes with the goaf edge on the eastern side, which causes the disappearance of one of the anomalous zones (Figure 6, Figure 7 and Figure 8).

3.3. Deposit Extraction in the Boundary Pillar According to Variant 2

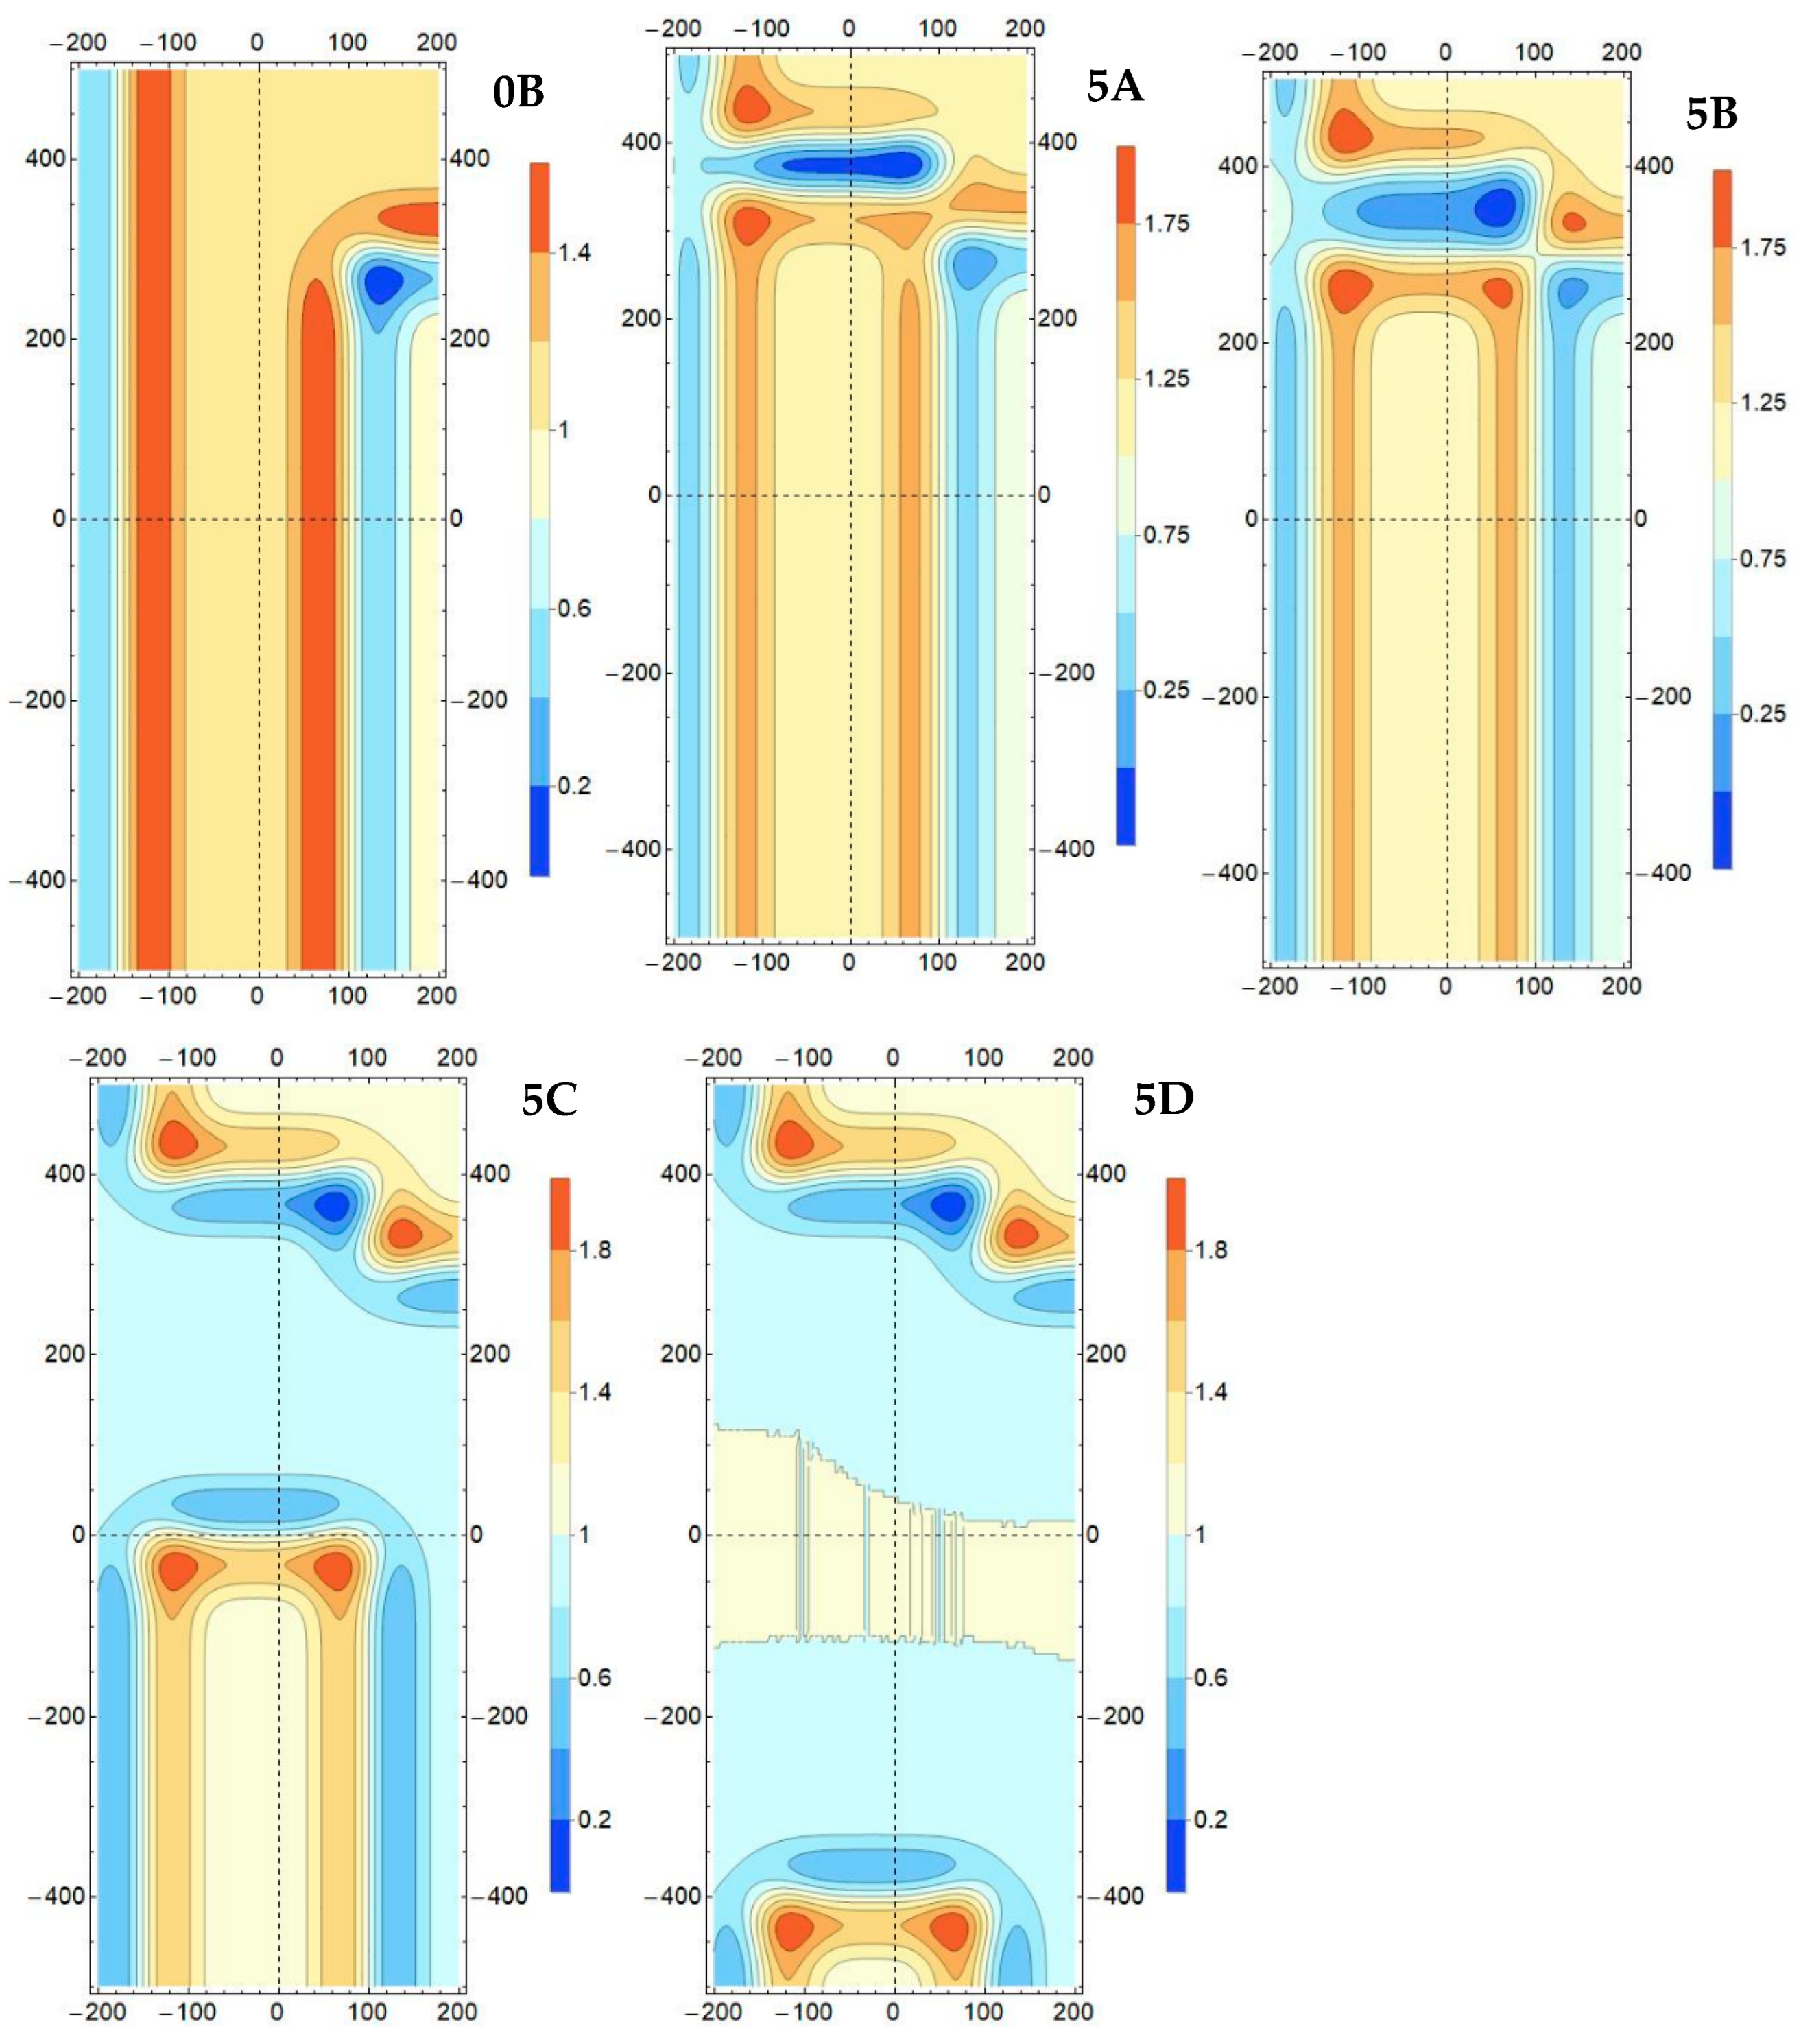
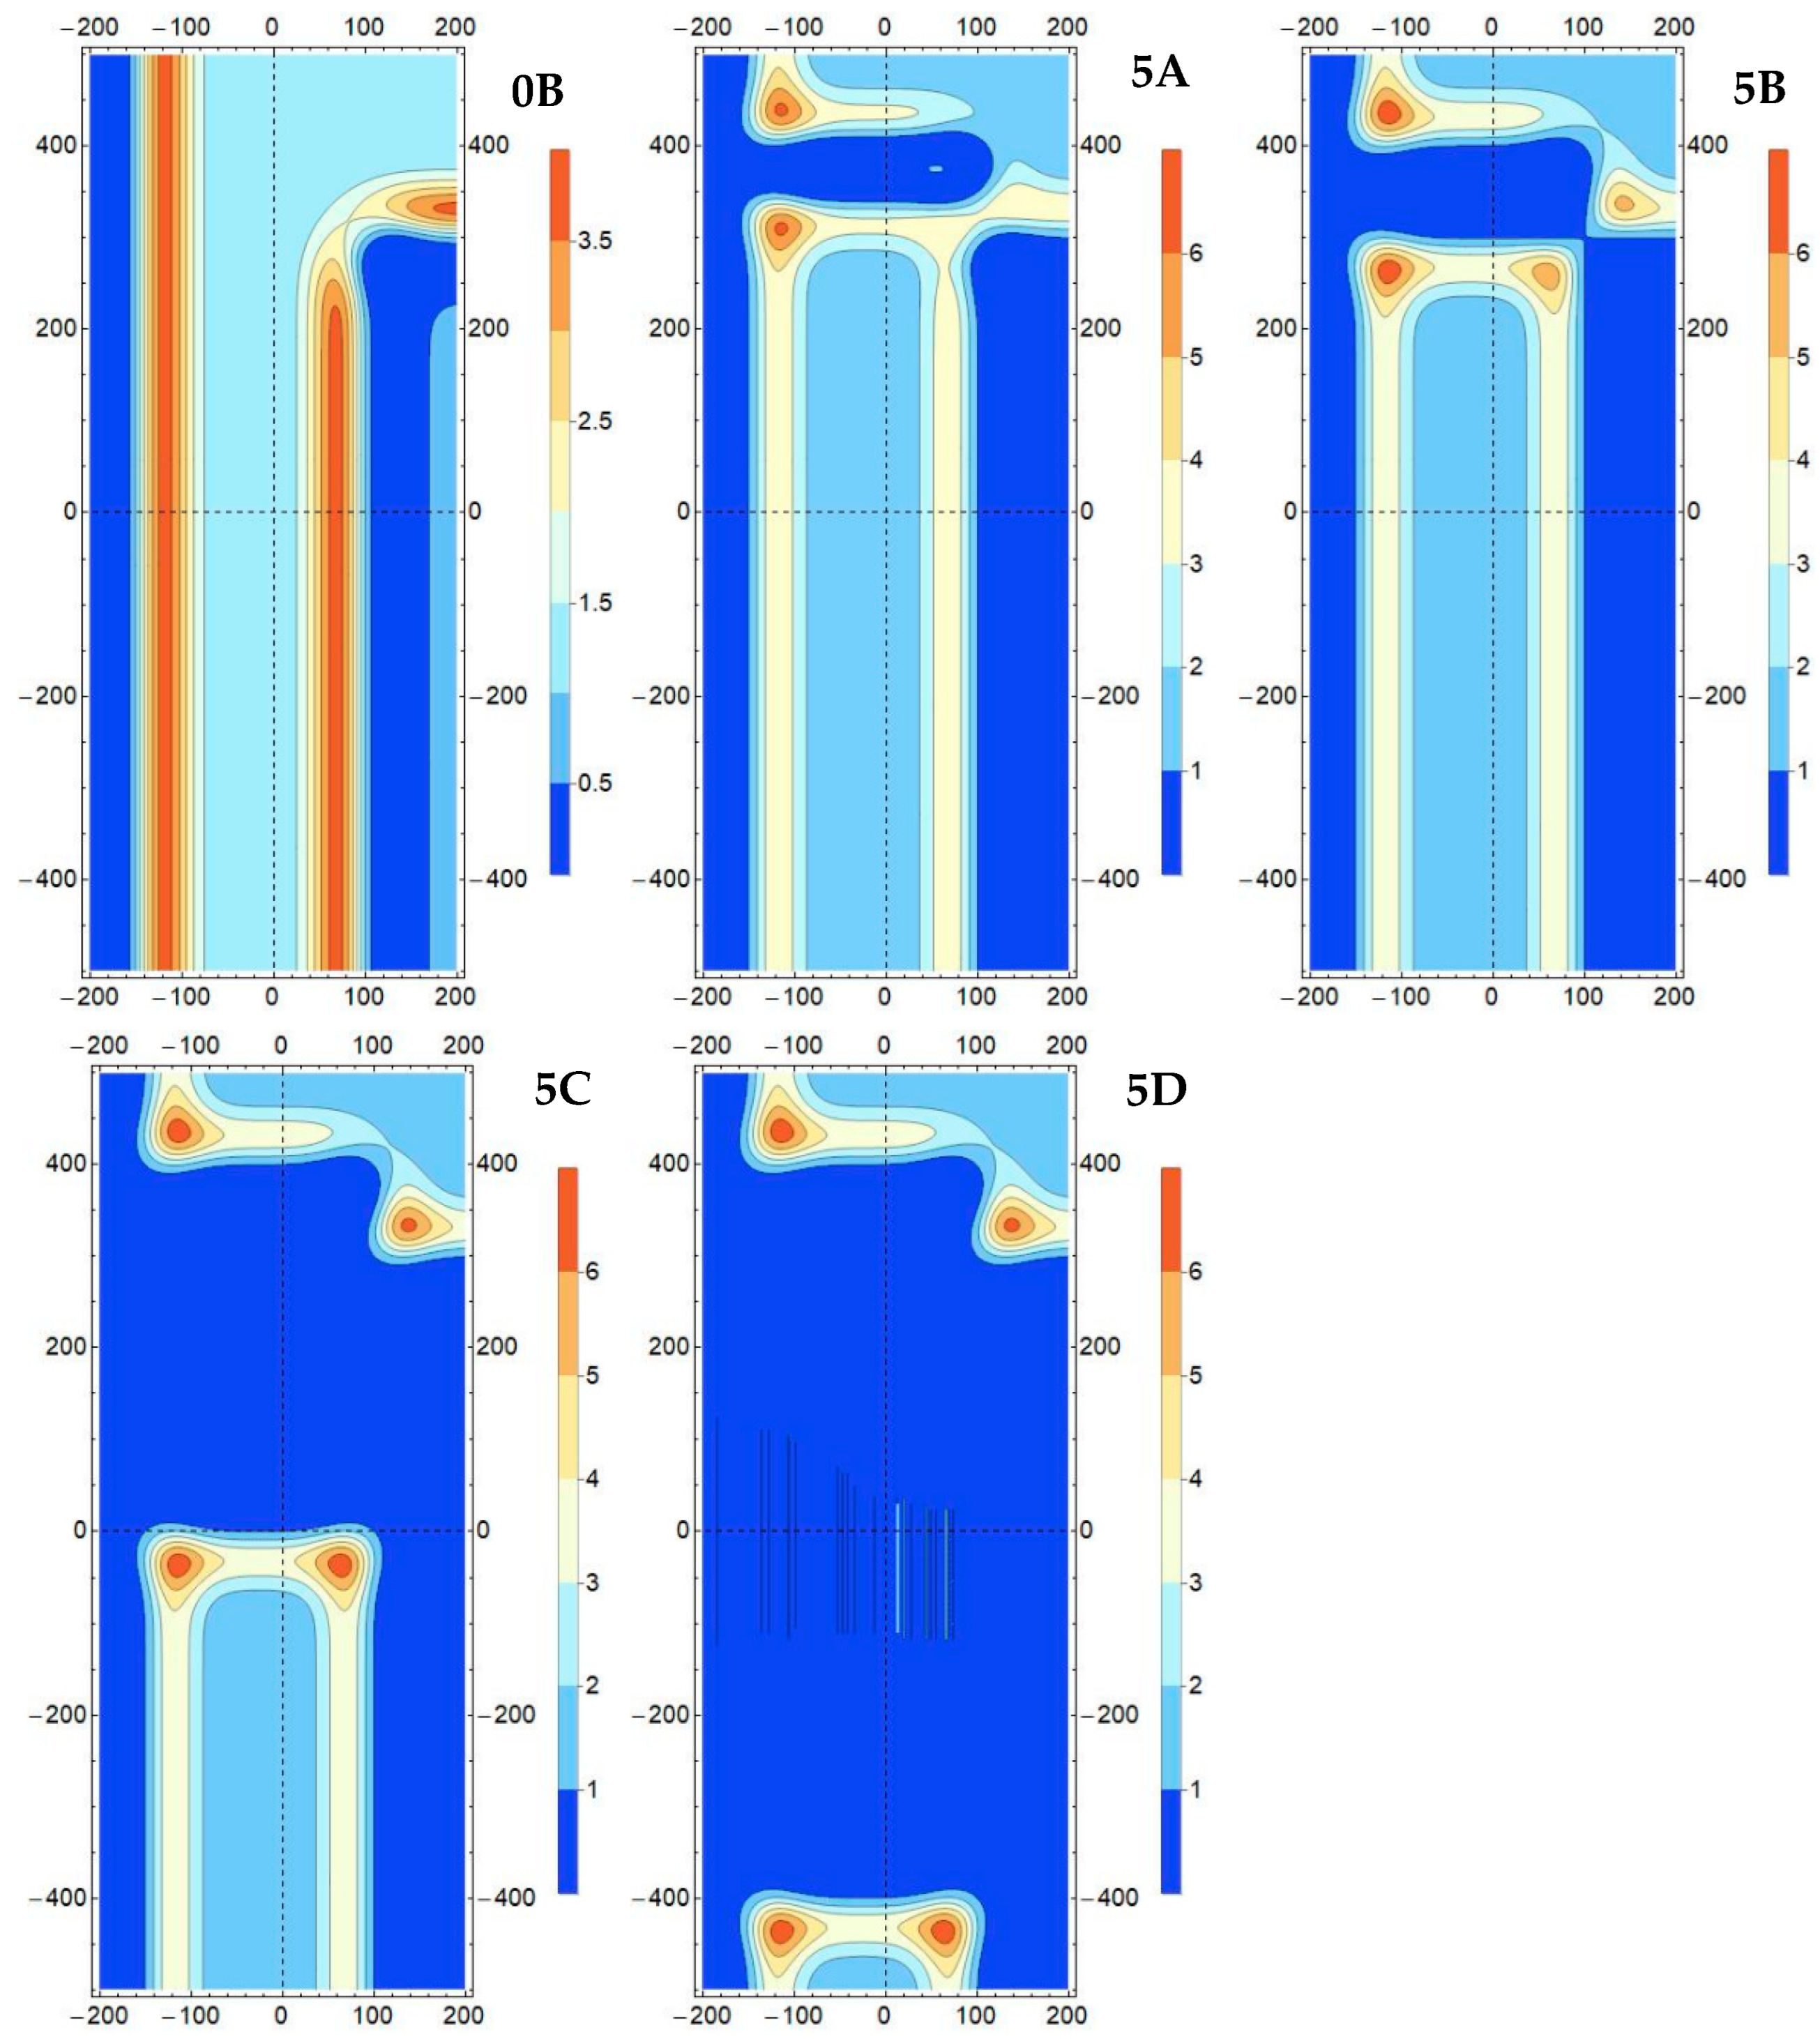
The second concept of resource extraction from a 250 m wide pillar separated by Model #0B also involves using a single mining working face of an analogous length, with the direction of advance reversed to the south (Model #0B → Model #5). In this variant, extraction will initially take place in conditions constrained by unilateral goafs, which will then (after achieving a 100 m face advance) transition into a bilateral proximity of extensive goaf surfaces on both sides of the MA boundary (Figure 3b). Similarly to the previous one (variant 1), the assumed destined geometry of the extraction parcel is a regular rectangle with dimensions of 250 × 800 m. In order to observe changes during the ongoing mining operations, the simulation results are presented for four working face positions in the sequence: Model #0B (baseline) → Model #5A (after achieving a 50 m face advance) → Model #5B (100 m face advance) → Model #5C (400 m face advance) → Model #5D (800 m face advance–final). The given values of the face advances were also selected as estimates in terms of the potential possibilities of capturing the most unfavourable interactions, but they are different in relation to variant 1 due to varied mining conditions. For the defined stages of extraction, the calculation results are illustrated (analogously as before) in the form of contour/zonal maps of changes in the concentration factor of the maximum principal stress k(σ1) (Figure 9), the effort factor k(Ω) (Figure 10), and the shear strain energy density factor k(Af) (Figure 11).
When discussing the simulation results, it should be noted at the outset that, for objective reasons, the presented distributions of variability of individual factors relating to the initial state (before exploitation start, Model #0B) and the final state (after achieving a face advance of 800 m, Model #5D) are identical in both variants under consideration. However, significant qualitative differences are noticeable for the presented intermediate stages (Model #5A, #5B, #5C), which is a consequence of both modifications of the instantaneous working face positions and the reverse direction of its guidance.
The analysis of the presented distributions indicates that, similarly to variant 1, the values of individual factors show an increasing trend with the development of exploitation within the framework of subsequent positions of the working face. The greatest variability of the maxima of the computational parameters is noted for the initial stage of exploitation (Model #0B → #5A) and amounts to ~22% (1.57 → 1.92) for the stress concentration factor k(σ1) (Figure 9), ~58% (1.68 → 2.67) for the effort factor k(Ω) (Figure 10), and ~68% (3.67 → 6.18) for the shear strain energy density factor k(Af) (Figure 11). Even in the second stage (Model #5A → #5B), a slight variability is noticeable at the level of ~2% (1.92 → 1.97) (for k(σ1)), ~6% (2.67 → 2.83) (for k(Ω)) and ~6% (6.18 → 6.57) (for k(Af)), respectively, after which the values stabilize, reaching limits identical to both variants. As a result of reversing the direction of the longwall advance, the case under consideration is associated with the approach of the working face to the corner of the goaf on the eastern side of the MA boundary, thus transitioning from a one-sided to a two-sided environment of the goaf surfaces. Considering only the maxima of individual coefficients, no significant fluctuations in their values were observed for the discussed phase of exploitation. The distribution and ranges of anomalous zones created by the largest values of k(σ1), k(Af), k(Ω) look slightly different, although their size is still characterized by locality and the shape remains similar to a circle. In variant 2, we are dealing with two or four such zones, depending on the degree of exploitation advancement. For the developed phase in the two-sided vicinity of the goaf surfaces, two of them are located in the corners of the rock body of the longwall face and the edges of the goaf on both sides, following the progress of exploitation until its completion. In the area of the longwall start-up, one constant zone adjacent to the western goaf is marked, and the second appears only after reaching a 100 m advance (Model #5B) and is related to the successively created rock body corner on the left side of the working face near the goaf on the eastern side (Figure 9, Figure 10 and Figure 11).

3.4. Comparison of Variant Exploitation in Terms of Potential Seismic Hazard

The exploitation variants presented in points 3.2 and 3.3 include methods of resource extraction from the deposit within the boundary pillar based on a single longwall with a length identical to the width of the designated coal pillar belt (250 m). They differ in the direction of the working face advance and the conditions of the start-up and end constraints. According to variant 1, the longwall advances from south to north and begins its progress in a two-sided environment of goafs, and the finishing line is situated in a one-sided environment (Figure 3a). In the case of variant 2, the direction of advance is opposite (from north to south), the start of exploitation takes place in a one-sided proximity to the goafs, and its completion is between the goafs on both sides of the mining excavation (Figure 3b). Both methods include the stage of the face approaching the goaf corner formed on the eastern side of the MA boundary, but in a different configuration.
The analyses so far have referred to each variant separately, taking into account the stress–strain behaviour of the rock body to the current positions of the working face. In this part of the work, considerations are presented that include a synthetic comparative analysis between the individual variants, the main task of which is to attempt to select a solution that is more advantageous from the point of view of the potential induced seismicity generated by carrying out exploitation mining operations with a single mining operation.
Comparing the simulation results for both variants, it should be stated that the changes accompanying the progress of the face in terms of the maximum values of all observed concentration factors (stresses, energy, effort) remain at a similar level, with the local occurrence of areas significantly differing both from the initial state of the rock body and the basic mining situation before the commencement of the face in the pillar. In both cases, more significant disturbances in the formation of the maximum values of individual factors—with particular emphasis on energy and effort—are noted in the initial stages of the exploitation face advance, and then they stabilize (Figure 12). In the initial phase of work for variant 1, the percentage increases are, however, bigger (changes reach 79%) than in variant 2 (maximum changes reach 68%), which is presumably related to the two-sided surroundings of the goafs. This status quo is observed despite a potentially more favourable (in relation to variant 2) mining situation related to the approaching of the face to the corner of the eastern goafs. Changes in the maximum values with respect to the end of the face advance in the discussed simulation models, in the face of the full development of exploitation (large span of own goafs), are hardly noticeable. Regarding the quantity/range of zones created by the largest values of the individual factors, (k(σ1), k(Ω), k(Af)) —red and orange outlines—in the case of variant 1, there are two such zones of similar size and shape on majority of the face advance (starting from its actuate) and one at the ending stage (Figure 6, Figure 7 and Figure 8). An analogous remark applies to variant 2, with the initial stage of the face advance being accompanied by one zone, while two zones persist on the remaining section of the face advance (including the end line) (Figure 9, Figure 10 and Figure 11). It can be assumed that this is a consequence of the development in the degree of exploitation advancement in conjunction with the change in mining conditions during the working face advance. Regardless of the model, the mentioned zones are located in the corners of the rock body in front of the face and are local in nature.
Based on the simulation results and the qualitative analyses conducted, it can be concluded that selecting the deposit in the pillar, according to both considered single-wall variants (Model #4, #5), will be associated with a comparable level of seismic hazard, constituting a positive element speaking in favour of the following:
Variant 1: May have a smaller number of anomalous zones shaped by the maxima of stress/effort/energy state factors for the face advance, where the face line aligns with the edge of the excavations on the eastern side of the MA boundary (Model 4C),
Variant 2: May have a smaller scale of percentage increases in the maximum values of computational indicators, favouring the initiation of effort processes for the initial stage of the face advance (Model 5B).
Both of these elements influence the behaviour of the burst-prone layer in a difficult-to-define manner, considering that the concentration factors (stress, energy, effort) reflect geomechanical changes in the current state relative to the state corresponding to the undisturbed rock mass. Regardless of the variant, the values of the indicators stabilize at the same level as the exploitation progresses (changes do not exceed 0.07%), which is a phenomenon consistent with expectations and is primarily related to the development of the surface of the goaf. In turn, comparing both variants from the point of view of the increases in the values of the factors for the initial stages of the working face advance, we are dealing with differences of up to 11%. Generally, it should be stated that the determinants of the initiation of effort processes are higher values of the calculation factors, and the range of the anomaly zones created by them can be attributed to secondary importance. Therefore, taking the above into account, the authors are inclined to decide to indicate variant 2 as more favourable from the point of view of the seismic-hazard-accompanying exploitation in the pillar. However, to develop general criteria allowing for full clarity of recommendations in this area, it is necessary to continue research that takes into account a larger number of simulation attempts for different input data and additional temporary face positions. It seems that the selection of the method of exploitation should be carried out in line with local geological and mining conditions, including the elements of the deposit’s occurrence and the current level of seismic hazard recorded in the fields adjacent to the boundary pillar area.

4. Verification of Simulation Results

Due to limited access to seismological data for the specific case of single-entry exploitation in the boundary pillar, an attempt to verify the results of simulation calculations was carried out using a geomechanically identical polygon of a crossing longwall in one of the operating coal mines in the Upper Silesian Coal Basin (USCB) that is threatened by rockburst hazard. The selected wall, with a length of 145 m and a face advance of 980 m, was extracted to a height of up to 3.4 m using a transverse system; the caving of roof rocks and a closing character (described by the two-sided proximity of goafs) affected a significant (~2/3) fragment of the run (Figure 13). According to the lithological profile representative of the longwall area, the roof formations above the exploited coal seam consisted of alternating packages of sandy shales, clay shales, and sandstones, including—at a distance of ~50 m—a thick (~15 m) layer of fine-grained sandstone with high strength parameters (Rc up 55 MPa, Rr up 4.2 MPa).
In relation to the mining situation, the presented example of the longwall on most of its face advance is almost identical to the simulation model (#5) considered within variant 2 (Figure 3b). Although it was characterized by a shorter mining operation length, it had a similar face advance, extraction gate height, and position of one of the burst-prone layers. An analogous constraint on the work also exists, involving the approach of the longwall to the corner of the goaf on the left side of the field. Since the earlier considerations were rather qualitative, the authors believe that the verification analyses included in this part of the work should focus on the essence of the issues discussed and be aimed at formulating general conclusions. Therefore, the main task of the research undertaken will be to confirm (or negate) the findings made on the basis of the modelling results, concerning primarily the locations of the occurrence of effort processes in the burst-prone layer. For this purpose, a comparative analysis was performed on the distribution theoretically determined for Model #5 anomalous zones described by the maxima of the relevant computational factors (stress, energy) in relation to the actual location of the tremor foci recorded during the exploitation of the example longwall selected for testing. In Polish hard coal mining, the parameters of seismic events, including their energies and location coordinates, are automatically calculated in dedicated software that registers the rock mass seismicity online within the measurement stations of a specific mine. The information used in the analyses regarding the energy and location of tremors comes directly from the databases of the mine’s seismological monitoring.
During the movement of the subject wall, 507 tremors with energies ≥ 103 J were recorded, with a total energy expenditure of 5.1 × 10⁷ J. Within this population, high-energy events (≥105 J) constituted 7% in quantity and 80% in energy, and among them, one event of the order of 107 J, two of the order of 106 J, and thirty-two of the order of 105 J occurred. The induced seismicity of the longwall was expressed by a unit energy expenditure of the order of 88 J/Mg, which is the average energy of a single tremor at the level of 1.0 × 10⁵ J, and for every 1 mb of progress from the rock mass, an energy of 5.2 × 10⁴ J was generated. Firstly, from the entire database of events ≥ 103 J, events with an energy of the order of 103 J were rejected, thereby limiting the considerations to tremors ≥ 104 J; subjectively considered as potentially originating from the activation of burst-prone formations, and not from the fracturing processes occurring within the seam or the immediate roof/floor. In this energy range, 205 tremors occurred, i.e., 40% of the previously considered population, including 170 only of the order of 104 J. Further considering the observations resulting from simulation calculations related to the location of anomalous areas in front of the face (up to ~50 m), in the following steps, from the database, the events that were separated were those whose horizontal coordinates were within threshold distances from the face, amounting to 50 m, 40 m, 30 m, 25 m, 20 m, and 15 m, respectively. It turns out that, taking into account the entire database of events ≥ 104 J, only 39% of the tremors recorded in the rock body in front of the face are accounted for, with the rest being goaf foci. The total energy expenditure of the events group in front of the face constituted 14.8% of the total released energy, which was at the level of 4.9 × 10⁷ J. The resulting statistics in relation to the defined distance intervals are differentiated in this range, and based on them, the following can be stated for distances from the face line:
Up to 50 m: Out of a total of 140 recorded phenomena, 47 occurred in the forefield (~34%), where their energy expenditure accounted for 9.4% of the total in this distance range (4.1 × 10⁷ J);
Up to 40 m: Out of a total of 114 recorded phenomena, 37 occurred in the forefield (~32%), where their energy expenditure accounted for 9.0% of the total in this distance range (3.7 × 10⁷ J);
Up to 30 m: Out of a total of 90 recorded phenomena, 32 occurred in the forefield (~36%), where their energy expenditure accounted for 8.4% of the total in this distance range (3.3 × 10⁷ J);
Up to 25 m: Out of a total of 75 recorded phenomena, 28 occurred in the forefield (~37%), where their energy expenditure accounted for 7.8% of the total in this distance range (3.1 × 10⁷ J);
Up to 20 m: Out of a total of 61 recorded phenomena, 23 occurred in the forefield (~38%), where their energy expenditure accounted for 7.5% of the total in this distance range (2.8 × 10⁷ J);
Up to 15 m: Out of a total of 41 recorded phenomena, 14 occurred in the forefield (~34%), where their energy expenditure accounted for 6.2% of the total in this distance range (2.7 × 10⁷ J).
The actual foci location of the registered tremors against the background of the proper map of mining excavations for selected distance ranges in relation to the position of the face are illustrated in Figure 14, Figure 15 and Figure 16. The presented distributions were obtained based on an experiment involving the appropriate selection of elements from a complete database of mining seismological data. In subsequent steps, events with energies ≥ 104 J were extracted from the population of phenomena, the foci of which were located within specific distance ranges in relation to the current position of the face advance. A collective compilation of this type of all tremors recorded at a distance from the face advance up to 50 m is presented in Figure 14 (up to 25 m in Figure 15; up to 15 m in Figure 16).
Analyzing the distribution of tremor foci along the working face (Figure 14, Figure 15 and Figure 16), it is undoubtedly possible to observe a property consistent with the simulation results (in a certain number of cases), consisting of their location near old goafs on one of the sides or in the zone of the central section of the longwall. Given the fact that the processes of activating the burst-prone layer usually have a periodic nature and occur at different time intervals, the obtained non-uniformity of the focus distributions along the face advance should be considered consistent with expectations. Nevertheless, the analysis of the cited statistical compilations and situational maps (Figure 14, Figure 15 and Figure 16) shows that the actual monitoring data from the example longwall test site (Figure 13) do not fully coincide with the results of the numerical simulations. It is possible that a certain influence on this state of affairs may be exerted by the error in the location of epicentral coordinates, which is a function of the distribution of seismometric stations, and which, according to mining data, is about 30 m in the area under consideration.
As stated at the beginning of Section 4, there are many similarities between the model situation and the conditions characterizing the mining polygon, but both cases differ significantly, among others, in the length of the longwall (model—250 m, polygon ~150 m). Therefore, for a closer comparison of the distribution and ranges of anomalous zones with the location of registered seismic events in a situation corresponding to the polygon, additional modelling was carried out for a working face length of 150 m. For greater clarity of comparative analyses, they covered a narrowed fragment of the face advance corresponding to exploitation developed in the bilateral surroundings of the goaf. The calculation results are presented in the form of drawings of concentration areas created by the highest values:
The main stress factor k(σ1) (Figure 17a);
The shear strain energy density factor k(Af) (Figure 17b);
The effort factor k(Ω) (Figure 17c).
The actual locations of seismic events with energies ≥ 104 J registered at a distance of up to 50 m in relation to the working face (according to Figure 14) were superimposed. Maintaining the legend of markings as in the figures in Section 3, for the improvement in the readability of the presented information, the distributions of the variability of the calculation factors shown in the Figure 17a–c were limited to the two most unfavourable anomalous zones described by red and orange contour lines. In addition, aiming at increasing the informativeness of the result, each of the included maps illustrates the distribution of anomaly zones for two different positions of the mining face corresponding to face advance of 450 m and 550 m, respectively.
The presented distributions of stress, energy, and effort concentration areas (Figure 17a–c) should be treated in terms of an increased, potential probability of occurrence—identical to tremors—of destruction processes at the level of the burst-prone layer. Considering this circumstance, it can be stated that for a 450 m face advance, the zones of predicted anomalies essentially correlate well with the location of induced seismicity foci. On the other hand, the analysis also shows that there are undoubtedly working face positions (e.g., for a 550 m advance) for which this correlation is difficult to consider fully satisfactory. However, this fact does not necessarily have to undermine the predictive value of the model, as there may be many justified reasons for this state of affairs. The most important issue concerns the complex structure of the rock mass, including the presence in the profile above the exploited longwall of other (besides the 50 m horizon) cohesive sandstone formations, as well as layers of sandy shales, whose strength parameters often equal those of sandstones. In the simulations, it was assumed that a specific rock layer is activated, while the genesis of the recorded phenomena could be related to a completely different one, or even several simultaneously. In addition, within the layers in question, effort processes, which were the result of seismicity generated by the operation of adjacent longwalls, could have been and probably were initiated earlier. The actual degree of deformation of burst-prone formations—for objective reasons—is impossible to model, as it would require access to detailed data in this area. The second issue concerns additional constraints on geological and/or mining works (Figure 13). In the area of the longwall and its immediate vicinity, there were fault disturbances (with throws reaching up to 70 m), as well as various exploitation legacies created in five overlying seams (lying at a distance of 15–200 m). These elements were not taken into account in the simulations, and in the case of tectonics, the model does not allow for this due to certain assumptions and the resulting limitations. In turn, taking into account the influence of mining remnants is not a problem, but this element was omitted due to the desire to focus on the effects of the exploitation of a single seam; but the continuation of research is planned. Exclusion of a fault and remnants from the model could have affected the simulation result; the correlation of their course with the locations of the foci of a significant group of recorded phenomena, in relation to selected ranges of the longwall’s progress, is confirmation of this thesis, as seen on the maps (Figure 14, Figure 15, Figure 16 and Figure 17). This applies, among others, to the initial section of the face advance, where the only tremors of 107 J and 106 J were recorded, with foci located in the vicinity of the tectonic disturbance zone on the left side of the working face. In the context of comparing the calculation results with the seismicity generated by the longwall movement, a certain asymmetry in the distribution of foci along the front is noticeable, in contrast to the symmetrical shapes of the predicted anomaly areas. Excluding the initial section of the face advance, describing the phase before the panel takes on a closing character, and a tendency to move the centre of gravity of the induced seismicity foci group towards the right-hand side goaf is undoubtedly noticeable, which is visible both in relation to the entire population of the analyzed tremors (≥104 J) and in the collections separated for individual distance intervals. Such a situation can be explained with high probability by a significant difference between the goaf surfaces we are dealing with on both sides of the field. Namely, four longwall panels were exploited on the right side, incidentally with a much longer face advance, while from the left side, there was only one panel with the relatively smallest face advance. The estimated disproportion of the goaf surfaces is therefore about sevenfold; therefore, the observed asymmetry in the distribution of foci on the sides of the field seems to be an expected phenomenon.
The presented example is purely illustrative. The geomechanical model used, like any other, undoubtedly has certain limitations in predicting induced seismicity. However, it should be emphasized that the geological and mining conditions in the area of the comparison longwall were very complex, including many elements that were not taken into account in the modelling. Therefore, to verify the forecasts based on simulation calculations with real mining experiences, the continuation of research with a sufficiently large population of cases is necessary. It seems that significantly better results can be expected in a situation with more selective adaptation of geotechnical conditions, or by the application of backward analysis rules.

5. Conclusions

As part of the work, a geomechanical assessment was made of the impact of resource method extraction from a seam deposit trapped in the boundary pillar of coal mines on the formation of seismic hazard along with verification for real mining data. The basis for the substantive analyses were the results of a model research programme using Knothe–Budryk’s theory algorithms in combination with classical solutions of the strain media mechanics. The considerations focused on a single-wall exploitation option characterized by a front length identical to the width of the asymmetrical pillar, separated in a two-sided environment of the goafs. Two variants of mining operations were considered, differing in the direction of the face, the degree of constraint of the start and end of the face advance, and mining circumstances in terms of the face approaching the goaf corner on one of the parcel sides. The essence of the simulation calculations was the observation of the progress of exploitation along with the behaviour of the burst-prone layer structure overlying the exploited deposit accompanying this progress. The considerations and articulated remarks were based on tracking the characteristics of changes in the values of delegated calculation parameters, among which were the factors of concentration of the largest principal stress, the density of elastic shear strain energy, and the effort factor according to the Coulomb–Mohr criterion. Taking into account the results of the simulation analyses, the following general conclusions can be formulated:
The geomechanical response of the rock mass to subsequent positions of the extraction face in both variants is at a similar, relatively high level in terms of extreme values of all three calculation indicators;
The largest fluctuations in the maxima of individual concentration factors are within the range 68–79% and are recorded at the initial stage of the face advance, after which their values asymptotically stabilize at identical levels;
The greatest risk zones of effort processes in the main roof are local and are located in front of the longwall face in the corners of the solid coal adjacent to the goafs on the sides of the closing field;
The considered methods of extracting the deposit in the boundary pillar will be associated with a high seismic hazard, but in both cases, it should be comparable, also with regard to the potential effects in the mining excavations;
The variant with the face advancing on the south is more favourable in the context of the scale of increases in the maximum values of concentration factors, while the variant with the face advancing north is more favourable in the context of the range of anomalous zones on specific sections of the face advance.
The variability of the induced seismicity attributes values and the size of the generated anomaly areas constitute valuable information within the framework of hazard forecasts, and both of these elements should be taken into account when designing appropriate preventive measures. However, considering that higher values of computational factors are determinants of the initiation of effort processes, from the perspective of the safety of mining operations, the variant in which the longwall working face advances southward should be indicated as generally more favourable (among the two analyzed). Taking into account the potential consequences of seismic events, information regarding the location and extent of anomalous zones can be considered when determining places where the presence of the crew will be limited or inadmissible.
Verification of the model analyses results, carried out on the example of a selected polygon of the crossing longwall, was illustrative and limited in terms of comparing experimentally indicated areas of potential seismic hazard with the location of tremors recorded during the working face advance. Although complete agreement between the simulation results and the actual mining data was not achieved, in the case of such a complex research object as the rock mass, more reliable effects undoubtedly require the continuation of research and analyses that go beyond a single case study. Specific elements of the polygon related to the geological structure of the rock mass, the prior deformation of burst-prone formations, the occurrence of discontinuities in tectonic activity, or exploitation remnants were not taken into account in the modelling, partially for intentional reasons, but also due to certain limitations of the method itself. The algorithms of the base theory, although successfully widely used in forecasting terrain deformation, and consequently repeatedly subjected to scientific discussion and confirmed in geodetic practice, may not fully reflect the complex processes of destruction and the nature of the redistribution of energy–stress changes in the rock mass in terms of assessing seismicity induced by underground exploitation. Therefore, in order to develop reliable interpretative criteria for forecasts, the authors intend to expand research in this area, including a larger number of simulation attempts for additional temporary positions of the working face and various geomechanical and spatial data.

Author Contributions

D.C. and G.D.: research/paper idea, methodology, conclusions; D.C.: data verification, stress state analytical modelling, results comparison, final editing; G.D.: data collecting and analysis, seismicity parameters calculation/processing, results visualization, draft text editing. All authors have read and agreed to the published version of the manuscript.

Funding

The research was funded by AGH University of Krakow; subsidy numbers 16.16.100.215, 501.696.7996.

Institutional Review Board Statement

Not applicable.

Informed Consent Statement

Not applicable.

Data Availability Statement

The original contributions presented in this study are included in the article. Further inquiries can be directed to the corresponding author.

Conflicts of Interest

The authors wish to confirm that there are no known conflicts of interest associated with this publication.

References

  1. State Mining Authority, Report on the Activities of State Mining Authority in 2024. Available online: https://www.wug.gov.pl (accessed on 1 July 2025). (In Polish)
  2. Report 2020: Hard Coal Mining in Poland. Instytut Gospodarki Surowcami Mineralnymi i Energią PAN.; Kraków. 2021. Available online: https://min-pan.krakow.pl/projekty/wp-content/uploads/sites/8/2018/07/Raport-2020_Górnictwo-węgla-kamiennego-w-Polsce.pdf (accessed on 1 April 2025). (In Polish).
  3. Konicek, P.; Schreiber, J. Heavy rockbursts due to longwall mining near protective pillars: A case study. Int. J. Min. Sci. Technol. 2018, 28, 799–805. [Google Scholar] [CrossRef]
  4. Das, R.; Sharma, M.L.; Wason, H.R.; Choudhury, D.; Gonzalez, G. A Seismic Moment Magnitude Scale. Bull. Seismol. Soc. Am. 2019, 109, 1542–1555. [Google Scholar] [CrossRef]
  5. Das, R.; Das, A. Limitations of Mw and M Scales: Compelling Evidence Advocating for the Das Magnitude Scale (Mwg)-A Critical Review and Analysis. Indian Geotech. J. 2025, 1147, 1–19. [Google Scholar] [CrossRef]
  6. Cała, M.; Tajduś, A. Stan Naprężenia Pod Pozostawionym Filarem Lub Resztką Pokładu. Conference materials: Tąpania 2001. 2001. (In Polish). Available online: https://home.agh.edu.pl/~cala/papers/2001_03.pdf (accessed on 15 June 2025).
  7. Kaya, A.; Tarakci, U.C. Stability Investigation of a deep shaft using different methods. Int. J. Geomech. 2020, 21, 05020009. [Google Scholar] [CrossRef]
  8. Bukowski, P. Determining of safety pillars in the vicinity of water reservoirs in mine workings within abandoned mines in the Upper Silesian Coal Basin. J. Min. Sci. 2010, 46, 298–310. [Google Scholar] [CrossRef]
  9. Kumar, R.; Verma, A.K. Water barrier pillar design for safety in underground coal mines: A review. Mine Water Environ. 2025, 44, 203–225. [Google Scholar] [CrossRef]
  10. Fan, J.; Li, Z.; Feng, G.; Zhang, H.; Qi, C.; Zhang, J. Failure analysis of coal pillars and overburden from underground water reservoir under the mining-water invasion coupling effect. Eng. Fail. Anal. 2023, 151, 107406. [Google Scholar] [CrossRef]
  11. Wesseloo, J.; Stacey, T.R. A reconsideration of the extension strain criterion for fracture and failure of rock. Int. J. Rock Mech. Rock Eng. 2016, 49, 4667–4679. [Google Scholar] [CrossRef]
  12. Zakri, R.S.; Wattimena, R.K.; Prassetyo, S.H.; Karian, T. Influence of mining depth and panel length in longwall underground coal mining on the distribution of principal stresses along the barrier pillars. In Proceedings of the IOP Conference Series: Earth and Environment Science, 3rd International Conference on Mining and Environmental Technology, Mataram, Indonesia, 22–24 August 2024; Volume 1422, p. 012014. [Google Scholar] [CrossRef]
  13. Yadav, A.R.; Islavath, S.R. Numerical investigation for estimation of behaviour of barrier pillars, gateroads and face of a deep longwall mine: A case study. Min. Metall. Explor. 2024, 41, 463–478. [Google Scholar] [CrossRef]
  14. Eremin, M.; Peryshkin, A.; Esterhuizen, G.; Pavlova, L.; Fryanov, V. Numerical Analysis of Pillar Stability in Longwall Mining of Two Adjacent Panels of an Inclined Coal Seam. Appl. Sci. 2022, 12, 11028. [Google Scholar] [CrossRef]
  15. Li, W.; Tu, S.; Tu, H.; Li, Y.; Liu, X.; Miao, K. Failure characteristics and control techniques for mining roadway affected by stress accumulation of residual pillars in contiguous coal seams. Eng. Fail. Anal. 2022, 141, 106646. [Google Scholar] [CrossRef]
  16. Zingano, A.C.; Koppe, J.C.; Costa, J.F. Barrier pillar between production panels in coal mine. Rem Rev. Esc. Minas 2007, 60, 219–226. [Google Scholar] [CrossRef]
  17. Oraee, K.; Hosseini, N.; Gholinejad, M. Estimation of coal pillar strength by Finite difference model. In Proceedings of the 2009 Coal Operators Conference, Wollongong, Australia, 12–13 February 2009; The AusIMM Illlawarra Branch: Wollongong, Australia, 2009; pp. 54–61. [Google Scholar]
  18. Wang, H.; Jiang, Y.; Zhao, Y.; Zhu, J.; Liu, S. Numerical Investigation of the Dynamic Mechanical State of a Coal Pillar During Longwall Mining Panel Extraction. Rock Mech. Rock Eng. 2013, 46, 1211–1221. [Google Scholar] [CrossRef]
  19. Hashikawa, H.; Mao, P.; Sasaoka, T.; Hamanaka, A.; Shimada, H.; Batsaikhan, U.; Oya, J. Numerical Simulation on Pillar Design for Longwall Mining under Weak Immediate Roof and Floor Strata in Indonesia. Sustainability 2022, 14, 16508. [Google Scholar] [CrossRef]
  20. Rezaei, M.; Hossaini, M.F.; Majdi, A. Development of a time-dependent Energy model to calculate the mining-induced stress over gates and pillars. J. Rock Mech. Geotech. Eng. 2015, 7, 306–317. [Google Scholar] [CrossRef]
  21. Frith, R.; Reed, G. The limitations and potential design risks when applying empirically derived coal pillar strength equations to real-life mine stability problems. Int. J. Min. Sci. Technol. 2019, 29, 17–25. [Google Scholar] [CrossRef]
  22. Wang, S.L.; Hao, S.P.; Chen, Y.; Bai, J.B.; Wang, X.Y.; Xu, Y. Numerical investigation of coal pillar failure under simultaneous static and dynamic loading. Int. J. Rock Mech. Min. Sci. 2016, 84, 59–68. [Google Scholar] [CrossRef]
  23. Lai, X.; Xu, H.; Fan, J.; Wang, Z.; Yan, Z.; Shan, P.; Zhang, S.; Yang, Y. Study on the mechanism and conrol of rockburst od coal pillar under complex conditions. Geofluids 2020, 2020, 8847003. [Google Scholar] [CrossRef]
  24. Maj, A.; Kortas, G. Wytężenie filarów przy komorowo-filarowej eksploatacji złoża anhydrytu. Przegląd Górniczy 2004, 60, 34–39. (In Polish) [Google Scholar]
  25. Kumar, A.; Waclawik, P.; Singh, R.; Ram, S.; Korbel, J. Performance of a coal pillar at deeper cover: Field and simulation studies. Int. J. Rock Mech. Min. Sci. 2019, 113, 322–332. [Google Scholar] [CrossRef]
  26. Chlebowski, D.; Burtan, Z. Geomechanical Analysis of the Main Roof Deformation in Room-and-Pillar Ore Mining Systems in Relation to Real Induced Seismicity. Appl. Sci. 2024, 14, 5710. (In Polish) [Google Scholar] [CrossRef]
  27. Nguyen, P.; Minh, V.; Litwa, P.; Makówka, J.; Szczerbiński, K.; Phan, V.V. Investigation of the Occurrence of Intensive Seismic Activity at the “Polkowice-Sieroszowice” Copper Ore Mine, Poland. Arch. Min. Sci. 2024, 69, 559–573. [Google Scholar] [CrossRef]
  28. Bańka, P.; Jaworski, A.; Plewa, F. Analityczne podejście prognostyczne, stosowane do oceny potencjalnego zagrożenia tąpaniami wyrobisk górniczych. Górnictwo Geol. 2011, 6, 23–35. (In Polish) [Google Scholar]
  29. Chlebowski, D. Analityczne Modelowanie Eksploatacji Skrępowanej w Aspekcie Identyfikacji Stref Zagrożenia Tąaniami; Wydawnictwo AGH: Kraków, Poland, 2013. (In Polish) [Google Scholar]
  30. Xue, C.; Cao, A.; Liu, Y.; Guo, W.; Wen, Y.; Hu, Y.; Gao, X. Mechanism and prevention practice of coal burst in deep graduał residual coal pillar area: A case study. Arab. J. Geosci. 2022, 15, 195. [Google Scholar] [CrossRef]
  31. Sałustowicz, A. Tąpania w Świetle Badań Laboratoryjnych i Obserwacji w Praktyce; Wydawnictwo SITG: Katowice, Poland, 1963. (In Polish) [Google Scholar]
  32. Gil, H.; Drzęźla, B. Metody oceny skłonności węgla do tąpań. Przegląd Górniczy 1973, 12. (In Polish) [Google Scholar]
  33. Bukowska, M. Kompleksowa Metoda Oceny Skłonności do Tąpań Górotworu w Górnośląskim Zagłębiu Węglowym; Wydawnictwo Główny Instytut Górnictwa: Katowie, Poland, 2009. (In Polish) [Google Scholar]
  34. Knothe, S. Prognozowanie Wpływu Eksploatacji Górniczej; Wydawnictwo Śląsk: Katowice, Poland, 1984. (In Polish) [Google Scholar]
  35. Djamaluddin, I.; Mitani, Y.; Esaki, T. Evaluation of ground movement and damage to structure from Chinese coal mining using a new GIS coupling model. Int. J. Rock Mech. Min. Sci. 2011, 48, 380–393. [Google Scholar] [CrossRef]
  36. Kowalski, A.; Białek, J.; Rutkowski, T. Caulking of Goafs Formed by Cave-in Mining and its Impact on Surface Subsidence in Hard Coal Mines. Arch. Min. Sci. 2021, 66, 85–100. [Google Scholar] [CrossRef]
  37. Strzałkowski, P. Predicting Mining Areas Deformations under the Condition of High Strength and Depth of Cover. Energies 2022, 15, 4627. [Google Scholar] [CrossRef]
  38. Blachowski, J. Application of GIS spatial regression methods in assessment of land subsidence in complicated mining conditions: Case study of the Walbrzych coal mine (SW Poland). Nat. Hazards 2016, 84, 997–1014. [Google Scholar] [CrossRef]
  39. Hejmanowski, R.; Malinowska, A.A. Wykorzystanie metody odwrotnej w estymacji osiadań powierzchni terenu dla złóż soli. Gospod. Surowcami Miner.—Miner. Resour. Manag. 2017, 33, 179–200. (In Polish) [Google Scholar] [CrossRef]
  40. Niedojadło, Z.; Stoch, T.; Jura, J.; Sopata, P.; Wójcik, A.; Mrocheń, D. Monitoring and modelling the deformation state of a dyke of a flotation tailings reservoir of a copper ore mine. Acta Montan. Slovaca 2023, 28, 123–140. [Google Scholar] [CrossRef]
  41. Tajduś, K. Określenie Wartości Parametrów Odkształceniowych Górotworu Uwarstwionego w Rejonie Wpływów Eksploatacji Górniczej. Ph.D. Thesis, Wydawnictwo AGH, Kraków, Poland, 2008. (In Polish). [Google Scholar]
  42. Sroka, A.; Knothe, A.; Tajduś, K.; Misa, R. Underground exploitations inside safety pillar shafts when considering the effective use of a coal deposit. Gospod. Surowcami Miner. 2008, 31, 93–110. [Google Scholar] [CrossRef]
  43. Han, J.; Zou, J.; Hu, C.; Yang, W. Study on Size Design of Shaft Protection Rock/Coal Pillars in Thick Soil and Thin Rock Strata. Energies 2019, 12, 2553. [Google Scholar] [CrossRef]
  44. Misa, R. Knothe’s theory parameters—Computational models and examples of practical applications. Gospod. Surowcami Miner.—Miner. Resour. Manag. 2023, 39, 157–180. [Google Scholar] [CrossRef]
  45. Witkowski, W. Implementation of the Least Squares Method in Determining the Parameters of Knothe’s Theory. Geomat. Environ. Eng. 2014, 8, 107–117. [Google Scholar] [CrossRef]
  46. Polanin, P. Application of the parameter groups of the Knothe-Budryk theory in subsidence prediction. J. Sustain. Min. 2015, 14, 67–75. [Google Scholar] [CrossRef]
  47. Awierszyn, S.G. Sdwiżenije Gornych Porod Pri Podziemnych Razrabotkach; Ugletiechzdat: Moskwa, Russia, 1947. [Google Scholar]
  48. Budryk, W. Wyznaczanie wielkości poziomych odkształceń terenu. Arch. Górnictwa Hut. 1953, 1, 63–74. (In Polish) [Google Scholar]
  49. Kłeczek, Z. Geomechanika Górnicza; Wydawnictwo AGH: Kraków, Poland, 1985. (In Polish) [Google Scholar]
  50. Szeptyński, P. Podstawy Wytrzymałości Materiałów i Mechaniki Układów Prętowych. Creative Commons CC BY-NC-SA 3.0 PL. 2018. Available online: http://limba.wil.pk.edu.pl/kpmoc/images/stories/kpmoc/pracownicy/PSz/WM/konspekty/07-Teoria.pdf (accessed on 15 June 2025).
  51. Sih, G.C. Methods of Analysis and Solutions of Crack Problems. Recent Developments in Fracture Mechanics. Theory and Methods of Solving Crack Problems. In Mechanics of Fracture; Noordhoff International Publishing: Leyden, The Netherlands, 1973; Volume 1. [Google Scholar]
  52. Drzęźla, B. Zmienność zasięgu wpływów eksploatacji w górotworze. Przegląd Górniczy 1979, 10, 413–418. (In Polish) [Google Scholar]
  53. Dżegniuk, B.; Niedojadło, Z.; Sroka, A. Podstawy wymiarowania i eksploatacji szybowych filarów ochronnych. Mater. Szkoły Eksploat. Podziemnej 2003, 77, 93. (In Polish) [Google Scholar]
  54. Hastings, C.; Mischo, K.; Morrison, M. Hands-on Start to Wolfram Mathematica and Programming with the Wolfram Language; Wolfram Media, Inc.: Champaign, IL, USA, 2016. [Google Scholar]
  55. Own Materials of the USCB Hard Coal Mines, 2020–2023. (Unpublished Materials). (In Polish)
Figure 1. Structure of hard coal resources in developed deposits (for the entire deposit, 2020) [2].
Applsci 15 12126 g001
Figure 2. (a) Simulation scheme for the production of a boundary pillar—step 1 (Model #0A); (b) Simulation scheme for the production of a boundary pillar—step 2 (Model #0B).
Applsci 15 12126 g002
Figure 3. (a) Simulation scheme for the production of a boundary pillar—variant 1 (Model #4A → #4B → #4C → #4D); (b) Simulation scheme for the production of a boundary pillar—variant 2 (Model #5A → #5B → #5C → #5D).
Applsci 15 12126 g003
Figure 4. Simulation area and sketch of the model situation in a horizontal (x,y) and vertical (x,z) system.
Applsci 15 12126 g004
Figure 5. (a) Stress factor variability zones k(σ1)—pillar creation (Model #0A → #0B); (b) Effort factor variability zones k(Ω)—pillar creation (Model #0A → #0B); (c) Shear strain energy density factor variability zones k(Af)—pillar creation (Model #0A → #0B).
Applsci 15 12126 g005
Figure 6. Stress factor variability zones k(σ1)—exploitation in pillar according to variant 1 (Model #0B → #4A → #4B → #4C → #4D).
Applsci 15 12126 g006
Figure 7. Effort factor variability zones k(Ω)—exploitation in pillar according to variant 1 (Model #0B → #4A → #4B → #4C → #4D).
Applsci 15 12126 g007
Figure 8. Shear strain energy density factor variability zones k(Af)—exploitation in pillar according to variant 1 (Model #0B → #4A → #4B → #4C → #4D).
Applsci 15 12126 g008
Figure 9. Stress factor variability zones k(σ1)—exploitation in pillar according to variant 2 (Model #0B → #5A → #5B → #5C → #5D).
Applsci 15 12126 g009
Figure 10. Effort factor variability zones k(Ω)—exploitation in pillar according to variant 2 (Model #0B → #5A → #5B → #5C → #5D).
Applsci 15 12126 g010
Figure 11. Shear strain energy density factor variability zones k(Af)—exploitation in pillar according to variant 2 (Model #0B → #5A → #5B → #5C → #5D).
Applsci 15 12126 g011
Figure 12. Comparative diagram of the variability of maximum values of calculation factors (k(σ1), k(Af), k(Ω)) in subsequent stages of exploitation development in the pillar according to variant 1 and 2 (Model #0B → #4/5A → #4/5B → #4/5C → #4/5D).
Applsci 15 12126 g012
Figure 13. Fragment of a mining map in the area of the mine verification polygon stage of the project for the exploitation of the closing longwall. Source: [55].
Applsci 15 12126 g013
Figure 14. Epicentral location of tremor foci (≥104 J) recorded within a distance of up to 50 m from the face against the background of a mining map (stage after the completion of exploitation of the closing longwall).
Applsci 15 12126 g014
Figure 15. Epicentral location of tremor foci (≥104 J) recorded at a distance of up to 25 m from the front against the background of the mining map (stage after the end of the operation of the closing longwall).
Applsci 15 12126 g015
Figure 16. Epicentral location of tremor foci (≥104 J) recorded at a distance of up to 15 m from the front against the background of the mining map (stage after the end of the operation of the closing longwall).
Applsci 15 12126 g016
Figure 17. (a) Zones of the largest values of the stress factor k(σ1) against the background of tremors foci < 50 m from the front of the longwall. (b) Zones of the largest values of the energy factor k(Af) against the background of tremor foci < 50 m from the front of the longwall. (c) Zones of the largest values of the factor of effort k(Ω) against the background of tremor foci < 50 m from the front of the longwall.
Applsci 15 12126 g017
Disclaimer/Publisher’s Note: The statements, opinions and data contained in all publications are solely those of the individual author(s) and contributor(s) and not of MDPI and/or the editor(s). MDPI and/or the editor(s) disclaim responsibility for any injury to people or property resulting from any ideas, methods, instructions or products referred to in the content.