Article

Sensitivity Improvement of 2.5 Gb/s Receivers Using AlGaAsSb Avalanche Photodiodes

School of Electrical and Electronic Engineering, University of Sheffield, Sheffield S1 3JD, UK
*
Author to whom correspondence should be addressed.
Appl. Sci. 2025, 15(22), 12056; https://doi.org/10.3390/app152212056
Submission received: 15 October 2025 / Revised: 7 November 2025 / Accepted: 10 November 2025 / Published: 13 November 2025
(This article belongs to the Special Issue Recent Advances in Optical Sensors)

Abstract

At a 1550 nm wavelength, the optical sensitivity of conventional indium gallium arsenide (InGaAs)-based avalanche photodiodes (APDs) is restricted by their high excess noise, hindering their performance in long-range free-space optical communication links. Al0.85Ga0.15As0.56Sb0.44 (AlGaAsSb), lattice-matched to indium phosphide (InP) substrates, has a much lower excess noise factor than InP, the conventional avalanche material. In this work, we evaluated the performance of optical APD-TIA receivers utilizing InGaAs/AlGaAsSb APDs through simulations and experiments. Simulations confirmed their optimum gain is much higher than conventional APDs. InGaAs/AlGaAsSb APD dies and transimpedance amplifier (TIA) chips were integrated, yielding four optical receivers for experimental evaluation. At 2.5 Gb/s and BER = 10−9, these receivers operated at a high optimal gain of 56 (as predicted in simulations) and produced a mean sensitivity of −38.5 dBm, with the best sensitivity at −39.2 dBm. These sensitivity values are at least 2.7 (or, in the best case, 3.4) dB better than those of typical commercial receivers with InGaAs APDs. This work quantifies the significant performance improvement that InGaAs/AlGaAsSb APDs provide to long-range free-space optical communication links.

1. Introduction

Indium gallium arsenide (InGaAs)-based avalanche photodiodes (APDs) are the optical detectors of choice for optical fiber-based communication systems operating at a 1550 nm wavelength. In recent years, there has been an increasing demand for these APDs in free-space optical communication (FSOC) [1], many of which also operate at the 1550 nm wavelength due to eye-safe operation at this wavelength (which enables higher transceiver powers) [2]. FSOC links can be deployed without costly and time-consuming optical cable installations. When compared with radio frequency links, FSOC links are not limited by spectrum scarcity, and they offer more directional signal propagation and better, higher bandwidths [3]. FSOC transceivers have been demonstrated for ship-to-ship communication at 300 Mbps, with up to 17.5 km separation between vessels [4]. More recently, a 10.07 Gbps link was achieved over 29 km between islands [5].
Atmospheric conditions can affect FSOC links [6], so high-sensitivity APD-TIA receivers are crucial to their overall performance. In an FSOC receiver, the incoming optical signals are often detected by an InGaAs-based APD integrated with a transimpedance amplifier (TIA). Both the APD and TIA provide amplification; however, the APD’s internal gain, M, helps to raise the optical signal above the noise of the TIA, improving the receiver’s sensitivity. As an example, a 2.4 km optical link utilized a receiver to achieve a sensitivity of −21 dBm at a bit error rate (BER) of 10−9 [7].
The APD’s gain is generated through impact ionizing collisions inside its avalanche layer. However, the optimum M values to achieve the best sensitivity in established avalanche materials such as indium phosphide (InP) and indium aluminum arsenide (InAlAs) are often limited to 10–20. A higher M is possible, but the increased excess noise (characterized by the excess noise factor, F) eventually worsens the signal-to-noise ratio. Therefore, high-sensitivity receivers not only require the APD to have a low dark current but also low F(M) characteristics.
InP and InAlAs are the most common avalanche materials in InGaAs-based APDs for 1550 nm wavelength. At 2.5 Gb/s, the best sensitivities using an InP APD are predicted to be ~−34.5 dBm (with M = 17.5) at BER = 10−12 [8], in line with commercial 2.5 Gb/s InGaAs-based APDs [9,10,11], as listed in Table 1. The unity-gain responsivity, R , and sensitivity values of these APDs are similar. Coupled with their relatively small optimal M values (M~10 [9]), it is highly likely that the F(M) characteristics of InP APDs limit the receiver’s sensitivity. InAlAs APDs can improve sensitivities slightly, but the associated optimal M is only slightly higher at 23 [11]. The InGaAs/InAlAs APD in [11] was provided by Optogration, so it can be considered a commercial-grade APD.
Recently, lower F(M) characteristics have been achieved using two Sb-containing alloys, AlxIn1−xAs0.79Sb0.21 and AlxGa1−xAs0.56Sb0.44, both of which can be grown lattice-matched to InP substrates as random or digital alloys [12]. Examples include Al0.7In0.3As0.79Sb0.21 [13], AlAs0.56Sb0.44 [14], and Al0.85Ga0.15As0.56Sb0.44 [15,16,17]. Of these, only Al0.85Ga0.15As0.56Sb0.44 (referred to as AlGaAsSb hereafter) is available commercially. Commercial InGaAs/AlGaAsSb APDs exhibit F ~ 3.4 at M = 100 [18], significantly better than commercial InGaAs/InP APDs [19]. Another InGaAs/AlGaAsSb APD offered a 2–5 dB improvement in sensitivity (depending on the operation temperature and for a false alarm rate < 2 × 10⁻⁴), compared with a commercial InGaAs/InP APD [20]. It is, therefore, worthwhile investigating the extent of performance improvement gained by replacing commercial InGaAs/InP APDs with InGaAs/AlGaAsSb APDs in FSOC links.
Though a significant improvement in the receiver’s sensitivity will benefit standard FSOC links, it is particularly important for FSOC links over long distances, such as in space communications. For 2.5 Gb/s FSOC links in space, the required receiver’s sensitivity is −37.1 dBm at BER < 10−9 [21]. This exceeds the best performance of existing commercial receivers (−35.8 dBm in Table 1) and is very close to the performance of the receiver using an InAlAs APD when tested with less stringent PRBS-7 data patterns. It is, therefore, desirable to develop a receiver with a sensitivity significantly better than −37.1 dBm, at a BER of 10−9 and under the more stringent PRBS-23 test condition. The recent emergence of commercial, low-noise InGaAs/AlGaAsSb APDs may improve the performance of receivers. In this work, we present our investigation on the potential benefit of using InGaAs/AlGaAsSb APDs in receivers for FSOC links.
Simulations using a standard BER model confirmed that the predicted sensitivity using an InGaAs/AlGaAsSb APD [18] is superior to that using an InGaAs/InP APD [19] when combined with several commercially available low-noise TIAs. Following that, an InGaAs/AlGaAsSb APD and a TIA were integrated to demonstrate a 2.5 Gb/s receiver with significantly improved sensitivity over existing, commercial 1550 nm wavelength receivers.

2. Simulation Model and Results

2.1. BER Model

A standard model for a digital receiver was used to simulate the BER (defined as the probability of incorrect identification of a bit by the receiver) versus the receiver’s sensitivity characteristics. The receiver’s output is approximated as a Gaussian variable with mean values of µ0 and µ1 during ‘0’ or ‘1’ bits, respectively, and standard deviations of σ0 and σ1. When the receiver bandwidth, Brec, exceeds the data transmission rate, then the receiver’s output (and, hence, the BER) will be independent of the previous outputs, i.e., with no significant inter-symbol interference (ISI). With this assumption, the BER is given by [22]
B E R = 1 2 e r f c Q 2 ,
where Q is the quality factor derived from the optimal detection threshold using
Q = μ 1 μ 0 σ 1 + σ 0 .
The mean difference between the current responses of the ‘0’ and ‘1’ bits is purely due to the multiplied photocurrent from the APD. Hence,
μ 1 μ 0 = M R P 1 P 0 ,
where P1 and P0 are the optical powers during the ‘1’ or ‘0’ bits. If the photocurrent is large, space-charge effects within the APD can lower M [23]. For 2.5 Gb/s receivers, however, the operating optical powers are small (<−30 dBm for 10−9 BER); hence, M can be assumed to be independent of the optical power.
The total noise of the receiver is the combination of the shot noise components of the APD’s dark current, id, the photocurrent, iph, and the TIA’s noise current density, iTIA. For a given receiver bandwidth, Brec, σ0(1) is given by
σ 0 ( 1 ) = B r e c i d 2 + i p h , 0 ( 1 ) 2 + i T I A 2 .
The subscript 0(1) denotes whether the APD is receiving a ‘0’- or ‘1’-bit signal, respectively. Due to the APD’s gain and its associated excess noise, iph is given by
i p h , 0 ( 1 ) 2 = 2 q M 2 F R P 0 ( 1 ) ,
where q is the charge of an electron, and P0(1) is the incoming optical power during a ‘0’- or ‘1’-bit signal. Likewise, the shot noise from the APD’s dark current is
i d 2 = 2 q M 2 F I b u l k + I s u r f ,
where Ibulk and Isurf are the bulk and surface components of the dark current. Note that the surface dark current is not multiplied by the avalanche gain. In this work, Isurf was omitted from the sensitivity calculations because M2FIbulk was assumed to be the dominant term in (6) and represents the worst-case scenario.
During operation, the input optical power will switch between P0 and P1, resulting in a mean value optical power Pmean = ½ (P1 + P0). In the ideal case of P0 = 0 and no optical intensity noise, (2) to (6) can be rearranged into the following form:
P m e a n = Q R q F Q B r e c + σ 0 M .
When P0 ≠ 0, the sensitivity is worse due to some of the optical power being wasted during the ‘0’ bits. The quality of optical modulation is characterized by the extinction ratio (ER), defined as 10 log10(P1/P0) in units of dB. In cases where σ0 is TIA-dominated, the ER-related sensitivity penalty, ΔPER, is given by
P E R = 10 l o g 1 + 10 E R / 10 1 10 E R / 10 ,

2.2. APD and TIA Selection

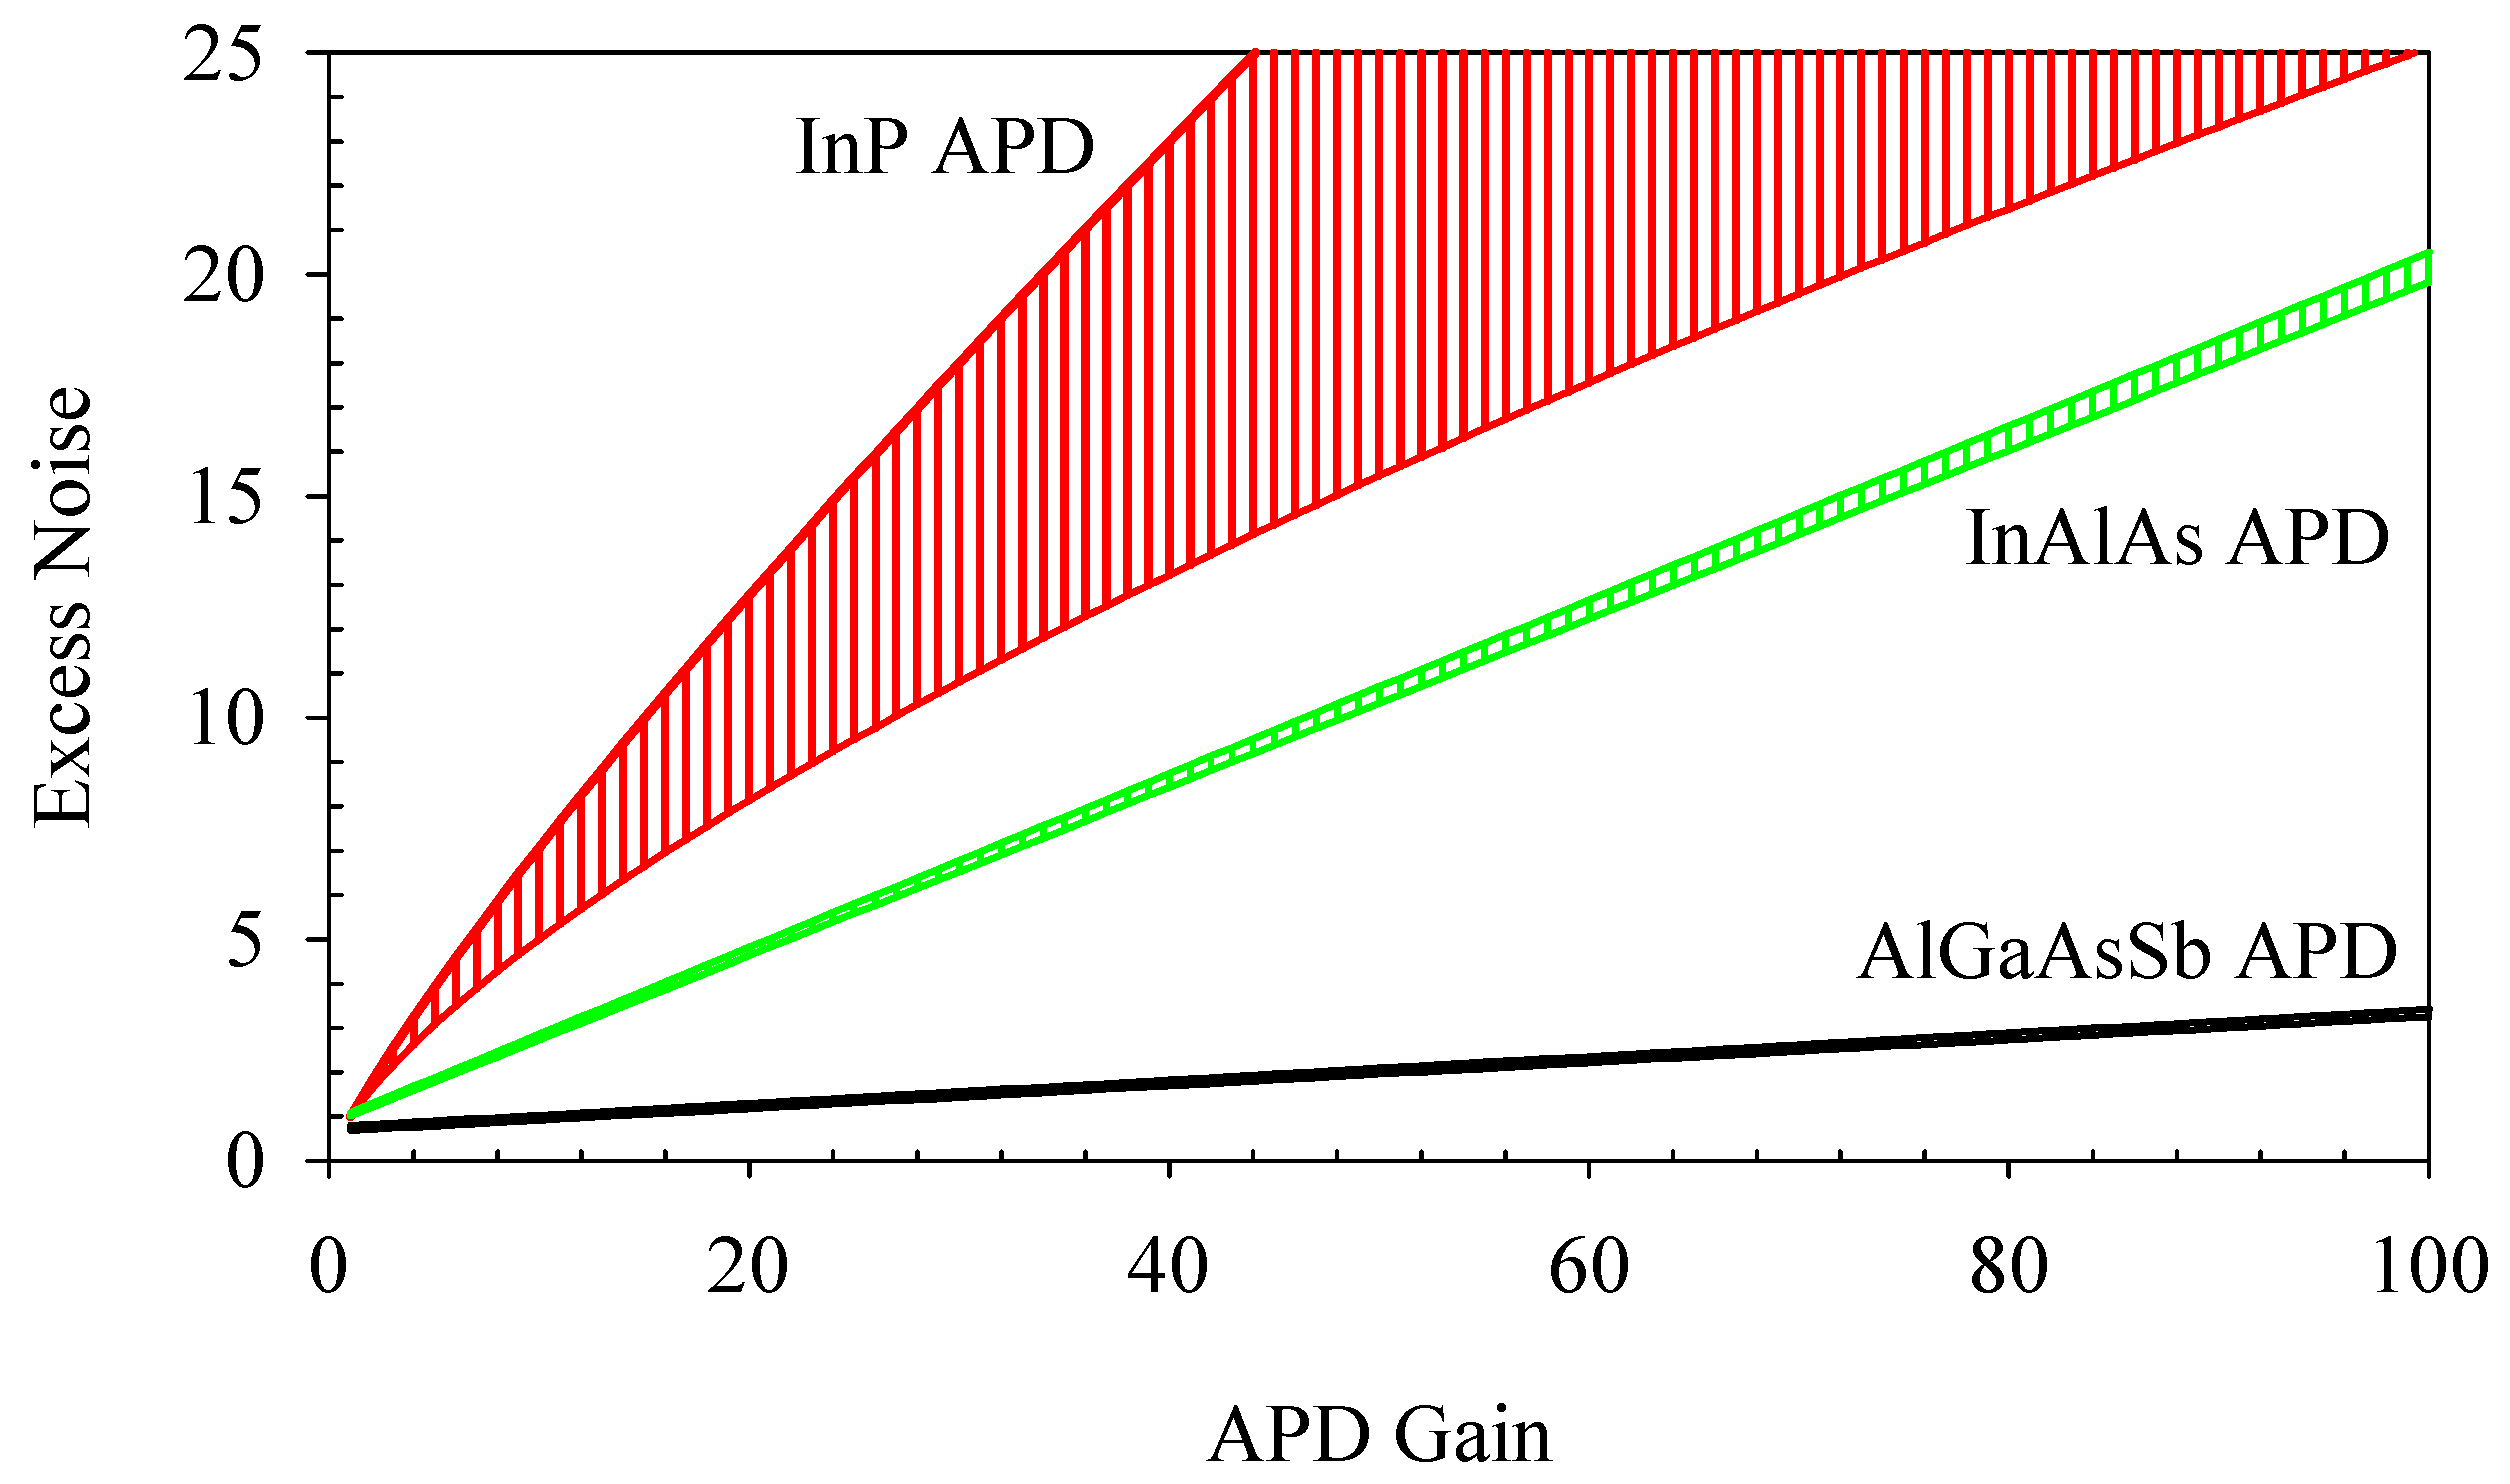
All APDs considered in this work have InGaAs absorption regions. Two commercial APDs, an InP APD [19] and an AlGaAsSb APD [18], were included in our simulation study. An optimized InAlAs APD [11] was also included for comparison. The key APD parameters used in the BER model are listed in Table 2. The receiver bandwidth was assumed to be limited by the TIA; hence, Brec was set to the TIA’s bandwidth. The excess noise trends for the AlGaAsSb and InAlAs APDs were obtained from the linear extrapolations of the available excess noise data from [18] and [11], respectively. The uncertainties of F, for the AlGaAsSb and InAlAs APDs, are included in Table 2 and Figure 1, while the ranges for F and R stated in [19] are included for the InP APD.
Of the APDs in Table 2, the InP APD had the highest dark current and lowest responsivity. Moreover, Figure 1 shows the F(M) characteristics of these APDs with AlGaAsSb, InAlAs, and InP avalanche layers. For the AlGaAsSb APD, the excess noise is substantially lower than that of the InAlAs and InP APDs, indicating that AlGaAsSb will provide a better sensitivity performance. For the AlGaAsSb APDs, an average dark current of 0.5 nA at M = 10 for APDs with a 50 µm diameter was obtained from 10 APDs. We assumed that Ibulk = 0.05 nA (at M = 1) and Isurf = 0. This very low dark current did not affect the sensitivity analysis since its noise contribution was small compared with the noise contributions from the photocurrent or the TIA. For example, an optical signal power of −50 dBm will generate a photocurrent of 9.5 nA without avalanche gain (using R = 0.95 A/W from Table 2), larger than the APD dark current.
Three low-noise commercial TIA chips were considered: HiLight HLR2G50 [24], Ommic CGY2102UH/C2 [25], and Phyworks PHY1097-03 [26]. Table 3 summarizes their bandwidths and root-mean-square noise currents (Brec1/2 × iTIA). The TIA noise currents are much greater than those from the APD.

2.3. Atmospheric Link Model

In a free-space optic (FSO) link, the transmitter’s output optical power, PTX, will be attenuated by geometric optical loss, LGEO, atmospheric scattering, LSCAT, pointing errors, LP, and optical coupling losses, LC, such that the received mean power (all units in dB) is
P m e a n = P T X L G E O L S C A T L P L C L M .
where LM is the optical link margin. The LGEO for a link distance, x, due to beam divergence is given by
L G E O ( x ) = 20   log 10 d R X d T X + θ x ,
where dRX and dTX are the diameters of the receiver and transmitter, and ϴ is the beam divergence (in mrad). Using (9) and (10), Pmean was calculated for a range of visibilities from 0.1 (thick fog) to 50 km (very clear conditions). The values of the parameters used in this model are listed in Table 4. We used LSCAT(x) = 4.343βx, where β is the optical attenuation coefficient, based on Kim’s model of atmospheric scattering [27]. The Kim model is dependent on the metrological visibility, defined as the atmospheric path length, where the optical power from a 2700 K temperature incandescent lamp drops to 5% of its original value [28]. The predicted FSO link distance is defined from the x value, where Pmean from the atmospheric link model equates to the receiver sensitivity.

2.4. Simulated Sensitivity at BER = 10−9

The APD parameters from Figure 1 and Table 2, combined with the TIA parameters from Table 3, were used with the BER model to simulate the sensitivity performance for the six APD-TIA combinations using AlGaAsSb and InP avalanche APDs, and the InAlAs APD with the PHY1097-03 TIA (as used in [11]). An ideal ER was assumed (i.e., ΔPER = 0 dB), and all receivers were modeled at a BER of 10−9 (Q = 6). The receiver bandwidth was assumed to be TIA-limited; hence, the Brec values from Table 3 were used, though all of the modeled receivers can operate at a data rate of 2.5 Gb/s.
Figure 2 shows the modeled sensitivities using the typical values from APD and TIA (Table 2 and Table 3). The corresponding optimum gain calculated using the typical values is also shown. For a given BER and TIA, using the AlGaAsSb APD improved the sensitivity by −5.6 dB compared with the InP APD. Our simulations suggest that a sensitivity below −40.3 dBm at a BER of 10−9 can be achieved using the AlGaAsSb APD with any of the TIAs. The AlGaAsSb, InP, and InAlAs APDs produced similar sensitivity when M < 10, indicating dominance of the TIA noise. Therefore, increasing M rapidly improves the sensitivity up to an optimal M, whose value depends on the APD and the TIA. Beyond the optimal M, the APD’s excess noise factor becomes so large that the sensitivity worsens. The optimal M of the InP APDs ranged from 15 to 19, depending on the TIA, and was much smaller than those of the AlGaAsSb APDs (54–66). The InAlAs APD with the PHY1097-03 TIA had an optimal M of 21, which was larger than that of the InP APD with the same TIA, but smaller than that of the AlGaAsSb APD. For a given APD, our results indicate that the best sensitivity was achieved using the PHY1097-03 TIA (lowest TIA noise current), followed closely behind by the HLR2G50 TIA (smallest bandwidth), while the CGY2102UH/C2 TIA was the worst-performing.
When the calculations were repeated using the available range of values in Table 2 and Table 3, a set of upper and lower values for the sensitivities was also produced. These sensitivities are included in Table 5, along with the corresponding optimal gains.

3. Experimental Results

3.1. APD-TIA Integration and Receiver Tests

The AlGaAsSb APD, procured from Phlux Technology Ltd., Sheffield, UK, was used in the APD-TIA integration, since it is advantageous to use an AlGaAsSb APD rather than an InP APD. CGY2102UH/C2 TIA chips were chosen because Figure 2 suggests they can achieve a sensitivity of −42.2 dBm at a BER of 10−9 and are on the European Preferred Parts List (EPPL) of the European Space Agency (listed under ED02AH). In contrast, no fabrication information for the other two TIA chips was provided, and they were not in the EPPL.
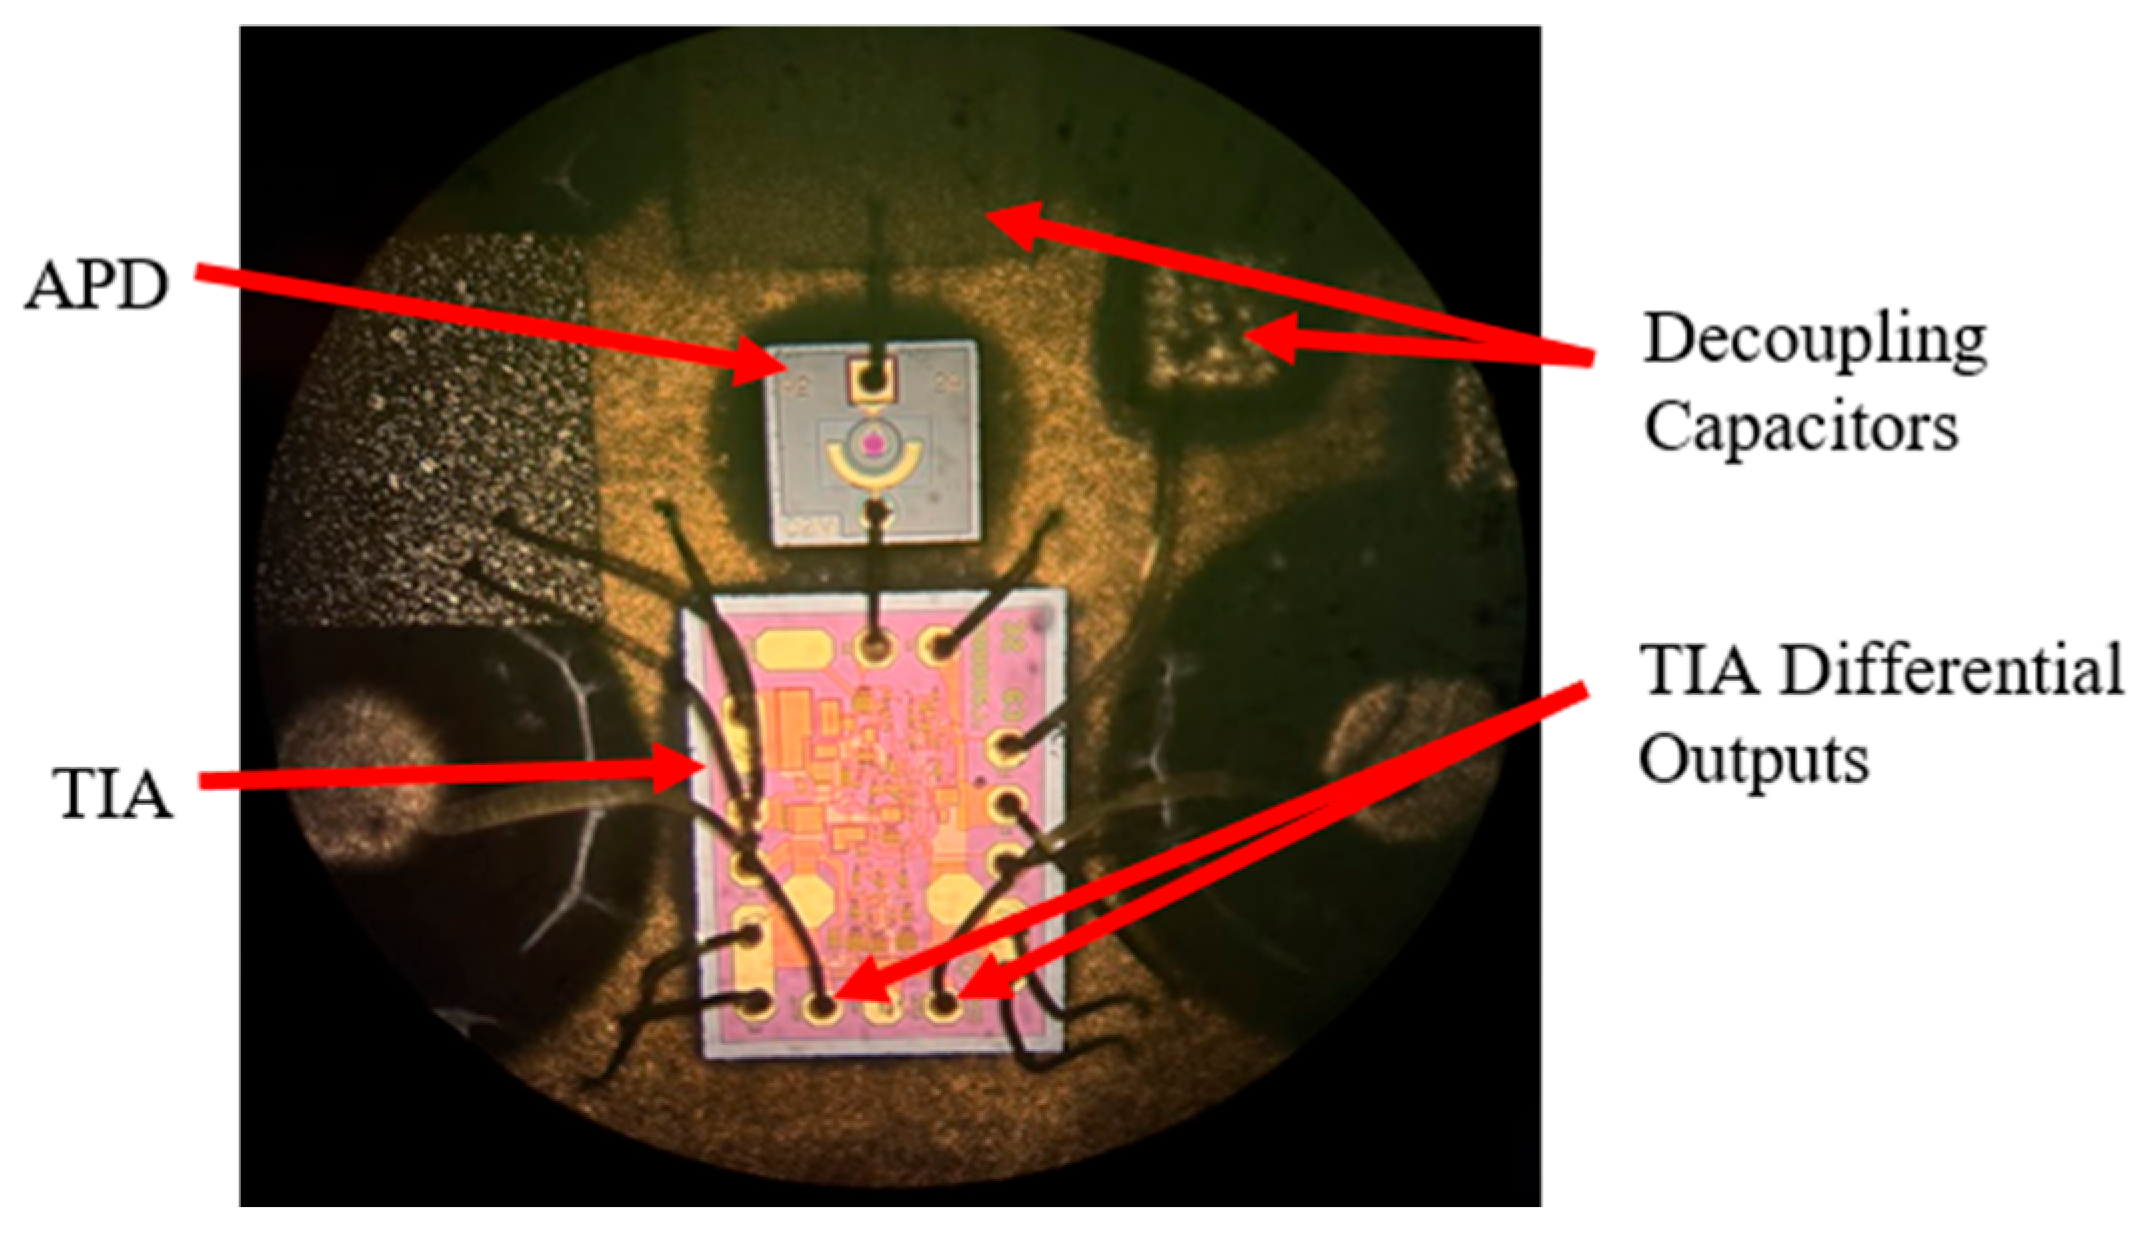
Prior to APD-TIA integration, the dark-current versus reverse-bias characteristics of ten APDs (in bare-die form) were measured using a source measure unit with the APD kept in the dark. From these, four AlGaAsSb APD dies (with a 50 µm active area diameter) were integrated with CGY2102UH/C2 TIA chips and mounted on transistor outline (TO-46) headers with five pins, yielding four completed optical receivers. An image of one of the completed receivers is shown in Figure 3. Wire bonding was used to connect the TIA chip with the APD die, additional capacitors, and the header’s pins. Two decoupling capacitors were placed between the power supply pins and the APD/TIA to ensure a stable voltage supply to the APD. The TIA’s differential outputs were connected to the bottom pins, while the ground connection was provided via the TO-can.
To characterize the receivers, the M, frequency response, and BER measurements were performed as functions of APD reverse bias. During testing, each receiver was mounted on a printed circuit board (PCB) with electrical connections to supply voltages to (+3.3 V dc for the TIA and variable for the APD) and take electrical voltage signals from the receiver. All measurements were carried out without temperature control, and the ambient temperature was between 20 and 25 °C. The TO headers were produced with flat windows, suitable for free-space coupling via an objective lens (positioned using a motorized three-axis translation stage). Optical powers incident on the receiver were adjusted using a variable optical attenuator. M(V) characteristics were estimated from experimental APD photocurrent versus reverse-bias characteristics with the receiver under 1550 nm laser illumination. The photocurrent was taken as the difference between the APD’s current under dark and illuminated conditions.
A network analyzer (Keysight Technologies Inc., Santa Rosa, CA, USA) was used to drive a 50 GHz-capable O-band ModBox from Exail to generate a 1310 nm modulated optical signal going to the receiver. The electrical signal from one of the receiver’s differential outputs was then fed back into the network analyzer. Frequency response measurements were conducted at −40 dBm, similar to the optical conditions used in the BER measurements. System losses (such as from the RF cables) were deducted from the raw data, while the calibrated data were normalized against the power at the lowest frequency.
In the BER measurements, a BER tester (Optellent, Santa Rosa, CA, USA) provided an optical PRBS 23-bit sequence at a 1550 nm wavelength, an extinction ratio of 12 dB, and a 2.5 Gb/s data rate to the receiver. The receiver’s electrical differential outputs (from the TIA) were fed to an Analog Devices, Wilmington, MA, USA limiting amplifier before being fed to the electrical input port of the BER tester. The BER was measured as a function of the APD reverse bias for a given optical power and receiver. The reverse bias producing the lowest BER was identified as the optimal APD reverse bias. The optimal voltage condition was then used to obtain the BER versus optical power characteristics.

3.2. Experimental Results of Receivers with AlGaAsSb APDs

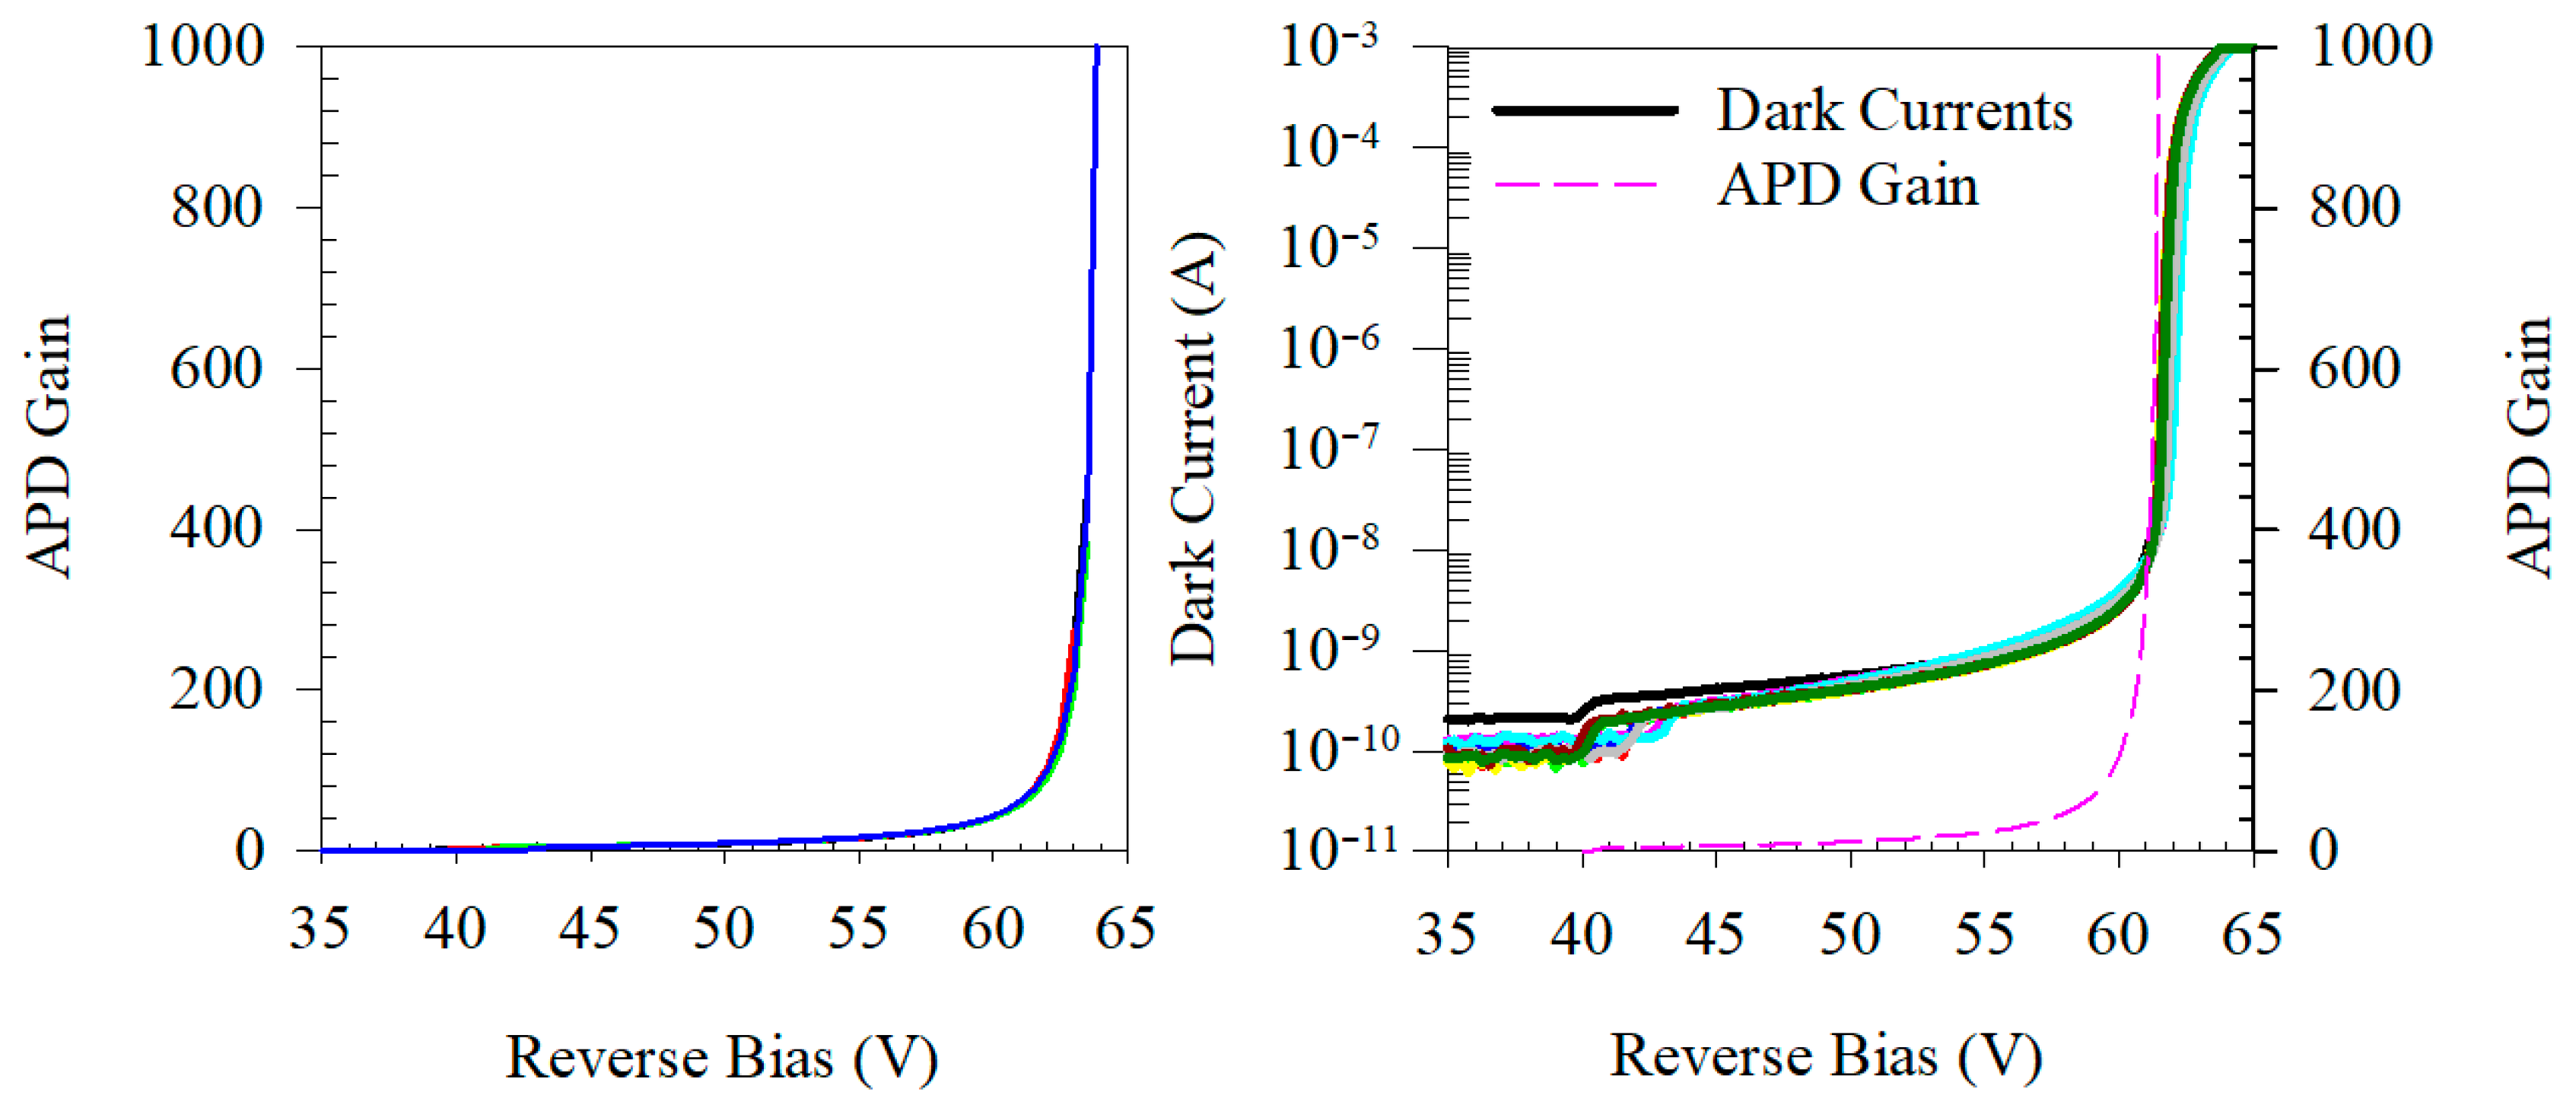
The dark-current versus reverse-bias characteristics from the 10 APD dies were indistinguishable before integration, as shown in Figure 4 (right). The avalanche breakdown voltage was ~64 V (defined by a dark current of 100 μA). The M(V) characteristic of an APD die prior to APD-TIA integration was also included in Figure 4 (right), with M reaching 1000 at 61.5 V. The M(V) characteristics of the APDs after APD-TIA integration, as shown in Figure 4 (left), also exhibit the same breakdown behavior at a given optical power. Post-integration, the APDs still reached gains of 1000, but at 63.8 V. The M(V) characteristics of the four receivers in Figure 4 (left) were highly similar.
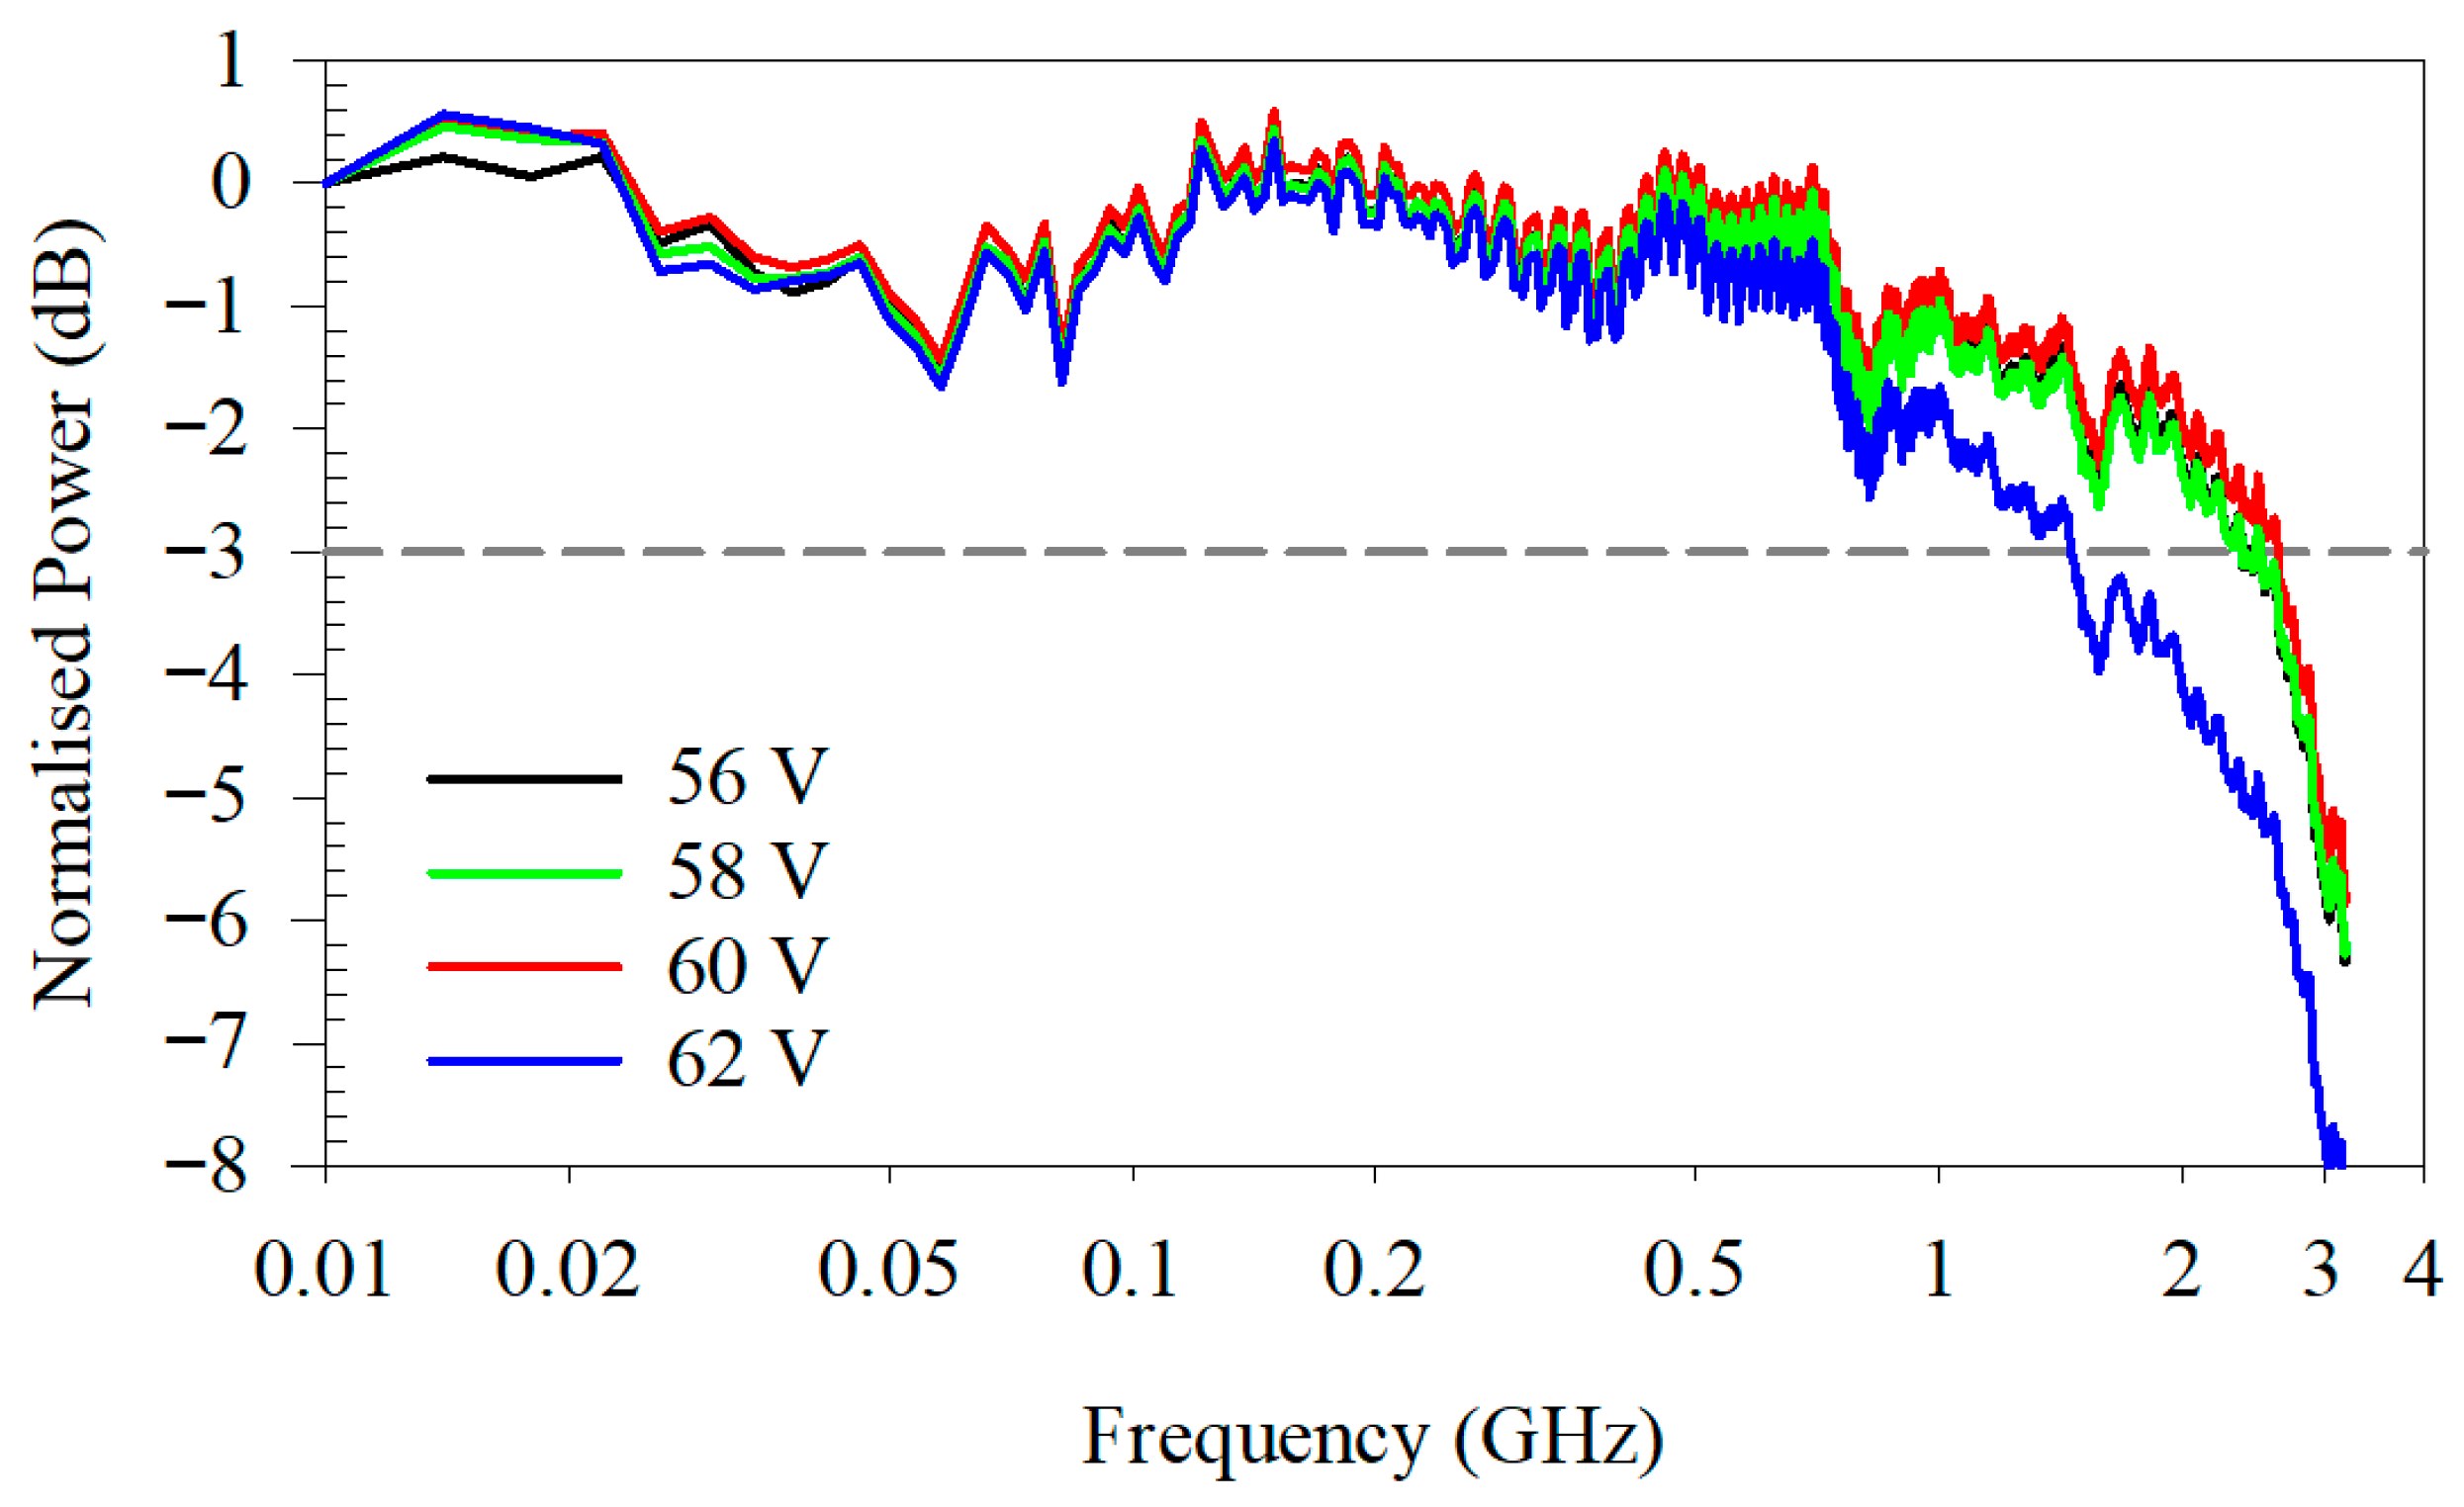
For clarity, we show the frequency response from one of the four receivers in Figure 5. The APD was reverse-biased from 56 to 62 V. No degradation in the −3 dB bandwidth was observed until the significant drop from 60 to 62 V (corresponding to M = 42 and 99, respectively). Measurements from all four receivers yielded a −3 dB bandwidth of 2.0–2.6 at 60 V and 1.3–1.5 GHz at 62 V, respectively. All receivers, therefore, had a sufficient bandwidth for 2.5 Gb/s operation.
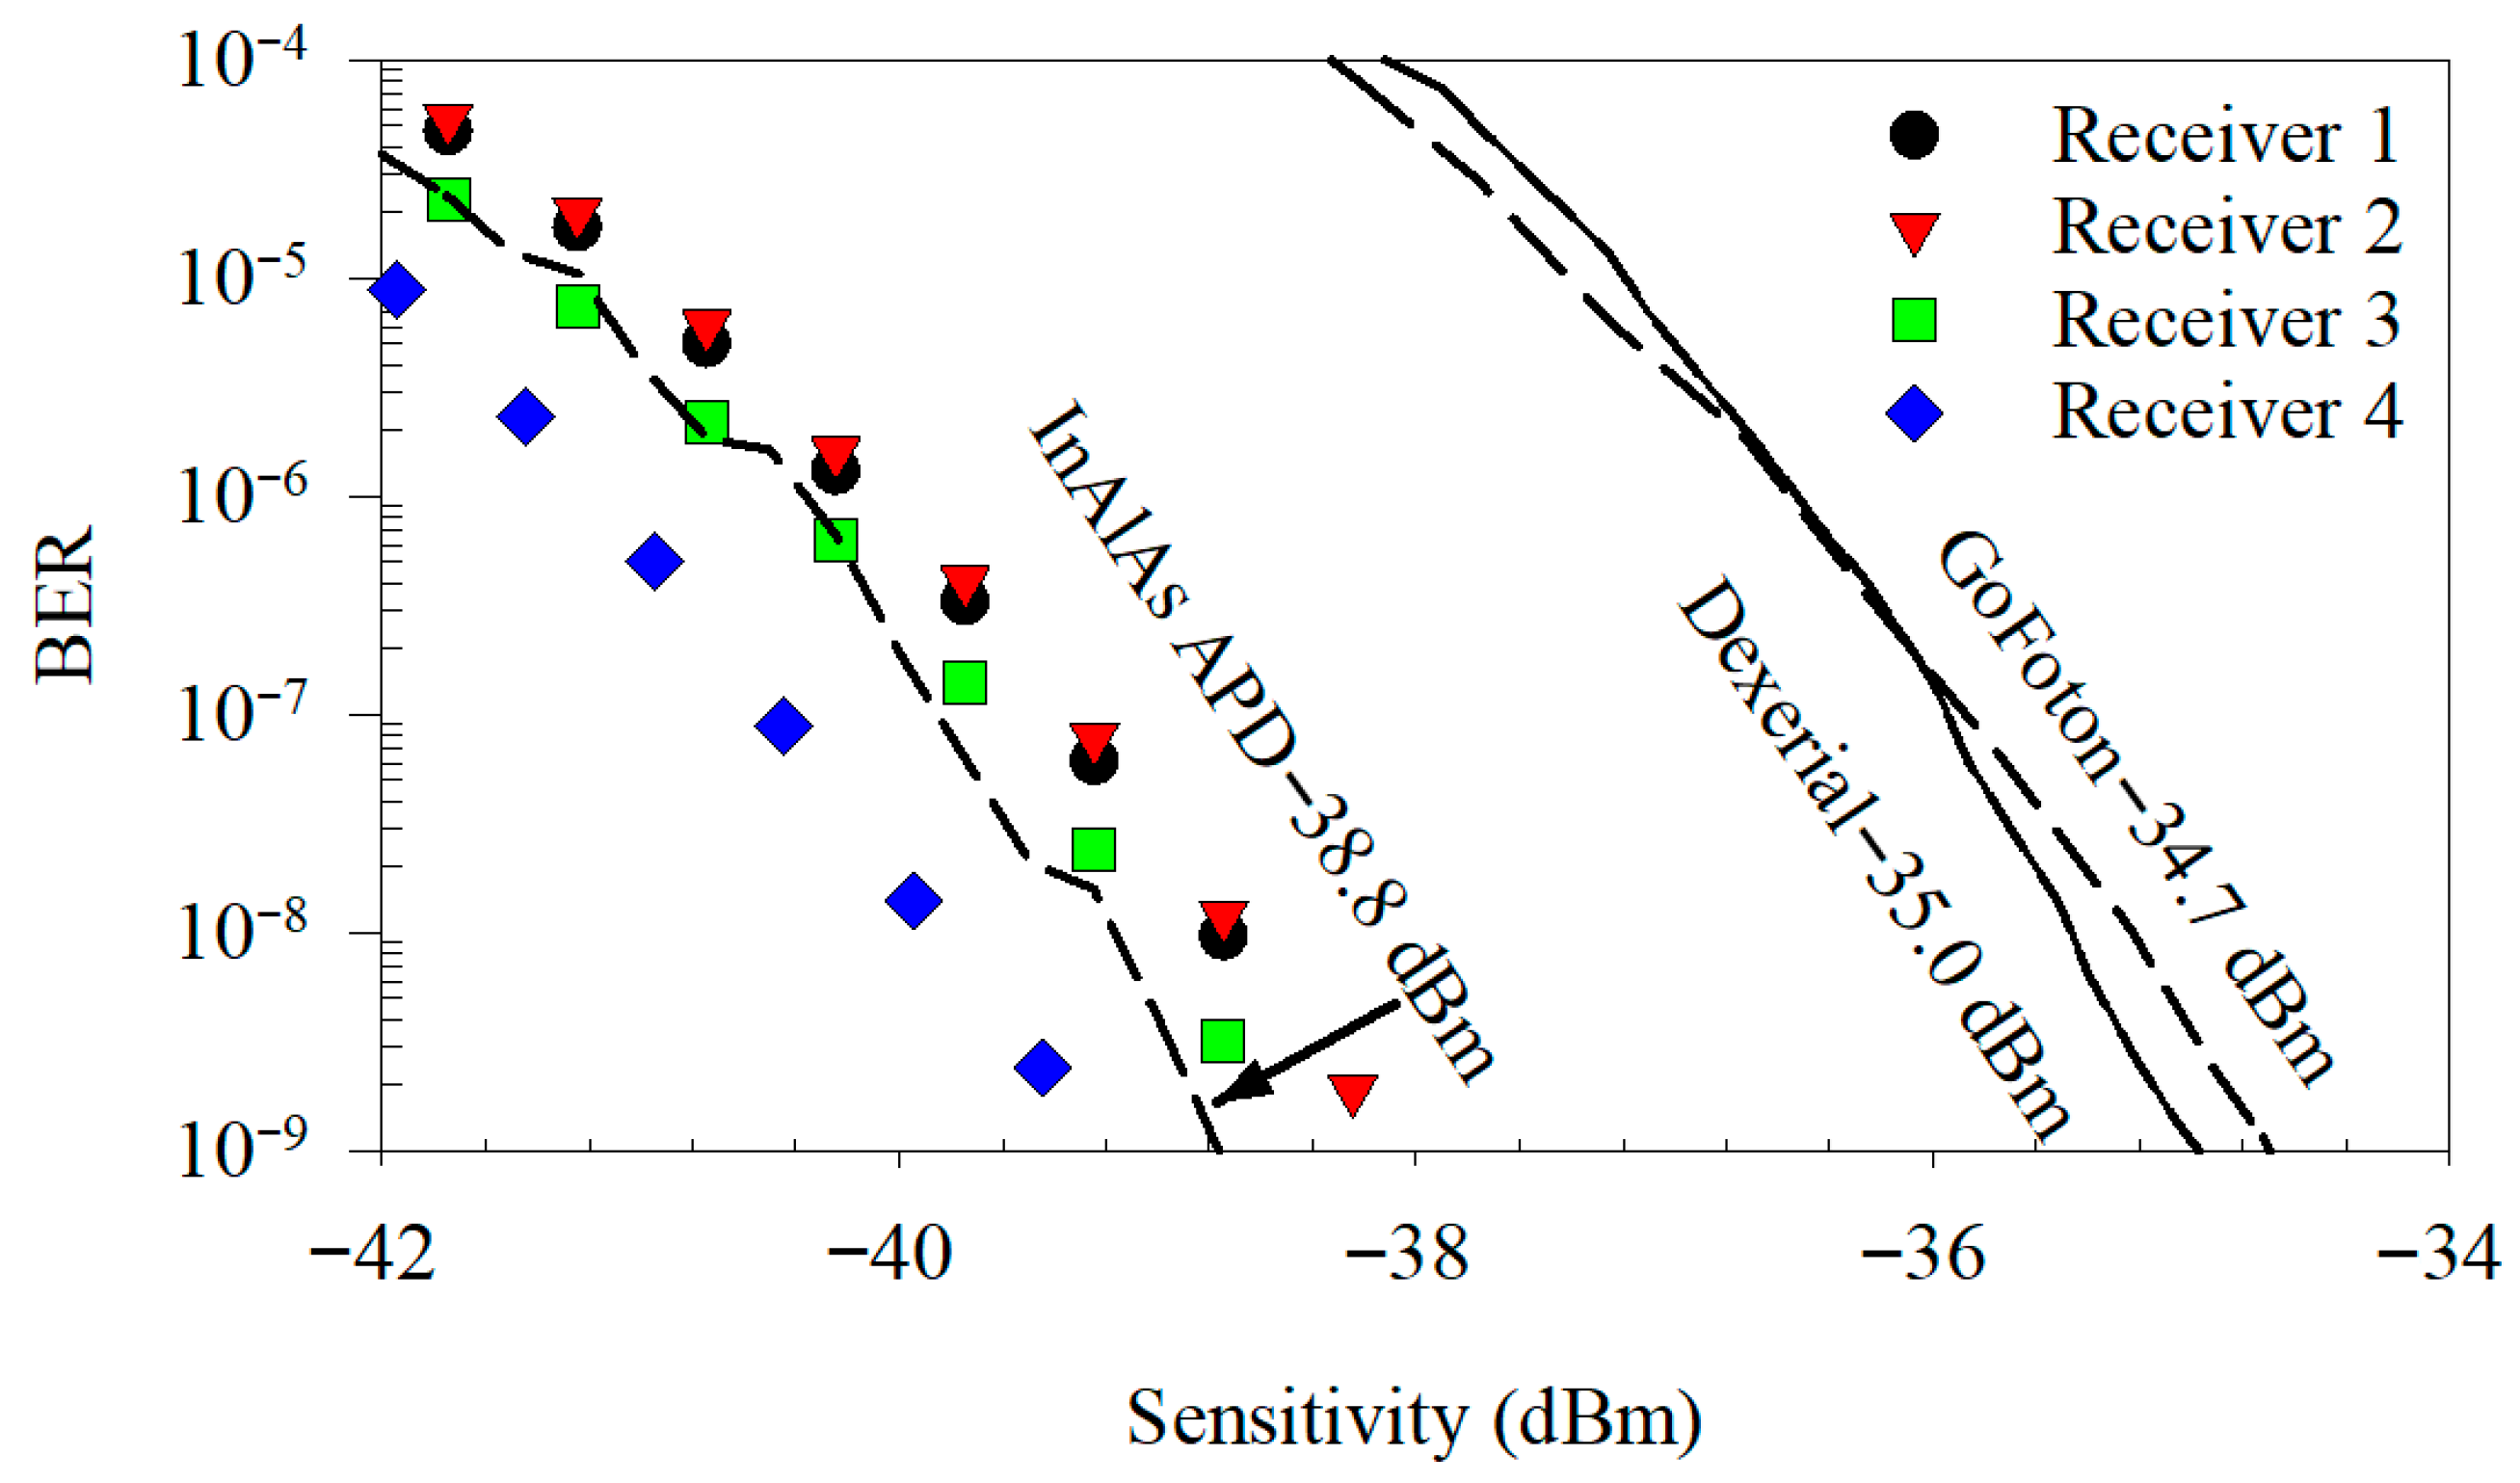
For a fixed optical power, the optimal APD reverse bias producing the lowest BER ranged from 60.2 to 60.8 V. Using the M(V) data at −40 dBm, the optimal gain was, therefore, estimated to be 56.1 ± 1.8, in good agreement with the predicted gain in Table 5. The 2.5 Gb/s BER versus optical power data at a 1550 nm wavelength for each APD operating at its optimum reverse bias are shown in Figure 6. At BER = 10−9, the mean sensitivity (of the four receivers) was −38.5 ± 0.5 dBm. Receiver 4 achieved a sensitivity of −39.2 dBm, the best out of the tested receivers, and 0.4 dB better than that of the receiver using an InAlAs APD, and at least 3.4 dB better than that of the commercial receivers with InP APDs.

4. Discussion

The receivers’ bandwidth of 2.0–2.6 GHz at 60 V (with M = 42) was lower than the TIA bandwidth of 2.8 GHz, suggesting signal losses from the APD dies (e.g., series resistance) and/or the APD-TIA integration (e.g., parasitic circuit elements). Since there was no APD bandwidth degradation until 60 V, the APD bandwidth can be assumed to be resistance–capacitance limited up to 60 V. With an APD capacitance of 0.27 pF (measured on-chip), the measured 2–2.6 GHz bandwidth indicates a series resistance of ~230–300 Ω. The series resistance may be reduced by optimizing doping in the APD’s contact layer, surface preparation, and metal contacts. Parasitic circuit elements can be minimized by reducing the APD’s chip size (without reducing the APD’s active area) and reducing the length of the bond wires.
Despite the less-than-optimum bandwidth, the sensitivity of the AlGaAsSb APD receivers outperforms those of commercial receivers (e.g., with Dexerials’s at −35.0 dBm [9] and GoFoton’s at −34.7 dBm [10]) by at least 3.5 dB (relative to the average receiver performance) or at least 4.2 dB (relative to the best receiver). Furthermore, the optimal gain of 56.1 ± 1.8 was considerably larger than that of other APDs, such as [11] (M = 23). This confirms the advantage of using low-noise AlGaAsSb APDs in optical receivers, supporting the link between low excess noise, high gain operation, and achieving high sensitivities.
The average sensitivity of our receivers was −38.5 dBm, close to the −38.8 dBm achieved in [11], which used an InAlAs APD and the PHY1097-03 TIA chip. Despite our model (Figure 2) suggesting that AlGaAsSb APDs will outperform InAlAs APDs, our experimental data indicate that the two APDs have highly similar performance. The discrepancy between the observation from our simulation results and the experimental evaluation may have arisen from two differences between this work and [11]: (i) the APD’s responsivity (0.95 cf. 1.025 A/W) and (ii) the TIA’s noise current (207 cf. 150 nA). In addition, the BER of the InAlAs APD in [11] was measured using PRBS-7 (a less stringent test condition) compared with PRBS-23 in this work.
To assess the overall effect of these differences on the receiver’s sensitivity, we simulated sensitivity versus gain characteristics for the APD-TIA combination used in [11]. The results are included in Figure 2, which shows that when the InAlAs APD-based receiver operates at its optimum gain of 21, the predicted sensitivity is −40.3 dBm, ~1.5 dBm better than the reported experimental value (−38.8 dBm). The difference may be attributed to experimental uncertainty and a non-ideal extinction ratio. Hence, the receiver in [11] was likely already operated with optimized conditions. Meanwhile, our analyses show that the performance of AlGaAsSb APDs in optical receivers can be improved by increasing the APD’s responsivity and bandwidth, as well as switching to a TIA chip with a lower noise current. Switching to different TIA chips could improve the performance of the receiver. For example, PHY1097-03 has a layout conducive to shorter bond wires, a lower TIA current noise, and a smaller bandwidth. Based on Table 5, switching the TIA from CGY2102UH/C2 to PHY1097-03 could improve the sensitivity by 1.6 dBm.
Our simulation results for receivers with AlGaAsSb APDs are better than the experimental results in Figure 6. For example, at BER = 10−9, the simulated and experimental sensitivities at 60.8 V (M = 55.6) are −42.2 and −38.5 dBm, respectively. This 3.7 dB discrepancy may be due to a combination of factors, including the following:
  • The model assumes an ideal, infinitely large ER, leading to over-optimistic sensitivity values. Using ER = 12 dB (our experimental value), the predicted optimum sensitivity worsens by ~0.5 dB to −41.7 dBm.
  • The transmitted optical signal also has an associated intensity noise. From [22], the sensitivity penalty due to intensity noise, ΔPI, can be approximated using
    P I = 10 l o g 1 r I 2 Q 2
    where rI is the noise level of the optical signal. The maximum relative intensity noise of our transmitter was −128 dB/Hz, corresponding to an rI value of 3.96 × 10⁻⁴ and ΔPI = 0.14 dB. Hence, the optical intensity noise resulted in a minor loss of sensitivity.
3.
The model does not include dead-space effects (known to increase an APD’s impulse response [29] and worsen an APD’s bandwidth). It also does not include the avalanche duration fluctuation. Hence, the single bandwidth Brec in Equation (4) is likely to overestimate the APD’s performance [8].
4.
The model assumes a Gaussian distribution for the amplitude fluctuation of the receiver’s voltage output. This is likely to underestimate the noise contributed by the avalanche gain distribution, which is non-Gaussian [30] and skewed heavily toward gains that are below the mean gain.
5.
The TIA layout necessitated relatively long bond wires between the TIA outputs and the TO-header pins, contributing to parasitic components.
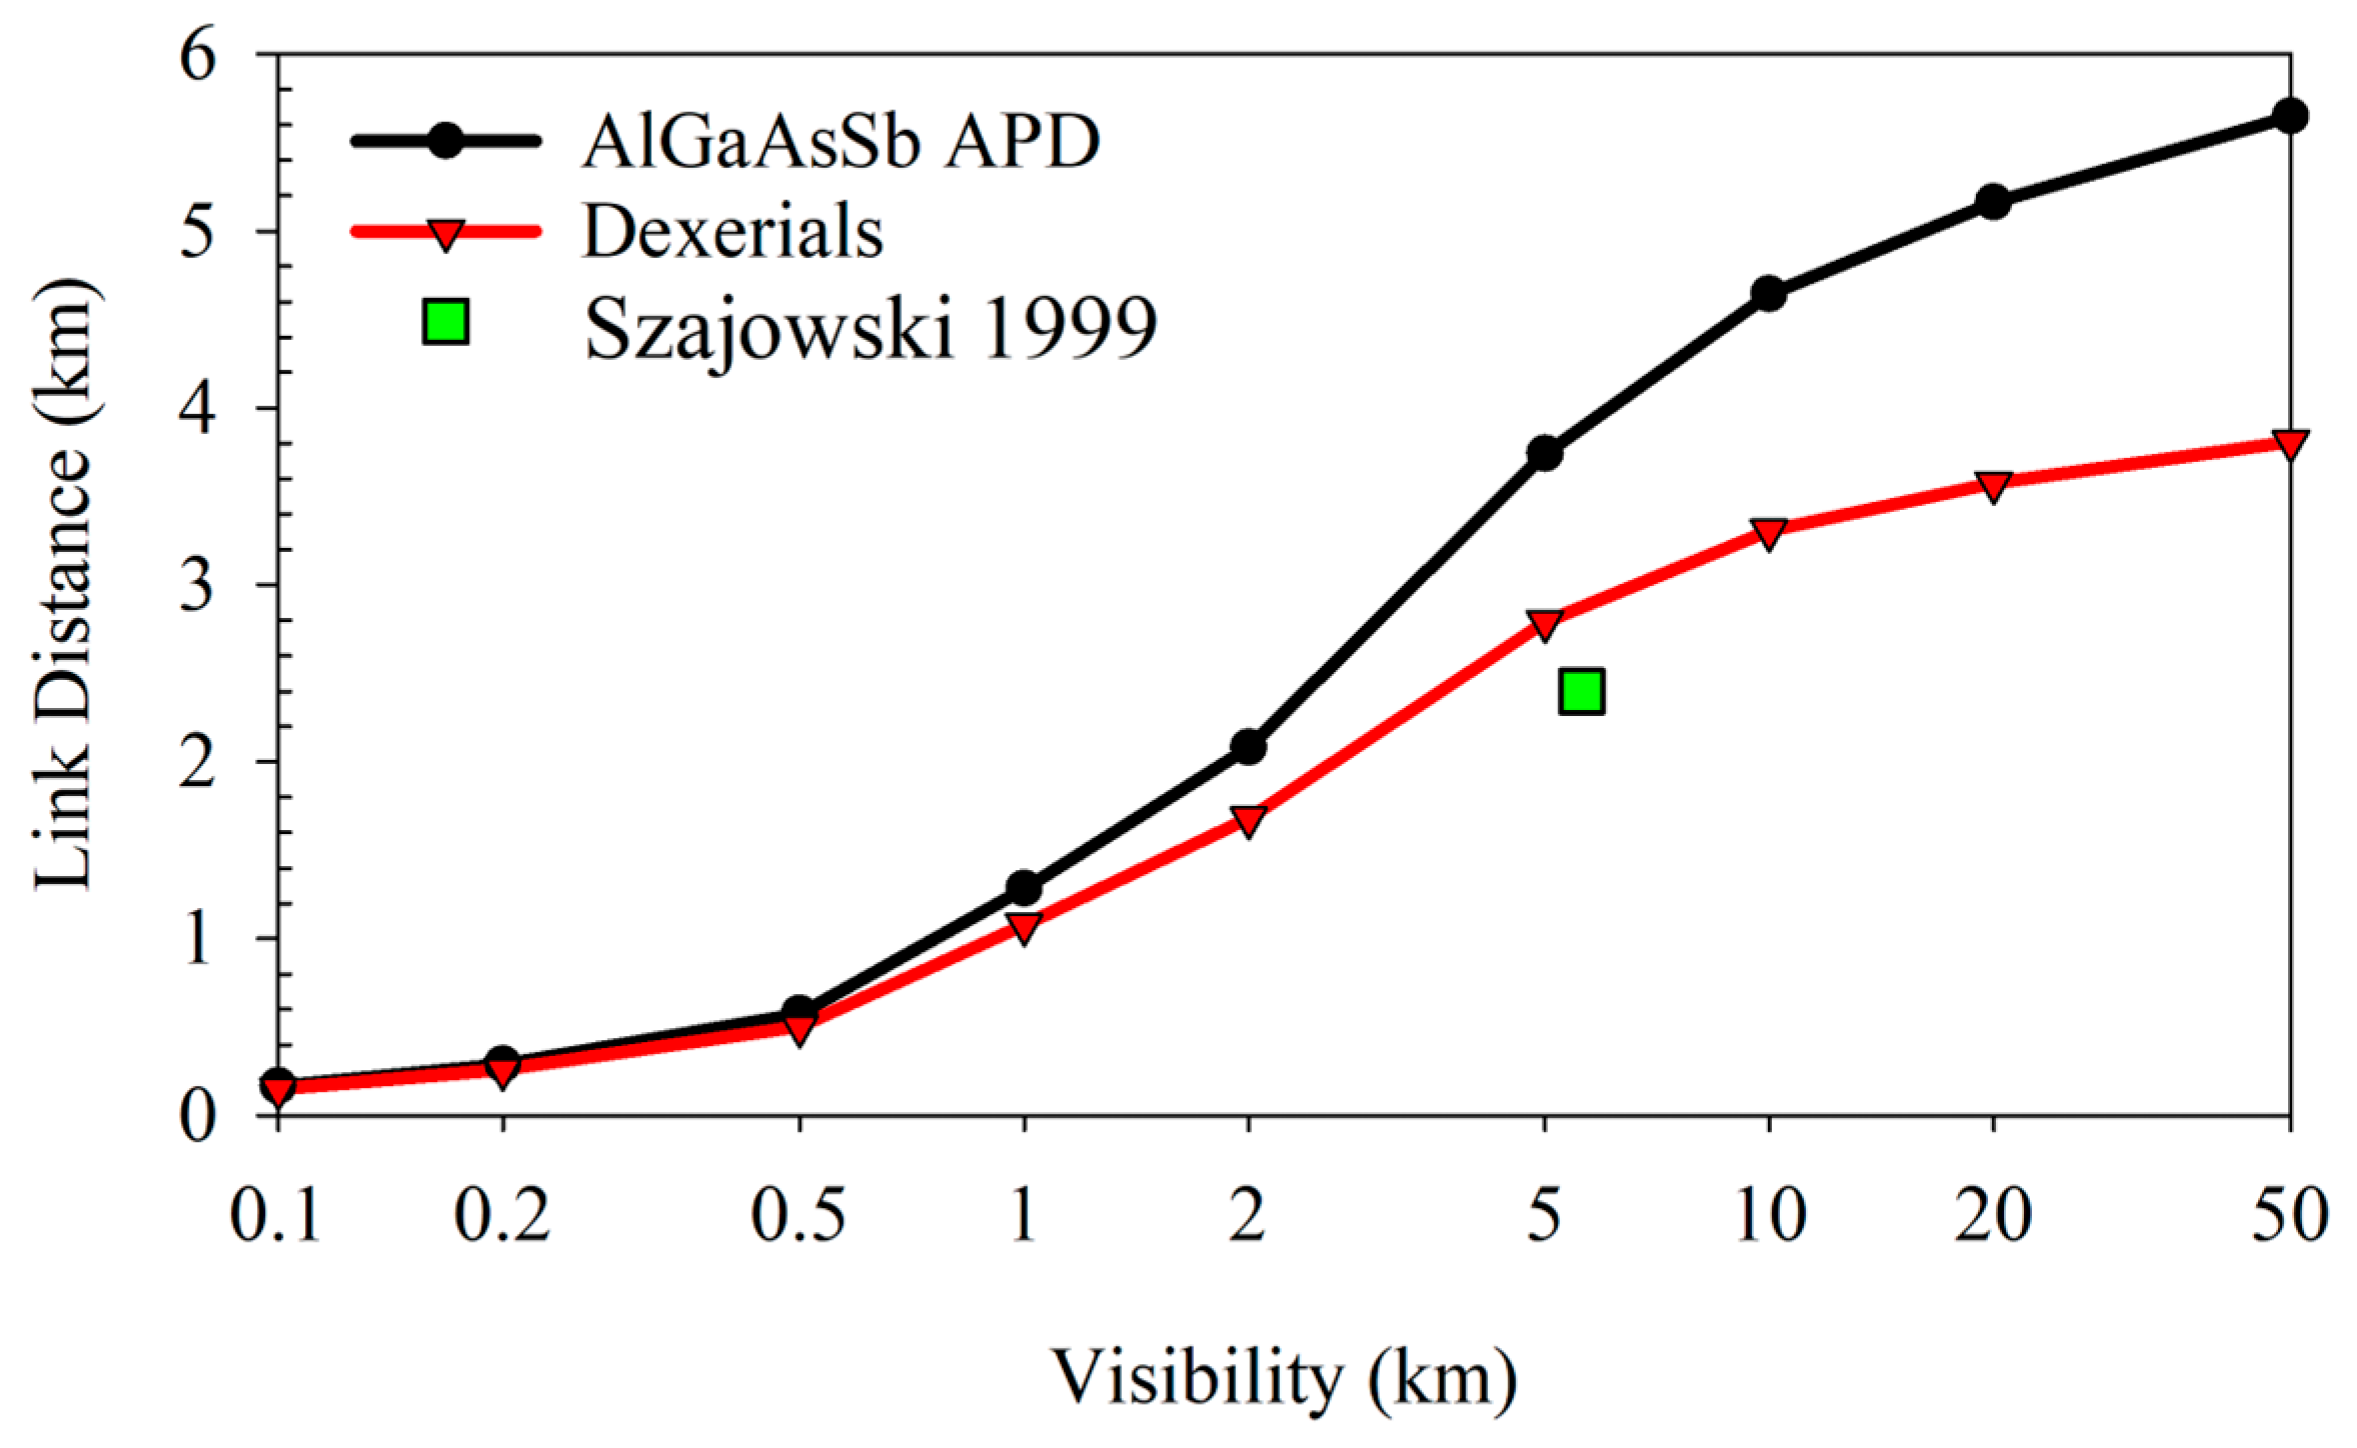
Next, we evaluate the potential of using the receivers with AlGaAsSb APDs for FSOC. In [7], a 2.4 km optical link utilized a receiver with a sensitivity of −21 dBm at a BER of 10−9. The significantly better sensitivity of the AlGaAsSb APD suggests that a much longer optical link could be achieved. To evaluate this, we simulated the optical power at the receiver, Pmean, from the atmospheric link model with parameters in Table 4 (Section 2.3). It should be noted that the link distances predicted with this model are optimistic, as over longer distances, the pointing error will increase. Other factors, such as scintillation from atmospheric turbulence, will also contribute to the noise but were not included.
Assuming a transmitter with an optical power of 10 dBm, the Pmean value was compared with the receiver sensitivities to estimate the achievable link distances under a range of metrological conditions (or visibilities). Figure 7 compares the link distances at BER = 10−9 for our AlGaAsSb receiver (−38.5 dBm) and the Dexerials receiver (−35.0 dBm) [9]. In conditions with visibility of <1 km (i.e., severe weather conditions, such as fog), the link distances are similar (difference < 0.2 km). As visibility increases beyond 1 km, the advantage of the AlGaAsSb APD becomes more pronounced. At visibilities of 5 (light haze) and 50 km (clear skies), the AlGaAsSb APD can achieve link distances of 3.7 and 5.6 km, respectively. These represent significant improvements of 34% and 47% over the Dexerials APD. For reference, values from [7] (a visibility of 5.6 km and a link distance of 2.4 km) are also shown in Figure 7.
FSOC links between satellites or high-altitude platforms generally have better visibility conditions than FSOC links at lower altitudes due to Mie scattering from larger particles (which are generally the main limitation to visibility) being primarily limited to the troposphere (<20 km). Hence, the link distance benefits of using an AlGaAsSb APD are expected to be even more pronounced on these higher-altitude platforms.

5. Conclusions

We presented the simulation and experimental results of high-sensitivity receivers using AlGaAsSb APDs. BER simulations of receivers comparing AlGaAsSb APD and InP APD confirmed that the AlGaAsSb APD operated at relatively high avalanche gains, resulting in better receiver sensitivity. At 2.5 Gb/s and BER = 10−9, the predicted sensitivity for AlGaAsSb APD was −42.2 to −43.8 dBm (assuming an ideal extinction ratio for the optical signals), representing a 5.6 dB improvement over the InP APD.
Experimental evaluation of four optical receivers, each containing an InGaAs/AlGaAsSb APD chip and a TIA chip, yielded a mean sensitivity of 38.5 ± 0.5 dBm (with the best sensitivity at −39.2 dBm) at 2.5 Gb/s and BER = 10−9. These values are at least 3.5 (in the best case, 4.2) dB better than those of typical commercial receivers. The optimal APD bias and gain were 60.2–60.8 V and 56.1 ± 1.8. The APD bandwidths were 2.0–2.6 GHz at 60 V, confirming their suitability for 2.5 Gb/s operation. Discrepancy between the experimental and predicted values for the receiver’s sensitivity may be reduced through the following: increasing the optical signal’s extinction ratio; increasing the APD’s responsivity; reducing the APD’s series resistance; and using TIAs with lower noise, as well as a more optimized layout.
Using our receiver’s data, we predict that the AlGaAsSb APD increases the maximum FSO link distances by 34% and 47% for visibilities of 5 km and 50 km, respectively, compared with a highly competitive InP APD. Our results quantify the significant performance improvement offered by InGaAs/AlGaAsSb APDs to long-range free-space optical communication links.

Author Contributions

Investigation, J.V. and D.C.; data curation, J.V.; visualization, J.V. and D.C.; methodology, J.V.; supervision, C.H.T.; writing—original draft, J.V.; writing—review and editing, J.P., J.S.N. and C.H.T. All authors have read and agreed to the published version of the manuscript.

Funding

This work was supported by the European Space Agency under contract no. 4000143382/23/UK/AL (ARTES 4.0 Strategic Programme Line—Optical Communication Scylight).

Institutional Review Board Statement

Not applicable.

Informed Consent Statement

Not applicable.

Data Availability Statement

The original data presented in this study are openly available in the University of Sheffield ORDA database at 10.15131/shef.data.30354250.

Acknowledgments

The APD dies for this work were procured from Phlux Technology Ltd., UK. APD-TIA integration was carried out by Aquarius Test Engineering, UK.

Conflicts of Interest

The authors declare no conflicts of interest.

Abbreviations

The following abbreviations were used in this manuscript:
AlGaAsSbAluminum Gallium Arsenide Antimony
APDAvalanche Photodiode
BERBit Error Rate
EPPLEuropean Preferred Parts List
ERExtinction Ratio
FSO(C)Free-Space Optics (Communication)
InAl(Ga)AsIndium Aluminum (Gallium) Arsenide
InPIndium Phosphide
ISIIntersymbol Interference
PCBPrinted Circuit Board
PRBS-(n)Pseudorandom Binary Sequence (2n − 1-bit length)
TIATransimpedance Amplifier
TOTransistor Outline

References

  1. Rao, S.; Digge, J.; Rindhe, B.U. Free Space Optics for 5G and Beyond. In Proceedings of the 2021 6th International Conference for Convergence in Technology (I2CT), Maharashtra, India, 2–4 April 2021; pp. 1–5. [Google Scholar] [CrossRef]
  2. Rockwell, D.; Mercherle, G.S. Wavelength Selection for Optical Wireless Communication Systems. Proc. SPIE 2001, 4530, 27–35. [Google Scholar] [CrossRef]
  3. Alimi, I.A.; Monteiro, P.P. Revolutionizing Free-Space Optics: A Survey of Enabling Technologies, Challenges, Trends, and Prospects of Beyond 5G Free-Space Optical (FSO) Communication Systems. Sensors 2024, 24, 8036. [Google Scholar] [CrossRef] [PubMed]
  4. Rabinovich, W.S.; Moore, C.I.; Mahon, R.; Goetz, P.G.; Burris, H.R.; Ferraro, M.S.; Murphy, J.L.; Thomas, L.M.; Gilbreath, G.C.; Vilcheck, M.; et al. Free-Space Optical Communications Research and Demonstrations at the US Naval Research Laboratory. Appl. Opt. 2015, 54, F189. [Google Scholar] [CrossRef] [PubMed]
  5. Li, B.; Guo, M.; Wang, Y.; Lu, Z.; Xu, D.; Yao, Y.; Zhang, H.; Liu, B. Long-Range Free-Space Inter-Island Optical Communications in Offshore Surface Environment. Opt. Eng. 2025, 64, 058107. [Google Scholar] [CrossRef]
  6. Shafi, F.; Kumar, A.; Nakkeeran, R. 2024 Performance Analysis of Free Space Optical Networks Under External Limiting Factors. Results Opt. 2004, 14, 100615. [Google Scholar] [CrossRef]
  7. Szajowski, P.F.; Nykolak, G.; Auborn, J.J.; Presby, H.M.; Tourgee, G.E.; Korevaar, E.J.; Schuster, J.J.; Kim, I.I. 2.4 km Free-Space Optical Communication 1550 nm Transmission Link Operating at 2.5 Gb/s—Experimental Results. In Proceedings of the Optical Wireless Communicationss, Boston, MA, USA, 27 January 1999; Volume 3532. [Google Scholar] [CrossRef]
  8. Ong, D.S.; Ng, J.S.; Hayat, M.M.; Sun, P.; David, J.P.R. Optimization of InP APDs for High-Speed Lightwave Systems. J. Lightw. Technol. 2009, 27, 3294–3302. [Google Scholar] [CrossRef]
  9. Dexerials InGaAs APD-TIA Receivers KPDXA2GK-H33. Available online: https://www.dexerials.jp/asset/optical_semiconductor/products/kpdxa2gk-h33/kpdxa2gk-h33_en.pdf (accessed on 10 October 2025).
  10. GoFoton InGaAs Avalanche Photodiode (APD) 2.5 Gbps APD with TIA. Available online: http://gofoton.cn/products/optics/materials/apd_tia.html (accessed on 10 October 2025).
  11. Ferraro, M.S.; Singh, A.; Tern, Z.T.; Murphy, J.L.; Mahon, R.; Rabinovich, W.S.; Krejca, B.D. 2.5G large area avalanche photodiodes for free space optical communication. In Proceedings of the Free-Space Laser Comms, San Francisco, CA, USA, 30–31 January 2024; Volume XXXVII, p. 1335525. [Google Scholar] [CrossRef]
  12. Ge, H.; Liang, Y.; Wang, W.; Wang, Z.; Zhu, L.; Huang, J.; Wang, G.; Wu, D.; Xu, Y.; Niu, Z.; et al. Low Noise Low Dark Current AlAsSb/GaAsSb Digital Alloy Avalanche Photodiode. Opt. Express 2025, 33, 10591. [Google Scholar] [CrossRef] [PubMed]
  13. Guo, B.; Schwartz, M.; Kodati, S.H.; McNicholas, K.M.; Jung, H.; Lee, S.; Konowitch, J.; Chen, D.; Bai, J.; Guo, X.; et al. InGaAs/AlInAsSb avalanche photodiodes with low noise and strong temperature stability. APL Photon. 2023, 8, 116112. [Google Scholar] [CrossRef]
  14. Yi, X.; Xie, S.; Liang, B.; Lim, L.W.; Cheong, J.S.; Debnath, M.C.; Huffaker, D.L.; Tan, C.H.; David, J.P.R. Extremely low excess noise and high sensitivity AlAs0.56Sb0.44 avalanche photodiodes. Nat. Photon. 2019, 13, 683–686. [Google Scholar] [CrossRef]
  15. Taylor-Mew, J.D.; Petticrew, J.D.; Tan, C.H.; Ng, J.S. Simulation of Al0.85Ga0.15As0.56Sb0.44 avalanche photodiodes. Opt. Express. 2022, 30, 17946. [Google Scholar] [CrossRef] [PubMed]
  16. Lee, S.; Guo, B.; Kodati, S.H.; Jung, H.; Schwartz, M.; Jones, A.H.; Winslow, M.; Grein, C.H.; Ronningen, T.J.; Campbell, J.C.; et al. Random Alloy Thick AlGaAsSb Avalanche Photodiodes on InP Substrates. Appl. Phys. Lett. 2022, 120, 071101. [Google Scholar] [CrossRef]
  17. Jung, H.; Lee, S.; Jin, X.; Liu, Y.; Ronningen, T.J.; Grein, C.H.; David, J.P.R.; Krishna, S. Low Excess Noise and High Quantum Efficiency Avalanche Photodiodes for beyond 2 Μm Wavelength Detection. Commun Mater 2024, 5, 219. [Google Scholar] [CrossRef]
  18. Sheridan, B.; Xiao, C.; Taylor-Mew, J.D.; White, B.; Ng, J.S.; Tan, C.H. An Extremely Low Noise-Equivalent Power Photoreceiver Using High-Gain InGaAs/AlGaAsSb APDs. J. Lightw. Technol. 2024, 43, 741–746. [Google Scholar] [CrossRef]
  19. Hamamatsu InGaAs APD G8931 Series. Available online: https://www.hamamatsu.com/content/dam/hamamatsu-photonics/sites/documents/99_SALES_LIBRARY/ssd/g8931_series_kapd1018e.pdf (accessed on 10 October 2025).
  20. Xiang, W.; Zhang, S.; Chen, C.; Wu, J.; Ding, Y.; Wang, K. AlGaAsSb APDs for 1550nm Lidar with High Sensitivity and Reliability. In Proceedings of the 50th European Conference on Optical Communication, ECOC 2024, Frankfurt, Germany, 22–26 September 2024; pp. 1960–1963. [Google Scholar]
  21. ESA Specification for Terabit/Sec Optical Links (ESTOL). Available online: https://connectivity.esa.int/sites/default/files/2025-07/ESTOL_air_interface_v2.2.pdf (accessed on 10 October 2025).
  22. Agrawal, G.P. Fibre-Optic Communication Systems, 4th ed.; John Wiley & Sons: Hoboken, NJ, USA, 2010; pp. 162–165. ISBN 987-0-470-50511-3. [Google Scholar]
  23. Nada, M.; Yoshimatsu, T.; Nakajima, F.; Sano, K.; Matsuzaki, H. A 42-GHz Bandwidth Avalanche Photodiodes Based on III-V Compounds for 106-Gbit/s PAM4 Applications. J. Light. Technol. 2019, 37, 260–265. [Google Scholar] [CrossRef]
  24. HiLight Semiconductor Datasheet: HLR2G50. Available online: https://www.hilight-semi.com/wp-content/uploads/HLR2G50-WebBrief.pdf (accessed on 10 October 2025).
  25. Ommic Product Datasheet CGY2102UH/C2 2.5 Gb/s Transimpedance Amplifier. Available online: https://fregat.ru/upload/iblock/675/x59np4x81gnfa8d1csrix3sqcuvzjxpd.pdf (accessed on 10 October 2025).
  26. Phyworks PHY1097-03 2.5 Gbps High Sensitivity Transimpedance Amplifier. Available online: https://www.analog.com/media/en/technical-documentation/data-sheets/phy1097.pdf (accessed on 10 October 2025).
  27. Kim, I.I.; McArthur, B.; Korevaar, E.J. Comparison of laser beam propagation at 785 nm and 1550 nm in fog and haze for optical wireless communications. In Proceedings of the Optical Wireless Communications, Boston, MA, USA, 6 February 2001; Volume III. [Google Scholar] [CrossRef]
  28. World Meteorological Organization (WMO). Guide to Instruments and Methods of Observation, 2024th ed.; WMO: Geneva, Switzerland, 2025; p. 352. [Google Scholar] [CrossRef]
  29. Saleh, B.E.A.; Hayat, M.M.; Teich, M.C. Effect of Dead Space on the Excess Noise Factor and Time Response of Avalanche Photodiodes. IEEE Trans. Electron Devices 1990, 37, 1976–1984. [Google Scholar] [CrossRef]
  30. McIntyre, R.J. The distribution of gains in uniformly multiplying avalanche photodiodes: Theory. IEEE Trans. Electron Devices 1972, 19, 703–713. [Google Scholar] [CrossRef]
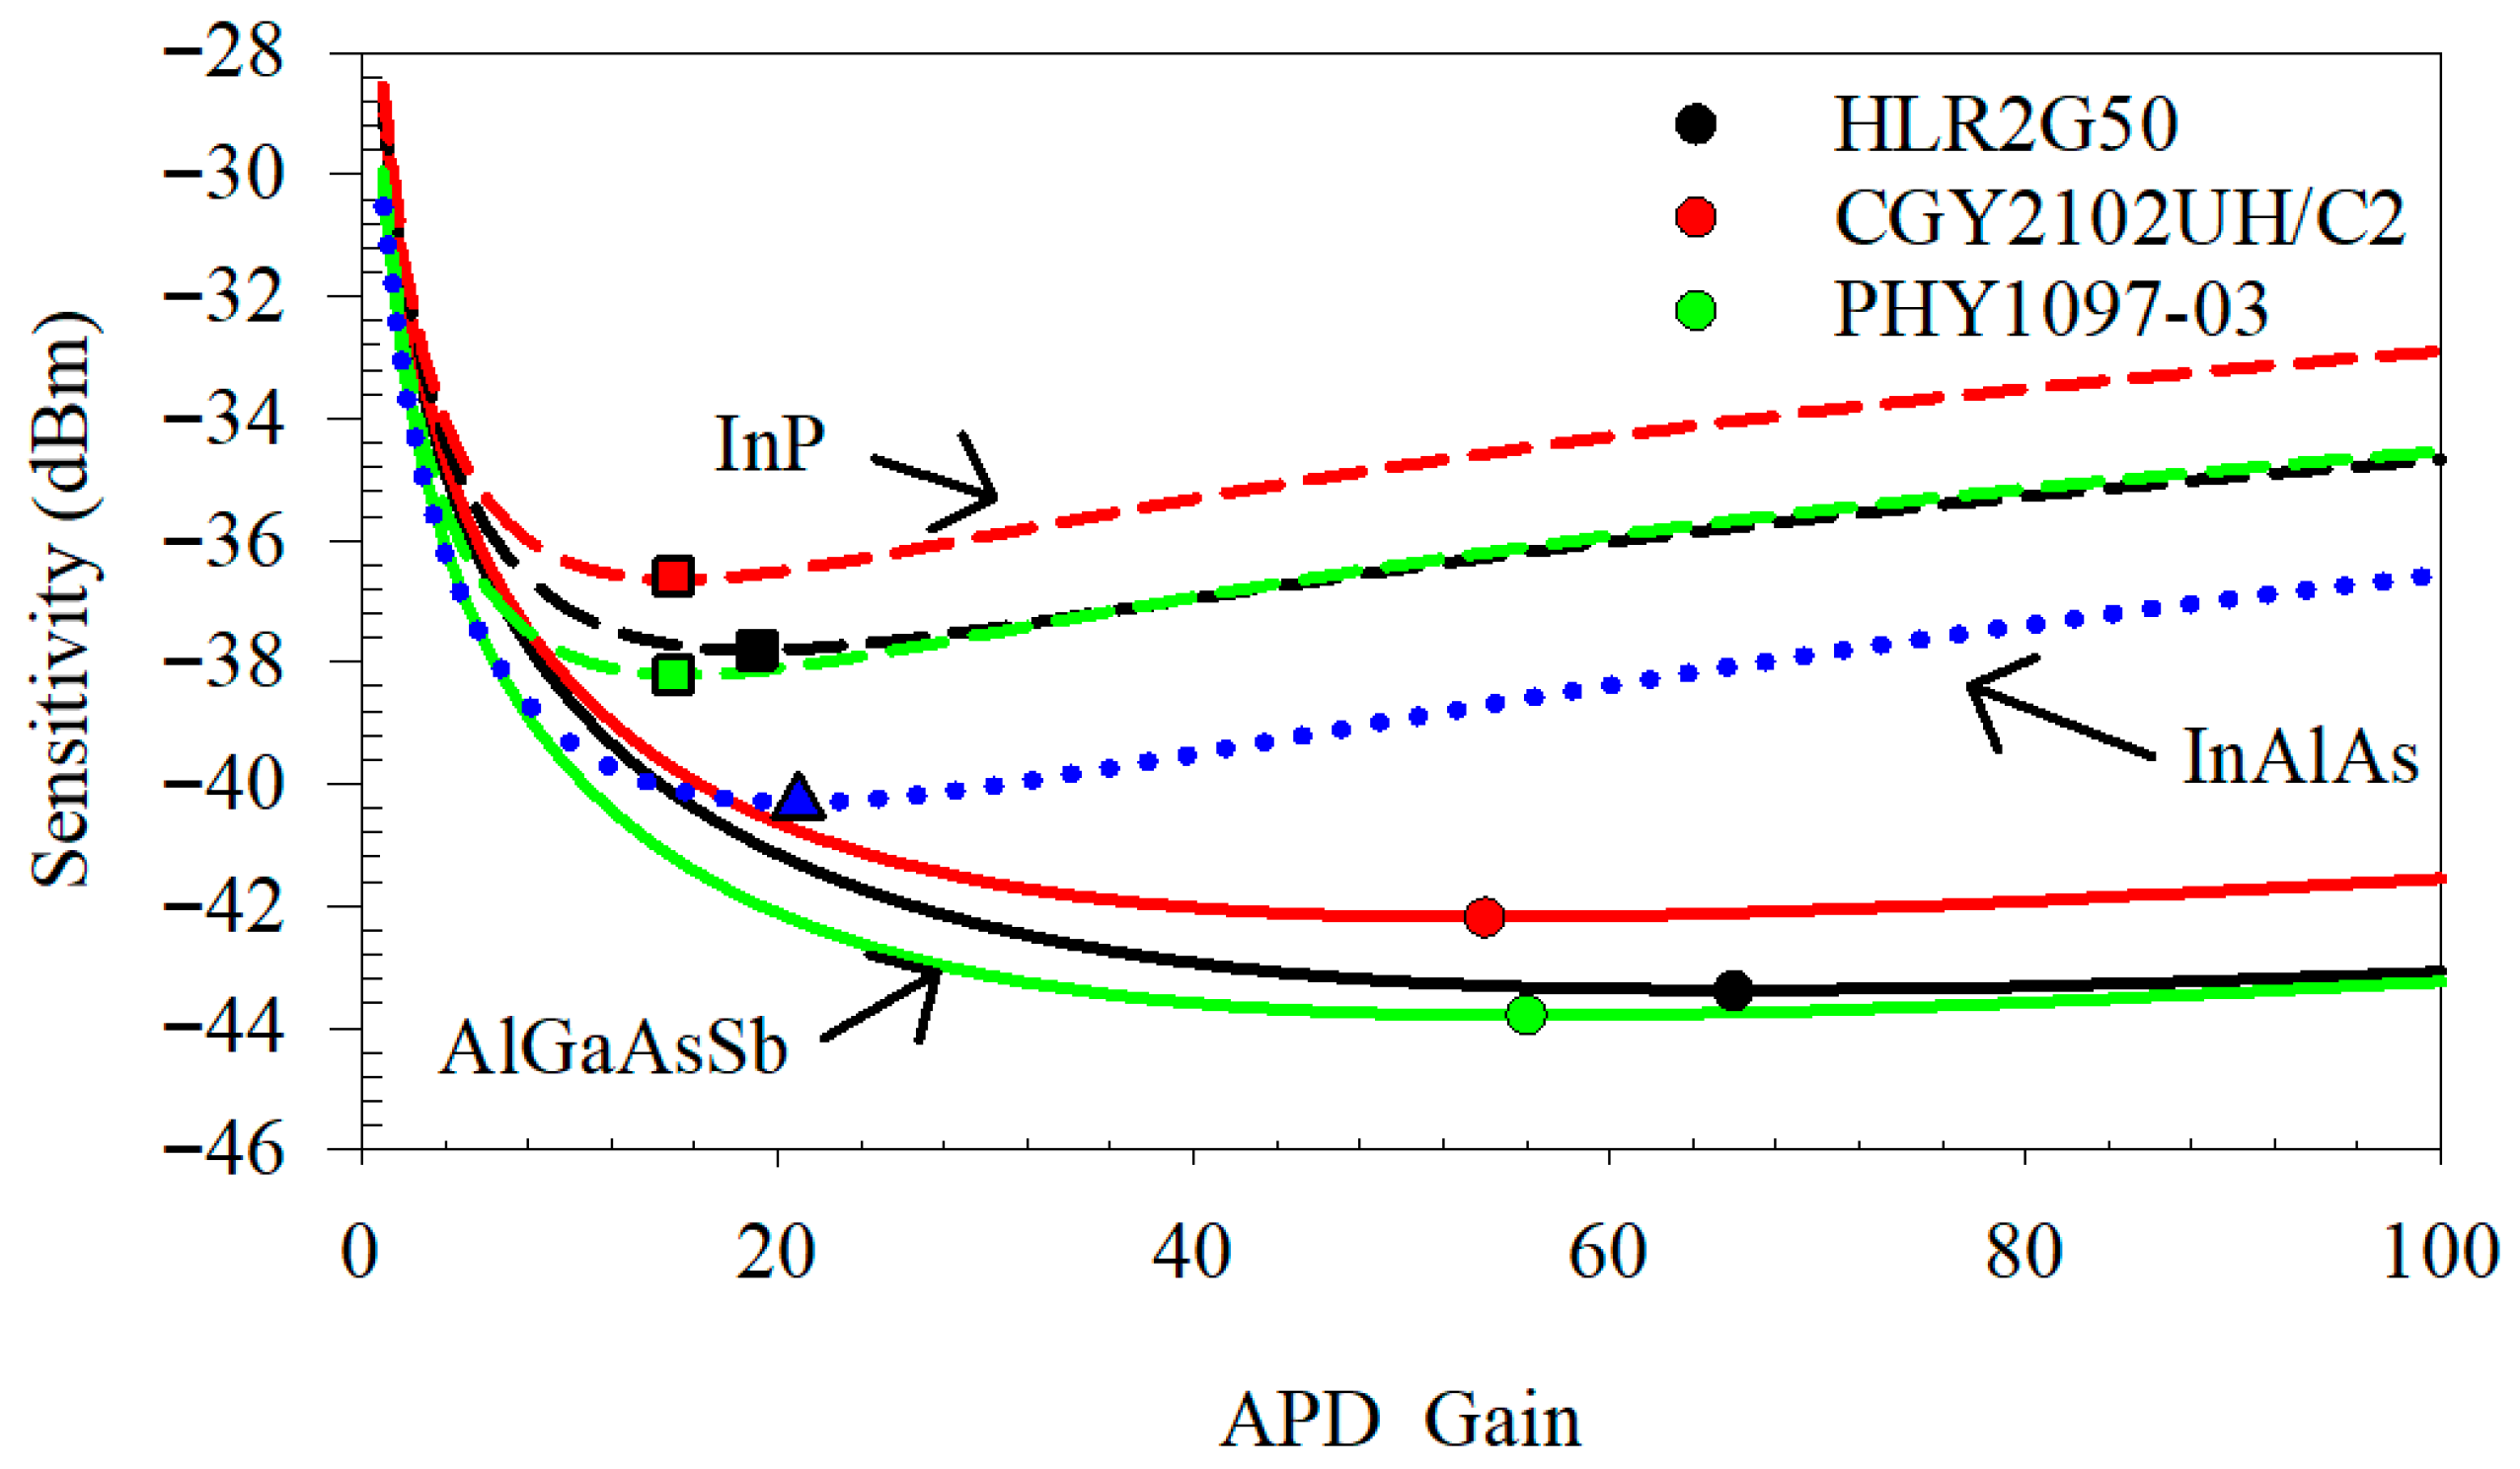
Figure 1. F(M) characteristics of the AlGaAsSb [18], InAlAs [11], and InP [19] APDs.
Applsci 15 12056 g001
Figure 2. Simulated sensitivity versus APD gain characteristics at BER = 10−9 for each APD-TIA combination listed in Table 5. Symbols mark the optimal gain and sensitivity (the typical values in Table 5) for the AlGaAsSb (solid lines), InP (dashed lines), and InAlAs (dotted line) APDs, respectively.
Applsci 15 12056 g002
Figure 3. An APD-TIA receiver on a TO-46 header using an AlGaAsSb APD.
Applsci 15 12056 g003
Figure 4. Experimental APD gain post-integration versus reverse bias characteristics (left) from four receivers at 1550 nm wavelength and −40 dBm optical power. Experimental dark-current versus reverse-bias characteristics from ten APD dies (solid lines of various colors—right) are highly similar. The M(V) characteristic of an APD die prior to integration is also shown (dashed line—right).
Applsci 15 12056 g004
Figure 5. Experimental frequency responses of a receiver at an optical power of −40 dBm for different APD biases, with the frequency response dropping notably at 62 V.
Applsci 15 12056 g005
Figure 6. Experimental BER versus sensitivity characteristics at 1550 nm wavelength, BER = 10−9, and 2.5 Gb/s for the four receivers in this work (symbols) and other receivers [9,10,11] (lines).
Applsci 15 12056 g006
Figure 7. Modeled FSOC link distance of the measured receiver using an AlGaAsSb APD alongside a Dexerials receiver [9] and reported data from Szajowski, 1999 [7] at BER = 10−9.
Applsci 15 12056 g007
Table 1. Performance of 2.5 Gb/s receivers at 1550 nm wavelength at a given BER value with a pseudorandom binary sequence of 223 − 1 bits (PRBS-23). * Reported at PRBS-7 not PRBS-23.
ReceiverSensitivity (dBm) @ BER R (A/W)
Dexerials [9]−35.0 @ 10−90.95
GoFoton [10]−34.7 @ 10−9n/a
InGaAs/InAlAs [11]−38.8 @ 10−9 *1.02
Table 2. APD parameters used for the sensitivity modeling. The APD’s dark current, Id, is assumed to be bulk and is normalized to M = 1.
Avalanche MaterialF at M = 50 R (A/W)Diameter (µm)Id (nA)
AlGaAsSb2.03 ± 0.060.95500.05
InP15.46 to 27.810.80 to 0.90404.0
InAlAs10.51 ± 0.181.0251000.045
Table 3. TIA parameters for the sensitivity modeling.
TIABrec (GHz)Noise Current (nA)
HiLight HLR2G501.8200
Ommic CGY2102UH/C22.5 to 2.8207
Phyworks PHY1097-031.866150 to 200
Table 4. Parameters used for the atmospheric link model.
ParameterPTXdTX and dRXϴLC and LPLM
Value10 dBm10 cm2 mrad1 dB5 dB
Table 5. Optimal gain, Mopt, and sensitivities (S.) for APDs at BER = 10−9, assuming an ideal extinction ratio.
APDTIAUpperTypicalLower
MoptS. (dBm)MoptS. (dBm)MoptS. (dBm)
AlGaAsSbHLR2G5066−43.366−43.467−43.5
CGY2102UH/C254−42.154−42.258−42.6
PHY1097-0365−43.256−43.857−43.9
InPHLR2G5014−36.319−37.819−37.8
CGY2102UH/C211−35.215−36.616−36.9
PHY1097-0313−36.215−38.215−38.2
InAlAsPHY1097-0324−39.721−40.321−40.3
Disclaimer/Publisher’s Note: The statements, opinions and data contained in all publications are solely those of the individual author(s) and contributor(s) and not of MDPI and/or the editor(s). MDPI and/or the editor(s) disclaim responsibility for any injury to people or property resulting from any ideas, methods, instructions or products referred to in the content.