Article

Application of Small Baseline Set Time-Series InSAR Technique in Landslide Disaster Monitoring in Southern Hilly Mining Area

1
School of Civil and Surveying & Mapping Engineering, Jiangxi University of Science & Technology, Ganzhou 341000, China
2
Technology Innovation Center of the Great Lakes Basin Land Space Ecological Protection and Restoration Engineering of the Ministry of Natural Resources, Nanchang 330000, China
3
Jiangxi Institute of Land Space Survey and Planning, Nanchang 330000, China
*
Author to whom correspondence should be addressed.
Appl. Sci. 2025, 15(22), 12051; https://doi.org/10.3390/app152212051
Submission received: 14 October 2025 / Revised: 9 November 2025 / Accepted: 11 November 2025 / Published: 13 November 2025

Featured Application

This study presents an innovative multi-source data fusion method for the quantitative identification of landslide hazards in mountainous open-pit mining areas, offering new insights and technical approaches for the research and prevention of such disasters. The method provides a scientific basis for identifying and assessing landslide risks in mountainous open-pit mining areas, demonstrating potential for application in similar regions. The findings contribute to the development of more effective disaster prevention and mitigation measures, ensuring mining site safety and promoting regional sustainable development.

Abstract

Mountainous open-pit mines are highly susceptible to landslides, yet quantitative risk assessment remains a challenge. This study aims to develop and validate a quantitative landslide risk assessment model by integrating multi-source data to enhance hazard identification in these complex environments. Taking the Dexing Copper Mine as a case study, we used Small Baseline Subset InSAR (SBAS-InSAR) to derive surface deformation rates. This deformation data was integrated with geological and topographical factors within a Geographic Information System (GIS), using an information value model combined with weighting from the Analytic Hierarchy Process (AHP) and Entropy Weight Method (EWM) to generate a comprehensive landslide risk map. The results show that 3860 potential landslide points were identified, with deformation rates ranging from −338.74 to 80.61 mm/a. High and very high-risk zones were primarily concentrated around the Fujiawu and Zhujiawu dump sites, and the model’s performance was validated with a high degree of accuracy, achieving an Area Under the Curve (AUC) value of 0.871. This study demonstrates that the integration of multi-source data provides a robust and effective approach for quantitative landslide risk assessment in mountainous mining areas. The proposed framework can serve as a valuable tool for targeted disaster prevention and management.

1. Introduction

The hilly and mountainous areas of southern China contain rich mineral resources due to their complex geological structure and rock types, coupled with warm and humid climate conditions [1,2]. Open-pit mines are relatively common among them. While their mining activities have made significant contributions to national economic construction, they have also caused geological and environmental problems, such as landslides [3]. Mining activities will disrupt the natural equilibrium of the mining area and result in significant damage to the geological structure [4,5], soil vegetation [6,7], and water resources [8,9,10]. During open-pit mining, the removal of surface vegetation and topsoil can result in soil instability and significant damage to land resources. In addition, blasting operations can have a seismic effect that opens up the joints in the rock mass and may even cause the rock to break, which can impact the stability of the slope [11]. The stacking of slag and other activities can also lead to the destruction of surface structures, severe pollution of soil and water bodies, and the occurrence of geological environmental problems. Since the soil and vegetation in the mining area cannot naturally recover in a short time, the process of artificial reclamation is lengthy. Coupled with the comprehensive impact of various factors, such as rainfall, landslide disasters have become increasingly prominent. Therefore, early identification of potential landslide risks plays a crucial role in the management of geological hazards and the implementation of early warning systems in mountainous mining areas. Only through scientific risk identification and assessment can effective preventive and response measures be taken to ensure the safety of mining areas and the sustainable development of the surrounding environment.
As a new technology for Earth observation in space, Interferometric Synthetic Aperture Radar (InSAR) utilizes spaceborne active microwave remote sensing imaging sensors. This technology allows for imaging throughout the day and in any weather conditions, providing precise and wide-ranging information on surface deformation. It has good applications in the field of landslide monitoring [12,13]. Since its first application to landslide monitoring research in 1995, InSAR technology has proven feasible in monitoring small landslide deformations. With the continuous development of technology and the deepening of research, domestic scholars have gradually recognized the significant value of InSAR in monitoring geological hazards. They have progressively developed various deformation monitoring methods, such as Differential Interferometric Synthetic Aperture Radar (D-InSAR), Permanent Scatterer Synthetic Aperture Radar Interferometry (PS-InSAR), and Small Baseline Subset (SBAS-InSAR). SBAS-InSAR technology is widely used in monitoring mine surface deformation, landslides, and other geological disasters due to its adaptability to large-scale complex terrain, ability to process multi-temporal data, and efficient processing of small baseline sets [14]. Guo Rui utilized SBAS-InSAR technology to measure subsidence in the mining area and successfully identified potential landslide areas in the study region [15]. Some scholars compared the similarities and differences between the SBAS-InSAR algorithm and the PS-InSAR algorithm. They found that the SBAS-InSAR algorithm can obtain higher-precision deformation results under moderate data volume conditions [16]. With the advancement of landslide research, the academic community has started to focus on quantitatively analyzing the risks associated with landslide disasters. The method that combines Geographic Information System (GIS) technology and mathematical statistics has been applied to the risk assessment of geological disasters, such as landslides and debris flows, and has achieved numerous results [17].
Despite the significant progress made in landslide research using InSAR technology, limitations persist due to factors such as the inherent constraints of radar satellites, the complex terrain of landslide areas, and other influences. Challenges include geometric distortions, dense vegetation cover, atmospheric effects, limitations in three-dimensional deformation monitoring, and a lack of consideration for various aspects such as actual surface deformation, terrain features, and rainfall. Therefore, to identify potential landslides more comprehensively and accurately, it is necessary to introduce multi-source data for comprehensive analysis to make up for the shortcomings of a single technology. Gao Binghai proposed a method to integrate multi-source data to construct a dynamic assessment of landslide susceptibility, proving that considering deformation factors can improve the accuracy of dynamic assessment of landslide susceptibility [18]. Future research trends indicate that comprehensive analysis based on multi-source data will become an important direction for potential landslide identification.
However, despite significant progress, accurately and quantitatively assessing land-slide risks in complex mountainous open-pit mines remains a challenge. Previous studies often relied on a single data source or qualitative assessments, which have certain limitations when applied to the dynamic and complex geological conditions of active mining areas. To address these limitations, the primary objective of this study is to develop and validate a quantitative landslide risk assessment model for mountainous open-pit mining areas by integrating multi-source data. This approach involves fusing SBAS-InSAR-derived surface deformation data with geological, topographical, and hydrological factors to establish a comprehensive assessment framework that reflects the unique landslide mechanisms in mining environments. The model’s effectiveness is then demonstrated through a case study at the Dexing copper mine. The novelty of this work lies in its integrated framework, which expands upon traditional hazard identification to achieve a quantitative risk assessment tailored for complex mining environments. This research is expected to contribute to the current body of knowledge by providing a replicable and robust methodology for the early warning and prevention of geological disasters in similar mines.

2. Materials and Methods

2.1. Study Area

Dexing Copper Mine is located in Dexing City, Shangrao, Jiangxi Province. It is one of the largest open-pit porphyry copper mines in my country. The study area mainly includes two open-pit mines (A, B), four dump sites (C, D, E, F), and four tailing ponds (G, H, I, J). The specific layout is shown in Figure 1. The area is characterized by mountains and hills, with steep terrain and deep valleys. The soil type in the area is predominantly red soil. The climate is classified as subtropical monsoon, with relatively high annual precipitation. Additionally, the mining area is intersected by the Dawu River. Since the commencement of open-pit mining activities in 1958, the Dexing Copper Mine has caused significant environmental damage. This includes the destruction of vegetation and sulfide weathering, which leads to the formation of acidic wastewater containing heavy metal ions. This acidic wastewater has been discharged into the mining and dump sites for an extended period, resulting in significant pollution to the soil and water quality in the mining area and its surrounding areas. Faced with serious ecological and environmental problems, Dexing Copper Mine began taking measures in the 1980s to strengthen the ecological restoration and plant restoration of dump sites and tailings ponds. Among them, the 1 # tailings pond has stopped discharging tailings since 1986. Although a series of improvement measures have been implemented, years of mine development activities have still caused significant damage to vegetation and soil, increasing the vulnerability of the entire mining area to landslides. To address this issue, it is crucial to conduct thorough research and implement effective protective measures. These actions are necessary to achieve the comprehensive restoration and sustainable development of the ecological environment surrounding the Dexing Copper Mine.

2.2. Data Sources

The data used in this study mainly include Sentinel-1A and Precise Orbit Determination (POD) Ephemeris data, Digital Elevation Model (DEM), precipitation, lithology, faults, Landsat 8 OLI, historical geological hazard data, roads, rivers, and land cover, among others. Multiple data sets and detailed data descriptions are presented in Table 1. To maintain consistency and comparability, the study processed each spatial data set and resampled its resolution to 30 m. The final unified projected coordinate system used was WGS_1984_UTM_Zone_50N.
Sentinel-1A is an Earth observation satellite launched by the European Space Agency (ESA) in 2014. It is equipped with a C-band synthetic aperture radar (SAR) and can conduct observations in various weather and lighting conditions. Due to its exceptional performance, Sentinel-1A is extensively utilized in various fields, including surface deformation monitoring, geological disaster assessment, and agricultural monitoring. It serves as a reliable data source for scientific research. The parameter information of Sentinel-1A in the study area is shown in Table 2.

2.3. Research Methods

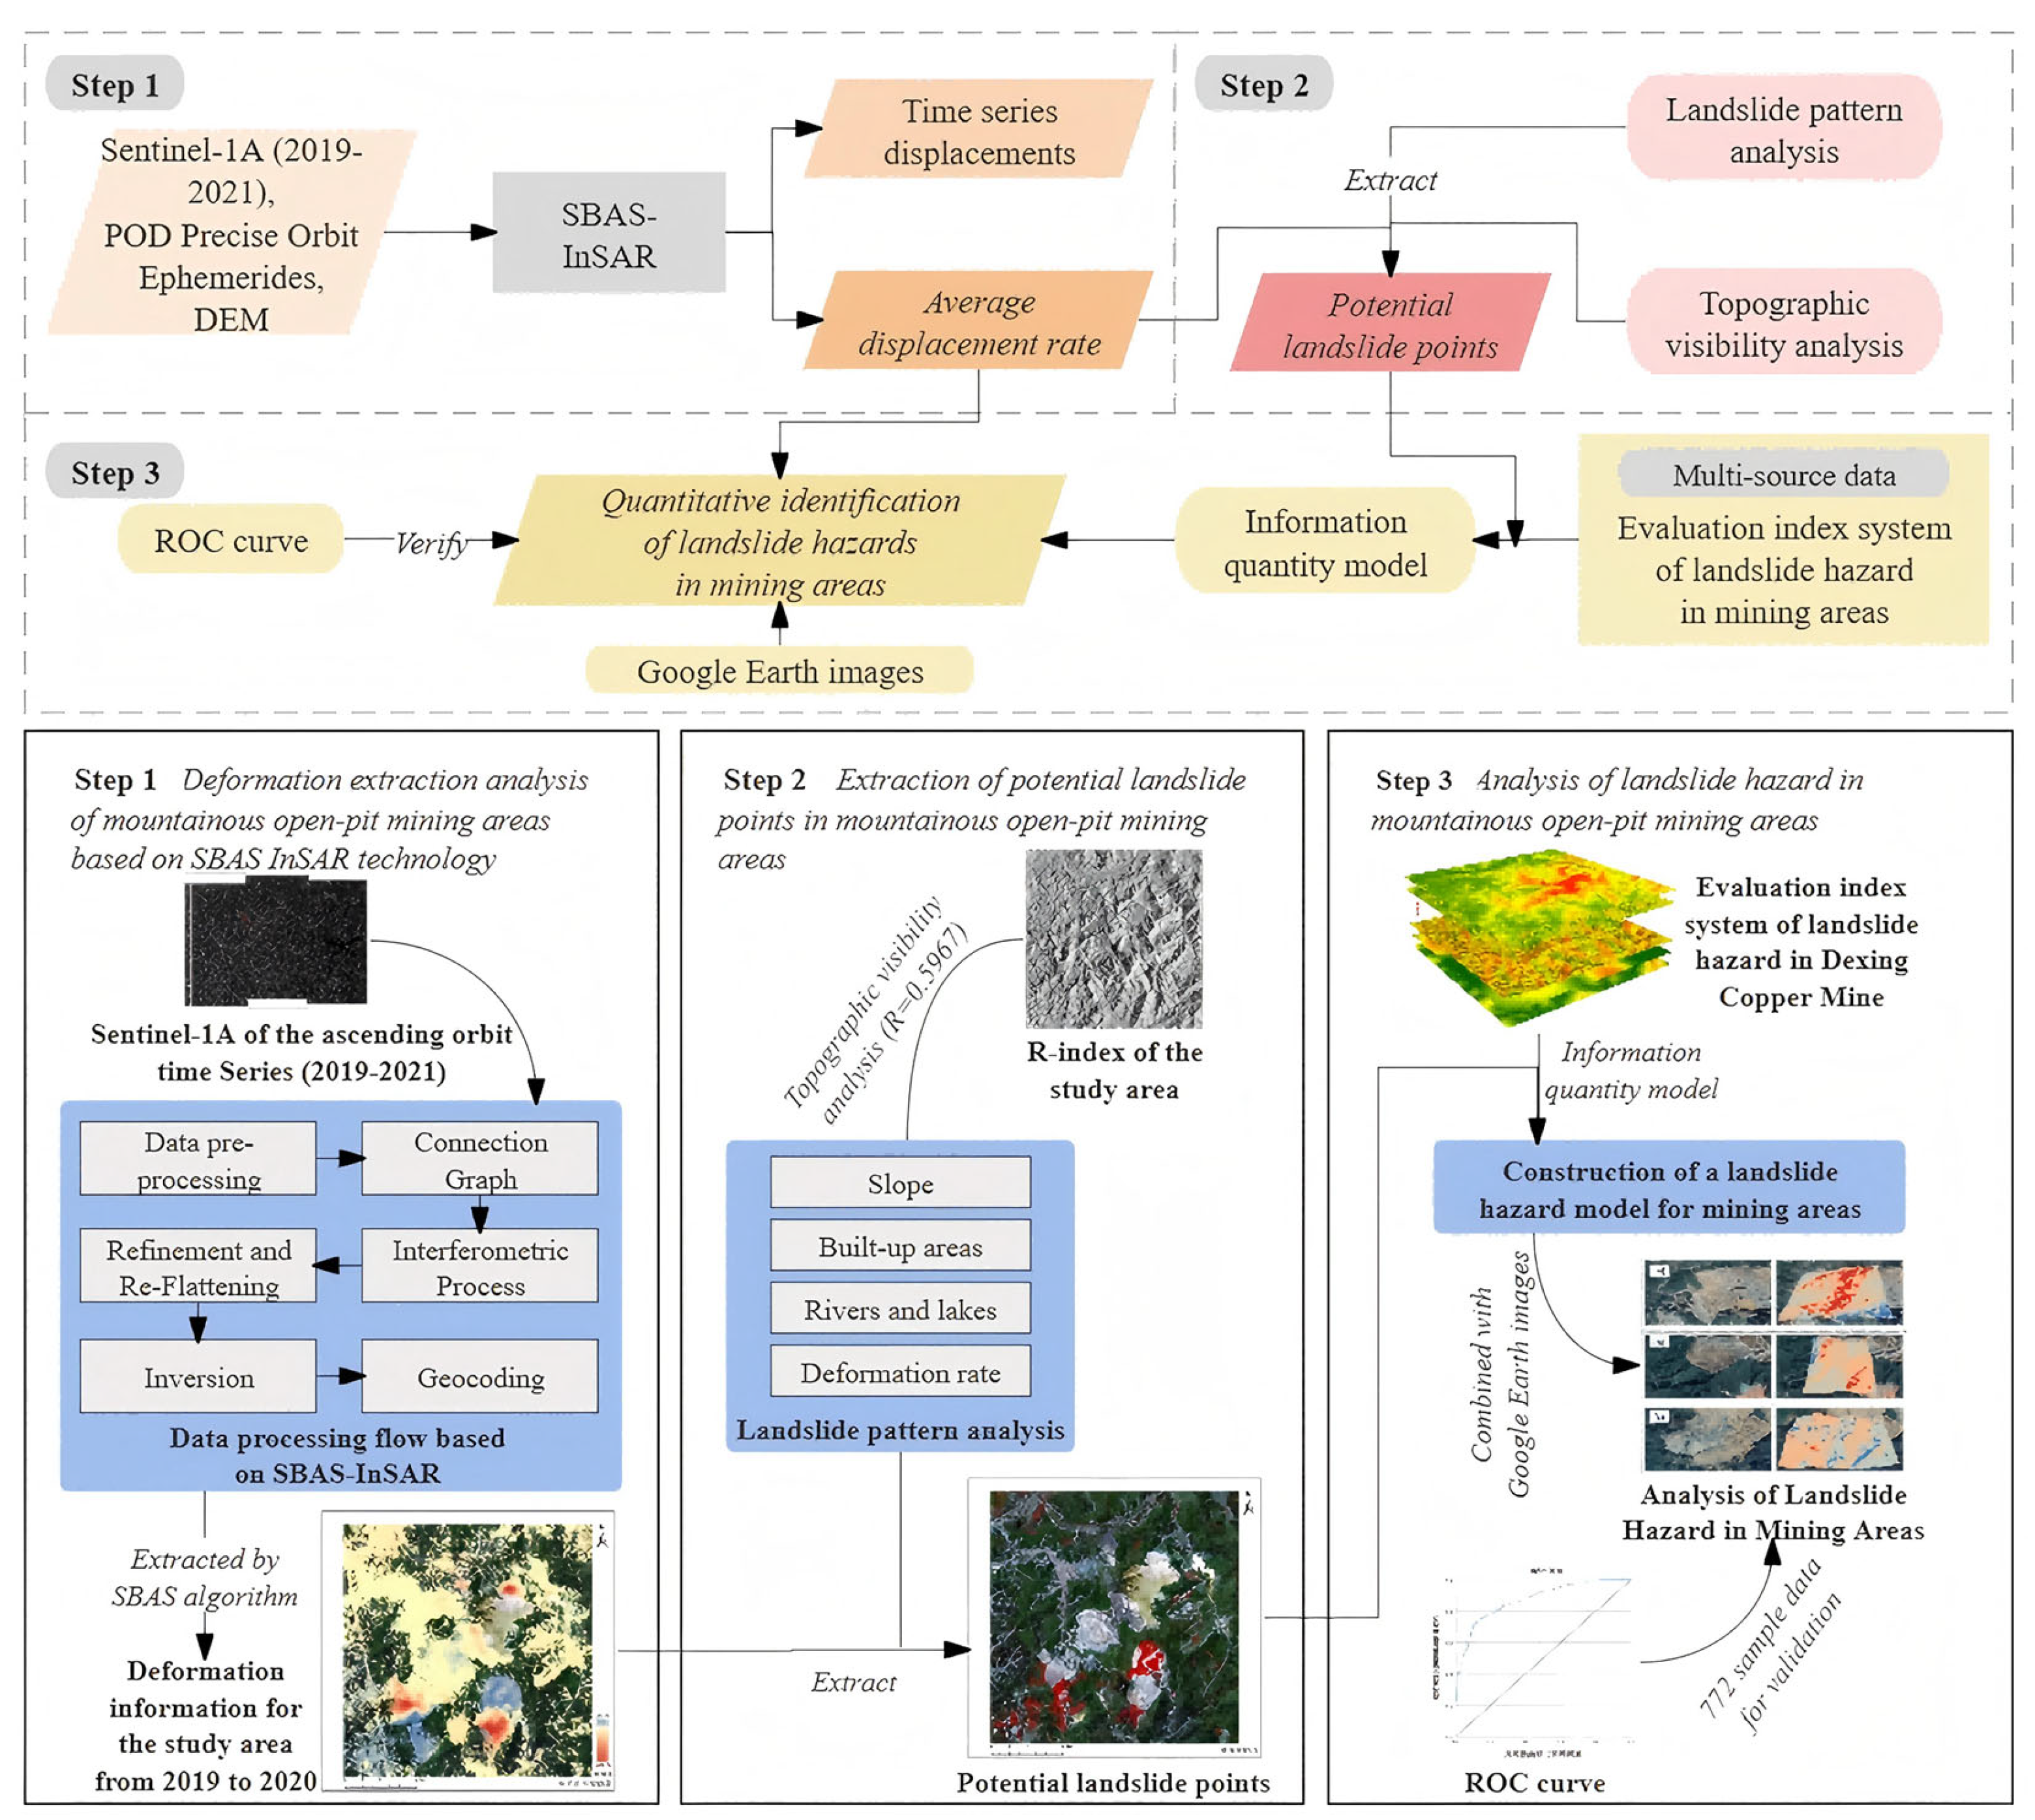
According to the characteristics of the mining area, this study first utilizes SBAS-InSAR technology to extract deformation information of the Dexing Copper Mine during the study period from the radar Line of Sight (LOS) direction of the ascending orbit data. Then, by combining the topographic visibility analysis of the R-index with the actual situation of the study area, we can eliminate unreliable deformation information and extract potential landslide points. Finally, based on the formation rules and spatial distribution characteristics of landslides in mining areas, we selected 11 evaluation indicators that impact landslides from three perspectives: geographical environment, geological structure, and human activities. Subsequently, we constructed a model to quantify information on landslide disaster risk. This model is used to quantitatively identify landslide risks in mining areas, and its evaluation results are verified. A detailed overview of the method is shown in Figure 2.

2.3.1. Extraction of Deformation Information and Potential Landslide Points in Mining Areas

In areas with high vegetation coverage in mining areas, the instability of surface scattering characteristics can easily lead to spatiotemporal decoherence, which makes traditional D-InSAR technology face some challenges in long-term deformation monitoring. PS-InSAR technology usually requires a large spatial baseline to identify and track permanent scatterers, which may be difficult in complex terrain or vegetation-covered areas. In contrast, SBAS-InSAR technology can not only capture weak deformation information on the surface but also adapt to complex terrain more effectively and alleviate the decoherence problem caused by vegetation, so it performs better in long-term surface deformation analysis [19,20]. Landslides at Dexing Copper Mine often occur near mines and dump sites, as well as in areas with low vegetation coverage. Therefore, the deformation results obtained based on SBAS-InSAR technology have reference values for subsequent extraction of potential landslide points.
The deformation information in this study was derived using the Small Baseline Subset (SBAS) InSAR technique, the principle of which is based on analyzing a combination of differential interferograms with short spatial and temporal baselines. If N + 1 SAR images of the study area are acquired within the period t 0 t N , and M differential interferograms with good coherence are generated through differential interference processing, then M must satisfy the following conditions:
N + 1 2 M N N + 1 2
Let x , r be the pixel in the differential interferogram whose azimuth and range directions are x and r respectively. It is known that λ is the radar wavelength. ϕ t A , x , r and ϕ t B , x , r are the deformation phases of pixel x , r at t A and t B ( t A > t B ). d t A , x , r and d t B , x , r respectively represent the accumulated deformation of pixel x , r in the LOS direction at time t A and t B relative to the initial time t 0 . ϕ a t m o x , r is the atmospheric delay phase, ϕ n a i s e x , r is the noise phase, and ϕ t o p o x , r is the residual topography phase. Then for any pixel x , r of the j-th (j = 1,2,…, M) differential interferogram, its phase δ ϕ j x , r can be expressed as:
For any pixel x , r of the j-th (j = 1,2,…, M) differential interferogram, its phase δ ϕ j x , r can be expressed as:
δ ϕ j x , r = ϕ t B , x , r ϕ t A , x , r 4 π λ d t B , x , r d t A , x , r + ϕ a t m o x , r + ϕ n o i s e x , r + ϕ t o p o x , r
where x , r is the pixel in the differential interferogram whose azimuth and range directions are x and r respectively, λ is the radar wavelength, ϕ t A , x , r and ϕ t B , x , r are the deformation phases of pixel x , r at t A and t B ( t A > t B ),  d t A , x , r and d t B , x , r respectively represent the accumulated deformation of pixel x , r in the LOS direction at time t A and t B relative to the initial time t 0 , ϕ a t m o x , r is the atmospheric delay phase, ϕ n a i s e x , r is the noise phase, and ϕ t o p o x , r is the residual topography phase.
To improve the accuracy and reliability of deformation monitoring results, an external DEM can be used to effectively remove the above three-phase errors. The average rate of ground surface deformation during the acquisition period of any two images is:
ν T = ν 1 = ϕ 1 t 1 t 0 , , ν n = ϕ N ϕ N 1 t N t N 1
where ν T is the transpose of the mean deformation velocity vector, t i represents the acquisition time of the i-th SAR image, ϕ i is the cumulative deformation phase at time t i , and ν i is the mean deformation velocity for the time interval between acquisitions t i 1 and t i .
Assume that ν k is the deformation rate of the pixel at time k . Then the interference phase of the j-th differential interferogram can be expressed as:
δ ϕ j = k = S j + 1 E j t k t k 1 ν k
where E j is the master image acquisition time and S j is the slave image acquisition time.
Define δ ϕ as the differential interference phase of all differential interferograms, ν as the deformation velocity in each time period to be solved, B j , k = t k t k 1 , and B as an M × N matrix. Equation (4) can be rewritten into matrix form:
δ ϕ = B ν
The basic idea of the SBAS method is to use the least squares method and the singular value decomposition method to estimate the deformation rate. The average deformation rate is then integrated over the time domain to obtain the time series deformation information [21].
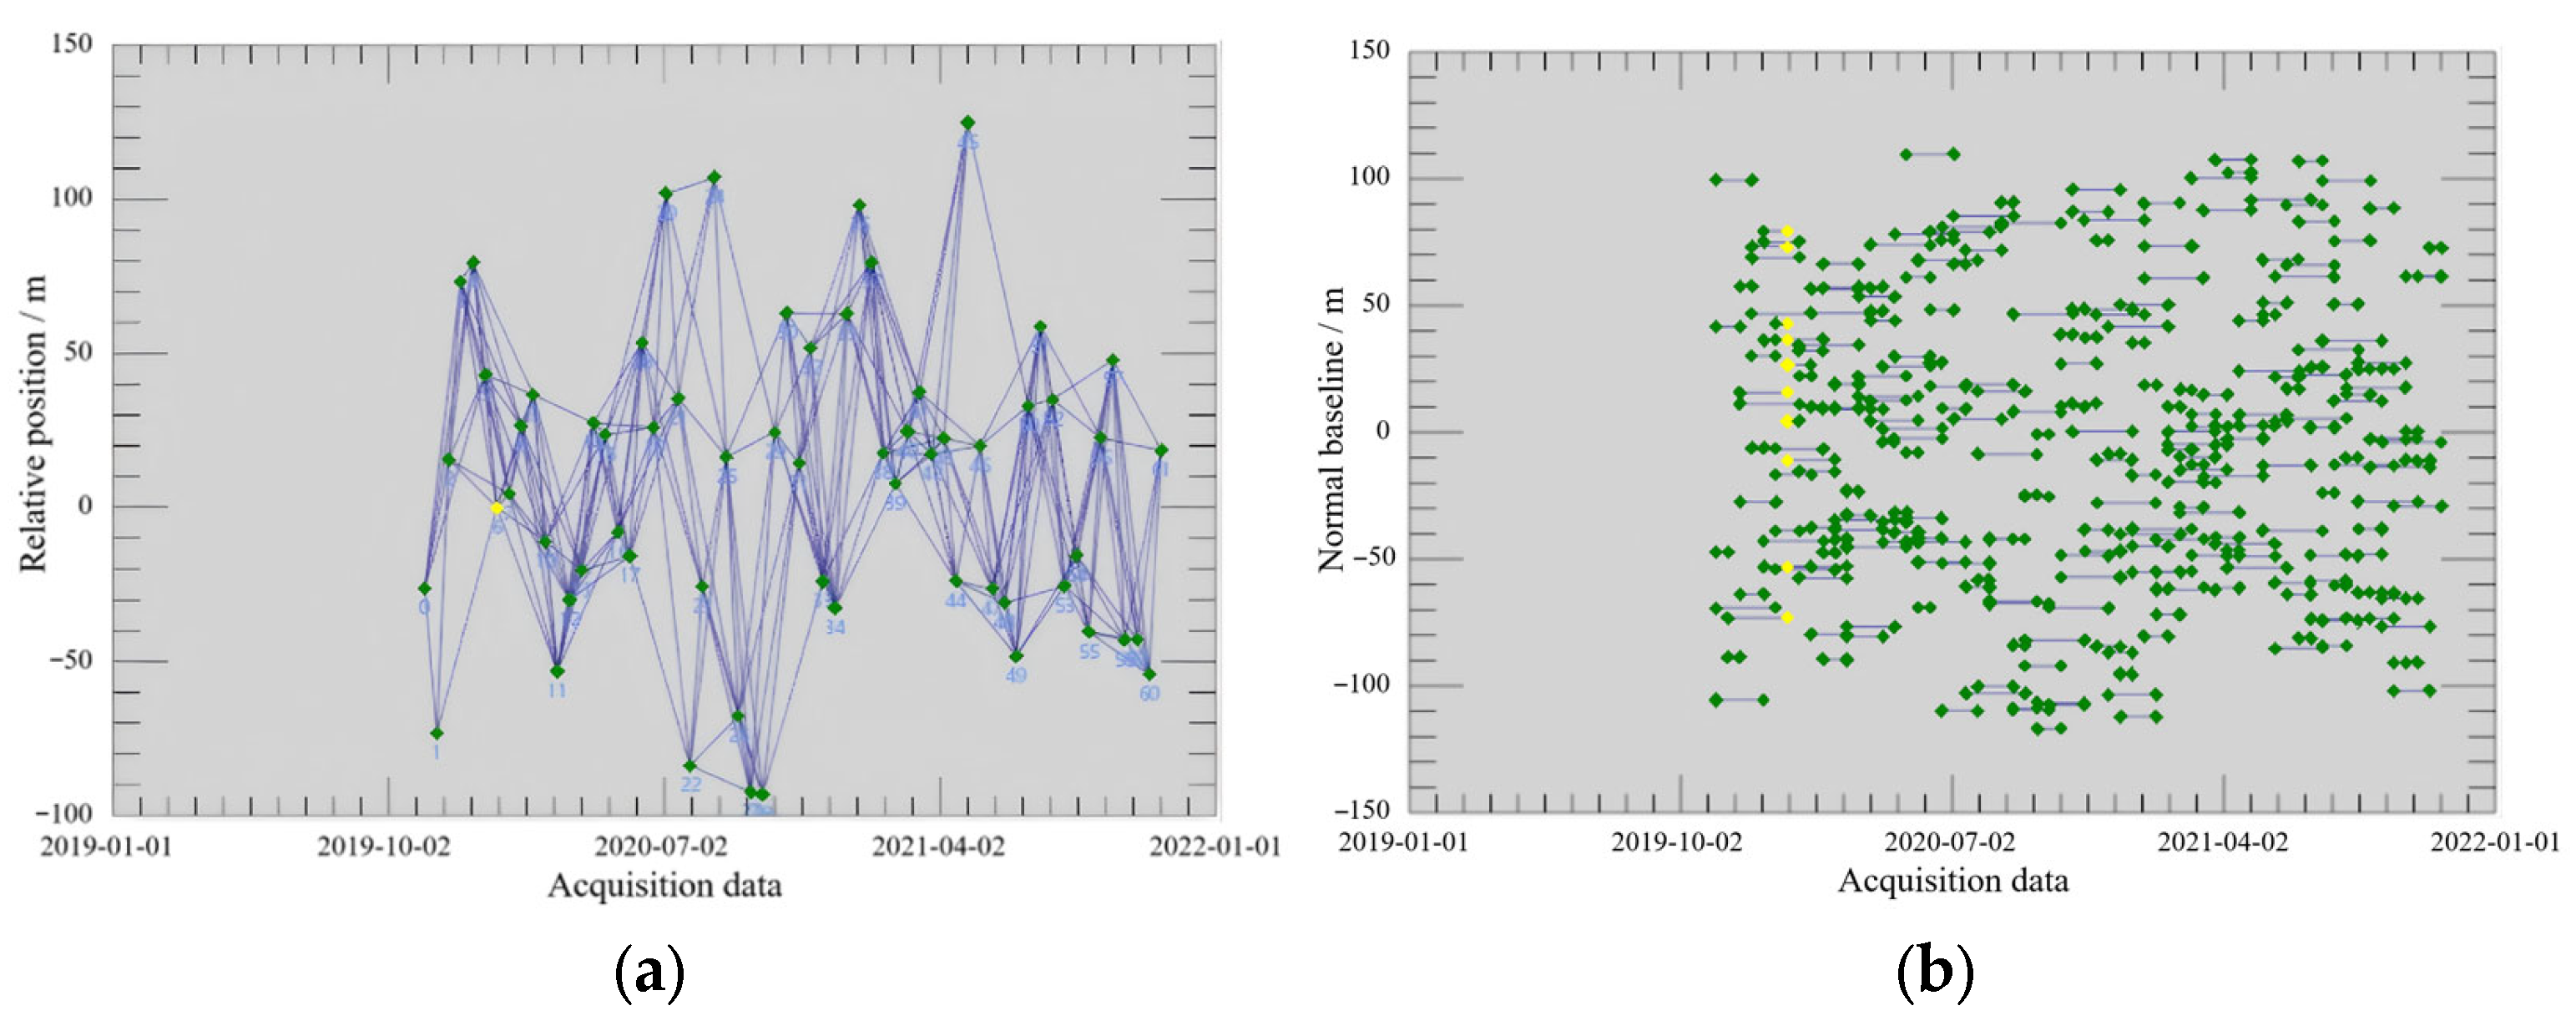
Following the theoretical principles, the specific data processing workflow was as follows. In the study, the orbital information of Sentinel-1A was first corrected using POD ephemeris data to generate Single-Look Complex (SLC) images. After cropping the data to match the study area’s scope, SBAS-InSAR processing was performed using the SARscape module (Version 5.6) within the ENVI software environment (https://www.nv5geospatialsoftware.com/Products/ENVI, accessed on 24 March 2024). To ensure the quality of the generated interferogram and the accuracy of the inversion, the research team made further adjustments to the parameters. Ultimately, we set the time baseline to 60 days and the critical baseline percentage to 2% to generate the connection diagram. On this basis, DEM data with a resolution of 30 m were used for registration, and differential interferometric processing was performed on all pairs of interferometric images. The system automatically selected the image of 17 January 2020, as the super main image. Through the connection of interferometric pairs from 62 ascending orbit images, a total of 269 interferometric pairs were obtained. Image time-position and time-baseline plots are detailed in Figure 3. Taking into account the current conditions of the study area, the Goldstein method was used for filtering. To ensure the accuracy of the extraction, the threshold for the unwrapped correlation coefficient was set to 0.2. In terms of phase unwrapping, the Minimum Cost Flow (MCF) method was used to minimize the impact of vegetation and other factors. To estimate and remove the residual constant phase and phase ramp that remain after unwrapping, Ground Control Points (GCPs) were selected for orbit refinement and re-flattening. Two deformation rate inversions were then performed to remove the atmospheric phase error, followed by the calculation of the average displacement rate and time series displacement. Finally, the results were geocoded and converted to the WGS_84 geographical coordinate system. Subsequently, the deformation results of the ascending orbit data in the study area in the LOS direction were obtained.
Based on the processed deformation results, the final step was the extraction of potential landslide points. The Dexing Copper Mine has a complex topography with significant overall undulations. Therefore, when monitoring using radar satellites, some areas may be affected by phenomena such as foreshortening, layover, and shadowing. Therefore, it is necessary to eliminate this portion of deformation information to more effectively extract potential landslide points. Topographic visibility analysis can be employed for this purpose. Topographic visibility from radar satellite sensors is influenced by the direction of the satellite’s LOS and the geometry of the radar about the surface during acquisition. The R-index represents the ratio between the pixel size of the slope and the ground geometry, which indicates the pixel compression factor. Based on the research conducted by Cascini and Notti, Cigna [22] addressed the limitations of single-pixel evaluation by simulating terrain visibility mapping and SAR distortion. They also proposed a calculation method for the R-index:
R = sin θ β × sin A
where θ is the line of sight incident angle. β is the slope. A is the aspect correction factor, which is computed as A = α + φ + 180 for ascending mode data, and A = α   φ for descending mode data. Among them, α is the aspect and φ is the radar flight azimuth.
When R = 1, it indicates optimal visibility. When sin θ < R < 1, visibility is relatively good. When 0 < R sin θ , the region experiences foreshortening, which leads to decreased visibility. When −1 ≤ R ≤ 0, layover and shadowing phenomena occur in the region, resulting in extremely low visibility.
The average incidence angle of ascending orbit data in the study area is 36.64°. Therefore, a threshold of R = 0.5967 is considered to separate regions with good visibility from those with poor visibility. When R 1 > 0.5967, these areas are primarily distributed in the east, southeast, and northeast directions, indicating regions with good visibility. When R 1 ≤ 0.5967, the predominant distribution is in the west, southwest, and northwest directions, indicating regions with low visibility. In these areas, foreshortening, layering, and shadowing phenomena occur, resulting in reduced visibility.
The study integrates multiple factors, including deformation information, topographic visibility analysis, and actual conditions in the study area. It also excludes deformation information from unreliable areas to identify potential landslide points. When conducting a comprehensive analysis of the deformation data in the mining area, the study found that the settlement observed in areas such as dump sites and tailings ponds is a natural occurrence. Through field investigation and analysis, it was further confirmed that landslides are less likely to occur in flat areas with a slope of less than 5°, residential building areas, rivers and lakes, and areas where the absolute value of the deformation rate is less than 25 mm/a in the study area. Therefore, the deformation information obtained based on SBAS technology was studied, and the deformation information in unreliable areas such as R 1 ≤ 0.5967, slopes less than 5°, residential building areas, rivers and lakes, deformation rates with an absolute value less than 25 mm/a, and dump sites and tailings ponds were eliminated. Finally, potential landslide locations were identified using the ArcGIS 10.8 platform (https://www.esri.com/en-us/arcgis, accessed on 12 May 2024), providing the basis for developing subsequent models to quantify landslide risk in mining areas.
Having identified the locations of potential landslides, the next stage of the methodology was to build a quantitative risk assessment model. The goal of this model is to establish the statistical relationship between the occurrence of these landslide points and a set of predisposing environmental factors. To achieve this, we first constructed a comprehensive evaluation index system, which serves as the input for the model.

2.3.2. Construction of Evaluation Index System of Landslide Risk in Mining Areas

Based on the actual conditions of the Dexing Copper Mine, the study selected 11 indicators from three aspects: geographical environment, geological structure, and human activities. These indicators include elevation, slope, aspect, annual average precipitation, lithology, NDVI, distance to rivers, disaster point kernel density, distance to fault zones, distance to roads, and distance to towns. These were chosen to construct an evaluation index system of landslide risk for the Dexing Copper Mine. The combined weights were determined using the subjective and objective weighting method, as shown in Table 3.
The subjective and objective weighting method is an effective approach that combines expert experience and objective data. This method helps establish a more scientific and reasonable evaluation index system, making decision-making more objective and scientific. The subjective empowerment method is based on personal experience and subjective judgment, which introduces a certain level of arbitrariness and lacks scientific rigor. On the contrary, the objective weighting method can avoid the influence of subjective factors on the weight by utilizing quantitative means such as objective data, statistical analysis, and mathematical models. However, it is overly reliant on the sample, which may result in distorted weights. Therefore, this study utilizes subjective and objective weighting methods to determine a relatively optimal combined weight value.
Due to the large number of evaluation indicators and the wide range of content involved, the study chose to use the Analytic Hierarchy Process (AHP) to determine the subjective weight. AHP is a multi-criteria decision analysis method. The basic idea is to break down a complex decision-making problem into multiple levels. Experts then provide subjective judgments to compare different levels and factors in pairs, forming a judgment matrix. This matrix, constructed based on expert scoring for the 11 evaluation factors, is presented in Table 4. A consistency check was performed on the judgment matrix, yielding a consistency ratio (CR) of 0.0303. Since this value is well below the standard threshold of 0.1, the matrix has a satisfactory consistency, and the derived subjective weights are reliable. The weights are then calculated based on this matrix [23]. The calculation formula is as follows [24].
W a i = W ¯ i i = 1 n W ¯ i
where W a i is the subjective weight value of the i-th indicator. W ¯ i is the n-th power root vector after multiplying the single rows of the judgment matrix elements one by one. i = 1,2,3…n.
The Entropy Weight Method (EWM) is also widely used in multi-attribute decision-making problems. The basic idea is to determine the objective weights based on the magnitude of indicator variability. The formula is as follows [25]:
W b i = 1 H i i = 1 n 1 H i
H i = ln m 1 j = 1 m f i j ln f i j
where W b i represents the objective weight value of the i-th indicator. Hi is the entropy value of the i-th indicator. f i j is the weight of the indicator value of the j-th item under the i-th indicator. m is the number of grid cells of the indicator in the study area. n is the number of research indicators.
Combining the empirical and scientific aspects of the two methods, citing the distance function Equation (11), the subjective and objective weighting methods are used to integrate the weights of each indicator. The formula is as follows [26]:
W a i b i = c W a i + d W b i
d W a i , W b i = 1 2 i = 1 n W a i W b i 2 1 2
d ( W a i , W b i ) 2 = ( c d ) 2 c + d = 1
where W a i b i is the combined weight value of the i-th indicator. c and d represent the distribution coefficients of subjective and objective weights, respectively, which can be obtained through Equations (11) and (12).
In the geographical environment, the Dexing Copper Mine exhibits significant overall topographic variations. Elevation and slope directly impact the accumulation and distribution of loose deposits and debris. Consistency between the aspect and rock layer inclination increases the risk of landslide occurrence. Rainfall can lead to the flow of surface water, which in turn causes surface runoff. Extensive rainfall infiltration can saturate slope soils, weakening their stability and reducing both frictional resistance and shear strength. Therefore, precipitation is one of the crucial factors that trigger landslides. Different types of rocks exhibit varying levels of strength and stability. Based on a 1:2.5 million scale vector file of the Chinese geological map, the existing rock types in the study area have been classified into three groups [27]. One type is tuffaceous slate, sedimentary tuff, silty slate, siltstone, etc. One type is ophiolite, spilite, greenschist, siliceous rock, etc. The other is silty shale, shale, dark gray silicalite, etc. The mining area typically employs artificial reclamation and vegetation planting to restore the area ecologically, thereby preventing landslides from occurring. Dense vegetation effectively slows down water flow, retains soil, and reduces slope erosion. Therefore, the NDVI is selected to reflect the impact of vegetation cover on landslides. The influence of surface water is simplified by using the distance from the main river as a representation. The geographical environment has a significant impact on the landslide hazard in the study area, and as multiple indicators are selected, a higher weight of 0.7672 is assigned to this dimension in the three-dimensional weighting system.
In geological structures, issues arising from past geological events, such as historical geological disasters and fault zones, can have a direct or indirect impact on the occurrence of landslides in mining areas. According to the current situation at Dexing Copper Mine, two indicators, namely disaster point kernel density and distance to fault zones, have been selected to assess the influence of geological structures on landslides. The total weight is set to 0.1702.
Among human activities, geotechnical and slope instability caused by long-term mining projects, village and town construction, and road projects in the study area have a significant impact on landslides. In this regard, two indicators, distance to roads and distance to towns, were selected concerning the availability of data. The total weight is set to 0.0626.

2.3.3. Construction of Landslide Risk Evaluation Model in Mining Areas

Domestic and international scholars have conducted extensive research on spatial quantitative prediction models for regional landslides. The information quantity model has found widespread application in the field of hazard assessment for geological disasters, such as landslides and debris flows [28]. The main idea of the information quantity method is to use the real situation and information of potential landslide points to convert the actual values of factors that influence landslide disasters in the study area into information quantity values. This method evaluates the degree of correlation between different influencing factors and the study object by calculating the information quantity value provided by each factor. It indicates the contribution of a specific factor to the occurrence of local landslides. In the information quantity model, as the value of information quantity increases, the contribution rate of the evaluating factor to triggering landslides also increases. Consequently, the hazard level becomes higher. The formula for calculating information quantity value is as follows:
I y , x 1 x 2 x n = l n P y , x 1 x 2 x n P y
where P y , x 1 x 2 x n is the probability of occurrence of landslide y under the combination of hazard factor x 1 x 2 x n .
Research usually uses a simplified approach to independently calculate the information quantity on a single factor and finally superimpose and analyze it. Generally, the sample frequency I am used to calculate the information quantity to represent the contribution rate of the evaluation factor category to the occurrence of landslides. The formula is as follows [29]:
I x i , y = l n H i / H S i / S
where I x i , y   represents the value of the information quantity provided by the evaluation factor category xi on the occurrence of landslides. H i is the number of landslide grid cells distributed within the evaluation factor category x i . H is the total number of landslide grid cells in the study area. S i represents the number of grid cells in the study area with the evaluation factor category x i . S represents the total number of evaluation grid cells in the study area.
The study aimed to construct an information quantity model of landslide hazards for the mining area, based on the extraction of potential landslide points. The research was conducted using grid units. Evaluation factors were categorized into intervals based on empirical knowledge and a review of the relevant literature. Subsequently, overlay analysis was performed separately for each categorized factor with the potential landslide points to determine their distribution relationship. Information quantity values for each evaluation factor category were then obtained using Equation (14). To avoid uncertainties arising from the inclusion of both positive and negative values, all information quantity values were standardized within the range of [0, 1]. Finally, a weighted overlay of information quantity within individual evaluation grid cells was conducted. This process yielded a comprehensive information quantity value of landslide risk in the mining area, reflecting the overall risk of landslides.

2.3.4. Model Validation

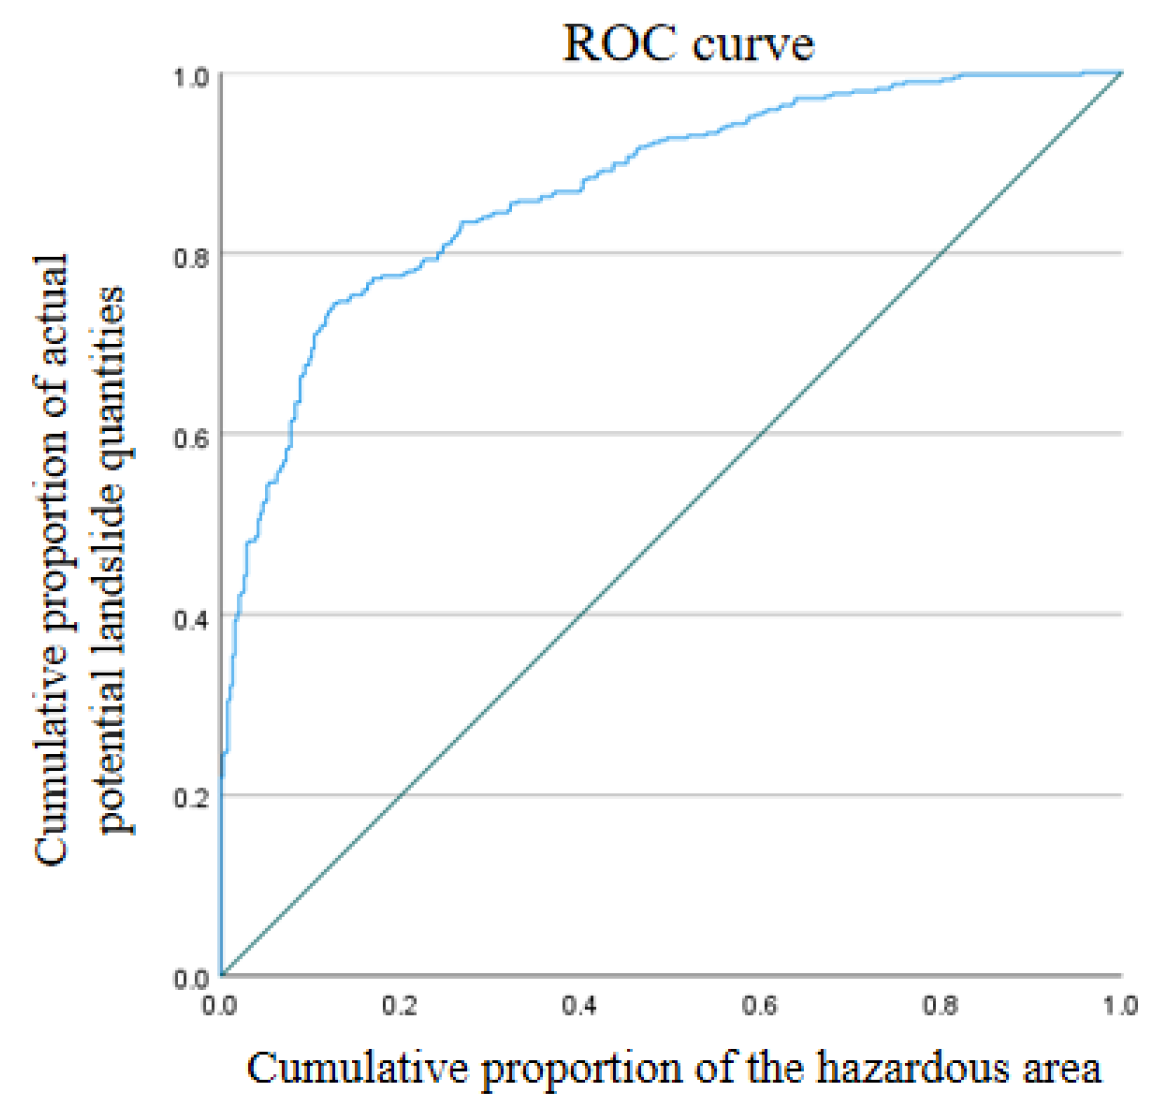
To assess the performance and predictive accuracy of the constructed model, the study employed the Receiver Operating Characteristic (ROC) curve method for validation. For the validation, the study selected 10% of potential landslide points as landslide sample points and then randomly generated an equal number of non-landslide sample points, totaling 772 sample data. Two corresponding sequences of samples were generated; one sequence represented the comprehensive information quantity values predicted by the model for the sample data, and the other sequence represented the actual hazard level of the sample points. Since landslide sample points were all potential landslide points defined by the study, the defined actual hazard level for landslide points was assigned a value of 1, while other non-landslide sample points were assigned a value of 0. The Area Under the Curve (AUC) of the ROC curve, which ranges from 0 to 1, was used as the final metric, with a larger value indicating a more reasonable model evaluation result [30].

3. Results

3.1. Deformation Analysis and Extraction of Potential Landslide Points in the Mining Area

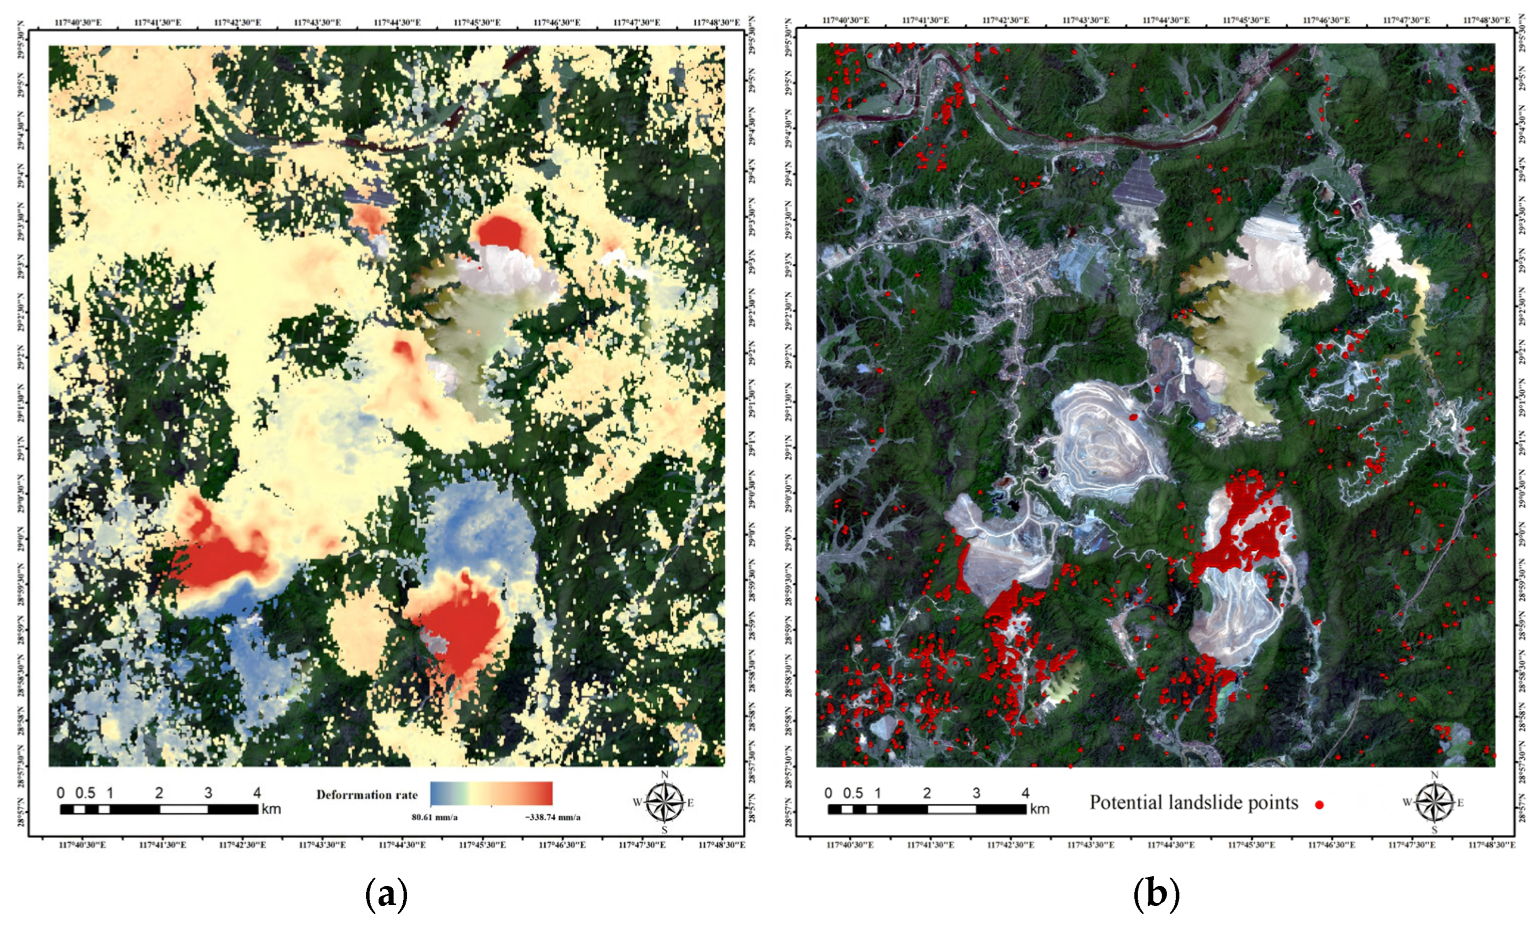
Following the standardized SBAS workflow, for which the key technical parameters have been described in Section 2.3.1, the ascending orbit data of the Dexing Copper Mine from November 2019 to November 2021 were processed. The annual average deformation rate results in the LOS direction were obtained, as shown in Figure 4 (Among them, the annual average deformation rate value is positive along the LOS direction toward the SAR sensor and negative in the opposite direction). It can be seen from the figure that areas with high vegetation coverage are prone to decoherence due to unstable scattering characteristics, making it difficult to obtain more deformation information. In contrast, it is easier to obtain deformation information from exposed surfaces such as built areas and open-pit mines. However, landslides in mining areas often occur near mines, dump sites, tailings ponds, and areas with low vegetation coverage. Therefore, combined analysis of the deformation monitoring results of SBAS-InSAR technology can make a more comprehensive and accurate assessment of subsequent potential landslide risks and formulate scientific response strategies for landslide prevention and control.
From an overall spatial distribution perspective, the Dexing Copper Mine exhibited uneven surface deformation throughout the study period. The northern part of the mining area exhibits a noticeable subsidence trend in the line of sight (LOS) direction. In the southern region, the overall trend of uplift is more apparent, but there are also instances of subsidence in certain local areas. The average annual deformation rate of the Dexing Copper Mine ranges from −338.74 to 80.61 mm/a. The areas showing significant deformation are mainly concentrated near open-pit mines, dump sites, and tailings ponds. Among them, the upward trend in the LOS (Line of Sight) direction is evident in the Tongchang and Fujiawu open-pit mines. Mainly caused by mining activities and other human interventions, these areas are at a higher risk of landslides and require increased monitoring and protective measures. Dump sites and tailings ponds primarily exhibit settlement deformation. However, research indicates that the settlement in these areas is relatively consistent, primarily attributed to the significant natural settlement of the waste soil. The mining area has continuously improved its earth-draining technology based on actual conditions and has strengthened protective projects such as slope stabilization, drainage enhancement, and artificial reclamation. As a result, the likelihood of landslides occurring in these areas is relatively low. In general, conducting a thorough analysis of the deformation monitoring results from the Dexing Copper Mine is crucial for establishing a basis for identifying and extracting potential landslides in the future. It also provides valuable information for managing and ensuring the safety of the mining area.
Based on the deformation results in the study area and using the potential landslide point extraction method described earlier, a total of 3860 potential landslide points were identified. Their distribution is illustrated in Figure 4b, clearly showing that these potential landslide points are mainly concentrated in the open-pit mines, slopes around dump sites, and other areas with relatively low vegetation coverage.

3.2. Information Quantity for Evaluation Factors of Landslide Risk in Mining Areas

The study, based on the statistical analysis of 90% of the extracted potential landslide points participating in the information quantity model, obtained information quantity values for each evaluation factor category, as shown in Table 5. The research results indicate that the following conditions are most conducive to triggering landslides in the Dexing Copper Mine: the elevation greater than 360 m, the slope steeper than 30°, the aspect between 112.5° and 157.5°, the average annual precipitation exceeding 2035 mm, the lithology such as silty shale, shale, dark gray silicalite, etc., NDVI less than 0.25, the distance to rivers greater than 3000 m, the disaster point kernel density between 0.1 and 0.18, the distance to fault zones between 2650 and 4110 m, the distance to roads exceeding 1000 m, and the distance to towns less than 340 m. In general, long-term mining in mining areas has not only led to serious damage to soil and vegetation, but also significantly increased the risk of landslides under conditions of high-intensity rainfall, soft lithology, and low vegetation coverage. At the same time, disturbances from historical disaster points and fault zones, as well as human activities, will intensify the risk of landslide disasters.
It can be seen from the table that the elevation, slope, distance to rivers, and distance to roads within the Dexing Copper Mine are positively correlated with landslide hazards overall. Higher values of elevation, slope, and average annual precipitation in the mining area increase the likelihood of landslides. At the same time, the farther away from rivers and roads, the greater the possibility of landslides. This is because landslide-prone areas, such as open-pit mines and dump sites in mining areas, are typically located far from rivers and roads. In addition, there is a negative correlation between the distance to towns and landslide hazards. The closer certain spatial locations are to cities and towns, the easier it is to trigger landslides. This is because urban population density is relatively high, and there are intensive industrial, agricultural, and urban construction activities, which greatly interfere with human activities. Therefore, under the same conditions, the probability of landslides is higher.
Similarly, influenced by the combined effect of natural geographic elements, indicators such as aspect, average annual precipitation, lithology, NDVI, disaster point kernel density, and distance to fault zones did not show a consistently positive or negative influence on landslide hazards. Instead, they played a role within a specific range. For example, when NDVI is less than 0.25, the information quantity value is the largest. Meanwhile, when analyzed in conjunction with the actual situation of the study area, it is evident that the mining area has undergone extensive artificial reclamation of vegetation. However, the stability of its soil cannot be restored quickly due to long-term mining activities, and it also increases the risk of landslides. Therefore, when the NDVI is in the range of 0.5–0.7, the information quantity value is also higher compared to the other two categories.
In summary, the occurrence of landslides in mining areas is the result of multiple factors. The research does not solely focus on a single factor, but rather on identifying the “optimal combination of factors” that has the greatest impact on the incidence of landslides in mining areas. Finally, comprehensive information quantity accurately characterizes the risk of landslides in the mining area.

3.3. Analysis of Landslide Risk and Validation of Evaluation Results in Mining Areas

3.3.1. Analysis of Landslide Risk in Mining Areas

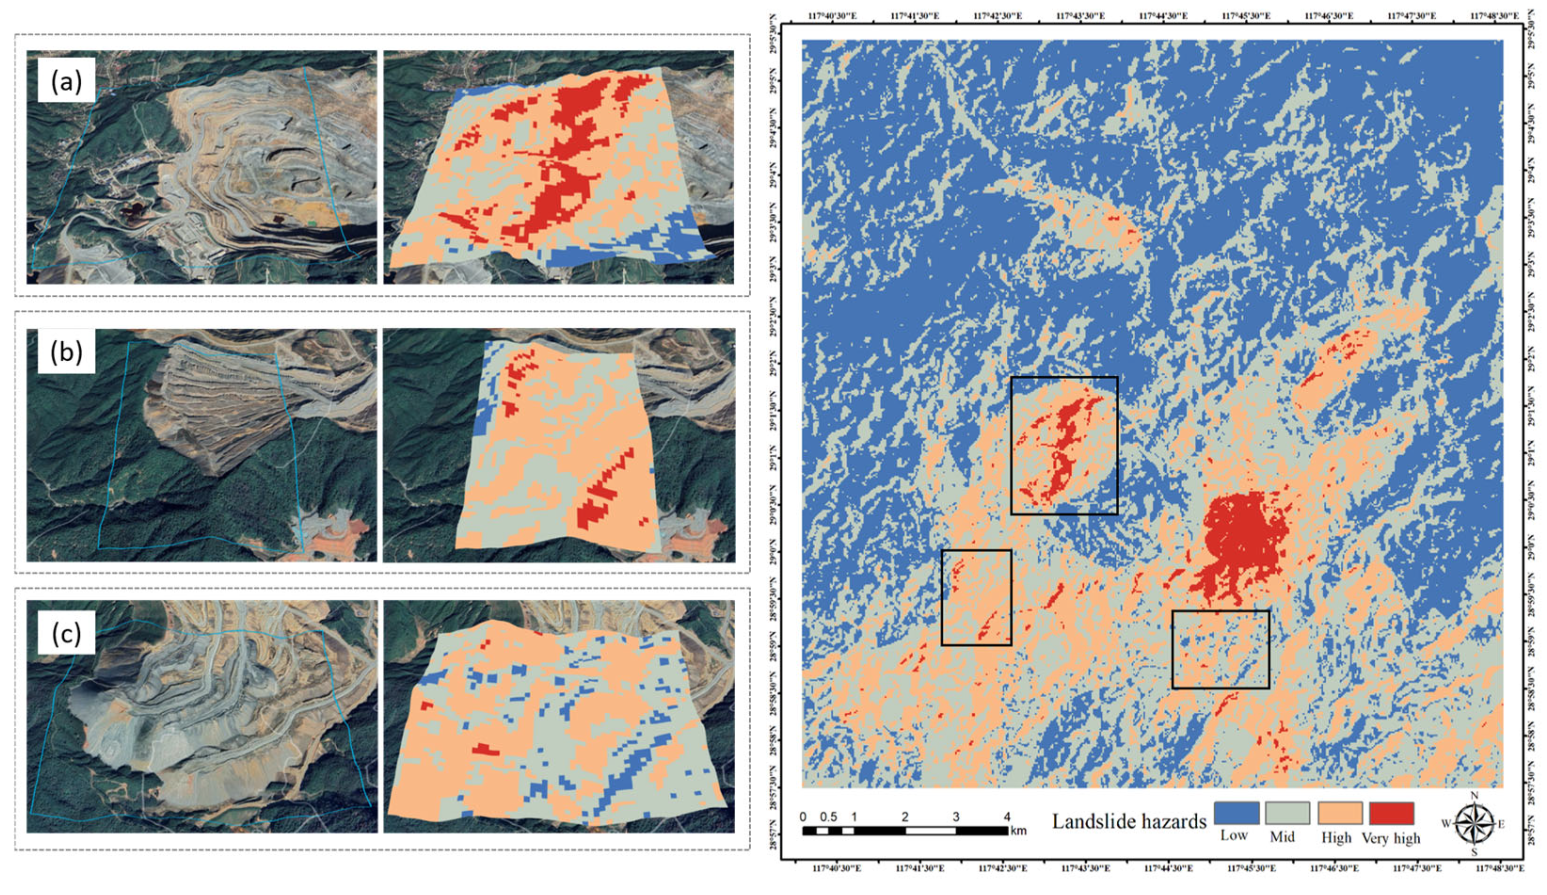
To visualize the spatial distribution of landslide risk, the comprehensive information value was categorized into four levels using high-resolution Google Earth imagery for context (Figure 5). The results reveal that high and very high-risk zones are concentrated around the Fujiawu and Tongchang open-pit mines and their adjacent dump sites. Specifically, the Fujiawu mine exhibits widespread high risk, whereas the Tongchang mine’s risk is primarily confined to specific slope areas (Figure 5a). Similarly, the Fujiawu and Zhujiawu dump sites were identified as critical areas of concern due to their elevated landslide risk, posing a threat to local residents (Figure 5b,c).
These findings have significant implications for targeted risk mitigation. To enhance the stability of the mining area and ensure personnel safety, operational adjustments to mining processes, parameters, and drainage systems are recommended. Key mitigation strategies should include implementing flood prevention measures, optimizing slope angles, and employing structural reinforcements such as retaining walls and anchor piles, coupled with enhanced slope monitoring. Furthermore, based on the spatial risk assessment, we recommend that local authorities implement proactive prevention and control strategies in the identified high-risk zones. This targeted approach is essential for minimizing landslide occurrences within controllable ranges.

3.3.2. Validation of Evaluation Results

The model’s predictive performance was validated using the methodology described in Section 2.3.4. As shown by the Receiver Operating Characteristic (ROC) curve in Figure 6, the model achieved an Area Under the Curve (AUC) of 0.871, demonstrating its high accuracy and reliability.

4. Discussion

This study introduces a quantitative method for identifying landslide hazards by integrating SBAS-InSAR with multi-source data. Applied to the Dexing Copper Mine, a representative mountainous open-pit mine, the method identified 3860 potential landslide points. The spatial distribution of these points is strongly correlated with major mining pits and dump sites, such as Fujiawu and Zhujiawu, confirming the method’s effectiveness in capturing slope instability risks induced by high-intensity mining. Previous studies, for instance, Su et al. [31]. who used SBAS-InSAR technology to complete a comprehensive landslide inventory of the Hunza Valley in Pakistan, have focused on regional landslide cataloging, which is of great significance for regional hazard surveys. In contrast, the core of our study lies in advancing the research level from “hazard identification” to “comprehensive risk assessment.” This research approach is also consistent with the current trend that emphasizes integrated risk management. For specific areas with intense engineering disturbances, such as the Dexing Copper Mine, merely completing a landslide inventory has limited guiding significance for risk control. By integrating multi-source data, our study not only deepens the understanding of the causal mechanisms of landslides in mining areas but also effectively improves the accuracy of the hazard assessment by differentiating deformation signals of different origins.
Nevertheless, this study still has several limitations at the data and methodological levels. In terms of InSAR data sources, the ascending C-band data used in this study has inherent limitations in its line-of-sight (LOS) observation geometry and its penetration capability in vegetated areas; future work could improve upon this by integrating both ascending and descending orbit data and by applying L-band SAR imagery. Regarding the extraction of potential landslides, the current method, which primarily relies on deformation thresholds, has room for optimization; its accuracy could be enhanced by incorporating high-resolution imagery or machine learning techniques [32]. The Information Value model adopted in this study also has significant limitations in terms of regional applicability. In the future, more generalizable algorithms, such as deep learning [33,34], could be introduced to adapt to the complex geological backgrounds of different mining areas.

5. Conclusions

This study successfully developed and validated a quantitative risk assessment model for landslide hazards in mountainous open-pit mining environments by integrating SBAS-InSAR with multi-source geospatial data. The main conclusions are as follows:
(1)
The model successfully identified 3860 potential landslide points within the Dexing Copper Mine. The very high-risk and high-risk zones are primarily concentrated in the open-pit mines and their surrounding dump sites, particularly the Fujiawu and Zhujiawu dump sites, revealing a strong correlation between mining activities and surface instability.
(2)
The model’s effectiveness was quantitatively validated, achieving an Area Under the Curve (AUC) value of 0.871. This demonstrates the model’s high accuracy and reliability for risk assessment in complex mining environments.
(3)
The core contribution of this research is the advancement of landslide hazard assessment in mining areas from traditional “hazard identification” to a “comprehensive quantitative risk assessment” through the fusion of multi-source data, effectively addressing the limitations of single-technology approaches.
(4)
While the model demonstrates strong performance, we acknowledge several limitations regarding InSAR’s observation geometry, the landslide extraction methodology, and the model’s regional applicability. Future research could further enhance its capabilities by incorporating more advanced algorithms, such as machine learning.

Author Contributions

Conceptualization, S.Z. and X.G.; methodology, S.Z., X.L. and H.L.; software, S.Z., X.L. and H.L.; validation, S.Z., X.G. and M.D.; formal analysis, S.Z.; investigation, S.Z.; resources, S.Z.; data curation, S.Z.; writing—original draft preparation, S.Z.; writing—review and editing, S.Z., X.L. and H.L.; visualization, S.Z.; supervision, S.Z.; project administration, S.Z.; funding acquisition, X.L. All authors have read and agreed to the published version of the manuscript.

Funding

This work was supported by the Natural Science Foundation of Jiangxi Province [grant number 20232ACB203025] and the Evaluation and early warning simulation of ecological carrying capacity of rare earth mines based on multimodal data [grant number JXYJY2025007].

Institutional Review Board Statement

Not applicable.

Informed Consent Statement

Not applicable.

Data Availability Statement

The original contributions presented in the study are included in the article; further inquiries can be directed at the corresponding author.

Conflicts of Interest

The authors declare no conflicts of interest.

References

  1. Hu, R.-Z.; Chen, W.T.; Xu, D.-R.; Zhou, M.-F. Reviews and new metallogenic models of mineral deposits in South China: An introduction. J. Asian Earth Sci. 2017, 137, 1–8. [Google Scholar] [CrossRef]
  2. Li, H.; Liu, Y.; Li, Q.; Wang, X. Analysis of ecological security pattern of southern rare earth mining area based on MCR model. Sci. Geogr. Sin. 2020, 40, 989–998. [Google Scholar] [CrossRef]
  3. Zhang, L.; Lu, Z.H.; Tang, S.Y.; Zhang, M.; Zhang, R.T.; Huang, Y.K.; Shang, Z. Slope vegetation characteristics and community stability at different restoration years of open-pit coal mine waste dump. Acta Ecol. Sin. 2021, 41, 5764–5774. [Google Scholar] [CrossRef]
  4. Si, G.; Cai, W.; Wang, S.; Li, X. Prediction of relatively high-energy seismic events using spatial–temporal parametrisation of mining-induced seismicity. Rock. Mech. Rock. Eng. 2020, 53, 5111–5132. [Google Scholar] [CrossRef]
  5. Zhou, W.; Yang, K.; Bai, Z.K.; Cheng, H.X.; Liu, F. The development of topsoil properties under different reclaimed land uses in the Pingshuo opencast coalmine of Loess Plateau of China. Ecol. Eng. 2017, 100, 237–245. [Google Scholar] [CrossRef]
  6. Gao, Y.; Wang, J.; Zhang, M.; Li, S. Measurement and prediction of land use conflict in an opencast mining area. Resour. Policy 2021, 71, 101999. [Google Scholar] [CrossRef]
  7. Hu, Q.; Cui, X.; Liu, W.; Feng, R.; Ma, T.; Li, C. Quantitative and dynamic predictive model for mining-induced movement and deformation of overlying strata. Eng. Geol. 2022, 311, 106876. [Google Scholar] [CrossRef]
  8. Li, B.; Liu, Z.; Wu, Q.; Long, J.; Liu, P.; Li, M. Prediction model for safe width of rock mass preventing water inrush from fault in excavation roadway and influencing factors analysis: A case study of the Xintian Coal Mine. Min. Metall. Explor. 2023, 40, 1225–1235. [Google Scholar] [CrossRef]
  9. Li, B.; Wu, H.; Liu, P.; Fan, J.; Li, T. Construction and application of mine water inflow prediction model based on multi-factor weighted regression: Wulunshan Coal Mine case. Earth Sci. Inf. 2023, 16, 1879–1890. [Google Scholar] [CrossRef]
  10. Zhao, Z.; Wang, L.; Bai, Z.; Pan, Z.; Wang, Y. Development of population structure and spatial distribution patterns of a restored forest during 17-year succession (1993–2010) in Pingshuo opencast mine spoil, China. Environ. Monit. Assess. 2015, 187, 431. [Google Scholar] [CrossRef]
  11. Liu, B.; Ge, D.; Li, M.; Zhang, L.; Wang, Y.; Wang, Y. Using ground-based InSAR to evaluate the stability of an open-pit slope under blasting operation. J. Remote Sens. 2017, 22, 139–145. [Google Scholar] [CrossRef]
  12. Zhang, P.; Guo, Z.; Guo, S.; Xia, J. Land subsidence monitoring method in regions of variable radar reflection characteristics by integrating PS-InSAR and SBAS-InSAR techniques. Remote Sens. 2022, 14, 3265. [Google Scholar] [CrossRef]
  13. Zhang, Y.; Li, Y.; Dong, J.; Fan, Q.; Che, B.; Zhang, L.; ZHhou, Y.; Liao, M. Landslide hazard detection in Markam with time-series InSAR analyses. Natl. Remote Sens. Bull. 2021, 23, 987–996. [Google Scholar] [CrossRef]
  14. Berardino, P.; Fornaro, G.; Lanari, R.; Sansosti, E. A new algorithm for surface deformation monitoring based on small baseline differential SAR interferograms. IEEE Trans. Geosci. Remote Sens. 2002, 40, 2375–2383. [Google Scholar] [CrossRef]
  15. Guo, R.; Li, S.; Chen, Y.; Yuan, L. A method based on SBAS-InSAR for comprehensive identification of potential goaf landslide. J. GeoInf. Sci. 2019, 21, 1109–1120. [Google Scholar] [CrossRef]
  16. Cheng, T.; Ge, C.; Tao, S.; Liu, Q.; Gao, Z. Small baseline DInSAR algorithm and its application. Sci. Surv. Map. 2015, 40, 96–99+126. [Google Scholar] [CrossRef]
  17. Wubalem, A.; Meten, M. Landslide susceptibility mapping using information value and logistic regression models in Goncha Siso Eneses area, northwestern Ethiopia. SN Appl. Sci. 2020, 2, 807. [Google Scholar] [CrossRef]
  18. Gao, B.; He, Y.; Zhang, L.; Yao, S.; Yang, W.; Chen, Y.; He, X.; Zhao, Z.; Chen, H. Dynamic evaluation of landslide susceptibility by CNN considering InSAR deformation: A case study of Liujiaxia reservoir. Chin. J. Rock Mech. Eng. 2023, 42, 450–465. [Google Scholar] [CrossRef]
  19. Xu, Y.; Li, T.; Tang, X.; Zhang, X.; Fan, H.; Wang, Y. Research on the applicability of DInSAR, stacking-InSAR and SBAS-InSAR for mining region subsidence detection in the datong coalfield. Remote Sens. 2022, 14, 3314. [Google Scholar] [CrossRef]
  20. Yao, J.; Yao, X.; Liu, X. Landslide detection and mapping based on SBAS-InSAR and PS-InSAR: A case study in Gongjue County, Tibet, China. Remote Sens. 2022, 14, 4728. [Google Scholar] [CrossRef]
  21. Narayan, A.B.; Tiwari, A.; Dwivedi, R.; Dikshit, O. Persistent scatter identification and look-angle error estimation using similar time-series interferometric pixels. IEEE Geosci. Remote Sens. Lett. 2017, 15, 147–150. [Google Scholar] [CrossRef]
  22. Cigna, F.; Bateson, L.B.; Jordan, C.J.; Dashwood, C. Simulating SAR geometric distortions and predicting Persistent Scatterer densities for ERS-1/2 and ENVISAT C-band SAR and InSAR applications: Nationwide feasibility assessment to monitor the landmass of Great Britain with SAR imagery. Remote Sens. Environ. 2014, 152, 441–466. [Google Scholar] [CrossRef]
  23. Kayastha, P.; Dhital, M.R.; De Smedt, F. Application of the analytical hierarchy process (AHP) for landslide susceptibility mapping: A case study from the Tinau watershed, west Nepal. Comput. Geosci. 2013, 52, 398–408. [Google Scholar] [CrossRef]
  24. Zhang, J.; Li, H.; Huang, D.; Wang, X. Evaluation study of ecological resilience in southern red soil mining areas considering rare earth mining process. Sustainability 2023, 15, 2258. [Google Scholar] [CrossRef]
  25. Zhang, D.; Wei, K.; Yao, Y.; Yang, J.; Zheng, G.; Li, Q. Capture and prediction of rainfall-induced landslide warning signals using an attention-based temporal convolutional neural network and entropy weight methods. Sensors 2022, 22, 6240. [Google Scholar] [CrossRef] [PubMed]
  26. Zhu, F.; Zhang, H. “AHP +entropy weight method” based CW-TOPSIS model for predicting rockburst. China Saf. Sci. J. 2017, 27, 128–133. [Google Scholar] [CrossRef]
  27. Wei, F.; Gao, K.; Hu, K.; Li, Y.; Gardner, J.S. Relationships between debris flows and earth surface factors in Southwest China. Environ. Geol. 2008, 55, 619–627. [Google Scholar] [CrossRef]
  28. Zhang, J.; Yin, K.; Wang, J.; Liu, L.; Huang, F. Evaluation of landslide susceptibility for Wanzhou district of Three Gorges Reservoir. Chin. J. Rock Mech. Eng. 2016, 35, 284–296. [Google Scholar] [CrossRef]
  29. Du, Y.; Peng, J.; Zhao, S.; Hu, Z.; Wang, Y. Ecological risk assessment of landslide disasters in mountainous areas of Southwest China: A case study in Dali Bai Autonomous Prefecture. Acta Geogr. Sin. 2016, 71, 1544–1561. [Google Scholar] [CrossRef]
  30. Cantarino, I.; Carrion, M.A.; Goerlich, F.; Martinez Ibañez, V. A ROC analysis-based classification method for landslide susceptibility maps. Landslides 2019, 16, 265–282. [Google Scholar] [CrossRef]
  31. Su, X.; Zhang, Y.; Meng, X.; Rehman, M.U.; Khalid, Z.; Yue, D. Updating inventory, deformation, and development characteristics of landslides in Hunza Valley, NW Karakoram, Pakistan by SBAS-InSAR. Remote Sens. 2022, 14, 4907. [Google Scholar] [CrossRef]
  32. Dai, M.; Li, H.; Long, B.; Wang, X. Quantitative Identification Method for Landslide Hazard in Rare Earth Mining Areas Based on Multi-Source Data Integration. J. China Univ. Min. Technol. 2024, 53, 198–210. [Google Scholar] [CrossRef]
  33. Ngo, P.T.T.; Panahi, M.; Khosravi, K.; Ghorbanzadeh, O.; Kariminejad, N.; Cerda, A.; Lee, S. Evaluation of deep learning algorithms for national scale landslide susceptibility mapping of Iran. Geosci. Front. 2021, 12, 505–519. [Google Scholar] [CrossRef]
  34. Chen, C.; Dong, B.; Lin, J.; Shen, Z.; Fang, L.; Weng, Y.; Wang, K. Bayesian deep learning framework for updating landslide susceptibility assessment based on epistemic uncertainty with InSAR augmented samples. J. Rock Mech. Geotech. Eng. 2025, in press. [Google Scholar] [CrossRef]
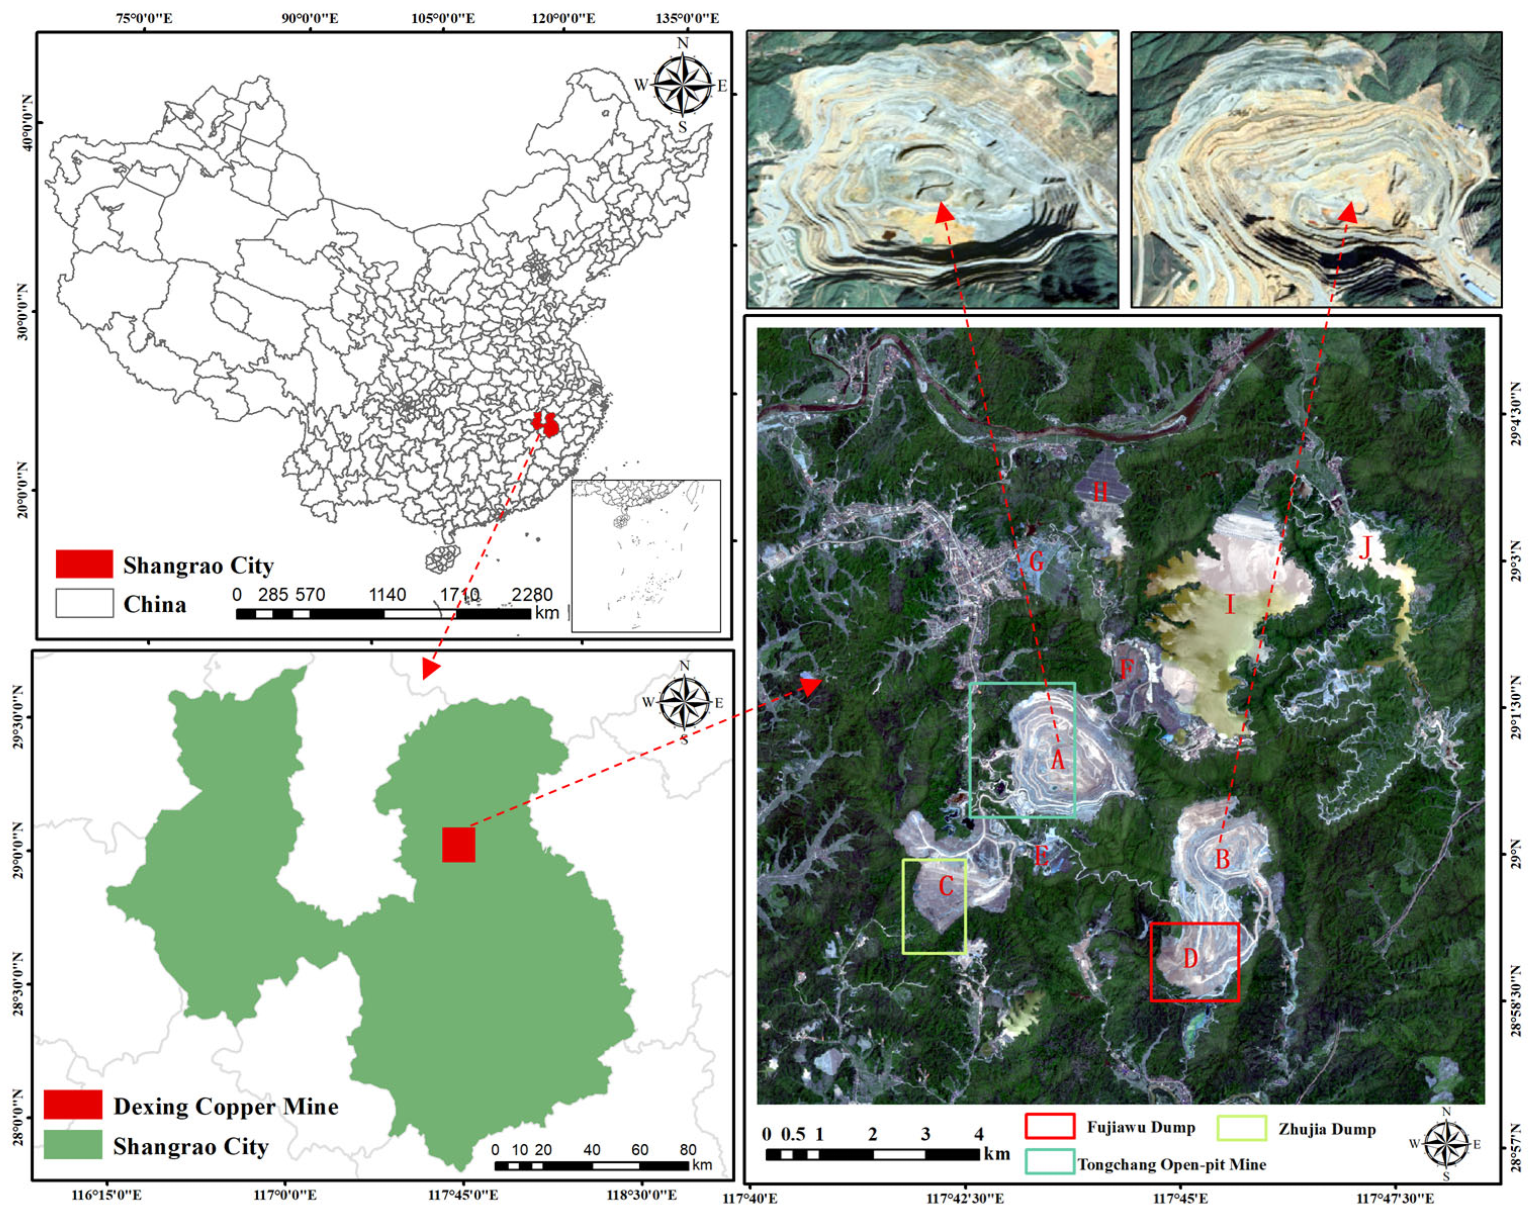
Figure 1. Overview of the study area. The base map is a false-color composite image based on Sentinel-2 data. The letters denote specific locations: (A) Tongchang open-pit mine; (B) Fujiawu open-pit mine; (C) Zhujia dump site; (D) Fujiawu dump site; (E) Yangtaowu dump site; (F) Xiyuan dump site; and (GJ) 1, 2, 4, and 5# tailings ponds, respectively.
Applsci 15 12051 g001
Figure 2. Flowchart of SBAS-InSAR-Based Potential Landslide Identification and Disaster Assessment Technology for Mining Areas.
Applsci 15 12051 g002
Figure 3. Image time-position and time-baseline plots: (a) image time-position plots, (b) image time-baseline plots.
Applsci 15 12051 g003
Figure 4. Annual average deformation rate and distribution of potential landslide points in the study area: (a) map of annual average deformation rate in the study area, (b) distribution map of potential landslide points in the study area. The deformation map (a) was generated using ENVI/SARscape (Version 5.6), and the potential landslide points (b) were subsequently extracted using ArcGIS (Version 10.8).
Applsci 15 12051 g004
Figure 5. Spatial differentiation of landslide risk of the Dexing copper mine: (a) slope area of the Tongchang open-pit mine, (b) slope area of the Zhujia dump site, (c) Slope area of the Fujiawu dump site. The low, mid, high, and very high-risk areas correspond to slope angles of 14.34°, 14.35–19.01°, 19.02–22.7°, and 22.71–28.18°, respectively. The map was generated using the spatial analysis tools in ArcGIS 10.8.
Applsci 15 12051 g005
Figure 6. ROC curves of the landslide hazard information content model used for performance evaluation. The units on both the horizontal and vertical axes are dimensionless (-).
Applsci 15 12051 g006
Table 1. Dataset Used for Landslide Hazard Assessment Based on SBAS-InSAR in the Dexing Copper Mining Area.
Data Type (-)Data Description (-)Spatial Resolution/mData Source (-)
Sentinel-1AThe deformation information was obtained using this data. Details of the data are shown in Table 2.5 × 20Alaska Satellite Facility
(https://asf.alaska.edu/, accessed on 27 January 2024)
POD Ephemeris data--
DEMThe data product used was ASTER GDEM V2, which was utilized to calculate elevation, slope, and aspect indicators.30Geospatial Data Cloud
(http://www.gscloud.cn/, accessed on 2 February 2024)
Precipitation data China’s monthly precipitation dataset, with a 1 km resolution, from 2011 to 2020, was used to calculate the average annual precipitation indicator.1000National Earth System Science Data Center
(http://www.geodata.cn/, accessed on 2 February 2024)
Lithological data Lithological data were used to calculate the lithology indicator.--China 1:2.5 million Geological Map Vector File
Fault data Fault data was used to calculate the indicator for distance to fault zones.--
Landsat 8 OLI The images from five periods, namely 16 November 2019, 20 February 2020, 8 April 2020, 26 March 2021, and 7 December 2021, were used to calculate the normalized difference.
vegetation index (NDVI) indicator.
30United States Geological Survey (https://www.usgs.gov/, accessed on 5 February 2024)
Historical geological disaster data The study area consisted of four types of disasters: landslides, slope failures, debris flows, and ground subsidence. These types were utilized to calculate the indicator for disaster point kernel density.--Geological Disaster Prevention and Control Related Maps
Road and river data These data were used to calculate the indicators for distance to roads and distance to rivers.--Open Street Map
(https://www.openstreetmap.org, accessed on 5 February 2024)
Land cover dataThe land cover data in 2021 was used to calculate the indicator for distance to towns.10Sentinel-2 Land Cover Explorer
(https://livingatlas.arcgis.com/landcoverexplorer/, accessed on 7 February 2024)
Table 2. The parameter information of Sentinel-1A in the study area.
ParameterCorresponding Value
Orbital directionAscending
Orbit number142
Data modeIW mode
Polarization modeVV
Incident angle/(°)36.64
Flight direction angle/(°)−12.21
Flight azimuth angle/(°)347.79
Image Acquisition Time6 November 2019–7 November 2021
Data volume/scene62
Table 3. Evaluation index system of landslide risk in Dexing Copper Mine.
Target Layer (-)Criteria Layer (-)Index Layer (-)Subjective
Weight (-)
Objective
Weight (-)
Combined
Weight (-)
Trend (-)
Evaluation index system of landslide risk in Dexing Copper MineGeographical environmentElevation0.06230.08950.0731+
Slope0.22580.04490.1539+
Aspect0.20930.09680.1646+
Average annual precipitation0.08280.06760.0768+
Lithology0.11600.23240.1623+
NDVI0.05090.14010.0863+
Distance to rivers0.02540.08790.0502+
Geological structureDisaster point kernel density0.15240.07640.1222+
Distance to fault zones0.03480.06810.0480+
Human activitiesDistance to roads0.01900.09090.0476+
Distance to towns0.02130.00540.0150+
Note: objective weights are determined using the EWM, with sample values for each indicator being the normalized value obtained from subsequent evaluation models. A higher value indicates a greater landslide hazard. Therefore, all indicators are considered positive indicators.
Table 4. Analytic Hierarchy Process (AHP) Evaluation Indicator Judgment Matrix.
C1C2C3C4C5C6C7C8C9C10C11
C11 1 5 1 5 1 2 1 3 23 1 3 254
C251143572687
C351142562577
C42 1 5 1 4 1 1 2 24 1 3 365
C53 1 3 1 2 2135 1 2 465
C6 1 2 1 5 1 5 1 2 1 3 12 1 4 244
C7 1 3 1 7 1 6 1 4 1 5 1 2 1 1 6 1 2 21
C83 1 2 1 2 32461566
C9 1 2 1 6 1 5 1 3 1 4 1 2 2 1 5 122
C10 1 5 1 8 1 7 1 6 1 6 1 4 1 2 1 6 1 2 11
C11 1 4 1 7 1 7 1 5 1 5 1 4 1 1 6 1 2 11
Note: The matrix was constructed based on expert judgments using the 1–9 Saaty scale. The codes C1-C11 represent Elevation, Slope, Aspect, Average annual precipitation, Lithology, NDVI, Distance to rivers, Disaster point kernel density, Distance to fault zones, Distance to roads, and Distance to towns, respectively.
Table 5. Results of information quantity for evaluation factors of landslide risk in Dexing Copper Mine.
Evaluation
Factor (-)
Factor
Category
Information Quantity (-)Evaluation
Factor (-)
Factor
Category
Information Quantity (-)
Elevation
/m
<130−0.4963NDVI<0.250.7011
130~240−0.20090.25~0.5−0.2747
240~360−0.06540.5~0.7−0.1313
>3601.27740.7~1−0.2769
Slope
/(°)
0~10−0.5271Distance to rivers
/m
0~1000−1.0734
10~20−0.11131000~2000−0.8368
20~300.13602000~3000−0.1025
>300.6357>30001.0091
Aspect
/(°)
−1 (Horizontal)0.0000Disaster point kernel density0~0.04−1.5767
0~22.5, 337.5~360 (North)−1.15090.04~0.1−1.0694
22.5~67.5 (Northeast)0.49380.1~0.180.9417
67.5~112.5 (East)0.6864>0.18−0.5506
112.5~157.5 (Southeast)1.0011Distance to fault zones
/m
0~1260−1.0995
157.5~202.5 (South)0.58781260~26500.0791
202.5~247.5 (Southwest)0.00002650~41100.7705
247.5~292.5 (West)0.0000>4110−0.8522
292.5~337.5 (Northwest)0.0000Distance to roads
/m
0~200−0.4542
Average annual precipitation
/mm
<2015−0.9460200~600−0.1407
2015~2025−1.4408600~10000.1707
2025~20350.3787>10001.1634
>20350.8512Distance to towns
/m
0~3400.0796
LithologyTuffaceous slate, sedimentary tuff, silty slate, siltstone, etc.−0.1347340~7700.0072
Ophiolite, spilite, greenschist, siliceous rock, etc.0.5055770~1430−0.0658
Silty shale, shale, dark gray silicalite, etc.0.6398>1430−1.1944
Disclaimer/Publisher’s Note: The statements, opinions and data contained in all publications are solely those of the individual author(s) and contributor(s) and not of MDPI and/or the editor(s). MDPI and/or the editor(s) disclaim responsibility for any injury to people or property resulting from any ideas, methods, instructions or products referred to in the content.