1. Introduction
Transmission Electron Microscopy (TEM) remains the definitive modality for nanoscale morphological, compositional, and crystallographic characterization [
1,
2,
3]. The exceptional capital expenditure and operational complexity associated with TEM installations, however, render microscope time a critically limited resource in academic and national research facilities [
4]. Electron sources are broadly categorized as thermionic (W or LaB
6) or field-emission (FE) [
5]; the former operate at modest vacuum (10
−3–10
−4 Pa) [
6] and achieve base pressure within 20–30% of the pump-down interval required by FE systems [
7], thereby permitting the rapid sequential loading of multiple specimens and making them the instrument of choice for high-throughput preliminary screening. Conversely, the micron-scale filament tip and low brightness intrinsic to thermionic emitters [
8] preclude sub-angstrom imaging, and the corresponding microscopes are typically configured with minimal analytical attachments, constraining their capacity for comprehensive micro-analysis. Additionally, the restricted pole-piece gap characteristic of thermionic columns limits both the specimen tilt range and the solid angle accessible to energy-dispersive X-ray spectrometers (EDS) and selected-area electron diffraction (SAED) optics, further diminishing their utility for rigorous materials surveys.
Field-emission TEM, exploiting a sharper filament tip, high brightness, and elevated accelerating voltage, delivers a superior spatial resolution, thereby constituting the preferred platform for multi-modal analytical investigations [
9,
10]. The ultra-high vacuum prerequisite (<10
−6 Pa), however, necessitates extended pump-down cycles that severely compromise throughput when multiple specimens are processed.
To maximize analytical efficiency, a hierarchical workflow is ubiquitously adopted: specimens are initially surveyed at low magnification in fast-cycling thermionic TEM or Scanning Electron Microscopy (SEM) systems, and only those regions adjudged worthy of detailed investigation are transferred to high-resolution analytical FE-TEM. A major impediment to implementing this strategy is the inability to rapidly and accurately relocate the nanoscale region of interest after the grid has been removed from one instrument and reloaded into a second analytical platform. Operators routinely expend from several tens of minutes to hours re-navigating the grid, resulting in the substantial loss of valuable microscope time. Consequently, the development of a vendor-neutral, model-independent, and nanoscale-precision repositioning protocol that enables robust cross-instrument ROI retrieval is urgently required.
Once established, this repeated microregion characterization protocol will not only enable the time-resolved re-examination of nanoscale ROIs in the TEM, revealing temporal evolution pathways, but also facilitate correlative imaging between TEM and other micro-analytical platforms (e.g., SEM, AFM), thereby acquiring multidimensional, complementary information from the same micro-/nano-volume. Such integrative capability is essential for advancing our fundamental understanding of the microscopic world [
11,
12].
Beyond immediate throughput gains, such a universal micro-area referencing framework would facilitate repeatable and fully traceable analyses of identical nanoscale regions, thereby enhance data reliability and underpin scientific reproducibility [
13]. This capability is equally invaluable for operator training and for safeguarding research integrity through auditable experimental workflows.
To address these challenges, this paper proposes the development of a microregion relocalization technique, which involves the repeated characterization of the same microregion on a single sample, enabling different research teams worldwide to conduct analyses on identical microscopic areas within their respective laboratories. By sharing and comparing the data obtained from these analyses, researchers can collaboratively verify or refute previous findings. This method not only promotes a culture of transparency and collaboration in scientific research, but also mitigates the risk of data fabrication.
Furthermore, this technique fosters direct cooperation among global research teams, reducing discrepancies and enhancing consensus in the field of micro-/nano-analysis. By ensuring that all parties are working with the same data from the same sample, the proposed method aims to streamline scientific discourse and accelerate the pace of discovery. Ultimately, this approach seeks to restore trust in academic research, ensuring that scientific advancements are built on a foundation of reliable and reproducible data.
Repeated microregion characterization techniques have become indispensable tools in modern materials science, leveraging advanced microscopy methods such as Optical Microscopy (OM), Scanning Electron Microscopy (SEM), Atomic Force Microscopy (AFM), and Transmission Electron Microscopy (TEM) [
14,
15], where OM-, AFM-, and SEM-based repeated microregion characterization methods are highly automated, which enables users to obtain high-precision correlation analysis results with efficiency and ease [
16,
17]. However, TEM-based repeated microregion characterization remains comparatively cumbersome and unfriendly to users. Currently available TEM equipped with built-in navigation allow for repeated observations of a specimen only within a single loading cycle; the pre-calibrated coordinates are lost as soon as the specimen is removed and re-inserted. Inter-instrument correlative operation, moreover, presupposes that every participating microscope runs a compatible navigation software package. For the large fleet of non-navigable TEMs, repeated microregion characterization still relies on operator-made fiduciary marks or grid-scratching followed by manual image matching. The methods often rely on manual image alignment and comparison to achieve correlated and repeated imaging of the same microregion [
18], which imposes a significant workload on researchers and may introduce potential artificial errors. As a result, TEM-based repeated microregion imaging has yet to fully meet the growing demand in advanced materials research.
Since samples prepared by ion milling, electrolytic twin-jet thinning, ultramicrotomy, or focused ion beam (FIB) processing are typically large enough to be easily identified under low-magnification (LowMag) TEM observation, the micro-area localization approach discussed in this paper is only applicable to observation targets at the micrometer or nanometer scale.
Positioning methodologies in TEM were originally conceived to solve the “find-and-relocate” problem inherent in correlative light–electron microscopy (CLEM). The earliest implementations emerged in the life sciences, and by the mid-1980s, commercial microscope–microscope hybrids began to appear [
19,
20,
21,
22,
23]. In a kind of CLEM instrument, the electron column and the light microscope are physically separated, and the specimen must be translated or rotated inside the chamber so that the ROI is brought sequentially under each detector. Relocation in this architecture is achieved by pre-loading the stage trajectory recorded during the initial characterization—i.e., by storing and replaying the internal stage coordinates [
19]. Consequently, the coordinate set is embedded within, and valid only for, the specific hardware and software suite in which it was generated.
Evidently, the stringent instrumental prerequisites of built-in coordinate mapping severely restrict its widespread adoption. To render correlative CLEM more accessible, fiducial-based navigation has been introduced. Micromachined markers that are simultaneously visible in both the optical and electron beams are patterned onto the support, and the vector relationship between these landmarks and the region of interest (ROI) is exploited for subsequent re-localization [
20,
21]. The attainable accuracy is therefore dictated by the geometric precision of the fiducials themselves. Focused ion beam (FIB) milling, by virtue of its nanoscale resolution and arbitrary site-specific patterning capability, has become the prevailing fabrication route [
22,
23]. Nevertheless, the fabrication cost scales exponentially with the required tolerance, rendering FIB-patterned high-precision markers prohibitively expensive for routine large-scale studies.
Consequently, we sought to develop a low-cost micro-area referencing protocol that leverages legacy equipment already installed in most TEM facilities. The strategy retains the standard metal grid as the specimen support and relies on existing stage-control firmware to achieve ROI retrieval, thereby eliminating the need for costly micromachining while maintaining nanoscale relocation accuracy.
There are currently two main strategies for Region of Interest (ROI) positioning in TEM. Both strategies adopted the TEM metal grid as a sample container, and this grid is an ultra-thin metal cell (with a thickness from 10 to 30 μm) covered with a soft and flat supporting membrane on one side. The machining accuracy of the commercial metal cell is generally at the level of ten microns [
24].
The first method involves using the instrument’s built-in coordinate system to label the ROIs and specific positions (mentioned as label points herein) of the TEM sample holder and then performing a coordinate transformation algorithm according to the method reported in ref. [
25], resulting in common metal grids.
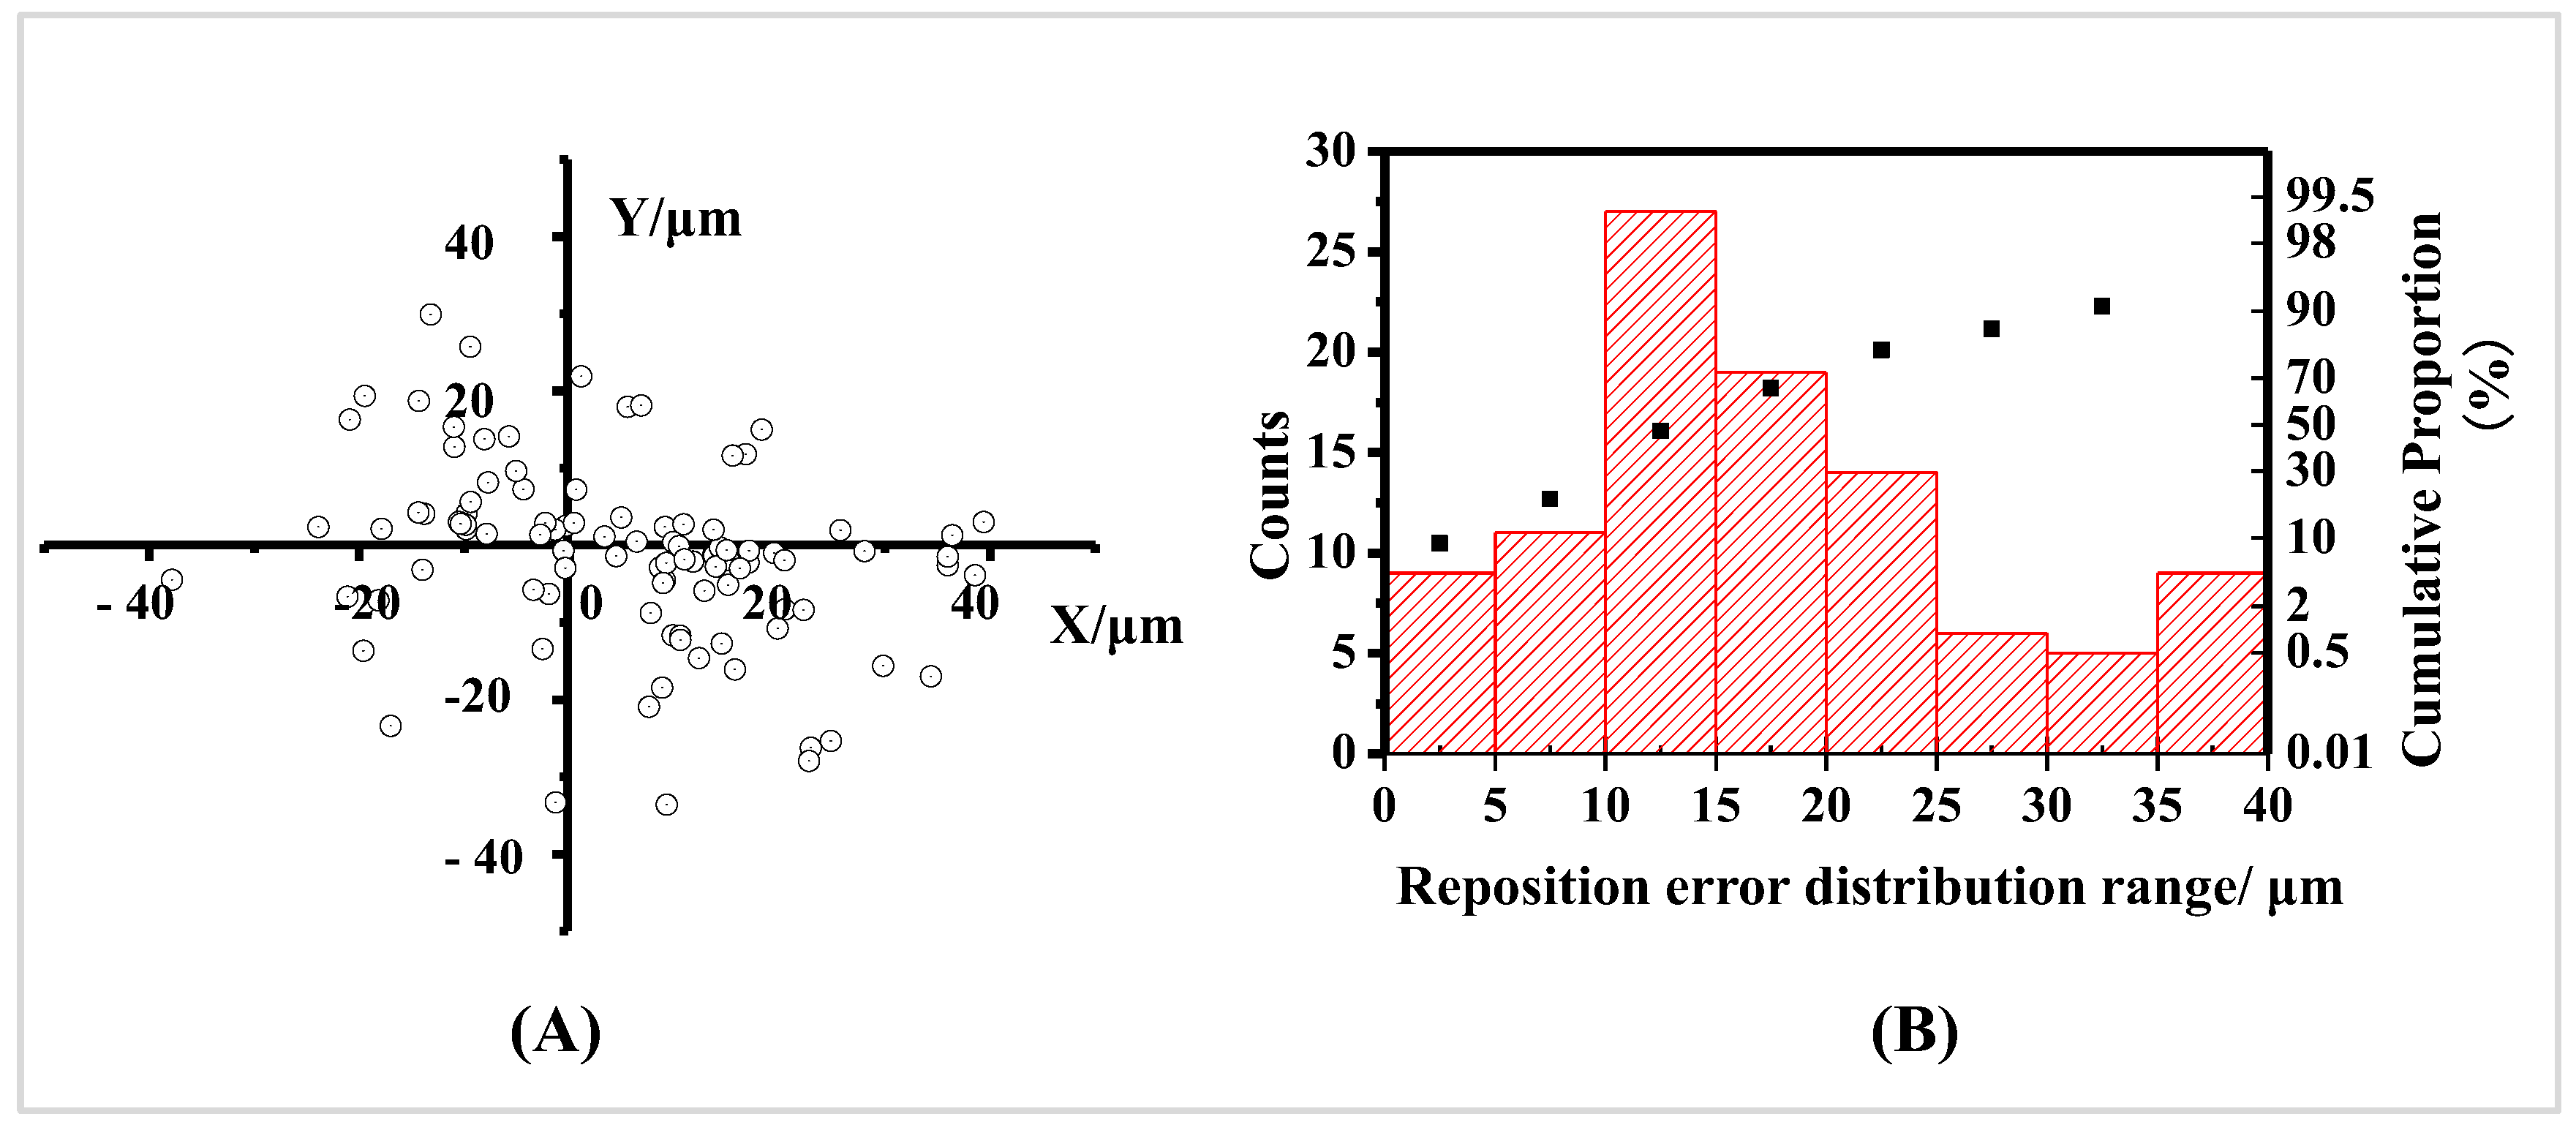
In the experiments, the first positioning strategy was carried out. Details of the positioning operation and the statistics method of the positioning error distribution range are listed in the
Supplementary Information Part 1. This distribution range for Au nanorod materials (with an average length of 100 nm and average diameter of 10 nm) by the first positioning method was 44.68 μm (see
Figure 1 and
Table 1), which cannot achieve the goal of retrieving ROIs at the scale of nanometers. There are two main reasons for the large positioning error with this strategy: One is that the machining accuracy of the metal is insufficient, resulting in an inconsistency in the true positions of the identically labeled points during the initial observation and subsequent retrieval [
26]. The other reason is that the images obtained in TEM are two-dimensional projections of three-dimensional images [
27]. When the focal height in the Z-direction varies, the projections differ accordingly [
28]. In the first positioning strategy, the corners of each cell are selected as label points. There is no definite scale in the Z-direction, which makes it impossible to record and calculate the coordinates in this direction [
29], so only the coordinates in the x and y directions can be calculated, which leads to a significant positioning error with this method.
The second method relies on the signs of the commercial coordinate grids to indicate the positions of the ROIs. The commercial coordinate grids are a kind of metal grid marked by printing prominent signs (usually combinations of letters and numbers) at the intersections of the standard TEM sample-holder grids, which helped to locate the specific positions.
The steps of the second method are listed as follows:
First, load the sample and execute a normal characterization process of an ROI. After that, measure and record the distance from the ROI to its two nearest adjacent metal ribbons on the grid.
In the retrieving process, identify the cell containing the ROI based on the signs of the coordinate grid in LowMag mode. Then, identify the same two adjacent metal ribbons that were used to measure the distance previously. Subsequently, use the recorded distance data from the initial observation to pinpoint the location of the ROI. Finally, switch the microscope to Mag mode and search for the ROI in the field of view.
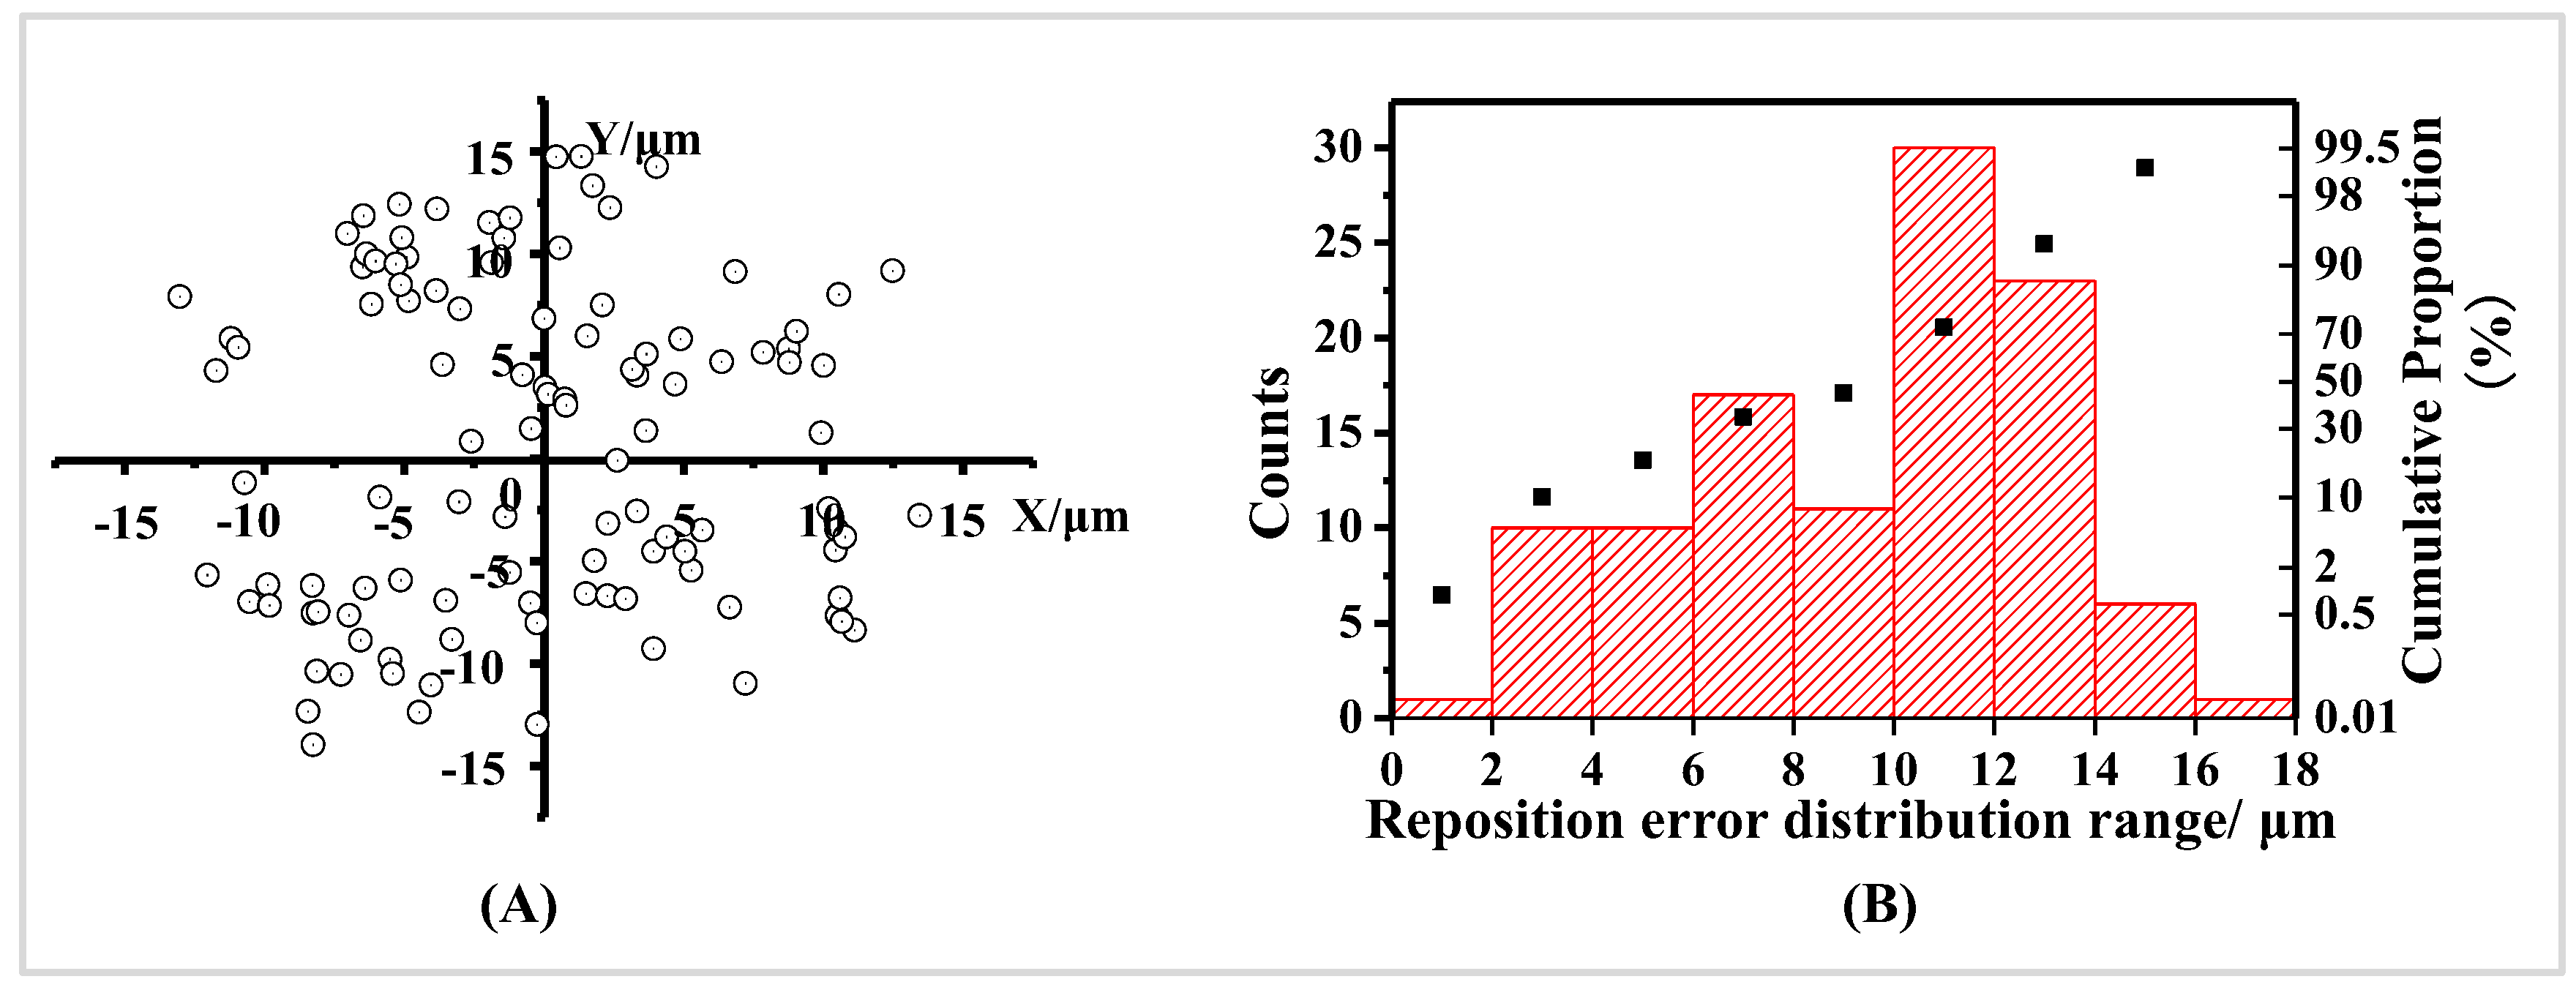
The error distribution for positioning using the second strategy was statistically analyzed in our experiment (see
Figure 2). The positioning process in detail and the statistical method of the positioning error distribution range are listed in detail in the
Supplementary Information Part 2. The statistical results displayed in
Table 2 indicate that the localization error obtained using the second repositioning method is significantly smaller (with a confidence interval of 18.75 μm) than that achieved using the first strategy in Part 1. Nevertheless, the probability of directly relocating the ROI within the field of view during the actual TEM process remains below 10%. In the majority of instances, the operators were required to adjust the specimen stage in Mag mode to bring areas initially outside the view-field into the visible region to retrieve the ROI. This process is highly uncertain and significantly diminishes the efficiency of the repositioning method. The inaccuracies associated with this localization method arise not only from the measurement errors of the distances between the ROI and the metal ribbons, but also from the changes in the optical system that occur during the switching between LowMag and Mag modes in TEM.
In other words, the TEM instruments cannot focus on the same point of the sample when varying the magnification continuously. When the TEM operation mode is switched from LowMag to Mag, issues in the optical path alignment cause a rotation and shift in the field of view, leading to the displacement of the viewing center. In some cases, this displacement may even exceed the detection range of the CCD detector, resulting in the inability to locate the ROI within the field of view [
30].
The aforementioned analyses of the reasons all indicate that it is necessary to establish the positional relationship between fiducials and ROIs within a smaller field of view or range. Considering the operability of the positioning process, positioning accuracy, the universality of the method across different instrument models, and cost, this experiment adopts a strategy of adding inert markers to a commercial coordinate grid. By incorporating markers with known morphological compositions at a specified density, nanoscale regions of interest (ROIs) can be localized within a small area.
2. Experiments
To determine the optimal range for measuring positional relationships, we conducted a reverse derivation based on the criterion of observing the ROI within a single field of view. The instructions below show how to transform the above error distribution range indicators into indicators at the instrument’s image output end.
Taking a Au nanorod with a diameter of 10 nm and a length of 100 nm as an ROI, it is necessary to meet the requirement that the image of the nanorod displayed on the instrument’s computer monitor can be effectively identified by a human’s naked eyes.
The human eye’s resolution is 1.72 arcminute (5 × 10
−4 radians) [
31,
32], and the eye-to-display distance is typically 45–60 cm, yielding a resolution of 300 µm at 60 cm. In a JEOL 1400+ TEM, the largest image window is 25 × 19 cm
2, with a photographic resolution of 1280 × 960 pixels (the resolution of the data was 195 µm per pixel, sourced from the Digital Micrograph software (Version 3.7.4) documentation). The metal grid features a repeating mesh pattern with a 100 μm spacing in both orthogonal directions; consequently, the maximum ROI–grid distance is 50 × 50 µm to ensure full visibility. For real-time ROI retrieval, the view field must be ≥50 × 50 µm, with each pixel representing 52 × 52 nm
2. Nanorods with a 10 nm diameter cannot be effectively identified or retrieved in real time.
To enable naked-eye identification of Au nanorods (10 nm diameter, 100 nm length), the ROI must be effectively recognized along its length in the view field of CCD. Studies [
33,
34] show that human eye recognition requires at least 20–30 pixels in either the X or Y direction. Assuming 20 pixels are needed for the 100 nm length, the view field of CCD corresponds to a sample area of 6.4 µm × 4.8 µm, yielding a magnification of 40,000×. The view field is far smaller than the commercial grid cell size. If the distance between the ROI area and the cell skeleton is greater than 4.8 μm in this case, it is impossible to obtain the position of the ROI based on the positional relationship between the ROI and the metal ribbons within a single field of view. Therefore, it is infeasible to achieve nanoscale positioning of the ROI using the second strategy.
Based on the analysis, to directly locate the ROI in the Mag field of view, we need to identify the positional relationship between a marker and the ROI within a view field of 4.8 µm × 6.4 µm. The marker must be easily recognizable in the LowMag view and fully visible in the Mag view alongside the ROI. Accordingly, we propose a repositioning method using a coordinate metal grid and fiducial markers. This method progressively narrows the target area and achieves efficient retrieval of nanoscale targets through image comparison and distance measurement techniques.
Simultaneously, we must clarify that once the specimen under investigation exceeds 780 nm along any dimensions, the ROI can be unambiguously re-localized in the Lowmag field using the metric coordinates of the indexed copper grid alone. The 780 nm threshold is determined by the maximum field-of-view (50 μm × 50 μm) attainable in the LowMag CCD mode, the pixels of the detector (1280 × 960), and the minimum number of pixels (20–30) required for reliable visual recognition by the human operator. Whenever this dimensional threshold is not satisfied, the intrinsic contrast of the ROI falls below the resolution limit of unaided visual inspection in LowMag view-field. Consequently, exogenous fiduciary markers detectable in LowMag view-field must be introduced to establish a secondary, high-resolution coordinate system within a restricted search volume, thereby enabling a hierarchical, multi-stage navigation strategy for rapid ROI retrieval.
2.1. Preparation of the Sample Holder
The commercial coordinate grids can be made of materials such as copper, molybdenum, nickel, gold, copper/palladium alloy, or stainless steel. Commercially available TEM grids typically have a mesh size between 200 and 250. In this experiment, the AG200F1-type copper grid (with a diameter of 3.0 mm, thickness of 30 μm, and mesh size of 200, coated with Formvar film) purchased from Beijing Zhongjing Keyi Technology Co., Ltd. (Beijing, China) was adopted. Since the support film grids used in the experiment were metallic and less than 200 μm in thickness, some of which exhibited relatively soft material properties and were prone to deformation during grid loading and unloading, a vacuum sampler was employed for grid handling and transfer to maximize the preservation of grid flatness and support film integrity.
To determine the positional relationship between the observation target and the inert marker, objects with a non-centrosymmetric shape were selected to facilitate orientation identification during the rotation of the field-of-view at different magnifications. For efficient identification in wide-field TEM imaging, the inert marker should be micrometer-scale in length (for visibility) and sub-micron-scale in cross-sectional dimensions (to permit co-observation with the target specimen). Their composition should differ from that of the target sample and may include materials such as ZnO, TiO
2, Au, Pt, or Pd micro/nanorods. The molar ratio of inert markers to the dispersant ranges from 10
−7 to 10
−9. In this experiment, BaTiO
3 (tetragonal) rods were adopted as inert markers. The synthesis method and characterization of the inert markers were reported in refs. [
35,
36].
The experimental results demonstrate that the deposition sequence of the test specimen and inert markers on the coordinate grid had no measurable impact on spatial localization. To streamline the workflow, the inert markers were initially deposited onto the grid and allowed to dry completely before subsequent sample application.
Selection of Dispersant: The dispersant should not chemically react with or dissolve either the inert markers or the target sample. Additionally, the dispersant should be volatile. Suitable dispersants include, but are not limited to, deionized water, anhydrous ethanol, acetone, DMF, chloroform, and DMSO.
2.2. Positioning Steps
2.2.1. Initial Observation
(1) Locate the ROI within the TEM and conduct the observation and analysis. After completing the analysis, gradually reduce the magnification to identify and confirm the morphology of the inert markers in the vicinity of the ROI, as well as the coordinate grid on which the inert markers are located. Capture images of these features for documentation.
(2) The inert markers are designed as an assembly of microrods that are clearly visible within a larger field of view (e.g., within a single grid square or one-quarter of a grid square). For precision, when capturing images, it is recommended to annotate the distance from a specific point on the boundary or center of the microrod assembly to the metallic framework of the coordinate grid. Similarly, the distance between the ROI sample and the inert markers (i.e., microrod assembly) should also be recorded.
2.2.2. Re-Retrieval of the Sample
Given that the coordinate grid cannot be rotated within the XY plane in the TEM and the electron beam cannot be rotated to adjust the image orientation in a controlled manner either, it is necessary to use image processing software to flip and/or rotate the images obtained during the initial observation to match the current field of view for rapid and accurate re-localization of the target sample. The re-retrieval process consists of two main steps:
(1) Determine the Transformation Required: Identify the specific transformations (flipping and/or rotating angle) that need to be applied to the images obtained during the initial observation to align them with the current field of view.
(2) Apply the Transformation and Locate the Sample: Apply the same transformations to all of the images obtained during the initial observation. Use these markers in the transformed images (such as the metallic framework of the coordinate grid, inert markers) as references to locate the ROI within the current field of view.
Since low-magnification large-field-of-view images display the grid skeleton of the coordinate grid and alphanumeric markers, which facilitate orientation identification, these images are preferentially selected for flipping or rotating at specific angles so as to match the images that appeared in the LowMag mode when they are retrieved. Once the flipping operation and/or rotation angle are determined, the same flipping and/or rotation operations are applied to all images captured during the initial observation. The processed images can then serve as a reference for ROI localization. Subsequently, the ROI is located based on the reference images, using the morphology of the inert markers and their distance from the grid framework to identify the markers. The test ROI is then retrieved based on its morphology, size, and spatial relationship with the inert markers.
Due to differences in the optical paths between the LowMag and Mag modes in TEM imaging, as well as the overlapping magnification ranges between the two modes, a 180° rotation of the field-of-view image can occur at the same magnification within the overlapping range, introducing interference during retrieval. To avoid such interference, the magnification mode and field-of-view range during retrieval must remain consistent with those used during the initial observation. Whether an image requires flipping depends on the specific instrument model and should be determined based on practical conditions. Images that require flipping in LowMag mode should maintain the same flipping state in Mag mode.
This localization method is not only applicable to TEM, but is also effective in SEM and AFM.
2.3. Quantitative Assessment of Repositioning Error Distributions
Since this localization protocol does not rely on the instrument’s built-in coordinate system and the inert markers are distributed at random—i.e., they do not necessarily conform to a Cartesian geometry—the error calculation scheme illustrated in
Figure 1 and
Figure 2 above is no longer applicable. To validate the accuracy of the proposed protocol, twenty distinct specimens were subjected to independent localization-and-relocation cycles in TEM, SEM, and AFM. The positional error was quantified as follows: The geometric center of the region of interest (ROI) in the TEM image was designated point R. The long edge of the nearest inert marker was projected onto a straight line, denoted l. The perpendicular distance from R to l was measured in the reference (first-pass) image and again after re-localization; the absolute difference between the two values was defined as the localization error. The error distribution of these 20 localization events was recorded, and the mean, variance, and confidence interval of the errors were calculated; the computational methods are the same with
Table 1 and
Table 2, computation details are provided in
Part 1 of the Supplementary Information.
3. Results and Discussion
Using the AG200F1-type grid as the sample holder, BaTiO
3 microrods as the inert markers, and Au nanorods as the target objects, we performed correlative micro-area imaging of the same Au nanorod on TEMs of different models from the same manufacturer, as well as on TEMs from different manufacturers. The same Au nanorod was also retrieved in SEM and AFM, thereby achieving correlative imaging that includes TEM. The sample preparation methods are detailed in the
Supplementary Information.
3.1. Applicability Test in Different Models of TEM from the Same Manufacturer
A JEOL JEM-1400+ TEM (JEOL Co., Ltd., Akishima, Tokyo, Japan) was used for initial observation and a JEOL JEM-2100F TEM (JEOL Co., Ltd., Akishima, Tokyo, Japan) was employed for sample relocation.
3.1.1. Initial Observation
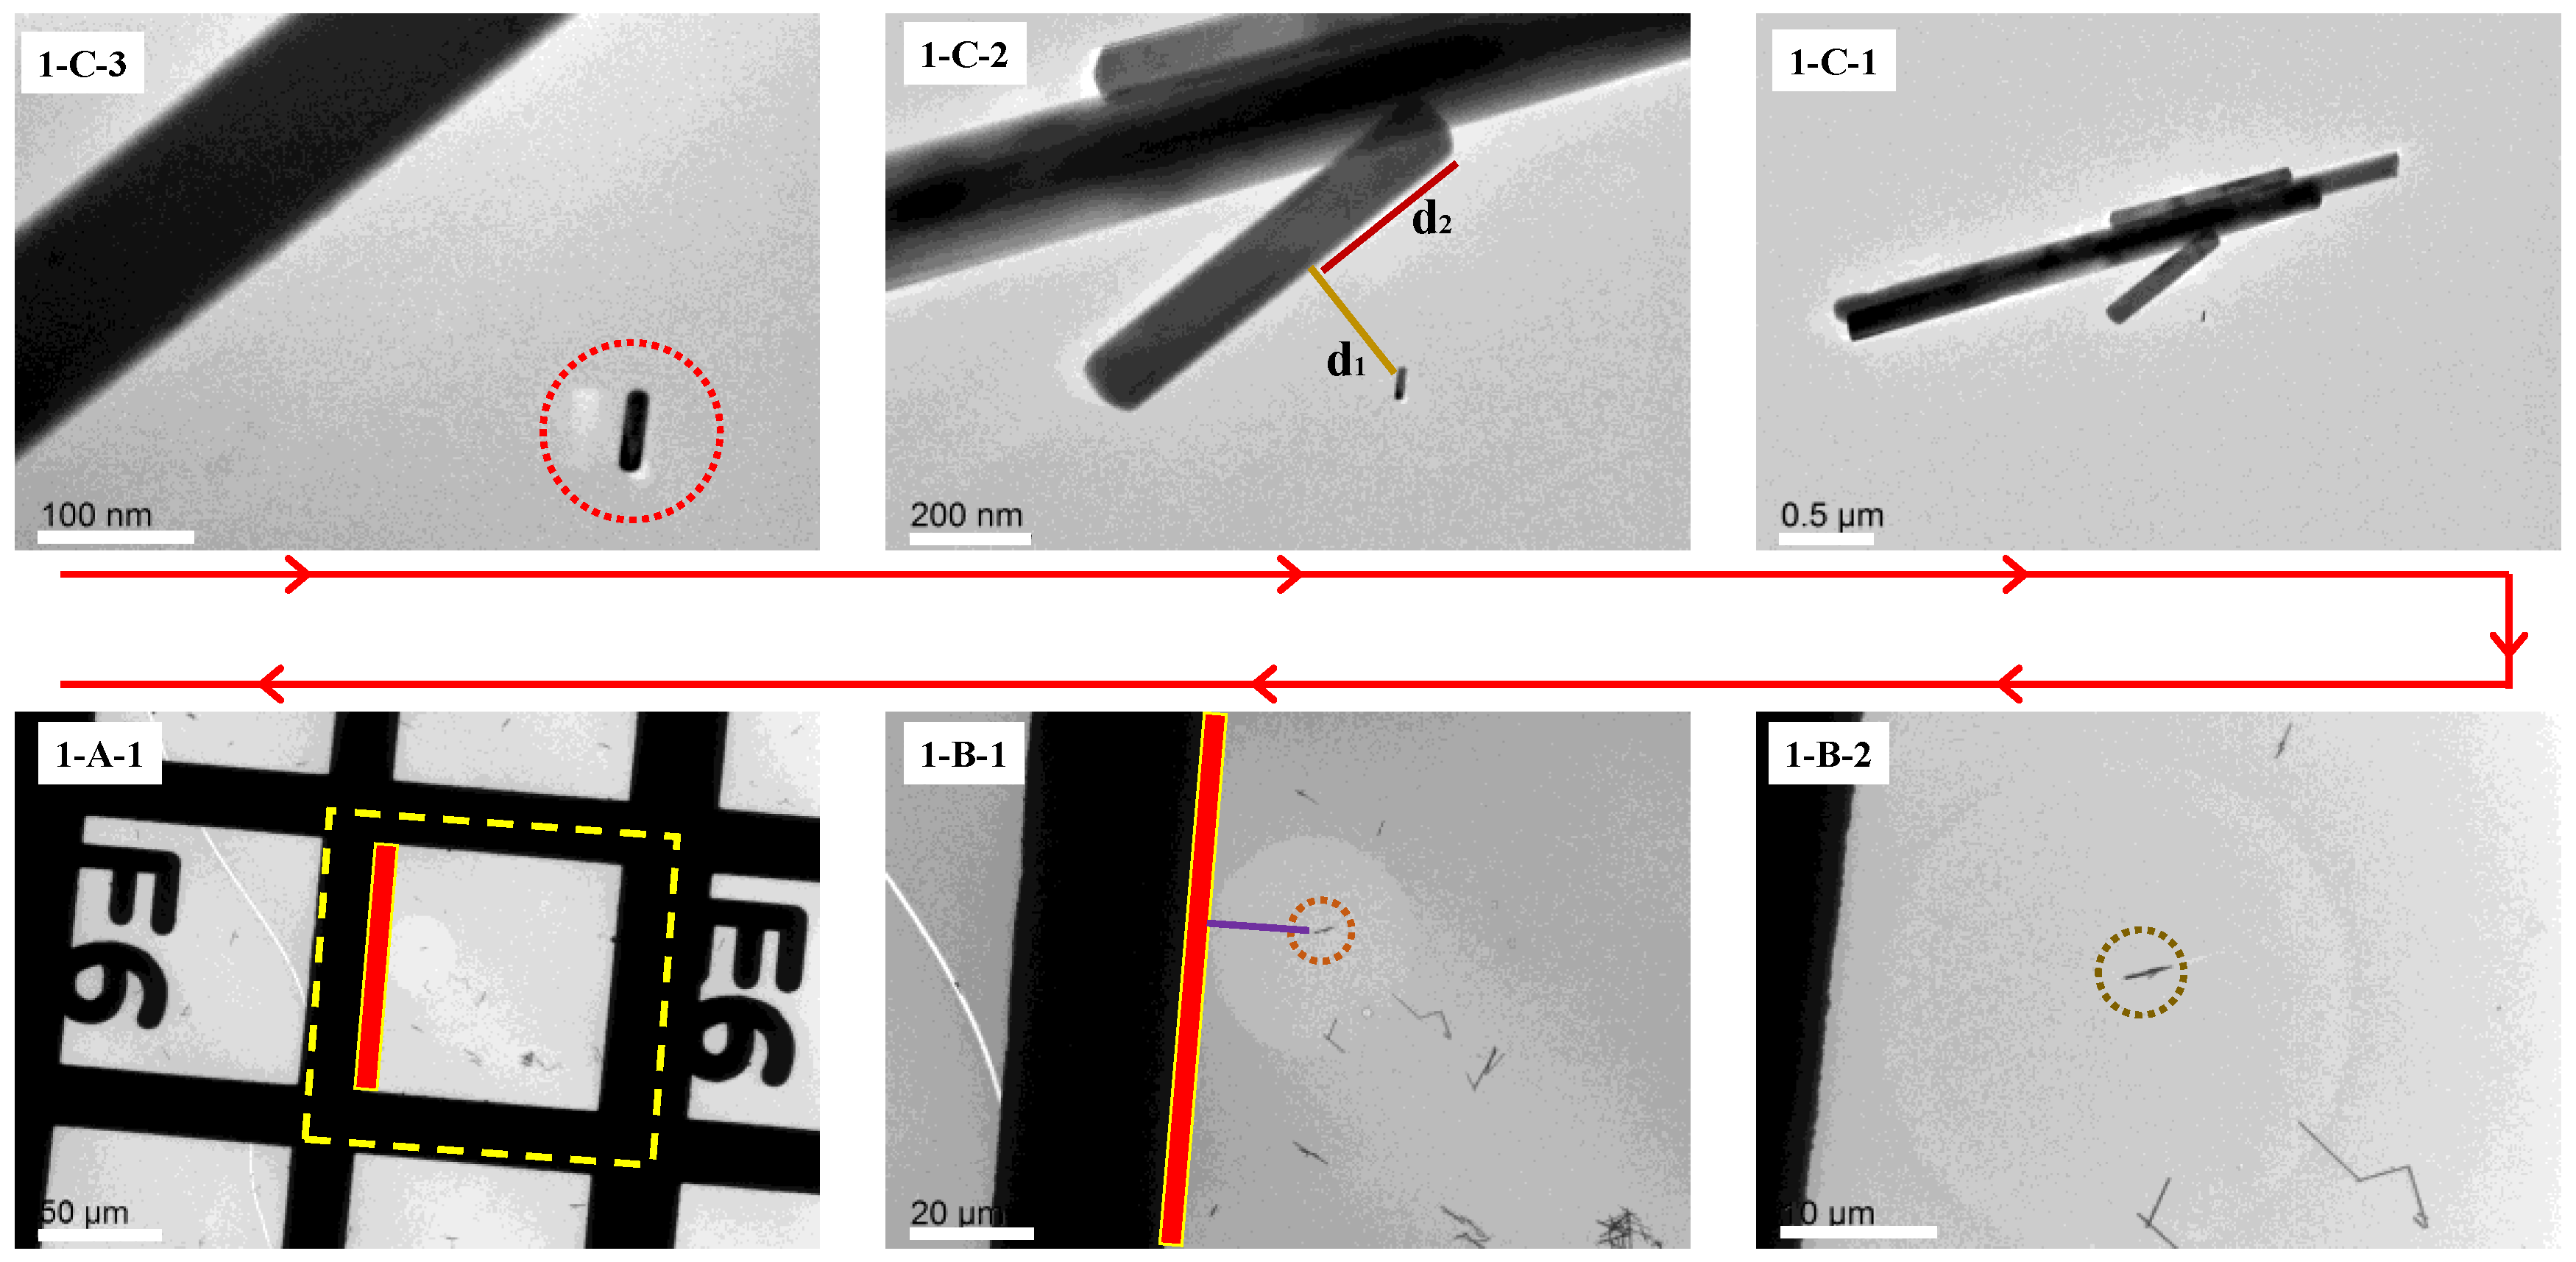
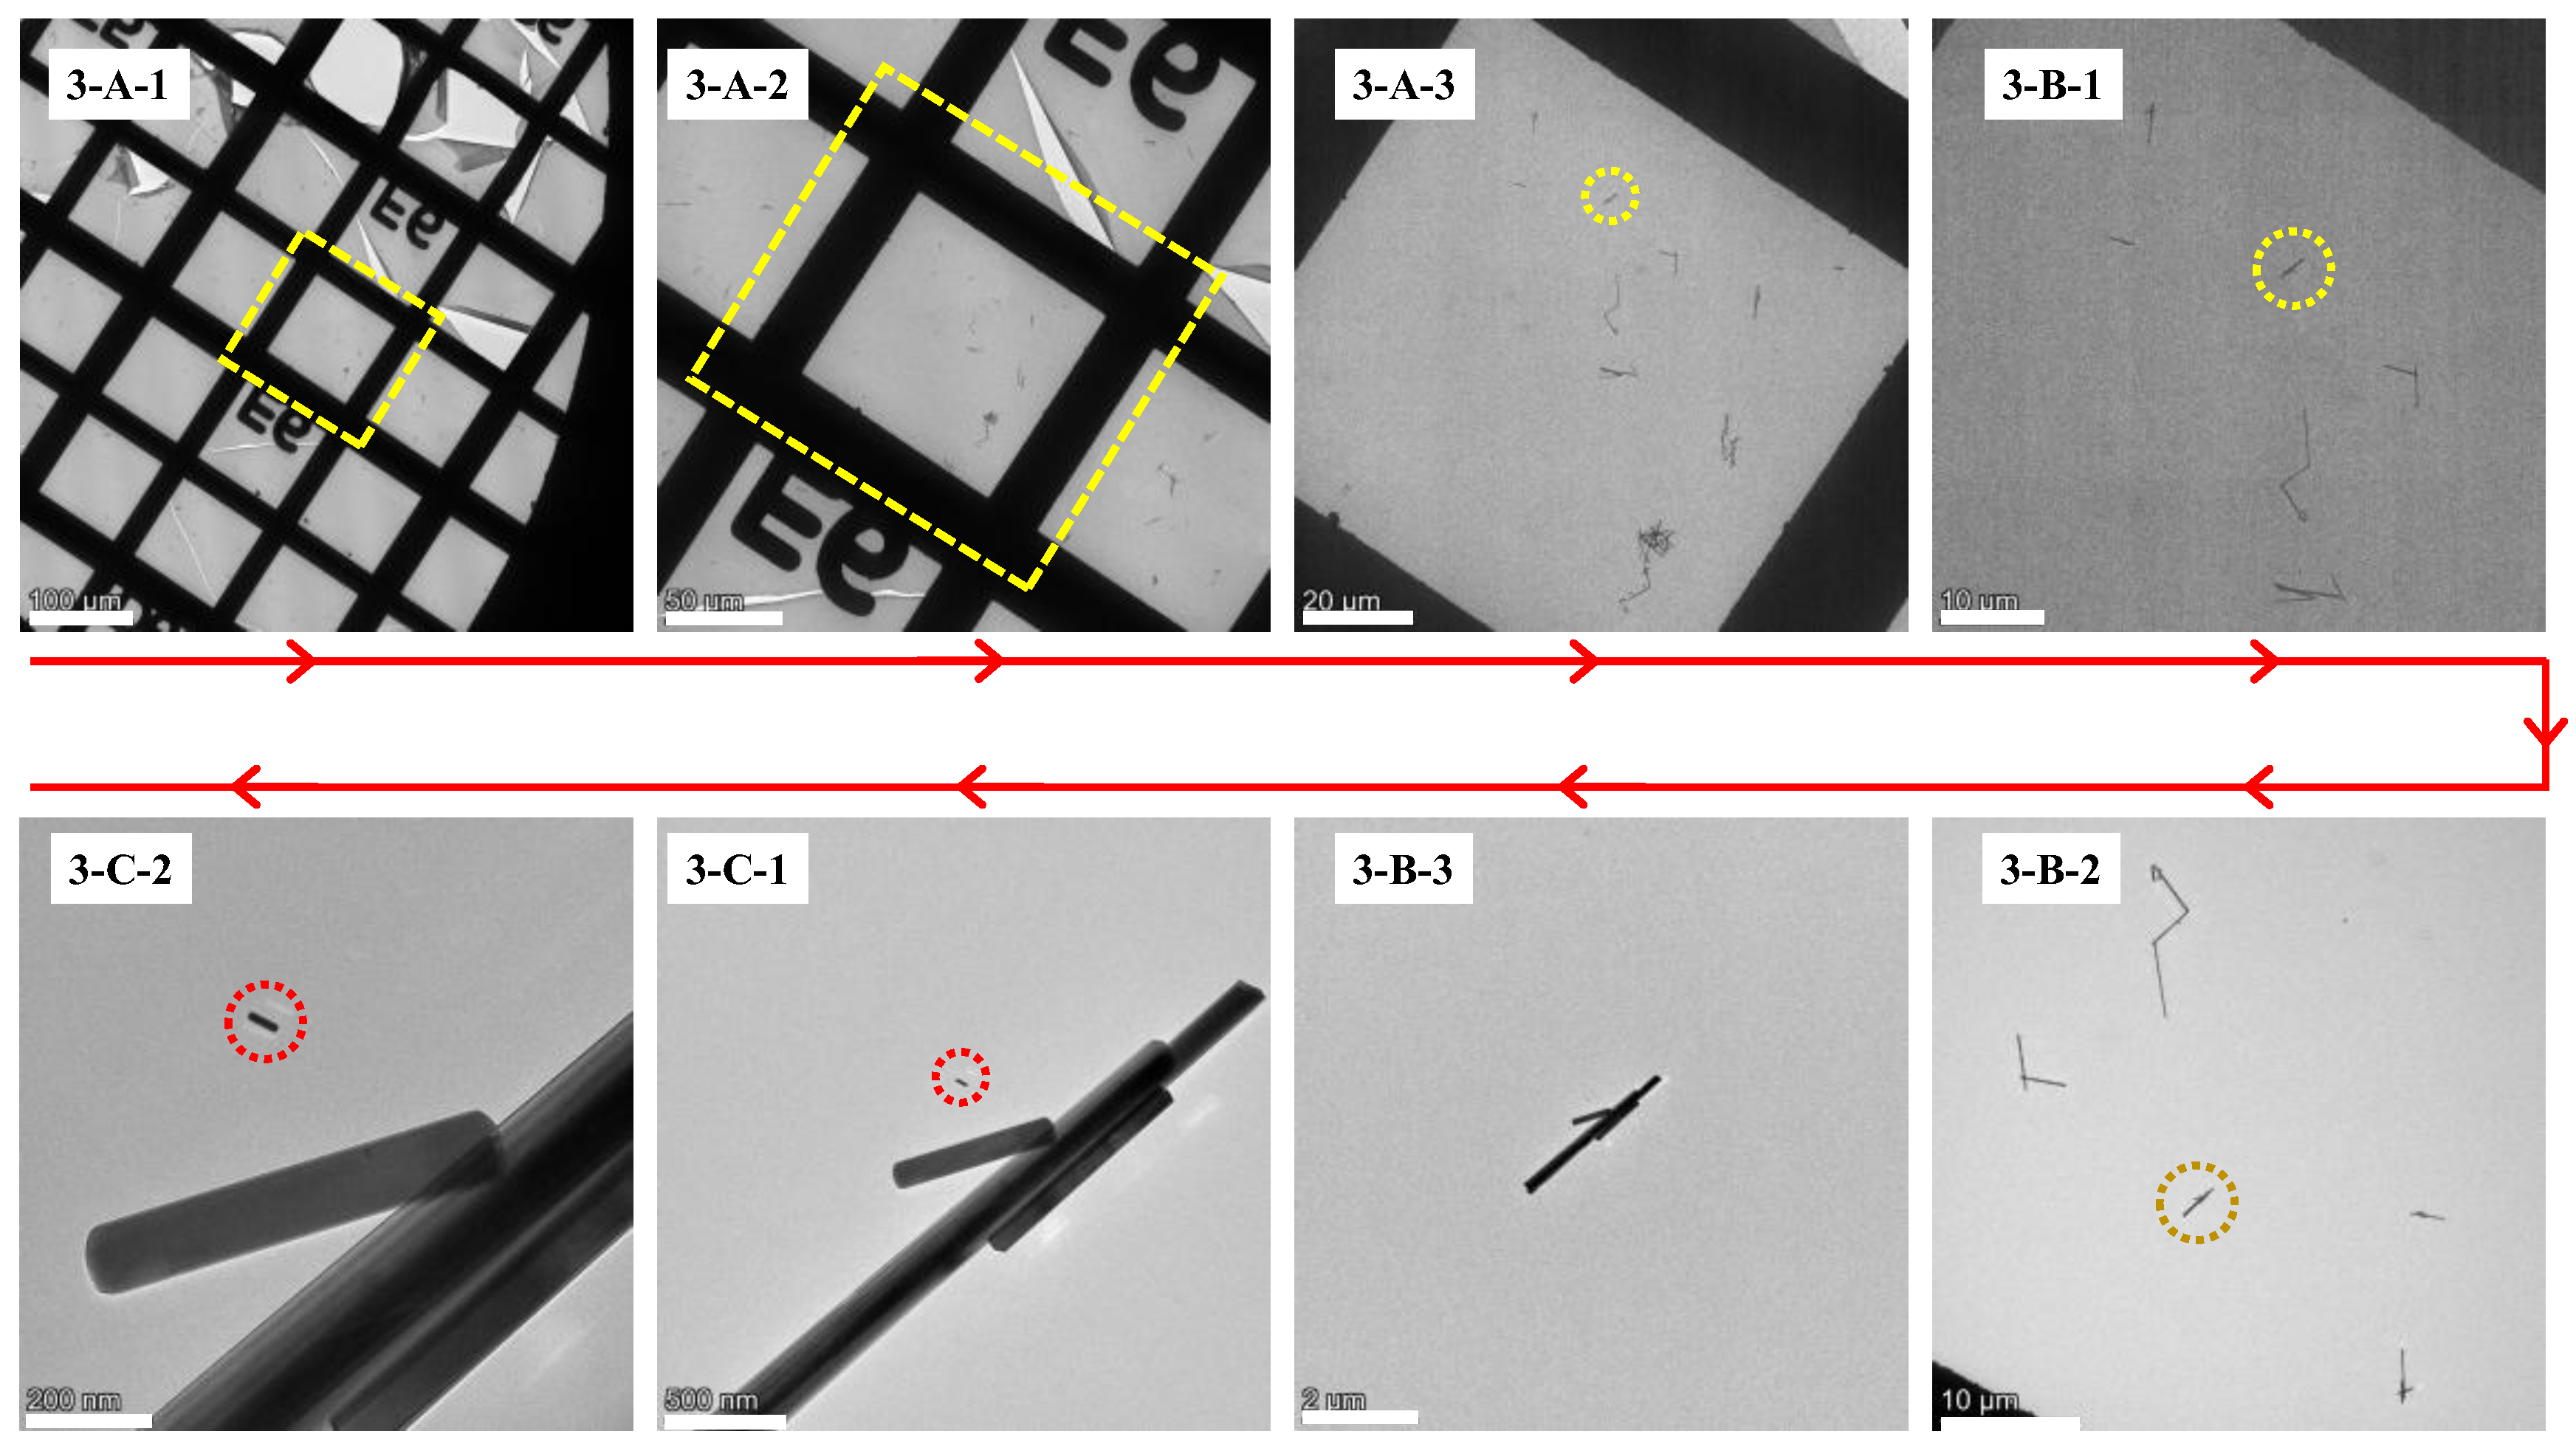
All images obtained during the first observation are presented in
Figure 3. The red arrow indicates the sequence of image acquisition, with each image labeled to correspond to its respective step in the experimental procedure.
The
Figure 3(1-C-3) shows the target Au nanorod in the initial observation. The short rod in the lower right part is the TEM image of the ROI. The thicker band in the upper left part of
Figure 3(1-C-2) is the TEM image of part of the inert marker. The
Figure 3(1-C-2,1-C-1) are the TEM images of the same point with a larger field of view. The spatial relationship between the target Au nanorod and the inert markers are also labeled in
Figure 3(1-C-1) (the distances labeled in the picture). The distance between the ROI and the nearest endpoint of the microrod was measured (denoted as d
1). If only one microrod was present, an additional perpendicular distance (d
2) from the ROI to the in-focus segment of the microrod was recorded (in this case, d
1 = 0.26 μm and d
2 = 0.36 μm). All the figures labeled with C were taken in Mag mode.
The
Figure 3(1-B-1,1-B-2) were captured in LowMag mode, illustrating the spatial relationship between the inert markers and the metal grid framework within a larger field of view (as shown in
Figure 3(1-B-1)).
Figure 3(1-A-1) shows the positions of the inert markers and the target grid within the entire metal grid holder. The combination of letters and numbers next to the metal grid not only indicates the position of the grid, but also provides information on the orientation of the copper grid, which is crucial for subsequent retrieval.
3.1.2. Retrieval
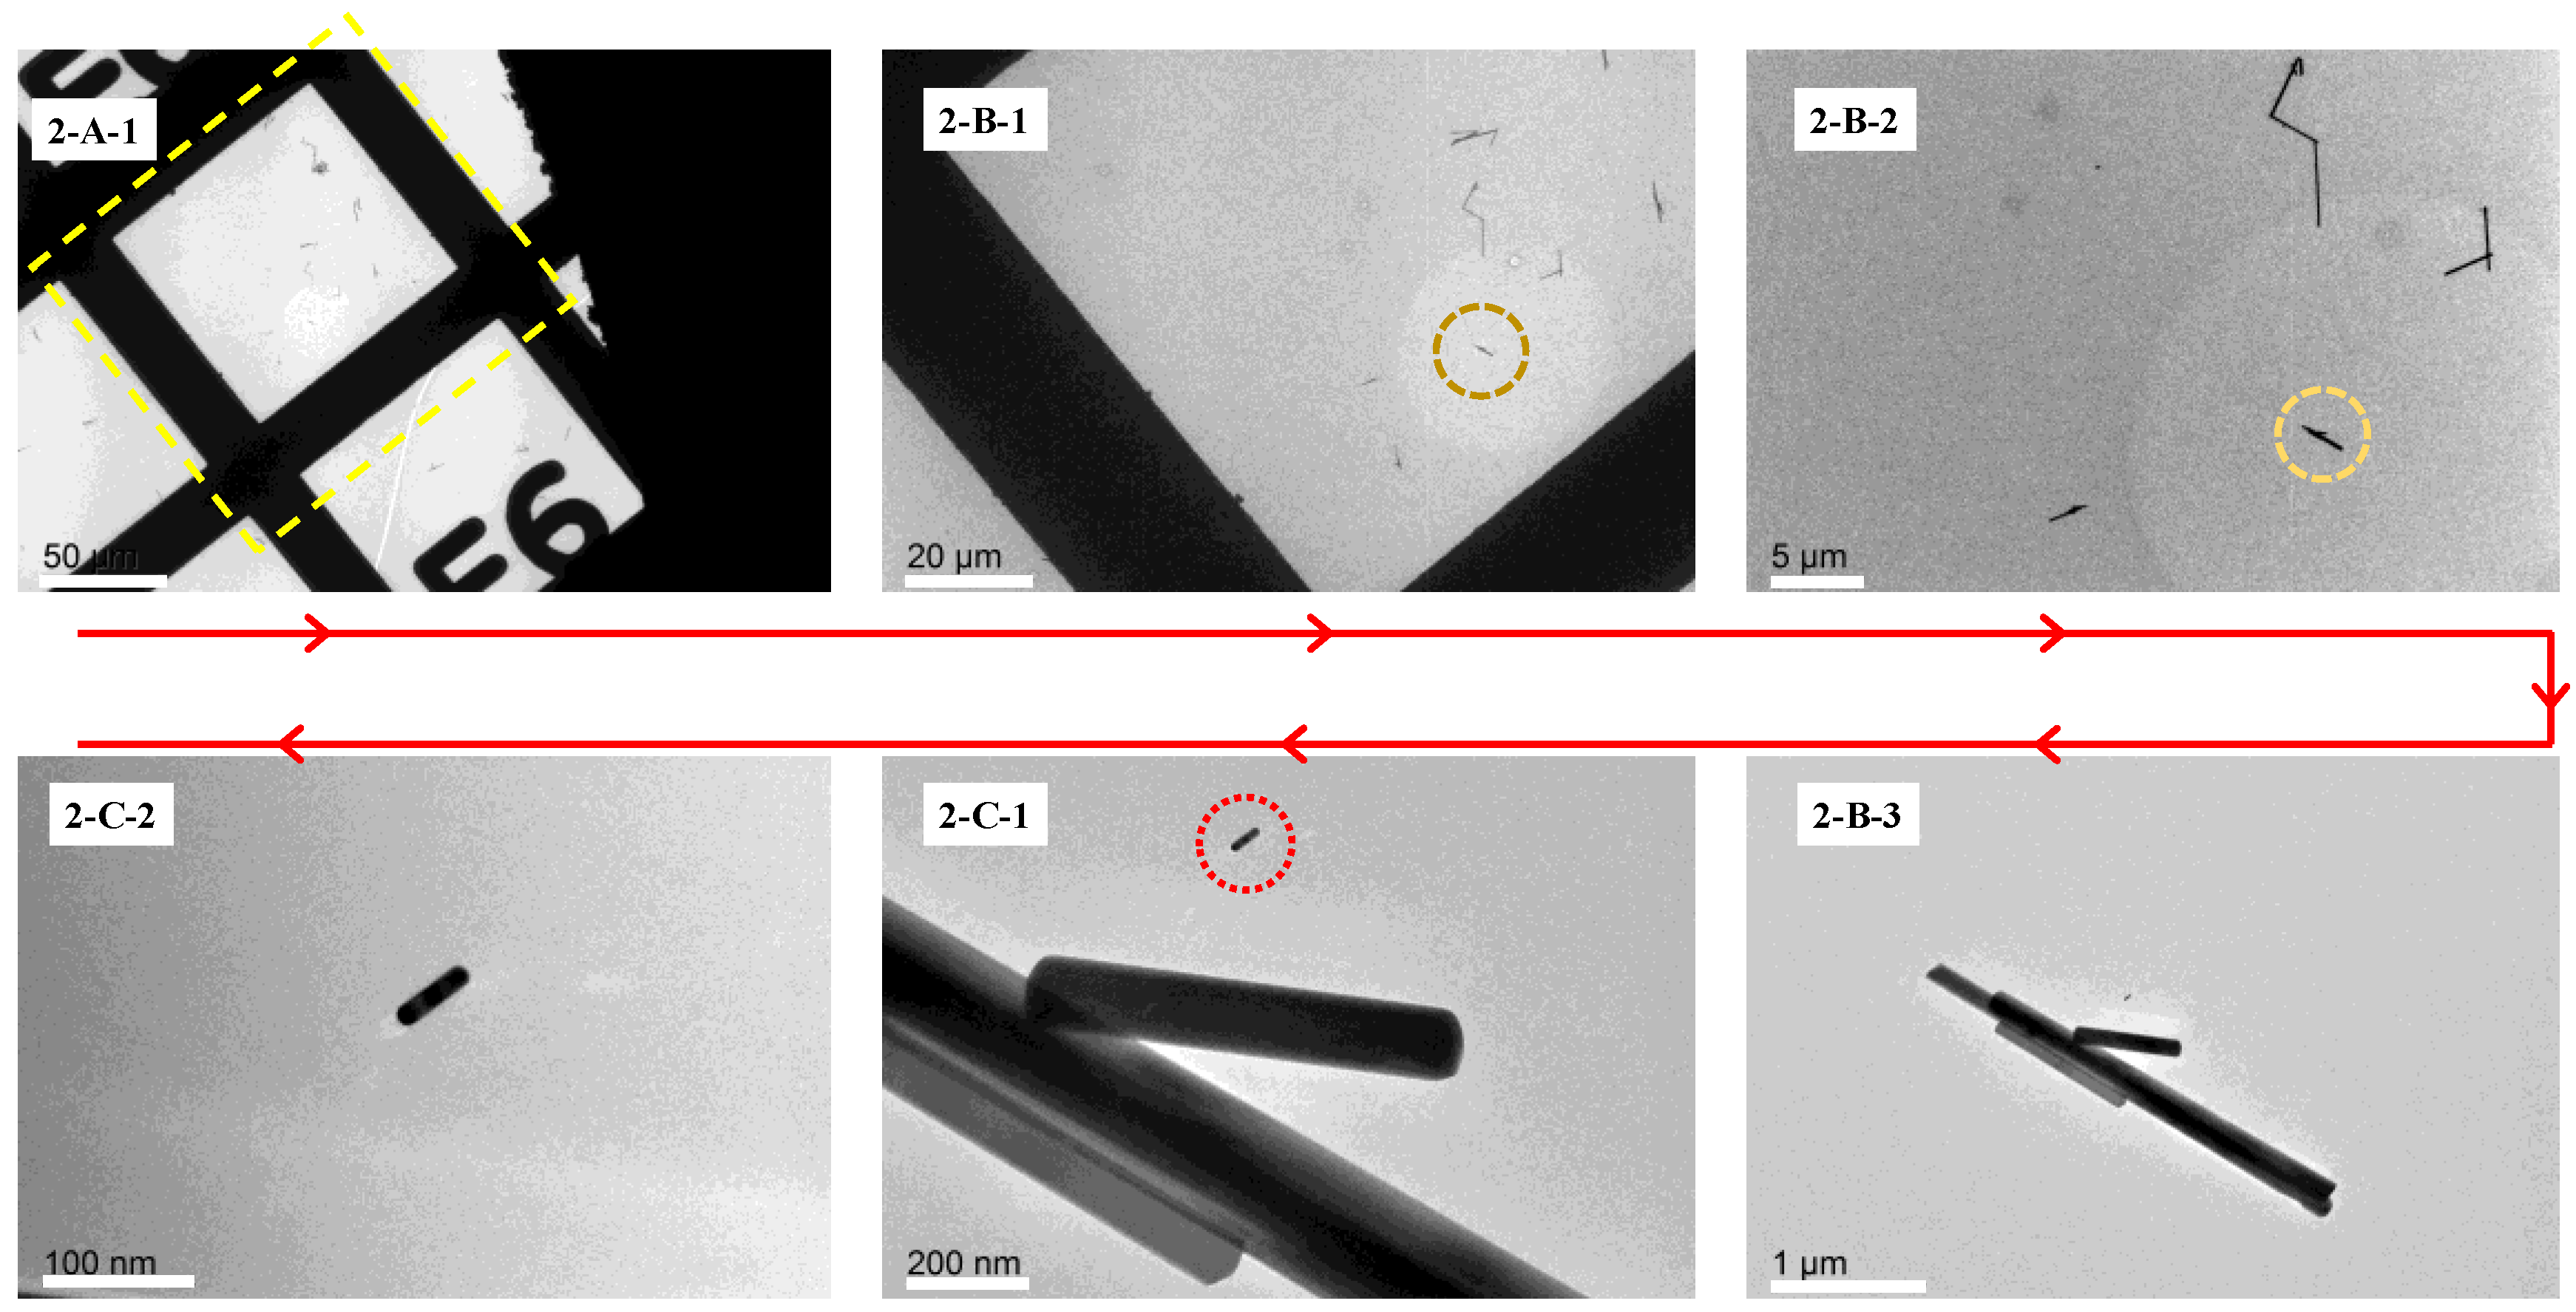
The retrieval process was executed on a JEOL 2100F TEM as shown in
Figure 4. The specific steps for the retrieval are presented below.
First of all, locate the specific grid that holds the ROI and the inert markers in the LowMag mode according to the information provided in
Figure 3(1-A-1). Before this step,
Figure 3(1-A-1) should be rotated counterclockwise by 135° to match the image shown in
Figure 4(2-A-1) in the retrieval process. Consequently,
Figure 3(1-B-2,1-B-1) should be rotated in the same manner. Secondly, locate the inert markers in
Figure 4(2-B-1) according to the rotated picture labeled
Figure 3(1-B-1). In this step, the rotating angle indicates the direction and the distance gives the accurate position of the inert markers. Once the inert markers appeared in the field of view, as shown in
Figure 4(2-B-2), move them to the center of the view-field and then magnify the markers, as shown in
Figure 4(2-B-3).
The next step is to locate the position of the ROI according to the spatial relationship between the ROI and the inert markers. By the same token, the picture labeled 1-C-1 should be rotated counterclockwise by 135° to match the image shown in the retrieval process. Next, based on the spatial relationship between the inert markers and the ROI, as shown in rotated image
Figure 3(1-C-1), locate the position of the ROI in the field of view (
Figure 4(2-C-1)), magnify it, adjust the focus, and move it to the center of the field of view (
Figure 4(2-C-2)). At this point, retrieval of the nanoscale ROI on a TEM device of the same brand, but a different model has been achieved.
3.2. Applicability Test in Different Models of TEM from Different Manufacturers
In this sub-section, the same sample was adopted as the specimen. A JEOL JEM-1400+ TEM was used for the initial observation and a Thermal Fisher Talos 120EC TEM (Thermal Fisher Co., Ltd., Hillsboro, OR, USA) was employed for the sample relocation.
The initial observation steps are consistent with those described in
Section 3.1.1.
The retrieval steps on the Thermal Fisher Talos 120EC TEM are as follows:
The overall images of the specimen grid in LowMag mode are shown in
Figure 5(3-A-1,3-A-2), which are mirror images of
Figure 3(1-A-1). Using image processing software, mirror the image of
Figure 3(1-A-1) (flip horizontally along the right edge of the image; the same applies hereafter). After mirroring, rotate the image counterclockwise by α
2 (α
2 = 52°) to align it with the orientation of the image in the field of view of the Thermal Fisher Talos 120EC TEM.
Locate the large grid on the coordinate grid and the corresponding grid skeleton where the ROI and inert markers are located according to
Figure 3(1-A-1).
Then, locate the inert markers based on the spatial relationship in the processed
Figure 3(1-B-1).
Zoom in on the image and enter the Mag mode, where the image will rotate clockwise by 180°, as shown in
Figure 5(3-B-2). Horizontally flip
Figure 5(3-C-1) and then rotate it clockwise by 128° (180° − 52° = 128°).
Adjust the focus of the electron optical system to focus the electron beam on the inert markers. Based on the distance d
2 marked on the micrometer rod in the flipped and rotated
Figure 3(1-C-1), determine the position of the perpendicular foot from the ROI point to the specific micrometer rod in the inert markers. Then locate the ROI by finding the distance d
1 based on the length of the perpendicular segment in the flipped and rotated
Figure 5(3-C-1).
3.3. Test of Correlation Imaging of TEM and SEM
The JEOL 1400+ TEM was selected for initial observation, and the Zeiss Merlin SEM (Carl Zeiss Co., Ltd., Cambourne, Cambridge, UK) was used for retrieval.
The initial observation steps are consistent with those described in
Section 3.1.1.
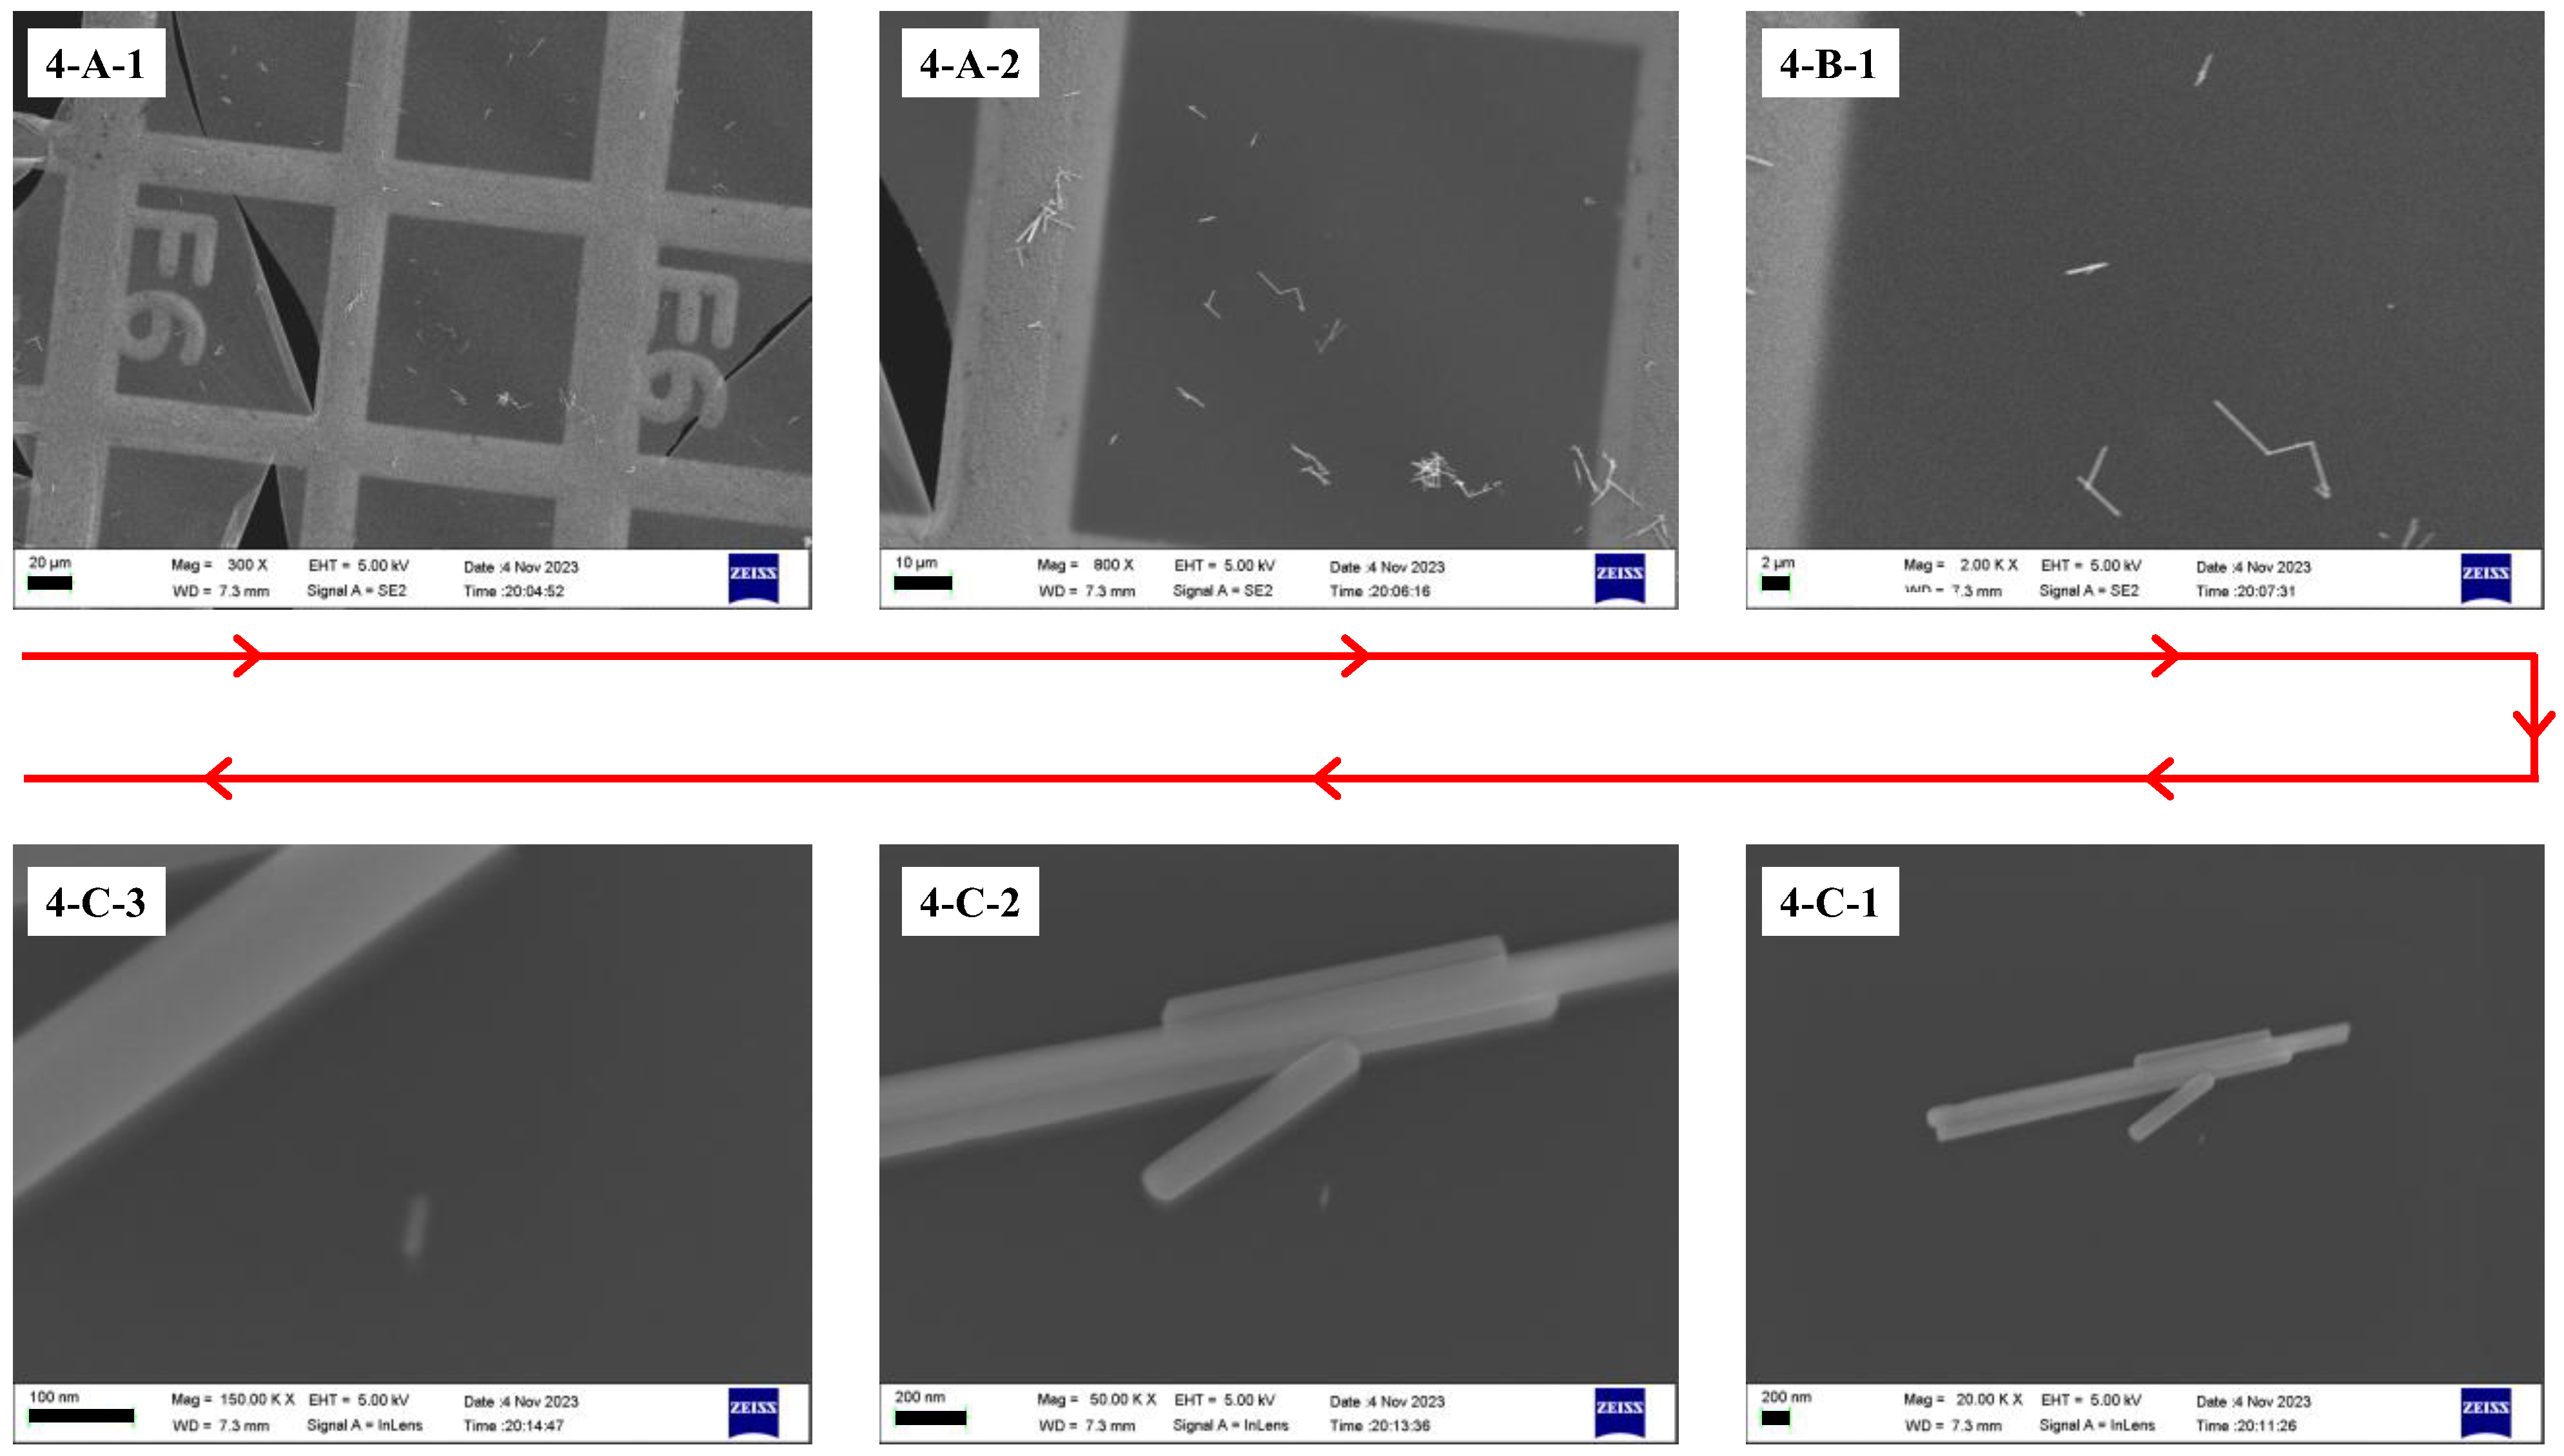
The retrieval process in the SEM is shown in
Figure 6. First, we loaded the specimen into the instrument. The sample was then observed within the largest possible field of view, and the rotation function of the instrument’s sample stage was used to align the image of the metal grid with the angle of the initial observation image (as shown in
Figure 6(4-A-1,4-A-2). The inert marker was located based on its positional relationship with the grid framework (as shown in
Figure 6(4-B-1,4-B-2). Subsequently, the position of the ROI was determined using the inert marker as a reference, according to the positional relationship illustrated in
Figure 6(1-C-1) (the step is shown in
Figure 6(4-C-1)).
The above steps describe the correlated imaging process where the initial observation is performed using TEM and the subsequent retrieval is carried out using SEM. When the initial imaging is performed using SEM and the retrieval is performed using TEM, since the imaging field of view of TEM cannot be rotated, the retrieval procedure is the same as the steps described in
Section 3.1 and
Section 3.2 for locating nanoscale targets using TEM.
3.4. Test of Correlation Imaging of TEM and AFM
Since AFM can provide three-dimensional surface topography information of the sample at a scale ranging from tens of micrometers to nanometers, and TEM can offer the internal structural information of the sample at the same scale, the two characterization methods have similar applicable scale ranges and highly complementary characterization results. Therefore, a combination of these two characterization techniques can provide a wealth of information.
Due to the different principles of TEM and AFM, the structure of the instruments and the design of the sample stages are completely different. At present, there are few reports on the methods and results of micro-area correlation imaging between TEM and AFM. However, some recent studies have demonstrated the potential for correlated AFM-TEM imaging, such as the application to lipid nanoparticles, where a step-by-step procedure was provided to obtain pairs of correlated AFM-TEM images. Additionally, other research has shown a complementary structural analysis using AFM and TEM for surface functionalization.
In this experiment, micro-area correlation imaging between TEM and AFM was achieved using the confined comparison method with the addition of markers. The specific steps are listed below.
The scanning range of the AFM in the plane is restricted to an area of 90 μm × 90 μm due to the technical limitations of the scanning tube. Thus, an optical microscope with a larger field of view can be employed to assist in locating the ROI. In the retrieving process, the first positioning process was carried out in the optical field of view, and then the precise positioning was achieved using the AFM test results.
The TEM model JEOL 1400+ was used for observation, and the AFM model Bruker Dimension Icon (Bruker Co., Ltd., Penang, Malaysia) was used for retrieval. The tested sample is a parallel sample prepared according to the method for test samples described in
Section 3.1. The steps for the initial observation were the same as those in
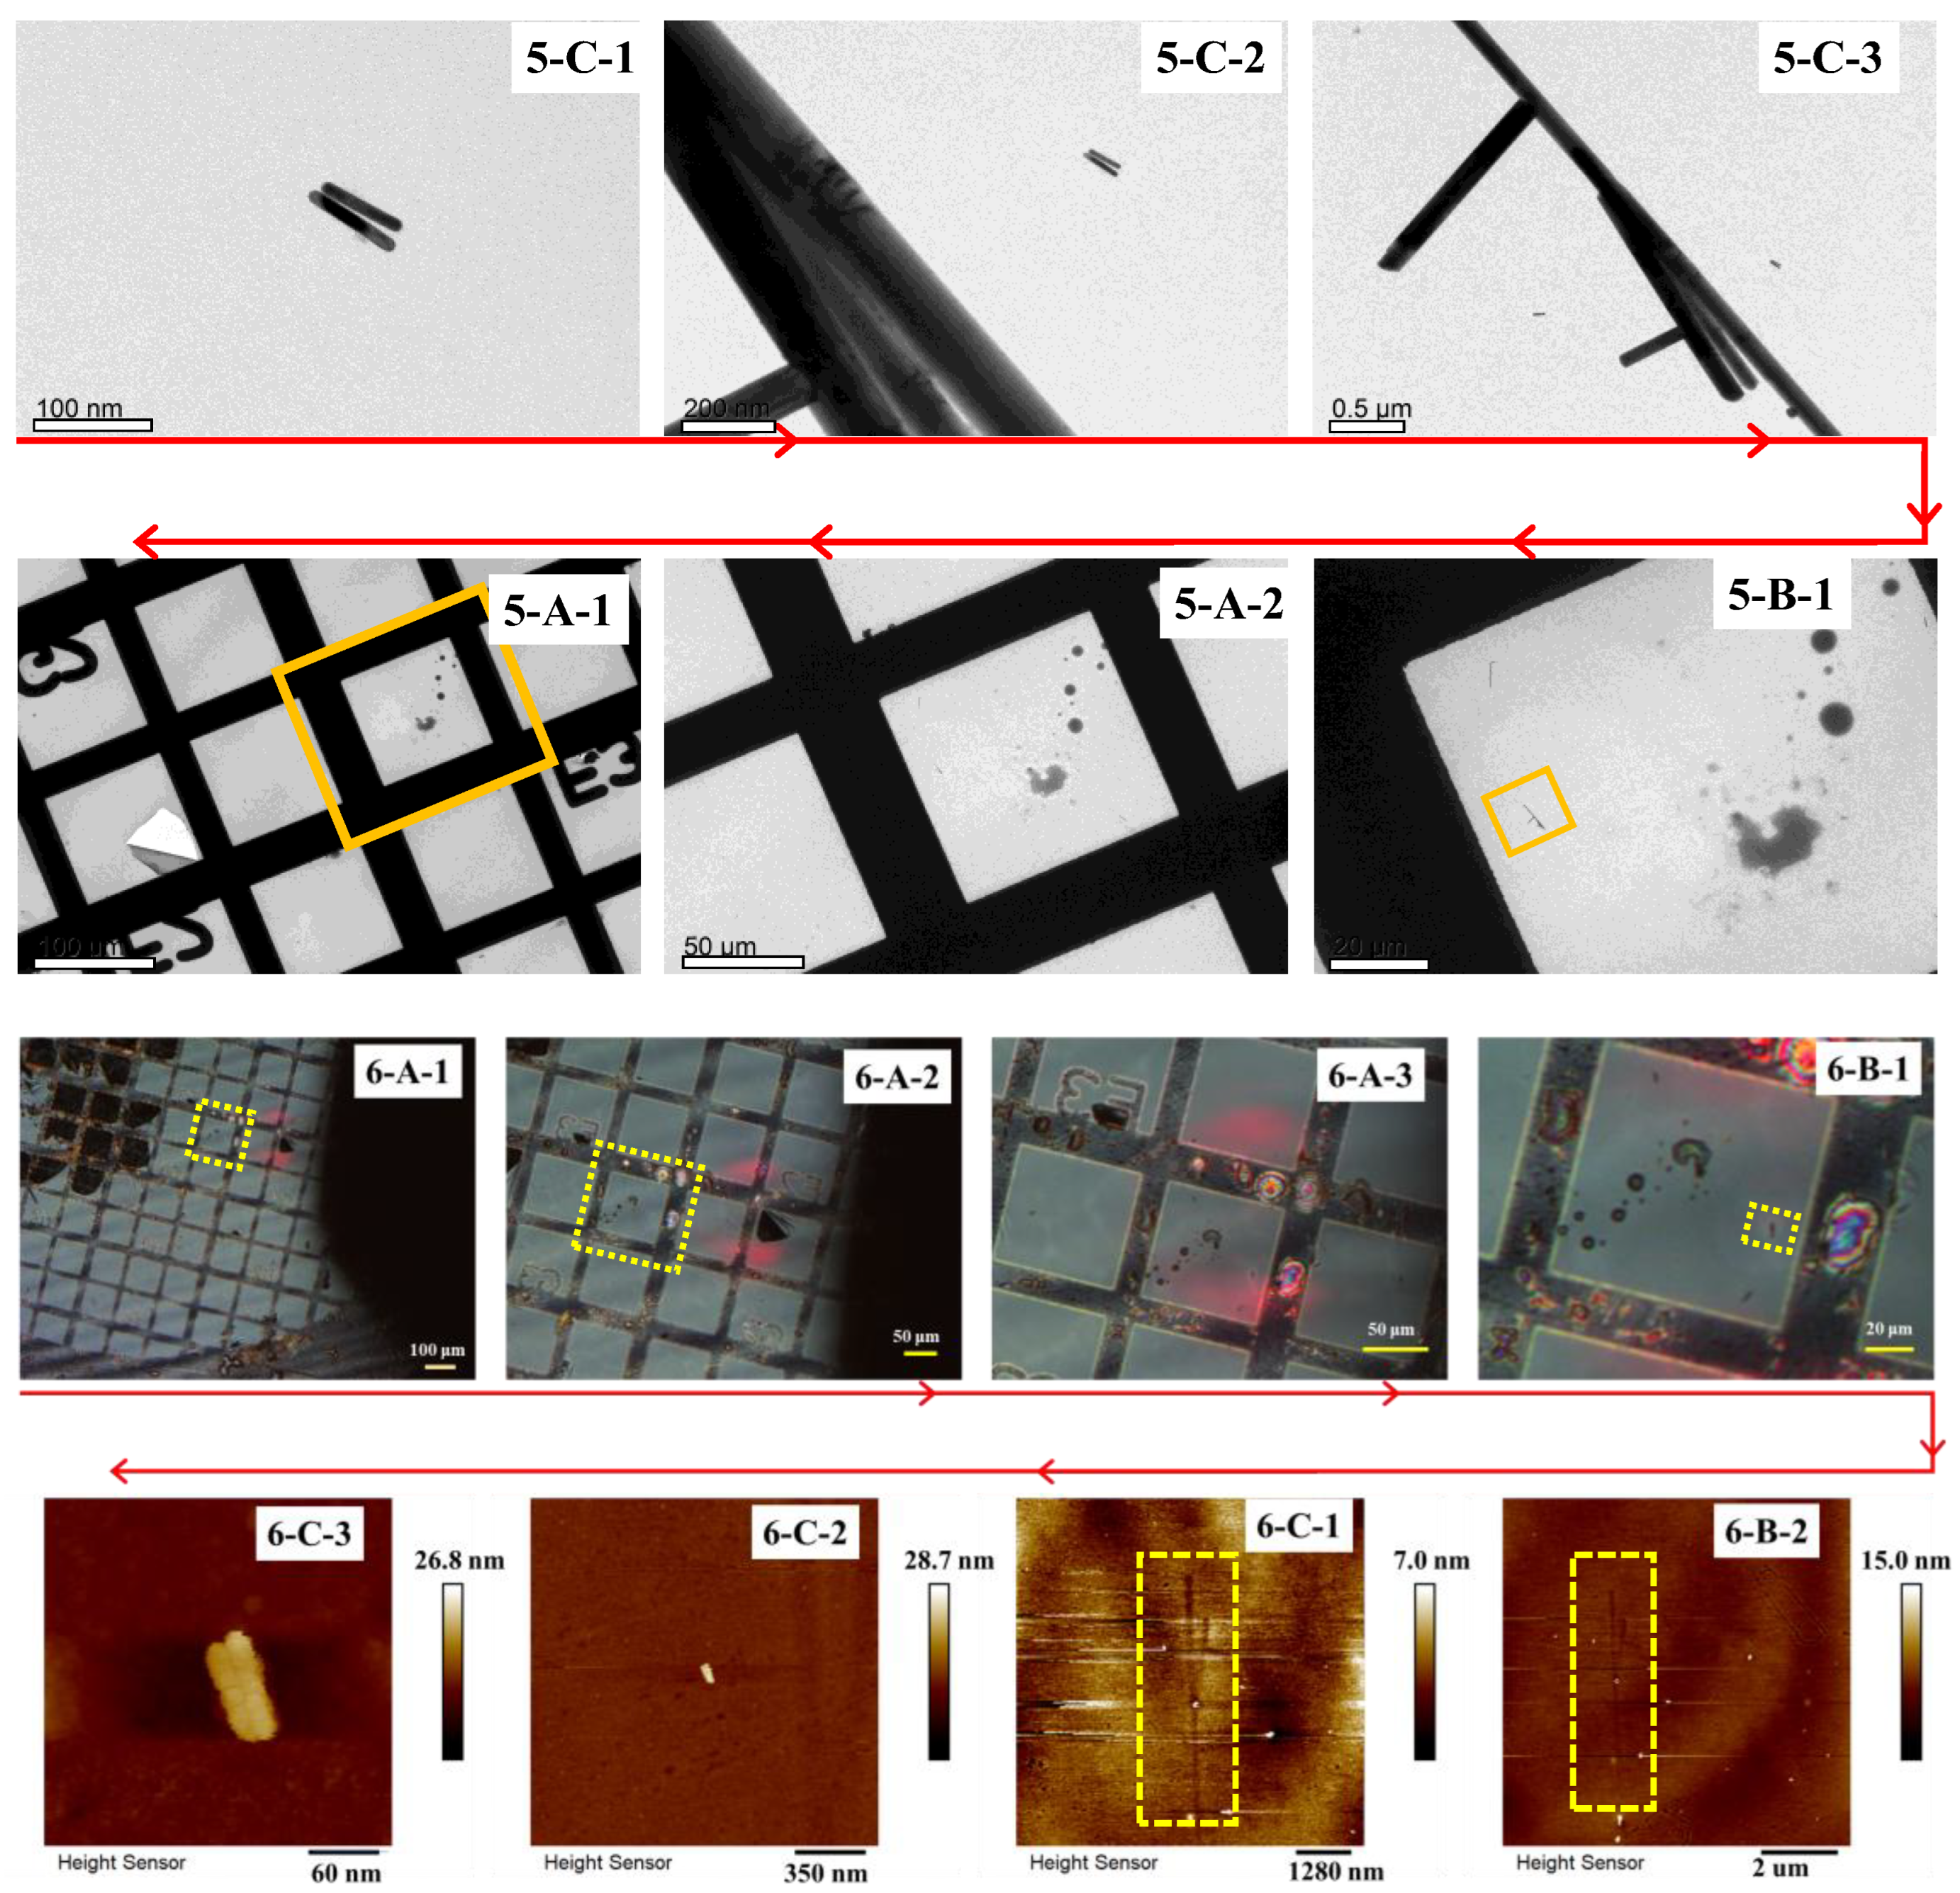
Section 3.1. In the retrieving process, the coated side of the coordinate grid was placed facing up and gently adhered to an iron plate. First, the coordinate grid and its alphanumeric markers were located in the view-field of the optical microscope that came with the AFM (see
Figure 7(6-A-1–6-A-3,6-B-1)). And then search the inert markers by AFM scanning in a large scanning range according to the positional relationship between the grid cell skeletons and inert markers provided by
Figure 7(5-B-1,6-B-1). In the subsequent steps, the scanning range will be progressively narrowed down based on the information provided in
Figure 7(5-C-2,5-C-3) to relocate the ROI.
When employing this method to retrieve targets on an AFM, the abrupt difference in thickness between the inert markers and the substrate can cause the AFM probe to dislodge the inert markers during testing. Although the residual imprint of the inert markers on the carbon film permitted ROI retrieval in the present experiment, physical loss of the markers has precluded any further repeated TEM/SEM characterization of this specimen. To preserve inert markers for correlative workflows that include AFM, the scan rate should be minimized and the tip–sample interaction force reduced as far as practicable. This phenomenon indicates that, in the subsequent design and selection of inert fiducial markers, materials with minimal thickness variation or gently sloping topographic relief should be considered. This selection better suits AFM imaging and minimizes TEM re-localization error by closely matching the ROI focal plane in the Z-axis.
3.5. Repositioning Accuracy of the Method
In addition, we evaluated the localization error with the procedure described in
Section 2.3, compiled the corresponding error distribution, and summarized the results in
Table 3. According to
Table 3, when ROIs of nanometer dimensions are relocated with this method, the mean distribution errors are 24 nm on TEMs of the same brand, 30 nm across different brands, 31 nm in the SEM, and 19 nm in the AFM; the maximum statistical spread of the ROI positioning error is ±43.6 nm. Based on the preceding discussions regarding the parameters of the TEM CCD camera and the characteristics of human visual perception, the smallest object that can be reliably identified by the human eye on the CCD display interface, within the aforementioned positioning error distribution range, is 2.7 nm. It should be emphasized that this result is contingent upon the precondition that the ROI exhibits sufficient contrast relative to the grid background.
The rationale underlying the attainment of the stated positioning accuracy by the proposed positioning method is elaborated below.
In the proposed localization protocol, the first step employed a coordinate grid and LowMag images to identify the grid cell containing the ROI, after which the inert markers were located by virtue of their predetermined spatial relationship to the grid skeletons. Subsequently, the same inert markers were re-identified using Mag mode. In the second step, the ROI was repositioned in Mag mode by reference to the relative position’s relationship between the ROI and the inert markers recorded during the initial Mag mode observation.
In Step 1, the grid-cell skeletons are immediately visible in the field of view, whereas the inert markers must be retrieved on the basis of previously acquired reference images. In Step 2, the inert markers are conspicuous and the ROI has to be re-found. Regardless of the step, we exploit two complementary sources of information provided by the initial observation: (i) the distance relationship between the known object (skeleton or markers) and the object to be retrieved (markers or ROI), and (ii) the direct image-to-image comparison. The distance constraint allows for the search area within the grid cell to be rapidly and reliably narrowed, while the image comparison enables the ROI to be pinpointed within this reduced region.
Benefiting from the aforementioned localization strategy, the successfully relocated nanoscale ROIs across TEMs of different models and manufacturers, as well as in SEM and AFM was achieved. Even in AFM tests where some inert markers were scraped off by the probe during scanning, we could still retrieve the ROI by tracking the imprints left by the inert markers on the carbon film.
