Article

Research on Multi-Beam Interference Competition Suppression Algorithms for Laser Doppler Vibrometry

1
Aerospace Information Research Institute, Chinese Academy of Sciences, Beijing 100094, China
2
School of Optoelectronics, University of Chinese Academy of Sciences, Beijing 100049, China
*
Author to whom correspondence should be addressed.
Appl. Sci. 2025, 15(22), 12020; https://doi.org/10.3390/app152212020
Submission received: 18 October 2025 / Revised: 7 November 2025 / Accepted: 10 November 2025 / Published: 12 November 2025

Abstract

The Laser Doppler Vibrometer (LDV) is widely used in precision vibration measurement due to its non-contact nature and high accuracy. However, when measuring non-cooperative targets, the internal stray light in the LDV interferes with the target’s return light, creating competition with the reference light, a phenomenon known as interference competition. This issue is particularly prominent in integrated transceiver LDV systems, where the backscattered light from the lens can be comparable in intensity to the target’s return light, significantly degrading phase extraction accuracy and limiting the LDV’s applicability. To address this challenge, this paper proposes a noise suppression algorithm based on the In-phase and Quadrature (IQ) demodulation. The algorithm uses the power spectrum within each frame’s relevant frequency band as an evaluation metric and employs the Three-point Probe Extremum Localization (3P-PEL) method to estimate the amplitude and phase of the stray light interference with the reference light in real time. This enables the accurate extraction of the interference signal between the measurement light and the reference light. Both simulations and experiments validate the effectiveness of the proposed method. The simulation results demonstrate that when the stray-to-measurement power ratio is below 0.25, the proposed algorithm can suppress spurious signals induced by multi-beam interference by more than 25 dB, while experimental results show it can reduce such signals below the LDV’s noise floor in various motion scenarios. The proposed algorithm holds potential applications in laser interferometry and effectively enhances LDV measurement accuracy.

1. Introduction

The LDV is an instrument that leverages the laser Doppler effect to precisely measure target vibration parameters. Compared to other vibration measurement techniques, it offers significant advantages such as a wide measurement range, high sensitivity, and non-contact operation [1,2,3,4]. With the widespread application of components such as narrow-linewidth lasers, high-stability acousto-optic frequency shifters, and balanced photodetectors with high common-mode rejection ratios, the micro-vibration detection capabilities of LDVs have been further enhanced [5,6,7]. This technological evolution has extended their application scope to diverse fields including vibration measurement of large-structure facades [8], hydrodynamic parameter measurement [9], fruit ripeness detection [10] and bridge structural health monitoring [11].
Most LDVs adopt an integrated transceiver design, where the same telescope transmits the laser beam and receives the diffusely reflected light from the target. This significantly simplifies system alignment and enhances targeting ease. However, it also introduces substantial stray light, particularly backscattered light from the lens, which interferes with both the target return light and the reference beam, leading to interference competition. When traditional IQ demodulation is employed, this interference can generate spurious signals during vibration reconstruction [12,13]. The issue becomes especially pronounced when the target exhibits large out-of-plane motion, producing noise that traditional filtering techniques cannot effectively suppress. This phenomenon severely degrades the LDV’s ability to measure micro-vibrations on large-moving targets.
Research on multi-beam interference competition in LDVs has persisted for many years. Yarovoi et al. systematically derived the influence of three-beam interference on Doppler signals in heterodyne vibrometry [14], experimentally demonstrating that multiple beams induce signal distortions such as ripples and spikes. Hao et al. designed and developed a point-diffraction spatial optical circulator [15], achieving a 66 dB improvement in directivity compared to commercial circulators and significantly reducing multi-beam interference competition in the system. Wu et al. employed a chopping method to modulate continuous-wave lasers into pulsed light [16]. Using a time-multiplexing approach, they successfully separated signal and stray light in the time domain, enabling micro-vibration detection at distances of tens of meters. However, this scheme cannot acquire continuous signals and faces challenges in multiplexing at short distances. Kong et al. proposed introducing a beam with controllable phase and amplitude, while adding an additional monitoring channel to ensure that the newly introduced beam matches the stray light in amplitude but is opposite in phase, thereby suppressing the negative effects of stray light [17]. This method performs well under stable stray light conditions, but its effectiveness decreases significantly in non-laboratory environments. Wang et al. proposed a differential preprocessing method for chirp signal suppression [18], achieving an 81.8% reduction in chirp signal power. Nevertheless, its effectiveness diminishes in scenarios with low target velocity and drastic optical power fluctuations.
This study leverages the conversion relationship between the Doppler frequency shifts obtained from multi-beam interference and conventional interference to propose a multi-beam interference suppression algorithm based on the 3P-PEL method. The algorithm estimates the amplitude and phase of the interference between stray light and the reference beam in the LDV system, effectively reducing the impact of stray light on vibration detection. As shown in Table 1, a summary comparison is provided between the proposed scheme and other multi-beam interference suppression approaches. Unlike competing solutions, this method requires no additional optical path setup while enabling continuous signal processing. It demonstrates superior interference suppression performance and enhanced adaptability to both system configurations and target conditions. Detailed principles and implementation are described below.

2. Principle

Figure 1 illustrates the working principle of a typical LDV. The system employs a Mach-Zehnder interferometric architecture, where the laser output is delivered via optical fiber and emitted through a transceiver telescope toward a rough target. Light scattered from the rough surface is recollected by the same telescope and coupled back into the fiber head. Through an optical circulator, the return signal interferes heterodynically with the reference beam that has been frequency-shifted by an acousto-optic modulator (AOM). The resulting signal is converted to an electrical signal by a balanced photodetector (BPD), which can then be acquired by a data acquisition card and processed through IQ demodulation algorithms to recover the target’s vibration information [19,20].
In an ideal system, the BPD receives only the reference and measurement beams. The resulting photocurrent from interference can be expressed as follows:
i s t r ( t ) | E r e i [ ( ω + ω 0 ) t φ r ] + E m e i [ ω t φ m ( t ) ] | 2   = E r 2 + E m 2 + 2 E r E m cos ( ω 0 t + φ m ( t ) φ r ) ,
where E r and E m denote the electric field amplitudes of the reference and measurement beams, respectively; ω and ω 0 represent the laser angular frequency and the heterodyne angular frequency introduced by the AOM, respectively; ϕ r and ϕ m ( t ) correspond to the initial phase of the reference beam and the time-varying phase shift induced by target vibration. The vibration-dependent phase term ϕ m ( t ) relates to the target displacement s ( t ) as: φ 1 ( t ) = 4 π s ( t ) / λ , where λ is the laser wavelength.
In practical optical systems, the photodetection signals received by the BPD deviate from ideal conditions due to various non-ideal characteristics of optical components. The laser emission exhibits imperfect linear polarization, while the transmissive optics in the transceiver telescope system demonstrate less than 100% surface transmittance. Furthermore, the polarization beam splitter (PBS) within the optical circulator possesses finite extinction ratios and suboptimal transmission efficiency. Additional stray light contributions arise from manufacturing imperfections in optical elements, including microscopic particulates and surface roughness. This parasitic light subsequently interferes with both the reference and measurement beams, introducing unwanted phase perturbations in the interferometric measurement. To facilitate theoretical analysis, we collectively represent the complex amplitude summation of all stray light components as E s t r e i [ ω t φ s t r ] . Consequently, the photocurrent generated through interference in the practical system can be reformulated as follows:
i ( t ) | E r e i [ ( ω + ω 0 ) t φ r ] + E m e i [ ω t φ m ( t ) ] + E s t r e i [ ω t φ s t r ] | 2   = E r 2 + E m 2 + E s t r 2 + 2 E r E m cos ( ω 0 t + φ m ( t ) φ r )     + 2 E r E s t r cos ( ω 0 t + φ s t r φ r )     + 2 E m E s t r cos ( φ m ( t ) φ s t r ) .
The DC component in Equation (2) can be effectively suppressed by leveraging the common-mode rejection characteristic of the BPD. Furthermore, since both the additional phase and intensity fluctuations introduced by stray light primarily manifest at low frequencies, a bandpass filter centered at ω 0 with a bandwidth encompassing the signal frequency range can be employed to suppress the third AC interference term in the equation. Consequently, the photocurrent component that ultimately impacts phase extraction can be simplified to
i B P F ( t ) 2 E r E m cos ( ω 0 t + φ m ( t ) φ r )     + 2 E r E s t r cos ( ω 0 t + φ s t r φ r )   = I cos ( ω 0 t + φ s ) ,
where I and φ s can be expressed as
I = 2 E r E m 2 + E s t r 2 + 2 E m E s t r cos ( φ m ( t ) φ s t r ) ,
tan φ s ( t ) = E m sin ( φ m ( t ) φ r ) + E s t r sin ( φ s t r φ r ) E m cos ( φ m ( t ) φ r ) + E s t r cos ( φ s t r φ r ) .
Consequently, the phase φ s extracted via IQ demodulation deviates from the ideal interference phase φ m ( t ) φ r , introducing a measurable discrepancy. Based on this deviation, the instantaneous Doppler angular frequency ω d o p p l e r , s in practical systems can be derived as follows [14]:
ω d o p p l e r , s = 1 2 [ 1 + 1 E s t r 2 E m 2 1 + E s t r 2 E m 2 + 2 E s t r E m cos ( φ m ( t ) φ s t r ) ] d φ m ( t ) d t   = 1 2 [ 1 + 1 a 2 1 + a 2 + 2 a cos ( Δ φ ( t ) ) ] · ω d o p p l e r , l ,
where ω d o p p l e r , l represent the instantaneous Doppler angular frequency under ideal conditions. The amplitude ratio of stray light to measurement light a and Δ φ ( t ) are defined as follows:
a = E s t r / E m ,
Δ φ ( t ) = φ m ( t ) φ s t r .
When the object’s velocity is significantly smaller than the speed of light, a linear relationship exists between the instantaneous velocity and the instantaneous Doppler angular frequency. Thus, the instantaneous velocity v s can be expressed as
v s = η ( a , Δ φ ( t ) ) · v l ,
where v l denotes the instantaneous velocity under ideal conditions. η is defined as follows:
η ( a , Δ φ ( t ) ) = 1 2 [ 1 + 1 a 2 1 + a 2 + 2 a cos ( Δ φ ( t ) ) ] .
Based on the above formulas, the velocity demodulation results v s can be analyzed under different scenarios as follows:
(1)
If the stray light power is zero, as discussed, η = 1 , v s = v l . The IQ demodulation method can accurately extract the instantaneous velocity.
(2)
If the target surface exhibits only small-amplitude, high-frequency vibration (with an amplitude much smaller than the wavelength), cos ( Δ φ ( t ) ) and η can be regarded as a stable value. The IQ demodulation result exhibits a linear scaling relationship with the target’s vibrational motion, and no spurious signals are generated.
(3)
If the target undergoes large-amplitude, low-frequency motion with non-negligible stray light power. The variable Δ φ ( t ) is guaranteed to traverse every value within the interval [ 0 , 2 π ] with a sweep frequency of 2 v l / λ . Due to the nonlinearity of function η , spurious signals emerge at frequency 2 n v l / λ , n = 1 , 2 , . The frequency of these artifacts varies proportionally with the target’s velocity, generating the characteristic chirp signal in the system.
(4)
Specifically, if a = 1 and Δ φ ( t ) = π , η , leading to severe signal distortion. However, this degenerate case requires exceptionally stringent conditions to manifest in practice.
Based on the above analysis, the presence of stray light transforms the ideal two-beam interference into multi-beam interference, causing deviations between the IQ demodulated phase and the ideal phase. Moreover, the closer the stray light power approaches the measurement light power, the more pronounced the resulting chirp signal becomes. As this constitutes a nonlinear process, simple correction methods prove ineffective. The unknown amplitude and phase of the stray light further compound the difficulty of implementing corrective processing.

3. Correction Algorithm

To obtain the true instantaneous velocity, according to Equation (9), real-time correction of the velocity can be achieved if both Δ φ ( t ) and a are acquired in real-time, expressed as follows:
v l ( t ) = v s ( t ) η ( a , Δ φ ( t ) ) .
In practical scenarios, environmental temperature variations and mechanical vibrations can induce fluctuations in both the intensity and phase of stray light. However, such variations exhibit slow temporal evolution, allowing the carrier signal to be segmented into frames. Within each frame, the amplitude and phase of the interference between stray light and the reference beam can be assumed to remain stable.
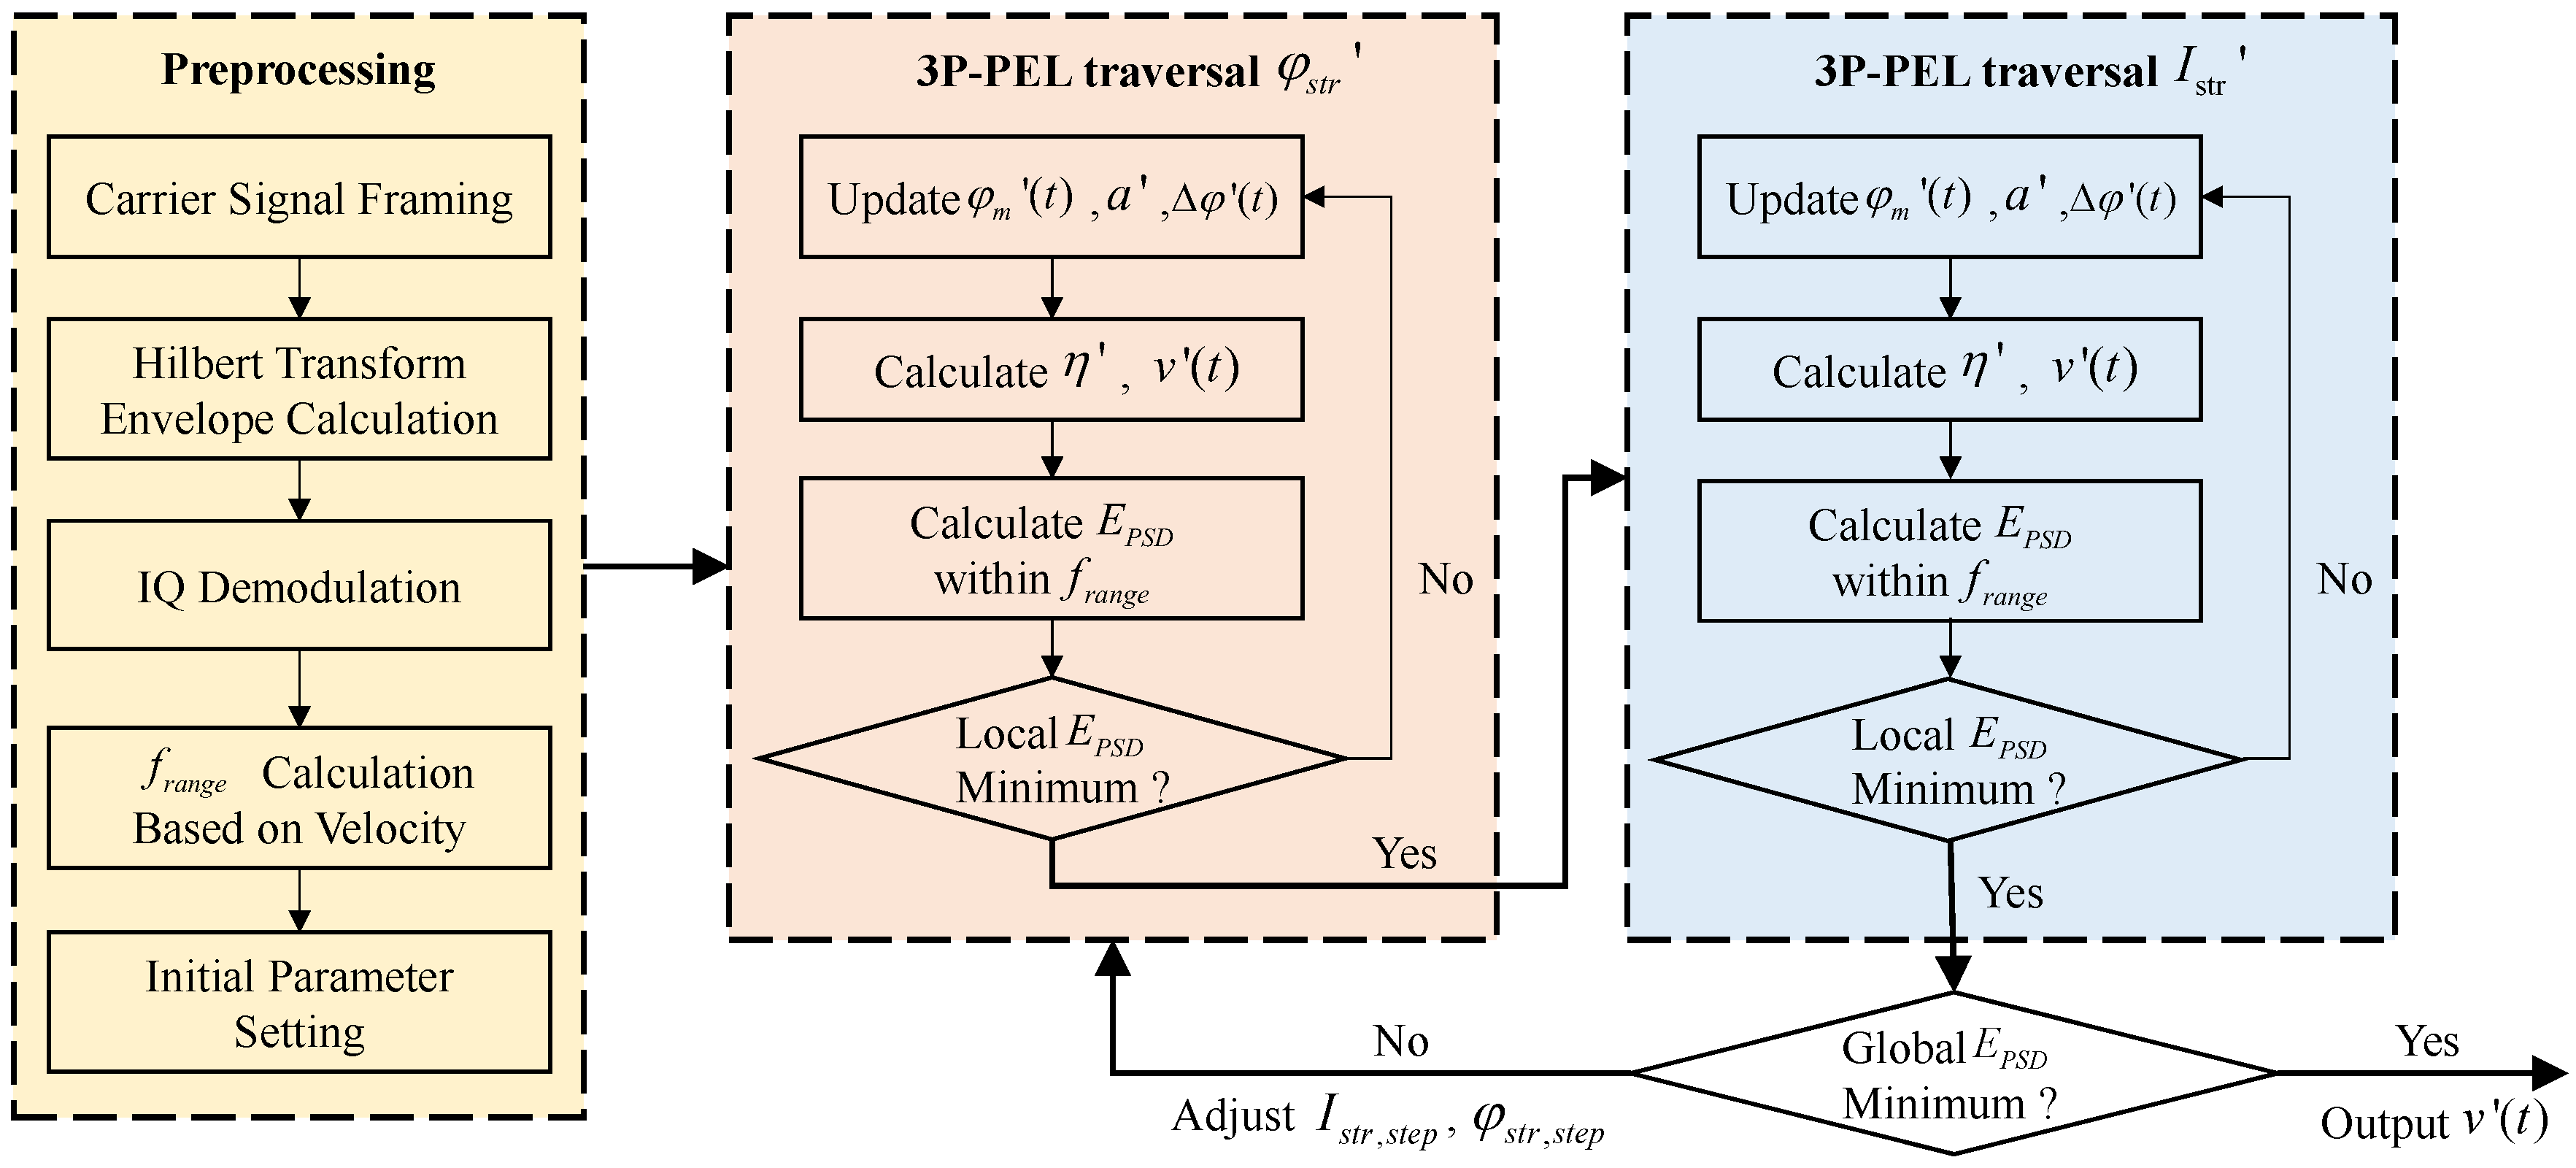
Note that the frequency range of the chirp signal is correlated with the target movement velocity. Thus, the approximate frequency range of the chirp signal can be derived from the velocity range of the single-frame velocity signal. From a power spectrum perspective, the presence of stray light introduces additional spurious signal power in the corresponding frequency band. Based on this property, the corrected velocity v ( t ) can be calculated by iterating through the intensity I s t r and phase φ s t r after interference between the stray light and the reference beam. v ( t ) total power spectrum energy E P S D in the target frequency band serves as an evaluation metric. When E P S D is minimized, the algorithm has estimated values approaching the true intensity I s t r and true phase φ s t r after interference between the stray light and reference beam. Consequently, the true vibration of the target can be more accurately estimated. The specific algorithmic workflow is illustrated in Figure 2.
STEP 1. Preprocessing: The carrier signal is divided into frames with partial overlap between adjacent segments to ensure smooth transitions when reconstructing the filtered demodulated signal. The envelope I e n v ( t ) of the carrier signal is calculated using the Hilbert transform, from which the phase φ s ( t ) and uncorrected object velocity v ( t ) are obtained through conventional demodulation algorithms. The calculated maximum velocity v max and minimum velocity v min per frame allow estimating the frequency range f r a n g e of spurious signals caused by interference competition within the velocity power spectrum as [ 2 v min / λ , 2 v max / λ ] . Set the initial values for the amplitude and phase of the stray light’s interference with the reference beam as I s t r , i n i and φ s t r , i n i , respectively, and define the iterative step sizes as I s t r , s t e p (for amplitude) and φ s t r , s t e p (for phase).
STEP 2. 3P-PEL traversal φ s t r : Given that the stray light power is typically lower than the signal light power in practical systems, the estimated value a for parameter a can be expressed based on the initial conditions I s t r , i n i as follows:
a = 2 E r E s t r 2 E r E m = 1 2 E r E m + 2 E r E s t r 2 E r E s t r 1 1 I e n v ( t ) I s t r , i n i 1 .
The estimated value φ m ( t ) for parameter φ m ( t ) can be expressed based on the initial conditions φ s t r , i n i as
φ m ( t ) = arg ( exp ( i φ s ( t ) ) a exp ( i φ s t r ) ) .
The estimated value Δ φ ( t ) for parameter Δ φ ( t ) can be expressed as follows:
Δ φ ( t ) = φ m ( t ) φ s t r .
Based on the initial values of the amplitude Δ φ ( t ) and phase a , the conversion coefficient η ( a , Δ φ ( t ) ) can be estimated as
η ( a , Δ φ ( t ) ) = 1 2 [ 1 + 1 a 2 1 + a 2 + 2 a cos ( Δ φ ( t ) ) ] .
Based on the above equation, the corrected velocity value v ( t ) can be further estimated as
v ( t ) = v s ( t ) / η ( a , Δ φ ( t ) ) .
Calculate the power sum E P S D of the power spectral density (PSD) of parameter v ( t ) within the frequency band f r a n g e :
E P S D = 2 v min / λ 2 v max / λ S v ( f ) d f
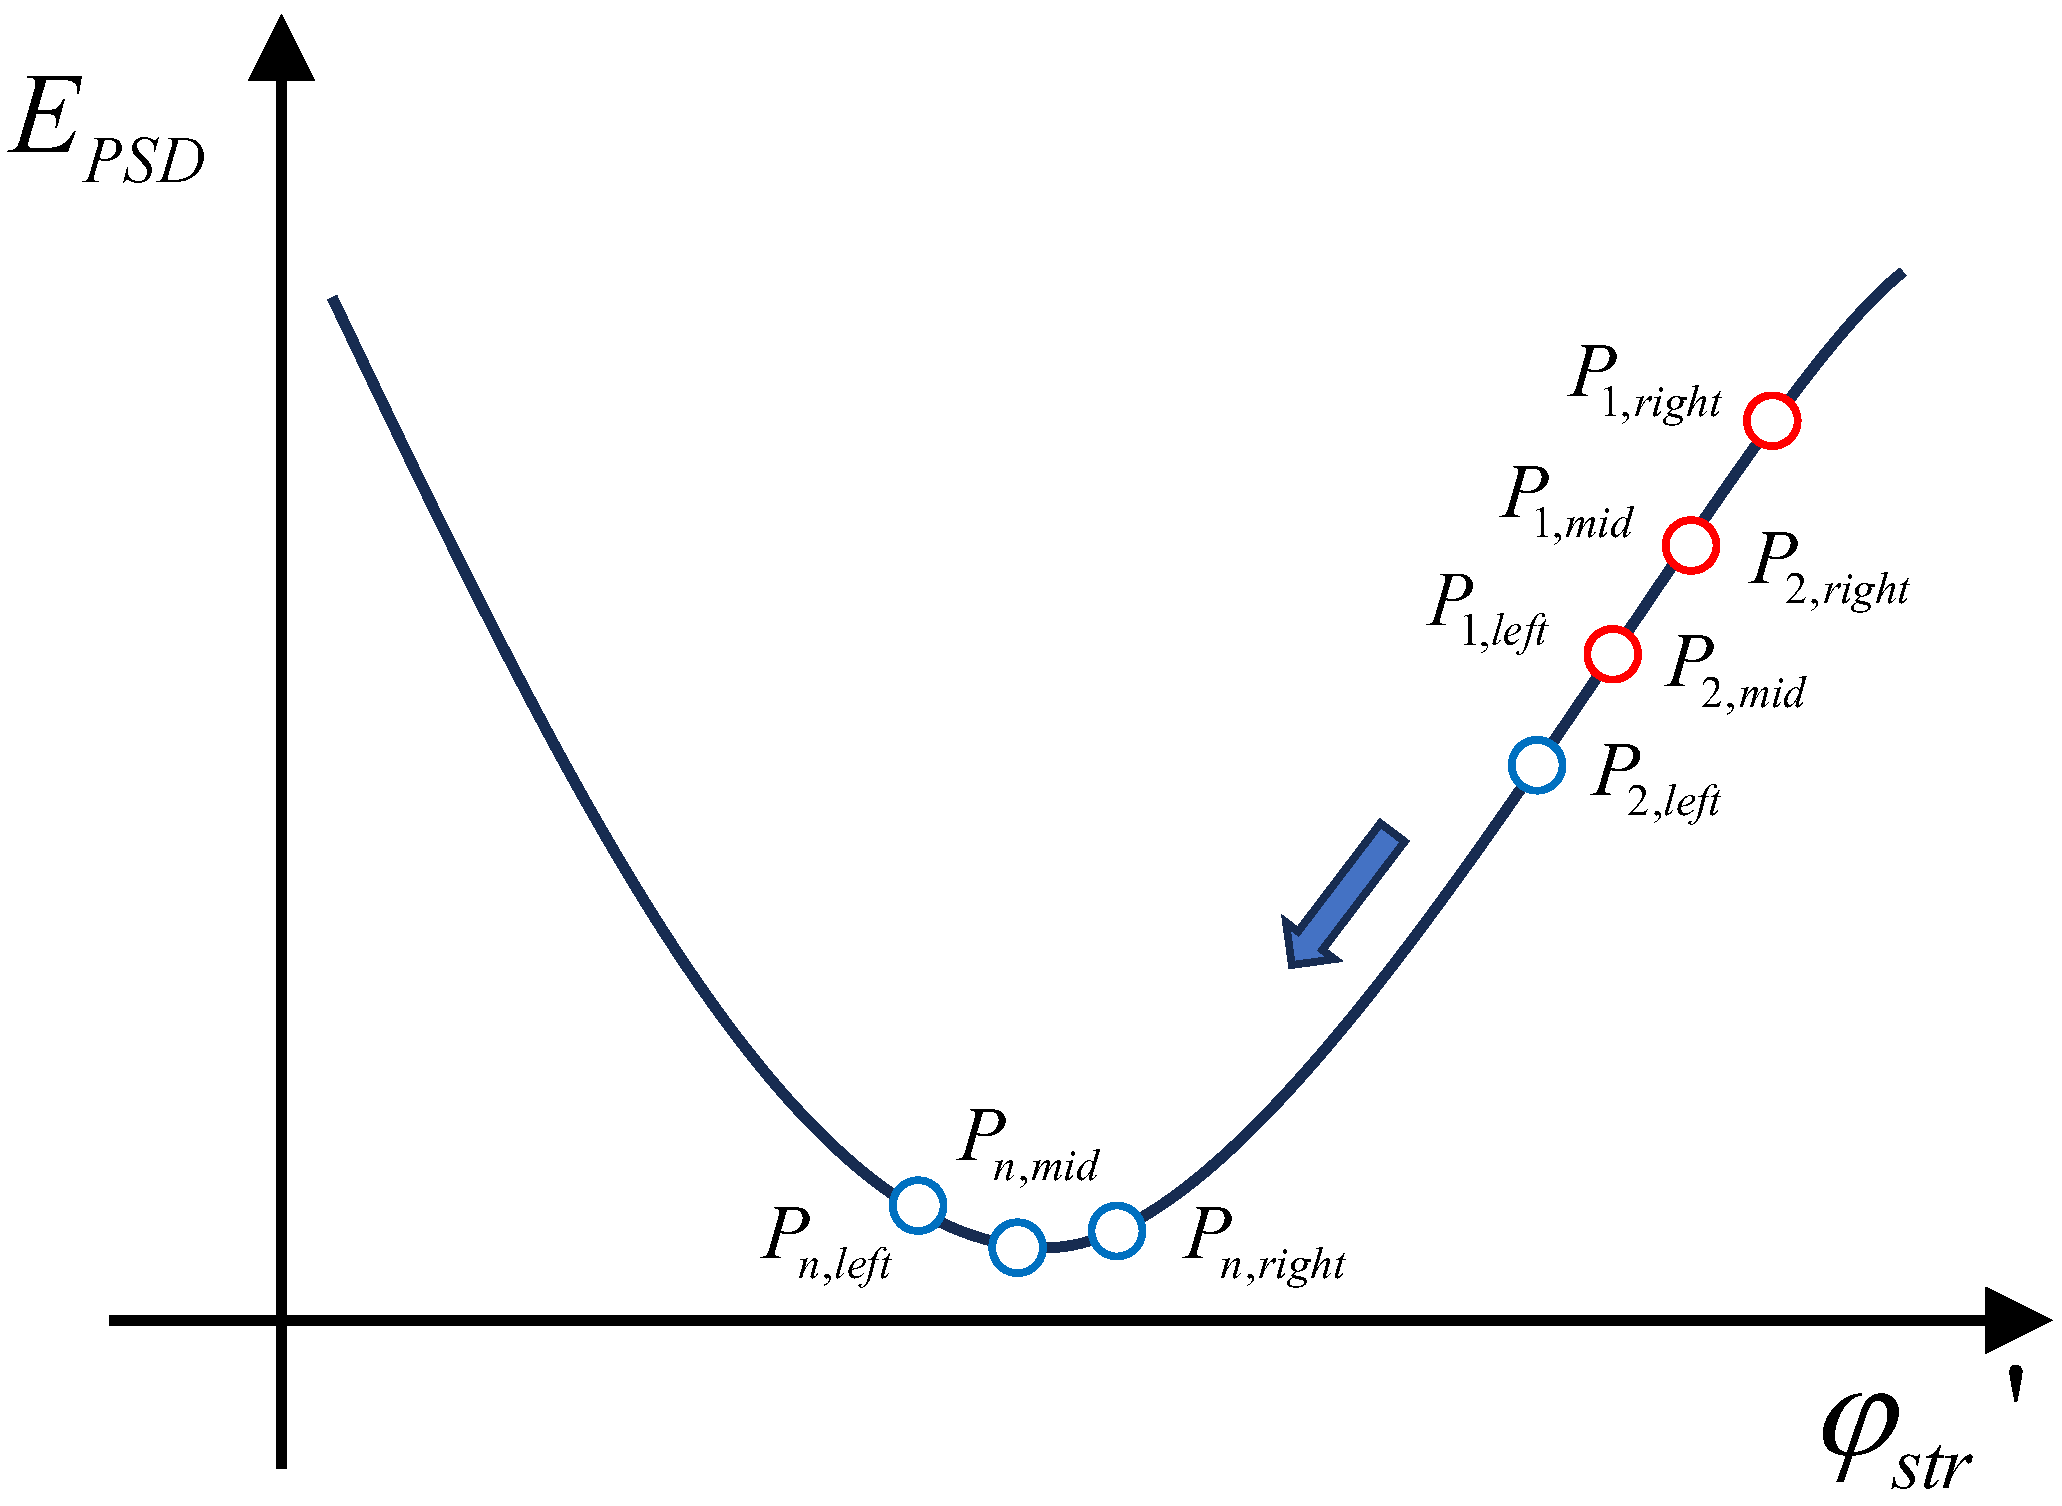
Take E P S D as the evaluation metric. While holding a constant, different values of φ s t r are iterated to calculate E P S D , and the optimal φ s t r is determined via 3P-PEL. A schematic diagram of the 3P-PEL calculation process is provided below for reference.
Here is the workflow of 3P-PEL. Given the initial values I s t r , i n i and φ s t r , i n i , the algorithm calculates E P S D of v ( t ) individually when φ s t r takes the values φ s t r , i n i φ s t r , s t e p , φ s t r , i n i , and φ s t r , i n i + φ s t r , s t e p , corresponding to the points P 1 , l e f t , P 1 , m i d , and P 1 , r i g h t in Figure 3. Given P 1 , l e f t < P 1 , m i d < P 1 , r i g h t , we infer that the local minimum of E P S D will occur to the left of P 1 , l e f t . Thus, we assign P 2 , r i g h t = P 1 , m i d , P 2 , m i d = P 1 , l e f t and compute E P S D under condition φ s t r , i n i 2 φ s t r , s t e p , which corresponds to point P 2 , l e f t in Figure 3. This process repeats iteratively until the loop termination condition P 1 , l e f t > P 1 , m i d , P 1 , m i d < P 1 , r i g h t is met (i.e., E P S D reaches a local minimum). The resulting value φ s t r is then passed to STEP 3.
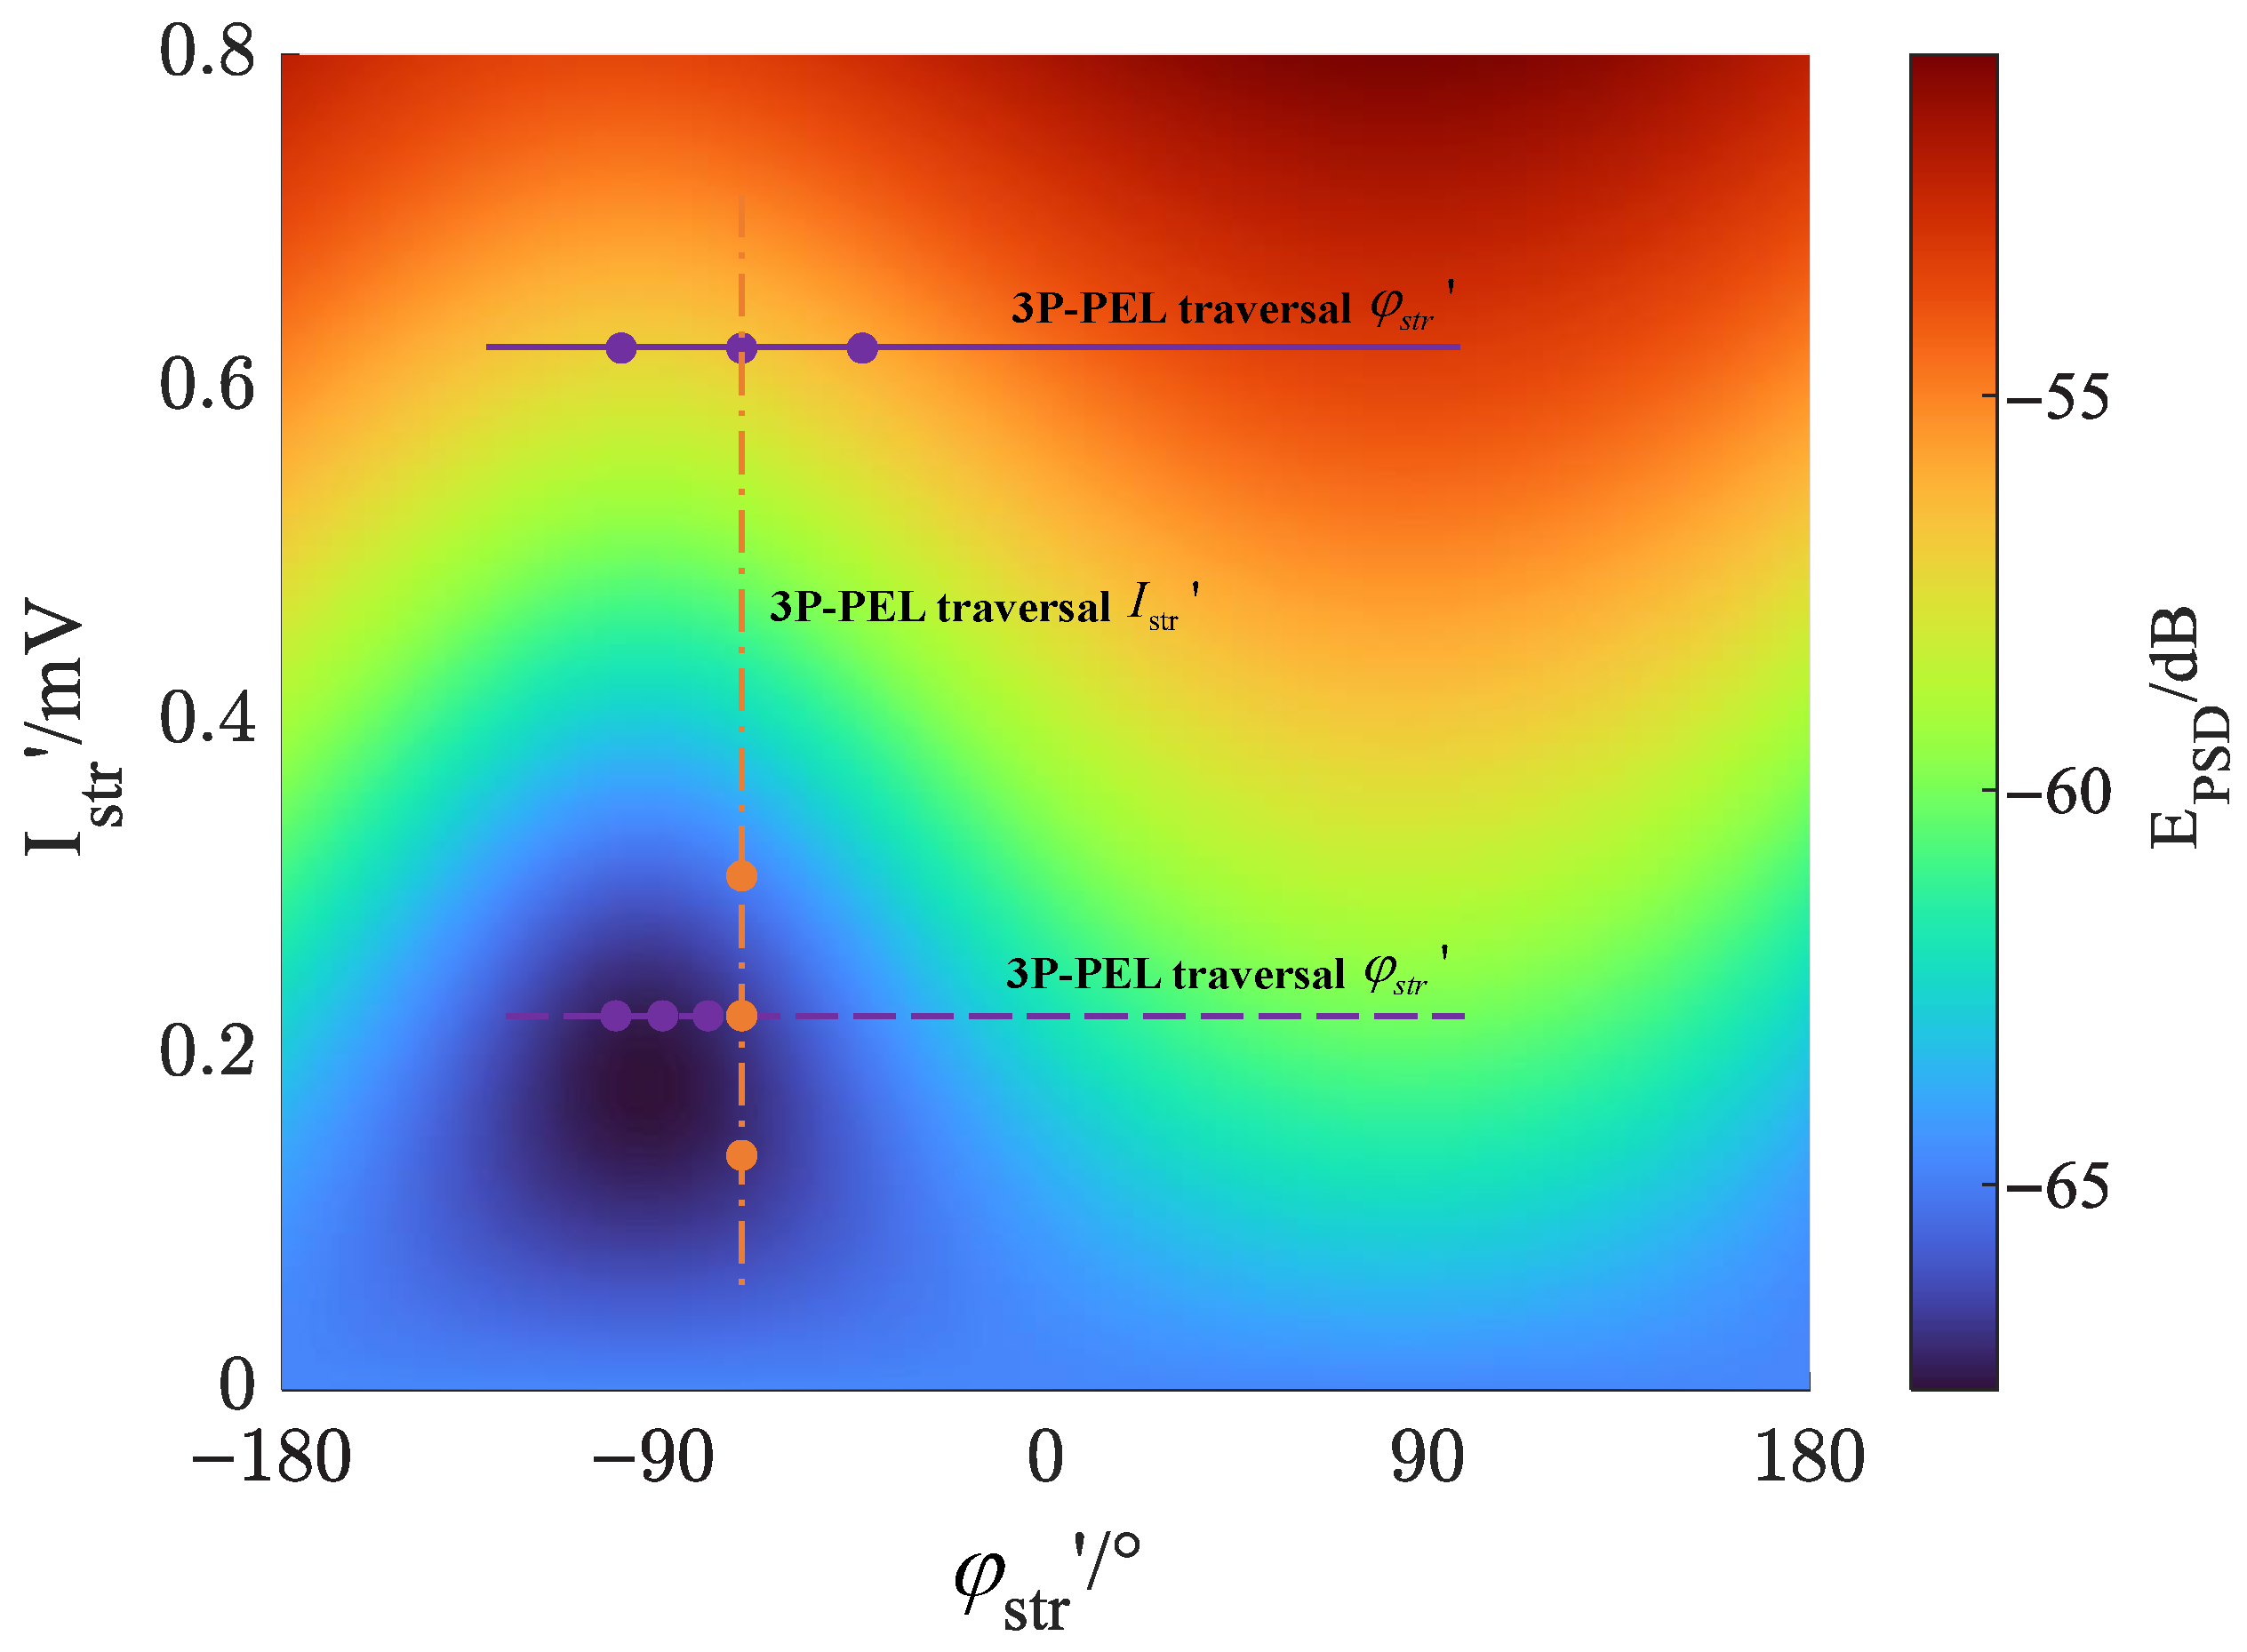
STEP 3. 3P-PEL traversal I s t r : To illustrate the workflow more clearly, assume ideal conditions I s t r = 0.2 mV and φ s t r = π / 2 . Under this assumption, the computational results E P S D are derived for all possible inputs I s t r and φ s t r . As shown in Figure 4, the solid purple line represents the initial traversal of parameter φ s t r in STEP 2, with each iteration refining its value. The purple circle on the line marks the final iteration result of STEP 2. In STEP 3, this converged result is used as input for traversing and optimizing parameter I s t r .
As illustrated by the orange dash-dotted line in Figure 4, φ s t r is held constant while varying I s t r iteratively. Similar to STEP 2, the loop evaluates the power sum of v ( t ) within f r a n g e and uses E P S D as the metric. The loop terminates when E P S D reaches a local minimum. I s t r obtained at this step is passed as input to STEP 4.
STEP 4. Iterative Loop: As shown in Figure 4, after one iteration cycle, adjusting parameters I s t r and φ s t r , E P S D is significantly reduced, with I s t r and φ s t r approaching their ground-truth values. To refine the results further, the correction algorithm decreases the iteration step sizes ( I s t r , s t e p and φ s t r , s t e p ) and repeats STEPs 2 and 3 (indicated by the purple dashed line in Figure 4). The process continues until the change in E P S D falls below the predefined threshold ε t h , at which point E P S D is considered to have reached the global minimum and completes the correction, outputting the corrected velocity v ( t ) .

4. Simulation

To better illustrate the multi-beam interference competition phenomenon and the effectiveness of the correction algorithm, this section provides a simulation analysis of three special cases under typical LDV application scenarios. The baseline configuration for simulated data processing was set as follows: LDV carrier frequency at 250 kHz, sampling rate of 2 MHz, with a frame length of 50 ms and frame shift of 45 ms.

4.1. Uniform Motion

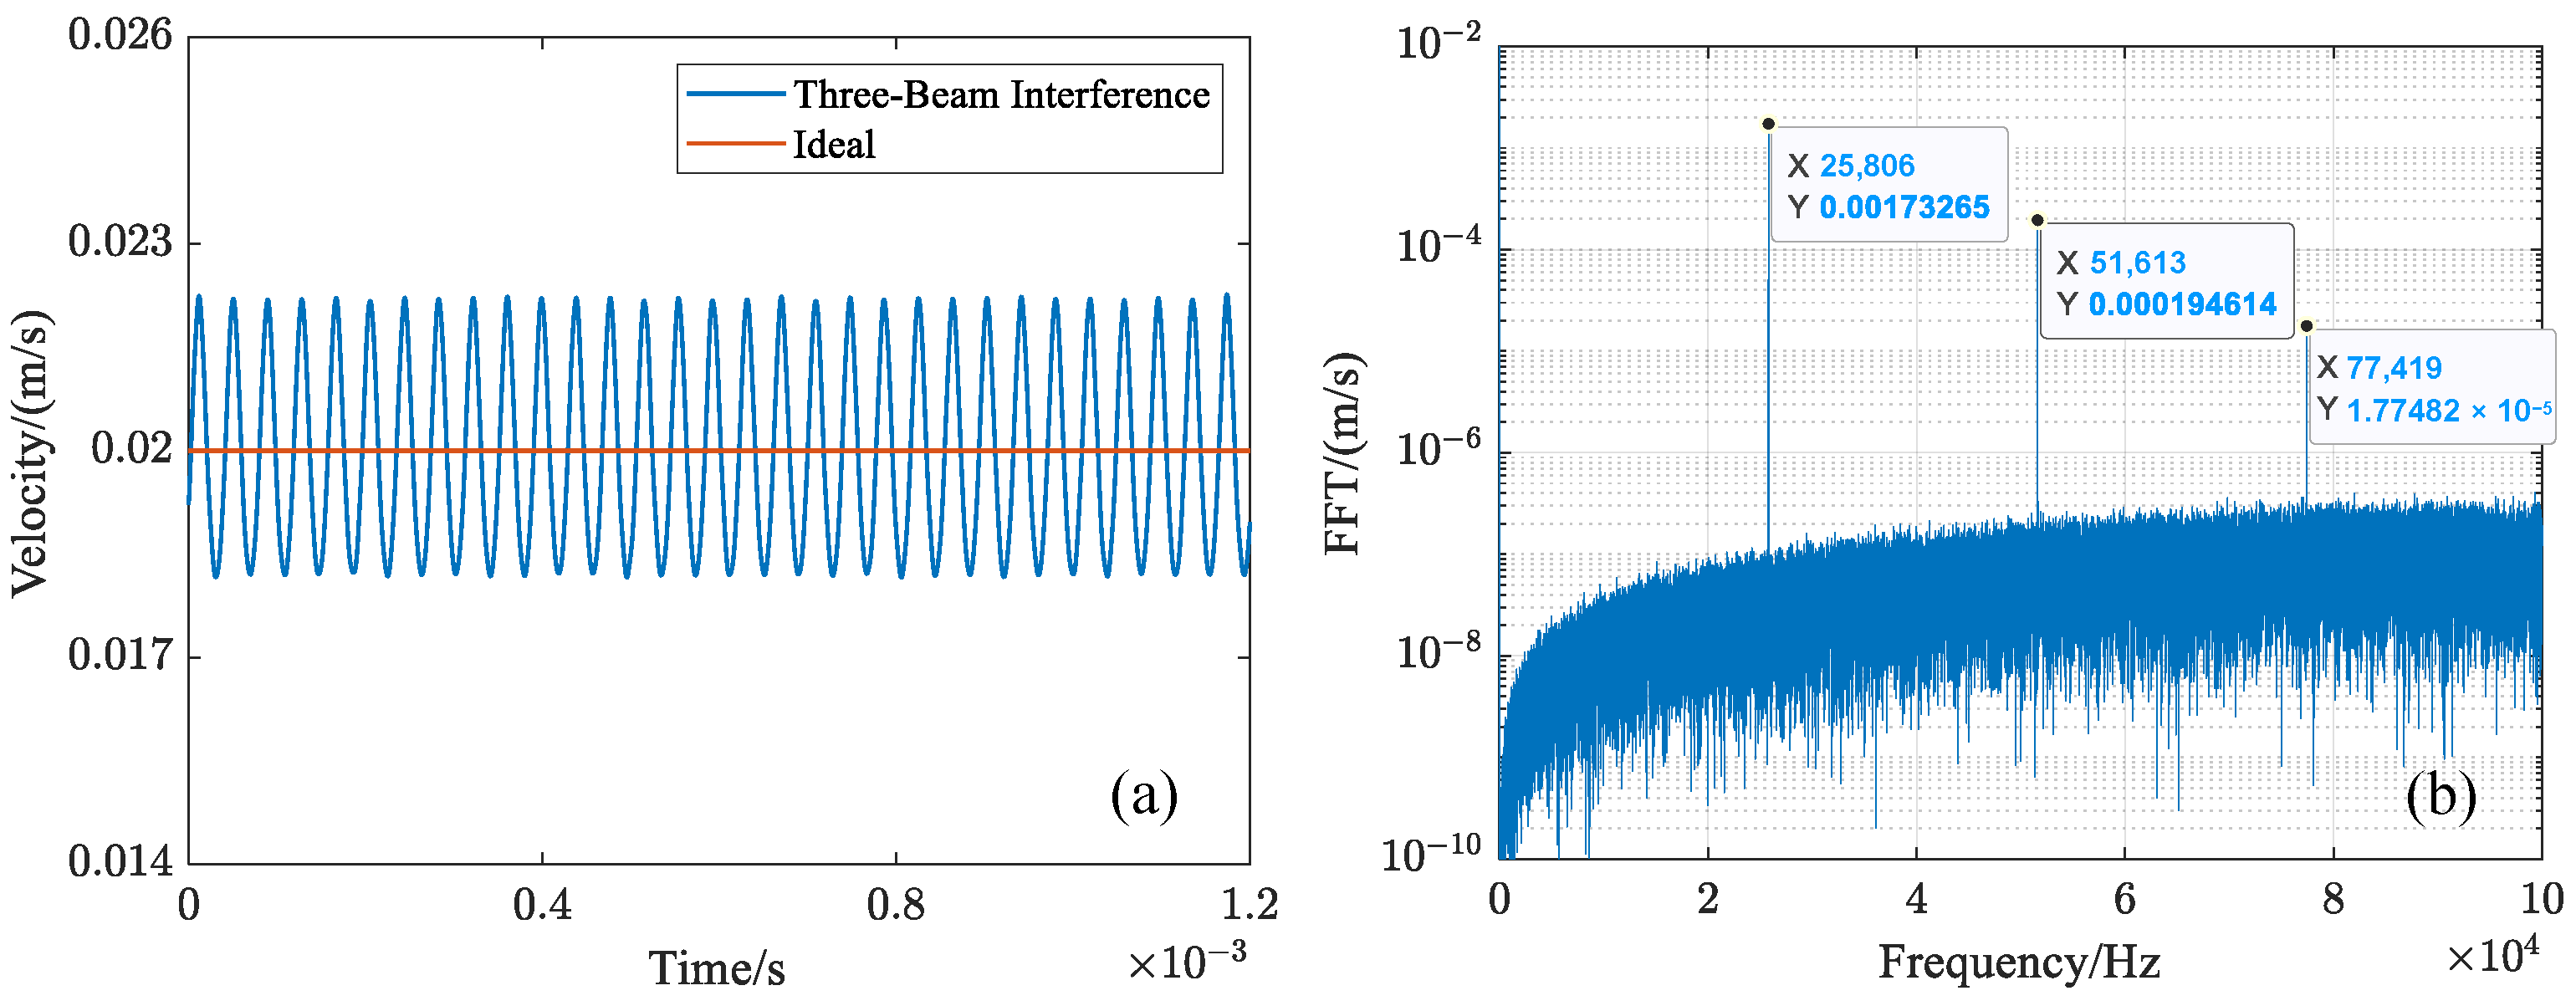
Assuming the stray light power is 1% of the measurement light power, the amplitude ratio between the stray light and measurement light is 1:10 (i.e., a = 0.1 ). The target undergoes a uniform out-of-plane motion at 20 mm/s. As shown in Figure 5, IQ demodulation is applied to the carrier signals obtained from two-beam ideal interference and three-beam interference. This yields the time-domain velocity signal and the fast Fourier transform (FFT) spectrum of the velocity signal under three-beam interference conditions.
From Figure 5, it can be observed that the velocity signal obtained through three-beam demodulation fluctuates around the ideal velocity signal with quasi-periodic noise. This phenomenon occurs because parameter Δ φ ( t ) rapidly varies around a central angular velocity, 4 π v 0 / λ (where v 0 represents the object’s mean velocity), causing the velocity to oscillate at a central frequency, f 0 = 2 v 0 / λ . As a result, a spurious signal appears at the fundamental frequency of 25.8 kHz. Additionally, due to the nonlinear effects of stray light, harmonic spurious signals are generated at integer multiples of this frequency (e.g., 51.6 kHz).

4.2. Uniform Motion + Micro-Vibrations

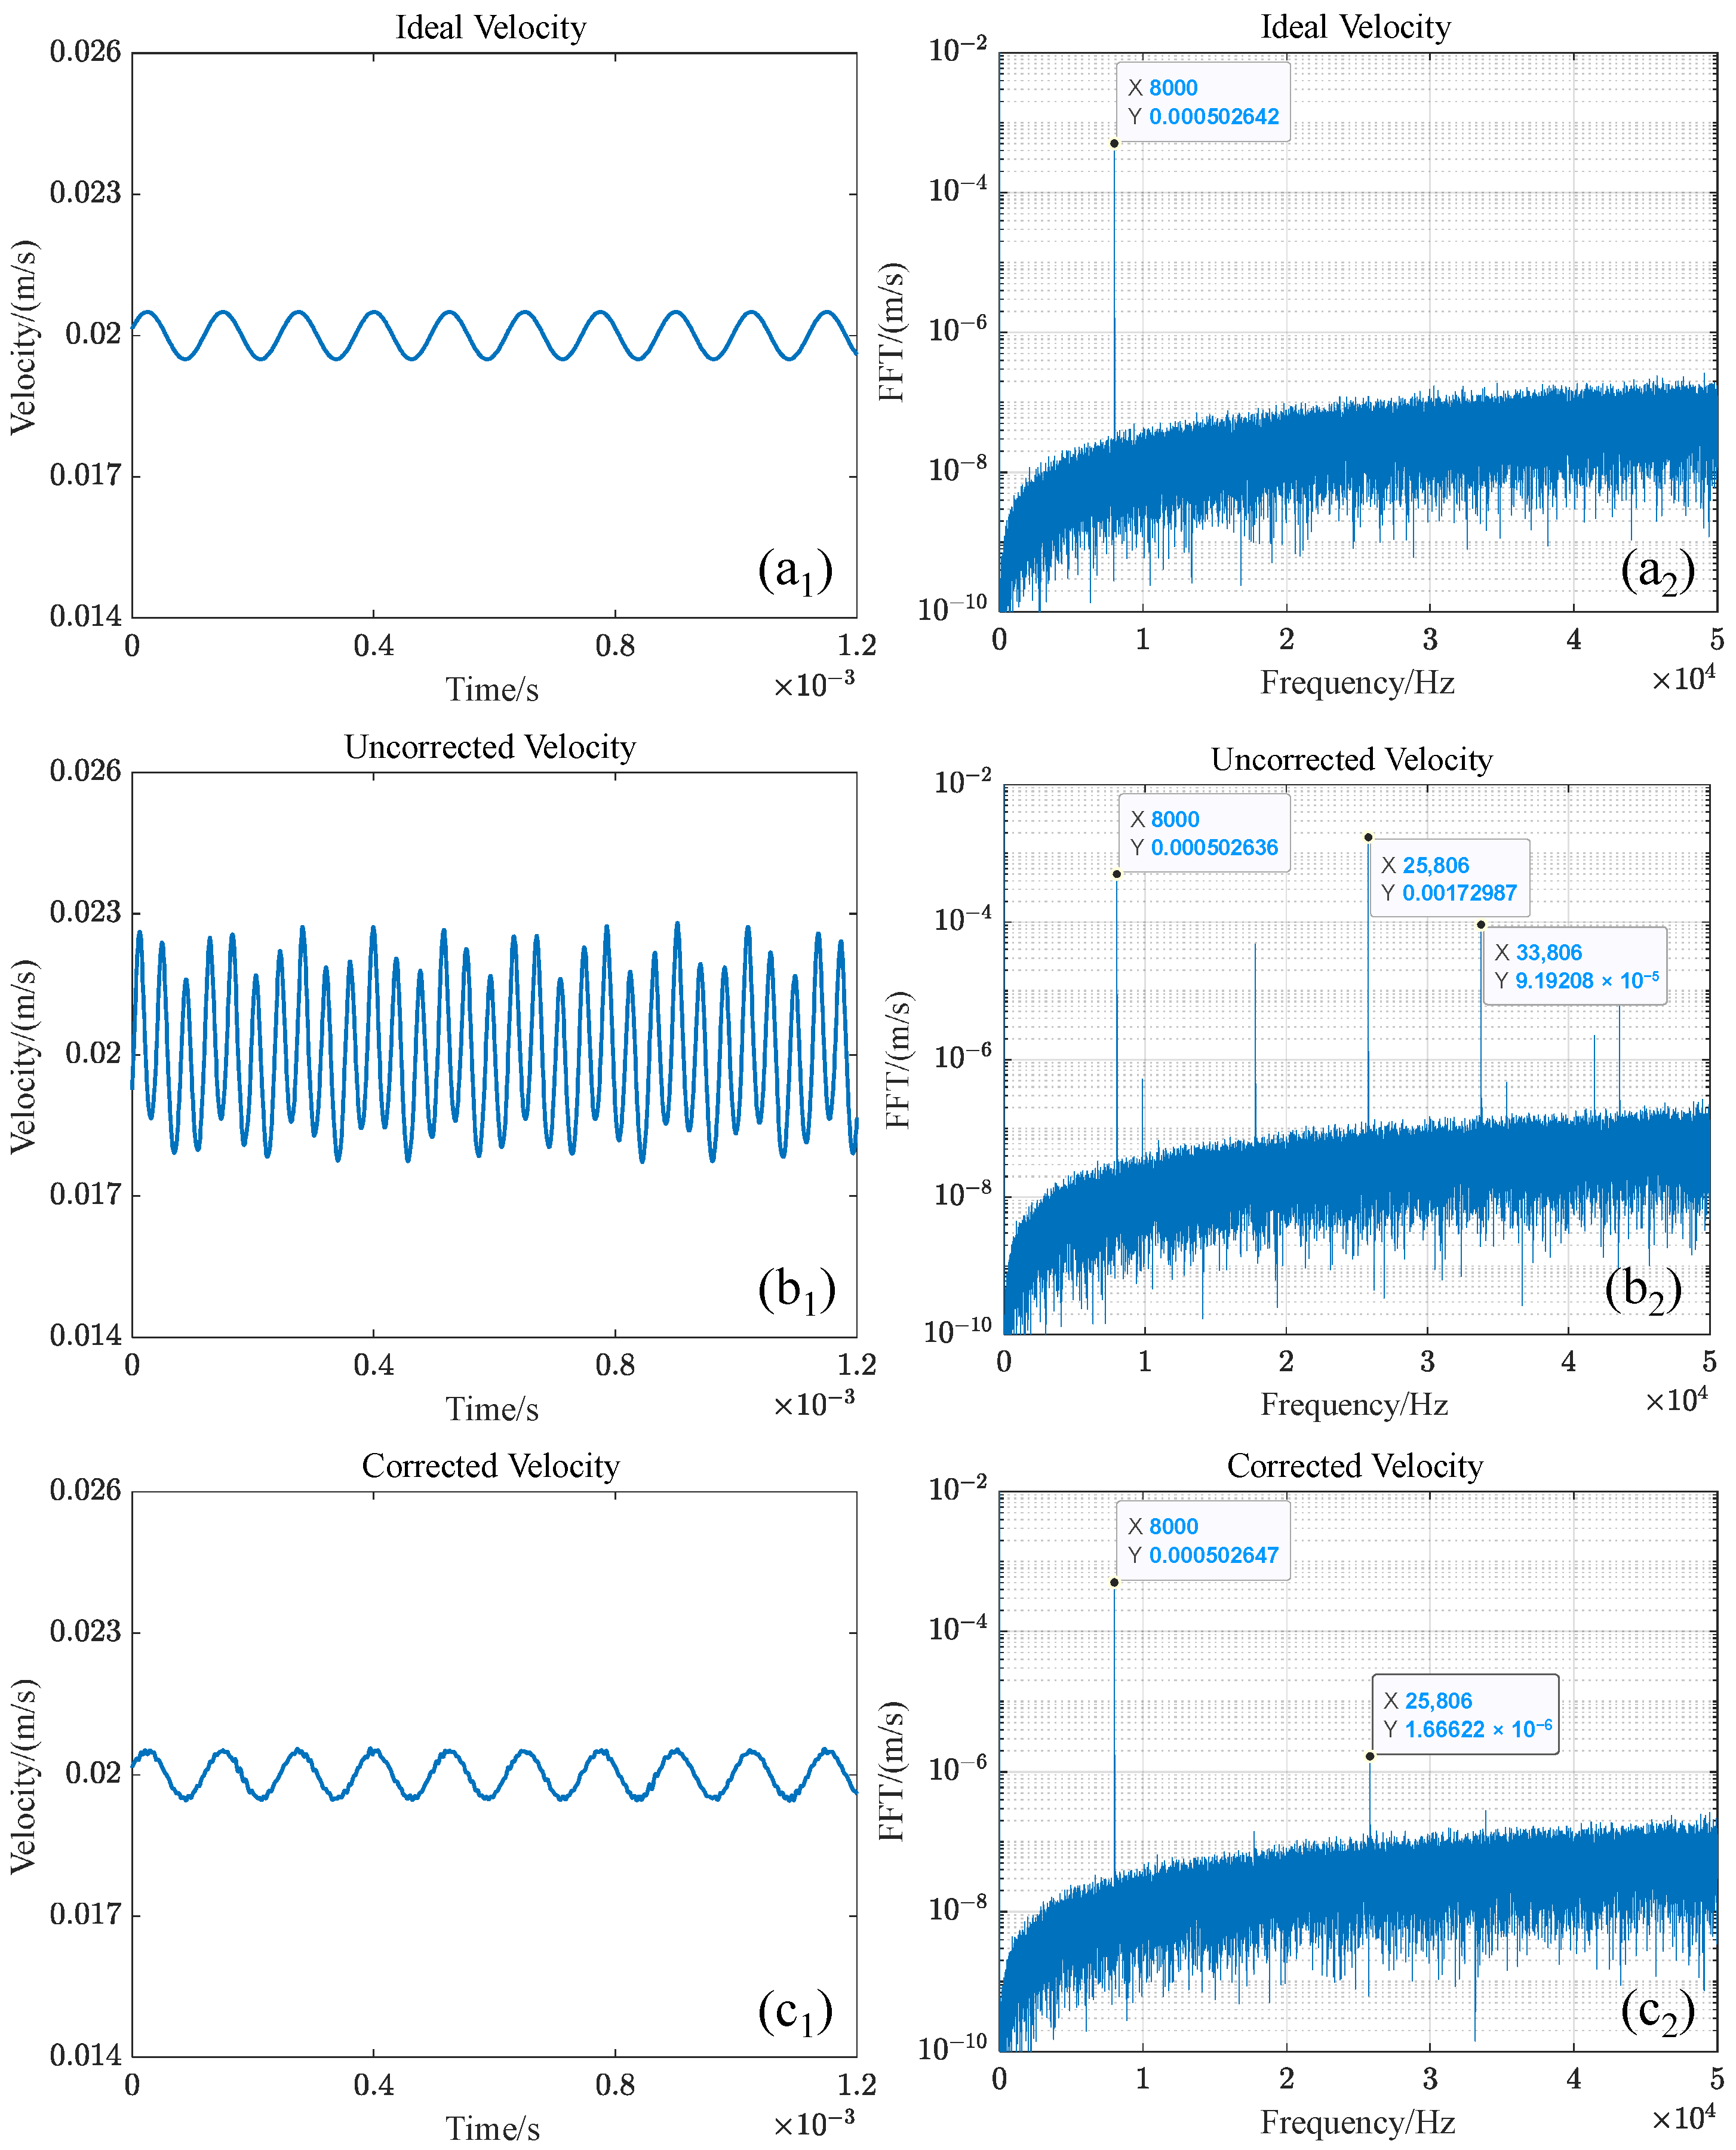
In LDV measurements, the system must simultaneously extract both large-scale motion (e.g., the previously mentioned uniform velocity) and micro-vibrations superimposed on this motion. Maintaining all other parameters constant, we modified the target motion profile to include an 8 kHz test signal with 10 nm amplitude superimposed on a 20 mm/s uniform motion. The time-domain waveforms and frequency spectra of the demodulated velocity signals were calculated for both ideal two-beam interferometry and corrected three-beam interferometry cases, as shown in Figure 6.
Figure 6( b 2 ) demonstrates that the uncorrected signal contains not only the true 8 kHz vibration component but also multiple higher-order frequency terms. These include both the fundamental frequency component f 0 (derived directly from the large-scale velocity as previously discussed) and its harmonics, as well as additional spectral peaks offset from f 0 and its harmonics by integer multiples of the vibration signal frequency. Even when stray light power is merely 1/100 of the measurement beam power, the multi-beam interference introduces spurious signals with amplitudes exceeding three times that of the true signal, significantly compromising the acquisition of genuine vibration data.
The proposed correction algorithm demonstrates significant effectiveness in processing the measured data. Comparative analysis of Figure 6( a 1 , c 1 ), after velocity correction, the demodulated velocity exhibits nearly identical characteristics to the ideal velocity. Comparative analysis of Figure 6( b 2 , c 2 ) reveals a substantial reduction in the spurious signal peak at 25.8 kHz—decreasing from 1.73 × 10 3 m/s to 1.72 × 10 6 m/s, representing an impressive 30 dB attenuation. Furthermore, all remaining harmonic noise components have been suppressed below the noise threshold, becoming indistinguishable. These results confirm that our multi-beam interference competition suppression algorithm achieves excellent interference mitigation performance.
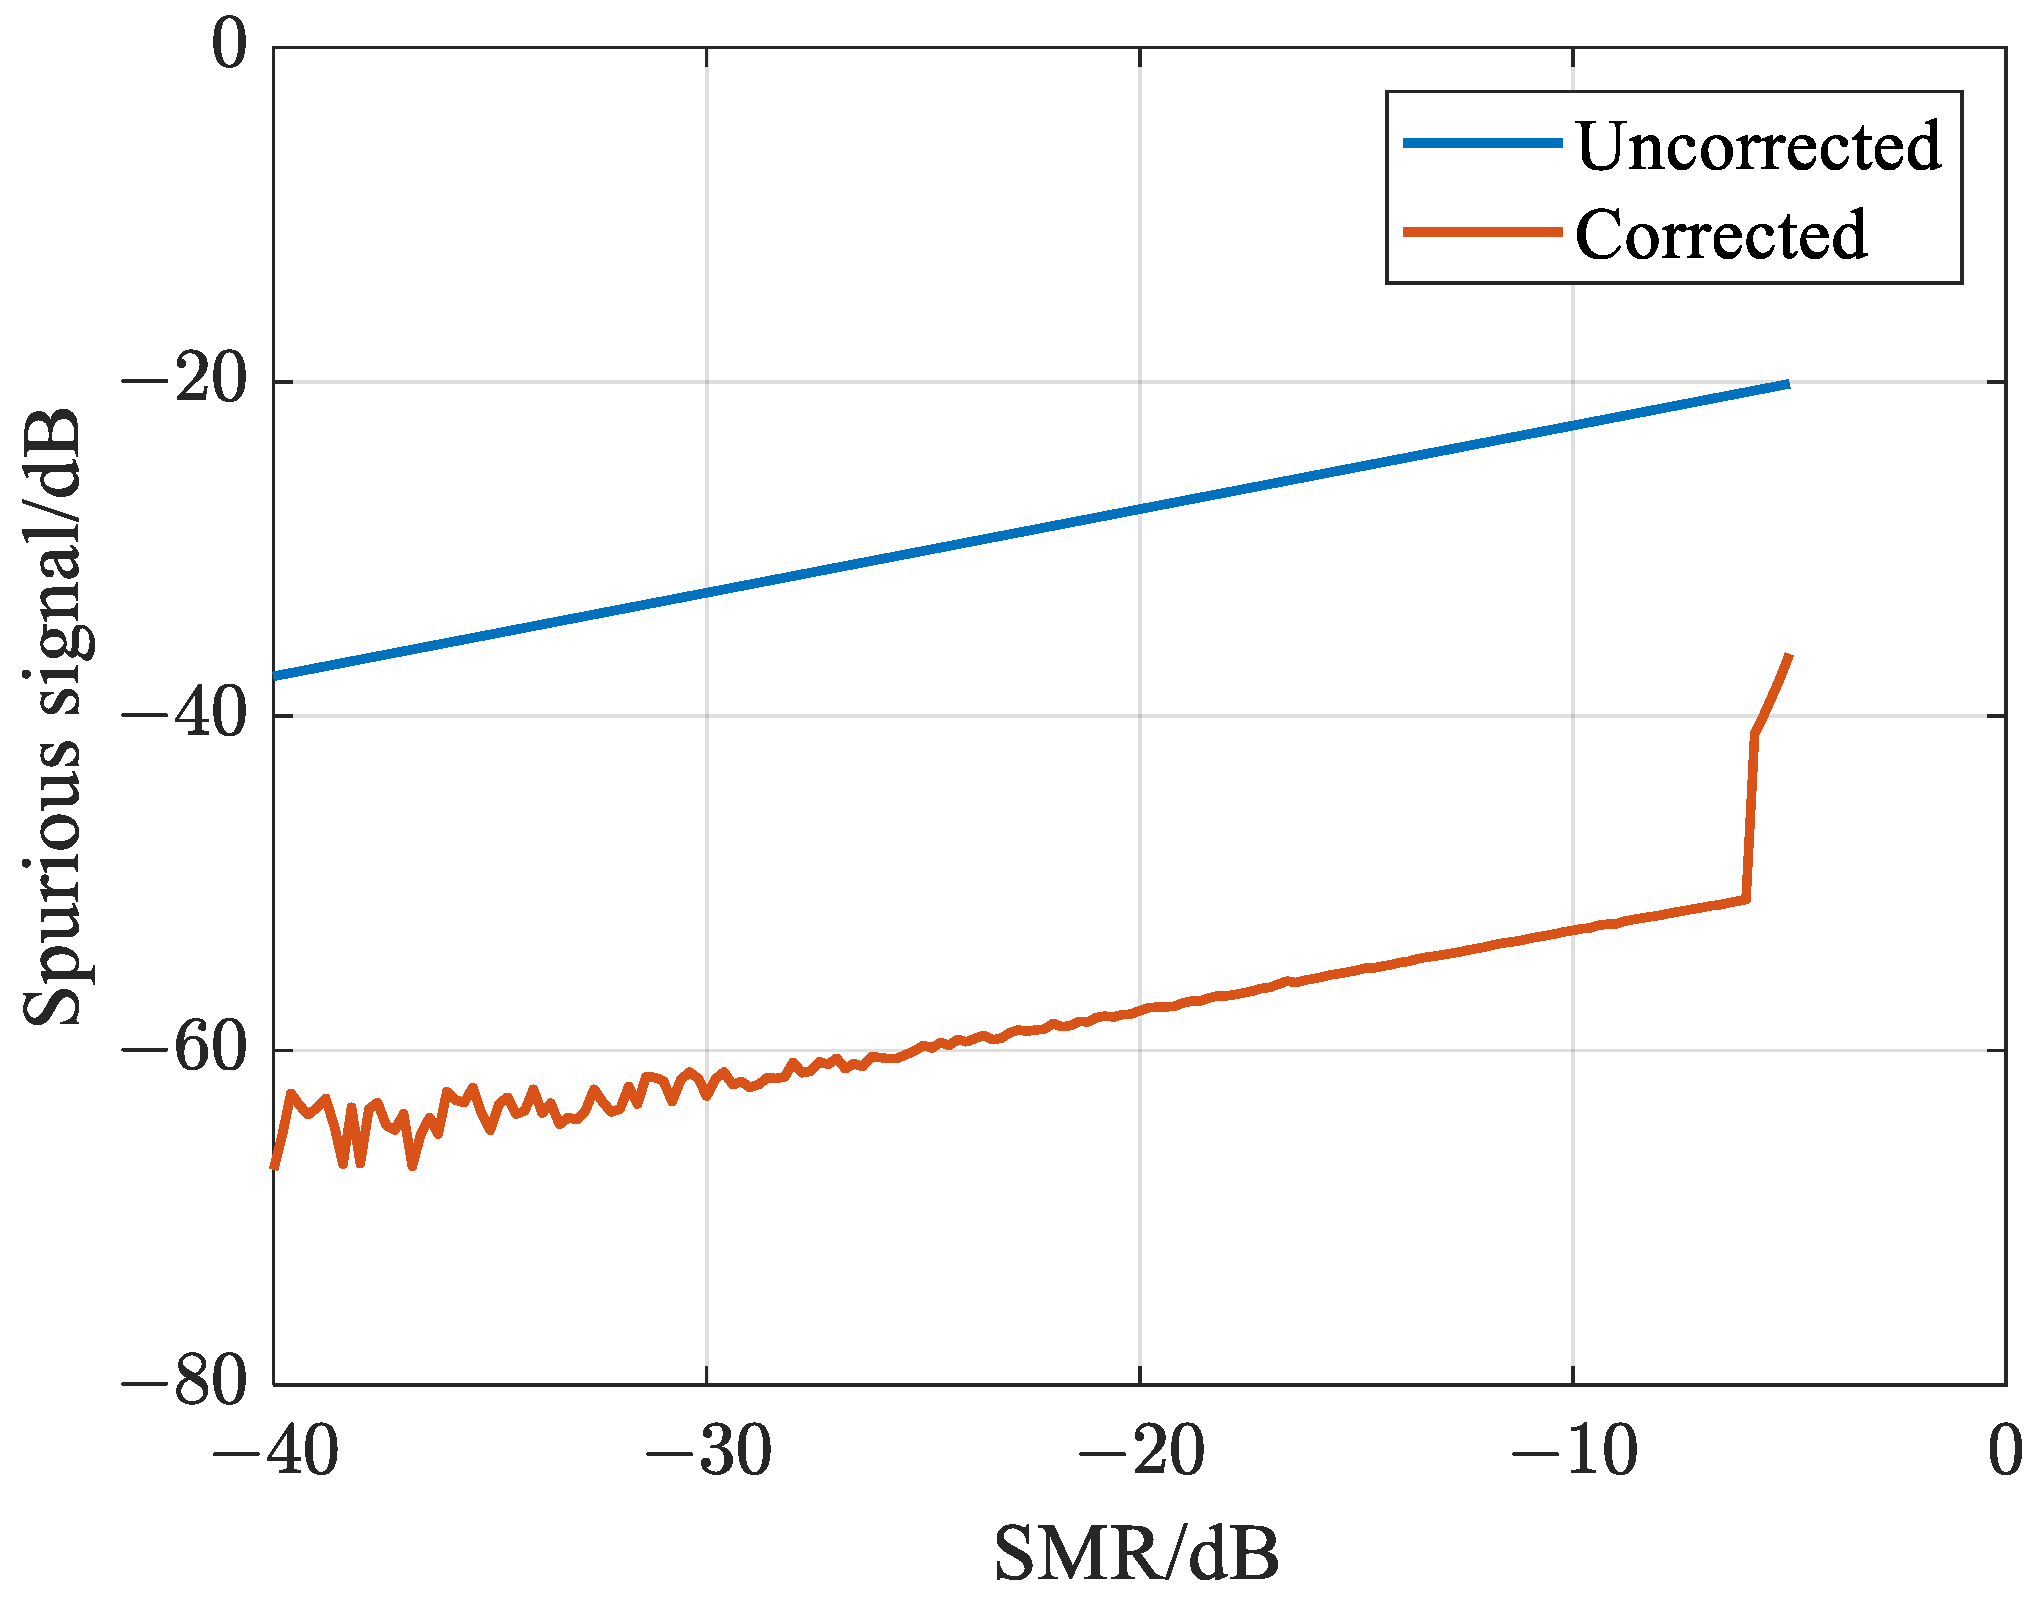
To systematically evaluate the algorithm’s suppression capability under varying stray light conditions, we performed comprehensive simulations spanning stray-to-measurement power ratios (SMRs) from 1 × 10 4 to 0.3. This analysis specifically quantifies the peak amplitude reduction of spurious signals at the characteristic 25.8 kHz frequency, as illustrated in Figure 7. The amplitude of the spurious signal caused by three-beam interference increases as the stray-to-measurement power ratio grows. The correction algorithm achieves a suppression effect exceeding 25 dB when the ratio remains below 0.25. However, when the ratio exceeds 0.25, the algorithm progressively fails because the stray light power approaches the measurement light power, violating the approximation condition used in Equation (3) and leading to incorrect estimation of the stray light’s complex amplitude by the correction algorithm.
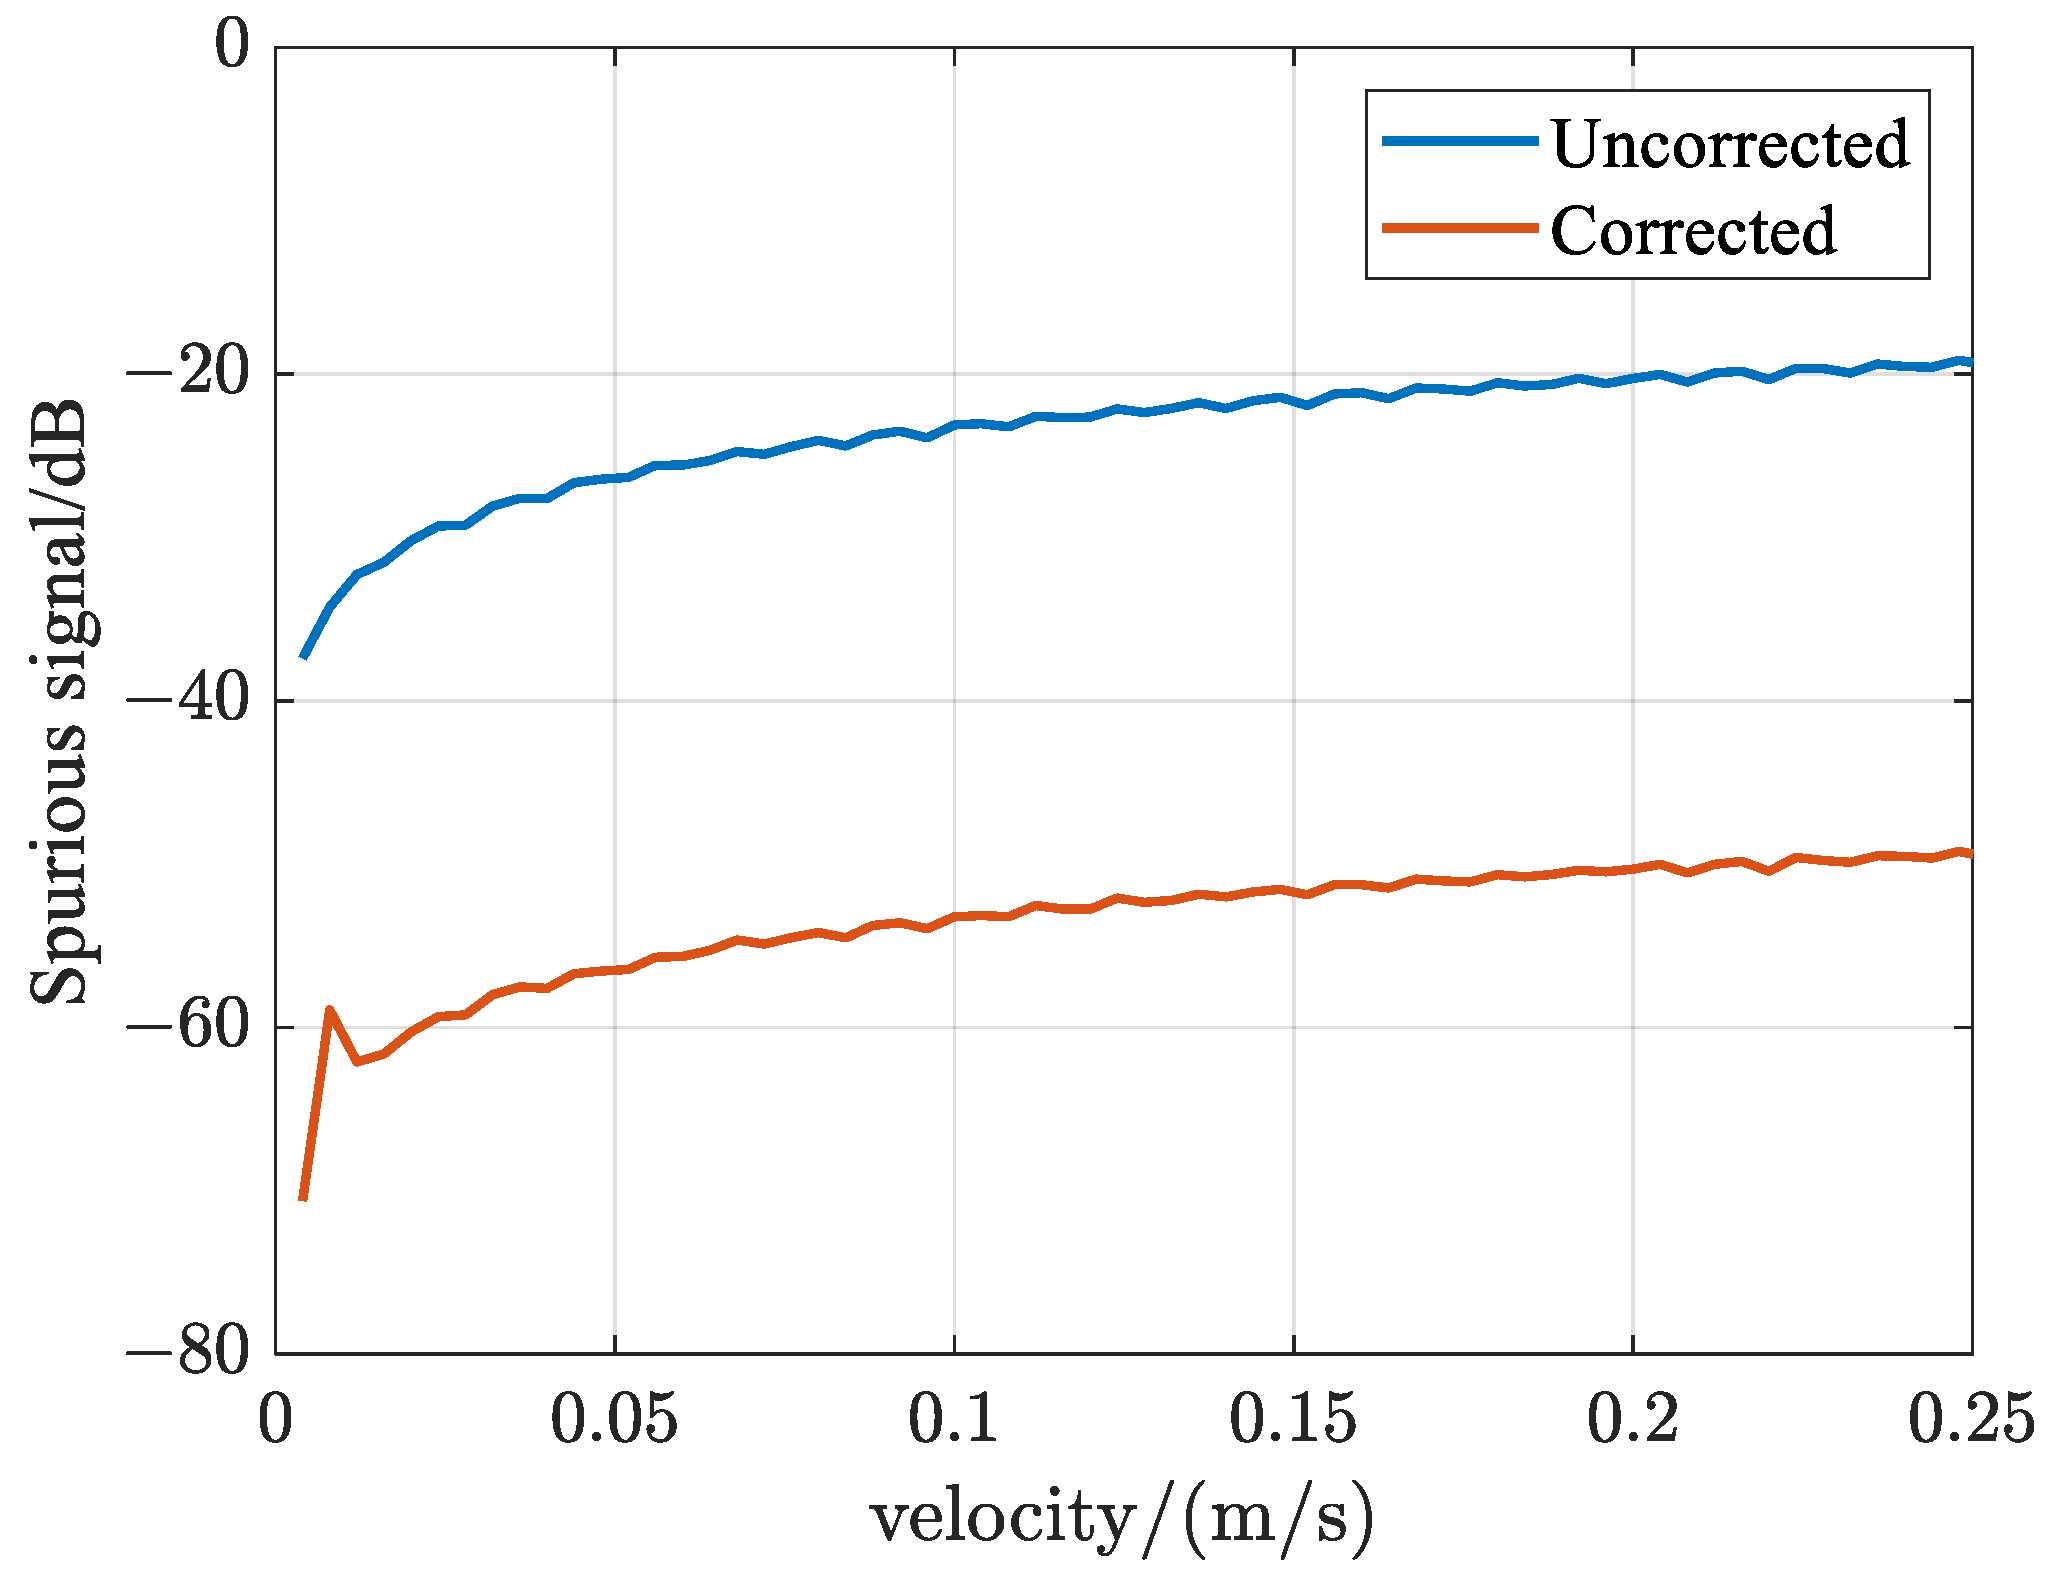
Under the additional assumption of SMR of −20 dB, the uniform motion speed was swept from 2 mm/s to 150 mm/s (constrained by the 250 kHz carrier frequency limit). The signal peaks at spurious frequency locations before and after correction were calculated, as illustrated in Figure 8. As evidenced by the figure, the spectral locations and magnitudes of spurious signals vary significantly with velocity. Nevertheless, the implemented correction algorithm consistently achieves over 25 dB suppression across all tested speed conditions.

4.3. Non-Uniform Motion + Micro-Vibrations

While keeping all other parameters unchanged, the target’s uniform motion was modified to sinusoidal motion with a maximum velocity of 20 mm/s and a frequency of 1 Hz. As previously analyzed, since the target undergoes variable-velocity motion, both the frequency and intensity of the spurious signal vary at different time points. Figure 9 presents the demodulated velocity time-domain signals and their corresponding Mel spectrograms, comparing two-beam ideal interference conditions with three-beam interference conditions both before and after correction.
As shown in Figure 9, when the target undergoes variable-speed motion, the system can correctly extract micro-vibration signals but simultaneously generates spurious signals. These spurious signals exhibit velocity-dependent characteristics in both intensity and frequency distribution, forming a chirp-type spurious signal. By comparing Figure 9b,c, the proposed algorithm demonstrates excellent suppression performance against spurious signals induced by multi-beam interference competition. It effectively reduces the chirp signal to nearly the instrument’s noise floor level. Taking the most prominent chirp signal as reference (indicated by the dark red curve in Figure 9b), the noise suppression achieves approximately 20 dB.

5. Experiments

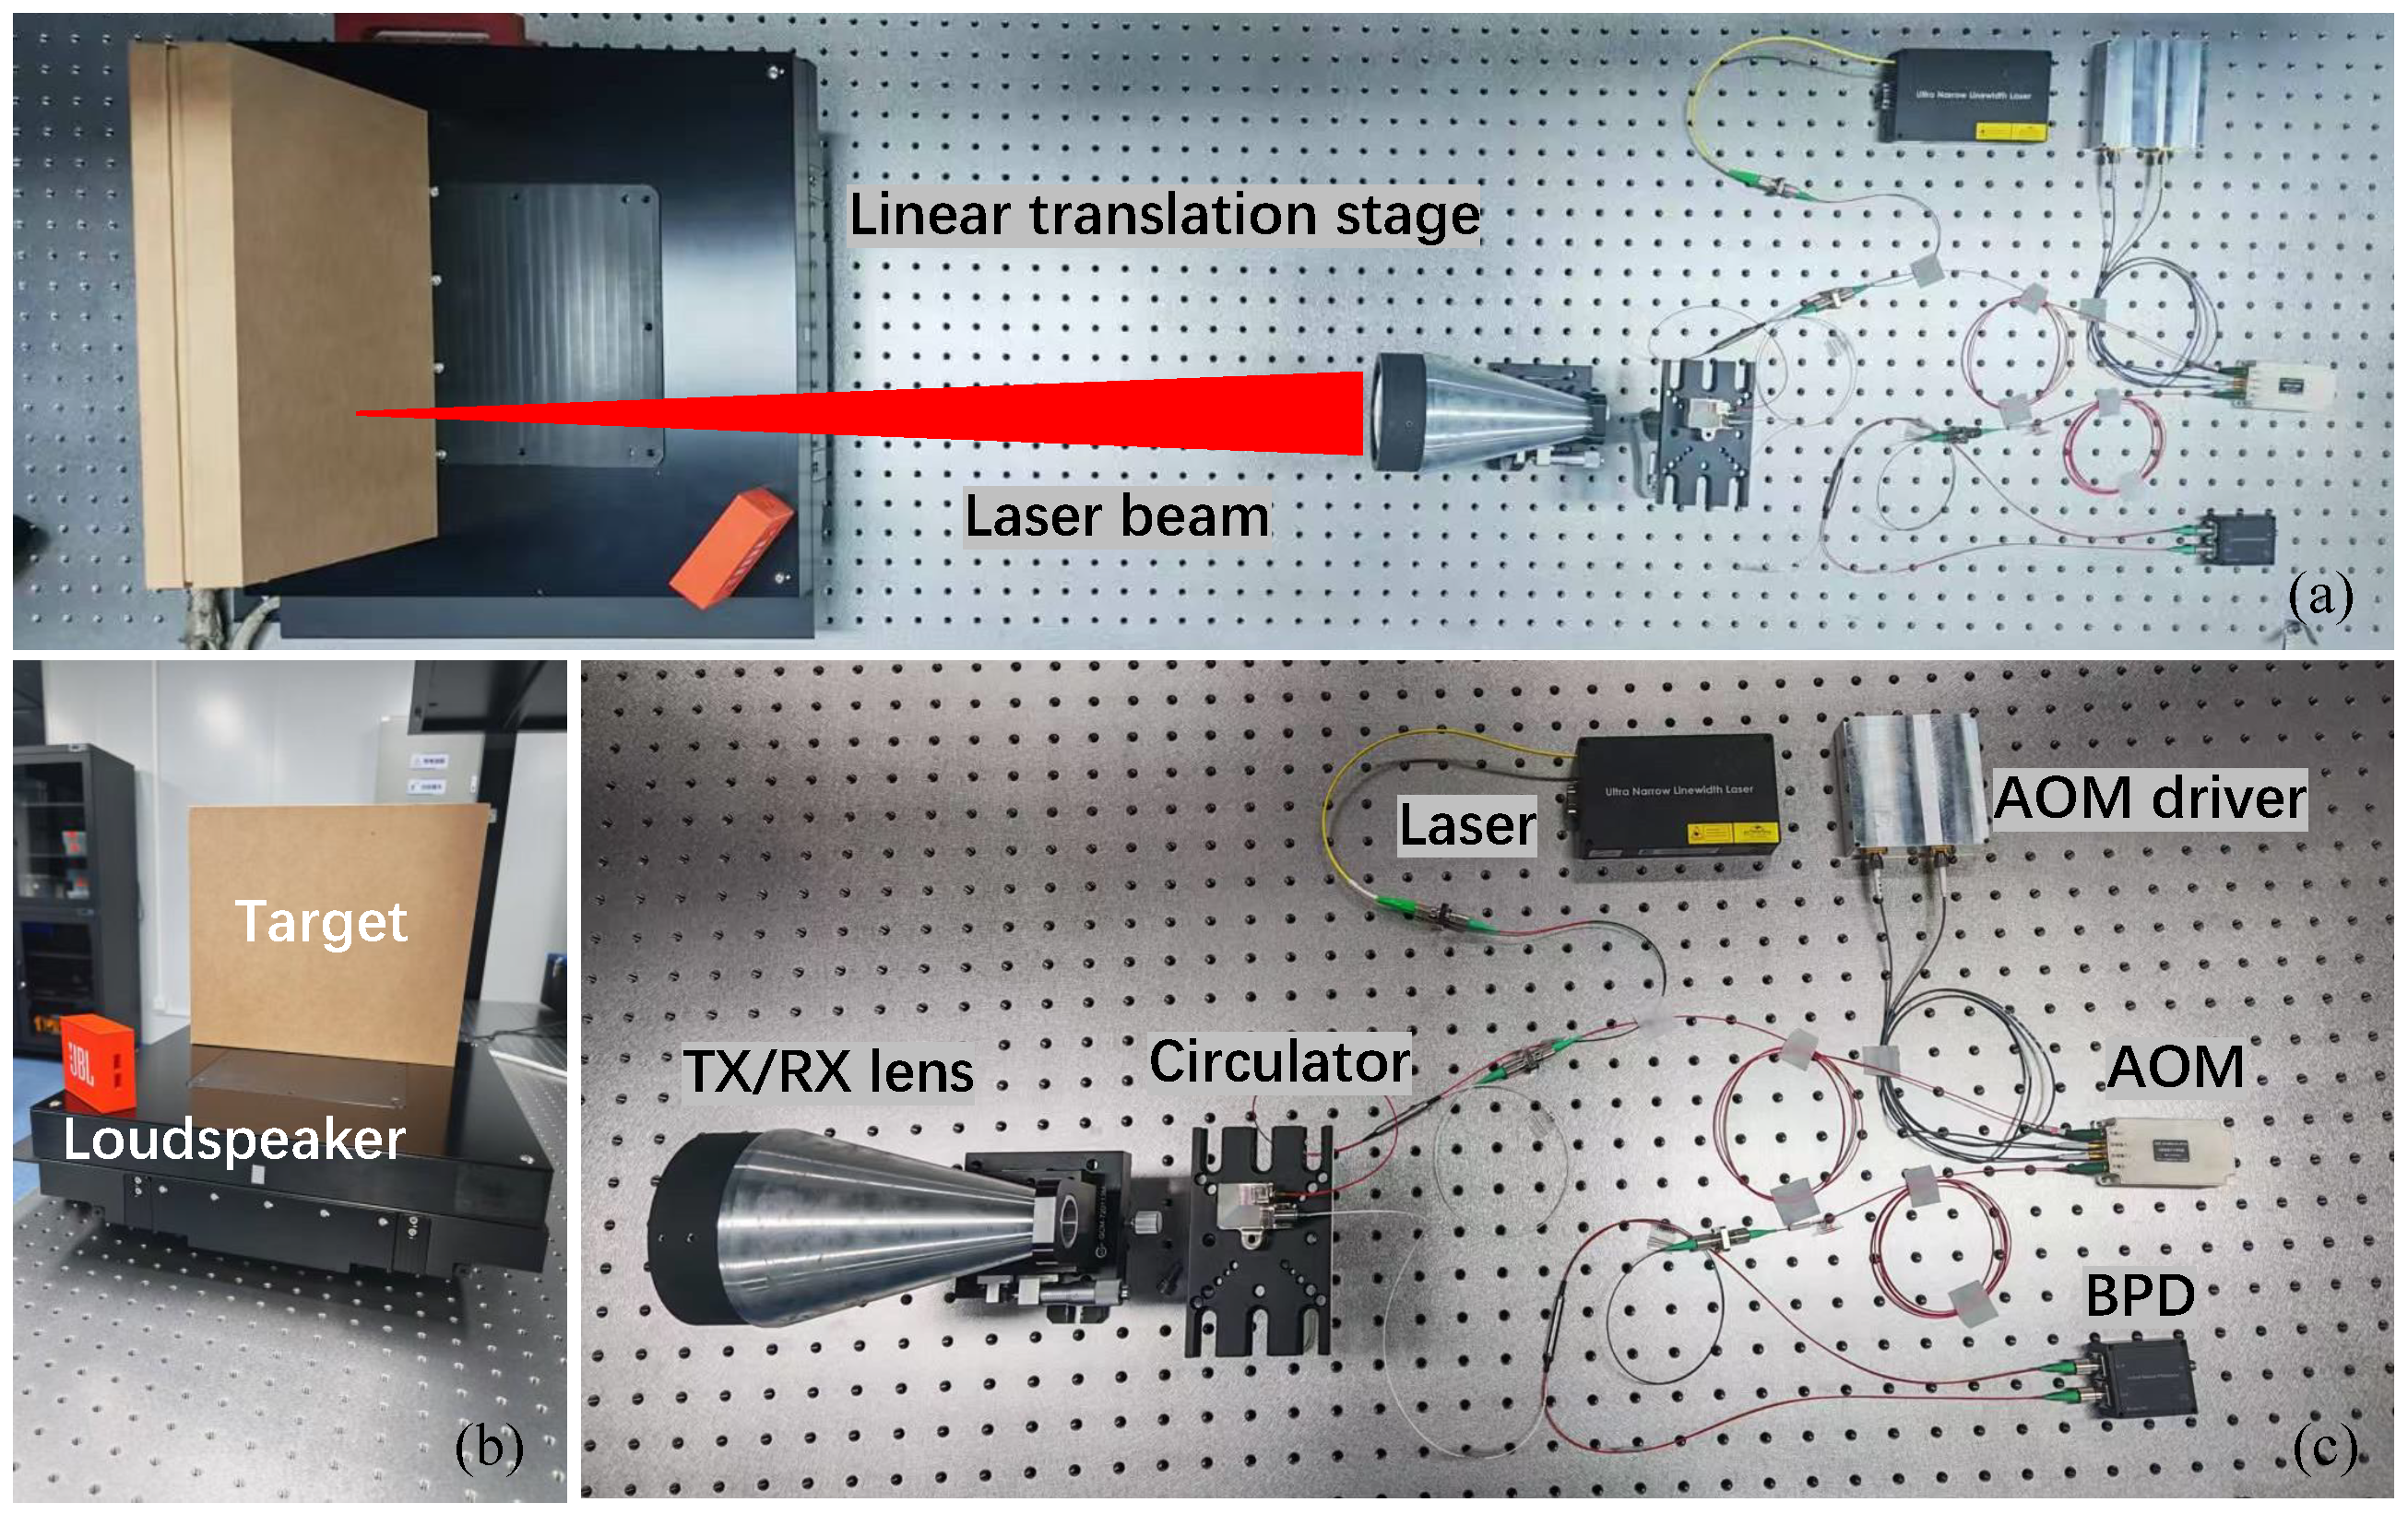
To validate the algorithm’s effectiveness, we conducted experiments using a fiber-optic LDV system with the optical configuration shown in Figure 1. The fiber laser emitted 1550 nm wavelength light with 25 mW output power, delivering 20 mW probe power after beam splitting. The reference arm incorporated an AOM with a 250 kHz frequency shift, and the photodetector output was sampled at 2 MHz using a data acquisition card. Figure 10 illustrates the LDV experimental setup and Table 2 lists the details of the experimental parameter settings.
As shown in Figure 10a,b, a cardboard box (40 cm × 30 cm) was selected as the moving target, positioned 5 m from the TX/RX lens (the experimental setup depicts relative positioning only). The box was mounted on a linear translation stage moving along the optical axis to simulate large-amplitude motions, while high-frequency vibration was superimposed via loudspeaker excitation to replicate micro-dynamic perturbations during motion. Experimental validation was conducted using the demodulation parameters derived from simulation to test two representative LDV vibration measurement scenarios.

5.1. Uniform Motion + Micro-Vibrations

A one-dimensional motion platform was set to drive the target at a uniform speed of 20 mm/s. The loudspeaker excited the target with a single-frequency vibration at 8 kHz. The signals acquired by the data acquisition card were processed using an orthogonal demodulation algorithm, and the FFT results of the velocity signal were calculated, as shown in Figure 11a. The data were post-processed with a correction algorithm, and the FFT results of the corrected velocity signal were obtained, as shown in Figure 11b.
The 20 mm/s uniform motion corresponds to a Doppler shift of 25.8 kHz. Based on the earlier analysis of multi-beam interference competition mechanisms, this induces spurious signals at the Doppler frequency, as seen in Figure 11a. The spectrum exhibits both the genuine 8 kHz target vibration signal and artificial peaks near 25.7 kHz. After correction, the amplitude of the 8 kHz signal remains stable, while the 25.7 kHz spurious peak is effectively suppressed; its magnitude drops from 11.5 µm/s to noise-floor levels (2.1 µm/s).

5.2. Non-Uniform Motion + Micro-Vibrations

The one-dimensional motion platform was programmed to drive the target in sinusoidal motion with a 2 s period and a peak velocity of 20 mm/s. The loudspeaker excited the target with an 8 kHz single-frequency vibration, while the data acquisition card recorded the raw carrier wave voltage output from the BPD, as shown in Figure 12a. The carrier signal was processed using the IQ demodulation algorithm to obtain the time-domain velocity. Mel-spectrogram analysis was subsequently performed on both raw and corrected velocity signals, with results presented in Figure 12b and Figure 12c, respectively.
As shown in Figure 12b, the target’s variable-velocity motion causes frequency modulation of the spurious signals, generating a chirp signal. After correction, the chirp signal is suppressed to the noise floor level and becomes undetectable, achieving a high-frequency suppression of up to 13.5 dB. Simultaneously, by comparing the Mel spectrogram with Figure 12a, it is evident that both the return light intensity and the original carrier signal amplitude vary during target motion, corresponding to time-dependent noise floor fluctuations. This demonstrates that the correction algorithm effectively suppresses multi-beam interference phenomena under varying velocities and return light power conditions.

6. Conclusions

This paper addresses the prevalent multi-beam interference competition phenomenon in LDV. We analyze velocity conversion relationships under both three-beam and two-beam interference conditions, and propose a velocity correction algorithm. Through frame-by-frame processing, the algorithm employs single-frame correlated band power as an optimization metric, utilizing the 3P-PEL algorithm to estimate the amplitude and phase of interference between stray light and reference light. Simulation results indicate that the algorithm achieves over 25 dB suppression of spurious signals when the stray-to-measurement power ratio remains below 0.25. Experimental validation was conducted using both a linear translation stage and acoustic excitation to simulate typical LDV measurement scenarios. Results show the algorithm effectively suppresses spurious signals caused by multi-beam interference down to noise floor levels across varying target motions and retroreflection conditions, confirming its universality and robustness.
While maintaining current functionality, the algorithm demonstrates optimization opportunities, particularly in real-time processing—a critical limitation stemming from time-consuming power spectrum computations. Strategic optimization approaches involving refined power spectrum summation algorithms complemented by parallel computing methodologies are expected to markedly enhance computational performance, ultimately strengthening the algorithm’s practical viability across application scenarios.

Author Contributions

Conceptualization, Y.S.; methodology, Y.S. and Y.W.; validation, R.Z., Y.S. and X.K.; writing—original draft preparation, Y.S.; supervision, X.K. and W.Z. All authors have read and agreed to the published version of the manuscript.

Funding

This research was funded by the National Key Research and Development Program of China, grant number 2023YFF0716700.

Institutional Review Board Statement

Not applicable.

Informed Consent Statement

Not applicable.

Data Availability Statement

Data will be available from the authors upon reasonable request.

Acknowledgments

The authors thank the reviewers and editors for their contributions to this article.

Conflicts of Interest

The authors declare no conflicts of interest.

References

  1. Khalil, H.; Kim, D.; Nam, J.; Park, K. Accuracy and Noise Analyses of 3D Vibration Measurements Using Laser Doppler Vibrometer. Measurement 2016, 94, 883–892. [Google Scholar] [CrossRef]
  2. Liu, H.; Ji, D.; Lin, J.; Liu, Z.; Li, H. Residual Angular Speed Analysis Based on Laser Doppler Vibrometer and Its Application in Planetary Gearbox Diagnosis. Measurement 2025, 250, 116987. [Google Scholar] [CrossRef]
  3. Yuan, K.; Zhu, W. Identification of Modal Parameters of a Model Turbine Blade with a Curved Surface under Random Excitation with a Three-Dimensional Continuously Scanning Laser Doppler Vibrometer System. Measurement 2023, 214, 112759. [Google Scholar] [CrossRef]
  4. Hagara, M.; Pástor, M.; Lengvarský, P.; Palička, P.; Huňady, R. Modal Parameters Estimation of Circular Plates Manufactured by FDM Technique Using Vibrometry: A Comparative Study. Appl. Sci. 2024, 14, 10609. [Google Scholar] [CrossRef]
  5. Rzasa, J.R.; Cho, K.; Davis, C.C. Long-Range Vibration Detection System Using Heterodyne Interferometry. Appl. Opt. 2015, 54, 6230–6236. [Google Scholar] [CrossRef] [PubMed]
  6. Yang, F.; He, Y.; Shang, J.; Chen, W. Experimental Study on the 1550 Nm All Fiber Heterodyne Laser Range Finder. Appl. Opt. 2009, 48, 6575–6582. [Google Scholar] [CrossRef] [PubMed]
  7. Jin, X.; Shen, Y.; Wang, Y.; Kong, X.; Zhang, W. Research on the Speckle Effect Suppression Technology of a Laser Vibrometer Based on the Dual-Wavelength Detection Principle. Appl. Sci. 2025, 15, 4858. [Google Scholar] [CrossRef]
  8. Rembe, C.; Halkon, B.J.; Ismail, M.A.A. Measuring Vibrations in Large Structures with Laser-Doppler Vibrometry and Unmanned Aerial Systems: A Review and Outlook. Adv. Devices Instrum. 2025, 6, 103. [Google Scholar] [CrossRef]
  9. Pasch, S.; Leister, R.; Gatti, D.; Örlü, R.; Frohnapfel, B.; Kriegseis, J. Measurements in a Turbulent Channel Flow by Means of an LDV Profile Sensor. Flow Turbul. Combust. 2024, 113, 195–213. [Google Scholar] [CrossRef]
  10. O’Brien, C.; Falagán, N.; Kourmpetli, S.; Landahl, S.; Terry, L.A.; Alamar, M.C. Non-Destructive Methods for Mango Ripening Prediction: Visible and near-Infrared Spectroscopy (visNIRS) and Laser Doppler Vibrometry (LDV). Postharvest Biol. Technol. 2024, 212, 112878. [Google Scholar] [CrossRef]
  11. Yu, T.; Tang, Q.; Vinayaka, S. Identifying Structural Properties of a Steel Railway Bridge for Structural Health Monitoring Using Laser Doppler Vibrometry. Autom. Constr. 2024, 160, 105320. [Google Scholar] [CrossRef]
  12. Tao, S.; Zhen, S.; Fang, J.; Chen, X.; Yu, B. Analysis of Multi-Beam Interference in Heterodyne Detection System. In Proceedings of the Fourth International Conference on Optoelectronic Science and Materials (ICOSM 2022), Hefei, China, 16–18 September 2022; SPIE: Bellingham, DC, USA, 2023; Volume 12553, pp. 152–159. [Google Scholar] [CrossRef]
  13. Kong, X.X.; Zhang, W.X.; Cai, Q.S.; Wu, Z.; Dai, Y.; Xiang, L.B. Multi beam hybrid heterodyne interferometry based phase enhancement technology. Acta Phys. Sin. 2020, 69, 190601. [Google Scholar] [CrossRef]
  14. Yarovoi, L.; Siegmund, G. The Effect of Three-Wave Interference in Laser Doppler Vibrometry. Meas. Sci. Technol. 2004, 15, 2150–2156. [Google Scholar] [CrossRef]
  15. Hao, Y.; Kong, X.; Cai, Q.; Zhang, W.; Wu, Z.; Dai, Y.; Wang, Y. Analysis of Effect of Circulator Noise on Laser Interferometry System. Acta Opt. Sin. 2021, 41, 0912003. [Google Scholar] [CrossRef]
  16. Wu, S.s.; Lü, T.; Li, Y.y.; Wang, T.f.; Guo, J. Multi-Beam Interference Competition in Heterodyne Detection. Optoelectron. Lett. 2019, 15, 213–216. [Google Scholar] [CrossRef]
  17. Kong, X.; Xiangli, B.; Zhang, W.; Wu, Z.; Zhang, D. Research on LDV Stray Light Suppression Technology Based on Four-Wave Hybrid Interference. In Proceedings of the Electro-Optical Remote Sensing XIII, Strasbourg, France, 9–12 September 2019; SPIE: Bellingham, DC, USA, 2019; Volume 11160, pp. 98–104. [Google Scholar] [CrossRef]
  18. Wang, Y.; Shen, Y.; Kong, X.; Zhang, W. Chirp Noise Analysis in Laser Doppler Vibration Measurement and Its Suppression Methods. Acta Opt. Sin. 2024, 44, 0507001. [Google Scholar] [CrossRef]
  19. Arahira, S.; Ono, H.; Onawa, Y.; Itoh, M.; Shimura, D.; Fujii, A.; Murai, H. Silicon Photonics-Based Laser Doppler Vibrometer with an Integrated Phase Modulator. Opt. Express 2025, 33, 40703–40714. [Google Scholar] [CrossRef] [PubMed]
  20. Volkers, H. On the Calibration of Laser Doppler Vibrometers Using Simulated Excitation. Meas. Sens. 2025, 38, 101748. [Google Scholar] [CrossRef]
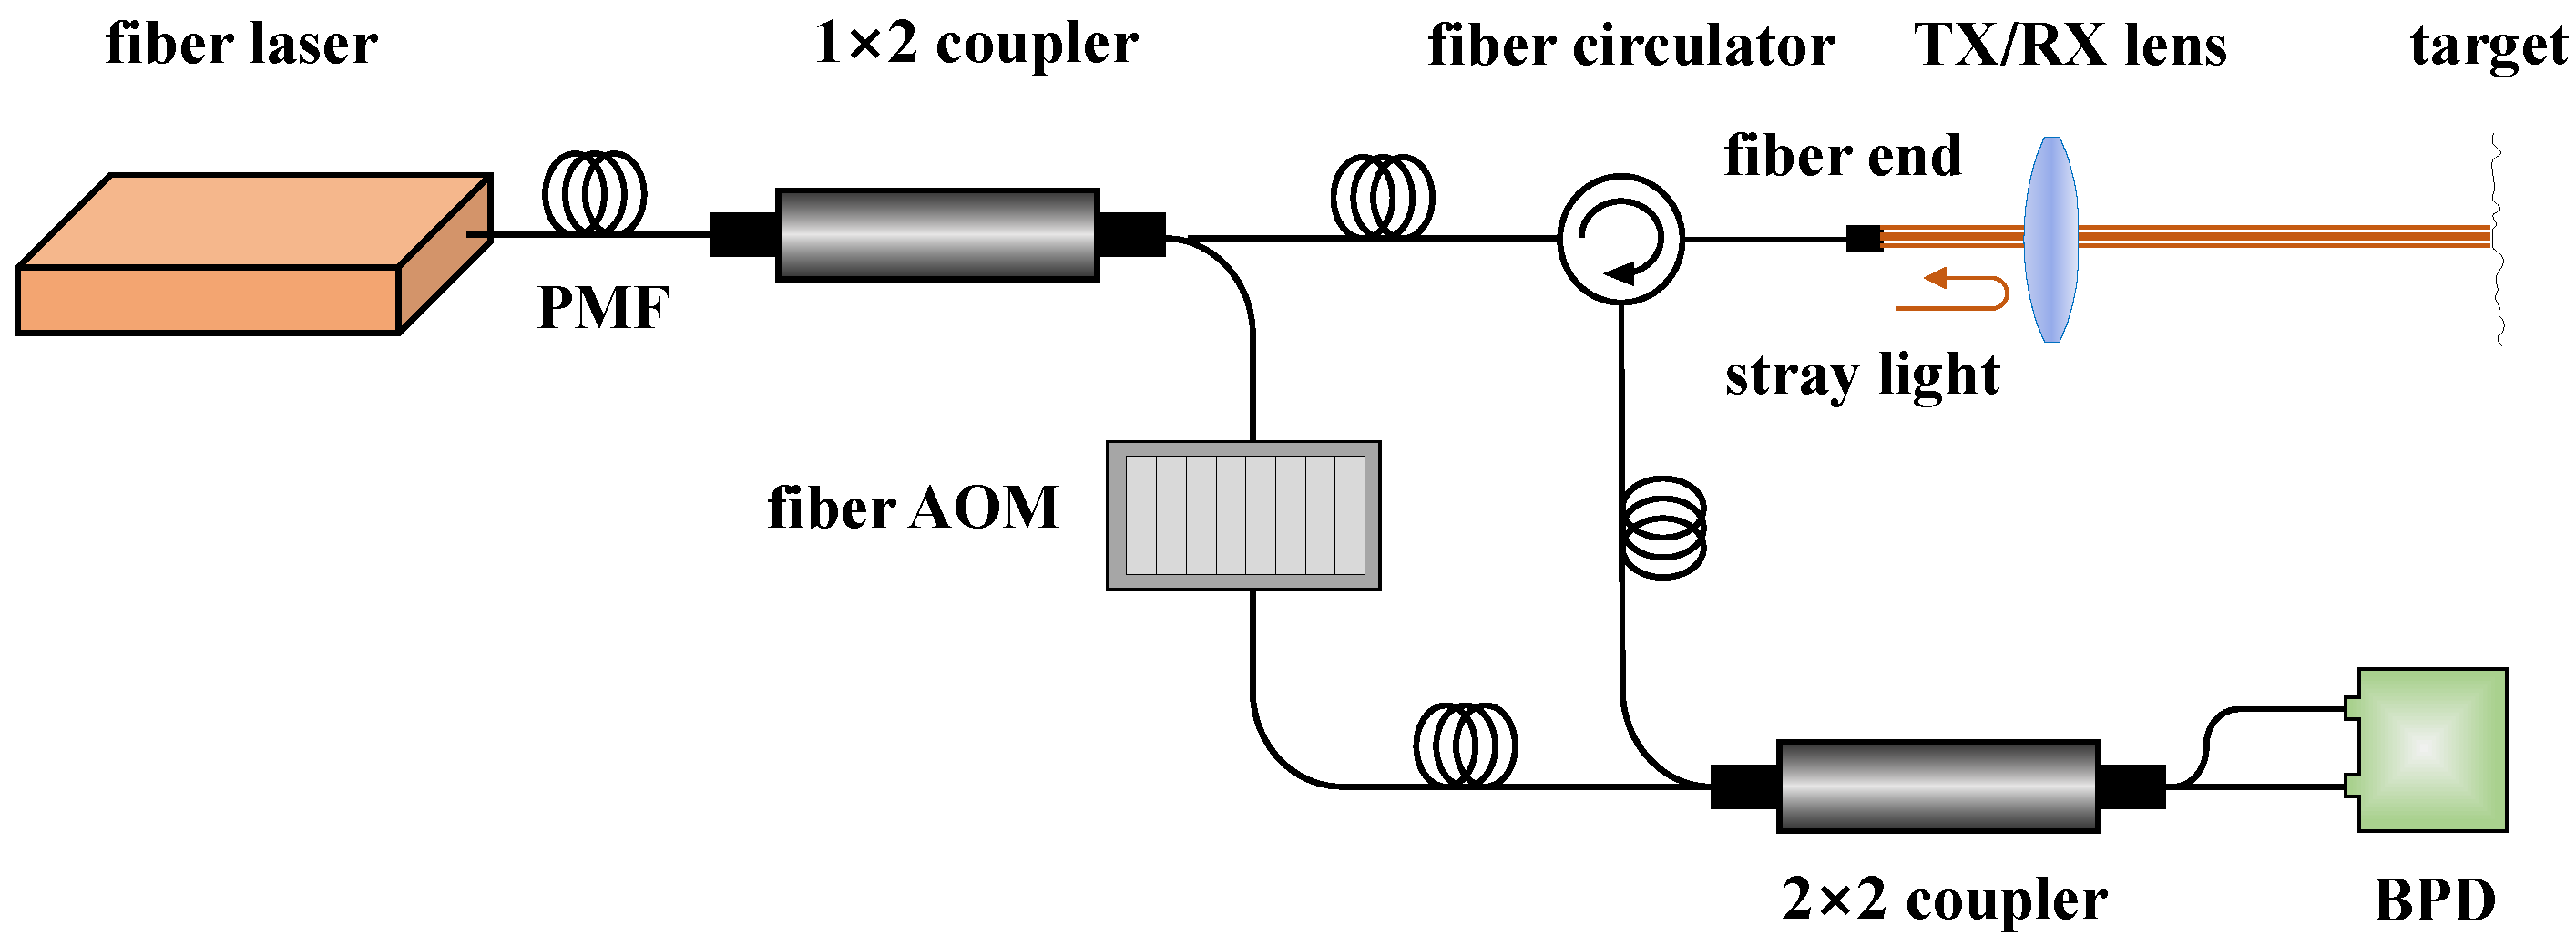
Figure 1. Schematic diagram of a typical fiber-based LDV System.
Applsci 15 12020 g001
Figure 2. Corrected algorithm processing flow.
Applsci 15 12020 g002
Figure 3. Schematic diagram of the 3P-PEL.
Applsci 15 12020 g003
Figure 4. Schematic of the correction algorithm iterative process.
Applsci 15 12020 g004
Figure 5. IQ demodulation simulation results: (a) time-domain results, and (b) three-beam interference FFT.
Applsci 15 12020 g005
Figure 6. Uniform motion simulation results: ideal velocity ( a 1 ) time-domain results ( a 2 ) FFT; uncorrected velocity ( b 1 ) time-domain results ( b 2 ) FFT; corrected velocity ( c 1 ) time-domain results ( c 2 ) FFT.
Applsci 15 12020 g006
Figure 7. Comparison of spurious signal suppression effects by the correction algorithm at velocity = 20 mm/s across different SMRs.
Applsci 15 12020 g007
Figure 8. Comparison of spurious signal suppression effects by the correction algorithm at SMR = −20 dB across different velocities.
Applsci 15 12020 g008
Figure 9. Non-uniform motion simulation results: (a) time-domain waveform, (b) uncorrected signal Mel spectrum, and (c) corrected signal Mel spectrum.
Applsci 15 12020 g009
Figure 10. Fiber-based LDV experimental setup: (a) experimental system, (b) zoom in of the target, and (c) zoom in of the LDV.
Applsci 15 12020 g010
Figure 11. Uniform motion demodulated velocity FFT results: (a) uncorrected and (b) corrected.
Applsci 15 12020 g011
Figure 12. Non-uniform motion experiment results: (a) carrier signal, (b) uncorrected velocity Mel spectrum, and (c) corrected velocity Mel spectrum.
Applsci 15 12020 g012
Table 1. Comparative Results of Different Multi-Beam Interference Suppression Schemes.
AuthorStrategySystem ComplexityProcessing EffectivenessData Continuity
Wuoptical system design+++++− 1
Kongoptical system design++++
Wangdata post-processing++++
Shendata post-processing+++++
1 (+) denotes implementation degree, (−) indicates unsupported capability.
Table 2. Multi-beam interference competition suppression experimental setup.
ComponentItemParameterUnit
Laserwavelength1550nm
Laseroutput power25mW
AOMdriver frequency250kHz
AOMoutput power0.2mW
TX/RX lensemission power20mW
TX/RX lensalignment distance5m
BPDbandwidth1MHz
BPDgain5 ×   10 5 V/W
data aquisition cardsampling rate2MHz
data aquisition cardinput range±5V
data aquisition cardquantization bits16bit
cardboard boxsize40 × 30cm
Disclaimer/Publisher’s Note: The statements, opinions and data contained in all publications are solely those of the individual author(s) and contributor(s) and not of MDPI and/or the editor(s). MDPI and/or the editor(s) disclaim responsibility for any injury to people or property resulting from any ideas, methods, instructions or products referred to in the content.