Abstract
Assessing preferences for heating, ventilation, and air conditioning (HVAC) sounds is important for improving comfort in living spaces. Recently, preference assessments using neurophysiological measurements have gained attention. However, associations between HVAC sound preferences and cortical activity remain insufficiently understood to establish neurophysiological indices. In this study, we developed machine learning models that estimate preference scores from magnetoencephalographic (MEG) signals recorded during HVAC sound presentation. We also developed spatial filters based on the common spatial pattern to extract MEG signals associated with the preferences. Both were trained for each participant using MEG signal pairs and participant’s paired-comparison judgments of HVAC sounds based on either coolness or preference. The preference scores estimated from the training data were strongly correlated with the average preference scores obtained through a psychological paired-comparison method (r > 0.98). Analysis of trained linear models revealed that the spatial filters primarily contributing to score estimation extracted theta (4–8 Hz) and alpha (8–13 Hz) oscillations. These suggest that the signals extracted by the spatial filters may reflect cortical activity associated with the coolness and preference of HVAC sounds, and that the preference estimation models may capture the relationship between cortical activity and psychological scales of HVAC sound preferences.
1. Introduction
Investigating human preferences and emotions toward objects is essential for developing better products and improving comfort of spaces. Whereas psychological measurements are typically used to assess preferences and emotions, recent advances in noninvasive brain imaging technologies and the availability of affordable measurement devices have led to growing research on assessing preferences and emotions using neurophysiological measurements such as electroencephalography (EEG) [,,,,,]. Neurophysiological methods are expected to provide more objective assessments by directly measuring brain activity involved in the processing of preferences and emotions, potentially reducing individual differences inherent in psychological methods. Moreover, psychological methods often require evaluators to make repeated judgments to ensure accuracy, which can be burdensome. In contrast, neurophysiological methods are expected to allow assessments with fewer repetitions. If it becomes possible to assess preferences from single-trial brain signals, neurophysiological assessments could be applied to brain–computer interfaces (BCIs). Additionally, the development of neurophysiological methods for assessing product quality and comfort may enhance our understanding of the complex brain functions underlying human preferences.
In this study, we focused on preference of sounds generated by heating, ventilation, and air conditioning (HVAC) systems. HVAC sounds have a significant impact on the comfort of living spaces because of their relatively high loudness and long duration []. Previous psychoacoustic studies on HVAC sounds have primarily assessed attributes such as preference, annoyance, and loudness [,,,]. In contrast, a few studies have assessed thermal impressions, such as coolness and warmth of HVAC sounds [,,]. Some studies have reported individual differences in the thermal impressions [,], suggesting that identifying the optimal HVAC sound for each individual may be more effective than seeking a universally optimal HVAC sound for all. Several studies have investigated the relationship between thermal comfort and brain activity [,,,], or assessed thermal comfort in a room using EEG [,,,]. In contrast, the relationship between thermal impressions of HVAC sounds and brain activity remains largely unexplored. In our previous study [], the association between the coolness of HVAC sounds and magnetoencephalographic (MEG) activity was investigated, and changes in the fronto-parietal low-theta (4–5 Hz) and temporal alpha (8–13 Hz) activities were observed in response to the coolness of the HVAC sounds. However, the observed associations were not strong enough to develop a neurophysiological index of the coolness of HVAC sounds.
Numerous studies have employed machine learning to estimate human preferences or to recognize emotions from EEG signals [,,,,]. These studies have primarily focused on classifying discrete emotion categories, levels of emotional valence and arousal, or degrees of preference. In our previous study [], we developed machine learning models that estimate preference scores of chords composed of three tones with various frequency ratios, from MEG recordings during auditory presentation of the chords. MEG signals associated with the preference were extracted using spatial filters based on the common spatial pattern (CSP) method. Although the model outputs a continuous preference score, both the spatial filters and the machine learning models were trained using MEG signal pairs and the corresponding binary comparative judgments recorded during paired-comparison tasks of the chords. Paired comparison is also applicable to assessing complex subjective criteria, allowing evaluators to make judgments even when the differences between two sounds are subtle. However, due to the sequential presentation of paired sounds, even an identical sound may elicit different neural responses depending on whether it is presented first or second. This presentation order effect may impair the performance of models that estimate preference scores from brain activity during a single stimulus presentation.
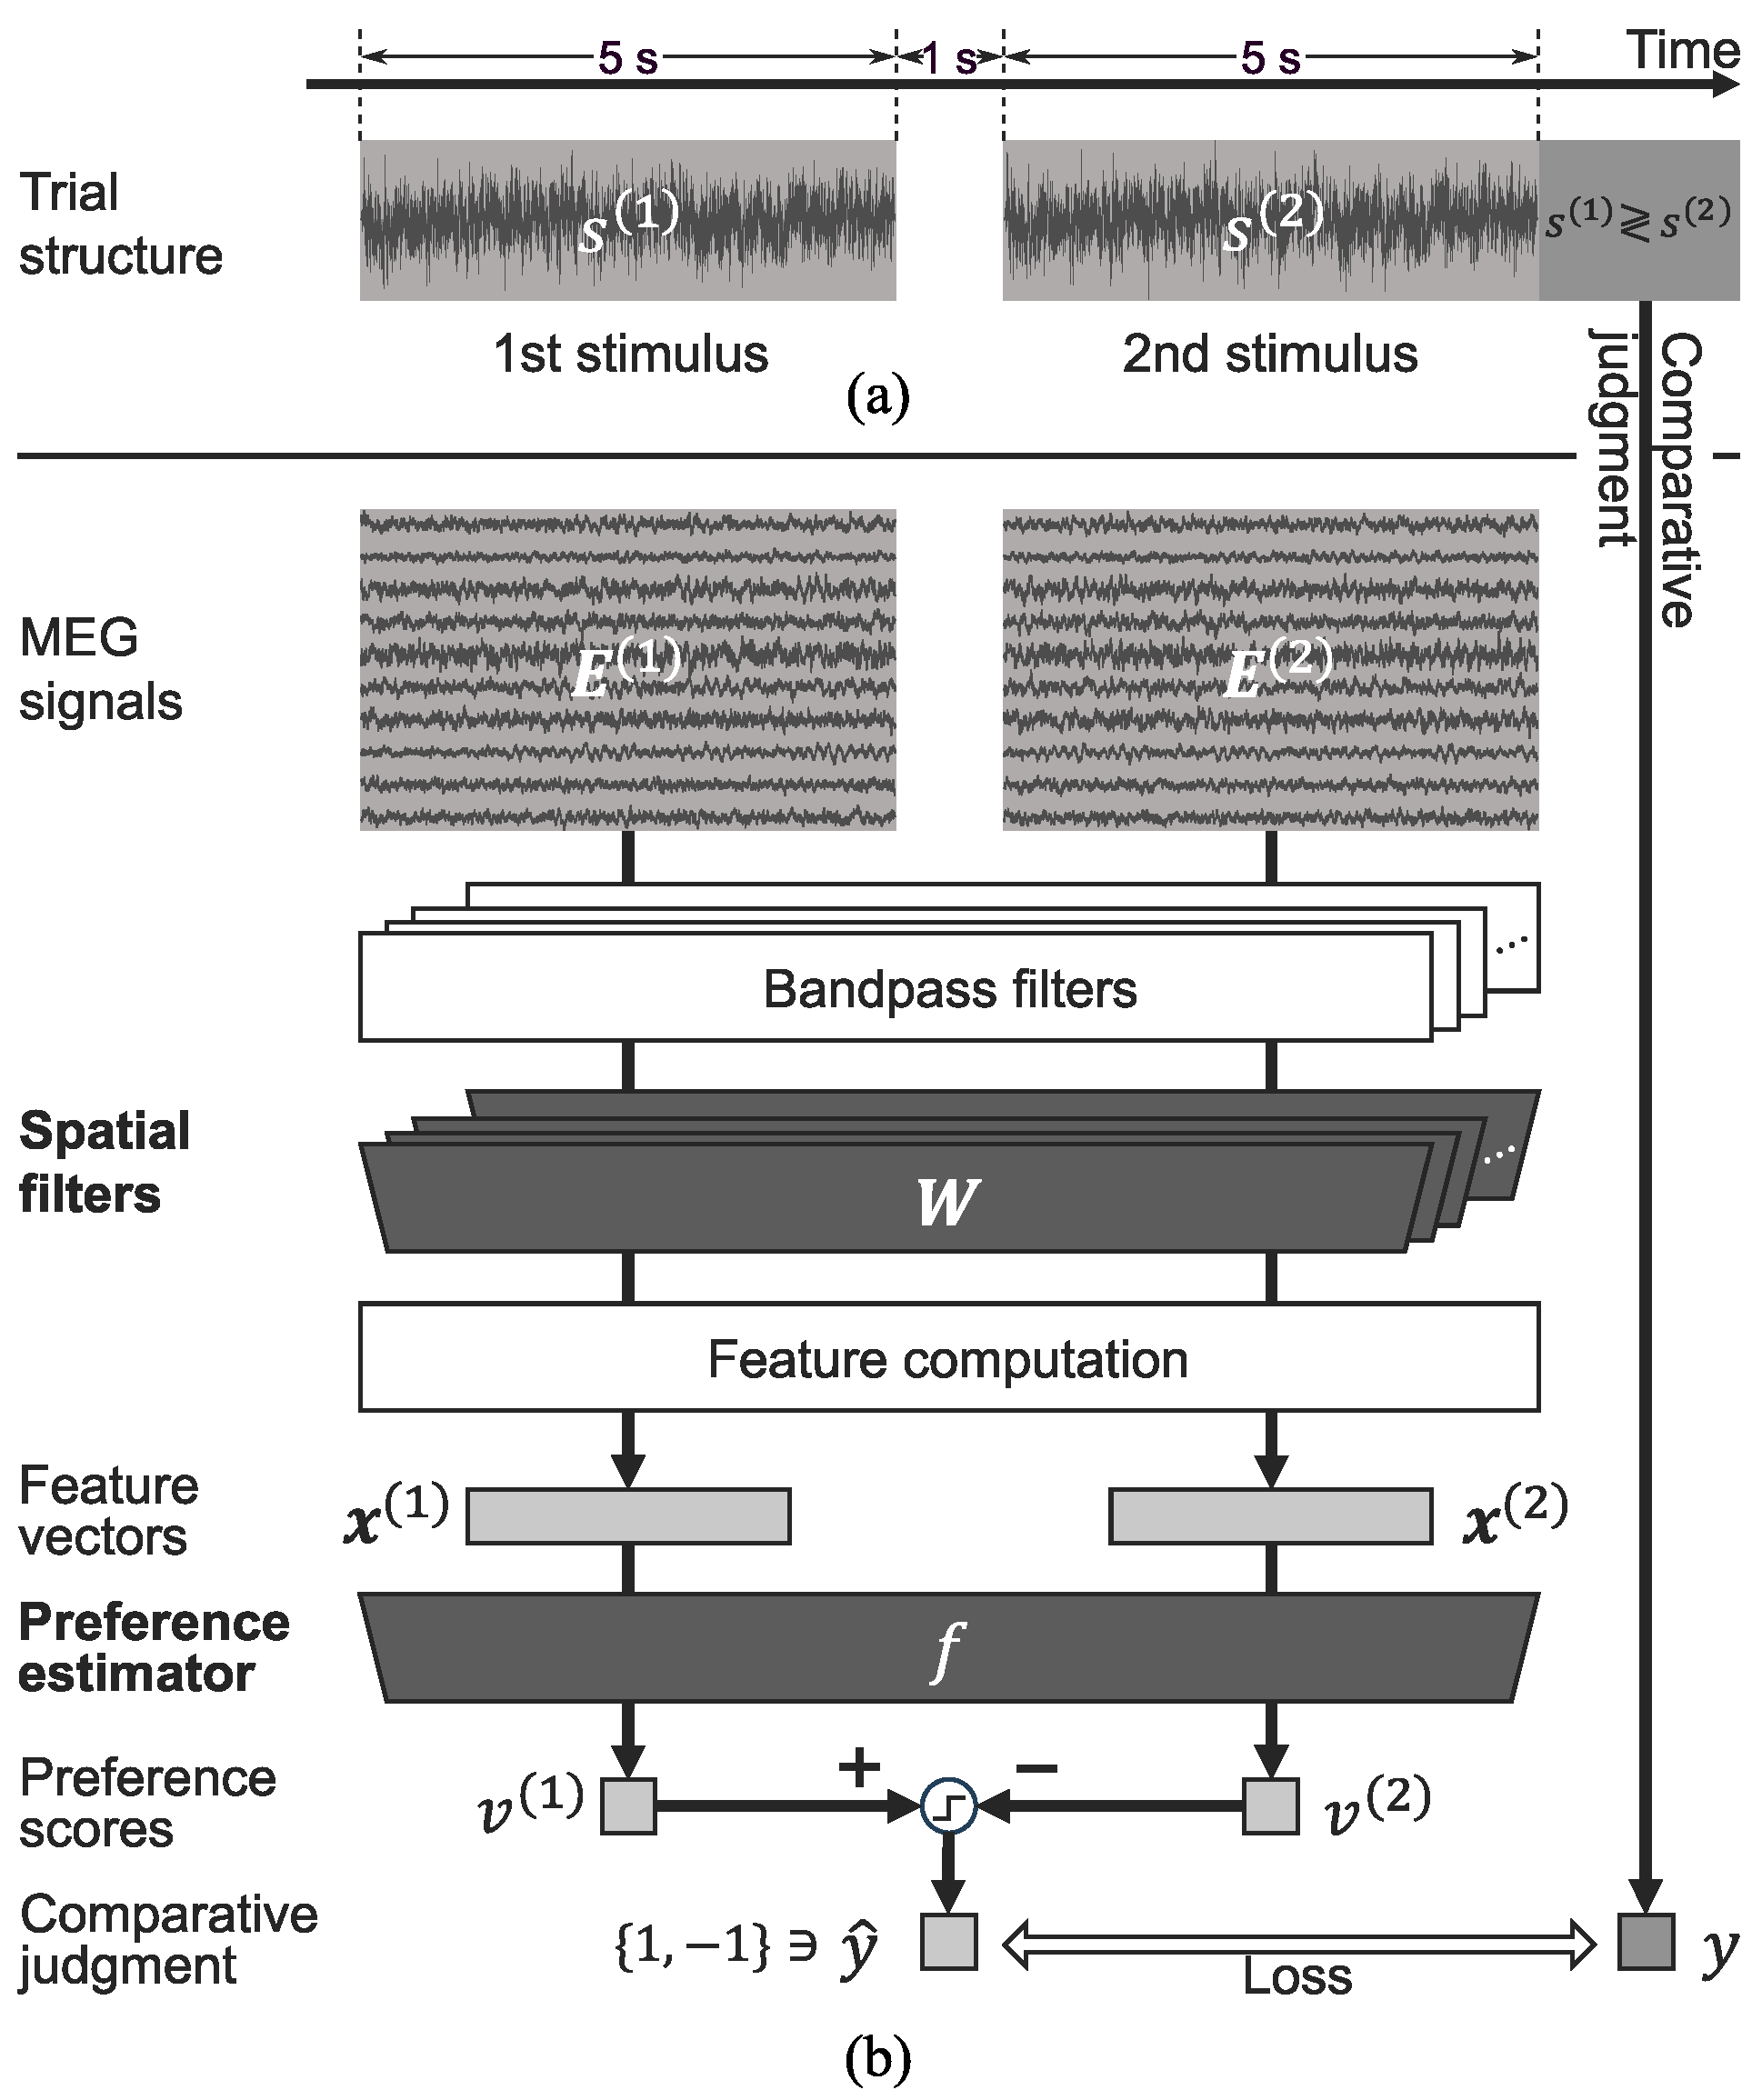
In this study, we developed machine learning models that estimate continuous preference scores from MEG recordings during HVAC sound presentation, aiming to establish neurophysiological indices of preferences for HVAC sounds through a direct and exploratory approach. These models are hereafter referred to as the preference estimation models. An overview of the preference estimation for HVAC sounds is shown in Figure 1. To extract MEG signals modulated by the preferences, spatial filters were developed based on the CSP method. Both the spatial filters and the preference estimation models were trained using MEG signal pairs and the corresponding binary comparative judgments obtained during paired-comparison tasks on HVAC sound preferences. Moreover, the following two approaches were employed to develop more robust spatial filters: (1) the covariance matrices were weighted to mitigate the influence of infrequent comparative judgments; (2) additional spatial filters were developed to extract MEG signals less affected by the effects of presentation order inherent in the paired comparison of long-duration HVAC sounds. The spatial filters and the preference estimation models were trained and evaluated using two datasets of MEG recordings acquired during paired-comparison tasks: one based on coolness and the other on preference of time-varying HVAC sounds. Although MEG measurements are less practical than EEG measurements, they provide higher spatial resolution and can acquire cortical signals with less distortion []. By analyzing trained linear preference estimation models, we also investigated cortical activity patterns that contribute to the estimations of the coolness and preference scores of the HVAC sounds.
Figure 1.
Overview of preference estimation. (a) Trial structure during magnetoencephalographic (MEG) measurements. (b) Process of estimating preference scores from MEG signals.
2. Materials and Methods
2.1. MEG Data
2.1.1. Dataset Description
We used two datasets of MEG recordings. One was acquired during paired-comparison tasks assessing coolness of time-varying HVAC sounds in our previous study []. The other was acquired during paired-comparison tasks assessing preference of the HVAC sounds, performed by the same participants in the same manner. The MEG recordings were acquired from six normal-hearing participants (four males and two females, aged 21–24 years). All participants were fully informed about the nature and purpose of the measurements, and written informed consent was obtained prior to participation. The study was approved by the Institutional Review Board on Ergonomic Research at National Institute of Advanced Industrial Science and Technology (AIST).
Five-second HVAC sounds, each amplitude-modulated with a sine wave, were used as the auditory stimuli. Seven stimuli were synthesized by setting the modulation frequency to 0 (no modulation), 0.2, 0.4, 0.6, 0.8, 1.6, and 3.2 Hz. For the coolness assessment, four stimuli were selected for each participant from the seven, including the ones rated as the coolest and the least cool in a prior subjective assessment (for details of the prior subjective assessment, see Appendix A). Similarly, for the preference assessment, four stimuli were selected in the same manner. These selected stimuli were presented to each participant during the MEG measurements.
Figure 1a illustrates the structure of a single trial in the MEG measurements. Two stimuli were paired and sequentially presented to both ears of the participant, with an inter-stimulus interval of 1 s. After each presentation of a stimulus pair, the participant was instructed to indicate which stimulus was cooler or preferable depending on the assessment criterion. Each participant underwent three measurement sessions, with two-minute intervals between sessions. All possible permutations of the paired stimuli were randomly presented four times per session. MEG signals were recorded during the paired comparison tasks at a sampling frequency of 400 Hz in a magnetically-shielded room using a 122-channel whole-head neuromagnetometer (Neuromag-122™; Neuromag Ltd., Helsinki, Finland).
2.1.2. Data Preprocessing
Artifacts and irrelevant components were removed from the MEG signals. Signals recorded at bad channels were excluded. Low-frequency components below 2 Hz were filtered out using a fourth-order zero-phase Butterworth filter. Power line noise at 60 Hz and its harmonic at 120 Hz were removed using second-order zero-phase Butterworth filters. Trials with absolute amplitudes exceeding 1000 fT/cm were excluded as artifacts. Independent component analysis (ICA) was applied to trials without large artifacts to remove remaining artifacts and cardiac and ocular activities. Only the independent components that could be clearly identified as reflecting these artifacts were manually removed. FastICA [] was used as an ICA algorithm.
Seven types of oscillatory activity—theta (4–8 Hz), alpha (8–13 Hz), low-beta (13–20 Hz), high-beta (20–30 Hz), low-gamma (30–50 Hz), mid-gamma (50–70 Hz), and high-gamma (70–100 Hz)—were extracted from the denoised MEG signals using eighth-order zero-phase Butterworth filters. The theta, alpha, beta (13–30 Hz), and low-gamma bands are frequently used in EEG-based emotion recognition [,,,]. In addition, to consider high-frequency oscillations up to 100 Hz, the beta and gamma band (30–100 Hz) were divided roughly equally on a logarithmic frequency axis.
2.2. Preference Estimation Model
The preference estimation models were developed based on utility functions commonly used in preference learning within machine learning [,]. Let denote the -dimensional feature vector extracted from the MEG signals recorded during the presentation of a stimulus. The preference estimation model is represented by a mapping that maps the feature vector to a preference score for the stimulus. The following linear model was used as f:
Here, is a mapping from the input feature vector to another feature space of dimension , i.e., , and is the parameter vector of the model.
Let and denote the stimuli presented first and second in each trial, respectively, and let and denote the feature vectors extracted from the MEG signals recorded during the presentations of and , respectively. Preference relations are denoted as when is preferred to , and when the opposite preference is true. The preference relations can also be represented by the following binary variable:
In this study, we assumed that the preference relation for the stimulus pair could be predicted by comparing the corresponding outputs of the preference estimation model, and . The predicted preference relation was computed using the following equation:
For simplicity, we set when . In this case, the preference estimation model is equivalent to a linear classifier without a bias term, , which classifies the feature difference into one of two classes corresponding to the preference relation y. We developed preference estimation models based on support vector machines (SVMs) [] and logistic regression.
2.3. Feature Extraction from Cortical Signals Associated with Preferences
The overview of the feature extraction process is shown in the middle of Figure 1b. First, CSP-based spatial filters were applied to each bandpass-filtered MEG signal to extract cortical signals associated with preferences. Then, feature vectors were computed from the spatially filtered signals. To construct more robust spatial filters, covariance matrix weighting and mitigation of stimulus presentation order effects were employed.
2.3.1. Common Spatial Pattern
CSP is a widely used technique for designing optimal filters to discriminate between EEG signals under two conditions [,,]. A bandpass-filtered multichannel neural signal recorded during a stimulus presentation is denoted by , where is the number of channels and T is the number of temporal samples. The covariance matrix estimated under condition is denoted by , and was computed using the following equation:
Here, denotes the set of indices labeled with condition c indicates the transpose operator, and denotes the sum of the diagonal elements of a square matrix.
The spatial filters in CSP are obtained by solving the following generalized eigenvalue problem []:
The generalized eigenvector corresponding to the largest generalized eigenvalue maximizes the variance under condition 1 while minimizing it under condition 2, and vice versa. Let denote the matrix whose columns are the generalized eigenvectors. The spatially filtered signals are computed as follows:
For feature extraction, it is common to use the variances of the spatially filtered signals corresponding to the m largest and m smallest generalized eigenvalues [,].
2.3.2. Extraction of Cortical Signals Associated with Preferences
We developed CSP-based spatial filters that discriminates between MEG signals during the presentations of more and less preferred stimuli (condition 1 and condition 2, respectively). These filters are expected to extract MEG signals whose amplitudes vary with the degree of preference. The bandpass-filtered MEG signals from 500 to 4500 ms after the stimulus onset were used as . These spatial filters are represented by the matrix of generalized eigenvectors from the problem in (5), denoted by .
2.3.3. Preference-Based Covariance Matrix Weighting
When comparing stimuli with only subtle differences, participants’ comparative judgments for the same stimulus pair are not necessarily consistent across repeated trials. Such inconsistencies may be regarded as outliers, possibly arising from occasional decision-making errors or inattentiveness during the task. To mitigate the influence of trials in which a typically preferred stimulus was judged otherwise, the covariance matrix of each trial was weighted as follows:
Here, indicates the number of occurrences in which stimulus was assigned to condition c (more preferred or less preferred).
2.3.4. Mitigation of Presentation Order Effects
In each trial, paired five-second auditory stimuli were presented sequentially. The participants were instructed to make their judgment only after the presentation of both auditory stimuli. Whereas comparison between the stimuli is not possible during the first stimulus presentation, it can be implicitly performed during the second presentation. Accordingly, the same stimulus may elicit distinct neural responses depending on whether it is presented first or second. This issue may limit the validity of the preference estimation models assuming that equivalent neural signals are recorded during the first and second presentations of the auditory stimuli.
To address this issue, we developed CSP-based spatial filters to extract MEG signals that are less affected by the stimulus presentation order. The covariance matrices and were computed from bandpass-filtered MEG signals during the first and second stimulus presentations, and , respectively, and the problem in (5) was solved. Here, denotes the number of trials. The generalized eigenvectors corresponding to the largest r and the smallest r generalized eigenvalues were excluded, and the remaining generalized eigenvectors were combined to construct the spatial filter . Subsequently, the preference-related spatial filter was developed using the multichannel signal , which was obtained by applying to the bandpass-filtered multichannel signal . The final filtered signal is given as follows:
2.3.5. Feature Computation
Let denote the most discriminative signals after spatial filtering in the k-th frequency band. Since the amplitudes of these signals are expected to vary with the degree of preference, features based on their variances, , were computed. The features computed for the seven frequency bands were concatenated to obtain the final feature vector . Accordingly, the dimensionality of was .
3. Results
3.1. Evaluation Experiment
The preference estimation models were independently trained for each participant and each assessment criterion. Their performance was evaluated based on the prediction accuracy of the paired-comparison judgments. The number of MEG signal pairs remaining after the artifact rejection varied across participants and assessment criteria, ranging from 93 to 176 (median: 139.5). All paired MEG signals and corresponding comparative judgments were divided into training and test sets using ten-fold cross-validation. Unless otherwise specified, the preference estimation models were implemented using nonlinear SVMs with a Gaussian kernel. The hyperparameter r of the spatial filters used to mitigate the presentation order effects was set to for the coolness assessment and for the preference assessment.
To evaluate the generalization performance of the proposed model to unseen participants, we developed cross-participant models. Specifically, data from one participant were used for testing, and data from the remaining five participants were used to train the spatial filters and the preference estimation model. Since the set of bad MEG channels varied across participants, only signals from channels that were in good condition for all participants were used. As different stimuli were presented to each participant, no covariance matrix weighting was applied when training the spatial filters; only the effect of presentation order was mitigated.
3.2. Comparative Judgment Prediction
The performance of the preference estimation models was evaluated under four different conditions in the extraction of preference-related MEG features: applying only covariance matrix weighting, applying only the mitigation of the presentation order effects, applying both processes, and applying neither process.
Table 1 shows the prediction accuracy for the coolness comparison for each participant. The prediction accuracy was approximately 60%. For four participants, applying covariance matrix weighting improved the accuracy compared to the case without covariance matrix weighting. In addition, mitigating the order effects improved the accuracy for five participants, excluding Participant 2. For participants whose accuracy improved with both covariance matrix weighting and mitigation of the order effects, further improvements were observed when these two methods were combined. Pairwise t-tests with Holm’s correction indicated that there were no significant differences in accuracy between any pair of the four conditions ().
Table 1.
Prediction accuracies of coolness comparative judgments [%].
Table 2 shows the prediction accuracy for the preference comparison for each participant. No improvement in prediction accuracy was observed with covariance matrix weighting for participants excluding Participants 1 and 6. Similarly, no improvement was observed when mitigating the order effects for participants excluding Participant 4. However, for four participants, the combination of the covariance matrix weighting and the mitigation of the order effects improved the accuracy. Pairwise t-tests with Holm’s correction indicated that there were no significant differences in accuracy between any pair of the four conditions ().
Table 2.
Prediction accuracies of preference comparative judgments [%].
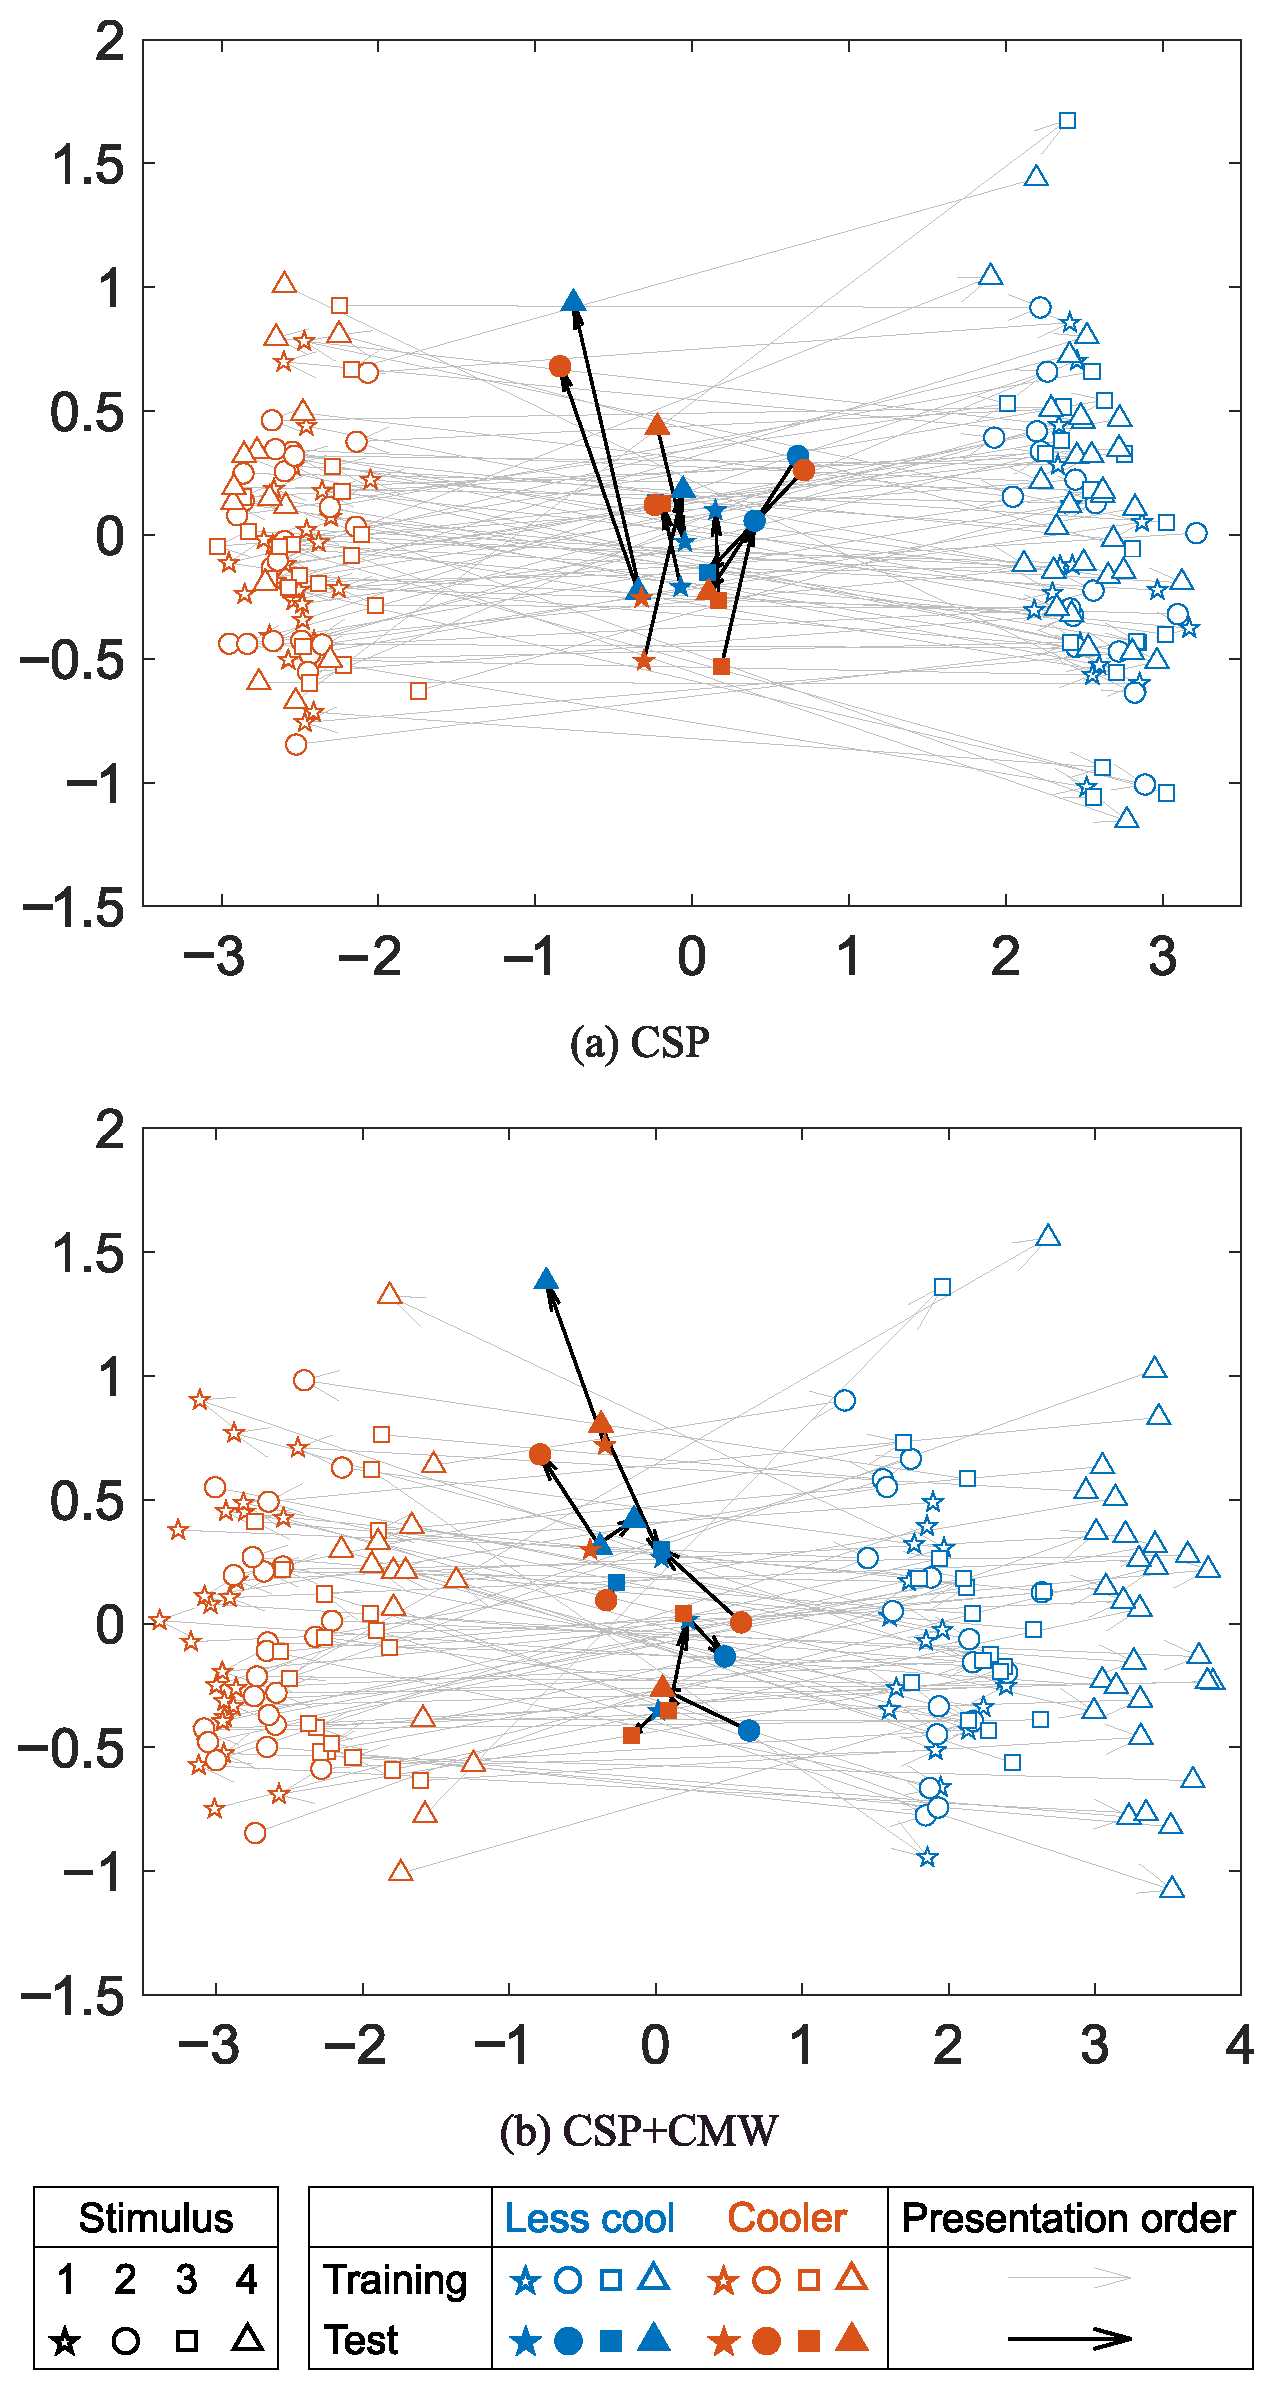
Figure 2 shows examples of feature vectors extracted using CSP-based spatial filters, with and without covariance matrix weighting, visualized in a two-dimensional space. These visualizations were created using the MEG data from Participant 3 during the coolness assessment. Multidimensional scaling [] was employed to embed the feature vectors into a two-dimensional space. The embeddings of the training data are distributed along the horizontal axis according to the binary coolness judgments, indicating that the extracted features facilitate classification based on coolness. In contrast, the embeddings of the test data tend to cluster near the center. When covariance matrix weighting was applied, the embeddings corresponding to Stimulus 4—rated by Participant 3 as the least cool (see Figure 3)—shifted to the right, indicating that the preference-based covariance matrix weighting was effective. Additionally, the distance between the two clusters of the training data was reduced.
Figure 2.
Examples of two-dimensional embeddings of feature vectors () extracted using (a) CSP and (b) CSP with covariance matrix weighting in the coolness assessment by Participant 3. Each marker represents an embedding derived from MEG signals recorded during a stimulus presentation.
Figure 3.
Average estimated coolness scores of the four stimuli for Participant 3. Each colored line represents the average estimated scores in each fold of the cross-validation. (a) Average scores estimated using the psychological method. The black line represents the scores estimated from all comparative judgments. (b) Average scores estimated by the preference estimation models from the MEG signals in the training and test set.
3.3. Estimated Preference Scores
Preference scores estimated from MEG signals using the preference estimation models were compared with those estimated only from comparative judgments using a psychological method. Thurstone’s paired-comparison method [,] was used as the psychological method, which estimates the mean scale value for each stimulus based on comparative judgments. The scores from each preference estimation model were standardized using the mean and standard deviation of the scores obtained from the corresponding training data, and then averaged for each stimulus.
As an example, Figure 3 shows the mean coolness scores obtained from the psychological method and the preference estimation model for Participant 3. The coolness and preference scores for all participants are shown in Appendix B. Note that the auditory stimuli used in the MEG measurements differed across the participants and the assessment criteria, with larger stimulus indices corresponding to higher modulation frequencies. Figure 3 shows the mean estimated scores for each cross-validation fold. Although some variation in the coolness scores is observed across folds, the overall preference pattern remains largely consistent. The average coolness and preference scores estimated from the psychological method closely resemble those obtained from the preference estimation model when applied to the training data. Pearson correlation analysis conducted across all participants, stimuli, and folds showed strong and significant positive correlations between the psychological scores and the corresponding mean estimated scores for both coolness (, ) and preference (, ). In contrast, the scores estimated for the test data differed from those for the training data. The variance of the scores for the test data was reduced, even though the same model was used for both the training and test data within each cross-validation fold. Correlation analysis revealed a weak but significant positive correlation between the psychological and mean estimated scores for coolness (, ), while no significant correlation was observed for preference (, ).
3.4. Magnetic Cortical Patterns Associated with Preferences
To investigate cortical activity contributing to preference score estimation for HVAC sounds, the preference estimation models based on sparse linear models were analyzed. First, both the spatial filters incorporating the mitigation of the presentation order effects and the preference estimation models based on L1-regularized logistic regression [] were retrained using all available data, separately for each participant and each assessment criterion. The hyperparameters for both the spatial filters and the models were selected based on the cross-validation results. Subsequently, we selected the three standardized linear weights with the largest absolute magnitudes from each retrained preference estimation model and computed the spatial patterns of cortical activity associated with the corresponding spatial filters. Let denote the Moore-Penrose pseudoinverse of either or . Each column vector of the matrix corresponds to each spatial pattern.
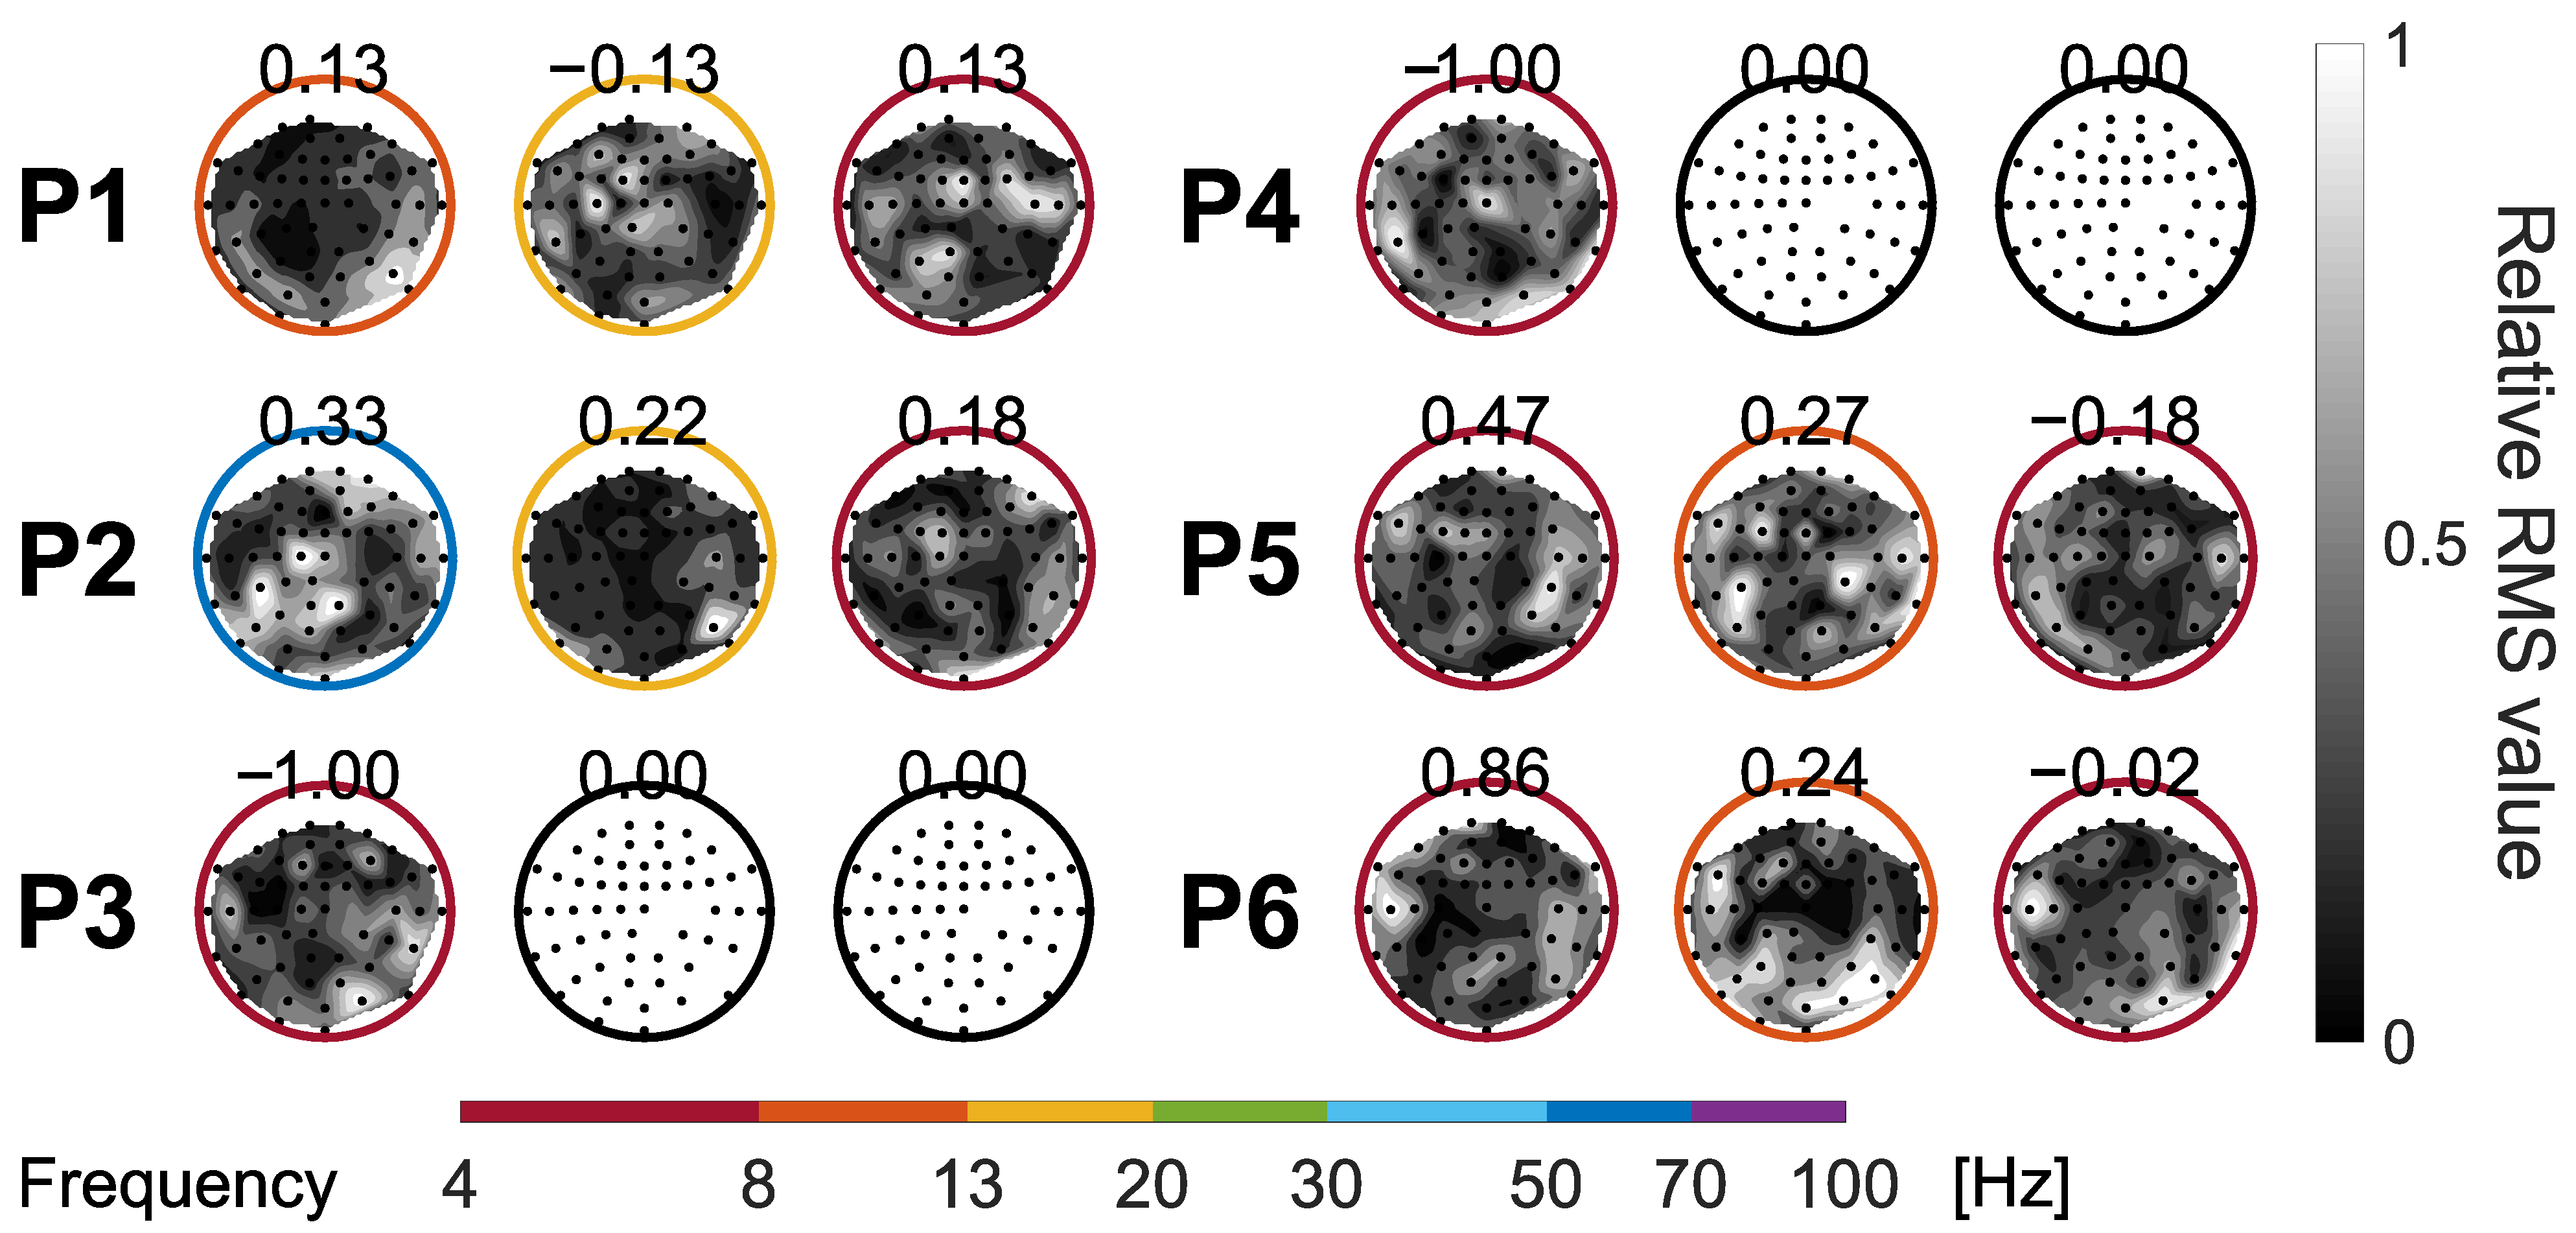
Figure 4 shows the topographies of the spatial patterns associated with the coolness score estimation. The spatial patterns for Participants 3 and 4 were limited to a single pattern, indicating that only one feature was selected during the model retraining. At first glance, the selected spatial patterns appeared to vary across participants. However, the spatial patterns in the theta band (4–8 Hz) and alpha band (8–13 Hz) were frequently selected.
Figure 4.
Topographic maps of the three spatial patterns most strongly associated with the HVAC sound coolness for all participants. Numerical values above the circles indicate the standardized linear weights of features corresponding to the spatial patterns, reflecting their contributions to coolness score estimation. Circle colors indicate the frequency bands. In each map, the upper and lower sides correspond to the front and back of the head, respectively. Dots represent MEG sensor locations. The grayscale indicates the relative root mean square (RMS) value of each spatial pattern across the topographic map.
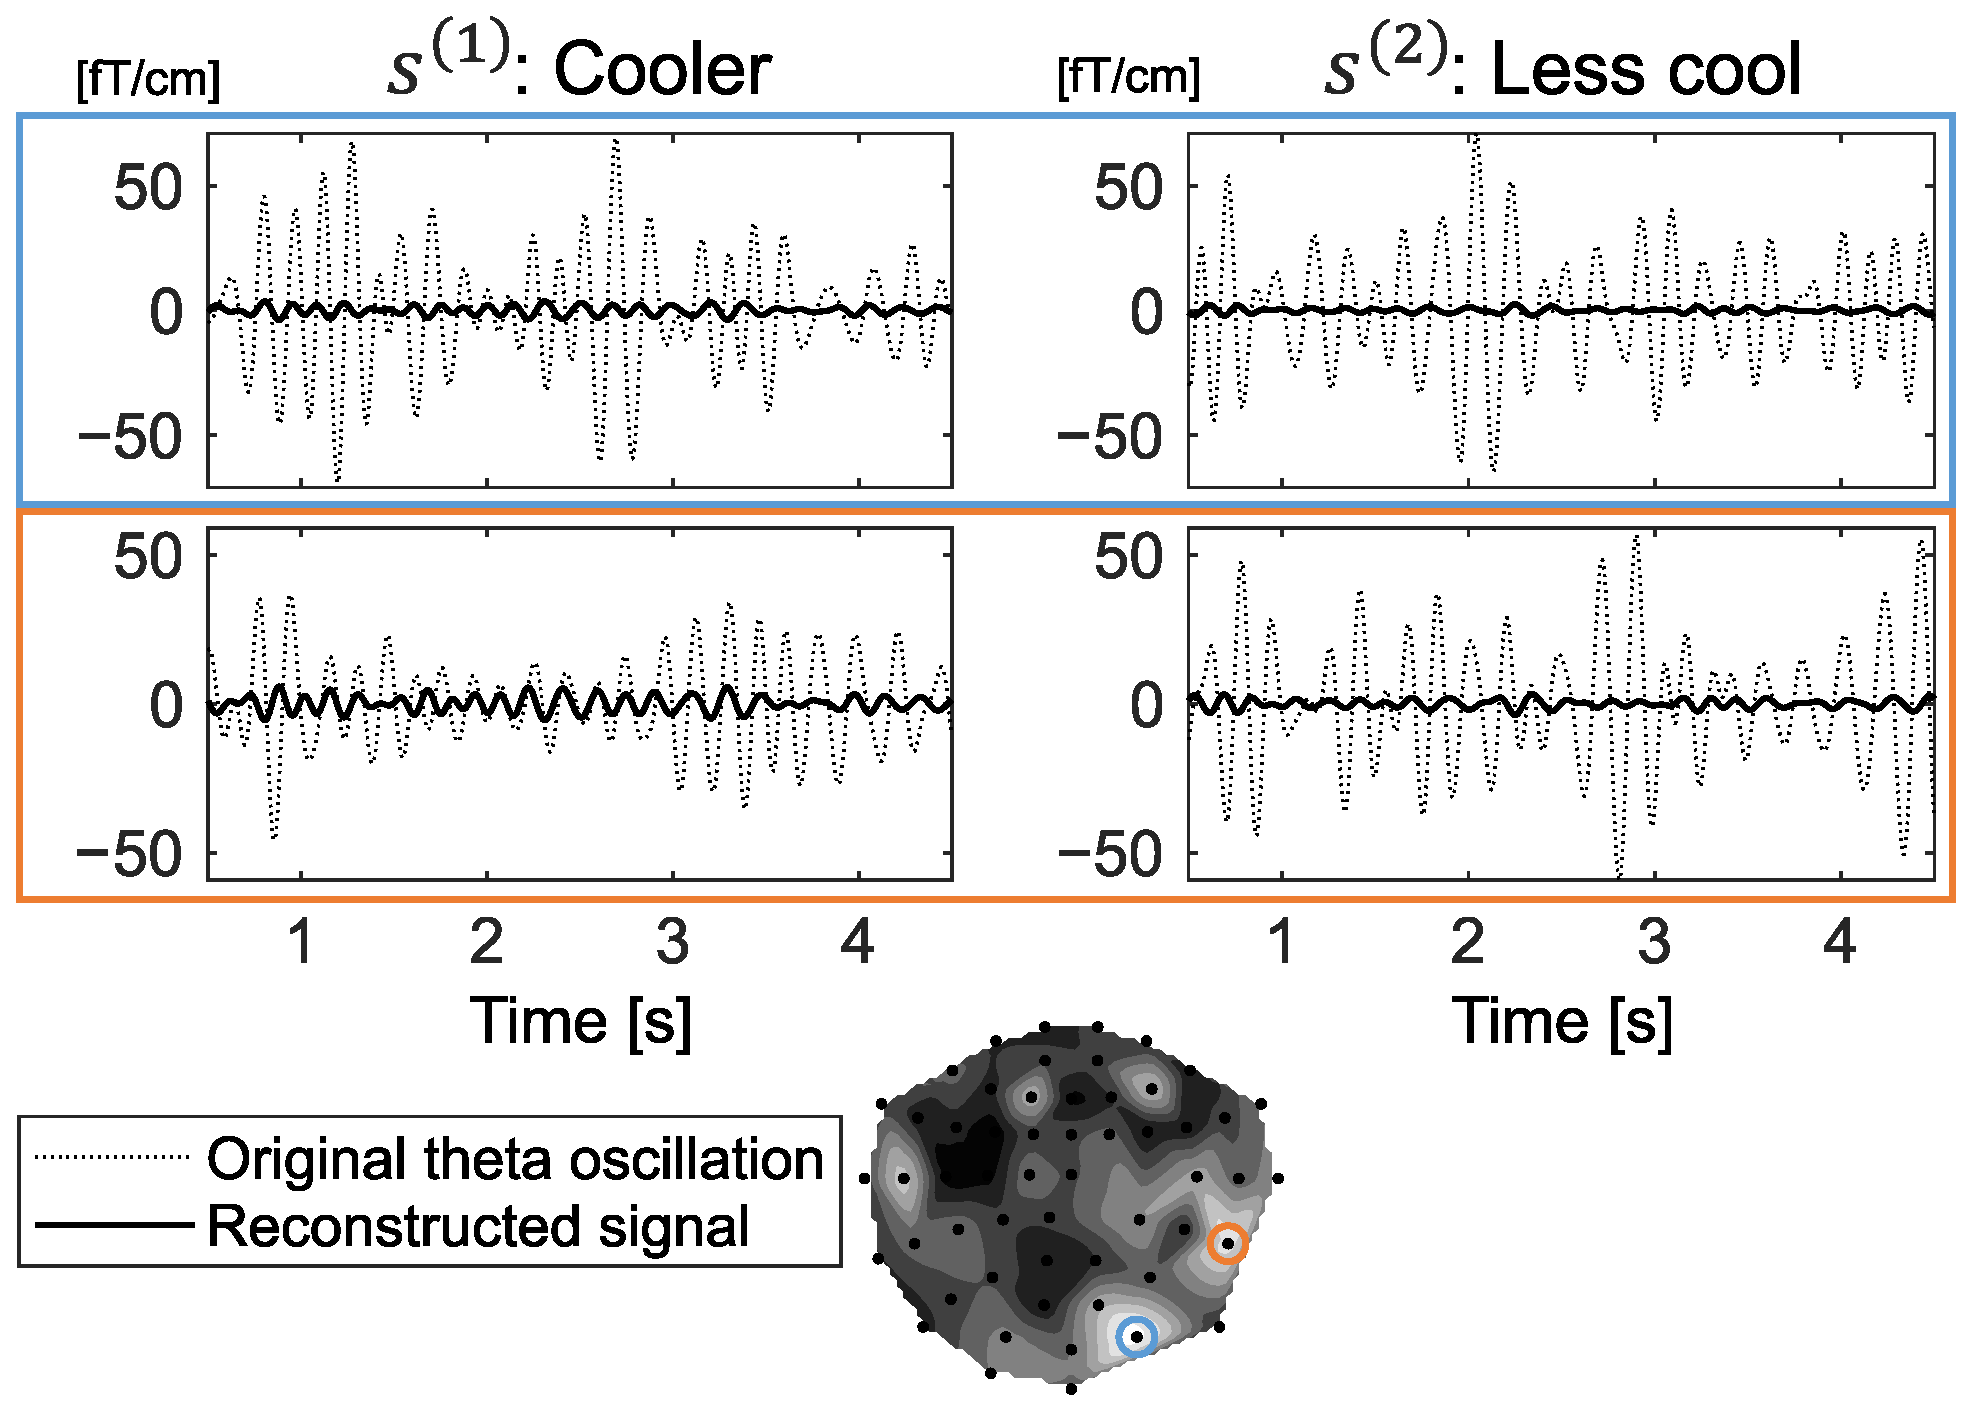
The MEG signals associated with the coolness of HVAC sounds were reconstructed in the original channel space from the spatially filtered MEG signals. Specifically, let denote a signal extracted by a spatial filter and denote the corresponding spatial pattern. The signal reconstructed from in the original channel space is given by . An example of the reconstructed signals for Participant 3 is shown in Figure 5. Theta oscillations that were respectively enhanced and suppressed when listening to cooler and less cool sounds were observed. Nevertheless, the reconstructed signals were considerably smaller than the original MEG signals in the theta band.
Figure 5.
Examples of theta oscillations reconstructed in the original MEG channel space from the signals extracted by the spatial filter that contributed the most to the coolness score estimation for Participant 3. The reconstructed theta oscillations are shown alongside the original theta oscillations. The signals from 0.5 to 4.5 s after the onset of the first and second stimulus presentations in a trial are shown on the left and right, respectively. In this trial, the first stimulus was judged to be cooler than the second stimulus. The colored circles on the topographic maps indicate the MEG channel locations where the signals enclosed by the corresponding colored boxes were observed.
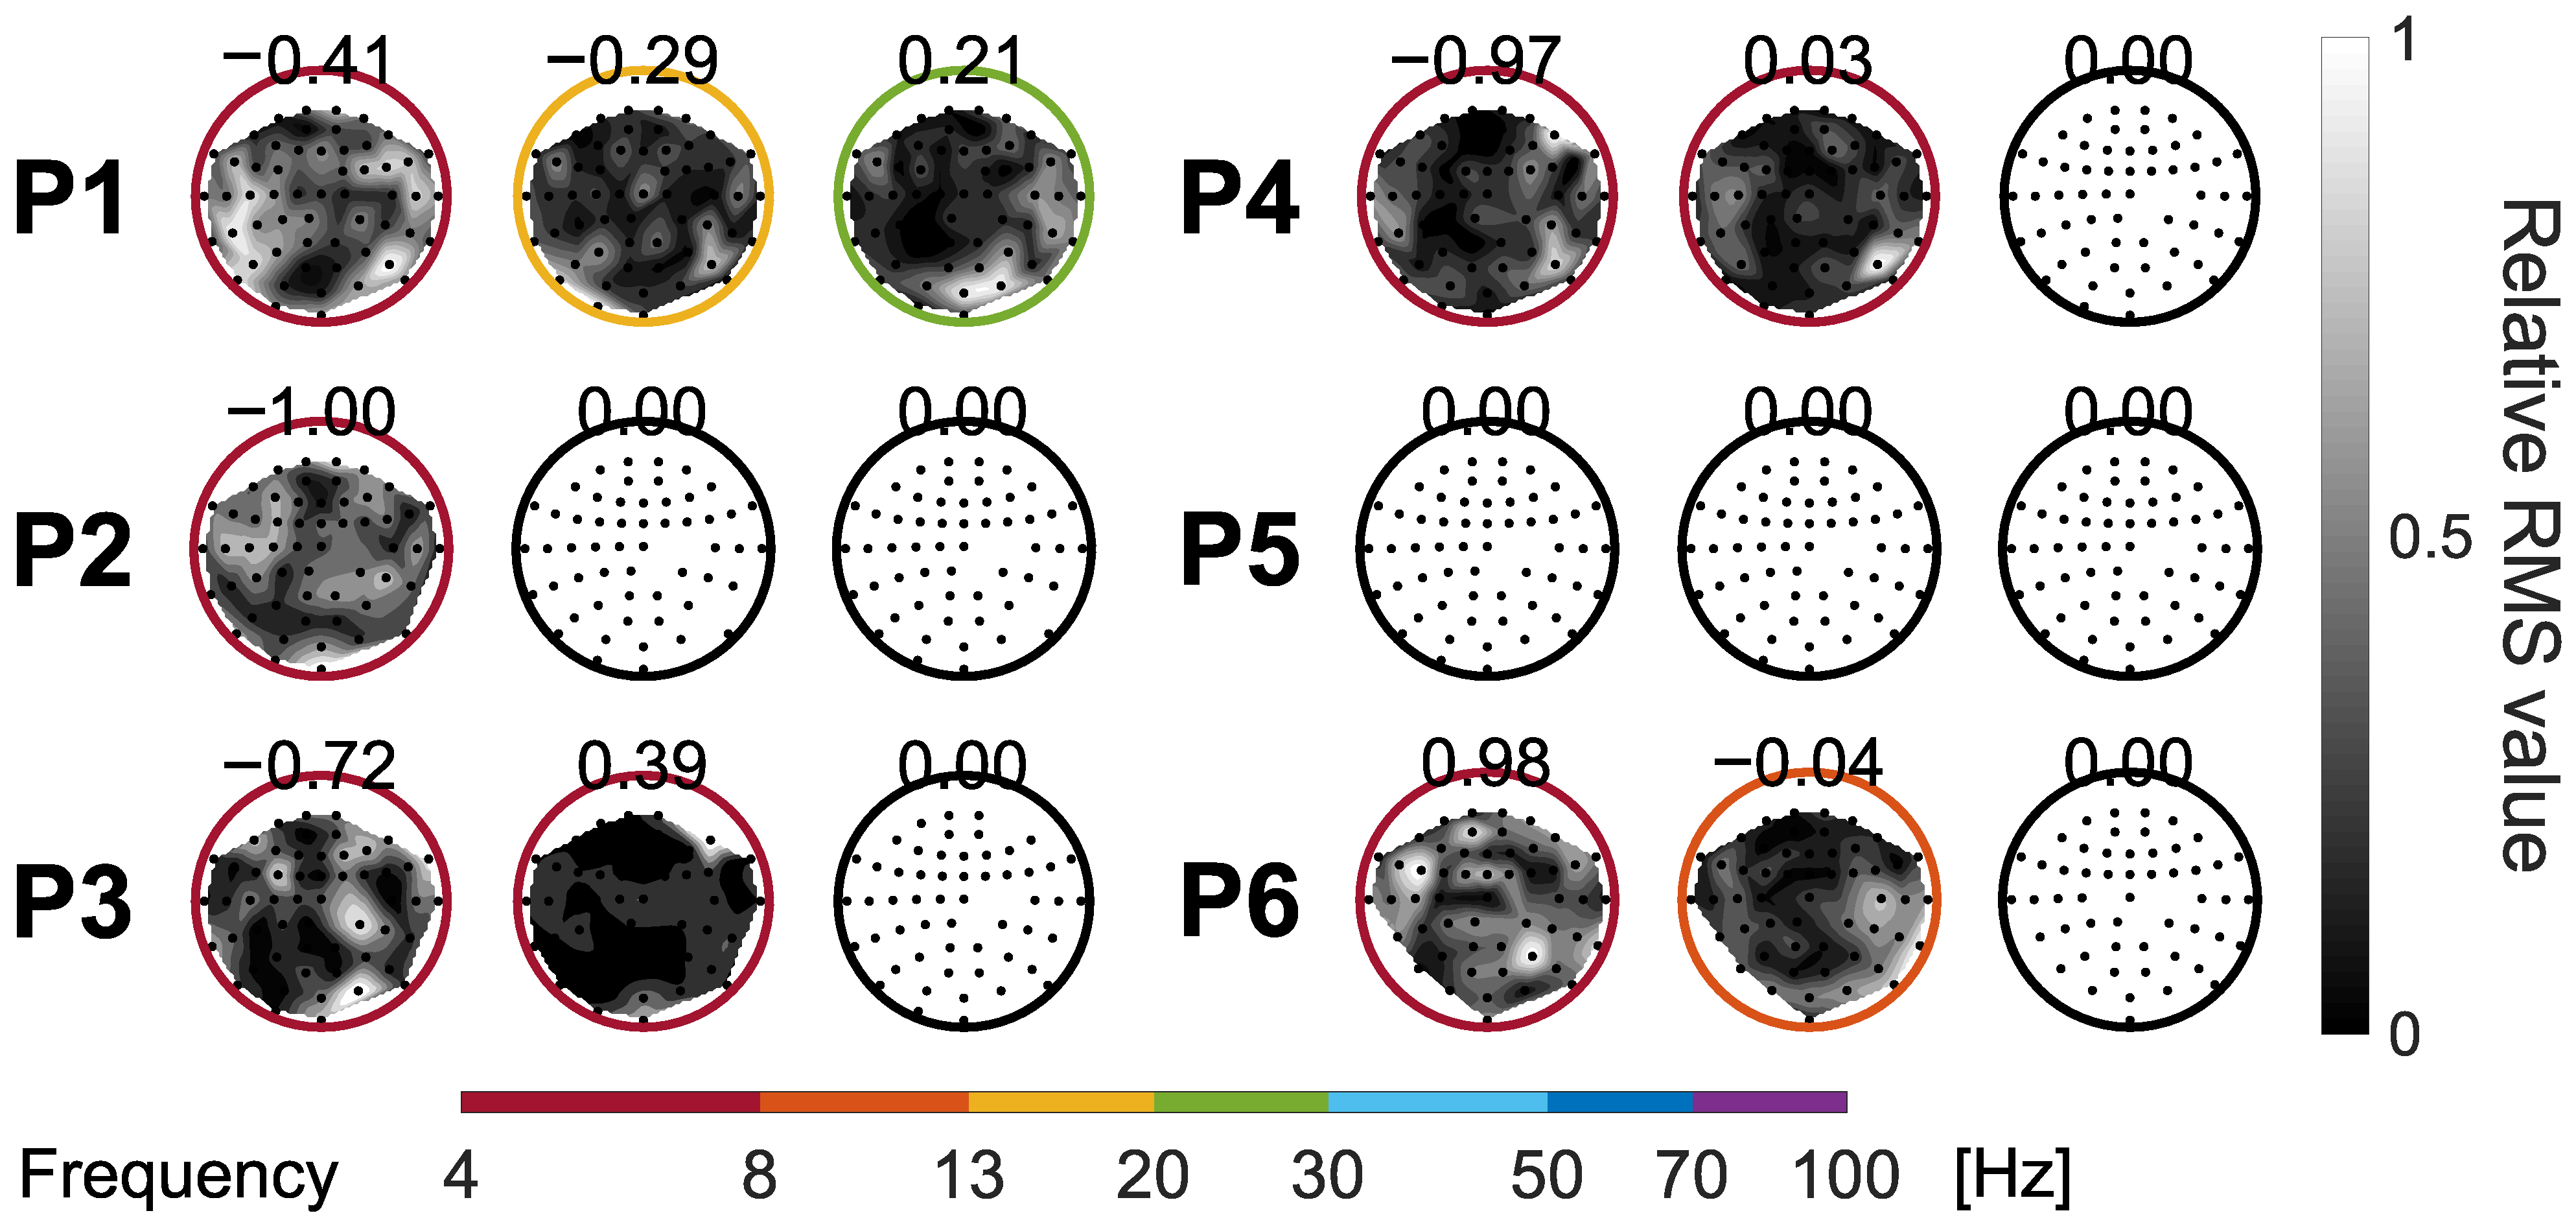
Figure 6 shows the topographies of the spatial patterns associated with the preference score estimation. For Participant 5, no features were selected during the model retraining. For all participants, excluding Participant 5, the spatial patterns in the theta band contributed most to the preference score estimation. The selected spatial patterns also showed individual differences across participants.
Figure 6.
Topographic maps of the three spatial patterns most strongly associated with the HVAC sound preference for all participants. Numerical values above the circles indicate the standardized linear weights of features corresponding to the spatial patterns, reflecting their contributions to preference score estimation. Circle colors indicate the frequency bands. In each map, the upper and lower sides correspond to the front and back of the head, respectively. Dots represent MEG sensor locations. The grayscale indicates the relative RMS value of each spatial pattern across the topographic map.
3.5. Cross-Participant Evaluation
Table 3 shows the accuracies of paired-comparison judgments predicted by the cross-participant preference estimation models trained on data from five participants. For both assessment criteria, the mean accuracy was approximately 52%, and no significant difference from the chance level (50%) was observed (, for coolness; , for preference). Preference scores estimated from unseen participants’ data by the cross-participant models were averaged for each stimulus, and their correlations with the corresponding scores obtained through subjective assessment were analyzed. As a result, no significant correlation was found for either assessment criterion (, for coolness; , for preference).
Table 3.
Prediction accuracies of paired-comparison judgments predicted by the cross-participant models [%].
4. Discussion
4.1. MEG Feature Extraction Associated with HVAC Sound Preferences
In this study, we developed CSP-based spatial filters to discriminate paired-comparison judgments of HVAC sound preferences and extracted preference-modulated MEG signals. The prediction accuracy of the comparative judgments using features computed from these signals was higher than the chance level (50%), suggesting that the CSP-based spatial filters may extract cortical activities associated with the coolness and preference of HVAC sounds to a certain extent.
By using spatial filters designed to mitigate the effects of stimulus presentation order, the prediction accuracy of paired-comparison judgments improved for the coolness assessment MEG data in many participants, whereas no improvement was observed for the preference assessment MEG data. These results suggest that the cortical activity associated with the coolness of HVAC sounds was influenced by the order of stimulus presentation. In contrast, the presentation order likely had little effect on the cortical activity during the preference assessment. One possible reason for the difference between the results for coolness and preference is that judging the coolness of HVAC sounds may be less intuitive and more cognitively demanding than judging their preference. Consequently, the comparative judgments of coolness may have been more influenced by the stimulus presentation order, and this influence might have been reflected in the cortical activity.
Nevertheless, the prediction accuracy of paired-comparison judgments remained low, suggesting that cortical activities highly correlated with the coolness and preference of HVAC sounds were not successfully extracted by the spatial filters. The spatial patterns associated with the HVAC sound preferences exhibited complex structures with multiple intensity peaks, compared to the typical patterns observed in commonly studied tasks such as motor imagery [,,]. Moreover, the signals extracted by the spatial filters were of low amplitude, suggesting that the filters may have overfitted to irrelevant cortical signals and noise inherent in the training data. Alternatively, weighting covariance matrices based on preference could help address this issue. It can serve as a form of regularization that prevents spatial filters from fitting to outlier data. In fact, the use of the covariance matrix weighting in constructing spatial filters improved the prediction accuracy of the paired-comparison judgments in some participants.
4.2. Neurophysiological Estimation of HVAC Sound Preferences
In this study, we also developed the preference estimation models to estimate continuous preference scores from MEG signals recorded while listening to HVAC sounds, with paired-comparison judgments of the HVAC sound preferences used as supervision. Although the true preference scores at each stimulus presentation were unknown, the mean preference scores for each stimulus estimated from the MEG signals in the training data using the models closely matched the results obtained by the psychological method. A weak but significant positive correlation was also observed in the coolness assessment between the mean scores estimated from the test data and those obtained through the psychological method. These suggest that the preference estimation models may capture the relationship between cortical activity and preference scores.
Conversely, the prediction accuracy of paired-comparison judgments for the test data remained around 60%, and the variance of the estimated preference scores for the test data was smaller than that for the training data. The MEG features of the test data were embedded between the two classes of the training data corresponding to the paired-comparison judgments, and the preference scores estimated for the test data tended to be closer to zero compared to those for the training data. These findings suggest that the comparative judgments for the test data were predicted near the decision boundary. The estimation of continuous scores for the coolness and preference of HVAC sounds from single-trial MEG signals is likely to be more challenging due to the absence of distinct components and an inherently low signal-to-noise ratio, compared to commonly studied tasks such as motor imagery.
The preference estimation models were able to capture the relationship between cortical activity and the psychological scales of the HVAC sound preferences in the training data. This also suggests that improving the prediction accuracy of paired-comparison judgments may enhance the performance of preference estimation from single-trial MEG signals. Recently, neural networks have been widely used in the field of BCI, enabling more advanced feature extraction and classification [,,]. Although we did not apply them in this study due to insufficient data per participant, it is possible to incorporate neural networks into the preference estimation models. Moreover, the issue of insufficient training data could be mitigated by data augmentation [,].
4.3. Cortical Activities Associated with HVAC Coolness and Preference
Through the analysis of the sparse linear models, the spatial filters contributing most to the estimation of either coolness or preference scores were identified. These filters are considered to have extracted cortical signals that, although not strongly correlated, were still meaningfully associated with the degree of either coolness or preference of HVAC sounds.
In the estimation of coolness scores, features in the theta and alpha bands were frequently selected. This finding is similar to the results of our previous study []. In that prior study, we examined whether MEG signals during the second stimulus presentation in paired-comparison tasks varied depending to the coolness comparative judgments. The results indicated changes in fronto-parietal low-theta (4–5 Hz) activity for Participants 1, 3, and 4, and changes in temporal alpha activity for Participants 4, 5, and 6. In addition, several MEG and EEG studies have reported that cold stimulation of the skin modulates theta activity in the frontal and temporal regions [,], as well as 10-Hz activity in the posterior insula and secondary somatosensory cortex []. These activities might also be related to the perception of coolness in HVAC sounds. The spatial patterns identified in this study may reflect cortical activities similar to those reported in previous research.
In the estimation of preference scores, features in the theta band were most frequently selected. Previous studies have revealed associations between frontal theta activity and emotional processing [,,,]. Several EEG studies have reported that the pleasantness of music is associated with frontal midline theta activity [] or phase synchronization between the frontal and temporal regions in the theta band []. The spatial patterns associated with the preference of HVAC sounds included activity patterns in the frontal and temporal regions, suggesting that the theta oscillations extracted by these spatial filters may reflect cortical processes related to emotion.
4.4. Generalizability of Preference Estimation Models to Unseen Participants
While the main findings of this study were obtained from participant-specific models, generalizability of the preference estimation models to unseen participants is crucial in practical applications. The models trained on data from five participants showed prediction accuracies for paired-comparison judgments on unseen participants’ data. These accuracies were comparable to the chance level. The correlations between the estimated preference scores and those obtained through the psychological method were close to zero. One possible reason for the low generalizability of the models is individual differences in the measured MEG data. Such differences may arise from variations in head position relative to the MEG sensors, anatomical differences in brain structure, or individual variability in neural processes underlying preference formation. In fact, cortical activities that contributed most to the estimation of coolness and preference scores differed across participants. To develop spatial filters and models with greater generalizability, it will be necessary to use data from a larger number of participants.
4.5. Limitations and Future Directions
The present study was conducted with only six participants, leading to limited statistical power and several limitations in the interpretation of the results. Based on the current findings, it was not possible to determine whether covariance matrix weighting and the mitigation of order effects in CSP-based spatial filters are generally effective. Moreover, the main results obtained in this study were based on participant-specific models, and it was not possible to train preference estimation models with generalizable performance. Although brain activity associated with coolness and preference of HVAC sounds could be visualized using the trained participant-specific linear models, generalizable neurophysiological insights regarding the coolness and preference could not be obtained. Collecting data from a larger number of participants and training models using such data would likely facilitate the development of more generalizable and interpretable models.
The preference estimation models proposed in this study currently have limited performance on unseen data, making it difficult to implement a BCI that controls the environment based on the preferences estimated by the models. However, since the models perform sufficiently well on the training data, they may be useful for modeling the relationship between human perception and the comfort of environments or products. The proposed approach may also be applicable to a variety of evaluation targets beyond HVAC sounds. Moreover, combining the proposed spatial filters with linear models may enable investigation of the relationship between neurophysiological activity and perceived comfort.
5. Conclusions
In this study, we aimed to establish neurophysiological indices associated with HVAC sound preferences. Using MEG recordings during paired-comparison tasks assessing the coolness or preference of HVAC sounds, we developed preference estimation models to estimate continuous preference scores and CSP-based spatial filters to extract MEG signals associated with HVAC sound preferences. The prediction accuracy of the paired-comparison judgments exceeded the chance level, and the preference scores estimated from the training data were strongly correlated with the results of a psychological paired-comparison method. These findings suggest that the preference estimation models may capture the relationship between cortical activity and the psychological scales of HVAC sound preferences. Additionally, spatial filters designed to mitigate the effects of stimulus presentation order improved the performance of the coolness estimation models in five of the six participants. The spatial filters that primarily contributed to the coolness score estimation extracted theta (4–8 Hz) and alpha (8–13 Hz) oscillations, and those that primarily contributed to preference score estimation extracted theta oscillations. These signals may reflect cortical activity associated with the coolness and the preference of HVAC sounds, respectively.
Nevertheless, the performance of the preference estimation models developed in this study remained insufficient for practical use, as the accuracy of estimated preference scores was low and the models showed poor generalization to unseen participants. Collecting data from a larger number of participants is essential for reliable preference estimation. Additionally, it is necessary to robustly extract cortical signals related to the HVAC sound preferences by employing regularization techniques for spatial filters, such as covariance matrix weighting, and more advanced feature extractors based on neural networks.
Author Contributions
Conceptualization, H.Y. and S.N.; methodology, H.Y.; software, H.Y.; validation, H.Y.; formal analysis, H.Y.; investigation, H.Y.; resources, T.T. and S.N.; data curation, H.Y.; writing—original draft preparation, H.Y.; writing—review and editing, T.T. and S.N.; visualization, H.Y.; supervision, T.T.; project administration, S.N. All authors have read and agreed to the published version of the manuscript.
Funding
This work was supported in part by JSPS KAKENHI (Grant No. JP25K21943).
Institutional Review Board Statement
The study was conducted in accordance with the Declaration of Helsinki, and approved by the Institutional Review Board on Ergonomic Research at National Institute of Advanced Industrial Science and Technology (AIST) (protocol code: 人2010-055C; approval date: 9 July 2012).
Informed Consent Statement
Informed consent was obtained from all subjects involved in the study.
Data Availability Statement
The datasets presented in this article are not readily available due to institutional ownership and participant confidentiality. Access may be granted to qualified researchers upon reasonable request and with approval from National Institute of Advanced Industrial Science and Technology (AIST).
Conflicts of Interest
The authors declare no conflicts of interest.
Appendix A. Prior Subjective Assessments of HVAC Sounds
In the prior subjective evaluation, the coolness and preference of seven types of amplitude-modulated HVAC sounds, with modulation frequencies of 0, 0.2, 0.4, 0.6, 0.8, 1.6, and 3.2 Hz, were assessed using a more detailed paired-comparison method than that employed during the MEG measurements.
The participants were seated in a soundproof room facing a computer monitor. Subjective coolness was assessed at three room temperatures (approximately 20, 25, and 30 °C), while subjective preference was assessed at a room temperature of approximately 25 °C. In each trial, two different stimuli were paired and presented sequentially to both ears with an inter-stimulus interval of 1 s. The participants then rated which stimulus was cooler or preferable on a 7-point scale () using a graphical user interface displayed on the monitor. All possible permutations of the paired stimuli were randomly presented once per session, resulting in trials. For each temperature condition, two sessions were conducted sequentially with a break of approximately 5 min. Coolness and preference scores for each stimulus were calculated using Nakaya’s variation of Scheffé’s method [,], based on the analysis of variance. For further details, see [].
Appendix B. Estimated Preference Scores for All Participants
Figure A1 shows the mean coolness scores obtained from the psychological method and the preference estimation model for all participants. Figure A2 shows the mean preference scores obtained from the psychological method and the preference estimation model for all participants.
Figure A1.
Average estimated coolness scores of the four stimuli for all participants. Each colored line represents the average estimated scores in each fold of the cross-validation. (top) Average scores estimated using the psychological method. The black line represents the scores estimated from all comparative judgments. (center) Average scores estimated by the preference estimation models from the MEG signals in the training set. (bottom) Average scores estimated by the models from the MEG signals in the test set.
Figure A2.
Average estimated preference scores of the four stimuli for all participants. Each colored line represents the average estimated scores in each fold of the cross-validation. (top) Average scores estimated using the psychological method. The black line represents the scores estimated from all comparative judgments. (center) Average scores estimated by the preference estimation models from the MEG signals in the training set. (bottom) Average scores estimated by the models from the MEG signals in the test set.
References
- Soeta, Y.; Nakagawa, S.; Tonoike, M.; Ando, Y. Magnetoencephalographic responses corresponding to individual subjective preference of sound fields. J. Sound Vib. 2002, 258, 419–428. [Google Scholar] [CrossRef]
- Lin, Y.P.; Wang, C.H.; Jung, T.P.; Wu, T.L.; Jeng, S.K.; Duann, J.R.; Chen, J.H. EEG-based emotion recognition in music listening. IEEE Trans. Biomed. Eng. 2010, 57, 1798–1806. [Google Scholar] [CrossRef] [PubMed]
- Lee, Y.J.; Shin, T.J.; Lee, S.K. Sound quality analysis of a passenger car based on electroencephalography. J. Mech. Sci. Technol. 2013, 27, 319–325. [Google Scholar] [CrossRef]
- Park, K.H.; Kim, H.J.; Oh, B.; Seo, M.; Lee, E.; Ha, J. Evaluation of human electroencephalogram change for sensory effects of fragrance. Skin Res. Technol. 2019, 25, 526–531. [Google Scholar] [CrossRef]
- Peng, Y.; Lin, Y.; Fan, C.; Xu, Q.; Xu, D.; Yi, S.; Zhang, H.; Wang, K. Passenger overall comfort in high-speed railway environments based on EEG: Assessment and degradation mechanism. Build. Environ. 2022, 210, 108711. [Google Scholar] [CrossRef]
- Wang, F.; Ma, X.; Cheng, D.; Gao, L.; Yao, C.; Lin, W. Electroencephalography as an objective method for assessing subjective emotions during the application of cream. Skin Res. Technol. 2024, 30, e13692. [Google Scholar] [CrossRef]
- Leite, R.P.; Paul, S.; Gerges, S.N. A sound quality-based investigation of the HVAC system noise of an automobile model. Appl. Acoust. 2009, 70, 636–645. [Google Scholar] [CrossRef]
- Tang, S.; Wong, M. On noise indices for domestic air conditioners. J. Sound Vib. 2004, 274, 1–12. [Google Scholar] [CrossRef]
- Susini, P.; McAdams, S.; Winsberg, S.; Perry, I.; Vieillard, S.; Rodet, X. Characterizing the sound quality of air-conditioning noise. Appl. Acoust. 2004, 65, 763–790. [Google Scholar] [CrossRef]
- Park, S.G.; Sim, H.J.; Yoon, J.H.; Jeong, J.E.; Choi, B.J.; Oh, J.E. Analysis of the HVAC system’s sound quality using the design of experiments. J. Mech. Sci. Technol. 2009, 23, 2801–2806. [Google Scholar] [CrossRef]
- Nakagawa, S.; Hotehama, T.; Kamiya, M. Assessment of auditory impression of the coolness and warmness of automotive HVAC noise. In Proceedings of the 39th Annual International Conference of the IEEE Engineering in Medicine and Biology Society (EMBC), Jeju, Republic of Korea, 11–15 July 2017; pp. 4171–4174. [Google Scholar] [CrossRef]
- Back, J.; Lee, S.K.; Min Lee, S.; An, K.; Kwon, D.H.; Park, D.C. Design and implementation of comfort-quality HVAC sound inside a vehicle cabin. Appl. Acoust. 2021, 177, 107940. [Google Scholar] [CrossRef]
- Yano, H.; Takiguchi, T.; Nakagawa, S. Magnetic cortical oscillations associated with subjective auditory coolness during paired comparison of time-varying HVAC sounds. NeuroReport 2024, 35, 1–8. [Google Scholar] [CrossRef] [PubMed]
- Kanosue, K.; Sadato, N.; Okada, T.; Yoda, T.; Nakai, S.; Yoshida, K.; Hosono, T.; Nagashima, K.; Yagishita, T.; Inoue, O.; et al. Brain activation during whole body cooling in humans studied with functional magnetic resonance imaging. Neurosci. Lett. 2002, 329, 157–160. [Google Scholar] [CrossRef] [PubMed]
- Rolls, E.T.; Grabenhorst, F.; Parris, B.A. Warm pleasant feelings in the brain. NeuroImage 2008, 41, 1504–1513. [Google Scholar] [CrossRef] [PubMed]
- Farrell, M.J.; Johnson, J.; McAllen, R.; Zamarripa, F.; Denton, D.A.; Fox, P.T.; Egan, G.F. Brain activation associated with ratings of the hedonic component of thermal sensation during whole-body warming and cooling. J. Therm. Biol. 2011, 36, 57–63. [Google Scholar] [CrossRef]
- Aizawa, Y.; Harada, T.; Nakata, H.; Tsunakawa, M.; Sadato, N.; Nagashima, K. Assessment of brain mechanisms involved in the processes of thermal sensation, pleasantness/unpleasantness, and evaluation. IBRO Rep. 2019, 6, 54–63. [Google Scholar] [CrossRef]
- Yao, Y.; Lian, Z.; Liu, W.; Jiang, C.; Liu, Y.; Lu, H. Heart rate variation and electroencephalograph—The potential physiological factors for thermal comfort study. Indoor Air 2009, 19, 93–101. [Google Scholar] [CrossRef]
- Shan, X.; Yang, E.H.; Zhou, J.; Chang, V.W.C. Human-building interaction under various indoor temperatures through neural-signal electroencephalogram (EEG) methods. Build. Environ. 2018, 129, 46–53. [Google Scholar] [CrossRef]
- Son, Y.J.; Chun, C. Research on electroencephalogram to measure thermal pleasure in thermal alliesthesia in temperature step-change environment. Indoor Air 2018, 28, 916–923. [Google Scholar] [CrossRef]
- Wu, M.; Li, H.; Qi, H. Using electroencephalogram to continuously discriminate feelings of personal thermal comfort between uncomfortably hot and comfortable environments. Indoor Air 2020, 30, 534–543. [Google Scholar] [CrossRef]
- Hadjidimitriou, S.K.; Hadjileontiadis, L.J. Toward an EEG-based recognition of music liking using time-frequency analysis. IEEE Trans. Biomed. Eng. 2012, 59, 3498–3510. [Google Scholar] [CrossRef]
- Atkinson, J.; Campos, D. Improving BCI-based emotion recognition by combining EEG feature selection and kernel classifiers. Expert Syst. Appl. 2016, 47, 35–41. [Google Scholar] [CrossRef]
- Naser, D.S.; Saha, G. Influence of music liking on EEG based emotion recognition. Biomed. Signal Process. Control 2021, 64, 102251. [Google Scholar] [CrossRef]
- Zhong, P.; Wang, D.; Miao, C. EEG-based emotion recognition using regularized graph neural networks. IEEE Trans. Affect. Comput. 2022, 13, 1290–1301. [Google Scholar] [CrossRef]
- Yano, H.; Takiguchi, T.; Nakagawa, S. Cortical patterns for prediction of subjective preference induced by chords. In Proceedings of the 41st Annual International Conference of the IEEE Engineering in Medicine and Biology Society (EMBC), Berlin, Germany, 23–27 July 2019; pp. 5168–5171. [Google Scholar] [CrossRef]
- Hämäläinen, M.; Hari, R.; Ilmoniemi, R.J.; Knuutila, J.; Lounasmaa, O.V. Magnetoencephalography—Theory, instrumentation, and applications to noninvasive studies of the working human brain. Rev. Mod. Phys. 1993, 65, 413–497. [Google Scholar] [CrossRef]
- Hyvärinen, A. Fast and robust fixed-point algorithms for independent component analysis. IEEE Trans. Neural Netw. 1999, 10, 626–634. [Google Scholar] [CrossRef]
- Herbirch, R.; Graepel, T.; Bollmann-Sdorra, P.; Obermayer, K. Learning preference relations for information retrieval. In Proceedings of the AAAI-98 Workshop on Learning for Text Categorization, Madison, WI, USA, 26–27 July 1998; pp. 83–86. [Google Scholar]
- Hüllermeier, E.; Fürnkranz, J.; Cheng, W.; Brinker, K. Label ranking by learning pairwise preferences. Artif. Intell. 2008, 172, 1897–1916. [Google Scholar] [CrossRef]
- Müller-Gerking, J.; Pfurtscheller, G.; Flyvbjerg, H. Designing optimal spatial filters for single-trial EEG classification in a movement task. Clin. Neurophysiol. 1999, 110, 787–798. [Google Scholar] [CrossRef]
- Ramoser, H.; Müller-Gerking, J.; Pfurtscheller, G. Optimal spatial filtering of single trial EEG during imagined hand movement. IEEE Trans. Rehabil. Eng. 2000, 8, 441–446. [Google Scholar] [CrossRef]
- Blankertz, B.; Tomioka, R.; Lemm, S.; Kawanabe, M.; Müller, K.R. Optimizing spatial filters for robust EEG single-trial analysis. IEEE Signal Process. Mag. 2008, 25, 41–56. [Google Scholar] [CrossRef]
- Borg, I.; Groenen, P.J. Modern Multidimensional Scaling, 2nd ed.; Springer Series in Statistics; Springer: New York, NY, USA, 2005. [Google Scholar] [CrossRef]
- Thurstone, L.L. A law of comparative judgment. Psychol. Rev. 1927, 34, 273–286. [Google Scholar] [CrossRef]
- Gulliksen, H. A least squares solution for paired comparisons with incomplete data. Psychometrika 1956, 21, 125–134. [Google Scholar] [CrossRef]
- Friedman, J.; Hastie, T.; Tibshirani, R. Regularization paths for generalized linear models via coordinate descent. J. Stat. Softw. 2010, 33, 1–22. [Google Scholar] [CrossRef] [PubMed]
- Halme, H.L.; Parkkonen, L. Comparing features for classification of MEG responses to motor imagery. PLoS ONE 2016, 11, e0168766. [Google Scholar] [CrossRef]
- Lawhern, V.J.; Solon, A.J.; Waytowich, N.R.; Gordon, S.M.; Hung, C.P.; Lance, B.J. EEGNet: A compact convolutional neural network for EEG-based brain–computer interfaces. J. Neural Eng. 2018, 15, 056013. [Google Scholar] [CrossRef]
- Zhang, C.; Kim, Y.K.; Eskandarian, A. EEG-inception: An accurate and robust end-to-end neural network for EEG-based motor imagery classification. J. Neural Eng. 2021, 18, 046014. [Google Scholar] [CrossRef]
- He, C.; Liu, J.; Zhu, Y.; Du, W. Data augmentation for deep neural networks model in EEG classification task: A review. Front. Hum. Neurosci. 2021, 15, 765525. [Google Scholar] [CrossRef]
- Rommel, C.; Paillard, J.; Moreau, T.; Gramfort, A. Data augmentation for learning predictive models on EEG: A systematic comparison. J. Neural Eng. 2022, 19, 066020. [Google Scholar] [CrossRef]
- Chang, P.F.; Arendt-Nielsen, L.; Chen, A.C. Comparative cerebral responses to non-painful warm vs. cold stimuli in man: EEG power spectra and coherence. Int. J. Psychophysiol. 2005, 55, 73–83. [Google Scholar] [CrossRef]
- Fardo, F.; Vinding, M.C.; Allen, M.; Jensen, T.S.; Finnerup, N.B. Delta and gamma oscillations in operculo-insular cortex underlie innocuous cold thermosensation. J. Neurophysiol. 2017, 117, 1959–1968. [Google Scholar] [CrossRef]
- Stančák, A.; Mlynář, J.; Poláček, H.; Vrána, J. Source imaging of the cortical 10 Hz oscillations during cooling and warming in humans. NeuroImage 2006, 33, 660–671. [Google Scholar] [CrossRef]
- Aftanas, L.; Golocheikine, S. Human anterior and frontal midline theta and lower alpha reflect emotionally positive state and internalized attention: High-resolution EEG investigation of meditation. Neurosci. Lett. 2001, 310, 57–60. [Google Scholar] [CrossRef]
- Sammler, D.; Grigutsch, M.; Fritz, T.; Koelsch, S. Music and emotion: Electrophysiological correlates of the processing of pleasant and unpleasant music. Psychophysiology 2007, 44, 293–304. [Google Scholar] [CrossRef] [PubMed]
- Ertl, M.; Hildebrandt, M.; Ourina, K.; Leicht, G.; Mulert, C. Emotion regulation by cognitive reappraisal—The role of frontal theta oscillations. NeuroImage 2013, 81, 412–421. [Google Scholar] [CrossRef] [PubMed]
- Zhao, G.; Zhang, Y.; Ge, Y. Frontal EEG asymmetry and middle line power difference in discrete emotions. Front. Behav. Neurosci. 2018, 12, 225. [Google Scholar] [CrossRef] [PubMed]
- Ara, A.; Marco-Pallarés, J. Fronto-temporal theta phase-synchronization underlies music-evoked pleasantness. NeuroImage 2020, 212, 116665. [Google Scholar] [CrossRef]
- Scheffé, H. An analysis of variance for paired comparisons. J. Am. Stat. Assoc. 1952, 47, 381–400. [Google Scholar] [CrossRef]
- Oshima, H.; Koizumi, T.; Tsujiuchi, N. Sensory assessment of loudspeakers considering multiple factors. J. Environ. Eng. 2009, 4, 78–88. [Google Scholar] [CrossRef]
Disclaimer/Publisher’s Note: The statements, opinions and data contained in all publications are solely those of the individual author(s) and contributor(s) and not of MDPI and/or the editor(s). MDPI and/or the editor(s) disclaim responsibility for any injury to people or property resulting from any ideas, methods, instructions or products referred to in the content. |
© 2025 by the authors. Licensee MDPI, Basel, Switzerland. This article is an open access article distributed under the terms and conditions of the Creative Commons Attribution (CC BY) license (https://creativecommons.org/licenses/by/4.0/).