Article

Advancing Retaining Wall Inspections: Comparative Analysis of Drone-Lidar and Traditional TLS Methods for Enhanced Structural Assessment

1
College of Engineering, University of Connecticut, Storrs, CT 06269, USA
2
NHERI RAPID Facility, University of Washington, Seattle, WA 98195, USA
*
Author to whom correspondence should be addressed.
Appl. Sci. 2025, 15(22), 12008; https://doi.org/10.3390/app152212008
Submission received: 24 September 2025 / Revised: 30 October 2025 / Accepted: 10 November 2025 / Published: 12 November 2025
(This article belongs to the Section Civil Engineering)

Abstract

Accurate inspection of retaining walls is crucial for ensuring structural integrity and public safety. Current assessment methods rely predominantly on qualitative visual evaluations that inform numerical structural ratings. These ratings lack the comprehensive quantitative measurements that 3D imaging can provide. This study evaluates the feasibility and accuracy of drone-based lidar platforms for retaining wall inspection as an alternative to traditional terrestrial laser scanning (TLS) that improves accessibility on hard-to-reach sites and may increase efficiency on site due to preplanned flights. Data was collected from three representative walls exhibiting diverse conditions using TLS and drone-lidar. To provide additional information on the site to use for alignment and checks, both Global Navigation Satellite System (GNSS) control and total stations were employed. The study provides a comparative analysis of the accuracy and practicality of each lidar method, aiming to determine the most effective techniques for routine inspection applications given varying site conditions. When compared against a finely registered TLS ground truth, drone-lidar was found to have root mean square errors of 2.3 cm in areas with low vegetation and 24.2 cm in densely vegetated areas. The findings highlight potential improvements in the precision of retaining wall assessments, proposing a shift from current qualitative practices to reliable, data-driven evaluations. Key limitations in GNSS accuracy and sites with dense vegetation are discussed.

1. Introduction

Retaining walls are vital infrastructure assets. Their maintenance is necessary to ensure safe and reliable transportation networks. Inspections of these structures must be accurate, quantitative, and repeatable to support data-driven asset management. The United States Federal Highway Administration in partnership with the National Park Service began the Wall Inventory Program in 2007. Nearly 3500 walls in 34 national parks across the United States were inventoried and their conditions were visually assessed. The estimated cost to repair damages to these critical transportation assets only within national parks was estimated at $18.5 million in 2007 [1]. With the National Park Service’s Wall Inventory Program representing only a small portion of retaining walls in the United States, there is a clear need for diligent asset management supported by quality routine inspection. However, current inspection standards fall short. They primarily rely on technicians’ qualitative visual assessments to determine structural ratings [2]. While a trained inspector may notice cracks and major signs of failure, their assessments are inherently subjective, may be difficult to reproduce, and prone to individual biases [2,3]. These methods also risk missing subtle signs of structure degradation that grow over time in retaining walls, such as bulging or leaning.
Inspection practices for retaining walls can be improved by implementing routine, comprehensive 3D imaging. Modern 3D imaging can provide accurate, precise, and complete measurements of retaining walls. Such measurements are critical as these structures are vulnerable to gradually developing problems such as leaning, bulging, and cracking [4,5,6]. This data enables asset management programs to support detailed service planning by quantifying changes in structural conditions. There is no established standard for routine retaining wall imaging in the United States [2]. Some agencies, such as North Carolina’s Department of Transportation, make nonbinding suggestions to deploy 3D imaging for walls in their state that have already been visually identified as poor, deteriorating, or beyond serviceability [7]. This growing need has been recognized by many agencies, as they call for further research on 3D imaging methods to aid in retaining wall asset management [7,8].
A variety of 3D imaging methods are in practice today. For example, lidar (Light Distance and Ranging) is used for many different applications including surveying, agriculture, archeology, robotics, etc. [9]. Lidar is implemented on a variety of platforms and is typically based on either time-of-flight measurements or phase-shift measurements [10,11]. Often operated on the ground from tripods, Terrestrial Laser Scanning (TLS) is commonly seen in the field of infrastructure monitoring and inspection [12,13,14,15]. Modern TLS scanners, such as Leica’s ScanStation P50, take advantage of both time-of-flight and phase-shift calculations through a method known as waveform digitizer technology (WFD) [16,17]. WFD enhances time-of-flight measurements and enables higher measurement accuracy, longer ranges, and smaller laser spot sizes [17].
TLS has been established as a reliable and accurate method of surface-level 3D imaging for structural health monitoring, even though it is unable to capture subsurface conditions. TLS and other lidar methods provide detailed and repeatable measurements of surface features that often serve as the first visible indicators of structural distress. Comprehensive structural health monitoring should use lidar-driven methods in conjunction with non-destructive testing methods, such as ground-penetrating radar, infrared thermography, and ultrasound. These methods enable inspectors to detect changes below a structure’s surface. The scope of this study is limited to the assessment of surface-level 3D imaging using lidar-based methods for asset management. TLS is a well-established method for these purposes, despite its limitations on large or complex sites.
The use of TLS for structural inspections has been the target of ample research. In studies specifically focused on civil infrastructure, TLS is effective for inspecting pavement, bridges, tunnels, and retaining walls [12]. TLS is a reliable method of capturing dense and accurate point clouds for change detection and deformation monitoring in civil structures [18]. It has also been effective for establishing ground truth measurements in recent studies evaluating alternative uncrewed aerial system (UAS) inspection methods based on structure-from-motion photogrammetry [19,20]. In a case study by Kwiatkowski and Anigacz on a noncontact bridge inventory, TLS measurements were within 0.4 cm of baseline total station measurements [21]. A recent study from Khan and Kumar found that methods derived from TLS data could detect 14 types of pavement distress [22]. A study from Oskouie et al. proposed a TLS-based method with an average error of 0.09 cm when measuring retaining wall displacements [23]. Anil et al. found that a pulsed time-of-flight TLS could detect a 0.125 cm crack within 10 m with proper sampling intervals [24]. Wondolowski et al. found TLS to be accurate within 0.065 cm on control surfaces in their study of enhanced inspection practices for masonry retaining walls [20].
TLS requires multiple setups to be manually set up and broken down, has limited mobility that may result in obstructed scans, and is inherently time-consuming for inspectors to capture comprehensive coverage [12]. With enhanced mobility and rapid data-collection capacity, drone-based lidar platforms offer a solution to these problems. Recent research into drone-lidar has primarily been focused on the automation of data collection and data processing through the improvement of autonomous flight patterns or autonomous feature detection [25,26,27].
While previous studies aim to improve the overall efficiency of the technology, they fail to provide evidence that spatial measurements collected with drone-lidar are comparable to TLS or that the data collection methods are suitable for retaining wall asset management. Numerous studies have developed applications that combine drone-lidar data with TLS or imagery data [28,29]. Despite using drone-lidar alongside TLS, previous studies have not presented comparisons to validate drone-lidar accuracy against TLS measurements as ground truth. This study closes that gap by validating drone-lidar measurement accuracy against TLS ground truth on retaining walls with different sizes, materials, and vegetation coverage.
Comprehensive retaining wall structural health monitoring requires accurate 3D measurements on both local and global scales. Local measurements are important for tracking changes on a wall’s surface, such as cracks. Global accuracy, meaning the accuracy of a 3D model’s position relative to a global reference system, influences the ability to track changes across the entire structure between subsequent inspections. This is an important distinction because both local and global accuracy are required to monitor slight leans or bulges in a retaining wall that indicate structural decay [30]. This study addresses limitations in previous work by establishing comprehensive and georeferenced ground truth models of each retaining wall with TLS and GNSS to evaluate the local and global accuracy of drone-lidar data.
The lack of quantitative validation of drone-lidar data on vertical surfaces in prior studies leaves uncertainty about whether this 3D imaging method can reliably meet the accuracy requirements for retaining wall inspections in structural health monitoring. This study addresses that uncertainty and contributes to the state of practice by presenting a direct comparison of drone-lidar and TLS to assess the efficacy of drone-lidar in retaining wall inspections. Drone-lidar measurements were collected of three retaining walls on sites with varied sizes, materials, and vegetation cover, selected to highlight potential limitations for this application. The global accuracy of drone-lidar measurements was assessed by comparing georeferenced point cloud data from TLS ground truth and drone-lidar. Local accuracy was measured through cloud comparisons after drone-lidar clouds were aligned with TLS clouds using an additional iterative closest point (ICP) registration [20]. These comparisons to TLS ground truths quantified the accuracy of the drone-lidar systems, separately evaluating the local accuracy of their sensing equipment and the global accuracy of their georeferencing systems, to assess their efficacy for retaining wall assessment.
This study demonstrates how drone-lidar can be integrated into practical asset management by focusing on walls that represent common field conditions. Correlations between vegetation coverage and measurement accuracy were established by comparing site conditions and drone-lidar accuracy between walls. This approach identifies scenarios with limited drone-lidar performance. This study’s realistic trial of drone-lidar retaining wall inspections provides actionable insights for future development in 3D imaging for infrastructure asset management. This article will outline the methods used to collect and process 3D models of each retaining wall and share the accuracy, density, and distribution of data within these models. The uses of the drone-lidar and TLS for retaining wall inspection are discussed based on the findings of this study.

2. Materials and Methods

This study aims to evaluate the feasibility of modern 3D imaging technologies, specifically terrestrial-lidar and drone-lidar, for the inspection of retaining walls. The research studies three retaining walls representative of various types of earth-retaining structures and site conditions. These structures were studied using both quantitative measurements and qualitative site assessments. Drone-lidar platforms’ ability to measure precisely, resolve features, and detect changes with and without the presence of vegetation is assessed. These assessments will be evaluated by comparing them to ground truth measurements obtained with tripod-mounted terrestrial lidar. Additionally, this study evaluates the accuracy of GNSS data for georeferencing models in structural health monitoring applications.

2.1. Overview of Structures

Three separate retaining walls were targeted for this study, each with unique characteristics and challenges. Figure 1 shows images of each of these structures.
Wall A, shown in Figure 1a, is a gravity wall that supports soil behind a parking complex. A 24 m section of this wall that was free of vegetation with clear surroundings was selected for this study. The surface of this poured concrete structure contained a textured pattern meant to emulate the look of cobbled stone masonry walls. Wall B, shown in Figure 1b, supports a foot path on the edge of the Montlake Cut and is a drystone masonry retaining wall constructed of large stones that spanned 82 m. This wall was covered by dense vegetation which was expected to impact the quality of lidar measurements of the structure itself. Similarly, Wall C, shown in Figure 1c, was partially obstructed by the hedges the structure supported along a park path. This 20 m section is also a drystone masonry wall constructed using small stone pavers. The presence of vegetation on Wall B and Wall C provided the opportunity to assess the quality of lidar inspection on sites with partially or fully obstructed surfaces.
These three walls were purposefully selected to vary in both length and vegetation cover. Variations in size allowed this study to investigate whether spatial measurement error accumulated over longer walls. Differences in vegetation provided insights into lidar’s performance across a range of visibility conditions, from the fully exposed surface of Wall A to the densely covered surface of Wall B. These walls were also selected to represent the two most common types of retaining wall surfaces in the United States: masonry and concrete. Data from the National Park Service Wall Inventory Program shows that masonry retaining walls are most prevalent in rural areas, representing 61% of all walls surveyed, followed by concrete-faced walls at 30% [1]. Cincinnati, Ohio’s 2016–2017 report on retaining walls and landslides shows that concrete walls are the most common in urban areas, comprising 65% of surveyed walls, compared to 26% for masonry [31]. The inclusion of concrete and masonry walls with varying vegetation and scale in this study enhances the generalizability of its findings by reflecting the conditions found in rural areas surrounding National Parks and urban areas such as Cincinnati.

2.2. Ground Control Systems

2.2.1. Site Map

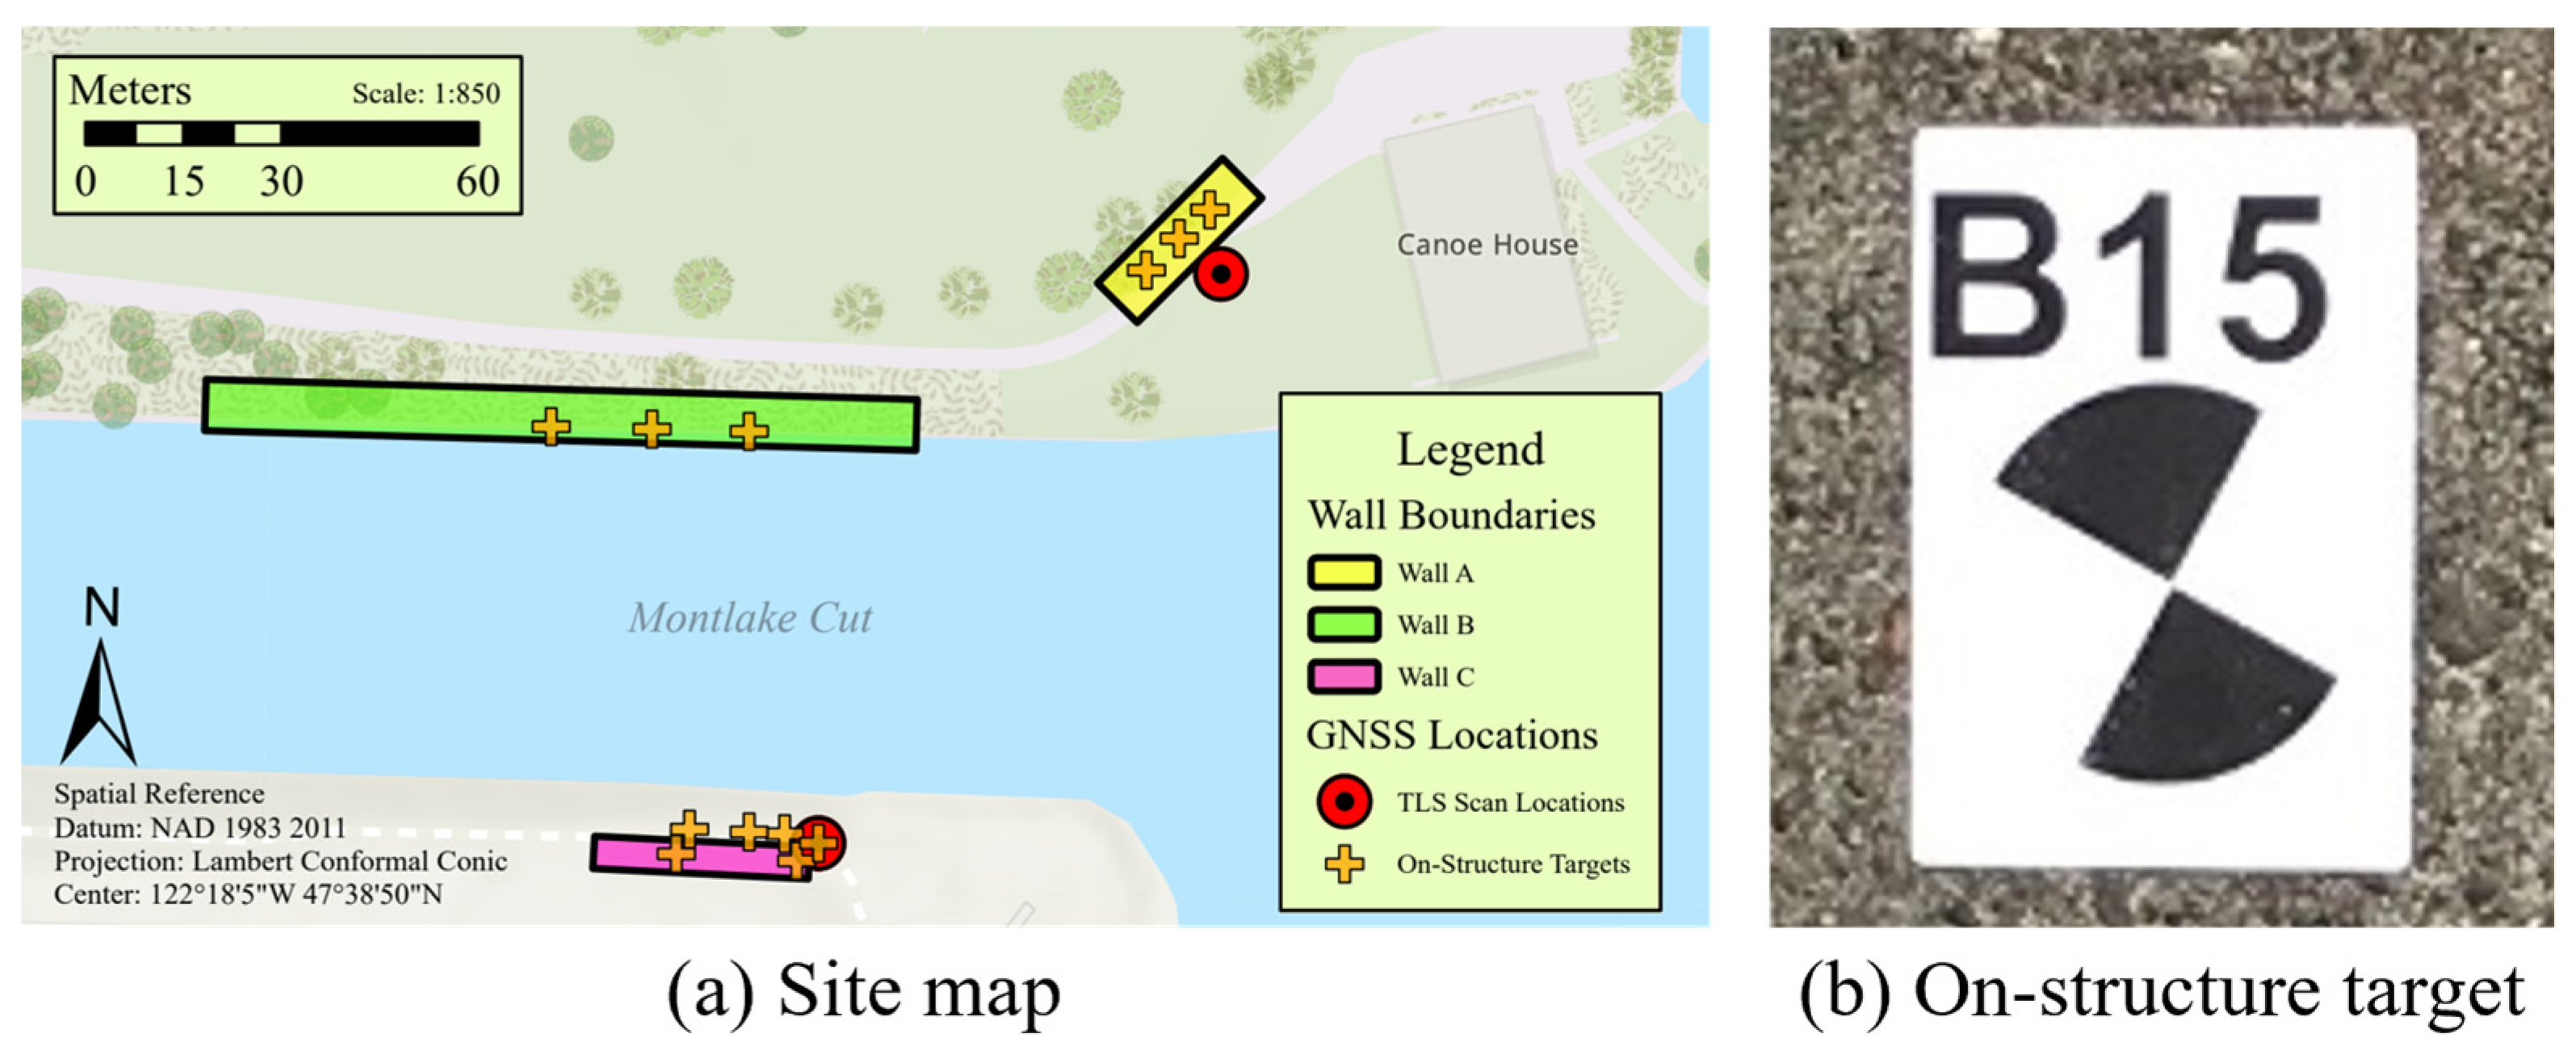
Figure 2a is a map of the full study site on the eastern inlet of the Montlake Cut in Seattle, WA [32]. This site map includes the locations of the three study walls and elements of the ground control system. The TLS unit was operated from two locations with one setup north of the Montlake Cut and another setup south of it as shown in Figure 2a. Two TLS scans were captured at the south setup to ensure sufficient coverage of Wall B across the waterway while only one TLS scan was captured at the north setup. On-structure targets are shown in Figure 2b. They were included to provide redundant alignment information. These targets were not necessary for the alignment of data, given the geolocation of all lidar collection points, but were included to provide options for manual alignment improvement for this study.

2.2.2. Total Station Electronic Distance Measurements

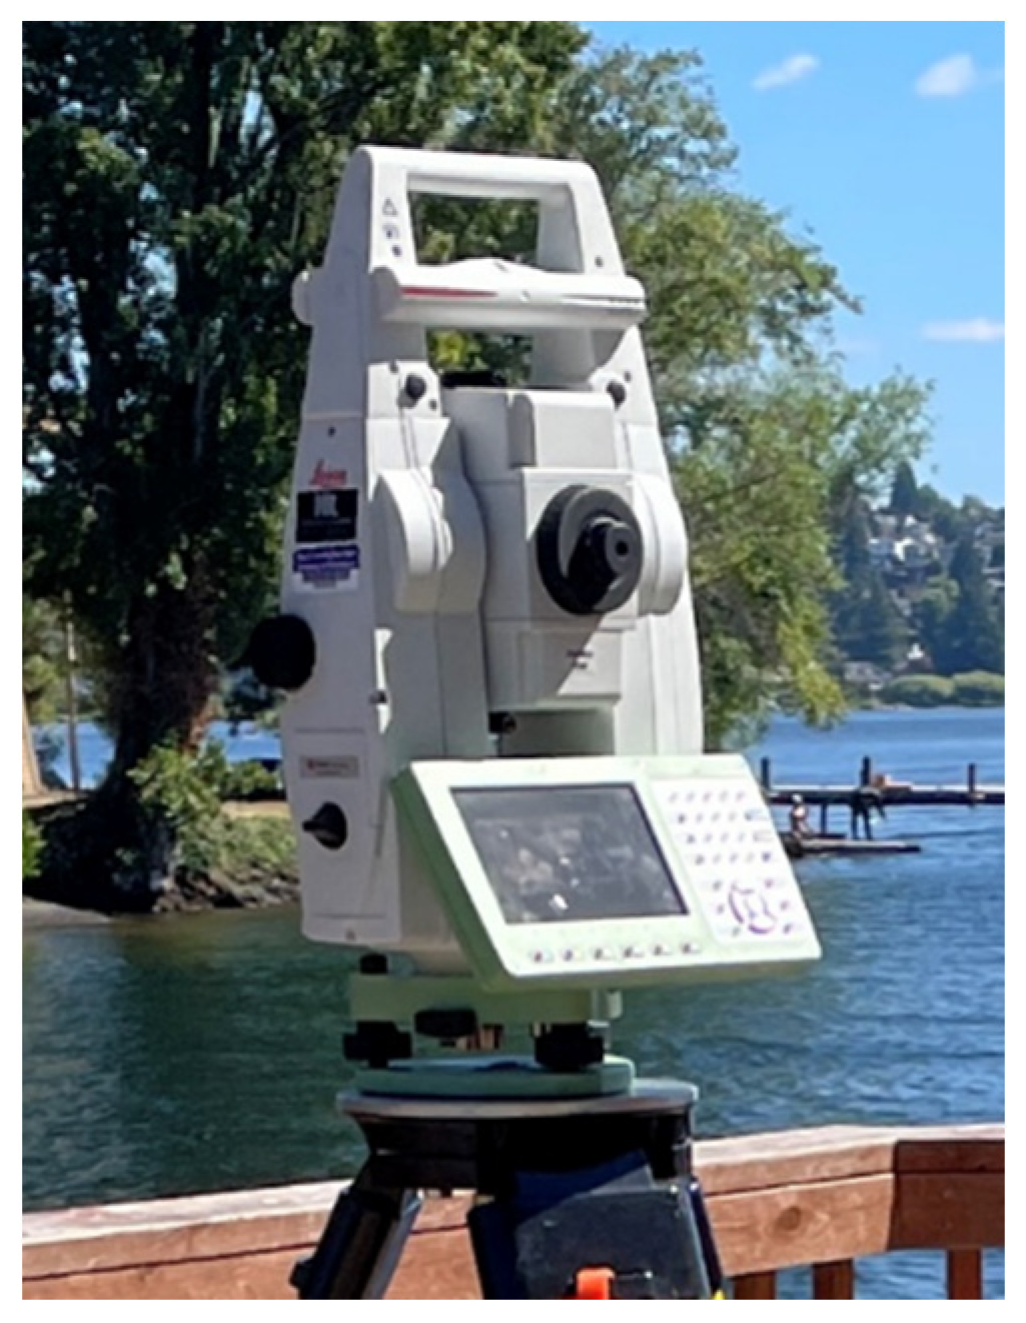
Total stations are instruments that combine the capabilities of theodolites and electronic distance measurement systems to measure angles and distances [33,34]. These devices are used for a variety of applications such as topographic mapping, utility inspections, and manufacturing [35,36,37]. A Leica Nova TS16i Robotic Total Station (Leica, Wetzlar, Germany) was used in this study to collect detailed electronic distance measurements with 1” angular precision and 0.2 cm range accuracy [38]. These provided reliable measurements between on-structure targets, which were used to enhance point cloud registration in Leica Cyclone. Figure 3 is an image of the device onsite, taken during data collection for this study on a clear, sunny day at 21.7 °C with an atmospheric pressure of 1016 hPa.

2.2.3. Global Navigation Satellite System (GNSS) Observation Data

The Global Navigation Satellite System (GNSS) was used to establish survey control in this study using observations from the United States Global Positioning System (GPS) satellite constellation [39]. The continually operating reference station ZSE1 was utilized as a base station to provide accurate corrections for all rover observations. The Novatel WAAS G-II receiver and MPL_WAAS_2225NW antenna that comprise ZSE1 were installed in 2003 and 2007, respectively [40,41]. This system continuously collects GPS observations from atop a steel mast in Seattle, Washington and has been maintained by the Federal Aviation Administration (FAA). Centimeter-level accuracy was expected with corrections provided by ZSE1, given that the rover observations were collected 40.9 km from ZSE1. Positional accuracy declines as the baseline distance between a base station and rover increases at a rate of 0.1 cm accuracy loss per 1 km baseline increase [42]. An approximate 5 cm positional accuracy was anticipated given the baseline distance.
A Leica GS18T GNSS receiver (Leica, Wetzlar, Germany) was used to collect rover observations at all total station locations and TLS locations using the United States’ GPS satellite constellation [43]. GPS corrections from the ZSE1 CORS base station were applied during post-processing using Leica Infinity (Version 4.1.0), a software that enables processing spatial information collected across various types of survey equipment [44]. Control points were processed within the WA N NAD83 (2011) coordinate system using the GRS80 ellipsoid with phase-fixed solutions and precise ephemerides. Orthometric heights were calculated from ellipsoidal heights using the WAGeoid12B model. Reports generated while processing GPS observations indicated an average 3D coordinate quality of approximately 5.1 cm measured with a moderate geometric dilution of precision of 4.5, indicating acceptable satellite coverage. The resulting control points were exported as .csv files and used to establish survey control for TLS ground truth measurements.

2.3. Terrestrial Laser Scanning (TLS) Ground Truth

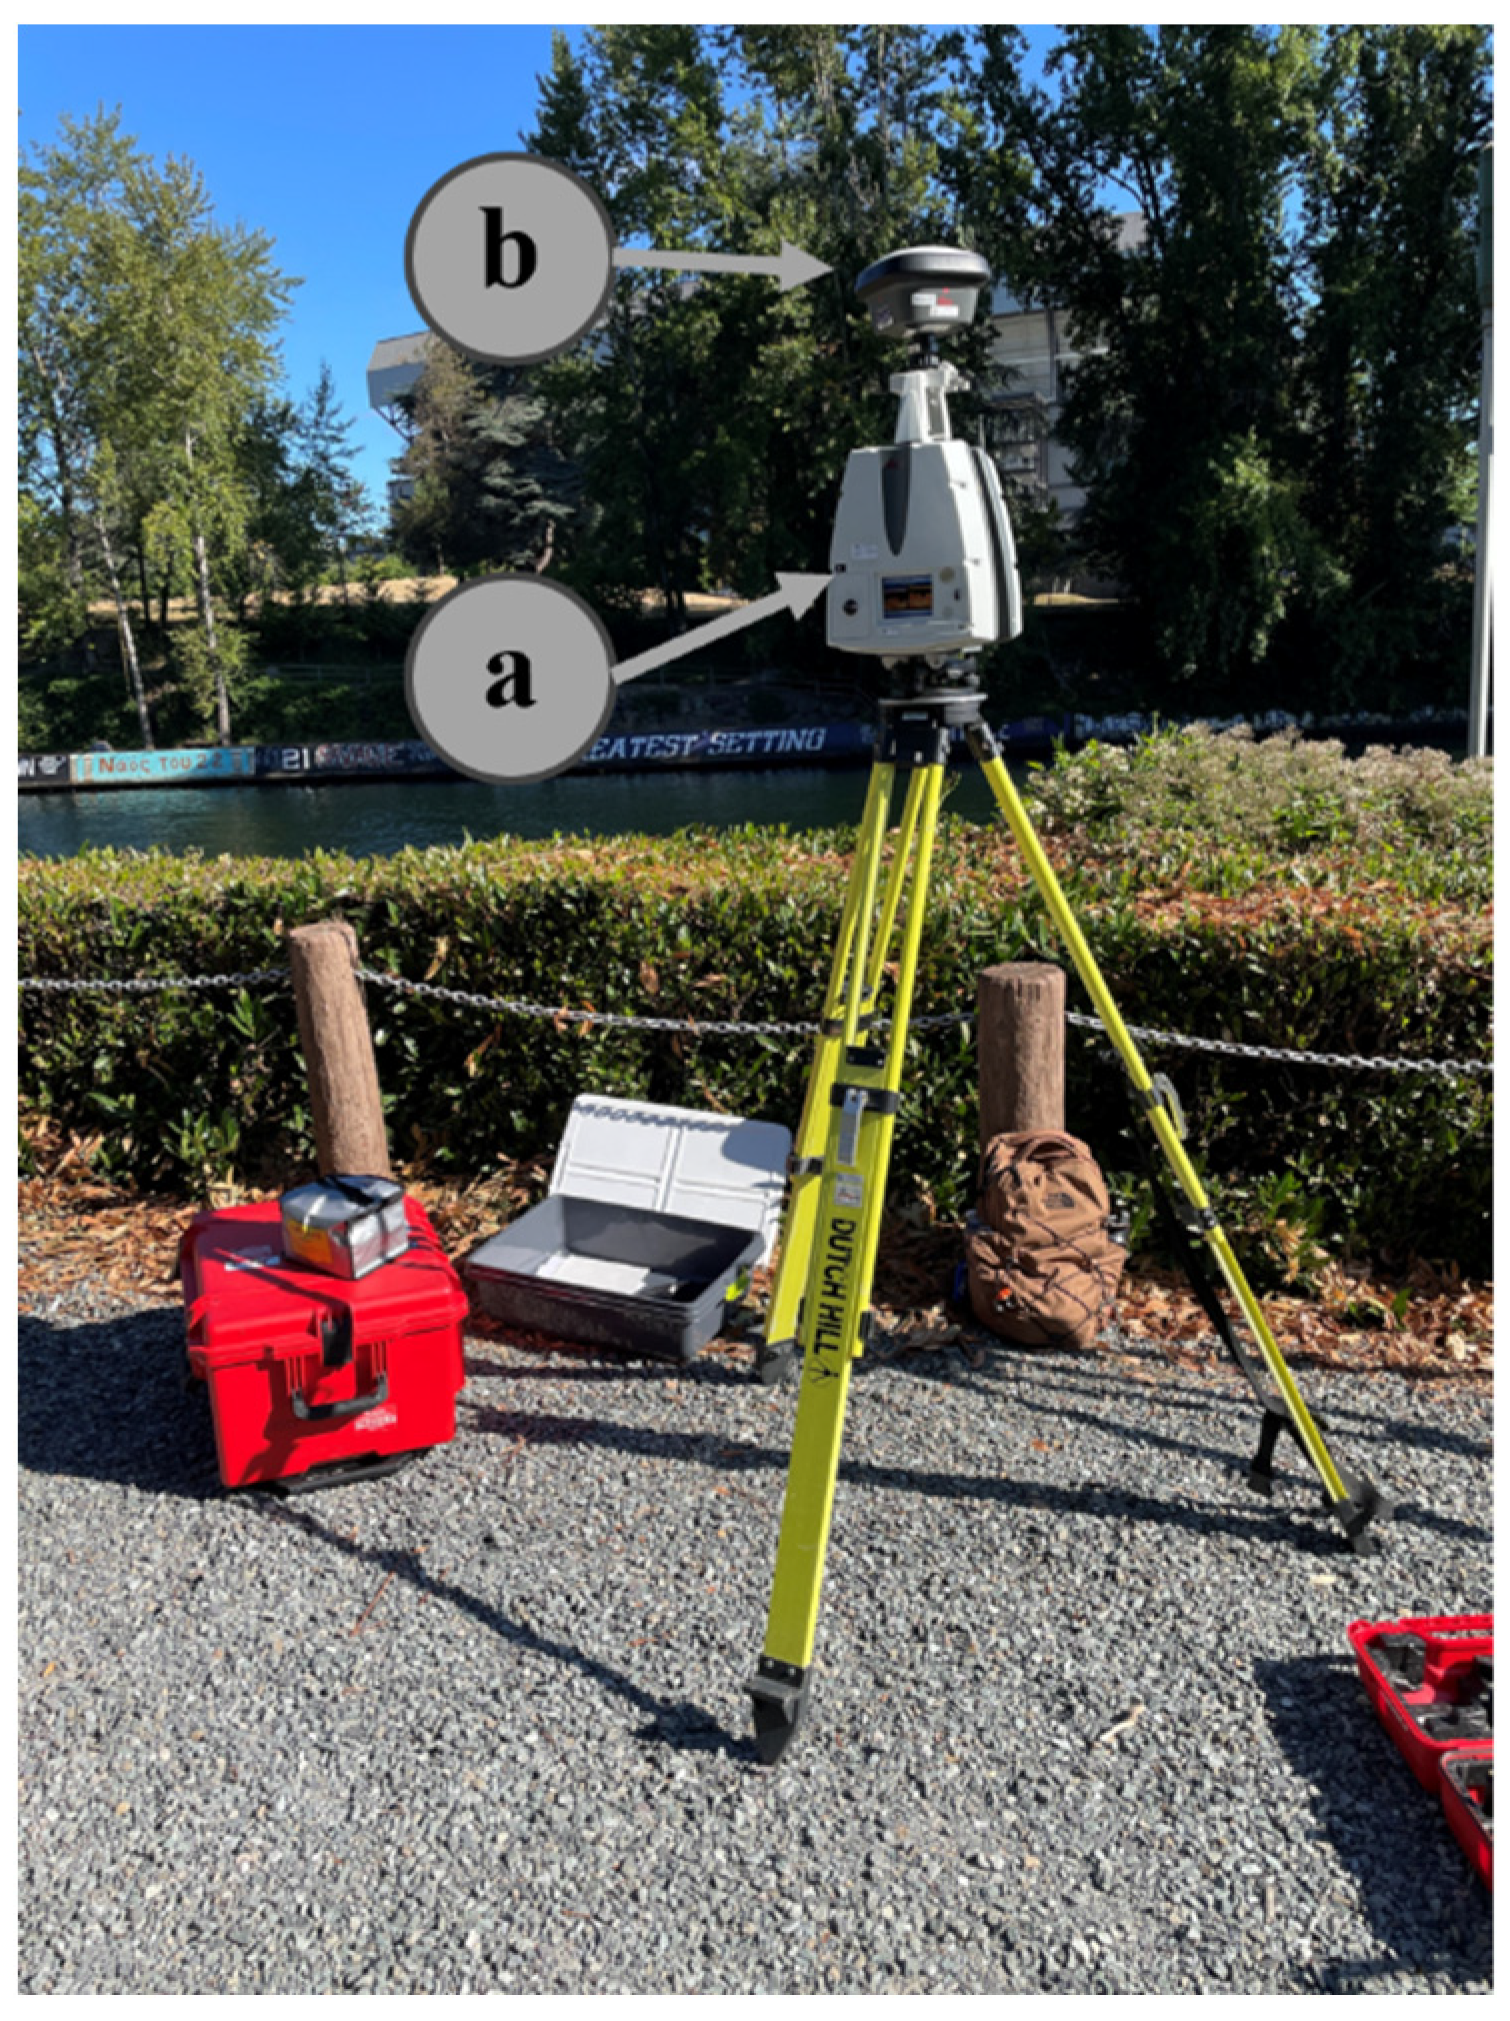
Leica’s ScanStation P50 (Figure 4a, Leica, Wetzlar, Germany) was used in this study to establish ground truth TLS measurements for comparative assessments of alternative imaging methods’ accuracies. The P50 uses a 1550 nm laser and a dual-axis liquid tilt compensation sensor to collect ultra-high speed time of flight range measurements enhanced by WFD [45]. The P50 was set up at two locations within 120 m of the retaining walls to gather baseline ground truth measurements of the site with 0.12 cm accuracy.
Low-density full dome scans captured complete views from each setup which allowed higher density data to be selectively collected. Secondary scans were conducted at each TLS setup that captured only the retaining walls and immediately surrounding areas at the highest possible scan resolution of 0.08 cm at 10 m. Tight access constraints on the site limited the ability to select TLS setups that minimized oblique incidence angles on all walls. Ideally, a TLS scanner should be operated from a vantage point where the subject can be captured with maximum incidence angle of 45 degrees with a standoff distance of 12–15 m [46].
The location of each TLS setup was recorded with GPS observations using a GS18T antenna attached to the top of the P50 (Figure 4b). Data was collected on a sunny afternoon in August in Seattle. Boat and pedestrian traffic were monitored and avoided during the study and did not impact any of the data collected.
Leica Cyclone Core (Version 2023.1.0, Leica, Wetzlar, Germany) was used to register the three independent TLS scans into one continuous point cloud using GPS observations and total station measurements [47]. This combined georeferenced point cloud of all P50 measurements was exported as a .las file and treated as ground truth for the drone-lidar cloud comparisons. The LASer (.las) file format was developed by the American Society for Photogrammetry and Remote Sensing to facilitate the exchange of lidar point cloud data [48].

2.4. Drone-Lidar

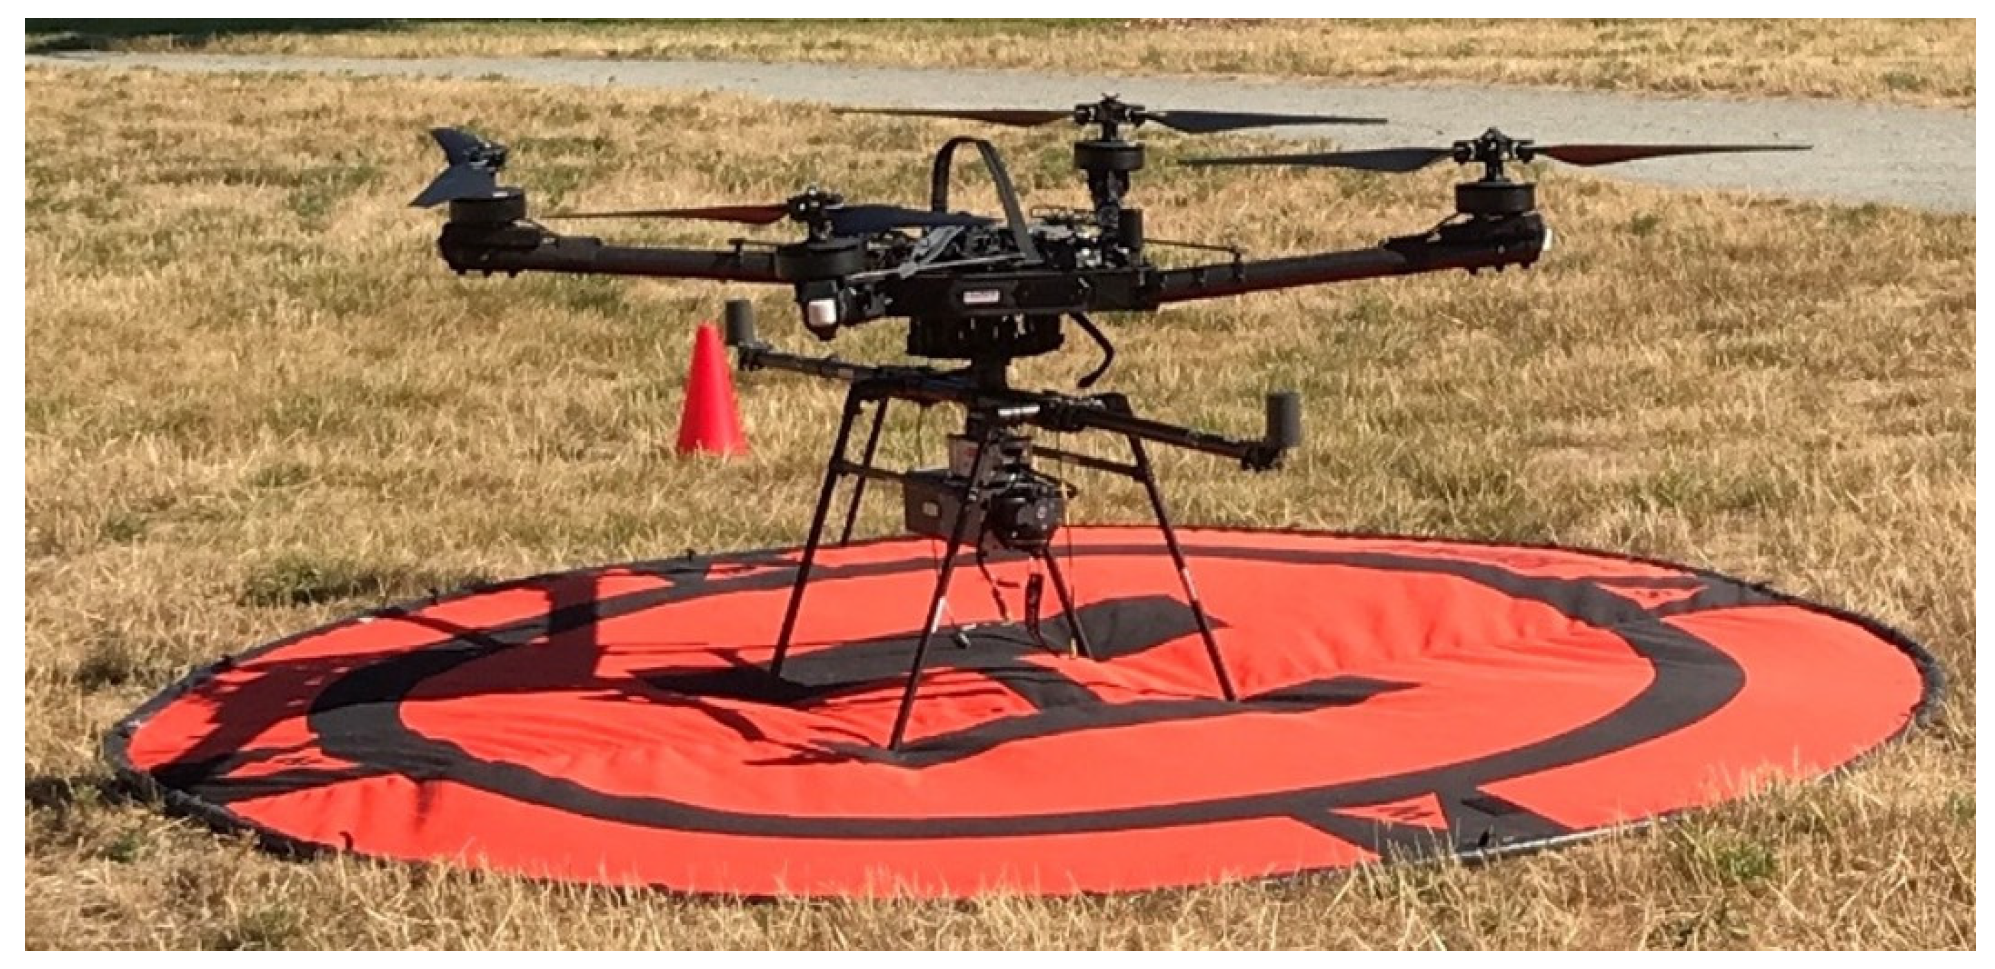
Advances in UAS technology and lidar registration methods have brought mobile platforms for lidar to market. Drone-lidar, operating on the same principles as TLS, offers the advantage of rapid data collection over large areas at the potential cost of reduced accuracy compared to TLS. Phoenix Lidar Systems’ MiniRanger-LITE (MiniRanger, Phoenix Lidar Systems, Austin, TX, USA) was used in this study to collect drone-lidar data (Figure 5). The MiniRanger sensor is resistant to dust and water with an IP64 rating and gathers lidar range measurements using a 905 nm laser with an advertised as 2.0–3.0 cm at 75 m [49]. The MiniRanger was flown by a Freefly Alta X UAS (Freefly Systems, Woodinville, WA, USA) and maintained a positional accuracy of 1.0 cm with on-board real-time kinematic positioning. The MiniRanger can collect 100,000 points per second at a recommended range of 150 m.
Drone-lidar data was collected in this study using the MiniRanger drone-lidar platform. The UAS first flew figure eight patterns as a calibration flight prior to formal data collection. Once calibrated, the UAS was landed and relaunched to execute its preplanned flight mission. The MiniRanger flight was planned using Phoenix FlightPlanner (Version 8.0, Phoenix Lidar Systems, Austin, TX, USA), Phoenix Lidar Systems’ web-based flight planning software [50]. Full details on the drone-lidar mission’s flight characteristics are shared in Table 1. Terrain following was used in this mission to maximize the quality of the drone-lidar data. This caused the variations in survey flight altitude and speed shown in Table 1. The use of a preplanned autonomous flight ensured that the complete study area was captured with a flight pattern optimized for the hardware. Additionally, autonomous flight improved the quality of readings by limiting sharp changes in the UAS’s trajectory that could have introduced additional error to the continuously collected in-flight lidar measurements. Once the UAS completed its flight mission, it landed, and data collection was halted. The drone-lidar scanning mission was captured in parallel to ground truth data collection on a clear and sunny afternoon in August with minimal wind.
Drone-lidar data was processed into functional point clouds through multistep processes specific to the drone-lidar manufacturer’s proprietary software. The first step was to process a trajectory to account for the movement of the MiniRanger while in flight. The process began by applying base station corrections from ZSE1 to the onboard GPS observations. These corrections were automatically applied in conjunction with readings from the MiniRanger’s inertial measurement unit (IMU) to compute a georeferenced flight trajectory in Inertial Explorer (Version 8.90.8520, Novatel, Calgary, AB, Canada), a Novatel software for GNSS and IMU processing. This trajectory was then imported into Spatial Explorer (Version 7.0.9, Phoenix Lidar Systems, Austin, TX, USA) for point cloud processing using Phoenix LiDAR Systems’ proprietary software. The trajectory was then split into processing intervals which excluded portions of the trajectory from further processing that did not contain relevant lidar data (e.g., turns, take-off, landing). The intervals with lidar data from active flight lines were then individually processed and fused using the “Create Cloud” tool to generate the MiniRanger point cloud. A colorized point cloud was finally generated using RGB data in the “CloudColorizer” tool. The drone-lidar cloud was aligned to the TLS ground truth using Leica Cyclone Core. The RMS was 1.68 cm for the registration between the georeferenced MiniRanger and P50 point clouds. This preprocessing workflow followed the process recommended to users of Inertial Explorer and Spatial Explorer [51,52,53]. These point clouds were exported as .las files for analysis in this study.

2.5. Post Processing

In this section, point cloud trimming, fine registration, and cloud-to-cloud comparisons will be discussed. These post-processing tasks were completed in CloudCompare (Version 2.13.2), a free and open-source software designed to view and edit point clouds [54]. CloudCompare was chosen for this task as it is an effective platform for comparing 3D models of large structures [55]. This software was used to trim, filter, align, and analyze point clouds from TLS and drone-lidar scans that had been preprocessed in their respective software. The specific post-processing steps conducted in CloudCompare are described in the sections below.

2.5.1. Point Cloud Trimming

Each imaging method produced a singular point cloud that encompassed the entire study site and contained all three subject walls. These point clouds were first manually segmented to separate the three walls and trimmed of unnecessary data. The CANUPO plugin was then used to further isolate the structures with vegetation filtering. CANUPO is a point cloud classification plugin that differentiates between different surface types driven by multi-scale dimensionality analysis based on manually selected sample segmentations [56,57]. The otira_vegetsemi classifier, trained to segment partial vegetation by Brodu and Lague, was used in this study and is publicly available [56,58]. This classifier was optimized for the classification of vegetation in natural landscapes, calculating 2 dimensionality features over 22 different scales spanning from 1 cm to 1 m. Complete point clouds were treated as core points during each classification run rather than the default selection of subsampled core points to maximize classification detail.

2.5.2. Fine Registration

Sections of the Miniranger point cloud containing each retaining wall were supplementally aligned to the P50 reference clouds after each cloud was trimmed and filtered using CloudCompare’s Fine-Registration tool. This tool uses an ICP algorithm to align two similar point clouds by selecting core points from the reference cloud and matching them to corresponding points in the aligned cloud [59,60]. This step was only performed in a secondary round of analysis designed to mitigate global error introduced by imperfect GPS solutions.

2.5.3. Point Distribution Analyses

The distribution of points in each TLS and drone-lidar cloud were assessed using the “Compute Geometric Attributes” toolbox within CloudCompare [61]. This tool generated scalar fields of local point density by counting the discrete number of neighboring points within a spherical radius of each point. A radius of 25 cm was used in this study to enable comparisons between point clouds with different densities. Smaller radii tested were insufficient on sparse data sets. These scalar fields can be used to observe variations in point density across a point cloud. These variations can expose inconsistencies within an imaging method important to consider when inspecting transportation assets such as retaining walls. A prior study examining metrics for point cloud data quality pointed out the importance of considering data uniformity to predict challenges with post processing steps such as surface reconstruction or point cloud simplification [19].

2.5.4. Cloud-to-Cloud Comparisons

The accuracy results discussed in the following sections of this article were created in CloudCompare with cloud-to-cloud (C2C) comparisons. C2C comparisons append an absolute distance to each point within a “reference cloud” that represents the distance between that point and the nearest neighboring point in the “compared cloud”. CloudCompare calculates the unsigned nearest neighbor distances using a Hausdorff-based distance algorithm [62]. This process yields a scalar field that enables full field analysis of the discrepancies between two point clouds. Point clouds generated using the TLS (P50) were treated as the “reference clouds” while point clouds generated with the drone-lidar (MiniRanger) served as “compared clouds” when performing C2C analyses in this study.

2.5.5. Vegetation Correlation Analysis

Correlations between vegetation prevalence and the accuracy of drone-lidar measurements were quantified in this study using C2C comparisons. Point clouds containing vegetation regions were first manually segmented from portions of the original MiniRanger cloud surrounding each retaining wall. The vegetation was then extracted from each of these manually segmented point clouds using the otira_vegetsemi classifier from Brodu and Lague in CloudCompare’s CANUPO plugin [56,58]. These vegetation clouds were then further segmented to isolate surface-level vegetation from vegetation in the surrounding tree canopies. This produced two point clouds per retaining wall, each containing either surface-level vegetation occluding the wall’s surface or overhead vegetation in adjacent tree canopies.
The proximity of drone-lidar measurements on each wall’s surface to vegetation was then measured using C2C comparisons. These C2C comparisons used vegetation clouds as the “reference clouds” and finely registered and trimmed clouds of retaining wall surfaces as the “aligned clouds”. C2C distances in these comparisons represent the proximity of each MiniRanger measurement on the retaining wall’s surface to vegetation. The coverage of each retaining wall by either surface-level vegetation or the tree canopy was approximated by the mean of these C2C distances between vegetation and surface measurements. Correlations were calculated comparing the RMSE between finely registered TLS and drone-lidar measurements on each wall and the corresponding approximated surface-level and canopy vegetation coverage. The results of these correlations are reported as r-values. R-values with magnitudes below 0.4 indicate weak correlations and above 0.6 indicate strong correlations. Negative correlations were expected in both cases and would suggest that increased vegetation coverage decreases drone-lidar measurement accuracy.

3. Results

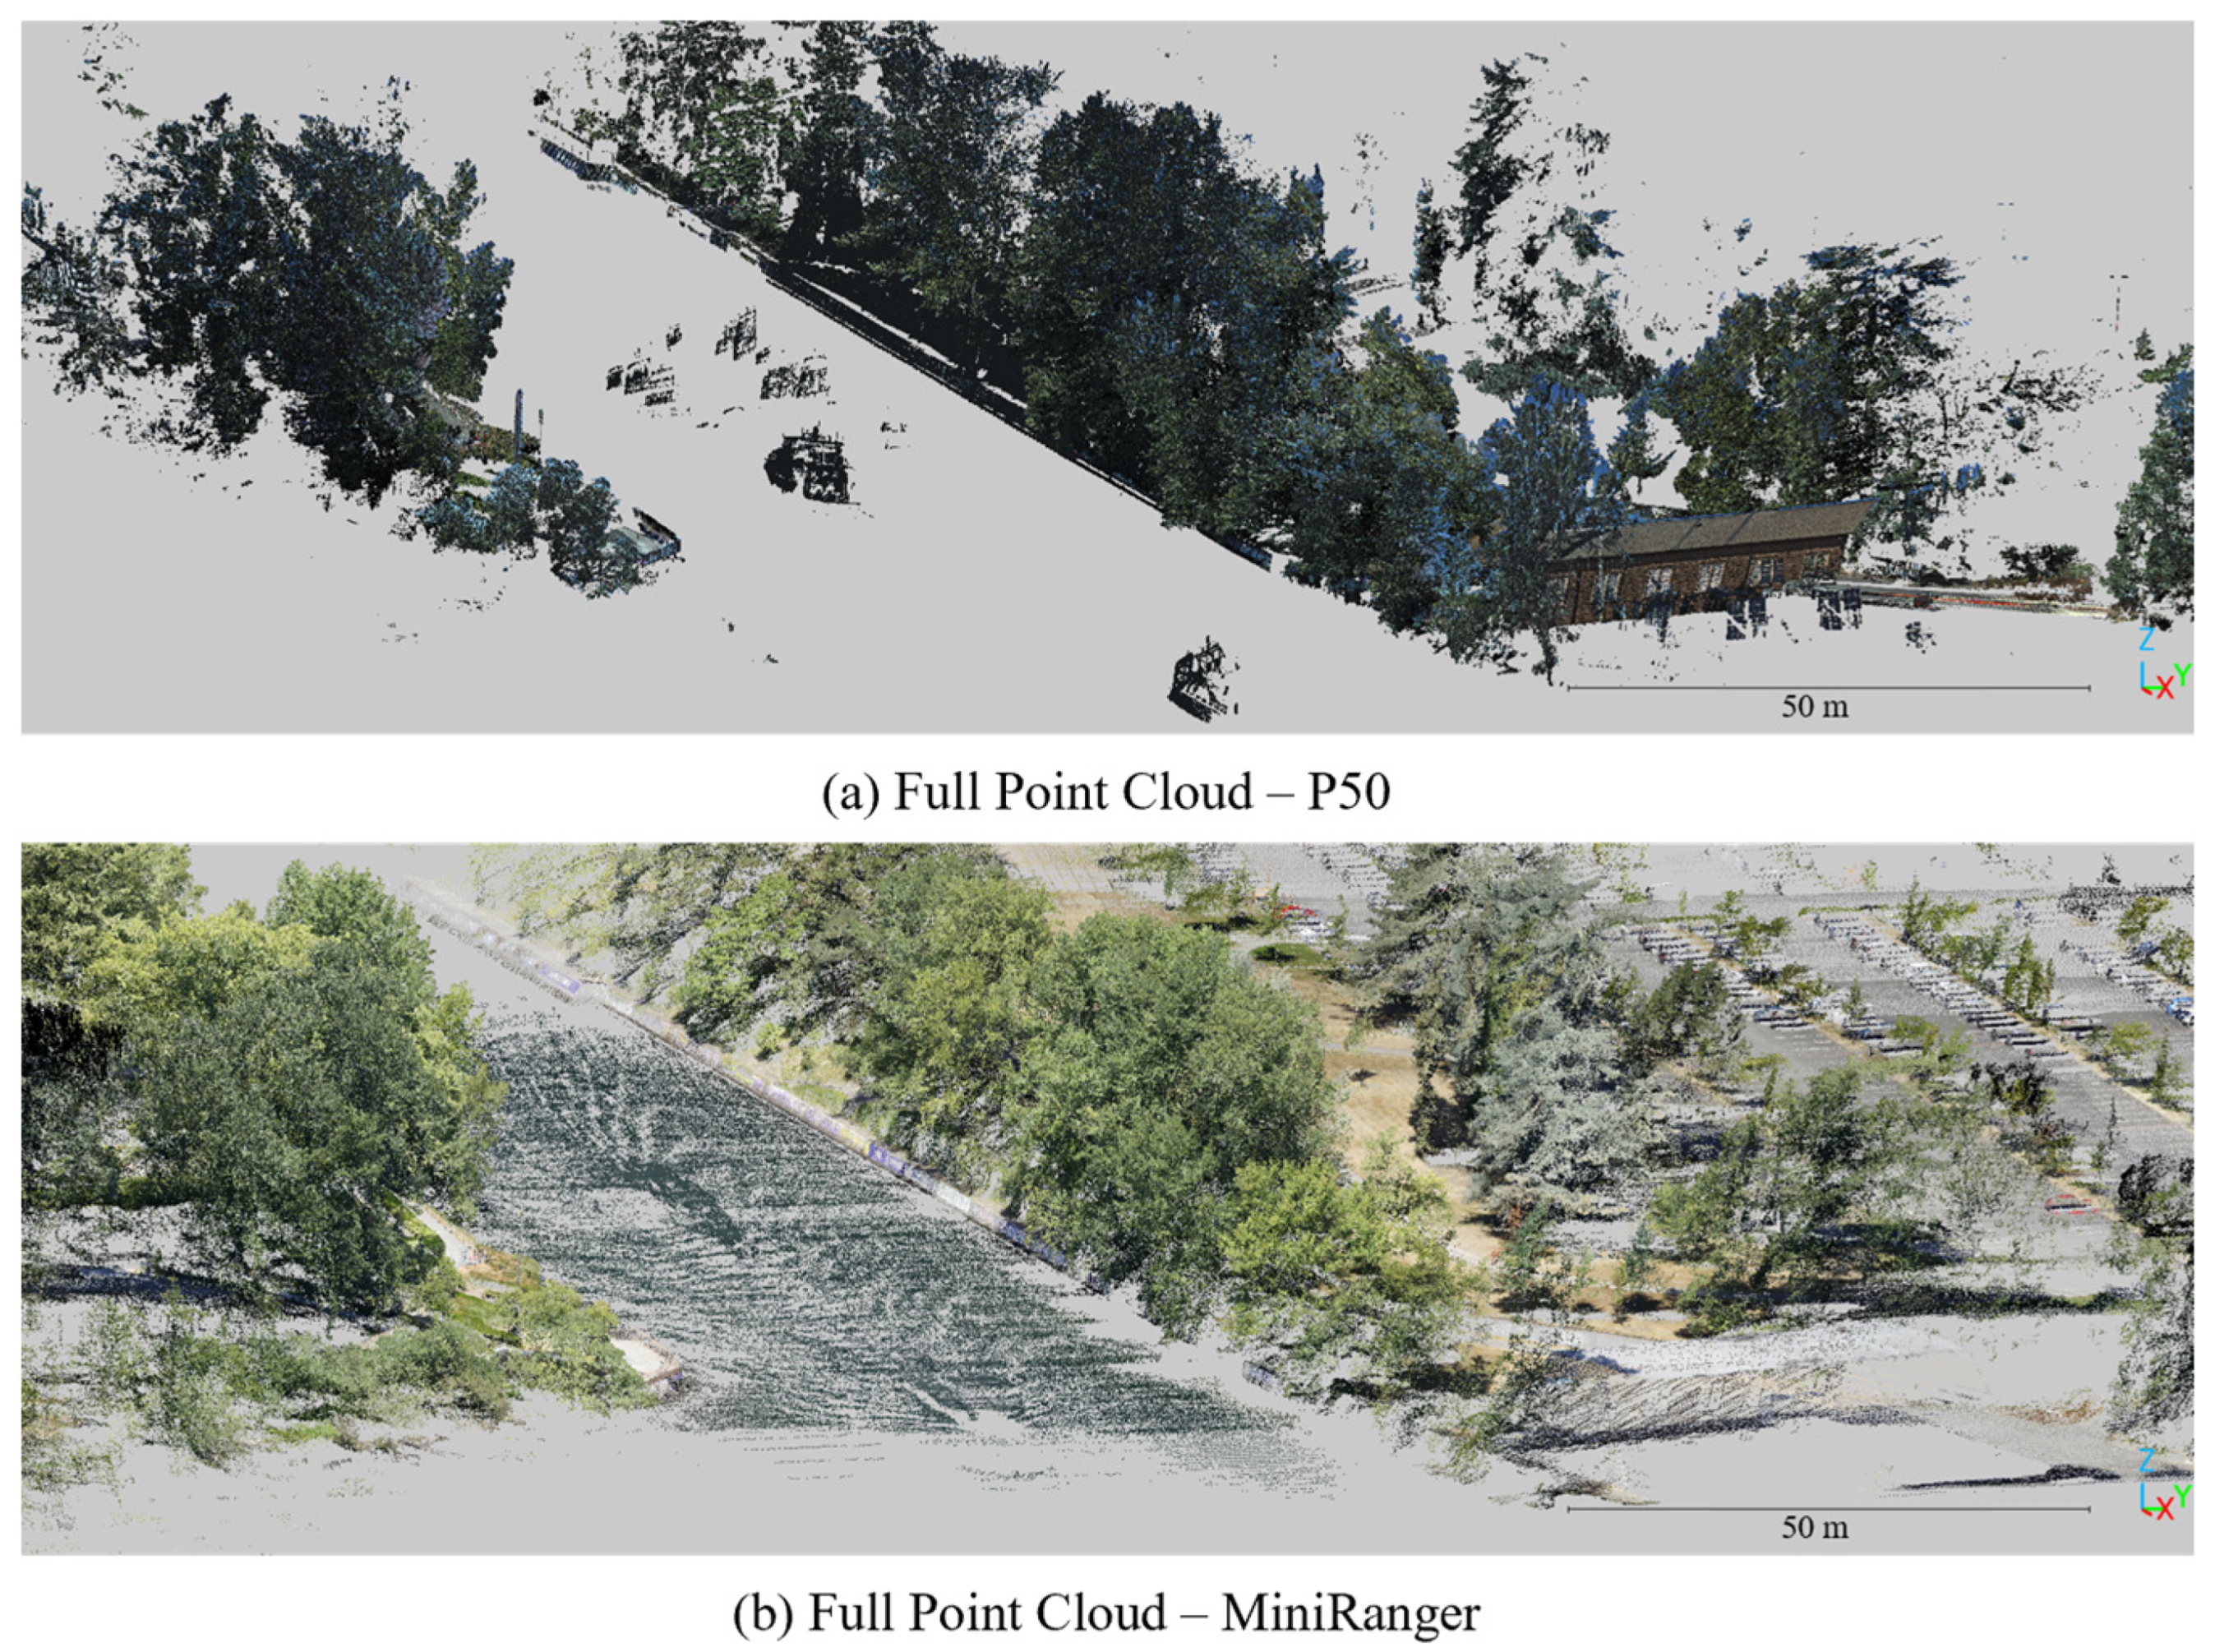
This section shares the results of this study which compared the efficacy of drone and terrestrial lidar scanning for 3D imaging inspections of retaining walls. Views of each point cloud can be found in Figure 6. Initially, comparisons of data density and coverage between the P50 and MiniRanger are presented. These comparisons provide an overview of the practical implementation of each imaging method by illustrating the amount of data that can be acquired. C2C comparisons are then shared to provide quantitative analysis on the accuracy of the drone-lidar. Conclusions are drawn on both the global and local accuracy of the data through assessments of georeferenced and finely registered C2Cs, respectively.

3.1. Point Cloud Density

There was a significant difference in the density of data between the tested imaging methods. Figure 7 is a collection of screenshots from the P50 and MiniRanger point clouds of Wall A that showcases the disparity in data density between the two clouds. The close views of the point clouds in Figure 7a,b cover 0.5 m × 0.5 m sections and are displayed in front of high contrast backgrounds to enhance the visibility of the sparse data in Figure 7b. The MiniRanger data was measured at 40 pts/m2. This trend was consistent with the advertised point density of the MiniRanger system, 31 pts/m2 at a speed of 5 m/s and range of 100 m from the target [49]. The density of the P50 ground truth TLS data was higher than the drone-lidar clouds at approximately 125,000 pts/m2. It was expected that TLS data would be denser than drone-lidar data in this study given that point density decreases as the distance between a surface and a lidar scanner increases. The high-density TLS data maximized the quality of the ground truth for this study. However, high density is not always required for effective retaining wall monitoring as low-density clouds can potentially detect global shifts in geometry indicative of bulging or leaning [63]. The differences between data density observed in this study should be considered when assessing goals for retaining wall imaging programs.

3.2. Data Coverage

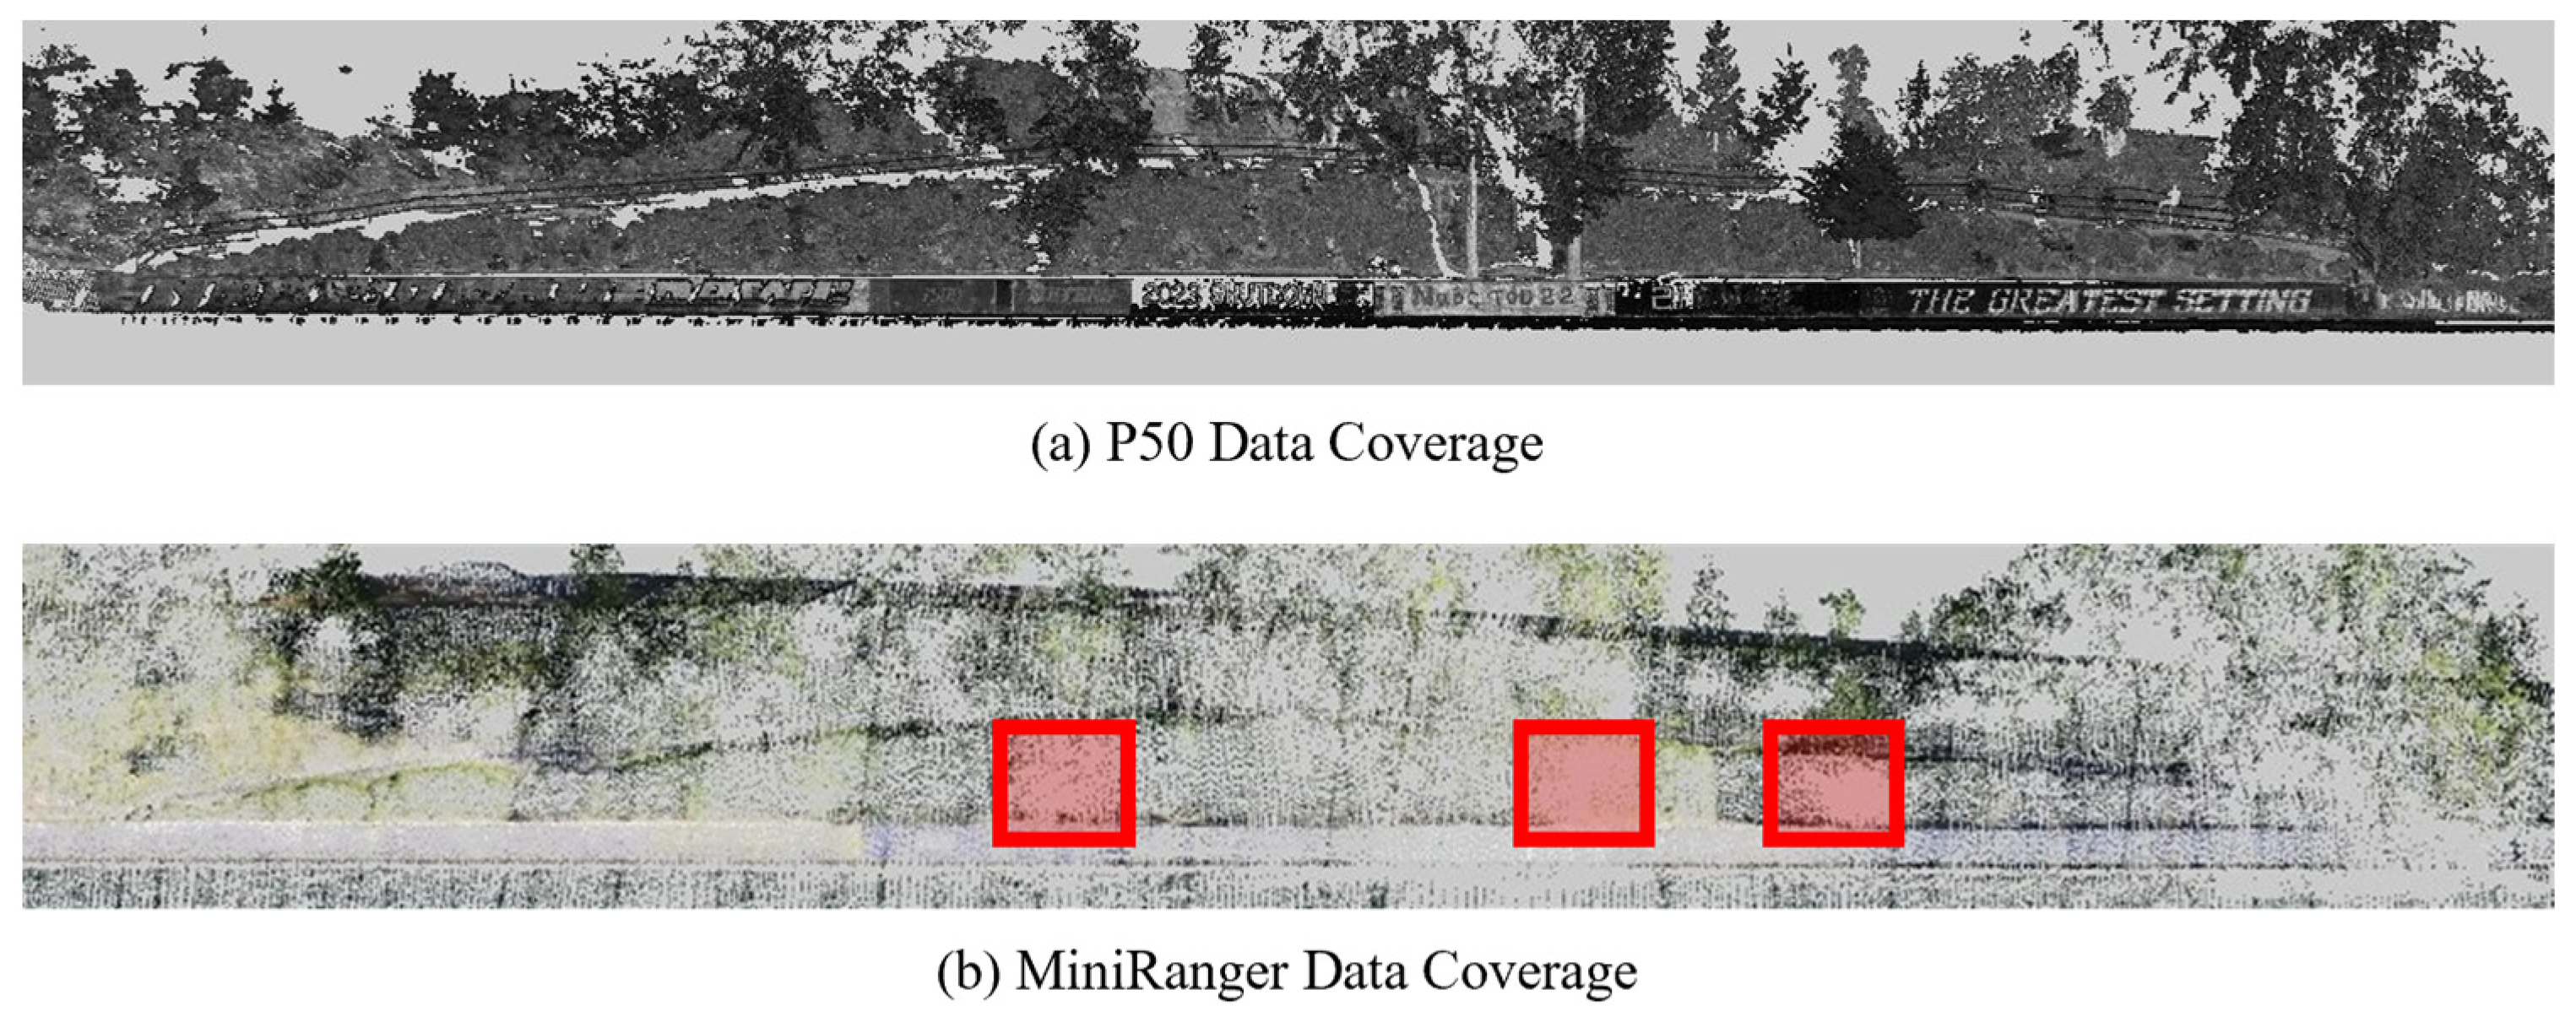
The condition and location of Wall B presented many challenges for comprehensive data collection. Figure 8 is a collection of screenshots of point clouds at Wall B. Wall B was selected to showcase the impacts of vegetation in this study given that the dense vegetation on this site created many gaps in data on the wall’s surface. Figure 8a shows that the P50 effectively captured the entirety of Wall B in the ground truth measurements, providing context for the gaps shown in red in the rest of the figure. Figure 8b shows that the MiniRanger platform captured data on the entirety of Wall B with gaps on the wall’s surface highlighted in red. These gaps resulted from dense portions of the tree canopy affecting lidar quality. The challenges in comprehensive data collection and the resulting measurement gaps offer valuable insights into the practical implementation of these imaging tools.

3.3. Point Distribution

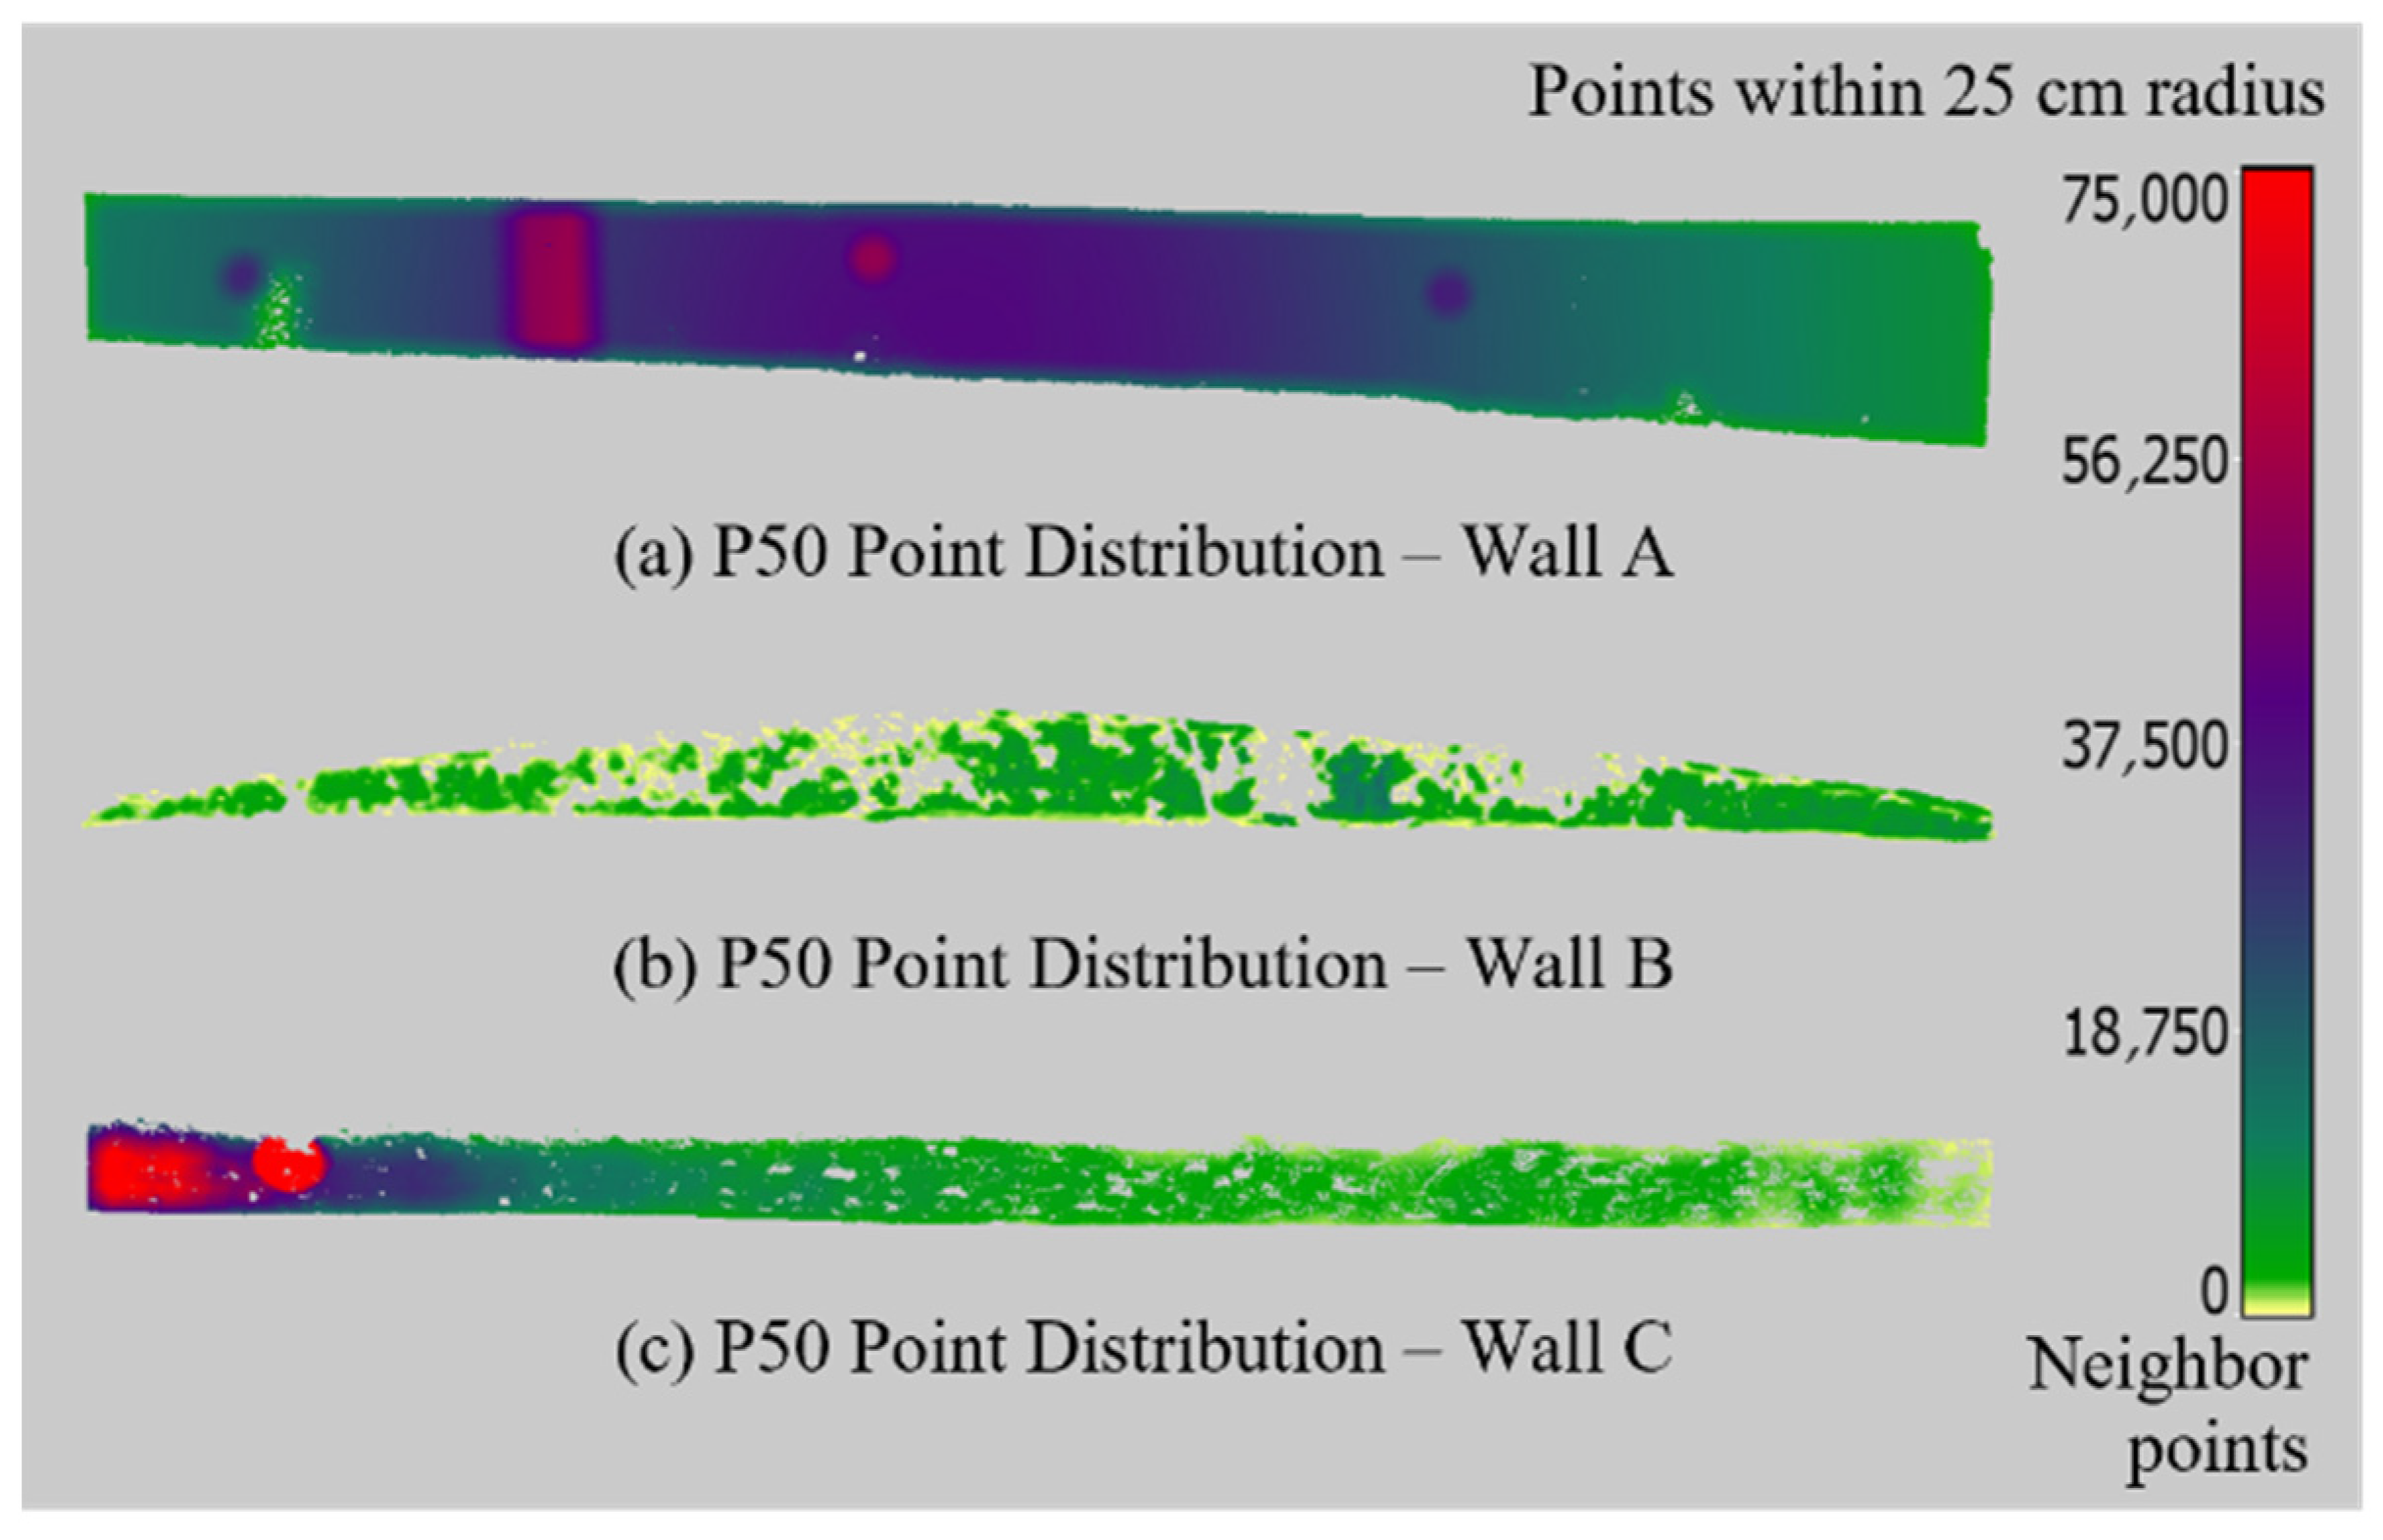
Figure 9 shows the distribution of data in all P50 point clouds generated in this study. TLS scanners, such as the P50, collect data radially which leads to a decrease in point density with increasing range from the scanning unit. This anticipated radial distribution of data is evident in Figure 9a,c. The sharp decline in point density seen in Figure 9c when moving left to right along Wall C can also be attributed to a rapid increase in incidence angle. The southern P50 setup was positioned close to the left edge of Wall C. The quality of data was expected to drop as individual lidar points were captured at increasing oblique angles when approaching the right end of Wall C. Pockets of increased density can also be observed in Figure 9a,c. These areas contained on-structure targets and were manually captured at higher density to improve the alignment of individual scans. The data on Wall B shown in Figure 9b is less dense than data from Walls A and C. Access constraints at Wall B meant that TLS data was captured approximately 70 m from the surface whereas TLS data was captured within 15 m of Walls A and C.
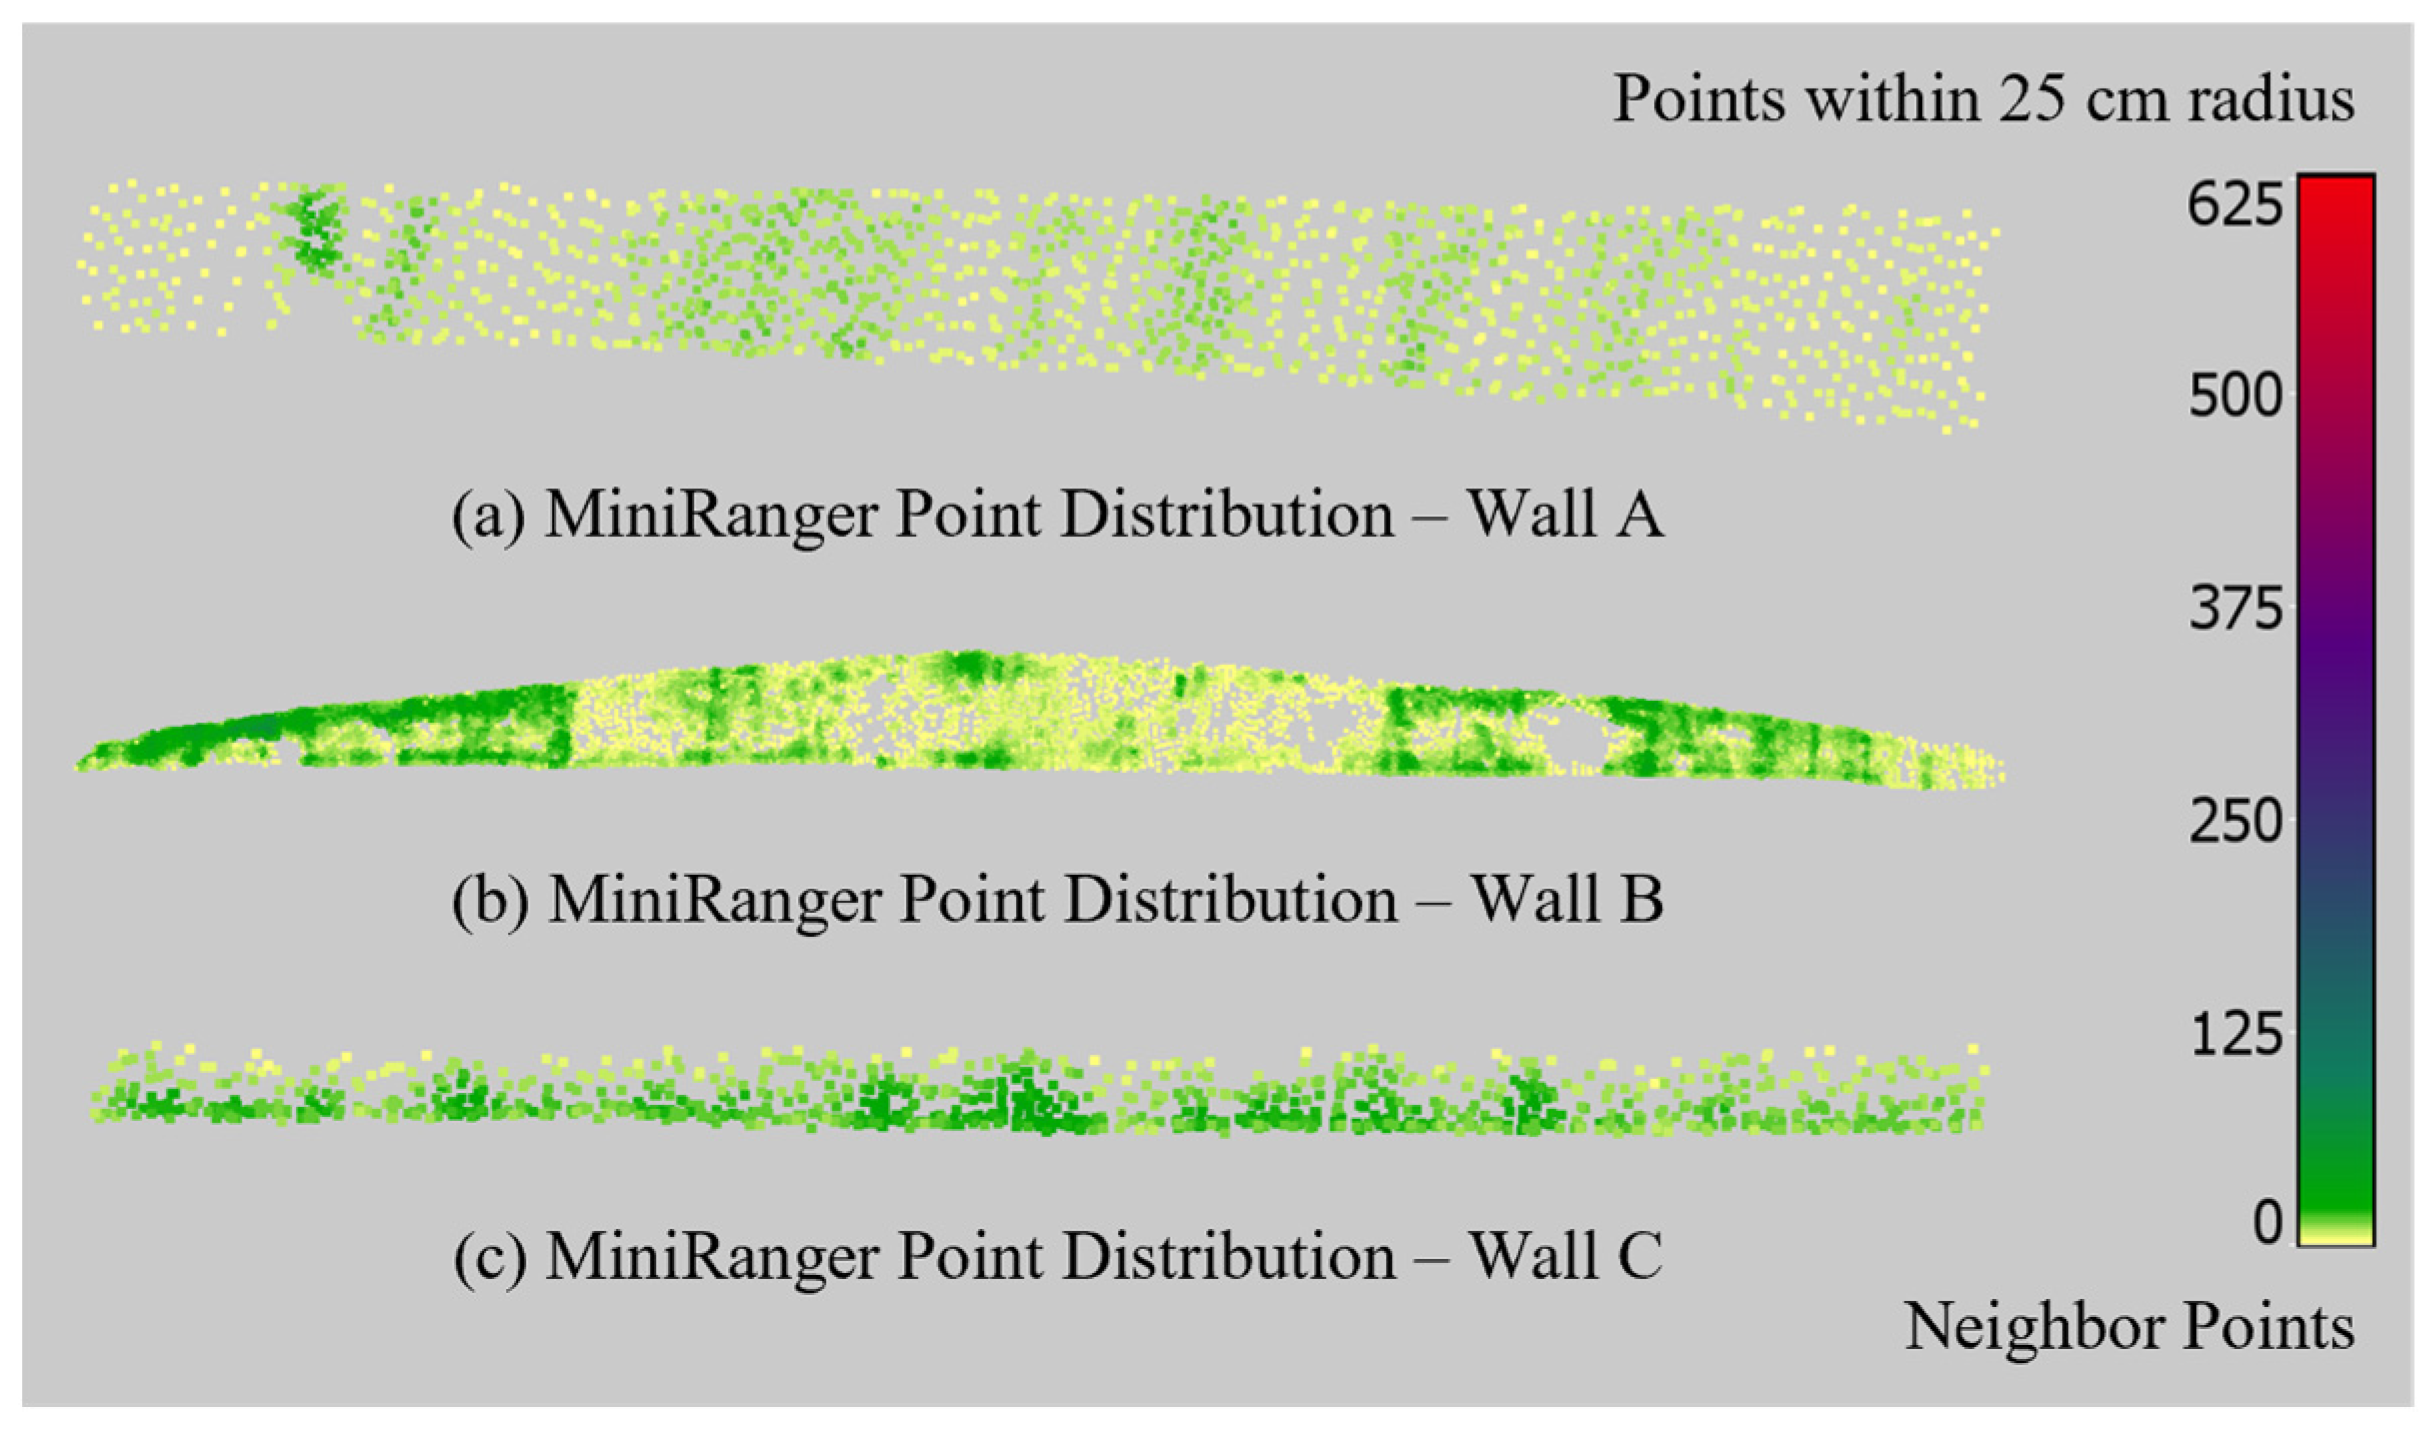
Figure 10 shares the results from the point distribution analyses conducted on all drone-lidar clouds collected in this study. As discussed above, the drone-lidar data is less dense than corresponding TLS ground truth clouds on each site. The distribution of the drone-lidar data is more consistent than observed in the TLS point clouds. This is because drone-lidar data is collected continuously throughout the drone’s flight opposed to being collected in a single location with TLS. The impact of vegetation on measurements of Wall B is clear in Figure 10b. Decreased point density is observed in the areas surrounding the complete gaps of data highlighted in Figure 8. This suggests that the quality of measurements collected around vegetation is impacted even when lidar returns are successfully registered. This is also shown by the decrease in point density along the top of Wall C in Figure 10c. This was the result of shrubbery along the top of Wall C that partially occluded the top edge of the wall. This highlights the uncertainty in lidar performance around vegetation and underscores the need to consider vegetation density in drone-lidar inspections carefully.

3.4. Georeferenced C2C Comparisons

This section contains the results of C2C comparisons conducted in this study between the drone-lidar data from the MiniRanger and the P50 ground truth measurements. Point cloud alignment was established during initial processing when the MiniRanger cloud was georeferenced and aligned with the P50 ground truth. These C2Cs conducted on georeferenced models are ideal for tracking large global movements in a retaining wall, such as leaning. Their ability to detect local changes is heavily dependent on the quality of the georeferencing.
Figure 11 displays the scalar fields for C2C comparisons of the georeferenced MiniRanger point cloud against the P50 at Wall A. The scalar fields can be viewed as spatial distributions of absolute error as they show the differences between point clouds from each imaging method and the ground truth P50 scan at every point.
Figure 11 shows broad trends in error across the entire surface of Wall A. This observation was best evidenced by the steady increase in absolute error when moving left to right along the span in the MiniRanger data (Figure 11). This trend indicates that error was caused by misaligned point clouds rather faulty relative measurements, which would have manifested as locally high pockets of error.
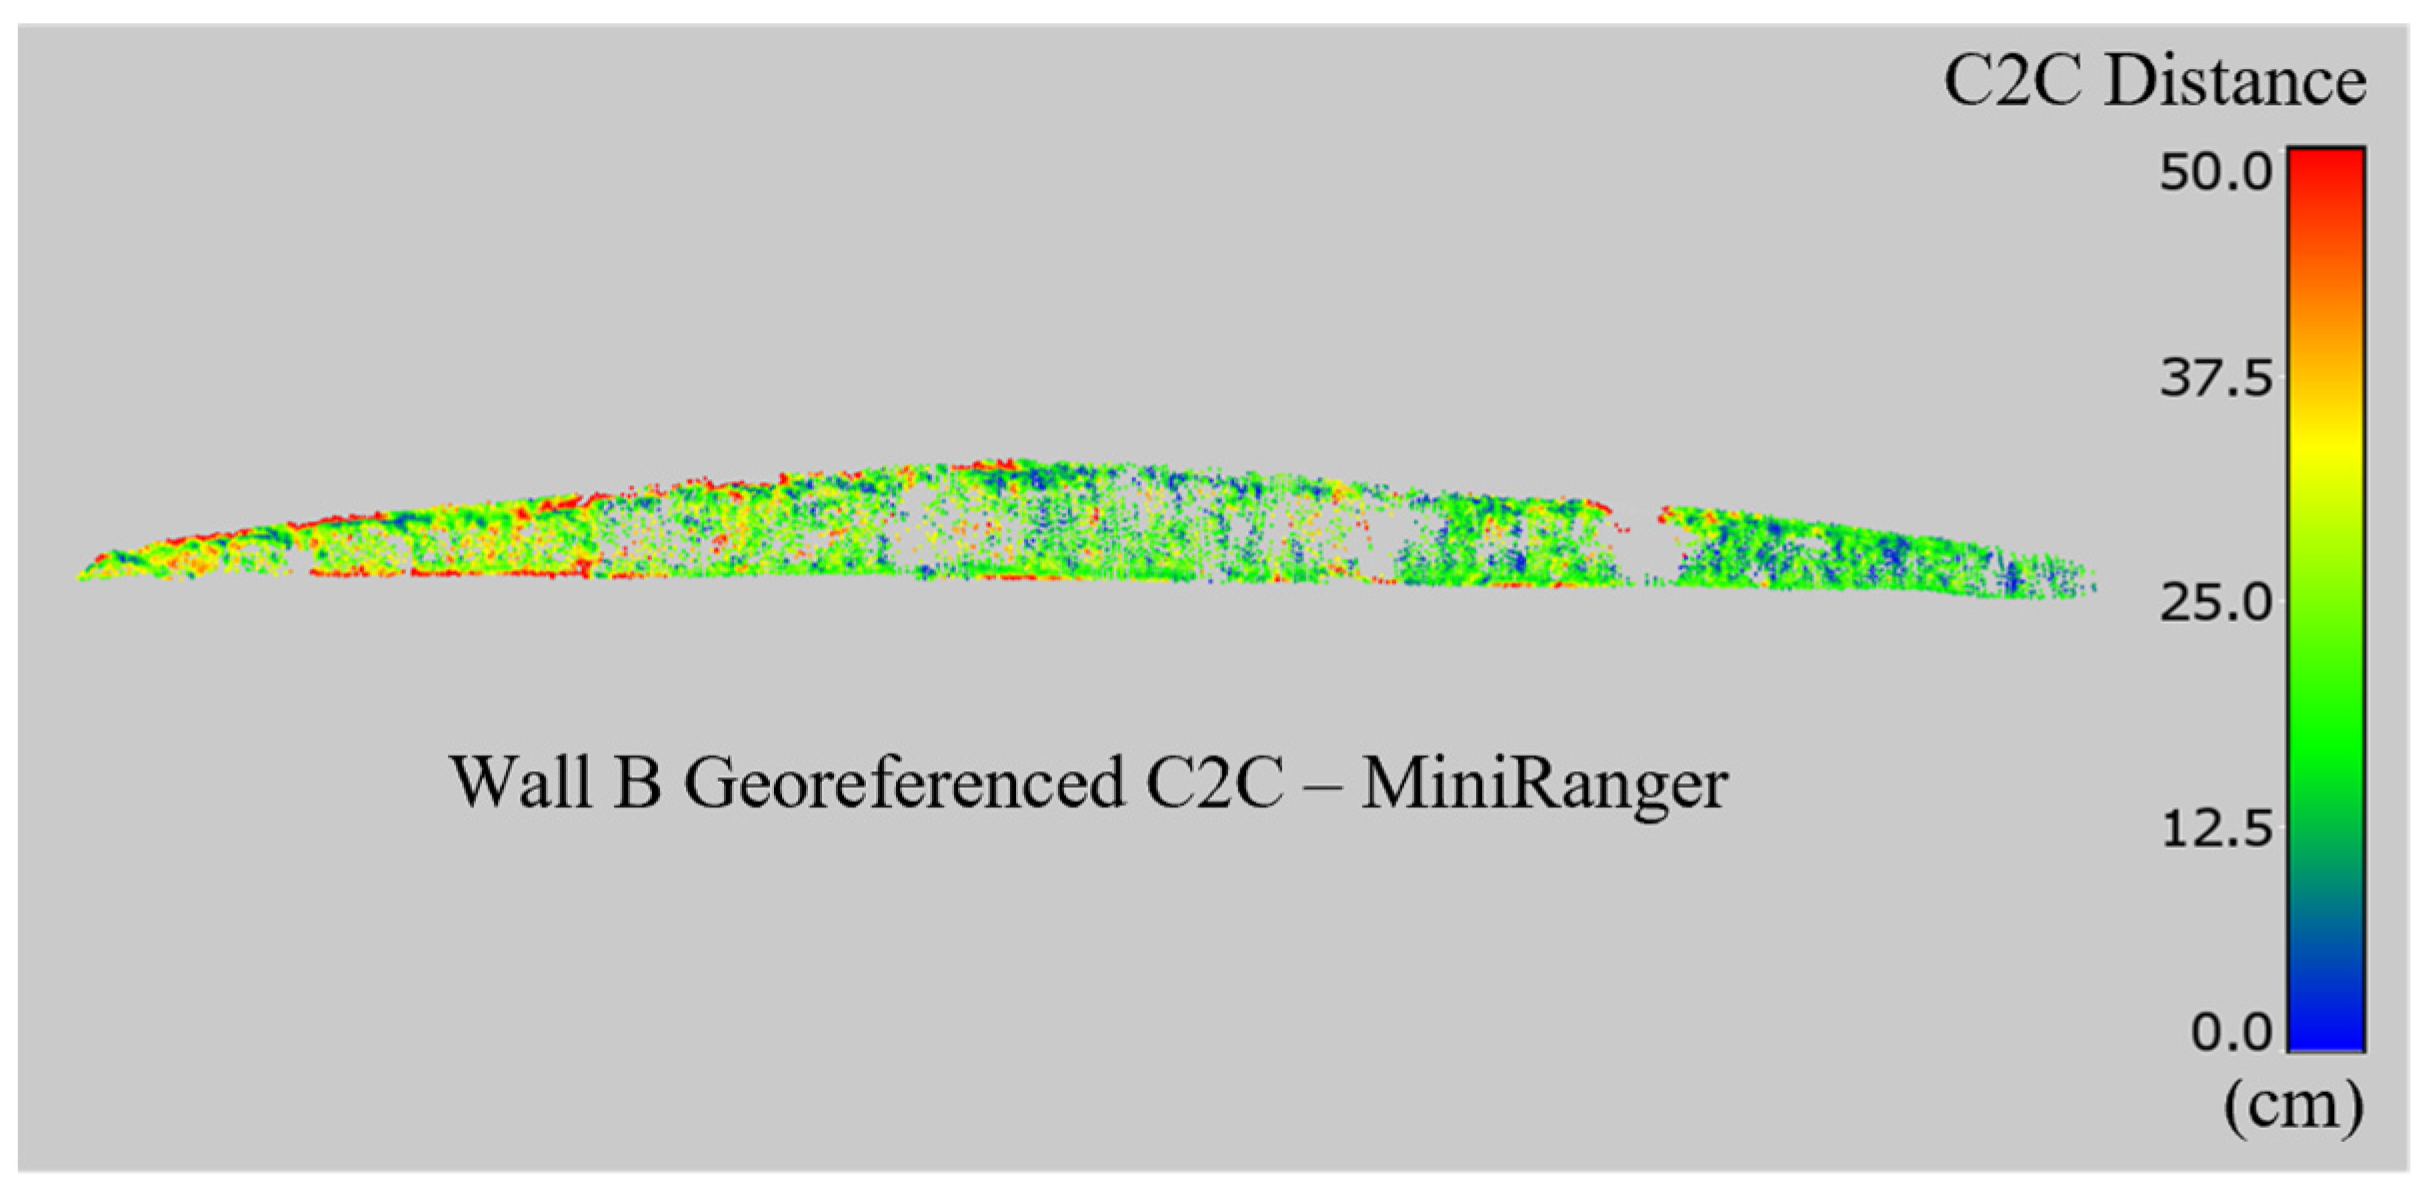
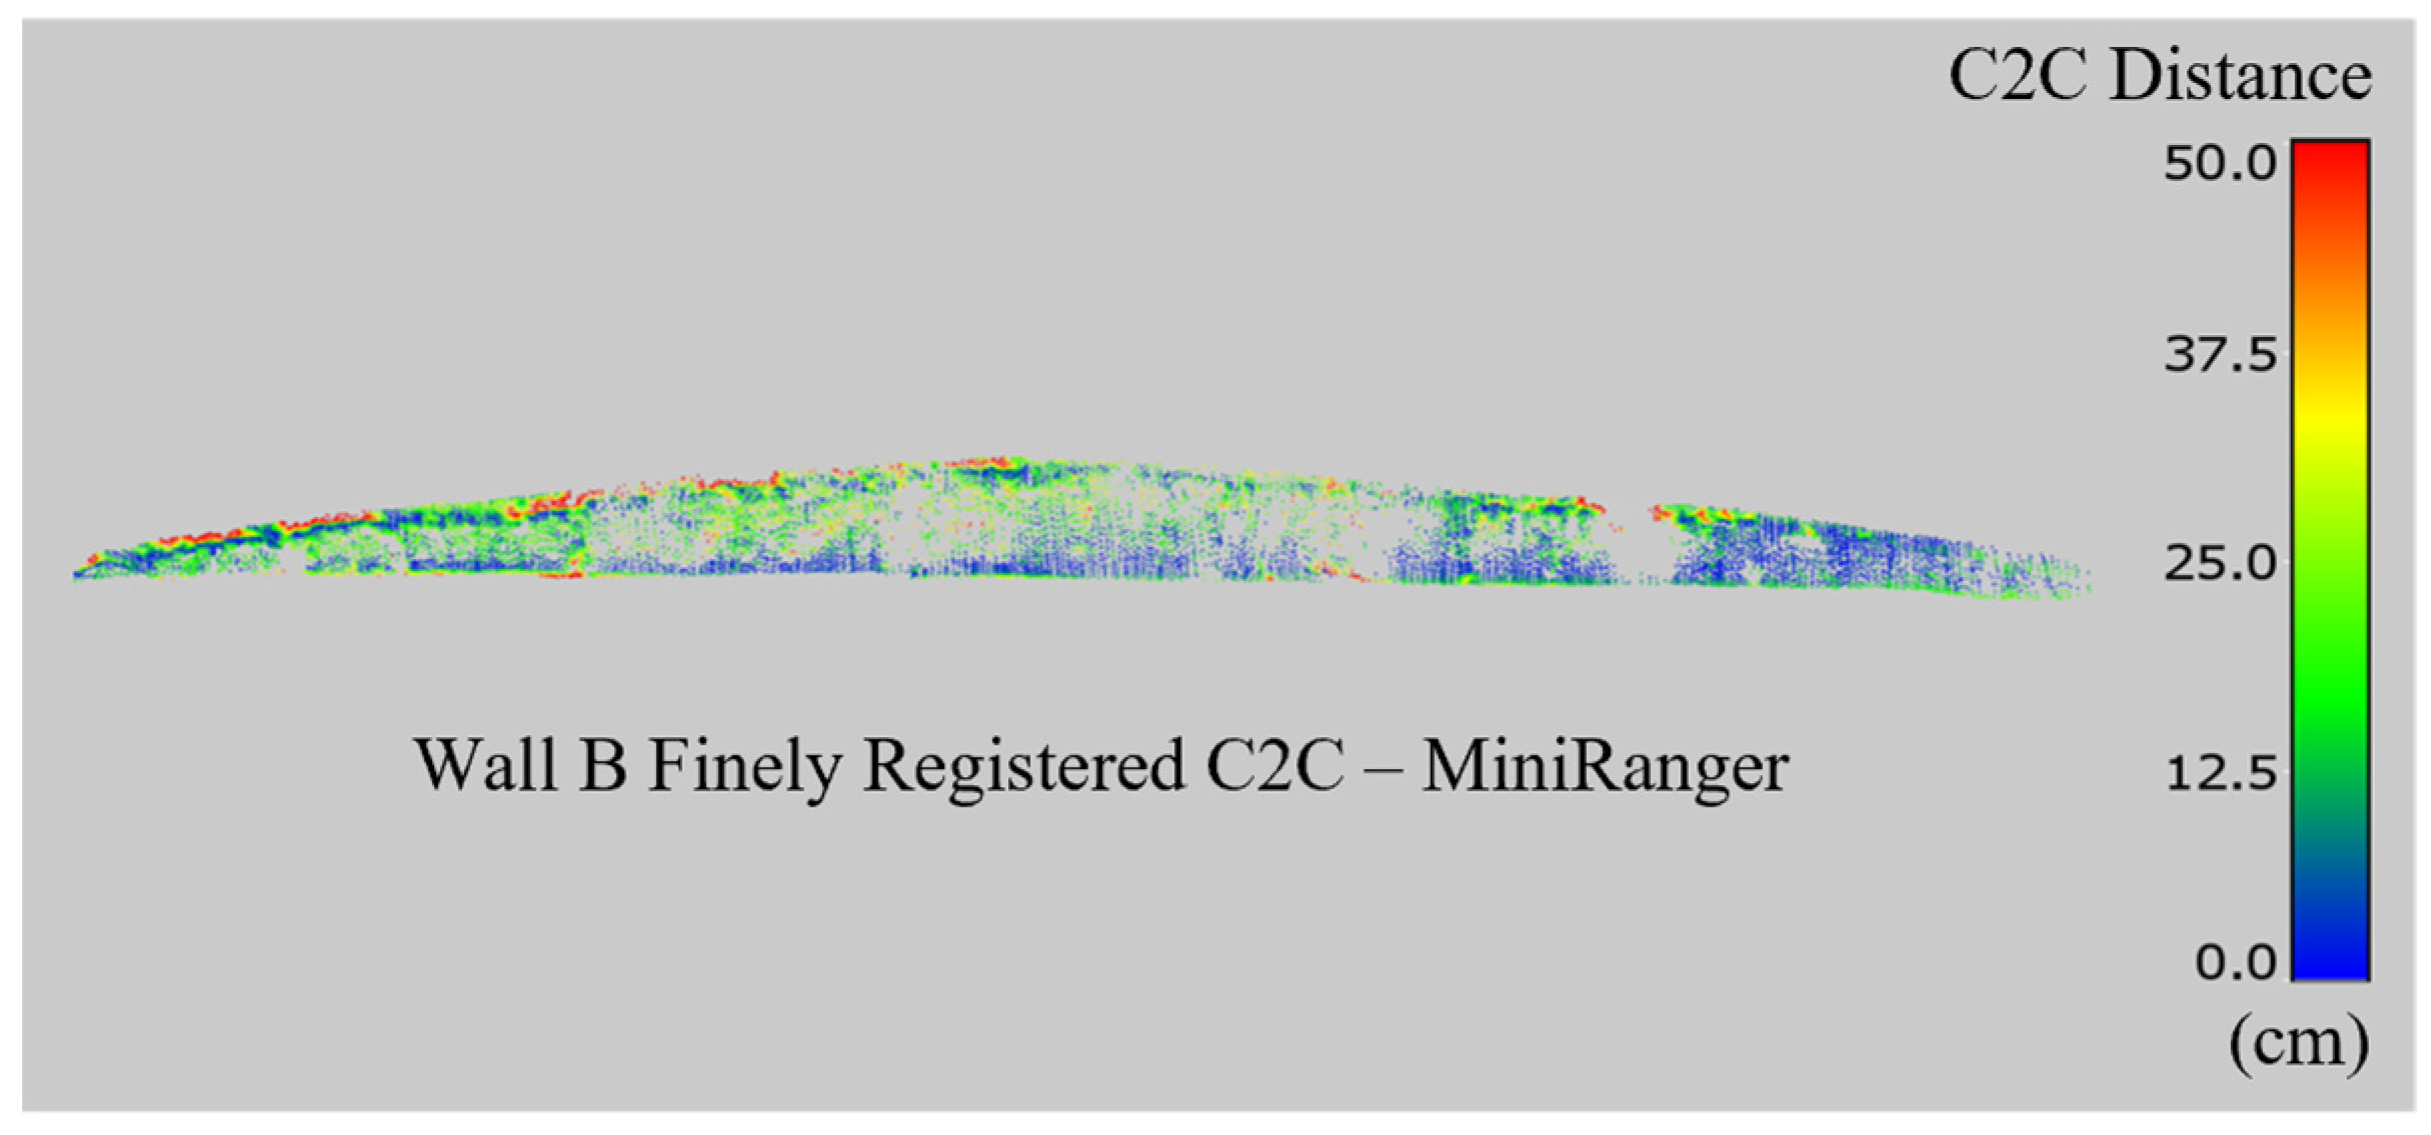
Figure 12 shows the results of the C2C analysis conducted on Wall B. The dense vegetation had a clear impact on the quality of measurement on this site with the MiniRanger data having substantially larger magnitudes of absolute error compared to Wall A. The trend in error running along the wall in Figure 12 provides further evidence of registration issues between the TLS ground truth and drone-lidar scan.
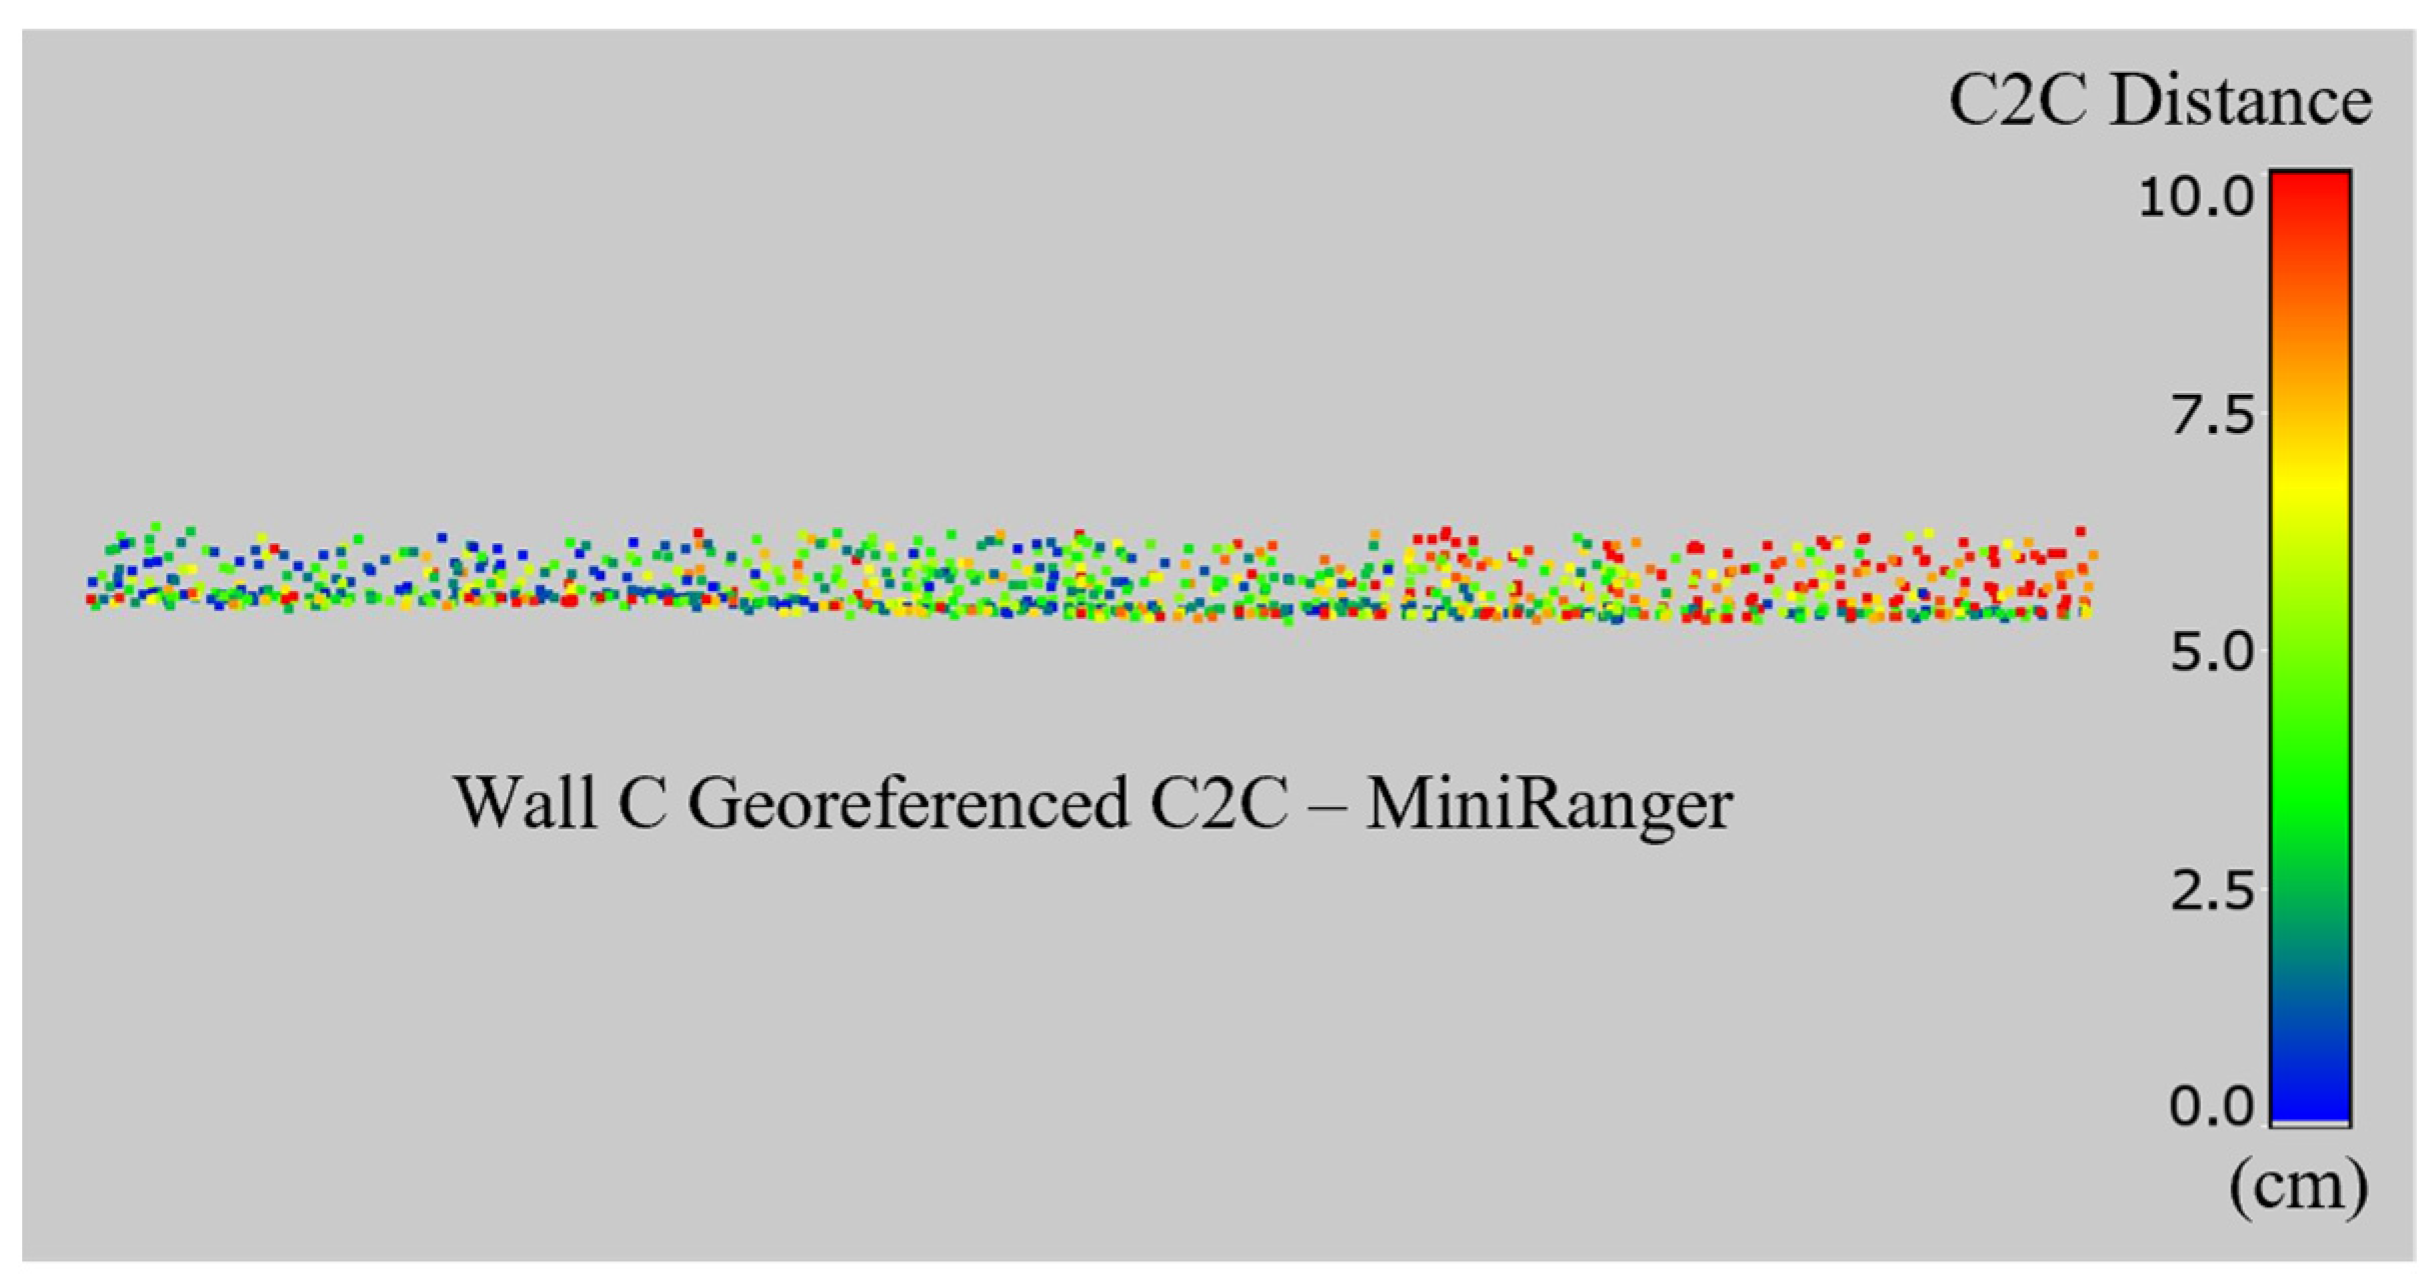
Figure 13 displays the C2C scalar field from the analysis of Wall C. Similarly to Walls A and B, a trend of error increasing when moving left to right along the Wall C scan signifies misalignment to the TLS ground truth. Figure 13 shows higher magnitudes of error in the gaps between the pavers that comprise the wall across all imaging types.

3.5. Finely Registered C2C Comparisons

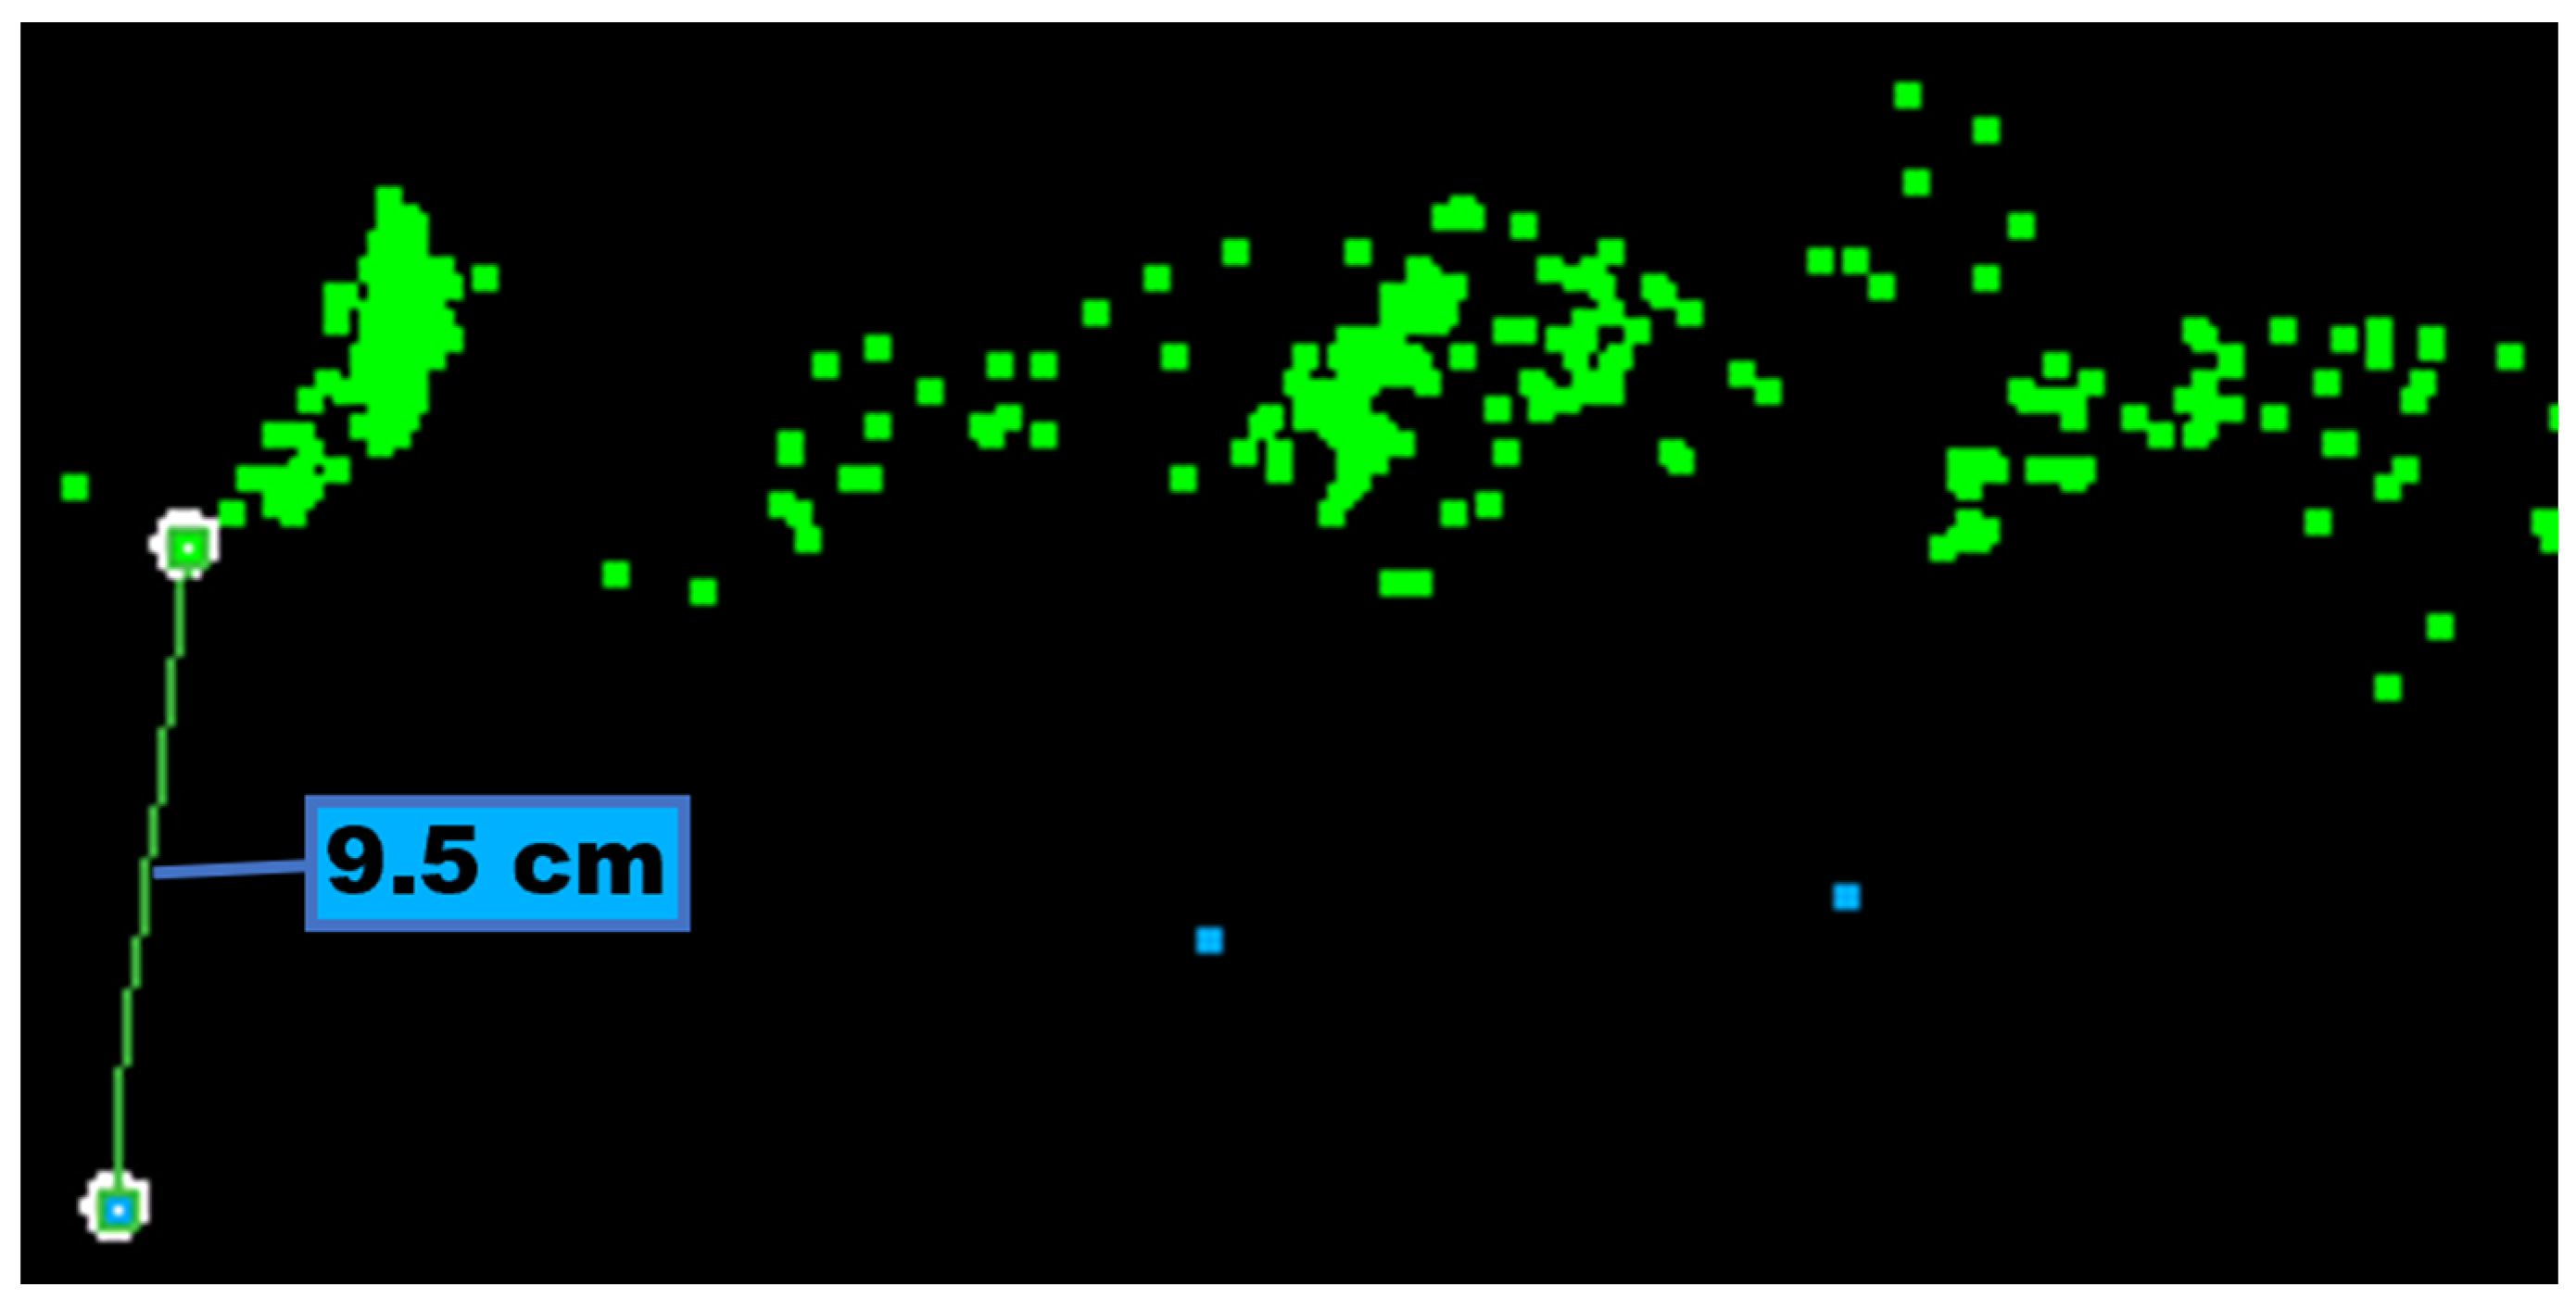
Sections of each wall surface were examined to further assess the evidence of misalignment present in the results discussed in the previous section. Figure 14 is a screenshot from Leica Cyclone Core that shows a section of both the P50 and MiniRanger clouds. This screenshot is further evidence of alignment issues in the data set, with a difference of 9.5 cm between the P50 and MiniRanger clouds. The lack of overlap between these surfaces that should be coplanar manifested as global error to the C2C comparisons.
Global movements over a retaining wall’s life are best monitored with accurately georeferenced cloud comparisons. This is ideal for retaining wall asset management as it allows comparisons to be drawn between subsequent scans that are independent of external changes to a site. Fine registrations are useful when georeferencing data is insufficient to assess these types of global changes. Though these fine registrations nullify the use of georeferencing data, they enable the detection of local changes in a retaining wall’s surface. The following results came from C2C comparisons conducted after fine registrations were performed in CloudCompare to improve the alignment of the tested point clouds to the ground truth P50 point cloud. This supplemental alignment allowed the quality of relative measurements of each surface to be compared even though it lessened the ability to draw conclusions based on global trends. This was intended to expose concentrated areas of error by limiting the impact of inconsistent georeferencing.
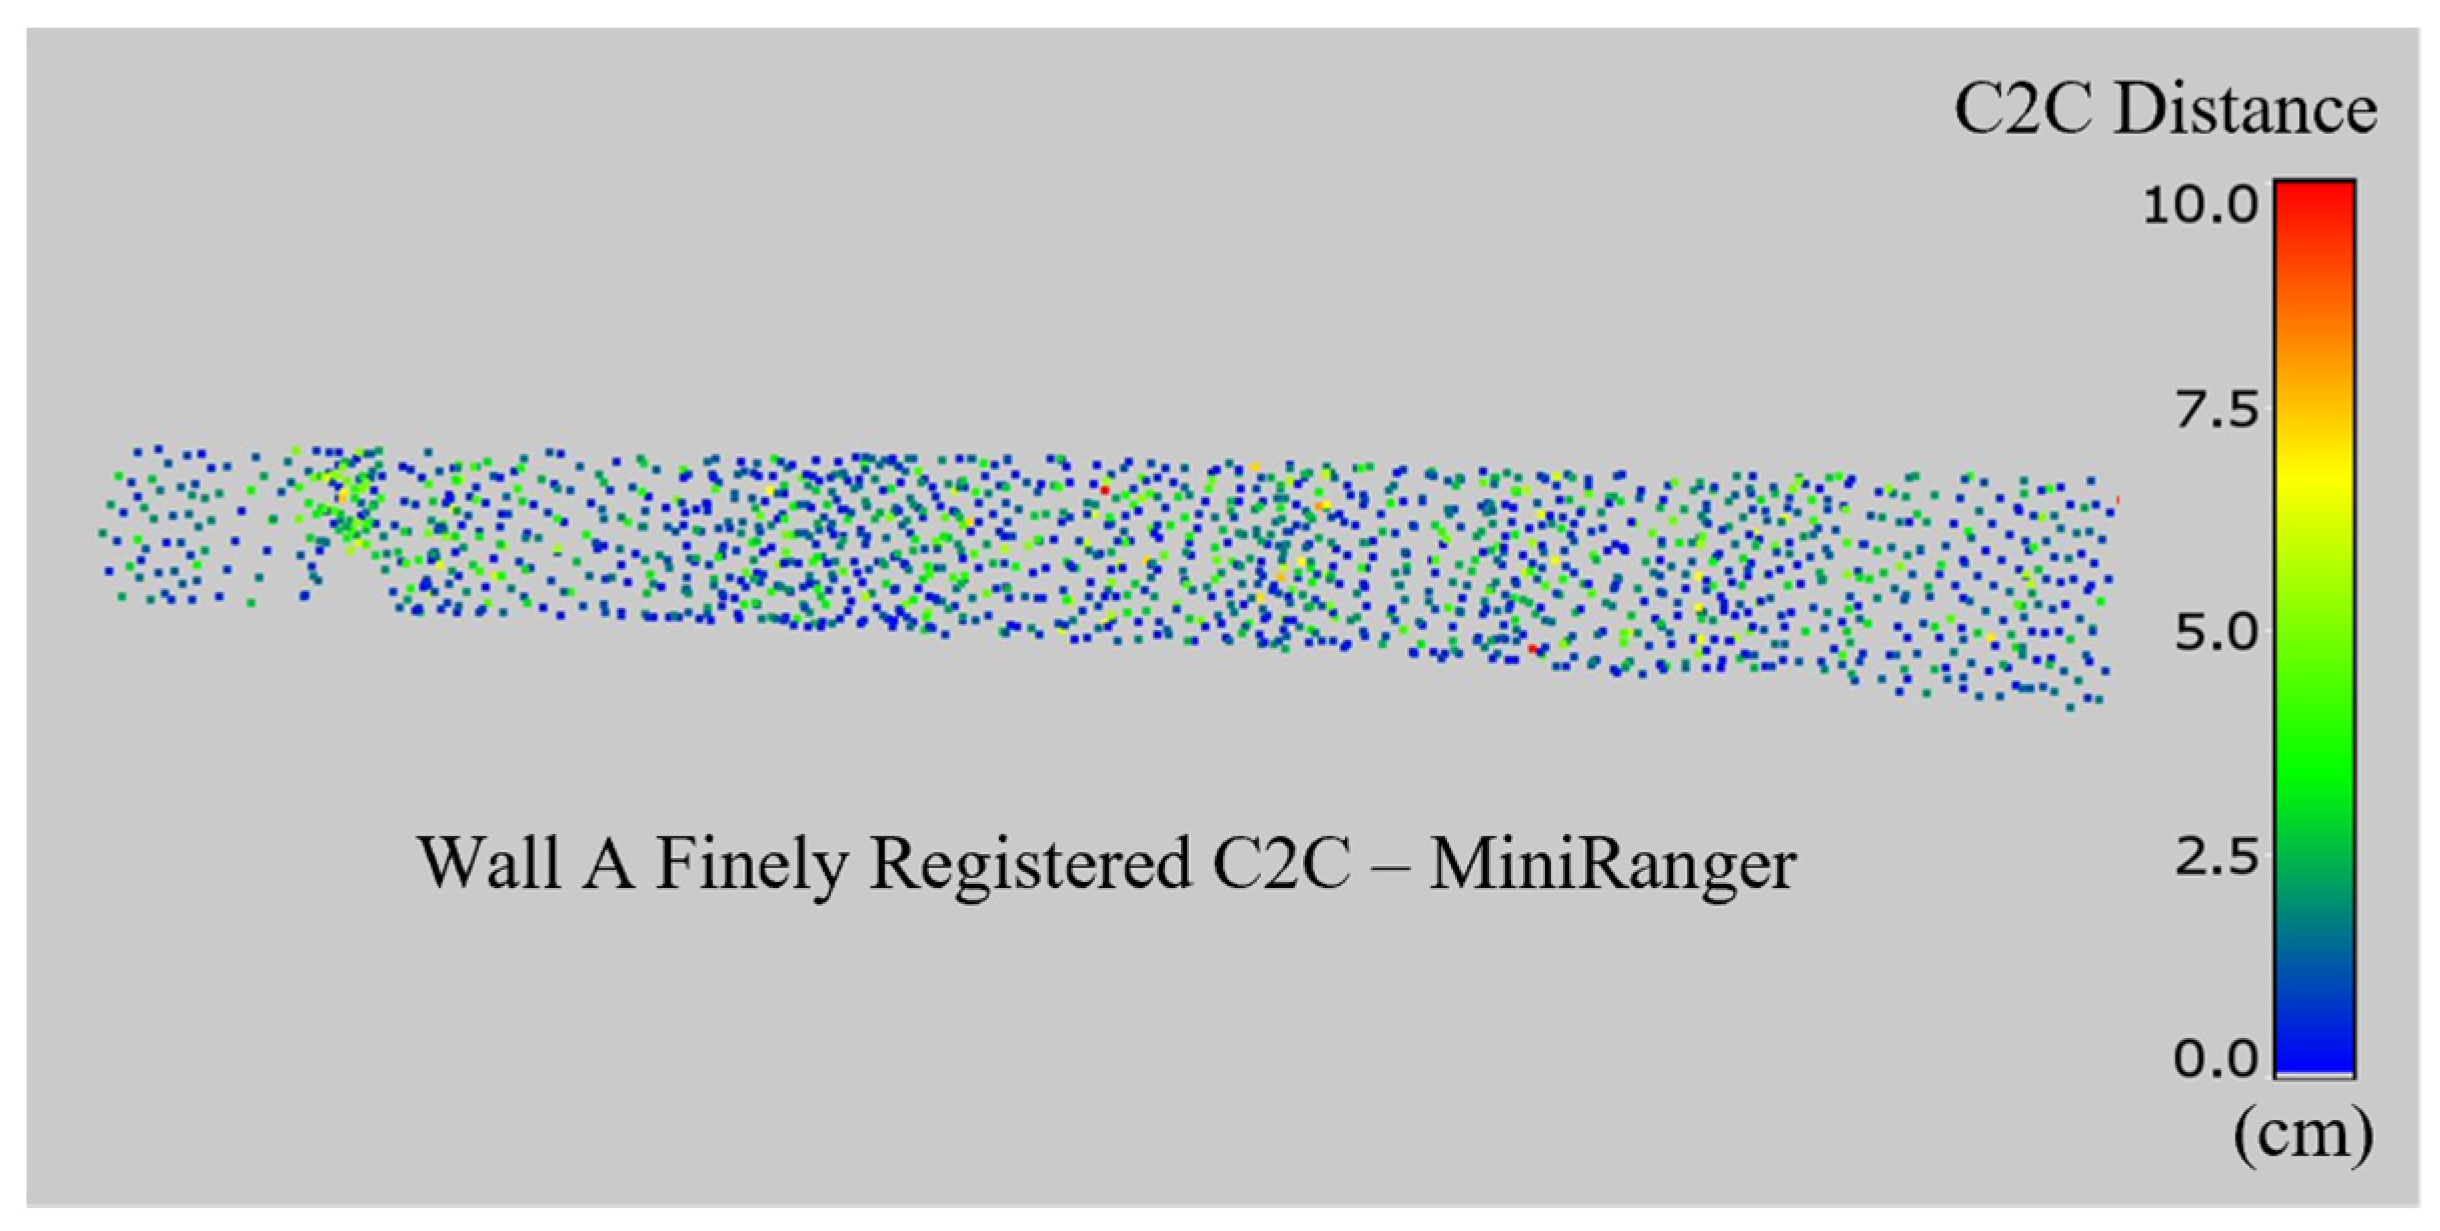
Figure 15 shows a dramatic improvement in the accuracy of Wall A measurements after fine registration was performed. This additional processing step removed the evidence of global misalignment that was evident in all georeferenced C2Cs. The flat surface of Wall A combined with the enhanced alignment of fine registration allowed for the precise assessment of the relative accuracy of the MiniRanger drone-lidar system used in this study. The relative accuracy interpreted from the results of finely registered C2Cs represents the MiniRanger’s ability to measure the geometry of a retaining wall’s surface without considering the accuracy of that location’s surface within a larger spatial reference system.
Figure 16 also shows an increase in accuracy in the models of Wall B compared to the previously georeferenced results. However, the magnitude of absolute error present in these models of Wall B remains higher than that observed on Wall A. The gaps in data present in the MiniRanger model resulted from dense pockets of vegetation in the tree canopy that completely occluded the wall’s surface from the drone-lidar scanners. These observations highlight the significant impact that vegetation had on the quality of measurements on Wall B.
Figure 17 shows the finely registered C2C results for Wall C. Similar improvements in accuracy were observed following the fine registration. Abnormally high absolute error was observed along the top edge of Wall C. This was likely due to a row of thick hedges that overhung the wall, which interfered with the MiniRanger’s measurements. These hedges were well trimmed and not expected to impede the drone-lidar scans at the time this study was conducted. The slight increase in error on the right edge of the wall is also likely caused by vegetation impacts from the tree canopy above this end of the structure. These observations underscore the need to heavily consider and monitor a site’s vegetation when considering drone-lidar imaging.

3.6. Summary of C2C Results

Table 2 summarizes the C2C results shared in the above section. The statistical measures of RMSE (Root Mean Square Error), mean absolute error (MAE), standard deviation (SD), and skewness are shared to provide context about the distribution of error in each retaining wall model. Mean absolute error reports the average unsigned absolute nearest neighbor distance of all points in each cloud as computed in each C2C analysis. The standard deviation provides context on the anticipated variability of each imaging method. The skewness describes the symmetry of error distribution. In this context, a larger, positive skew indicates a higher concentration of points near the mean, with a longer tail to the right. This distribution is desirable when the MAE is low as it indicates consistently accurate measurements. The MiniRanger attained centimeter-level accuracy at Wall A and Wall C.
Results from the finely registered analysis of Wall A served as the baseline for the maximum attainable accuracy. The lack of vegetation and flat surface of Wall A resulted in the highest quality data following the fine registration with a root mean square of 2.33 cm versus 24.2 cm at Wall B and 3.63 cm at Wall C. Though this registration was attained artificially, the results following the fine registration are meant to represent only the relative accuracy of the data. Data that captures a retaining wall’s surface with sufficient relative accuracy still enables valuable in situ evaluations to be conducted such as crack detection, tilt monitoring, etc.
The overall trend in error between the different walls can be attributed to the differences in vegetation impacts between sites. Wall B was qualitatively observed to be the most occluded by vegetation during data collection, followed by Wall C and Wall A. The overall trend in error between walls is supported by the results of the vegetation correlation analysis between the sites, which found moderately strong negative correlations between finely registered measurement accuracy (RMSEs) and the proximity to vegetation on the surface (r = −0.54) and surrounding tree canopies (r = −0.62). This indicates that vegetation reduces the accuracy of drone-lidar measurements of retaining walls.
Table 2 shows that the RMSE and MAE were reduced by fine registration on Wall B while the SD was slightly increased. This highlights a key advantage of aligning retaining wall surfaces with CloudCompare’s ICP based fine registration tool which aligns point clouds by minimizing the distance between overlapping points while treating all points equally. The increased density and regularity of the point cloud along the surface of Wall B as compared to the scattered and noisy measurements collected of vegetation effectively allowed the ICP alignment to prioritize the registration of the wall’s surface over the alignment of vegetation. In the case of Wall B, this effectively decreased the systematic misalignment of the retaining wall surfaces in the drone-lidar and TLS point clouds while increasing the spread of error caused by noisy vegetation measurements. This is shown by the increase in SD despite improvement in overall alignment with the fine registration of the Wall B drone-lidar data.

4. Discussion

4.1. Sources of Error and Accuracy Improvements

This study supplementally used fine registrations between TLS ground truth and tested drone-lidar point clouds to assess local accuracy. Results shown in Table 2 indicate global sources of error, evidenced by the average 52% reduction in RMSE across all sites after fine registrations. This error likely came from inaccurate georeferencing, with a 3D point accuracy of only 5.1 cm, and dynamic site conditions. Georeferenced accuracy could have been improved if the study site was closer to the continually operating reference station used for GPS corrections. A base station could also be deployed on site during data collection to maximize GPS quality.
The dynamic nature of the lighting, waterways, and vegetation on the study site introduced noise into the full-site point clouds, potentially reducing alignment accuracy. This variability is challenging to avoid on some study sites and should be considered when conducting 3D imaging-based inspections. On sites with dense vegetation and conditions similar to those at Wall B, inspectors should recognize these significant limitations before attempting any quantitative evaluation based on lidar data. This study collected measurements of all three walls on a single site. This required excess measurements of the surrounding area that may have exacerbated errors caused by noisy data. Narrowing the area of focus for data collection helps limit the effects of surrounding conditions. The global error introduced by GPS inaccuracies and dynamic conditions was effectively mitigated by performing fine registrations on trimmed and filtered point clouds.

4.2. Point Density Considerations

The difference in point density between TLS and drone-lidar data set was substantial. The P50 TLS scanner was operated at maximum resolution to capture a robust ground truth model. However, this density exceeds what would realistically be required for inspection tasks. Drone-lidar data was much less dense than the TLS data in this study, with the MiniRanger data averaging approximately 40 pts/m2, which translates to an average point spacing of 16 cm. Inspectors considering implementing drone-lidar inspections should carefully consider the desired data density for their application.
While the drone-lidar data may be sufficiently dense to capture topographic features it is likely to miss small variations in a surface such as bulges. It is also insufficient to detect cracking. Drone-lidar data is generally not dense enough to detect cracking during retaining wall inspections. Recent studies have shown that crack detection with point cloud data requires point spacing of half the expected minimum crack widths [64,65]. This means the drone-lidar data produced could only be used to detect hypothetical cracks with widths of 32 cm with the MiniRanger data.
Drone-lidar point density is a function of the scanning unit’s sampling limitations, flight speed, and altitude. Data was collected for this experiment under time pressure due to unique airspace restrictions which led the pilots to prioritize data coverage over density. Scan angles should also be considered when planning for point density. Retaining walls are vertical structures which means that high altitude drone-lidar scans are more likely to degrade in quality due to high incidence angles than TLS scans that might be able to capture a wall’s surface more perpendicularly. A study of aerial lidar point cloud data in urban environments found that measurements on vertical surfaces contain 180% more error and only 10% as many points when compared to horizontal surfaces [66]. Certain sites may restrict the placement of TLS setups forcing the capture of suboptimal oblique lidar data.
Data density in drone-lidar scans can be improved upon with the use of high-quality scanning units and careful mission planning that trades off speed for point density. One study on the use of ultra-high-density drone-lidar that deployed scanners with wide scan angles flown at low altitude showed that accurate measurements with thousands of points per m2 are possible [67].

4.3. Comparing Drone-Lidar and TLS for Retaining Wall Inspection

Implementing 3D imaging to retaining wall inspection protocols allows asset managers to perform quantitative evaluations of 3D models collected between subsequent inspections. It is necessary to understand the level of accuracy in these point clouds required before reliably performing change detection analyses. Retaining wall deformation thresholds should first be understood to establish accuracy requirements for 3D imaging-based inspections. However, there are very few resources available quantifying acceptable levels of deformation in retaining walls. Section 1501.6 of Ohio DOT’s Geotechnical Design Manual specifies a maximum of horizontal displacement for all retaining wall types of 1% the height of the wall [68]. NCHRP Report 903 quantifies retaining walls as structures with a minimum exposed height of 1.2 m [69]. An approximate threshold for allowable horizontal displacement in retaining walls can be estimated as 1.2 cm, considering an allowed 1% displacement of minimum wall height of 1.2 m. This estimation provides a practical benchmark for evaluating whether 3D imaging methods can achieve the accuracy necessary for reliable deformation monitoring.
This research was conducted to address the need for high-accuracy monitoring methods capable of detecting small yet progressive changes in retaining walls. Retaining walls typically decay slowly. Minor bulging and leaning that ultimately lead to failure occur gradually over time. Detecting these early indicators requires measurement methods that consistently achieve sub-centimeter accuracy. The choice between drone-lidar and TLS for retaining wall inspection requires stakeholders to weigh trade-offs in accuracy, efficiency, and operational constraints for each method. Table 3 summarizes the pros and cons of drone-lidar and TLS for this application.
TLS offers higher potential accuracy and greater data density than drone-based lidar scanners. TLS is shown in this study to be effective when imaging sites under dense tree canopies that might obstruct aerial scans. However, TLS can be inefficient on large and complex sites with dynamic obstacles that require multiple scan locations to image structures effectively. Similar sites could be captured by a single drone-lidar flight, leveraging the ability to see over and around many of these ground-based obstacles.
Drone-lidar can also help keep road crews safe and minimize traffic disruptions by reducing the need for a TLS unit and accompanying technicians to operate on active roadways. These benefits come at the cost of increased complexity that requires more time for planning and data processing. A Part 107 license from the FAA would be required to pilot any drone operating lidar scanners for retaining wall inspections [70]. The regulations detailed under FAA Part 107 include a number of factors that may impede drone-lidar inspections such as airspace restrictions and increased regulations for operations over pedestrians and motorists. The potential benefits of drone-lidar inspections must be weighed against the restrictions applied by FAA Part 107 and additional complexities that are introduced with aerial data collection.

4.4. Recommendation for Future Work

Future work in 3D imaging for retaining wall asset management should focus on improving usability and scalability to enable widespread adoption in real-world applications. Key areas of improvement include automating point cloud segmentation and vegetation filtering to increase data processing efficiency. These developments would reduce the time required to extract usable data on relevant features from point clouds.
Future studies of drone-lidar retaining wall inspections should include a parameter sensitivity analysis of key data-collection parameters assessed over multiple flights. Collecting drone-lidar data over multiple flights with various equipment, site conditions, and flight plans could enable future studies to evaluate the repeatability and consistency of the resulting data. Flight height is a crucial factor to consider, as it directly affects point density and ground sampling resolution. Amelunke et al. found that flight altitude significantly influences vertical accuracy in drone-lidar surveys of marshes [71]. Other parameters to evaluate include flight speed, scanning angle, scanning rate, and the number and placement of ground control points. Esri, a leader in geospatial mapping, recommends a minimum of five well-spaced control points for optimal results with more points required for large and complex sites [72]. Understanding how these variables affect point cloud accuracy would support the development of optimized and robust inspection protocols.
Advances in automated flight planning that account for obstructions to the desired structure could improve the reliability of drone-lidar scans. Drone-lidar flight planning is optimized for the collection of data on horizontal surfaces, though rudimentary vertical flight planning has been explored for the inspection of communication towers [73]. Future studies investigating the optimization of vertical flight planning for the application of retaining wall inspections are required that minimize oblique scanning angles and vegetation impact, which would provide significant benefits to the field. Such studies should consider vector-based analyses capable of precisely measuring incidence angles and vegetation coverage to determine their effects on drone-lidar data. Improvements in vertical flight planning would also lessen the upfront operational cost of implementing drone-lidar solutions to retaining wall asset management programs. Future research that addresses these technological challenges has the potential to enhance the reliability and efficiency of 3D imaging-based retaining wall inspections. Widespread adoption of techniques that leverage these developments would increase the capacity for proactive and data-driven asset management.
The TLS and drone-lidar inspection methods used in this study both require the acquisition and maintenance of expensive and specialized equipment. However, recent advances in consumer technology have made lidar-based 3D imaging more accessible by incorporating compact lidar sensors into many modern smartphones and tablets. These low-cost sensors typically only achieve 4–5 cm measurement accuracy [74]. Despite their low accuracy, their low cost and ease of use have prompted growing interest in their potential to support structural inspections. A recent study from the FHWA assessed the use of a smartphone lidar sensor for the inspection of MSE bridge abutments and found limitations in its local accuracy and ability to monitor bulging defects [75]. Future research seeking to refine the implementation of similarly accessible 3D imaging inspection methods should be considered to validate their use in applications where the cost of TLS or drone-lidar may be prohibitive.
3D imaging enables data-driven life-cycle planning for infrastructure assets by quantifying measurements collected during subsequent inspections. However, there is limited available data on the life expectancy of retaining walls to support the life cycle planning that routine 3D imaging makes possible [76]. A report from the National Cooperative Highway Research Program identified the need to develop decay curves to estimate effective structural health in earth retaining structures, thereby improving the limited understanding of lifetime retaining wall performance [8]. Developing such decay curves is reliant on the existence of detailed historical data of in-service retaining walls that 3D imaging-driven inspection protocols can provide. Future studies investigating the long-term performance of retaining walls that establish thresholds for allowable displacement, cracking, surface deformations, and other markers of decay are required to maximize the value that 3D imaging-based inspections can provide. Such studies should consider retaining walls on diverse sites with varying vegetation cover, weather, seasonality, and traffic, which may affect the structure’s performance and the ability to routinely capture high-quality 3D measurements.

5. Conclusions

Three-dimensional imaging through modern lidar technology can be used to efficiently capture comprehensive 3D models over large areas. This study assessed the accuracy of drone-lidar imaging through comparisons to ground truth established by TLS. This imaging method was selected for this study, given its potential to improve the efficiency of widespread 3D imaging over traditional TLS-based workflows. This work was conducted as part of an ongoing effort to improve current standards for retaining wall inspection by incorporating 3D imaging. The methods described in this manuscript provide summaries of various workflows potentially capable of efficiently capturing comprehensive 3D models of retaining walls with centimeter-level accuracy.
The results of this study highlight how varying site conditions around retaining walls affect the efficacy of modern lidar imaging techniques for routine inspection. GPS accuracy and dense vegetation were highlighted as key limitations to the feasible implementation of the proposed methods. The following findings provide valuable insight that should be considered in the development of routine inspection protocols designed for reliable and accurate retaining wall imaging.
  • Terrestrial lidar scanning is validated as a reliable method of 3D imaging with comprehensive data capture, even on structures with dense vegetation.
  • The overall accuracy of retaining wall imaging using drone-lidar is more dependent on precise georegistration than the relative accuracy of imaging platforms.
  • Drone-lidar systems are not recommended as the sole means of 3D imaging for retaining wall inspection purposes. Drone-lidar was found to offer centimeter-level accuracy on retaining walls under low to moderate vegetation with an average density of 40 pts/m2. This data quality is insufficient for most retaining wall monitoring purposes.
  • Inspections combining TLS and drone-lidar may be considered to maintain the accuracy and density of measurements on the surface of retaining walls while leveraging the efficiency of drone-lidar to capture larger areas that contextualize measurements of the wall collected by TLS.
  • Drone-lidar should not be used on walls with dense vegetation.
  • The efficiency of drone-lidar must be weighed against the potential for inaccurate georeferencing and local measurements.

Author Contributions

Conceptualization, M.W., A.H. and M.G.; Methodology, M.W., A.H. and M.G.; Formal Analysis, M.W.; Investigation, M.W., K.D. and M.G.; Resources, A.H.; Data Curation, M.W.; Writing—Original Draft Preparation, M.W.; Writing—Review and Editing, M.W., A.H., K.D. and M.G.; Visualization, M.W. and K.D.; Supervision, A.H., and S.M.; Project Administration, A.H.; Funding Acquisition, A.H. All authors have read and agreed to the published version of the manuscript.

Funding

This research was funded by the Connecticut Department of Transportation and US Federal Highway Administration, grant number SPR-2327.

Institutional Review Board Statement

Not applicable.

Informed Consent Statement

Not appliable.

Data Availability Statement

Data will be made available by the authors upon reasonable request.

Acknowledgments

This paper presents the findings of a study conducted under project SPR-2327 funded by the Federal Highway Administration and the Connecticut Department of Transportation (CTDOT). The authors would like to thank Sara Ghatee for her support during the project as well as the support of the CTDOT Research Unit. The authors would also like to thank Andrew Lyda from the RAPID team at UW for their assistance during the experiment. ChatGPT (GPT-5, accessed on 30 October 2025) was used as a writing assistant to check grammar. The opinions, findings and conclusions expressed in the paper are those of the authors and do not necessarily reflect the views of the Connecticut Department of Transportation or University of Connecticut. Data was collected in part using equipment provided by the National Science Foundation as part of the RAPID Facility, a component of the Natural Hazards Engineering Research Infrastructure, under Award No. CMMI: 2130997 [77,78]. Any opinions, findings, conclusions, and recommendations presented in this paper are those of the authors and do not necessarily reflect the views of the National Science Foundation.

Conflicts of Interest

The authors declare no conflicts of interest.

Abbreviations

The following abbreviations are used in this manuscript:
TLSTerrestrial Laser Scanning
GNSSGlobal Navigation Satellite System
GPSGlobal Positioning System
lidarLight distance and ranging
UASUncrewed Aerial System
RTKReal-Time Kinematics
C2CCloud-to-Cloud Comparison
RMSERoot Mean Square Error

References

  1. NPS. National Park Service–WIP and GIP Reports. Available online: https://fhfl15gisweb.flhd.fhwa.dot.gov/NpsReports/GipWip (accessed on 13 June 2024).
  2. Butler, C.J.; Gabr, M.A.; Rasdorf, W.; Findley, D.J.; Chang, J.C.; Hammit, B.E. Retaining Wall Field Condition Inspection, Rating Analysis, and Condition Assessment. J. Perform. Constr. Facil. 2016, 30, 04015039. [Google Scholar] [CrossRef]
  3. New York State Department of Transportation. Retaining Wall Inventory and Inspection Program Manual. Available online: https://www.dot.ny.gov/divisions/engineering/technical-services/geotechnical-engineering-bureau/RWIIP%20Manual (accessed on 13 June 2024).
  4. Hain, A.; Zaghi, A.E. Applicability of Photogrammetry for Inspection and Monitoring of Dry-Stone Masonry Retaining Walls. Transp. Res. Rec. 2020, 2674, 287–297. [Google Scholar] [CrossRef]
  5. Oats, R.; Escobar-Wolf, R.; Oommen, T. A Novel Application of Photogrammetry for Retaining Wall Assessment. Infrastructures 2017, 2, 10. [Google Scholar] [CrossRef]
  6. Psimoulis, P.; Algadhi, A.; Grizi, A.; Neves, L. Assessment of accuracy and performance of terrestrial laser scanner in monitoring of retaining walls. In Proceedings of the 5th Joint International Symposium on Deformation Monitoring—JISDM 2022, Valencia, Spain, 20–22 June 2022. [Google Scholar] [CrossRef]
  7. Rasdorf, W.; Gabr, M.A.; Butler, C.J.; Findley, D.J.; Bert, S.A. Retaining Wall Inventory and Assessment System. NCDOT Project 2014-10; 2015. Available online: https://connect.ncdot.gov/projects/research/RNAProjDocs/2014-10FinalReport.pdf (accessed on 13 June 2024).
  8. Brutus, O.; Tauber, G. Guide to Asset Management of Earth Retaining Structures. Available online: https://onlinepubs.trb.org/onlinepubs/nchrp/docs/nchrp20-07(259)_fr.pdf (accessed on 13 June 2024).
  9. Neoge, S.; Mehendale, N. Review on LiDAR Technology. SSRN Electron. J. 2020. [Google Scholar] [CrossRef]
  10. Abbas, M.A.; Chong Luh, L.; Setan, H.; Majid ZKChong, A.; Aspuri, A.; Idris, K.M.; Ariff, M.F.M. Terrestrial Laser Scanners Pre-Processing: Registration and Georeferencing. J. Teknol. 2015, 71, 115–122. [Google Scholar] [CrossRef]
  11. What Is LiDAR? Available online: https://www.artec3d.com/learning-center/what-is-lidar (accessed on 13 July 2024).
  12. Kaartinen, E.; Dunphy, K.; Sadhu, A. LiDAR-Based Structural Health Monitoring: Applications in Civil Infrastructure Systems. Sensors 2022, 22, 4610. [Google Scholar] [CrossRef] [PubMed]
  13. Yust, M.B.S.; McGuire, M.P.; Shippee, B.J. Application of Terrestrial Lidar and Photogrammetry to the As-Built Verification and Displacement Monitoring of a Segmental Retaining Wall. Geotech. Front. 2017, 2017, 461–471. [Google Scholar] [CrossRef]
  14. Laefer, D.F.; Lennon, D. Viability Assessment of Terrestrial LiDAR for Retaining Wall Monitoring. In Proceedings of the GeoCongress 2008, Orleans, LA, USA, 9–12 March 2008. [Google Scholar] [CrossRef]
  15. Kurdi, F.T.; Reed, P.; Gharineiat, Z.; Awrangjeb, M. Efficiency of Terrestrial Laser Scanning in Survey Works: Assessment, Modelling, and Monitoring. Int. J. Environ. Sci. Nat. Res. 2023, 32, 556334. [Google Scholar] [CrossRef]
  16. Leica ScanStation P50 3D Laser Scanner. Available online: https://secure.fltgeosystems.com/laser-scanners-3d/leica-scanstation-p50-3d-laser-scanner-lca6012700/?srsltid=AfmBOorNIjRttgv1pjcHY7cQf2APce9w5rrCQZDuzHDF4dv61kFouVww (accessed on 5 December 2024).
  17. Maar, H.; Zogg, H. WFD-Wave Form Digitizer Technology White Paper. 2021. Available online: https://leica-geosystems.com/en-us/about-us/content-features/wave-form-digitizer-technology-white-paper (accessed on 9 September 2025).
  18. Mukupa, W.; Roberts, G.W.; Hancock, C.M.; Al-Manasir, K. A review of the use of terrestrial laser scanning application for change detection and deformation monitoring of structures. Surv. Rev. 2016, 49, 99–116. [Google Scholar] [CrossRef]
  19. Chen, S.; Laefer, D.F.; Mangina, E.; Zolanvari, S.I.; Byrne, J. UAV Bridge Inspection through Evaluated 3D Reconstructions. J. Bridge Eng. 2019, 24, 05019001. [Google Scholar] [CrossRef]
  20. Wondolowski, M.; Hain, A.; Motaref, S.; Grilliot, M. Assessing Doming Mitigation Strategies for Enhanced Inspection of Masonry Retaining Walls with SfM as a Cost-Effective 3D Imaging Solution. Front. Built Environ. 2025, 11, 1517379. [Google Scholar] [CrossRef]
  21. Kwiatkowski, J.; Anigacz, W.; Beben, D. A Case Study on the Noncontact Inventory of the Oldest European Cast-iron Bridge Using Terrestrial Laser Scanning and Photogrammetric Techniques. Remote Sens. 2020, 12, 2745. [Google Scholar] [CrossRef]
  22. Khan, N.H.R.; Kumar, S.V. Terrestrial LiDAR derived 3D point cloud model, digital elevation model (DEM) and hillshade map for identification and evaluation of pavement distresses. Results Eng. 2024, 23, 102680. [Google Scholar] [CrossRef]
  23. Oskoui, P.; Becerik-Gerber, B.; Soibelman, L. Automated measurement of highway retaining wall displacements using terrestrial laser scanners. Autom. Constr. 2016, 65, 86–101. [Google Scholar] [CrossRef]
  24. Characterization of Laser Scanners for Detecting Cracks for Post-Earthquake Damage Inspection. In Proceedings of the 30th ISARC, Montréal, QC, Canada, 11–15 August 2013. [CrossRef]
  25. Border, R.; Chebrolu, N.; Tao, Y.; Gammell, J.D.; Fallon, M. Osprey: Multi-Session Autonomous Aerial Mapping with LiDAR-based SLAM and Next Best View Planning. arXiv 2023. [Google Scholar] [CrossRef]
  26. Moore, A.J.; Schubert, M.; Rymer, N.; Balachandran, S.; Consiglio, M.; Munoz, C.; Smith, J.; Lewis, D.; Schneide, P. Inspection of electrical transmission structures with UAV path conformance and lidar-based geofences. In Proceedings of the 2018 IEEE Power & Energy Society Innovative Smart Grid Technologies Conference (ISGT), Washington, DC, USA, 19–22 February 2018. [Google Scholar] [CrossRef]
  27. Yan, Y.; Mao, Z.; Wu, J.; Padir, T.; Hajjar, J.F. Towards automated detection and quantification of concrete cracks using integrated images and lidar data from unmanned aerial vehicles. Struct. Control Health Monit. 2021, 29, e2757. [Google Scholar] [CrossRef]
  28. Zhao, Y.; Im, J.; Zhen, Z.; Zhao, Y. Towards accurate individual tree parameters estimation in dense forest: Optimized coarse-to-fine algorithms for registering UAV and terrestrial LiDAR data. GISci. Remote Sens. 2023, 60, 2197281. [Google Scholar] [CrossRef]
  29. Suh, J.W.; Ouimet, W. Generation of High-Resolution Orthomosaics from Historical Aerial Photographs Using Structure-from-Motion and Lidar Data. Photogramm. Eng. Remote Sens. 2023, 89, 37–46. [Google Scholar] [CrossRef]
  30. Mundell, C.; McCombie, P.; Heath, A.; Harkness, J.; Walker, P. Behaviour of drystone retaining structures. Proc. Inst. Civ. Eng. Struct. Build. 2010, 163, 3–12. [Google Scholar] [CrossRef]
  31. 2016 & 2017 Retaining Wall and Landslide Report. Available online: https://www.cincinnati-oh.gov/sites/dote/assets/File/WallsHillsides/2016-2017_Retaining_Wall_Report.pdf (accessed on 13 July 2025).
  32. Esri Community Map Contributors, WSU Facilities Services GIS, City of Seattle, King County, WA State Parks GIS. Topographic Basemap. 2021; 1:16138; 1:1613; 122.3019453° W 47.6475268° N. Available online: https://www.arcgis.com/sharing/rest/content/items/27e89eb03c1e4341a1d75e597f0291e6/resources/styles/root.json (accessed on 25 October 2025).
  33. Mahun, J. Theodolite and Total Station. Open Access Surveying Library. 2017. Available online: https://www.jerrymahun.com/index.php/home/open-access/44-x-equipment-check-adjustment/199-d-theodolite-tsi?showall=1 (accessed on 24 June 2025).
  34. Scherer, M.; Lerma, J.L. From the Conventional Total Station to the Prospective Image Assisted Photogrammetric Scanning Total Station: Comprehensive Review. J. Surv. Eng. 2009, 135, 173–178. [Google Scholar] [CrossRef]
  35. Roziqin, A.; Gustin, O.; Kurniawan, A.; Syaifudin, M. Topographic Mapping Using Electronic Total Station (ETS). In Proceedings of the 2019 2nd International Conference on Applied Engineering (ICAE), Batam, Indonesia, 2–3 October 2019. [Google Scholar] [CrossRef]
  36. Zhao, L.; Wang, P.; Zhang, G. Shape Measurement of Parabolic Antenna Using Total Station TCRA1102. In Proceedings of the 2011 IEEE International Conference on Spatial Data Mining and Geographical Knowledge Services, Fuzhou, China, 29 June–1 July 2011. [Google Scholar] [CrossRef]
  37. Liang, Y.; Xie, R.; Liu, C.; Ye, A. Construction and Optimization Method of Large-scale Space Control Field based on Total Station. In Proceedings of the 2022 3rd International Conference on Geology, Mapping and Remote Sensing (ICGMRS) 2022, Zhoushan, China, 22–24 April 2022. [Google Scholar] [CrossRef]
  38. Leica Geosystems. Leica TS16 Data Sheet. Available online: https://leica-geosystems.com/-/media/files/leicageosystems/products/datasheets/leica_viva_ts16_ds.ashx (accessed on 13 June 2024).
  39. GPS.gov. GPS: The Global Positioning System. Available online: https://www.gps.gov/ (accessed on 6 June 2024).
  40. PAGNA Geodesy Lab CWU. ZSE1 (PANGA) Seattle WA. Available online: https://www.geodesy.org/sites/zse1/ (accessed on 12 November 2024).
  41. FAA. ZSE1 Site Information Form. Available online: https://www.ngs.noaa.gov/CORS/Sites/zse1.html (accessed on 12 November 2024).
  42. Phoenix Lidar. LiDAR Mapping Systems: Post Processing—Workflow with Inertial Explorer and TerraSolid. Available online: https://www.phoenixlidar.com/wp-content/uploads/2019/02/Phoenix-LiDAR-Systems-Post-Processing-Workflow-20190107.pdf (accessed on 28 June 2024).
  43. Leica. Leica GS18 T GNSS RTK Rover. Available online: https://leica-geosystems.com/en-us/products/gnss-systems/smart-antennas/leica-gs18-t (accessed on 6 June 2024).
  44. Leica. Leica Infinity Training Materials-Advanced GNSS Processing. Available online: https://leica-geosystems.com/-/media/539597242bfa46b99d1366acae90d133.ashx (accessed on 14 June 2024).
  45. Leica. Leica ScanStation P50 Because Every Detail Matters. Available online: https://leica-geosystems.com/-/media/files/leicageosystems/products/datasheets/leica_scanstation_p50_ds.ashx?la=en&hash=5EC270F6F529355910203E95EA1959EF (accessed on 21 September 2025).
  46. Laefer, D.F.; Fitzgerald, M.; Maloney, E.M.; Coyne, D.; Lennon, D.; Morrish, S.W. Lateral Image Degradation in Terrestrial Laser Scanning. Struct. Eng. Int. 2009, 19, 184. [Google Scholar] [CrossRef]
  47. C.R.Kennedy & Company. Leica Cyclone Basic User Manual. Available online: https://www.sdm.co.th/pdf/Cyclone%20Basic%20Tutorial.pdf (accessed on 14 June 2024).
  48. LASer (LAS) File Format Exchange Activities. Available online: https://www.asprs.org/divisions-committees/lidar-division/laser-las-file-format-exchange-activities (accessed on 13 July 2025).
  49. Phoenix miniRANGER-LITE Product Spec Sheet. Available online: https://www.phoenixlidar.com/wp-content/uploads/2019/11/PLS-miniRANGER-LITE-Spec-Sheet.pdf (accessed on 21 September 2025).
  50. Phoenix FlightPlanner User Manual. Available online: https://docs.phoenixlidar.com/flightplanner/flight-planning (accessed on 21 September 2025).
  51. Inertial Explorer 8.70 Manual. Available online: https://novatel.com/support/waypoint-software/inertial-explorer (accessed on 14 June 2023).
  52. Spatial Explorer Manual. Available online: https://www.phoenixlidar.com/wp-content/uploads/2019/03/PLSAcqTrainSE.pdf (accessed on 14 June 2024).
  53. Spatial Explorer 7-Airborne Lidar Workflow. Available online: https://docs-7.phoenixlidar.com/lidarmill-desktop/post-processing/airborne-lidar-workflow (accessed on 1 September 2025).
  54. CloudCompare. CloudCompare Version 2.6.1 User Manual. 2023. Available online: https://www.cloudcompare.org/doc/qCC/CloudCompare%20v2.6.1%20-%20User%20manual.pdf (accessed on 7 September 2025).
  55. Wondolowski, M.; Hain, A.; Motaref, S. Experimental evaluation of 3D imaging technologies for structural assessment of masonry retaining walls. Results Eng. 2024, 21, 101901. [Google Scholar] [CrossRef]
  56. Brodu, N.; Lague, D. 3D Terrestrial lidar data classification of complex natural scenes using a multi-scale dimensionality criterion: Applications in geomorphology. ISPRS J. Photogramm. Remote Sens. 2012, 68, 121–134. [Google Scholar] [CrossRef]
  57. CloudCompare. CANUPO (Plugin). Available online: https://www.cloudcompare.org/doc/wiki/index.php/CANUPO_(plugin)#Use_an_existing_.22.prm.22_file (accessed on 30 June 2024).
  58. Girardeau-Montaut, D.; Lague, D. qCANUPO (Classifier Files, etc.). Available online: https://www.cloudcompare.org/forum/viewtopic.php?t=808&start=90 (accessed on 1 July 2024).
  59. Li, L.; Wang, R.; Zhang, X. A Tutorial Review on Point Cloud Registrations: Principle, Classification, Comparison, and Technology Challenges. Math. Probl. Eng. 2021, 2021, 9953910. [Google Scholar] [CrossRef]
  60. CloudCompare. ICP. Available online: https://www.cloudcompare.org/doc/wiki/index.php/ICP (accessed on 6 December 2023).
  61. Density-CloudCompare. Available online: https://www.cloudcompare.org/doc/wiki/index.php/Density (accessed on 24 June 2025).
  62. Cloud-to-Cloud Distance. Available online: https://www.cloudcompare.org/doc/wiki/index.php/Cloud-to-Cloud_Distance (accessed on 20 September 2023).
  63. Liao, J.; Zhou, J.; Yang, W. Comparing LiDAR and SfM digital surface models for three land cover types. Open Geosci. 2021, 13, 497–504. [Google Scholar] [CrossRef]
  64. Pascucci, N.; Dominici, D.; Habib, A. LiDAR-Based Road Cracking Detection: Machine Learning Comparison, Intensity Normalization, and Open-Source WebGIS for Infrastructure Maintenance. Remote Sens. 2025, 17, 1543. [Google Scholar] [CrossRef]
  65. Merkle, D.; Schmitt, A.; Reiterer, A. Sensor Evaluation for Crack Detection in Concrete Bridges. Int. Arch. Photogramm. Remote Sens. Spatial Inf. Sci. 2020, XLIII-B2-2020, 1107–1114. [Google Scholar] [CrossRef]
  66. Stanley, M.H.; Laefer, D.F. Metrics for Aerial, Urban Lidar Point Clouds. J. Photogramm. Remote Sens. 2021, 175, 268–281. [Google Scholar] [CrossRef]
  67. Moenning, C.; Dodgson, N.A. A New Point Cloud Simplification Algorithm. Available online: https://www.semanticscholar.org/paper/A-new-point-cloud-simplification-algorithm-Moenning-Dodgson/d2fb5de95e13041f62a82d3f8099f82ba0c12f17 (accessed on 7 September 2025).
  68. Ohio Department of Transportation. Geotechnical Design Manual. 2025. Available online: https://www.transportation.ohio.gov/working/engineering/geotechnical/manuals/geotechnical-design (accessed on 25 October 2025).
  69. Vessely, M.; Robert, W.; Richrath, S.; Schaefer, V.R.; Smadi, O.; Loehr, E.; Boeckmann, A. Geotechnical Asset Management for Transportation Agencies, Volume 1: Research Overview; Transportation Research Board: Washington, DC, USA, 2019. [Google Scholar] [CrossRef]
  70. Remote Pilot-Small Unmannned Aircraft Systems Study Guide. 2016. Available online: https://www.faa.gov/sites/faa.gov/files/regulations_policies/handbooks_manuals/aviation/remote_pilot_study_guide.pdf (accessed on 7 September 2025).
  71. Amelunke, M.; Anderson, C.P.; Waldron, M.C.; Raber, G.T.; Carter, G.A. Influence of Flight Altitude and Surface Characteristics on UAS-LiDAR Ground Height Estimate Accuracy in Juncus roemerianus Scheele-Dominated Marshes. Remote Sens. 2024, 16, 384. [Google Scholar] [CrossRef]
  72. Set Ground Control Points for Use in Site Scan Manager for ArcGIS. Available online: https://support.esri.com/en-us/knowledge-base/how-to-set-ground-control-points-for-use-in-site-scan-m-000023042 (accessed on 13 July 2025).
  73. Alsadik, B.; Remondino, F. Flight Planning for LiDAR-Based UAS Mapping Applications. ISPRS Int. J. Geo-Inf. 2020, 9, 378. [Google Scholar] [CrossRef]
  74. Catharia, O.; Richard, F.; Vignoles, H.; Véron, P.; Aoussat, A.; Segonds, F. Smartphone LiDAR Data: A Case Study for Numerisation of Indoor Buildings in Railway Stations. Sensors 2023, 23, 1967. [Google Scholar] [CrossRef] [PubMed]
  75. Corrigan, M. Pocket Lidar for Assessing Mechanically Stabilized Earth (MSE) Retaining Wall for Bridge Abutments. 2024. Available online: https://rosap.ntl.bts.gov/view/dot/79630/dot_79630_DS1.pdf (accessed on 19 March 2025). [CrossRef]
  76. CTDOT. Connecticut Department of Transportation 2022 Highway Transportation Asset Management Plan. Available online: https://portal.ct.gov/dot/-/media/dot/tam/transportation-asset-management-plan-fhwa-certified-9302022.pdf?rev=989262de6f41476f8365f271f293ec6f&hash=21AC54AF2CCA5CE106855062270548E9 (accessed on 30 September 2025).
  77. Berman, J.W.; Wartman, J.; Olsen, M.; Irish, J.L.; Miles, S.B.; Tanner, T.; Gurley, K.; Lowes, L.; Bostrom, A.; Dafni, J.; et al. Natural Hazards Reconnaissance With the NHERI RAPID Facility. Front. Built Environ. 2020, 6, 573067. [Google Scholar] [CrossRef]
  78. Wartman, J.; Berman, J.W.; Bostrom, A.; Miles, S.; Olsen, M.; Gurley, K.; Irish, J.; Lowes, L.; Tanner, T.; Dafni, J.; et al. Research Needs, Challenges, and Strategic Approaches for Natural Hazards and Disaster Reconnaissance. Front. Built Environ. 2020, 6, 573068. [Google Scholar] [CrossRef]
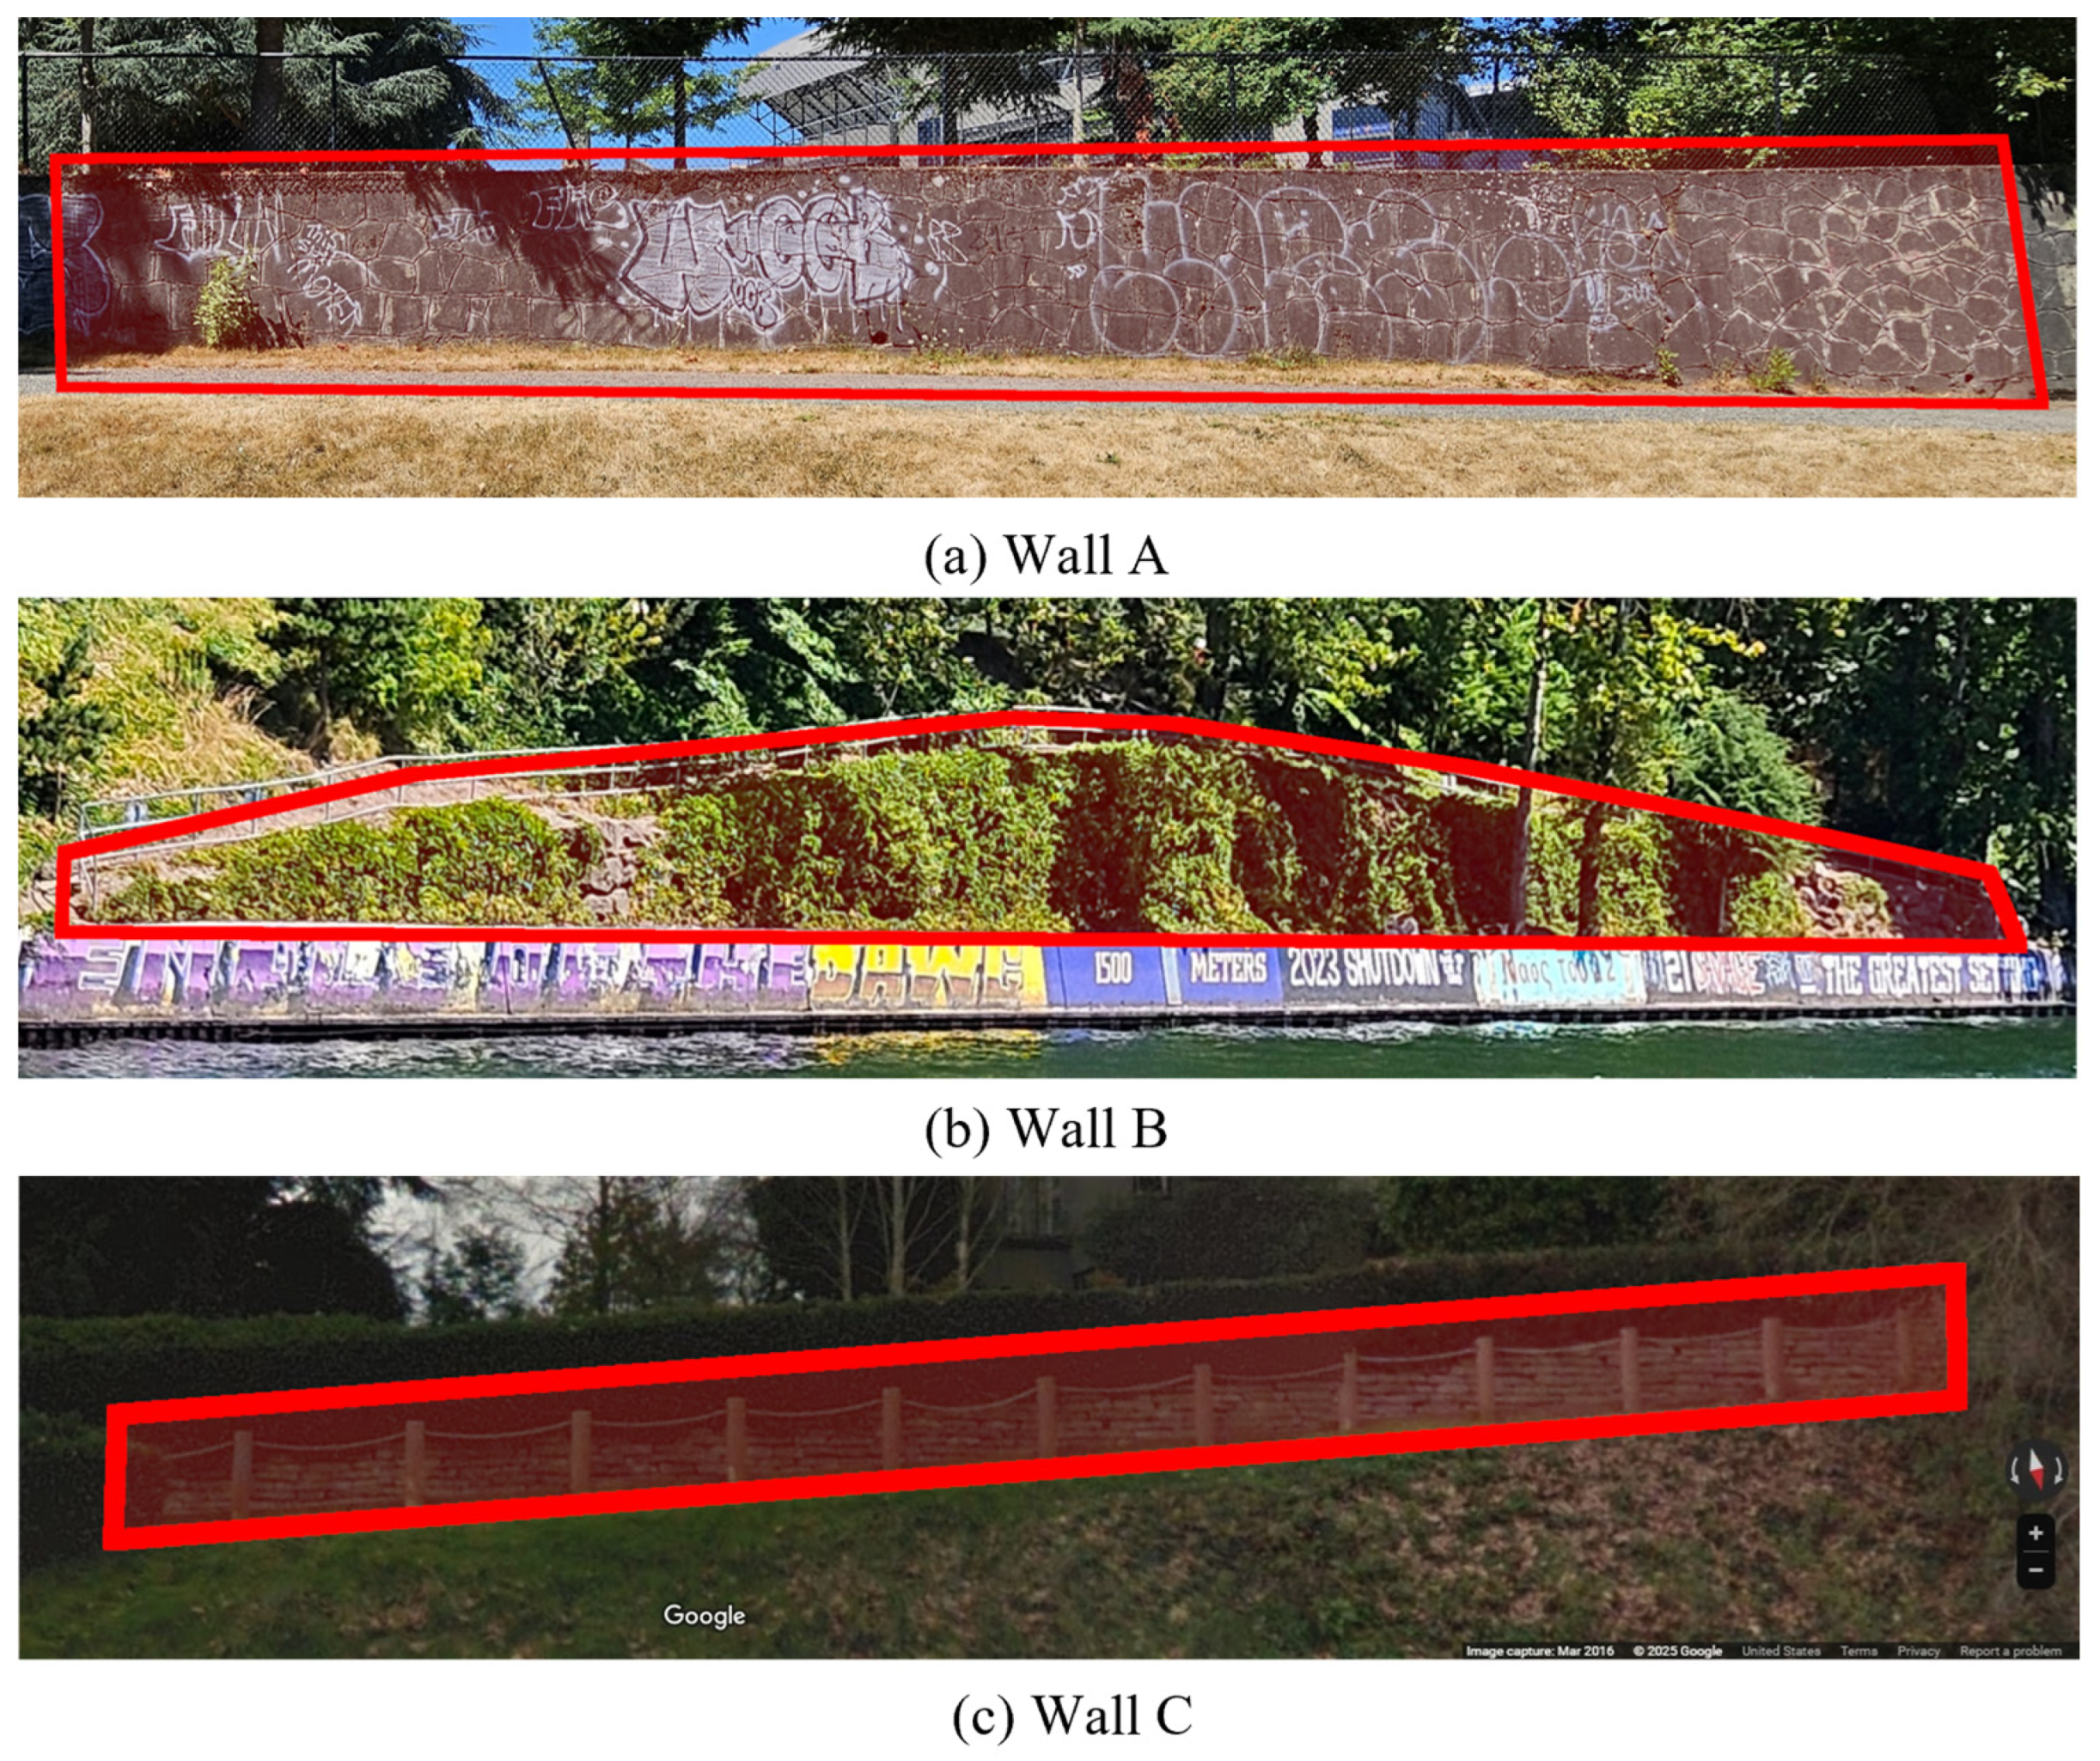
Figure 1. Study walls, highlighted in red: (a) textured concrete gravity wall, primarily exposed, (b) drystone masonry wall, above the painted revetment mostly concealed by ground cover and larger trees, (c) drystone masonry wall, decorative landscaping growing above.
Applsci 15 12008 g001
Figure 2. Site preparation: (a) Map of study site on eastern inlet of the Montlake Cut in Seattle, WA, (b) Sample on-structure target.
Applsci 15 12008 g002
Figure 3. Leica Nova TS16i.
Applsci 15 12008 g003
Figure 4. TLS Setup: (a) Leica ScanStation P50 (Leica, Wetzlar, Germany), (b) GS18T GNSS Rover (Leica, Wetzlar, Germany).
Applsci 15 12008 g004
Figure 5. Phoenix MiniRanger (Phoenix Lidar Systems, Austin, TX, USA) drone-lidar system mounted on Freefly Alta X UAS (Freefly Systems, Woodinville, WA, USA).
Applsci 15 12008 g005
Figure 6. Full Point Clouds—(a) P50, (b) MiniRanger.
Applsci 15 12008 g006
Figure 7. Wall A: Data Density—(a) P50, (b) MiniRanger.
Applsci 15 12008 g007
Figure 8. Wall B: Data Coverage—(a) P50, (b) MiniRanger.
Applsci 15 12008 g008
Figure 9. P50 Point Distribution (a) Wall A, (b) Wall B, (c) Wall C.
Applsci 15 12008 g009
Figure 10. MiniRanger Point Distribution (a) Wall A, (b) Wall B, (c) Wall C.
Applsci 15 12008 g010
Figure 11. Wall A: Georeferenced C2C Scalar Field.
Applsci 15 12008 g011
Figure 12. Wall B: Georeferenced C2C Scalar Field.
Applsci 15 12008 g012
Figure 13. Wall C: Georeferenced C2C Scalar Field.
Applsci 15 12008 g013
Figure 14. Sample View of Point Cloud Misalignment—green = P50, blue = MiniRanger.
Applsci 15 12008 g014
Figure 15. Wall A: Finely Registered C2C Scalar Field.
Applsci 15 12008 g015
Figure 16. Wall B: Finely Registered C2C Scalar Field.
Applsci 15 12008 g016
Figure 17. Wall C: Finely Registered C2C Scalar Field.
Applsci 15 12008 g017
Table 1. Drone-Lidar Flight Characteristics.
Flight CharacteristicMiniRanger
AverageMinMax
Survey flight altitude (AGL)80 m71 m113 m
Approximate survey flight speed6.81 m/s1.96 m/s9.30 m/s
Number of flight strips5
Orientation of flight stripsParallel
Lidar flight line overlap80%
Duration of flight4 min 50 s
Table 2. C2C Results Statistics.
WallRegistration MethodRMSE (cm)MAE (cm)SD (cm)Skewness
AGeoreferenced3.883.282.080.72
Finely Registered2.331.751.541.52
BGeoreferenced28.323.415.92.65
Finely Registered24.217.117.22.72
CGeoreferenced6.245.173.500.77
Finely Registered3.632.782.332.11
Table 3. Pros and Cons of Drone-lidar and TLS for Retaining Wall Inspection.
ProsCons
Drone-lidar
  • Efficient data collection for sites with multiple structures
  • Improved safety for technicians
  • Minimized disruptions to motorists
  • Ability to operate around ground-based occlusions
  • Reliability
  • Drone limitations: airspace, wind, visibility, operation over pedestrians
  • Lower potential accuracy and data density
  • Challenges penetrating dense tree canopies
  • Increased planning and data processing time
Terrestrial lidar (TLS)
  • Higher potential accuracy and data density
  • Ability to operate underneath dense tree canopies
  • Reliability
  • Lower equipment cost for comparable accuracy
  • Inefficient for large sites with many structures
  • Need for multiple scan locations on sites with ground-based occlusions
  • Challenges on sites with dense vehicle and pedestrian traffic
Disclaimer/Publisher’s Note: The statements, opinions and data contained in all publications are solely those of the individual author(s) and contributor(s) and not of MDPI and/or the editor(s). MDPI and/or the editor(s) disclaim responsibility for any injury to people or property resulting from any ideas, methods, instructions or products referred to in the content.