Article

Automatic Fruit Grading System with High Adaptability Using Machine Learning Method

1
School of Digital Art Industry, Hubei University of Technology, Wuhan 430068, China
2
Hubei Key Laboratory of Modern Manufacturing Qualtity Engineering, School of Mechanical Engineering, Hubei University of Technology, Wuhan 430068, China
*
Author to whom correspondence should be addressed.
Appl. Sci. 2025, 15(22), 11866; https://doi.org/10.3390/app152211866
Submission received: 30 August 2025 / Revised: 23 October 2025 / Accepted: 24 October 2025 / Published: 7 November 2025

Abstract

Fruit quality plays an important role in the agricultural economy. However, low efficiency and inaccurate detection in manual fruit grading has led to reduced fruit quality assurance. To solve these problems, an automatic fruit grading system for several kinds of fruits based on ML is proposed. In this research, four kinds of fruit are rapidly divided into three grades, depending on this automatic fruit grading system, through three steps. Firstly, the features with a large impact on fruit grading are extracted from fruit—the texture, shape, color, size, and defects. Then, the extracted fruit features are input into a Random Forest algorithm to train the fruit grading model. Finally, the grades of four kinds of fruit are predicted by this fruit grading model. The dataset contained 666 images from Kaggle of purchased fruit, including 270 images of apples, 170 images of pomegranates, 114 images of oranges, and 112 images of loquats. A 70% training set and 30% testing set split was used, and a ten-fold cross-validation (ten-fold CV) strategy was employed to evaluate the model. The experimental results show that the RF algorithm demonstrates the best stability and accuracy in classifying the four types of fruit, with accuracies of 98.6%, 95.3%, 98.1%, and 99.1% for apples, loquats, pomegranates, and oranges, respectively. Compared with other ML methods, RF performed the best in the multi-fruit classification task.

1. Introduction

In recent years, under the background of the rapid development of modern agriculture, the Chinese fruit industry has achieved subtle development, and fruit has become an important branch of its agricultural development structure. At the same time, with the increasing consumption levels of residents, there is a high demand among consumers for the quality, safety, and diversity of fruits.
Traditionally, manual fruit grading has been used, which has low speed, low accuracy, and significant subjective influence. With the rapid development of the industry, machine vision technology has become widely used in fruit grading systems due to its many advantages such as high accuracy, fast speed, and unified standards.
Generally, machine vision-based fruit grading is only for one or similar fruits, and traditional methods cannot apply the classification requirements of multiple fruit types at the same time over a wide variety of fruits. Maintaining good performance stability for grading a variety of fruits has become a challenge.
Machine learning is the most traditional classification method. Many scholars have conducted research on this application aspect, and using ML methods to classify fruits based on multiple features has become a research direction [1]. For example, a grading system based on machine vision was developed using the texture, color, and shape characteristics of cashew nuts [2]. Color features, shape and size features, texture features, defects, and wrinkles have been used to classify jujubes. Then, the most useful features are selected using feature selection algorithms, such as PCA and CFS. A decision tree is used for grading to achieve better prediction results [3]. The time series is integrated into RF, and the prediction model for apple fruit yield is established. It has a certain value for plantations [4]. By combining Fourier transform Raman spectroscopy with ML algorithms, it has good practicality in the evaluation of fruit spirits’ trademark fingerprints [5]. Similarly, multiple ML methods are used for comparison for the same type of fruit. Four common ML methods were used to grade mangoes. It was found that FANN performs the best [6]. These features of fruits are often utilized as an important basis for evaluating the grade of fruits. The grading of fruits by extracting various features of fruits has been completed, such as texture features, color features, and defect features [7,8,9,10,11,12]. There may be a correlation between different features. Too many features will result in feature redundancy, which will affect fruit grading. In order to increase the accuracy of fruit grading, an improved grading algorithm or fruit evaluation can be adopted [13,14,15,16]. Two-dimensional images of fruits have limitations when used for 3D fruit grading. Therefore, 3D reconstruction technology is applied to build a fruit grading model, which helps complete the comprehensive detection of fruits [17]. However, in the face of rapid detection of a large number of fruits, this 3D reconstruction technology has poor real-time performance. Not only that, the bionic detection technology of fruit has emerged, relying on smell [18]. However, the cost of this technology is too high to be suitable for widespread use.
In view of the lack of field data, transfer learning will be a better choice to improve the model grading effect. For example, a new prediction modeling method based on the concept of transfer learning was proposed to effectively predict the impact of environmental factors on blueberry yield [19]. A pre-training network based on transfer learning is used to classify and grade tomato maturity according to color (red, green, yellow) to meet the requirements of high performance and accuracy and reduce costs [20]. By using various deep learning models to grade fruits, it was found that the performance of applying stack ensemble deep learning methods is better [21]. Based on size, color, shape, and surface defect characteristics, a deep learning framework was used to detect and grade apples in the field, meeting classification accuracy [9]. The dataset containing eight different categories of date palm fruit was created to train the proposed model. It was found that this model outperformed all other models in terms of accuracy [22].
However, basic devices often cannot meet the hardware configuration requirements of deep learning. The complexity of the method based on ML is significantly reduced, and the requirements for the equipment are easy to satisfy.
In order to improve the efficiency of fruit detection and increase the adaptability of the fruit grading system, a model based on RF is employed to divide fruits into three grades according to different features of diverse fruits. Firstly, the texture feature of fruit is extracted by entropy, energy, contrast, and uniformity in grayscale images. The fruit is separated from the background by dual-threshold segmentation, and the size feature of the fruit is extracted by its total pixel area. Secondly, the Sobel operator is used to obtain the edge contour of the fruit, and the shape feature of the fruit is extracted by comparing the total pixel area of the minimum circumscribed circle of the fruit edge contour with the total pixel area of the fruit. Then, the HSI (hue saturation intensity) color model is utilized to decompose the fruit image, and the color feature of the fruit is extracted according to the obtained fruit component image of the hue and saturation. Finally, the defect part of the fruit is separated by the Otsu threshold, and the defect feature of the fruit is extracted by the proportion of the total pixel area of the defect part in the total pixel area of the fruit. The fruit feature vector is input into the grading model constructed by RF for training. When grading multiple fruits using other ML methods for comparison, Random Forest exhibited excellent performance and stability in multi-fruit grading. Therefore, RF can be used for hierarchical predictions for lots of fruits.
The paper is arranged in three parts: Materials and Methods, Experimental Results, and Discussion and Conclusions. Section 2 contains an introduction to the fruit collection process, fruit feature extraction methods, and experimental equipment. In Section 3, the feature types and classification results are displayed graphically and tabularly. In Section 4, the paper is concluded, and the advantages and disadvantages of this article’s method are analyzed. Finally, the possible application scenarios and future plans are discussed.

2. Materials and Methods

2.1. Materials

One part of the experimental material is directly obtained from Kaggle (url: https://www.kaggle.com/datasets/moltean/fruits, accessed on 20 July 2025), which contains photos of apples and pomegranates, and the other part is collected by purchased fruits. The total dataset contains 666 pictures of fruits. In each case, 70% of the sample set was selected as the training set, and 30% of the sample set was selected as the test set. The fruit grading system is shown in Figure 1a. The fruit is detected by station 1 and 2. The industrial camera used to obtain images with 5 million pixels is located 15 cm above the fruit. The image information of the fruit was captured from both the upper and lower directions. A ring light source located 5 cm below the camera was used to illuminate the fruit.
During the experiment, fruits were placed at various angles to ensure data diversity and representativeness. Different placements, such as front, side, and inclined angles, were used to better simulate real-world fruit grading, enhancing the model’s adaptability and accuracy. The image processing environment was Matlab2017b on the Window10 system. The equipment composition and detection system of this experiment are shown in Figure 1b. The fruits detected in station 2 were pushed to the conveyor belt by the motor and were sorted by the motor on the conveyor belt below.
The obtained fruit photos were screened, and the fruit pictures covering various grades were selected. Then, according to the type of the fruit and corresponding image processing methods, the relevant characteristic data of the fruit were extracted. Finally, the abnormal data were reviewed and processed to ensure the quality of the data.
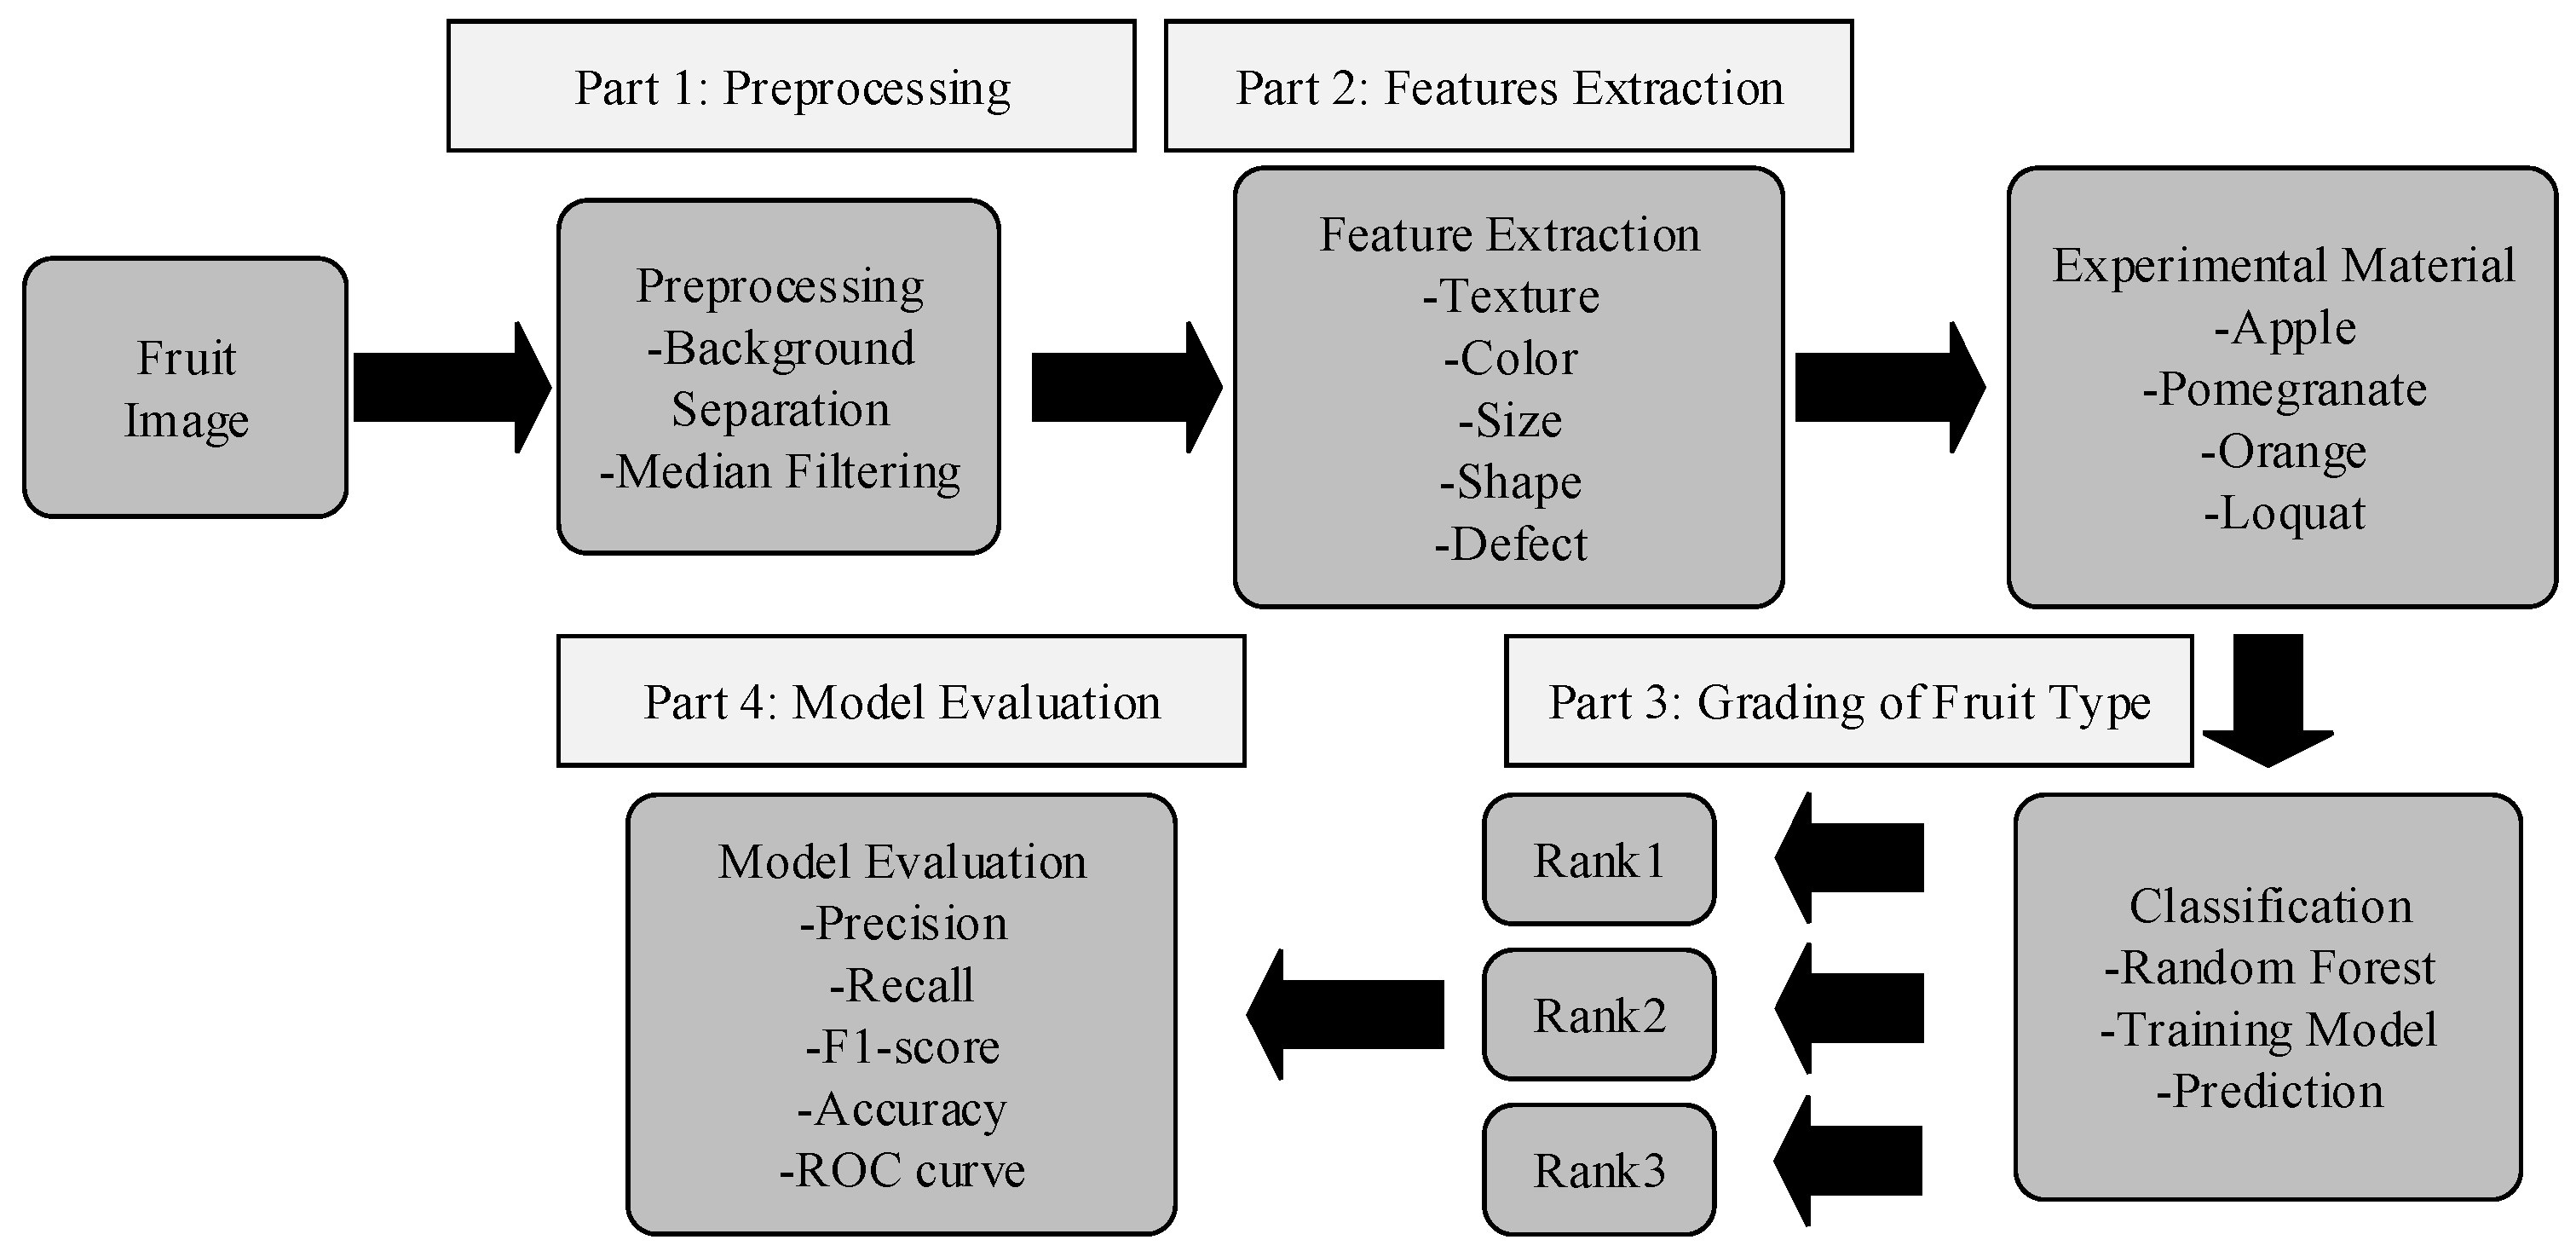
The objects in the experiment were pomegranates, loquats, apples, and oranges. The corresponding numbers of fruit sample sets were 270, 112, 170, and 114. The fruit grading process is shown in Figure 2. The overall process can be roughly divided into preprocessing, feature extraction, classification, and evaluation.

2.2. Methodology

(i)
Pretreatment: Since the collected images are susceptible to noise interference, a median filter is used to remove the image noise. The median of the pixel set around the filtered point is taken as the pixel of the point in this approach. The filtered images are converted from RGB to HSI color space. The threshold suitable for target region segmentation is selected for segmentation, which is prepared for subsequent feature extraction. The collected loquat images were decomposed by RGB color, and the red, green, and blue components are shown in Figure 3.
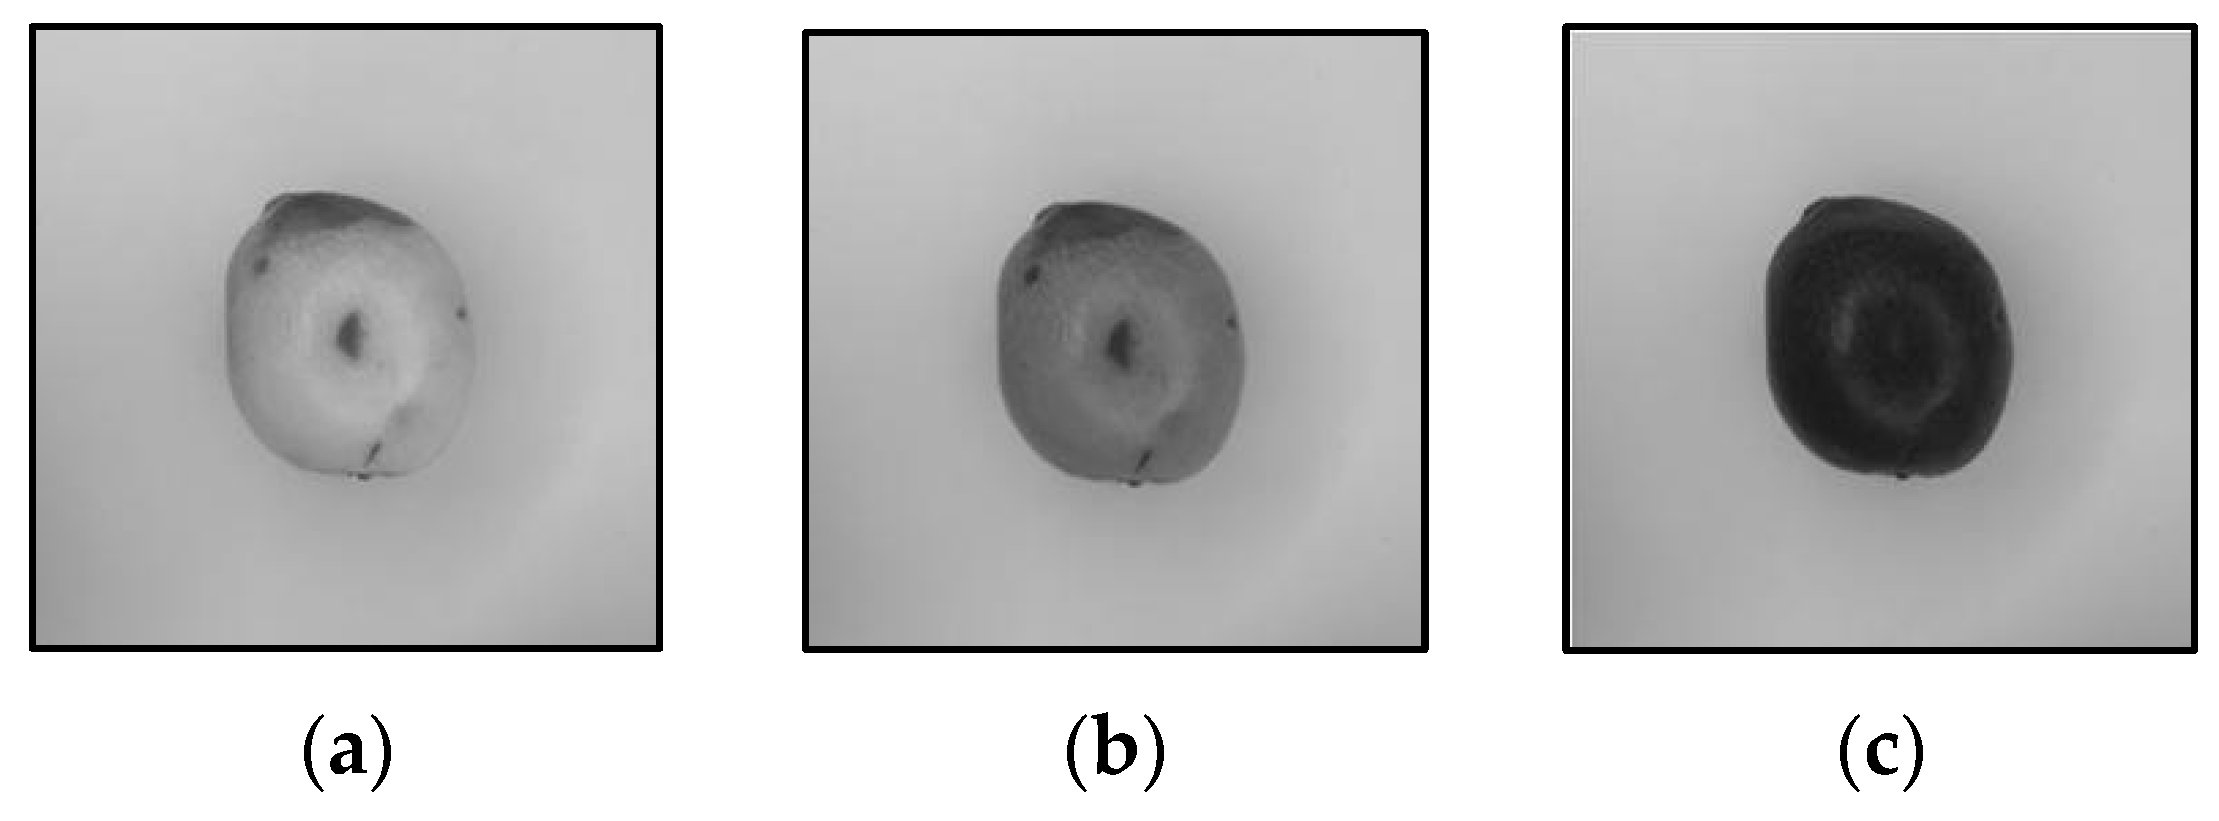
Figure 3. Loquat RGB color components: (a) red component; (b) green component; (c) blue component.
Applsci 15 11866 g003
Because the main color of loquat is yellow, the red, green, and blue components in the RGB color space are 255, 255, and 0, respectively. It can be seen that the color difference between the blue component and background is more obvious, which can be used as a background separation template. The threshold of the B component is obtained by T = Graythresh (B) in Matlab. The threshold calculation function is
b w ( i , j ) = 0 , f ( i , j ) < T 1 , f ( i , j ) T
In the formula, bw (i, j) is the pixel of the binary image, and f (i, j) is the gray value at the index coordinate (i, j). i is the abscissa of the pixel index position, and j is the ordinate of the pixel index position. The binary image is used as a mask, and then the original image is separated from the background by multiplication. The pixel of the separated background is
f 1 ( i , j ) = f ( i , j ) × b w ( i , j )
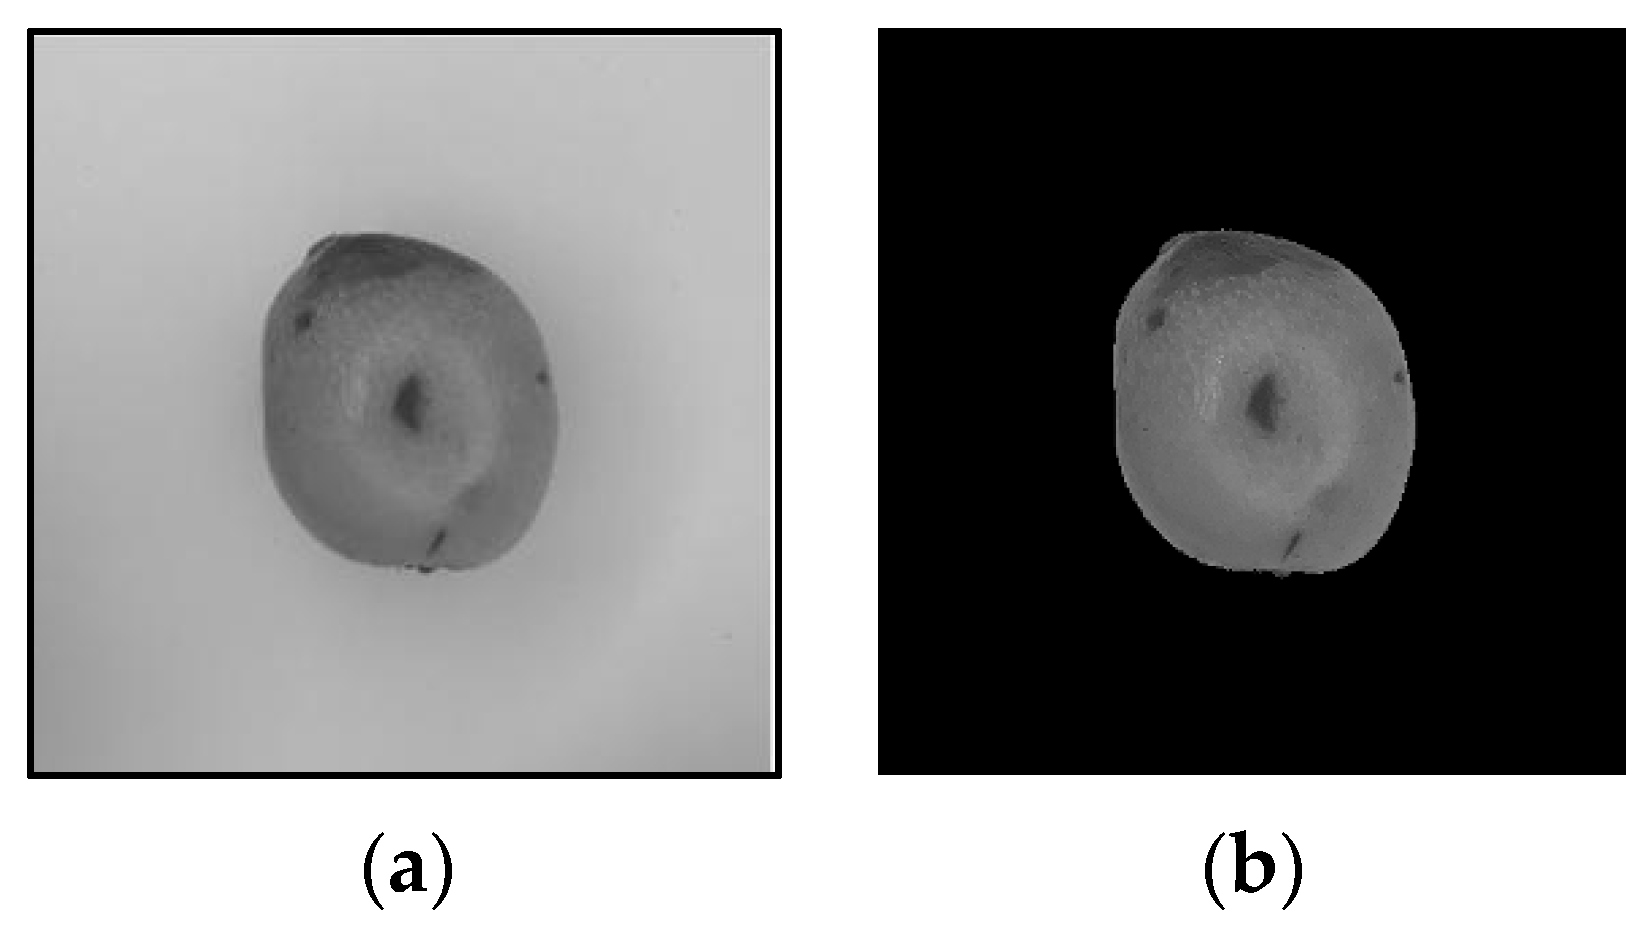
In the expression, f1 (i, j) is the pixel of the image separated by the background. The original image will be collected for gray processing; the gray image is shown in Figure 4a. The result of background separation is shown in Figure 4b.
(ii)
Feature extraction: Feature extraction is an important process of fruit grading, and the general feature types include texture, shape, size, color, and defects. The corresponding features are extracted according to the features of fruits, which is the most suitable way for the establishment of a grading model. The color, shape, and defect features of loquats can be extracted for loquat grading.
A texture feature is the spatial distribution of gray in an image. The evaluation indexes of texture features are
A S M = i = 1 N j = 1 N f ( i , j ) 2
C O R = [ i j ( i j ) 2 f ( i , j ) ]
E N T = i j f ( i , j ) log f ( i , j )
I D M = i j 1 1 + ( i j ) 2 f ( i , j )
A size feature is an indicator for evaluating the fruit volume. Because the camera can only collect the plane view of the fruit, the plane area of the fruit on the same scale can be used as the basis for judging the fruit volume according to the positive relationship between the fruit volume and the fruit plane area. The evaluation index of the fruit size features is
S F = i j f ( i , j )
Fruits of different shapes can be evaluated in different ways. For round fruit, the Sobel operator can be applied to extract the fruit contour. The circumscribed circle of the contour is utilized as the shape judgment index; the roundness of the fruit is evaluated by the ratio of the fruit area to the circumscribed circle of the fruit contour. The Sobel operator is an edge detection method combining Gaussian smoothing and derivatives. The Sobel template in the horizontal x and vertical y directions is
x = 1 0 1 2 0 2 1 0 1           y = 1 2 1 0 0 0 1 2 1
The image index is used to obtain all contour point coordinates, and the farthest Euler distance of the index coordinates on the contour is calculated as the diameter of the outer circle of the loquat contour. The farthest Euler distance is
d i s t = m a x ( x i x j ) 2 + ( y i y j ) 2
In the formula, dist is the distance between the farthest two points on the contour; xi, yi, and xi, yj are the coordinates of the points on the loquat contour.
The roundness evaluation index of the fruit is
c i r c l e = r s 2 r w 2 = S y / 4 π r L 2 / ( 4 π ) 2 = 4 π S y L 2
In the above formula, rs is the radius of the circle of the loquat contour. rw is the radius of the circumscribed circle of the loquat contour, and Sy is the total area pixel of the loquat. L is the perimeter of the circumscribed circle of the loquat boundary.
If the loquat contour is ideally a circle, rs is equal to rw and the value of the circle is 1 at this time. As shown in Figure 5a, the circumscribed circle of the extracted loquat contour is displayed in red.
As an important basis for evaluating fruit maturity, the color feature is commonly used as a key factor in fruit grading systems [23]. The main color of the loquat is yellow. An important indicator for evaluating the maturity of loquats is hue and saturation. The color feature of the loquat is extracted from the HSI color space. Compared with the RGB color model, the HSI color model has a higher anti-interference ability. The conversion from RGB to HSI color space is
H = arccos ( R G ) + ( R B ) / 2 ( R G ) 2 + ( R B ) ( G B ) 1 2 , R G 360 arccos ( R G ) + ( R B ) / 2 ( R G ) 2 + ( R B ) ( G B ) 1 2 , R > G
S = 1 3 ( R + G + B ) [ m i n ( R , G , B ) ]
I = ( R + G + B ) 3
The sum of hue (H)and saturation (S) was divided by the total area of the loquat to obtain the color characteristics of the loquat. The evaluation index of color characteristics is
a c = ( H + S ) 2 i S y j S y f ( i , j )
Defect features are the most important part of fruit grading systems [24]. The requirements for fruit quality have been formulated according to the proportion of fruit defects, and its industry standards are shown in Table 1.
Although the difference between the fruit and background is large in component B, the fruit defect is not obvious. Therefore, the grayscale image with the most obvious defect feature is selected for threshold processing to separate the fruit defects, and the defect feature is extracted according to the proportion of the total pixel area of the defect in the total pixel area of the fruit. The extraction of loquat defects is shown in Figure 5b.
The curved surface of the fruit results in uneven brightness of the fruit image. The dark part of the fruit image will be assumed to be a defect, resulting in an error. Therefore, the brightness uniformity of the fruit image must be ensured. Figure 3a shows the threshold, and the gray distribution histogram of the fruit was plotted. The threshold was selected according to the gray distribution histogram. After repeated tests, it was found that the defect feature of loquats is the most obvious when the threshold is 0.3. The evaluation index of defect characteristics is
d e f = i S q j S q f ( i , j ) i S y j S y f ( i , j )
In the formula, def is the proportion of the total pixel area of the defect in the total pixel area of the fruit, Sq is the total pixel area of the defect, and f (i, j) is a pixel of the fruit.
(iii)
Fruit grade marking: Firstly, the grades of the fruits are manually labeled with easy-to-distinguish characteristics. For similar fruits, they are graded in detail by referring to the characteristic data and artificial sensation. In the case of unified shooting parameters and height, a square of a known size is put under the lens to obtain its picture information. Then, the pixel size of the square according to the square picture information is calculated. Finally, the ratio of the actual area of the square and the pixel area is taken as the pixel to the actual scale bar under the condition of this parameter. Dual labeling was conducted, and the accuracy of annotations was ensured by combining manual labeling with sensory judgment.
(iv)
Model construction: RF is a highly flexible machine learning algorithm [25]. The basic unit of RF is a decision tree. Its basic idea is the inheritance learning approach. Randomness indicates that each decision tree extracts samples randomly, and the forest contains many decision trees. Despite inputting high-dimensional samples, Random Forest maintains strong grading performance without dimensionality reduction. The decision tree consists of three parts, namely the root node, leaf node, and internal node. The closer to the root node, the greater the impact on the grading results. After a large number of sample training runs, the critical parameters of each feature node grading are determined. The grading results are output at the leaf node.
In order to describe the uncertainty of information sources, the concept of information entropy is proposed. According to the positive correlation between the probability and possibility, the value of discrete random variable X is set to xi, and the probability of occurrence is pi. The evaluation index of information entropy H (X) of discrete sets is
H ( X ) = i = 1 p i log p i
The selection of root nodes from many features is based on the information gain. The information entropy of a sample set (D) is a certain value H(D) before grading. When a feature A is used to classify the dataset, the information entropy of the classified data subset is H (D|A). The evaluation index of feature A information gain is
g ( D , A ) = H ( D ) H ( D | A )
By comparing the information gain of each feature, the maximum information gain feature is selected as the root node. However, the limitation of information gain is that the selection of root nodes is easily influenced by the number of features.
In order to solve the limitation of information gain, the information gain rate is proposed. For a larger number of features A, its own entropy H (A) is larger. The ratio of the number of its entropy reduces the impact on the selection of root nodes. The evaluation index of the information gain rate is
g r ( D , A ) = g ( D , A ) H ( A )
In order to evaluate the misjudgment of a decision tree in grading, the Gini coefficient is proposed. The evaluation index of misjudgment is
G i n i ( p ) = k = 1 K p k ( 1 p k )
In the formula, pk is the probability of correctly classifying the sample set into k classes, and the probability of being misclassified is 1 − pk. There are K classes in the sample set and k is one of them. The greater the Gini coefficient, the higher the misjudgment rate.
In order to judge the decision tree more accurately, the weighted entropy of each leaf node is used for evaluation. The sum of the evaluation index of weighted entropy is
C ( T ) = t l e a f N t H ( t )
In the formula, Nt is the sample number of leaf nodes. The smaller the evaluation value C(T) is, the better the decision tree is. Since the sample set trained by each decision tree is always part of the total sample set, it will not produce overfitting.
In the total sample K, each sample has the same probability to be extracted. The randomly selected sample set K1 is input into the decision tree for training. When a sample is input into a RF, each decision tree predicts this sample, respectively. The grading with the most prediction results in the decision tree selected as the output grading of RF. Compared with a single decision tree, RF improves prediction accuracy and enhances generalization ability.
(v)
Evaluation: Since RF aims at bi-classification problems, the multi-classification problems need to be transformed into multiple bi-classifications. The actual and predicted grades of each fruit in the prediction set are counted. The confusion matrix is used to show the numerical distribution of various predictions. The evaluation index of the fruit grading model is
A C C = T P + T N T P + T N + F P + F N
P R E = T P T P + F P
R E C = T P T P + F N
F 1 = 2 · P R E × R E C P R E + R E C
(vi)
Experimental equipment: The parameters of the camera according to the manufacturer are as follows (Table 2):
The computer information used to process the image is as follows (Table 3):
In this paper, four ML methods will be used for fruit grading comparison, including SVM, KNN, LDA, and RF. RF is a classifier of data based on probability by combining multiple decision trees. SVM is a classifier of linear classifiers through performing the binary classification of data. KNN is a classifier of data by calculating the Euclidean distance. BAYES is a classifier of data by prior probability.

3. Experimental Results

There are 666 fruit pictures, and the sample sizes of apples, pomegranates, oranges, and loquats are 270, 170, 114, and 112, respectively. The ratio of training samples to predicted samples is about 7:3.
The characteristics selected for the four fruit types are shown in Table 4. Apples are characterized by texture, color, and size. Oranges are characterized by color and size. Pomegranates are characterized by color and defect characteristics. Loquats are characterized by color, size, and defects.
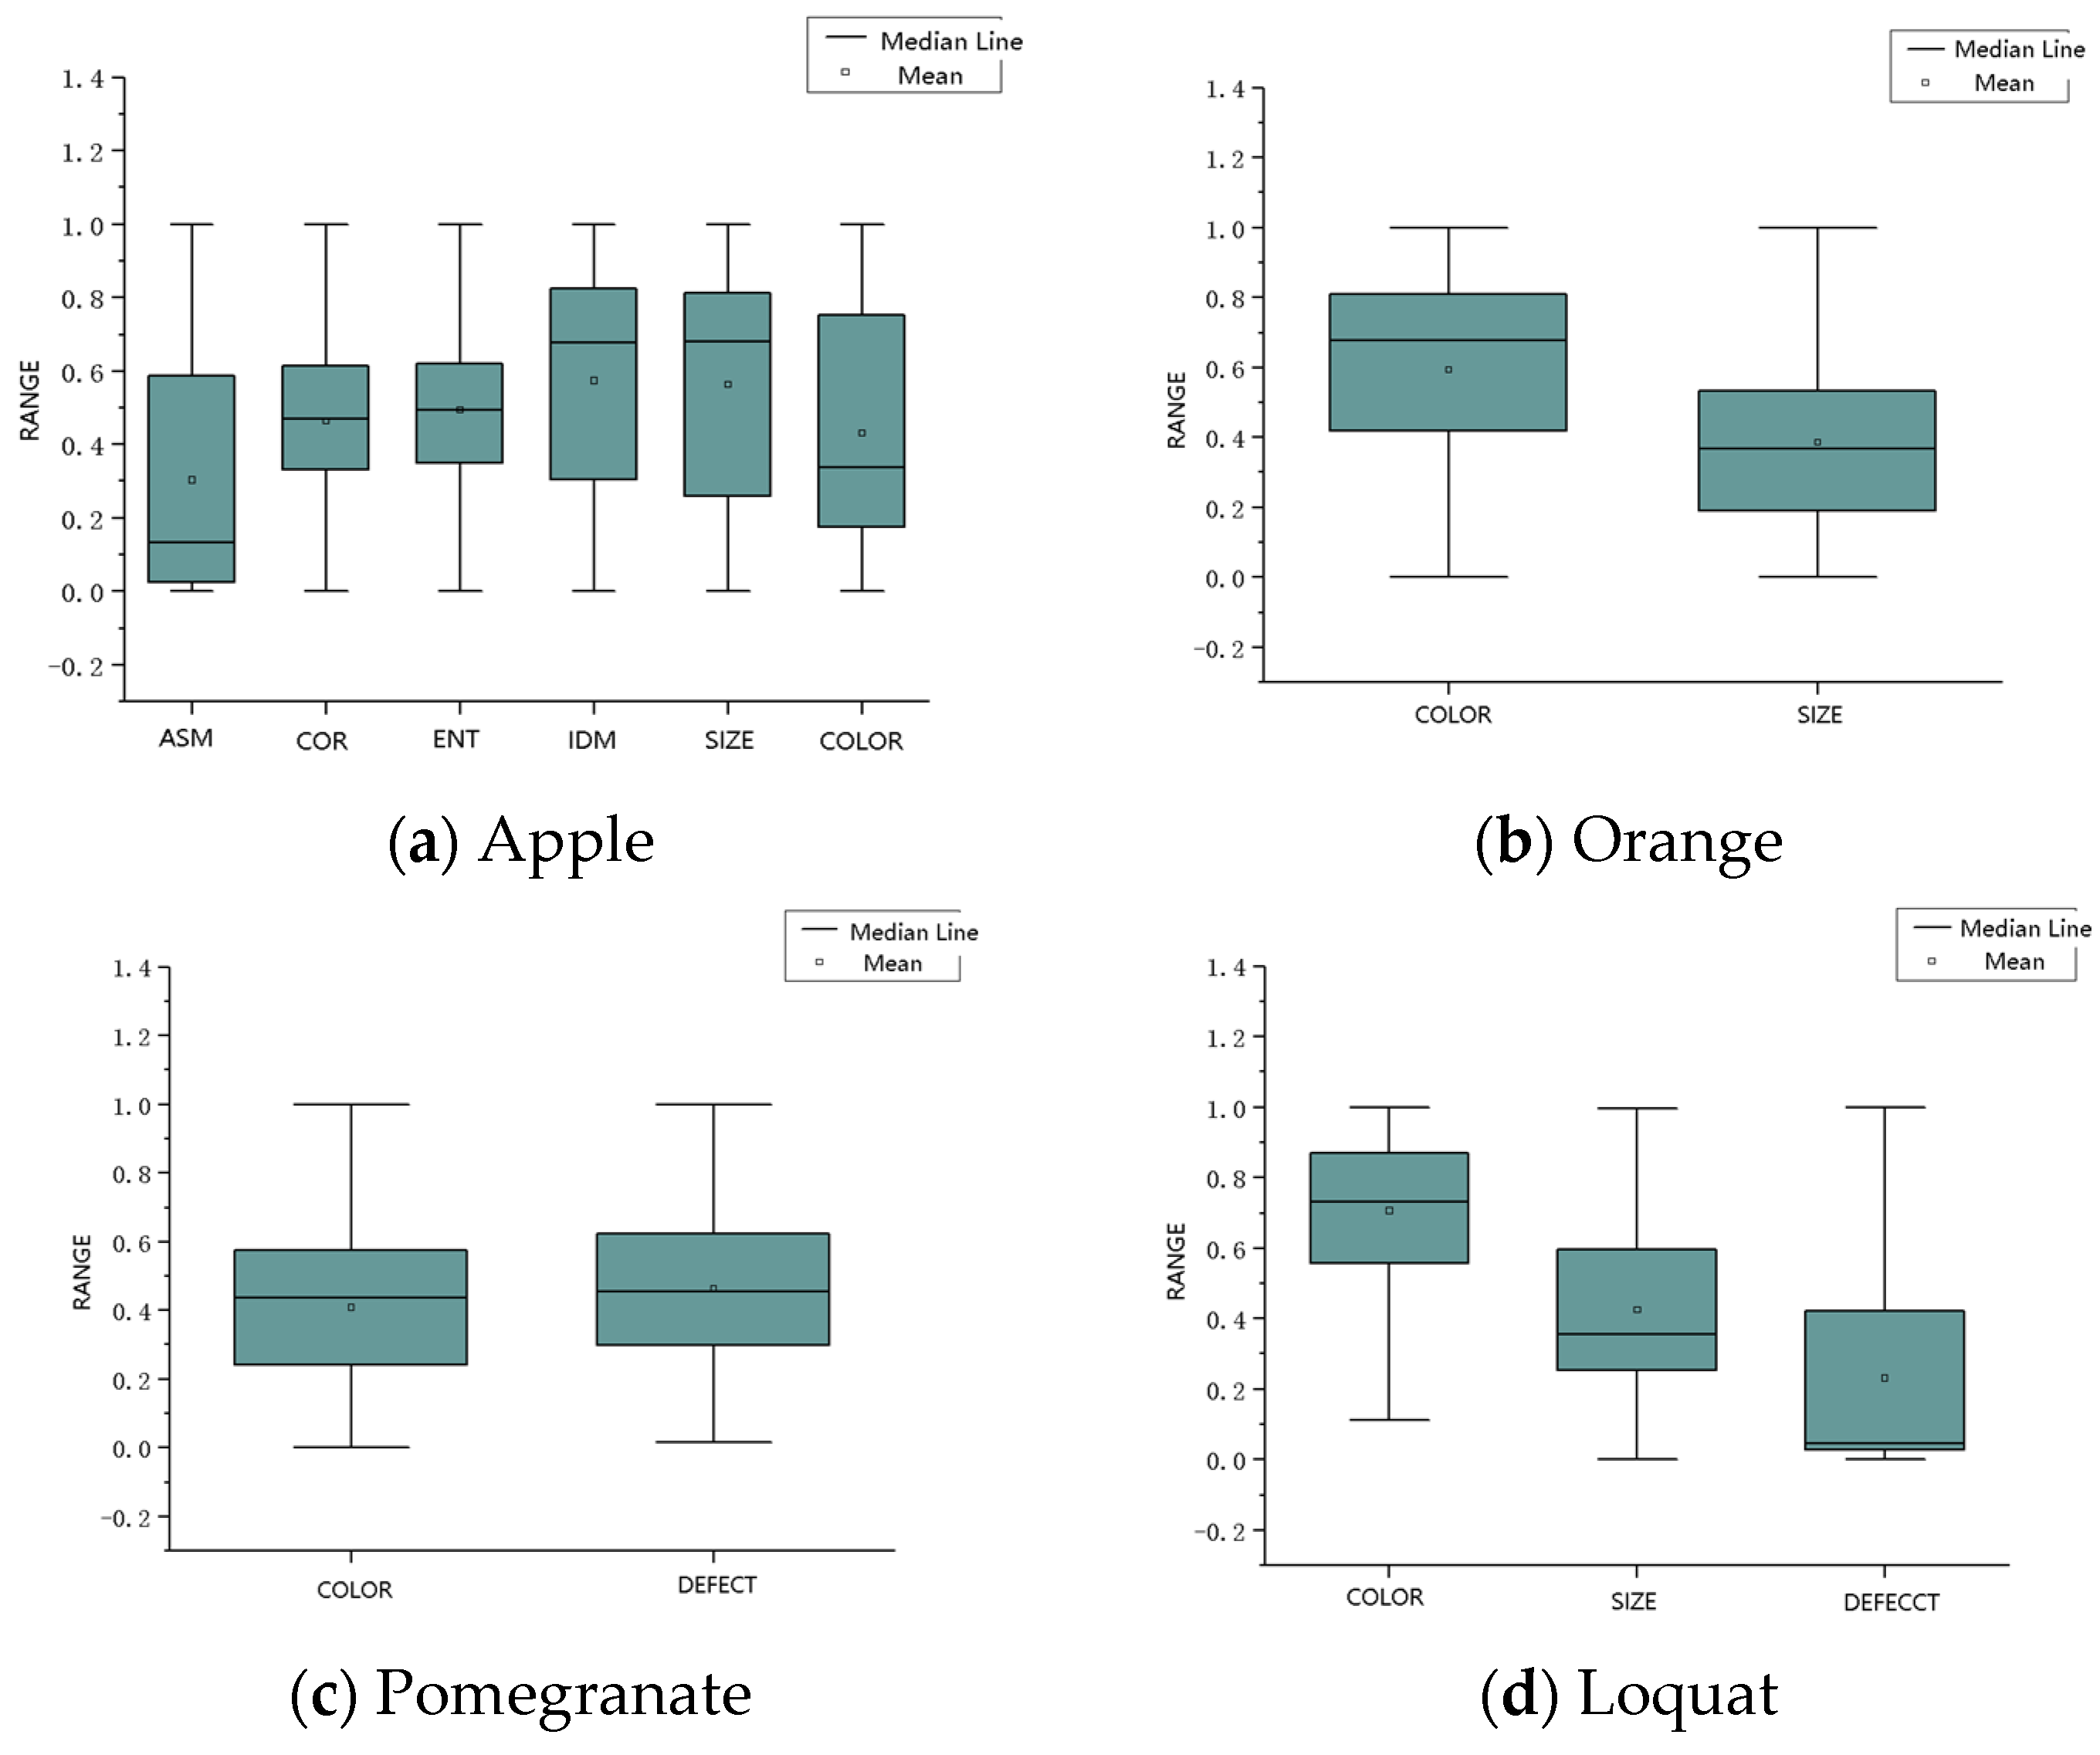
The feature boxplots for the four fruits are shown in Figure 6, and there are a few outliers in some features.
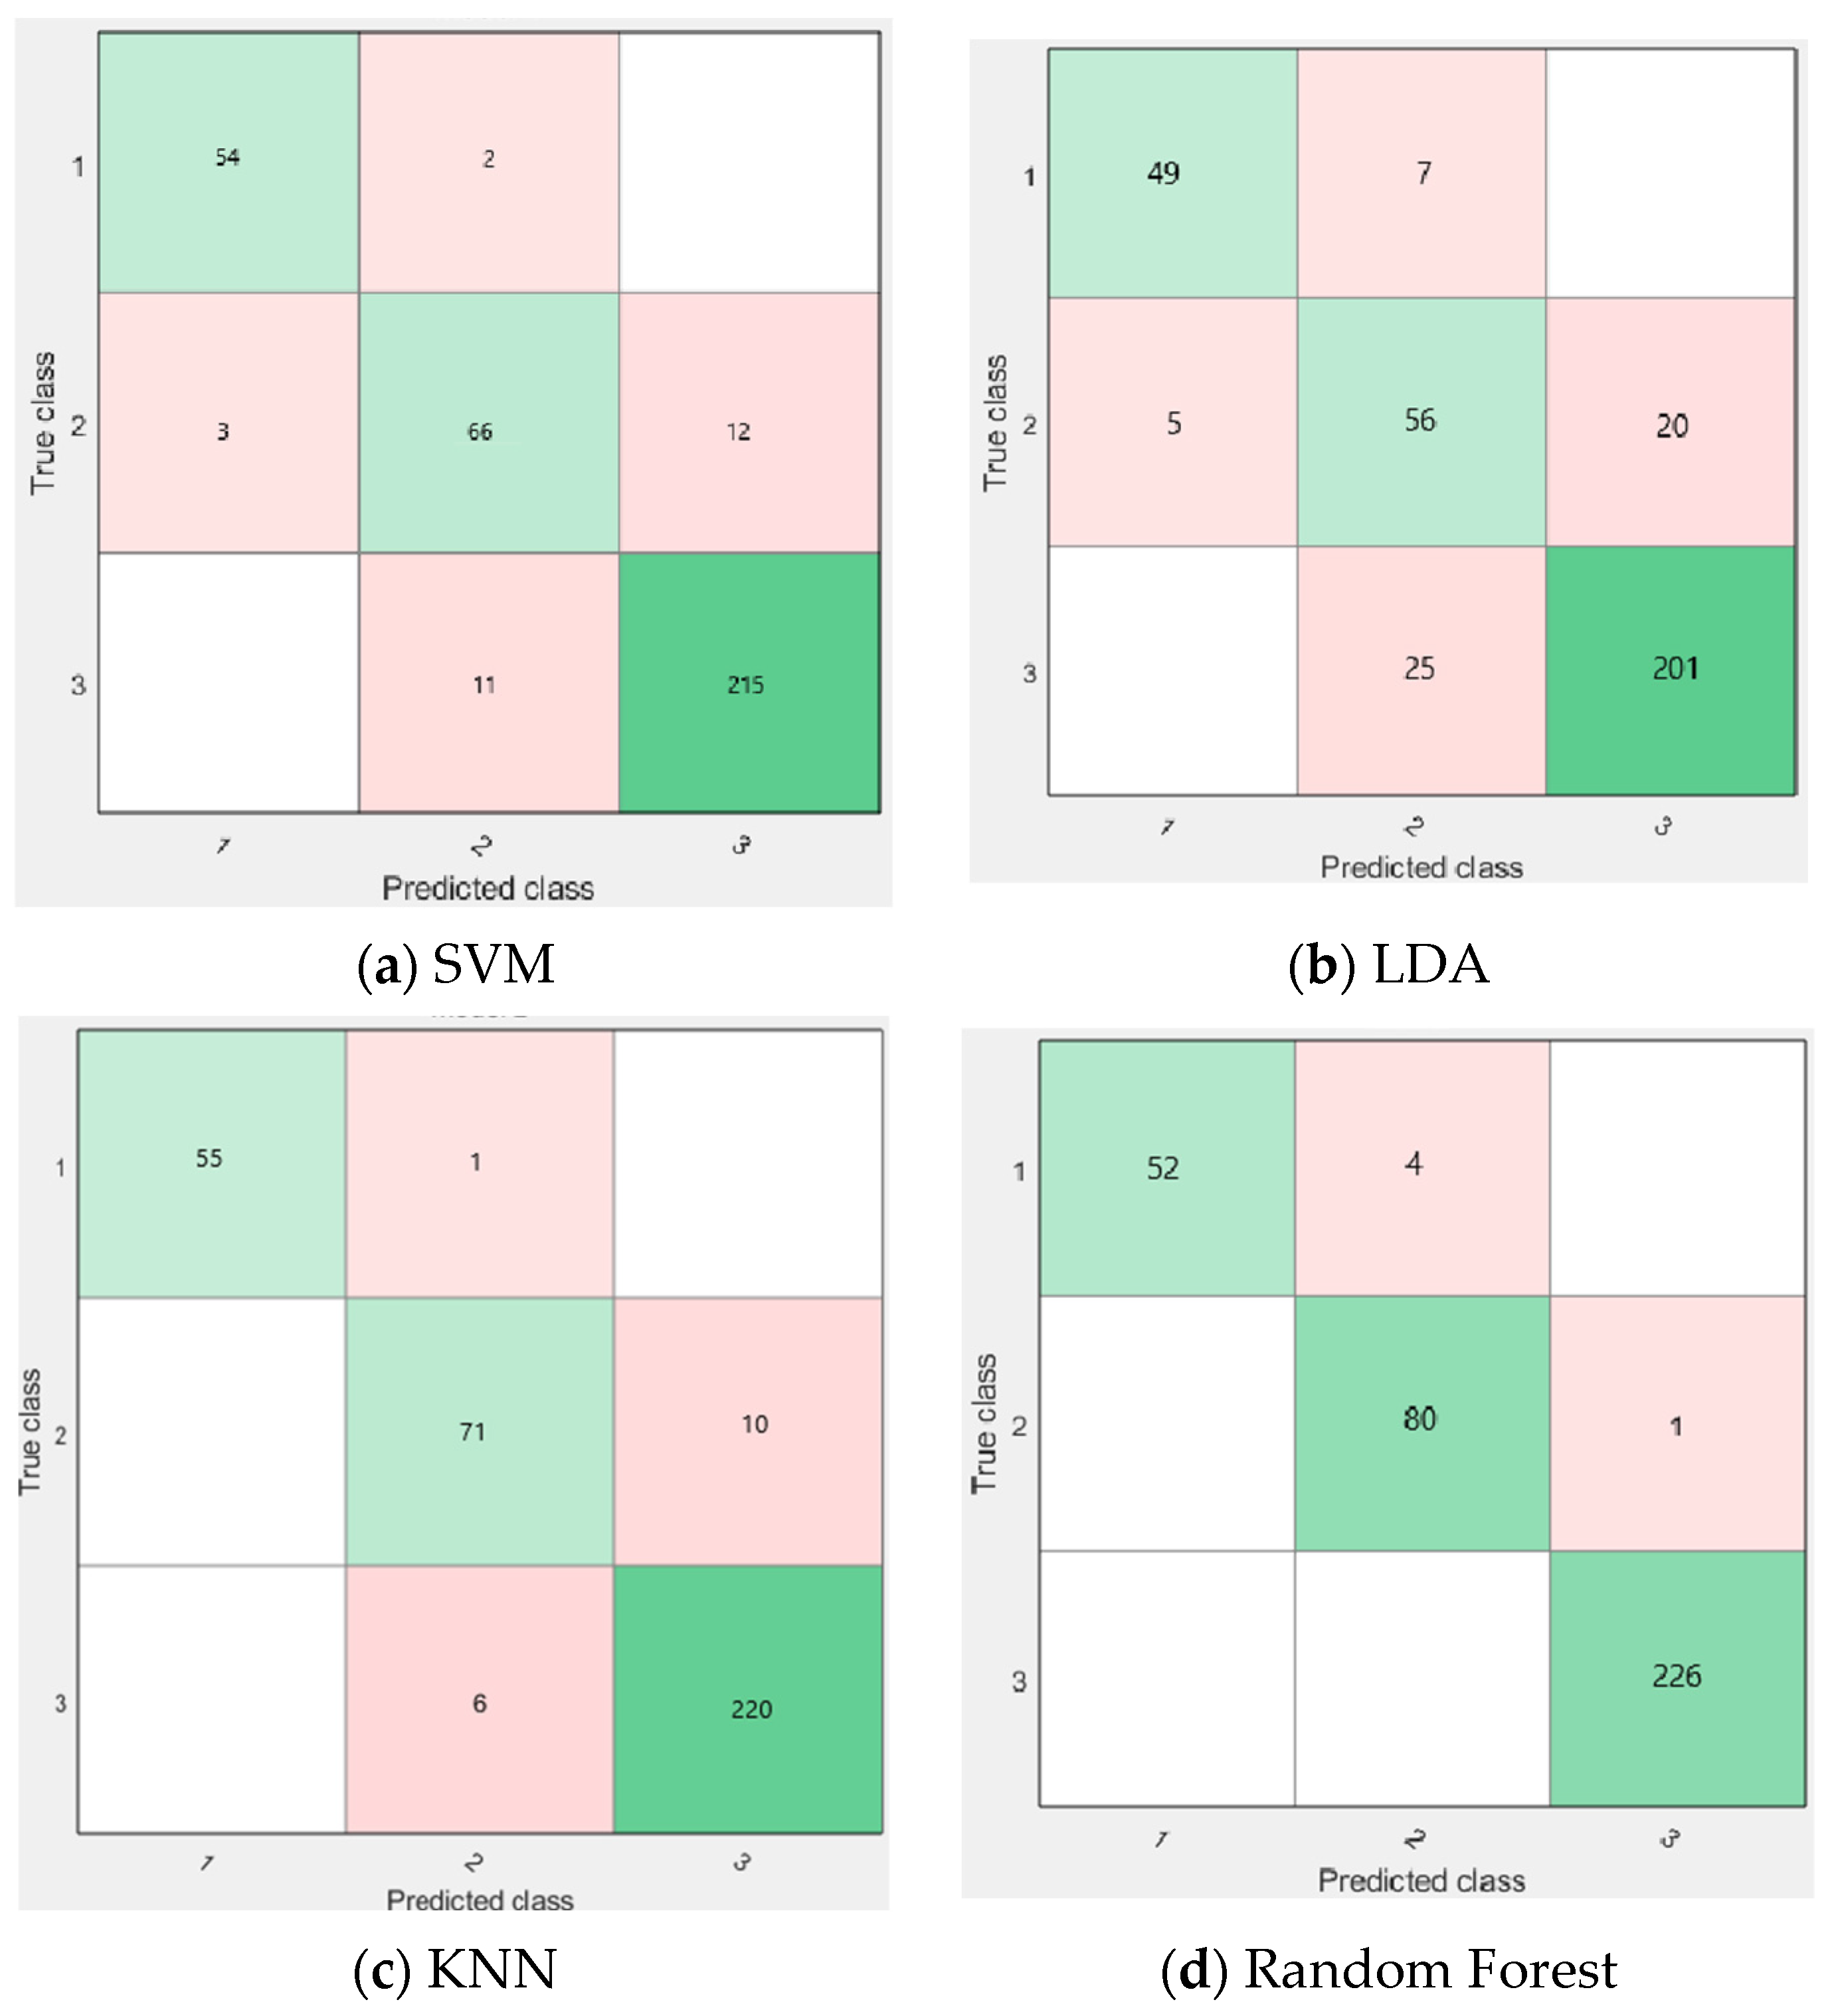
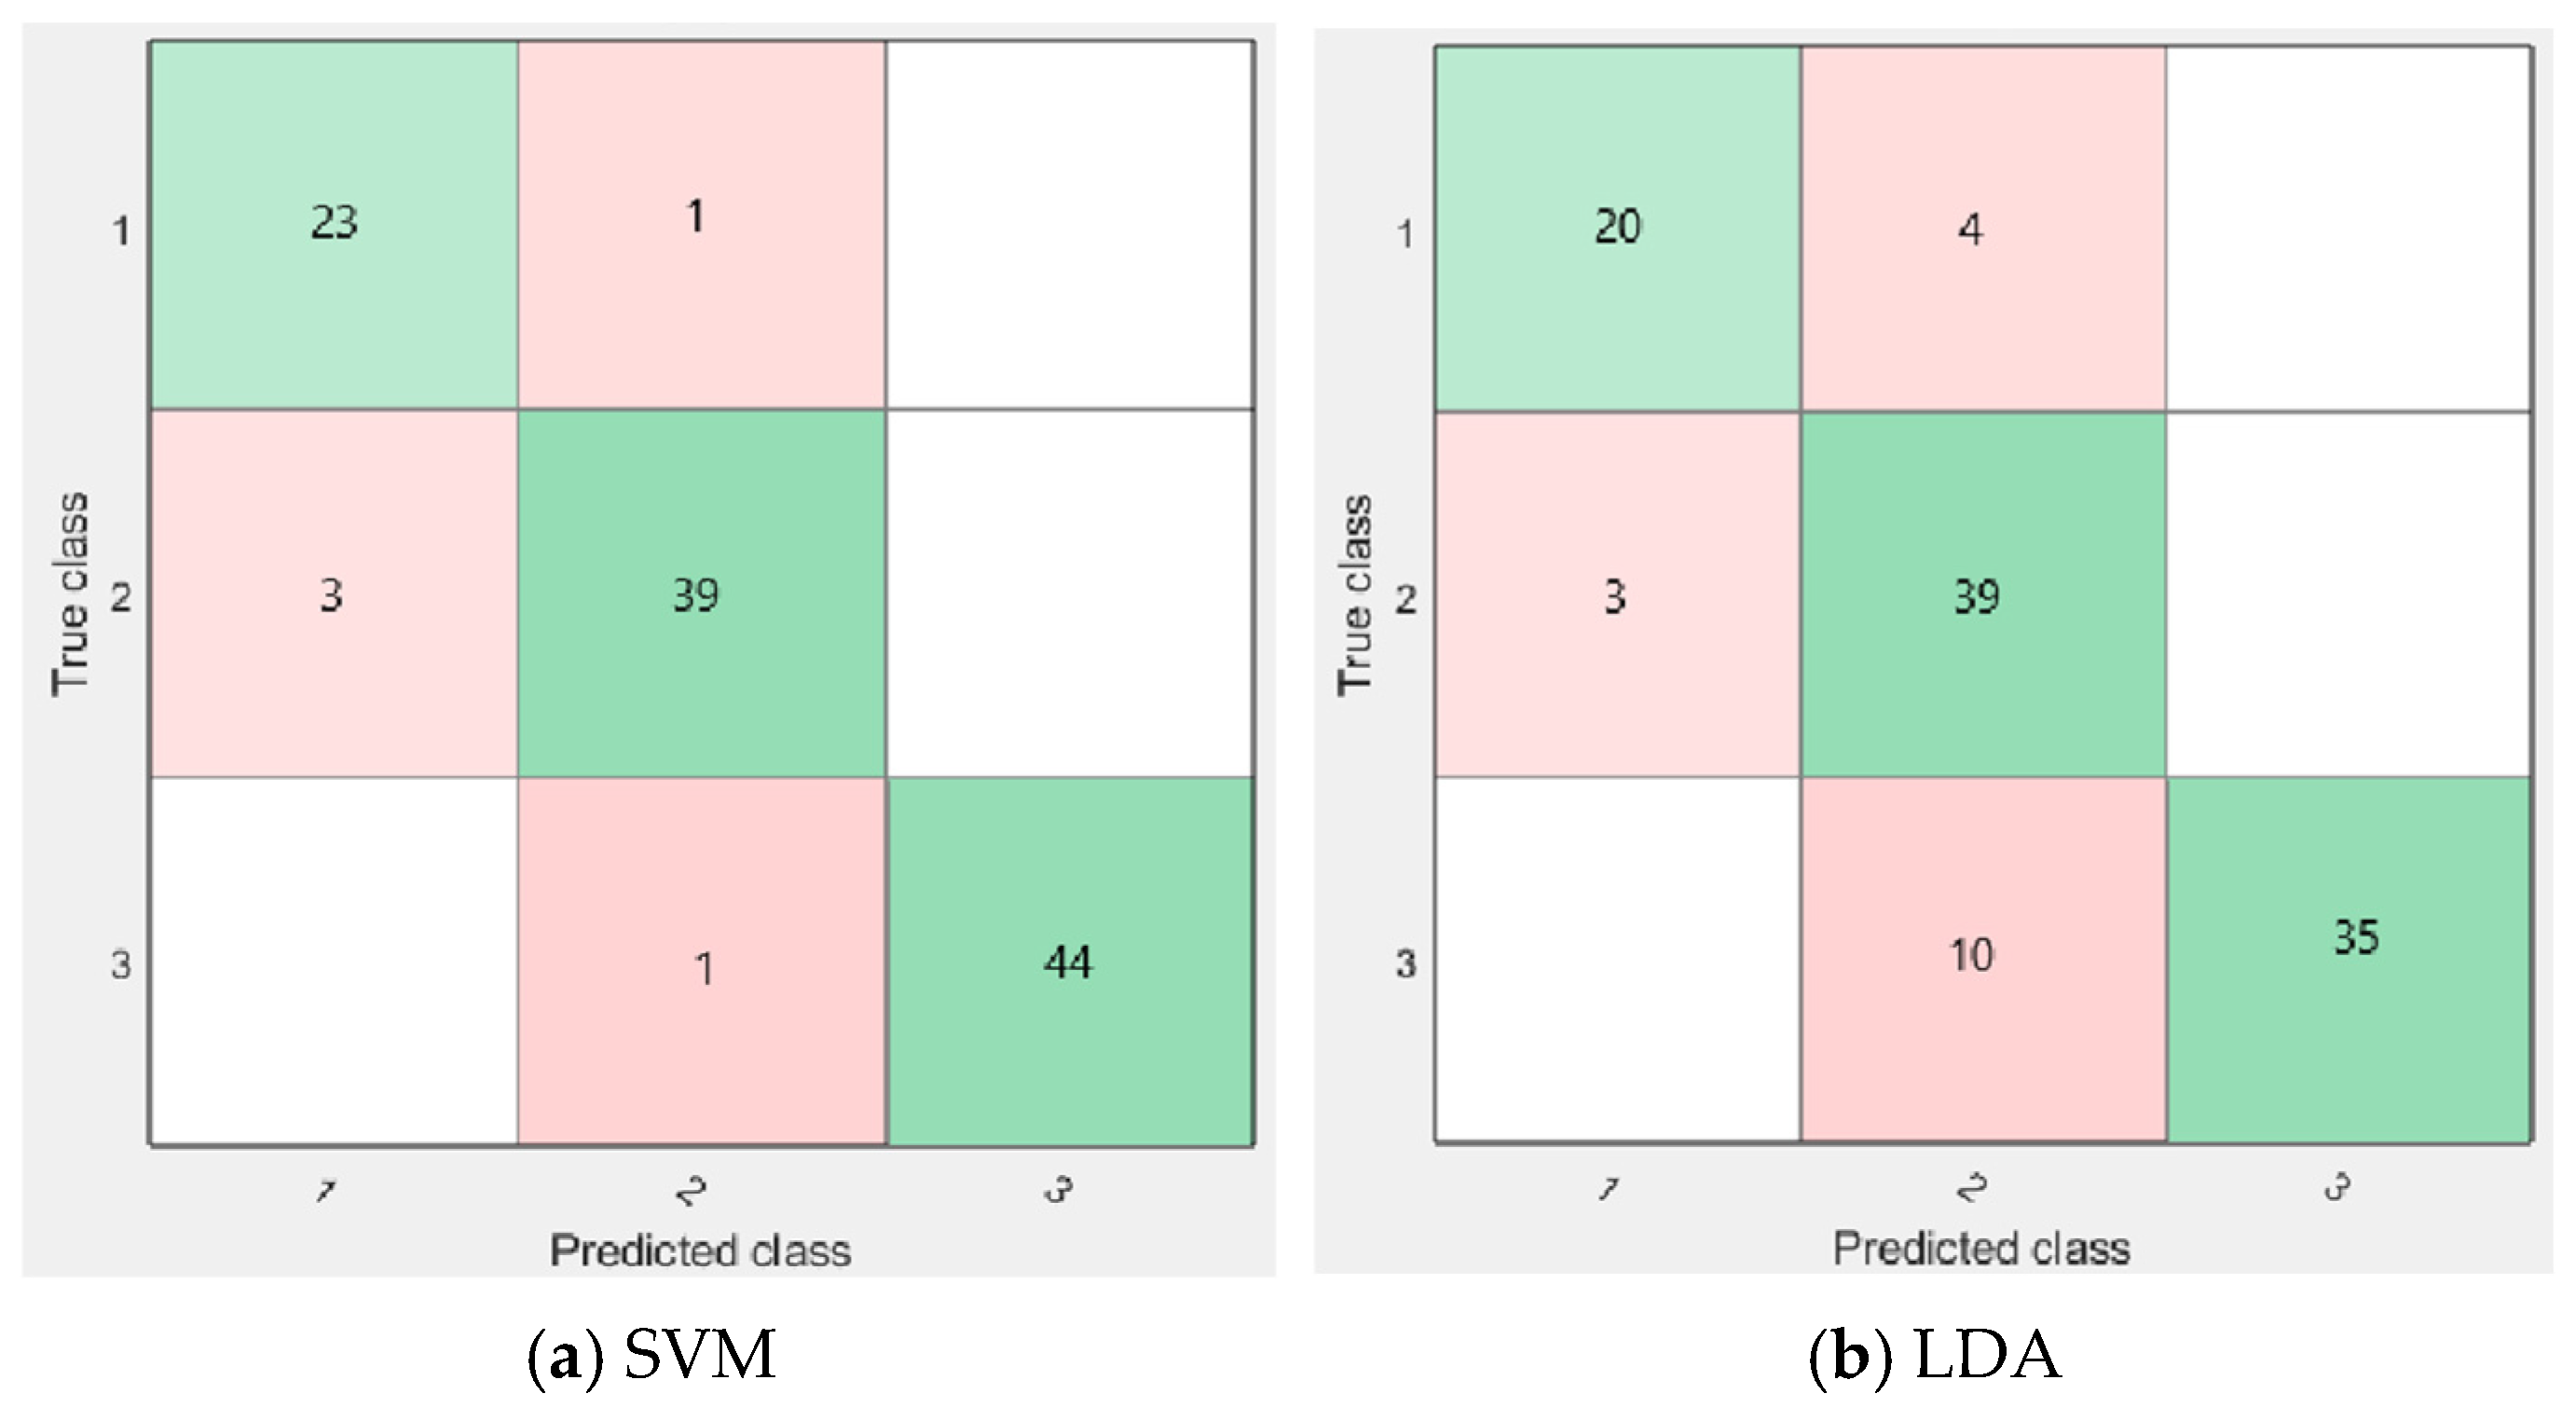
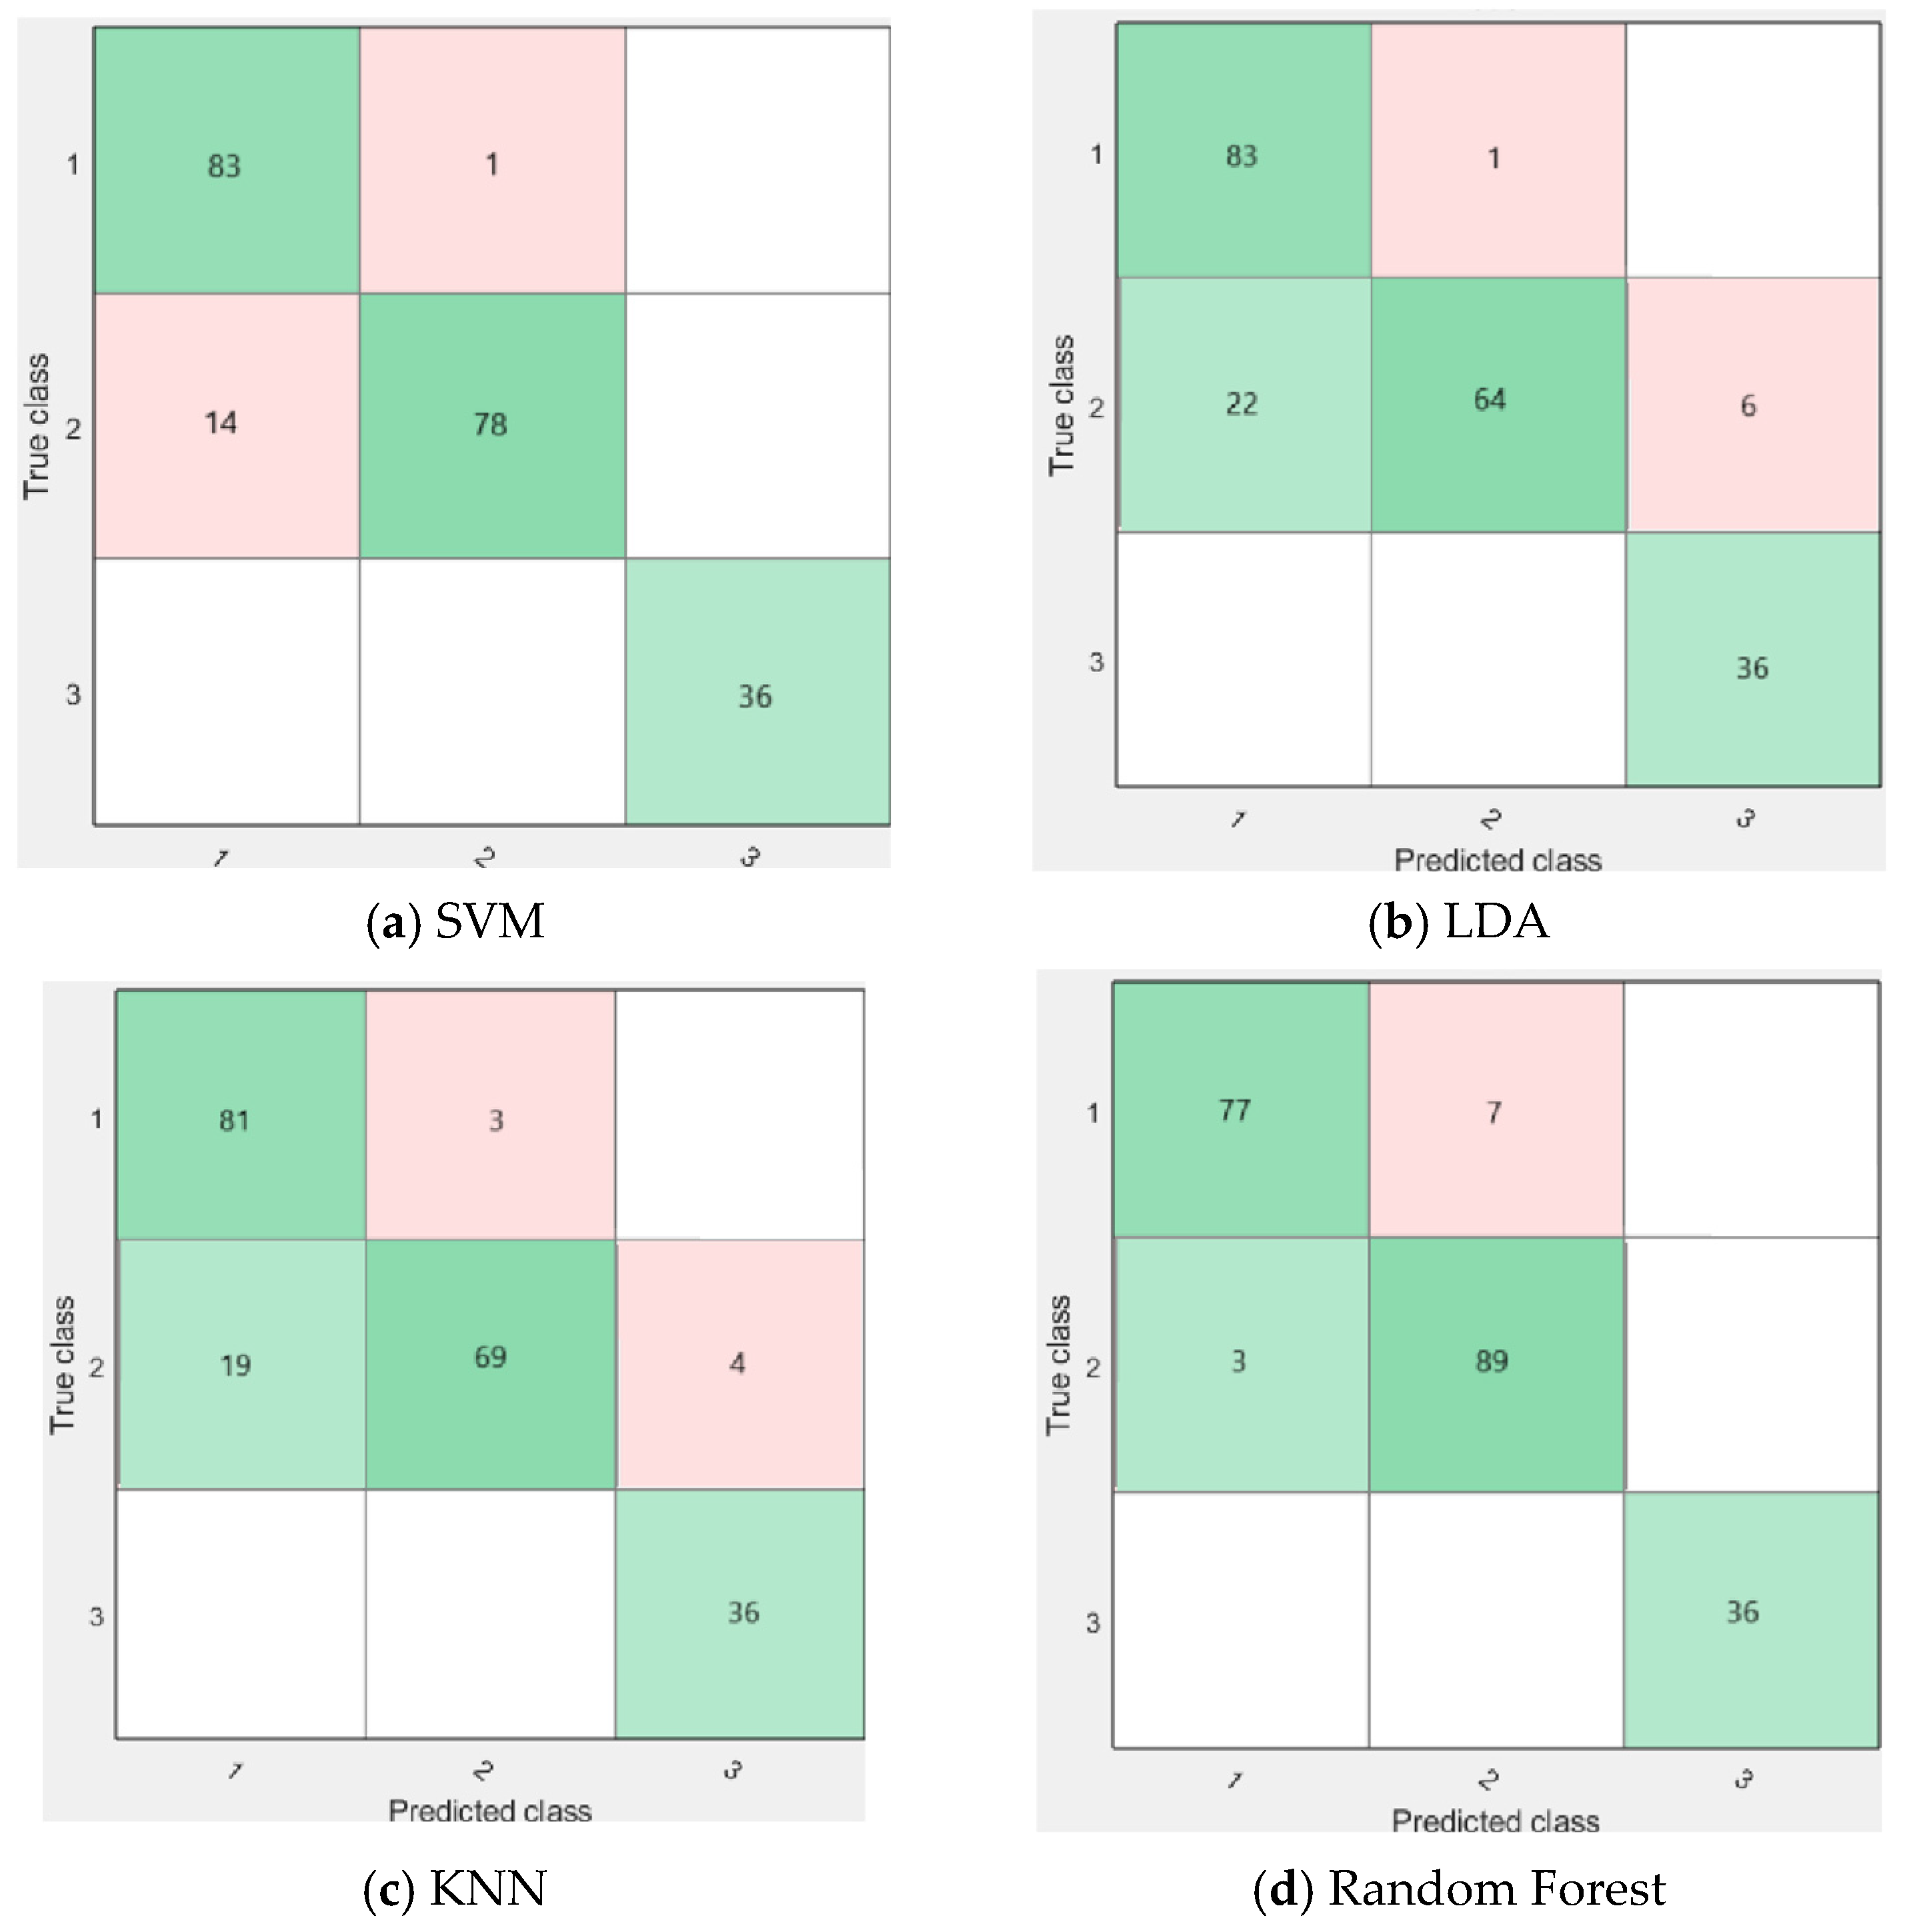
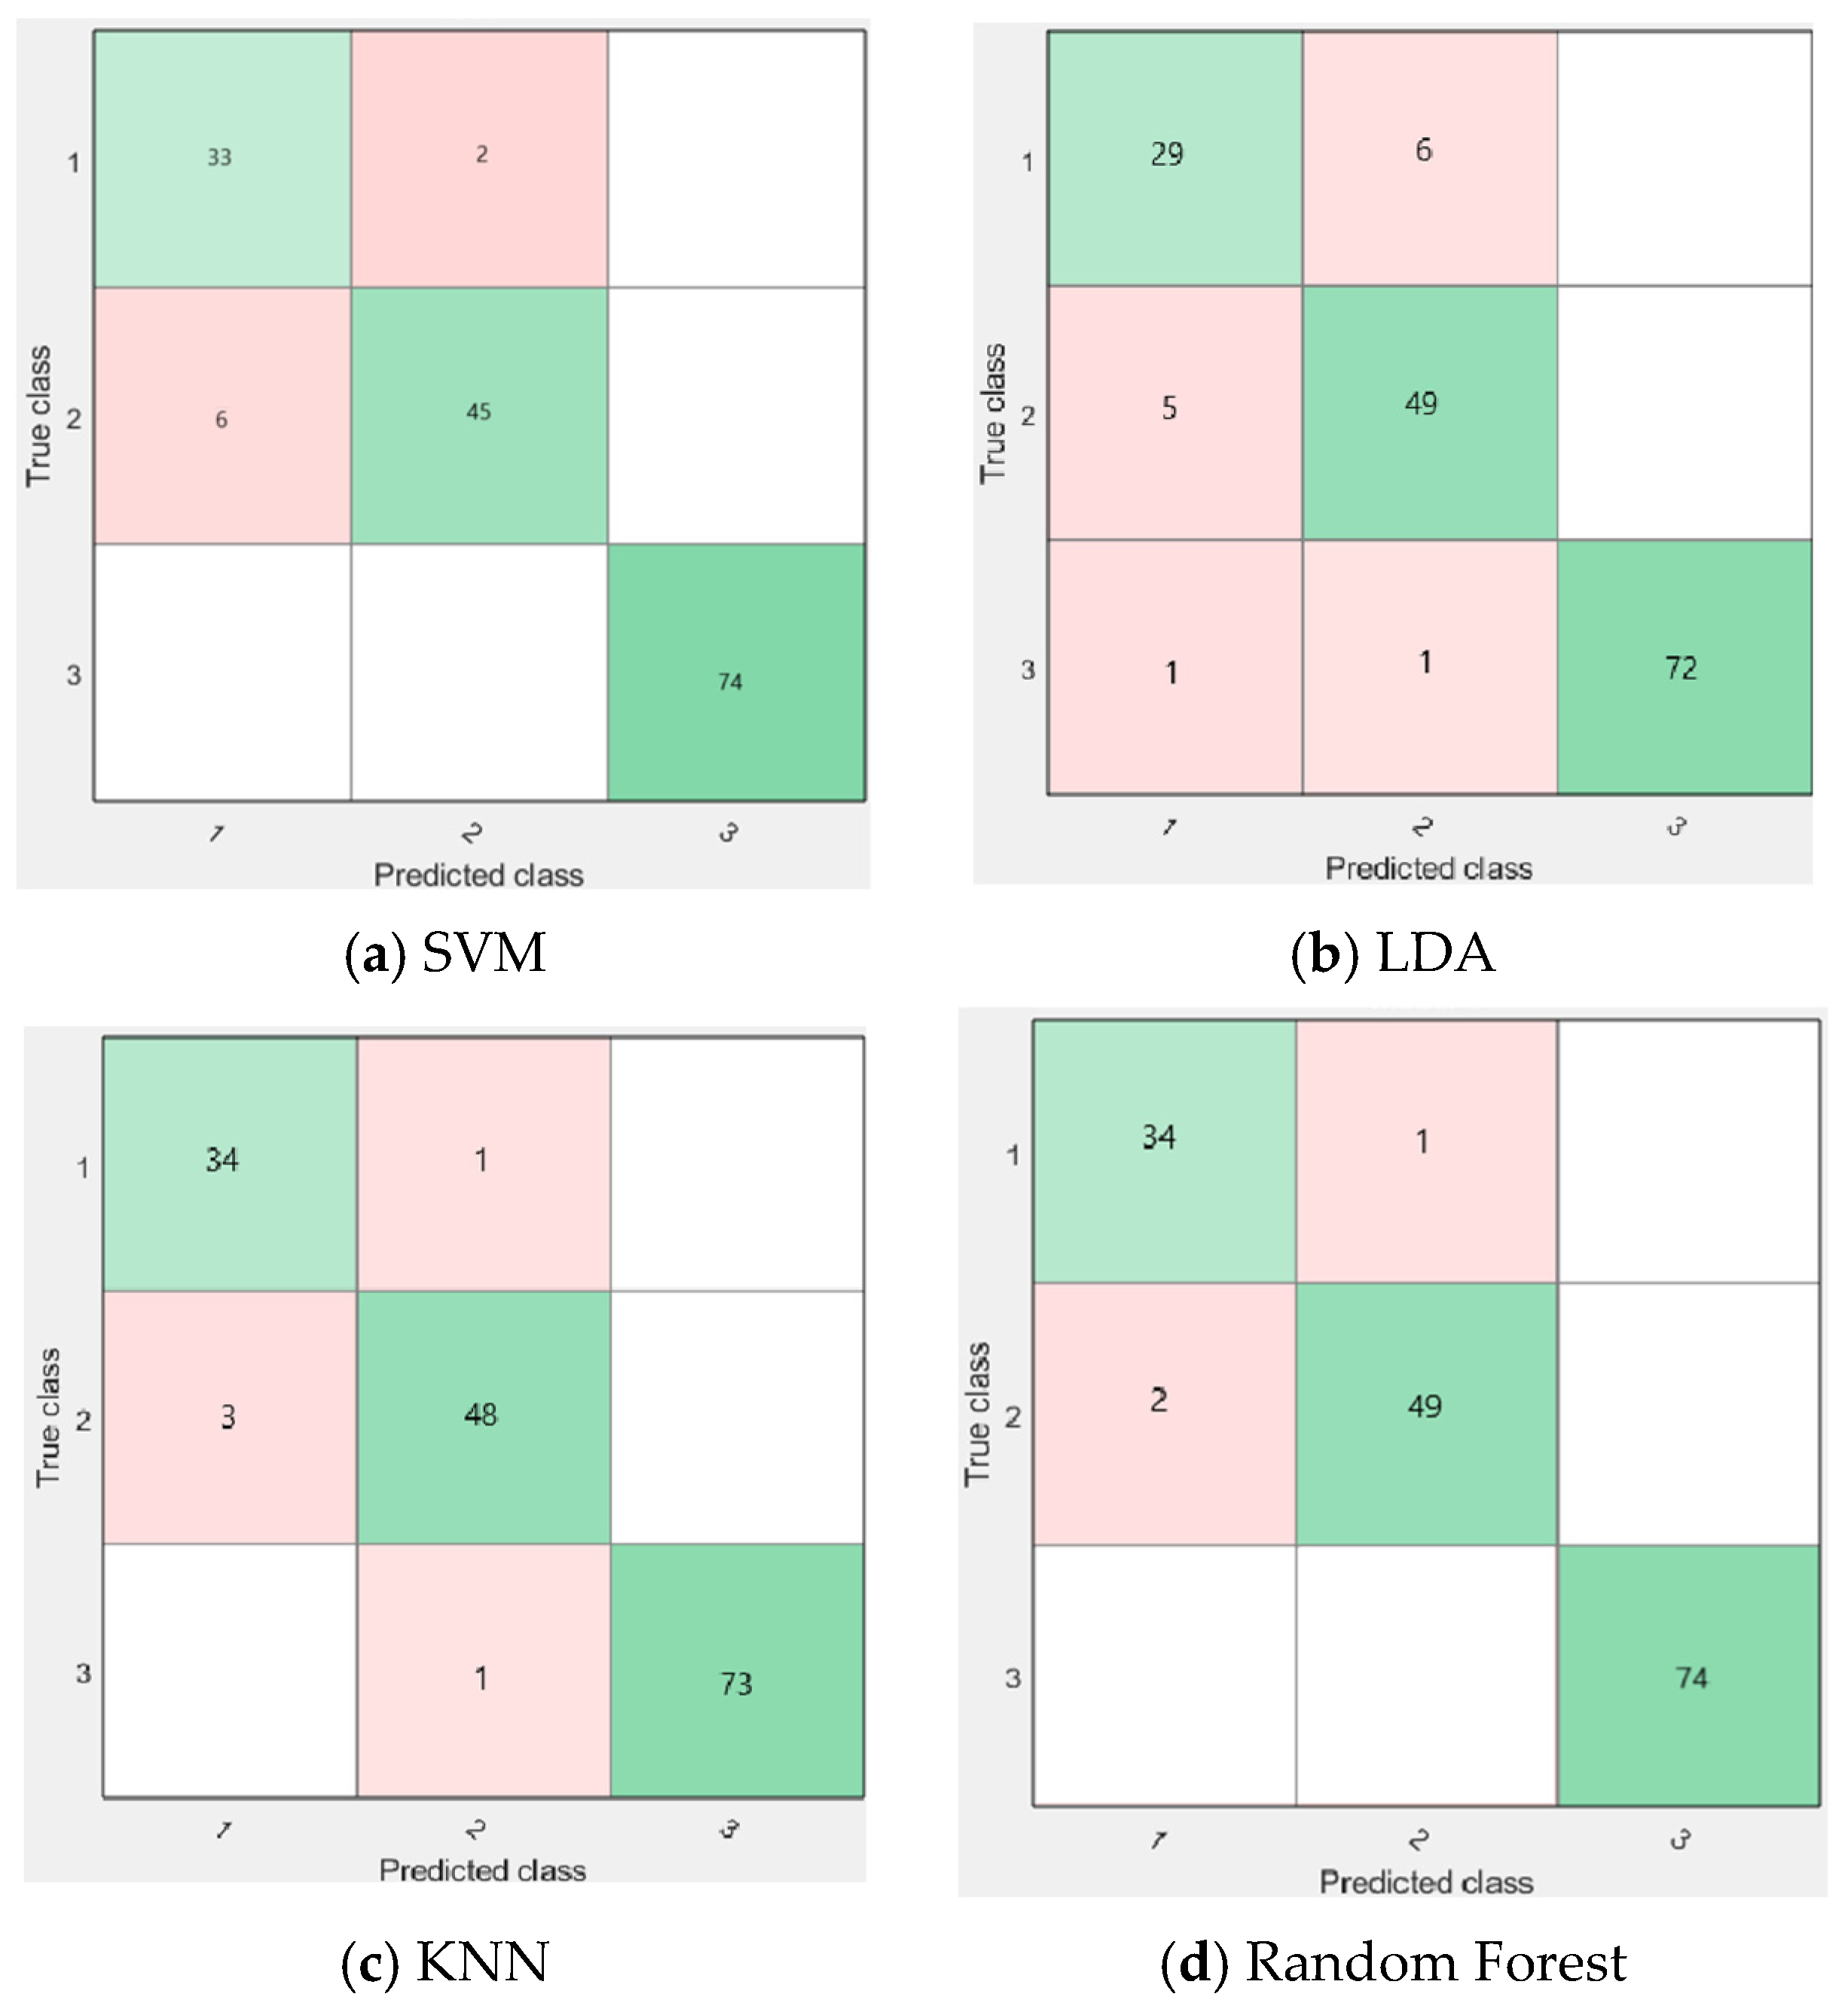
According to the above characteristics, the SVM, LDA, KNN, and RF ML methods were used for prediction. The ten-fold cross-validation training of four models is shown in Figure 7, Figure 8, Figure 9 and Figure 10. It was found that the prediction results of SVM and LDA show large differences in the grading effect of different kinds of fruits. The grading effect of KNN shows smaller variations across different fruits, whereas Random Forest demonstrates the best stability among all classifiers. It is verified that RF has good stability for the grading of a variety of fruits.
The total prediction results of the four ML methods for the four fruits are shown in Table 5, and it is found that the prediction accuracy of Random Forest for multiple fruits is better than that of other ML methods.

4. Discussion and Conclusions

When grading four types of fruits based on multiple features, SVM consistently maintains a high classification accuracy, with orange grading reaching 98.8%. The overall fruit grading accuracy of SVM fluctuates within a range of 11.1%. The LDA has the highest fruit grading accuracy of 90.9%. Its model performance is the worst among the ML models used in this article. Compared with SVM, the KNN model also performs well in grading multiple fruits with an average prediction rate of 94.9% and a fluctuation range of 2.6%. RF maintained the highest prediction rate among the four fruit grading methods, reaching 97.9%. The fluctuation prediction rate is 6.3%. According to the above experimental results, it is found that the process of grading lots of fruits by RF is more applicable. The methods in this article can be used for fruit grading after farm picking. Due to subjective factors, the labor work of fruit grading is inaccurate detection, resulting in failure to distinguish the subtle differences between fruits. In terms of fruit grading, most scholars have focused on researching the grading of a single type of fruit. Their research mainly centers on machine learning [26], migration learning [27], and deep learning [28]. However, there is a lack of research on multiple fruits with multiple features. Deep learning has been shown to achieve higher accuracy. Classical ML can improve classification performance and approach deep learning performance by optimizing the dataset [29]. This article extracts multiple features of different fruits and analyzes the predictive performance of SVM, LDA, KNN, and Random Forest in various fruits. The effectiveness of the ten-fold cross-validation algorithm is demonstrated. It is found that RF has a high predictive rate in the model for grading multiple fruits. Therefore, RF can be used as an effective means of fruit grading. In the future, multiple characteristics of fruits should be automatically obtained. The PCA method can be used to select the key characteristics of fruits for classification. In terms of fruits with large features differences, the location of equipment, the choice of features, and the applicability of ML methods will be affected. How to overcome such problems will require further studies. In addition, deep learning can be employed to classify fruits before applying the corresponding model for grading to achieve the fully automatic grading of fruits. The Random Forest algorithm’s single-image processing time on traditional hardware is much shorter than that of the mechanical response interval. And the overall hardware cost is controlled at around USD 1200. These results indicate that the proposed method can not only accurately classify various fruits but also can offer good real-time performance, cost-effectiveness, and engineering feasibility.

Author Contributions

Conceptualization, P.Z. and X.L.; methodology, P.Z.; software, P.Z.; validation, P.Z. and X.L.; formal analysis, P.Z.; resources, P.Z. and X.L.; data curation, P.Z.; writing—original draft preparation, P.Z.; writing—review and editing, P.Z.; supervision, X.L.; project administration, X.L.; funding acquisition, P.Z. All authors have read and agreed to the published version of the manuscript.

Funding

This research was funded by the Natural Science Foundation of Hubei Province of China (Grant No. 2025AFB547), the National Natural Science Foundation of China (Grant No. 52003078), the Doctoral Scientific Research Foundation of Hubei University of Technology (Grant No. BSQD2 020002), and the Hubei Key Laboratory of Modern Manufacturing Quality Engineering Foundation (Grant No. KFJJ-2020005).

Institutional Review Board Statement

Not applicable.

Informed Consent Statement

Not applicable.

Data Availability Statement

The original contributions presented in this study are included in the article. Further inquiries can be directed to the corresponding author.

Conflicts of Interest

The authors declare no conflicts of interest.

References

  1. Patil, P.U.; Lande, S.B.; Nagalkar, V.J.; Nikam, S.B.; Wakchaure, G. Grading and sorting technique of dragon fruits using machine learning algorithms. J. Agric. Food Res. 2021, 4, 100118. [Google Scholar] [CrossRef]
  2. Al-Shargabi, B.; Alzyadat, R.; Hamad, F. AEGD: Arabic essay grading dataset for machine learning. J. Theor. Appl. Inf. Technol. 2021, 99, 1329–1338. [Google Scholar]
  3. Tarbă, N.; Boiangiu, C.-A.; Voncilă, M.-L. State-of-the-Art Document Image Binarization Using a Decision Tree Ensemble Trained on Classic Local Binarization Algorithms and Image Statistics. Appl. Sci. 2025, 15, 8374. [Google Scholar] [CrossRef]
  4. Bai, X.; Li, Z.; Li, W.; Zhao, Y.; Li, M.; Chen, H.; Wei, S.; Jiang, Y.; Yang, G.; Zhu, X. Comparison of machine-learning and casa models for predicting apple fruit yields from time-series planet imageries. Remote Sens. 2021, 13, 3073. [Google Scholar] [CrossRef]
  5. Magdas, D.; David, M.; Berghian-Grosan, C. Fruit spirits fingerprint pointed out through artificial intelligence and FT-Raman spectroscopy. Food Control 2022, 133, 108630. [Google Scholar] [CrossRef]
  6. Worasawate, D.; Sakunasinha, P.; Chiangga, S. Automatic classification of the ripeness stage of mango fruit using a machine learning approach. AgriEngineering 2022, 4, 32–47. [Google Scholar] [CrossRef]
  7. Bhargava, A.; Bansal, A.; Goyal, V. Machine learning–based detection and sorting of multiple vegetables and fruits. Food Anal. Methods 2022, 15, 228–242. [Google Scholar] [CrossRef]
  8. Mo, Y.; Bai, S.; Chen, W. ASHM-YOLOv9: A Detection Model for Strawberry in Greenhouses at Multiple Stages. Appl. Sci. 2025, 15, 8244. [Google Scholar] [CrossRef]
  9. Hu, G.; Zhang, E.; Zhou, J.; Zhao, J.; Gao, Z.; Sugirbay, A.; Jin, H.; Zhang, S.; Chen, J. Infield apple detection and grading based on multi-feature fusion. Horticulturae 2021, 7, 276. [Google Scholar] [CrossRef]
  10. Bhargava, A.; Bansal, A. Classification and grading of multiple varieties of apple fruit. Food Anal. Methods 2021, 14, 1359–1368. [Google Scholar] [CrossRef]
  11. Chopra, H.; Singh, H.; Bamrah, M.S.; Mahbubani, F.; Verma, A.; Hooda, N.; Rana, P.S.; Singla, R.K.; Singh, A.K. Efficient fruit grading system using spectrophotometry and machine learning approaches. IEEE Sens. J. 2021, 21, 16162–16169. [Google Scholar] [CrossRef]
  12. Kumari, N.; Dwivedi, R.K.; Bhatt, A.K.; Belwal, R. Automated fruit grading using optimal feature selection and hybrid classification by self-adaptive chicken swarm optimization: Grading of mango. Neural Comput. Appl. 2022, 34, 1285–1306. [Google Scholar] [CrossRef]
  13. Chuquimarca, L.E.; Vintimilla, B.X.; Velastin, S.A. A Review of External Quality Inspection for Fruit Grading Using CNN Models. Artif. Intell. Agric. 2024, 14, 1–20. [Google Scholar] [CrossRef]
  14. Albaaji, G.F.; S.S., V.C.; Sharafudeen, M. An Intelligent Multi-Modal Neural Framework for Accurate Fruit Grading Localization and Yield Estimation. Expert Syst. Appl. 2025, 268, 126366. [Google Scholar] [CrossRef]
  15. Song, J.-Y.; Qin, Z.-S.; Xue, C.-W.; Bian, L.-F.; Yang, C. Fruit Grading System by Reconstructed 3D Hyperspectral Full-Surface Images. Postharvest Biol. Technol. 2024, 212, 112898. [Google Scholar] [CrossRef]
  16. Hayat, A.; Morgado-Dias, F.; Choudhury, T.; Singh, T.P.; Kotecha, K. FruitVision: A Deep Learning Based Automatic Fruit Grading System. Open Agric. 2024, 9, 20220276. [Google Scholar] [CrossRef]
  17. Mon, T.; ZarAung, N. Vision based volume estimation method for automatic mango grading system. Biosyst. Eng. 2020, 198, 338–349. [Google Scholar] [CrossRef]
  18. Baietto, M.; Wilson, A.D. Electronic-nose applications for fruit identification, ripeness and quality grading. Sensors 2015, 15, 899–931. [Google Scholar] [CrossRef]
  19. Qu, H.; Xiang, R.; Obsie, E.Y.; Wei, D.; Drummond, F. Parameterization and calibration of wild blueberry machine learning models to predict fruit-set in the northeast china bog blueberry agroecosystem. Agronomy 2021, 11, 1736. [Google Scholar] [CrossRef]
  20. Das, P.; Yadav, J.K.P.S.; Yadav, A.K. An Automated Tomato Maturity Grading System Using Transfer Learning Based AlexNet. Ingénierie Systèmes D’inf. 2021, 26, 191–200. [Google Scholar] [CrossRef]
  21. Ismail, N.; Malik, O.A. Real-time visual inspection system for grading fruits using computer vision and deep learning techniques. Inf. Process. Agric. 2022, 9, 24–37. [Google Scholar] [CrossRef]
  22. Albarrak, K.; Gulzar, Y.; Hamid, Y.; Mehmood, A.; Soomro, A.B. A deep learning-based model for date fruit classification. Sustainability 2022, 14, 6339. [Google Scholar] [CrossRef]
  23. Barrett, D.M.; Beaulieu, J.C.; Shewfelt, R. Color, flavor, texture, and nutritional quality of fresh-cut fruits and vegetables: Desirable levels, instrumental and sensory measurement, and the effects of processing. Crit. Rev. Food Sci. Nutr. 2010, 50, 369–389. [Google Scholar] [CrossRef] [PubMed]
  24. Li, J.; Huang, W.; Zhao, C. Machine vision technology for detecting the external defects of fruits—A review. Imaging Sci. J. 2015, 63, 241–251. [Google Scholar] [CrossRef]
  25. Speiser, J.L.; Miller, M.E.; Tooze, J.; Ip, E. A comparison of random forest variable selection methods for classification prediction modeling. Expert Syst. Appl. 2019, 134, 93–101. [Google Scholar] [CrossRef]
  26. Anita, C.; Nagarajan, P.; Lakshminarayanan, E.; Sankar, M.N.; Rishikanth, V. Machine Vision and Machine Learning based Fruit Quality Monitoring. Rev. Geintec-Gest. Inov. E Tecnol. 2021, 11, 836–842. [Google Scholar] [CrossRef]
  27. Pardede, J.; Sitohang, B.; Akbar, S.; Khodra, M.L. Implementation of transfer learning using VGG16 on fruit ripeness detection. Int. J. Intell. Syst. Appl. 2021, 13, 52–61. [Google Scholar] [CrossRef]
  28. Rismiyati, R.; Luthfiarta, A. Vgg16 transfer learning architecture for salak fruit quality classification. Telematika 2021, 18, 37. [Google Scholar] [CrossRef]
  29. Alresheedi, K.M.; Aladhadh, S.; Khan, R.U.; Qamar, A.M. Dates Fruit Recognition: From Classical Fusion to Deep Learning. Comput. Syst. Sci. Eng. 2022, 40, 151–166. [Google Scholar] [CrossRef]
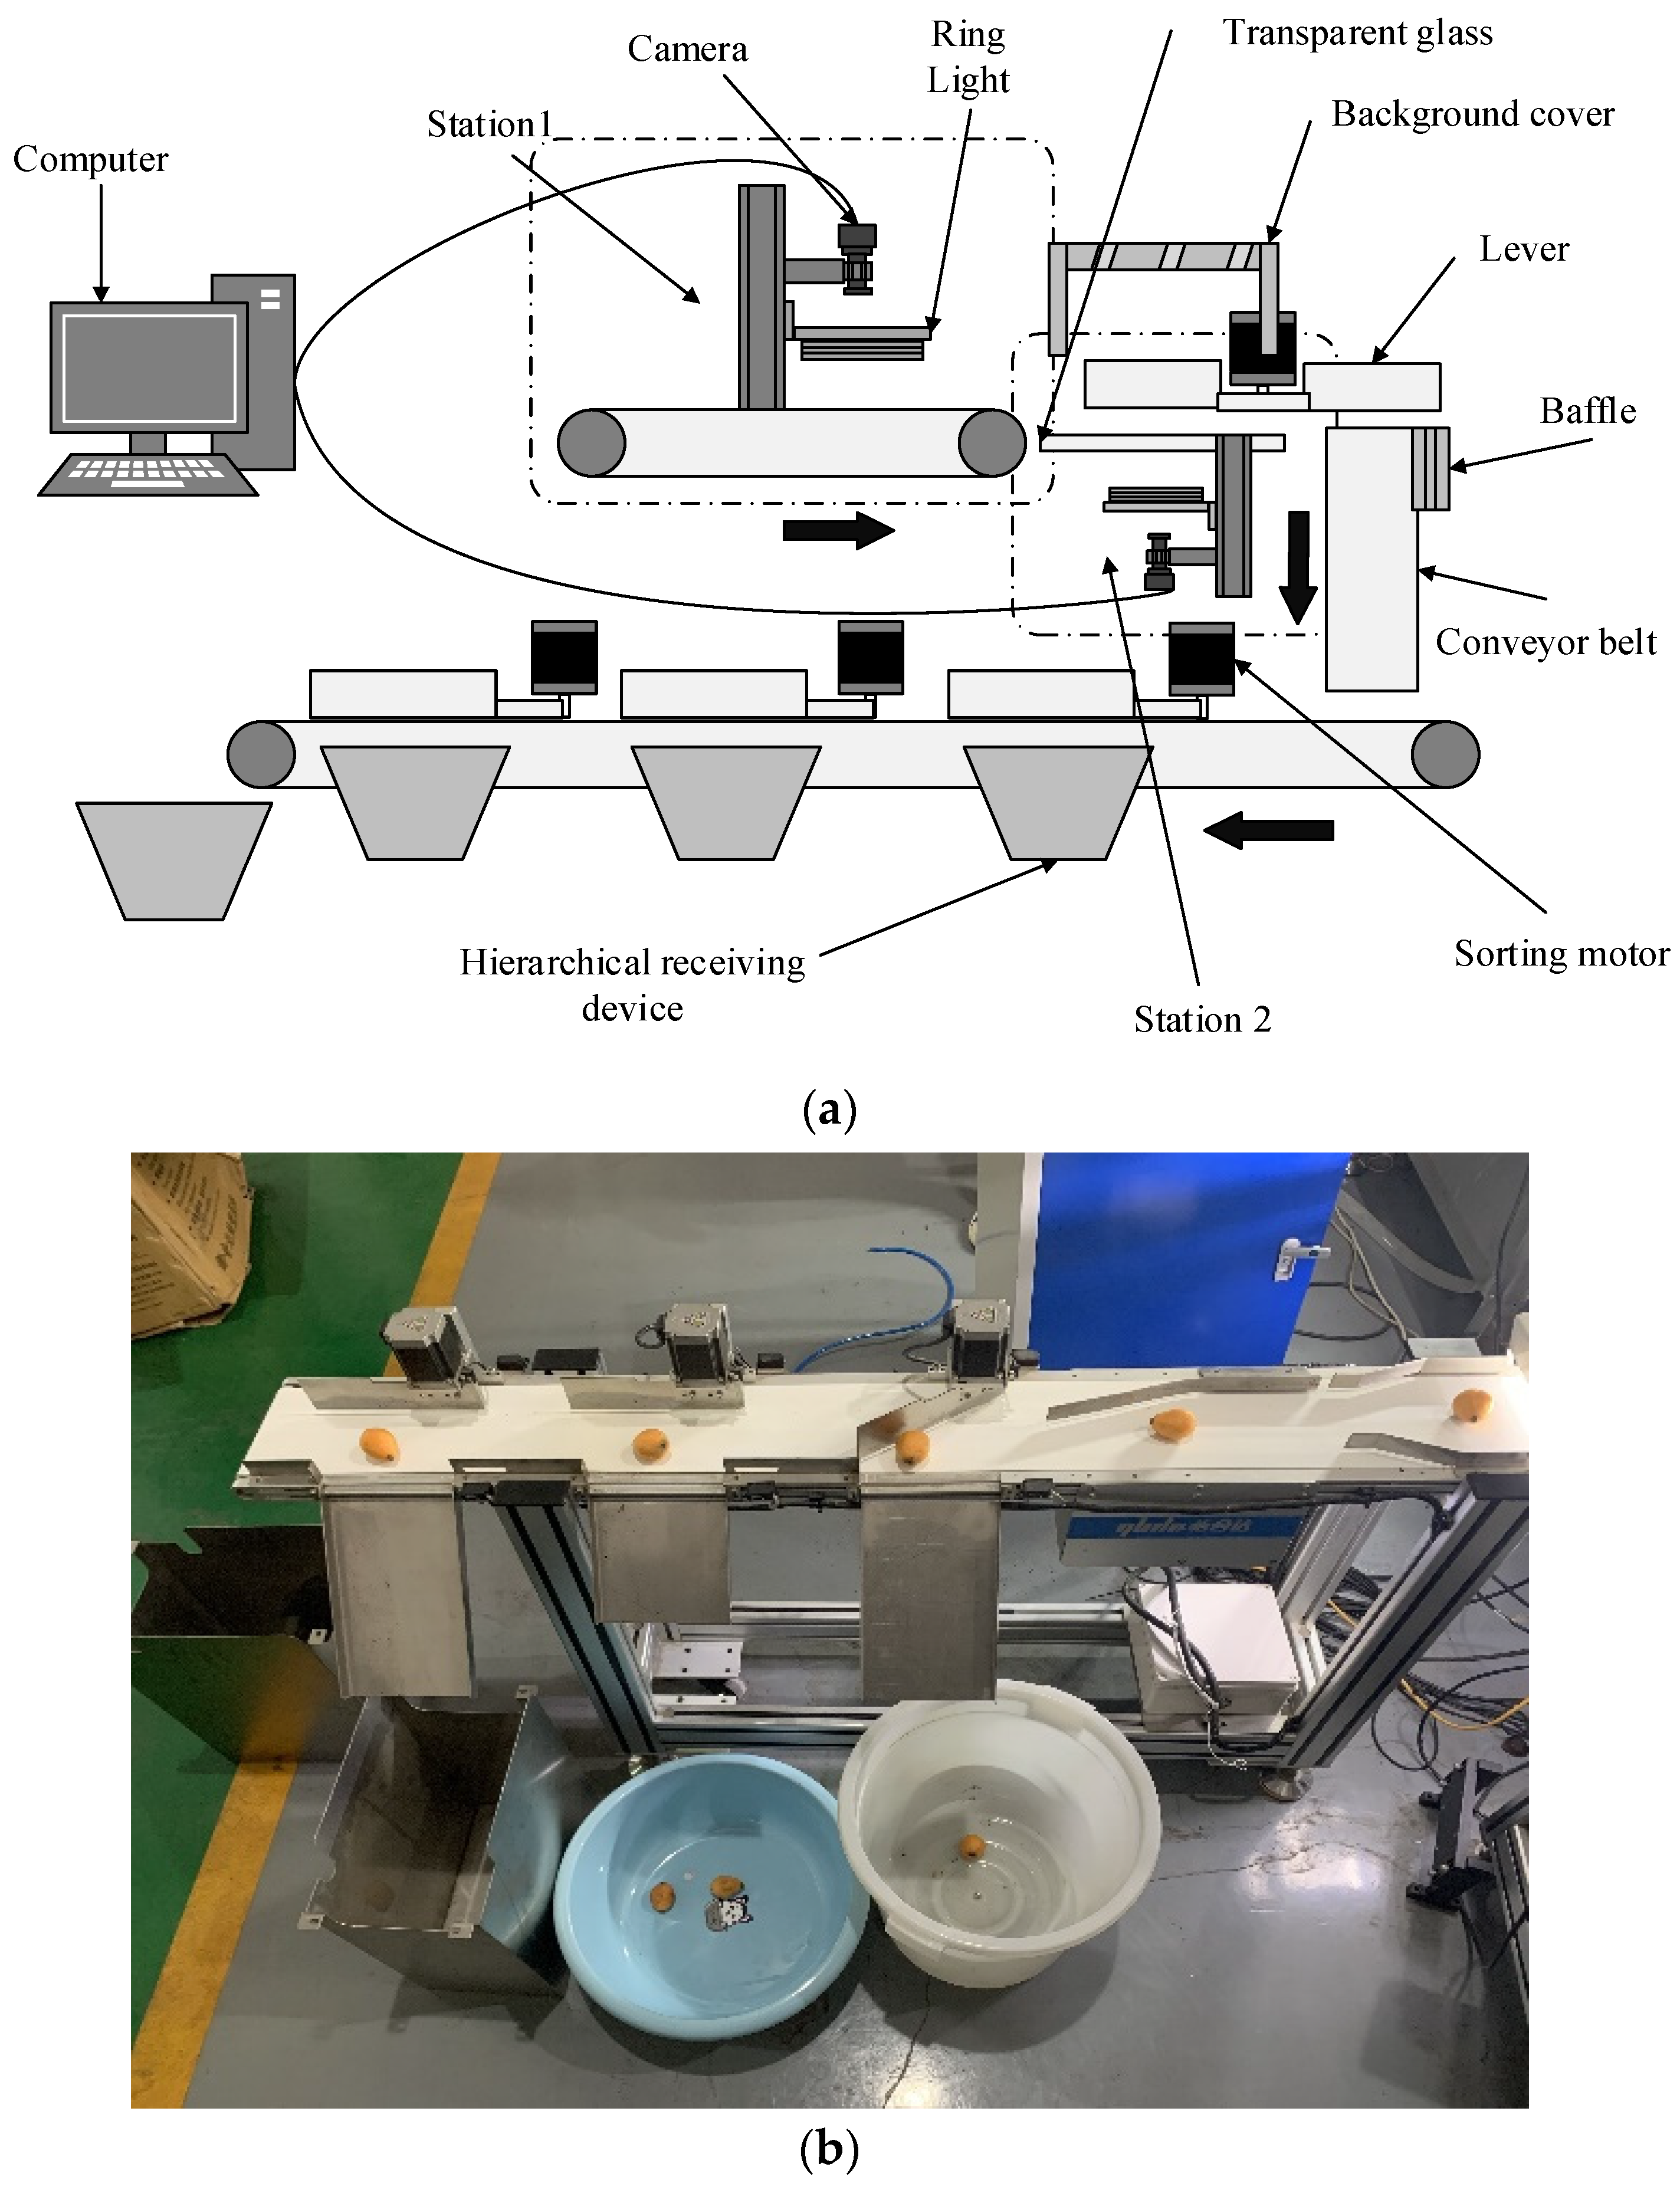
Figure 1. (a) Schematic diagram of fruit grading system. (b) Experimental device.
Applsci 15 11866 g001
Figure 2. Workflow diagram of fruit grading system.
Applsci 15 11866 g002
Figure 4. (a) Grayscale processing; (b) background separation.
Applsci 15 11866 g004
Figure 5. (a) Contour circumcircle; (b) defect characteristics.
Applsci 15 11866 g005
Figure 6. Feature boxplot of apples (a), orange (b), pomegranates (c), and loquats (d). ASM, COR, ENT, and IDM are the evaluation indicators for texture features, represented in Formulas (3)–(6). SIZE is the size feature. COLOR is the color feature. DEFECT is a defect feature.
Applsci 15 11866 g006
Figure 7. Ten-fold cross-validation classification results of apples using SVM (a), LDA (b), KNN (c), and Random Forest (d).
Applsci 15 11866 g007
Figure 8. Ten-fold cross-validation classification results of oranges using SVM (a), LDA (b), KNN (c), and Random Forest (d).
Applsci 15 11866 g008aApplsci 15 11866 g008b
Figure 9. Ten-fold cross-validation classification results of loquats using SVM (a), LDA (b), KNN (c), and Random Forest (d).
Applsci 15 11866 g009
Figure 10. Ten-fold cross-validation classification results of pomegranates using SVM (a), LDA (b), KNN (c), and Random Forest (d).
Applsci 15 11866 g010
Table 1. Fruit defect grading level.
GradeDefect Rate
Premium≤0.5%
First level≤5%
Second level≤10%
Table 2. The parameters of the camera.
Product ModelSHL-500WS
Lens Size1/2.5 inch (4:3)
Cell Size2.2 μm
Highest Effective Pixel2592(H) × 1944(V)
Signal-to-Noise Ratio38 dB
Dynamic Range70 dB
Sensitivity1.4V/lux-sec@550nm
Minimum Illumination0.1 lux
Table 3. Hardware and OS configuration of the image-processing computer.
Product ModelThinkPad E470c
Screen Size14 inch
CPU ModelIntel CORE i56200U
CPU Frequency2.3 GHz
Memory Capacity8 GB (8 GB × 1) DDR42400MHz
Hard Disk Capacity500GB7200turns
Graphics ChipNVIDIAGeforce920MX
Operating SystemWindows 10
Table 4. The distribution of feature extraction for four types of fruits.
Features
TextureColorSizeShapeDefect
Apple
Orange
Pomegranate
Loquat
Table 5. The prediction results of each ML model for four types of fruits.
AppleLoquatPomegranateOrange
SVM0.9230.9290.9500.988
LDA0.8430.8630.9190.847
KNN0.9530.8770.9690.928
Random Forest0.9860.9530.9810.991
Disclaimer/Publisher’s Note: The statements, opinions and data contained in all publications are solely those of the individual author(s) and contributor(s) and not of MDPI and/or the editor(s). MDPI and/or the editor(s) disclaim responsibility for any injury to people or property resulting from any ideas, methods, instructions or products referred to in the content.