1. Introduction
Vehicles using conventional fuel types today continue to increase greenhouse gas emissions, which are the central cause of global warming. One of the most crucial elements of an electric vehicle is the battery; therefore, selecting the appropriate battery type is essential. Various kinds of batteries are available for electric vehicles. These include lead–acid, nickel–cadmium, nickel–metal hydride, lithium-ion, lithium–polymer, lithium iron phosphate, spent-air, lithium–sulfur, and lithium–air batteries.
Li et al. [
1] examined the cooling performances of lithium-ion batteries at various speeds using the experimental and Computational Fluid Dynamics (CFD) method. They stated that multiple optimizations according to the placement of the batteries would reduce the temperature difference in the battery pack. In another study, Uzal et al. [
2] the effect of air inlet position and speed on the cooling performance of nickel–metal hydride (Ni-MH) battery packs in electric vehicles was examined using computational fluid dynamics (CFD) simulations. The results of the study show that battery thermal management systems (BTMS) in electric vehicles can be used to increase energy efficiency. Jiaqiang et al. [
3] investigated the best cooling performance of the Li-ion battery group consisting of 60 cells, depending on the air inlets and outlets, using a single-stack cell model with the CFD method, and determined that using partitions depending on the inlet and outlet positions at air flow rates increased the cooling performance. Sefidan et al. [
4] stated experimentally and by the CFD method that by cooling the cylindrical lithium-ion battery with air with the nanofluid-based cooling they developed, the maximum temperature of the cells effectively decreases. Behi et al. [
5] with the hybrid system they created, the effects of distance between batteries, ambient temperature, and air inlet speed were determined experimentally and by the CFD method for cylindrical lithium-ion batteries. Li et al. [
6] In the battery group with U-type channel geometry, the effect of the location of the batteries on the cooling performance was investigated using the CFD method, and the channel flow rate optimization was carried out. Park et al. [
7] investigated the air cooling performance of the air-cooled Li-ion battery group in various air distributions for U and Z-type channels using the CFD method, and the thermal efficiency was compared by changing the pressure and inlet position. Jithin et al. [
8] this research involves examining and comparing Different Dielectric Fluids (DELC) for direct cooling of lithium-ion batteries. Numerical analysis of direct cooled cells is performed with three different dielectric fluids involving deionized water, mineral oil, and engineering fluid. Wang et al. [
9] numerically investigated the thermal performance of the module consisting of batteries arranged in different shapes. They observed that battery modules arranged in cubic and hexagonal shapes can be cooled more effectively compared to those arranged in rectangular and circular shapes.
Saw et al. [
10] examined air cooling and digitally analyzed the battery unit, which consisted of qualified ion batteries. A 38120 type battery was used in the study, and it was formed from a battery part consisting of 24 batteries. The heat was generated when the batteries were in contact with the surfaces of the batteries. Fan et al. [
11] experimentally examined the effects of air inlet temperature and battery discharge rate on battery thermal management in sequential, staggered, and diagonally arranged cylindrical lithium-ion batteries. They observed that the in-line array is the most suitable design, considering the cooling efficiency and homogeneous temperature distribution. Celen et al. [
12] 10 × 10 battery group consisting of cylindrical lithium-ion batteries used in electric vehicles was considered, and the cooling of the batteries with air and electrically insulating liquid (Novec 7200, 3M, Saint Paul, MN, USA) was examined parametrically. Celen experimentally examined a single-phase immersion-cooled lithium-ion battery in different operating states. A LiFePO
4 (LFP) pouch-type battery was experimentally cooled by both air and water. Celen and Bakırcı analyzed the cooling of Lithium-Ion batteries numerically using the ANOVA method by designing a mini channel and applying the immersion cooling technique. Optimum values were obtained by changing the geometry of the channel and the fluid velocity entering the channel. Zhu et al. carried out an optimization study to obtain optimum cooling by changing the channel dimensions and refrigerant flow rate for the immersion cooling method of lithium-ion batteries. Bulut [
13] considered a four-cell battery module considered a cooling plate with serpentine channels. The study examined the number of parallel channels on this plate and the cooling efficiency and temperature values of the cooling fluid mass flow rate. The study determined the channel spacing, channel width, and mass design values; the design points were selected using the LHS method, and CFD-based analyses were then performed. Deng et al. [
14] chose the liquid cooling method for the lithium-ion battery module and designed a cooling plate between the cells. They achieved an 85.53% change in the friction coefficient and a 17.19% change in the heat transfer coefficient. Due to its computational simplicity, the Newman–Tiedemann–Gu–Kim [
15] model is one of the most widely used models for efficiently modeling lithium-ion batteries and is selected to conduct this simulation research of the electrical, chemical, and thermal processes of the battery.
In Al-Zareer’s [
16] examined various battery thermal management methods including air, liquid, phase change material, and hybrid systems by evaluating their efficiency, safety, and performance. The results indicated that hybrid systems are the most effective solution for maintaining stable battery temperature control. Lin et al. [
17] developed an online parameterization-based adaptive observer to estimate the internal core temperature of cylindrical lithium-ion batteries. Using only surface temperature measurements, the proposed approach identifies the temperature-dependent internal resistance and tracks its long-term variation, thereby enhancing battery health monitoring and thermal management. Rao et al. [
18] examined the performances of continuous cooling and intermittent cooling of the lithium-ion battery module using the air cooling method under operating conditions at low loads and different ambient temperatures. They observed that with an increase of 1.1–1.3 °C in the highest temperature inside the module, the energy drawn from the system decreased by 83–92%, respectively. Serincan et al. [
19] designed a thermal management system that will increase the electrochemical performance and system reliability for a 30 Ah Li-ion battery module consisting of 8 prismatic cells with a nominal operating voltage of 24 V. For this purpose, the electrochemical events in the cells and the heat-fluid events in the cooling channels were examined in detail with the three-dimensional computational fluid dynamics (CFD) model developed for the battery pack. Ozcan et al. [
20] They examined the battery chemicals used in electric vehicles and explained in detail which chemicals are advantageous or disadvantageous when used for electric vehicles. Analysis studies are focused on ensuring that the battery module is reliable, mechanically resistant to stress, and has a long life. Kurucan et al. [
21] investigated the thermal behavior and performance of envelope-type lithium-ion batteries used in Hybrid Electric Vehicles (HEV) and all-electric (EV) vehicles at different discharge rates through numerical simulations. In this study, a software package based on the dual-potential multiscale-multidimensional (MSMD) battery model was used to evaluate the discharge characteristics of the cells and analyze their thermal performance. The developed model is accurate enough to be used in battery thermal management systems to ensure a homogeneous thermal distribution of batteries. As a result of their study [
22], they said that a thermal management system should be designed for electric vehicles. A high-efficiency air-cooled system can be used in the electric vehicle thermal management system, and even system efficiency can be increased with a heat sink, heat pipe, or forced airflow. It can also be increased, but it has been determined that the air cooling system will be insufficient in electric vehicles with high-voltage batteries. Eliminating heat and homogenizing temperature distributions in single cells and packs are key considerations. Immersion cooling, which submerges the battery in a dielectric fluid, has the potential to increase the heat rate. 10,000 times more transfer than passive air cooling. This performance increase is provided in 2-phase systems through the latent heat of vaporization of the liquid-to-gas transition and the resulting turbulent 2-phase.
Roe et al. [
23] made a detailed compilation study of immersion cooling methods. Accordingly, they presented current developments in immersion cooling for lithium-ion batteries and addressed their performance impact. The findings from this evaluation will contribute to the design of higher-performance, safer, and longer-lasting electric vehicles by researchers and developers working in both academia and industry. Dielectric liquids are increasingly favored for their high thermal conductivity and electrical insulation, as also investigated by Han et al. [
24]. Solaie et al. illustrate the validation of a data-driven numerical method permitting the evaluation of the fast behavior of the Immersion Cooling of a Lithium-ion Battery Pack. Battery thermal management methods, including air cooling, indirect liquid cooling, tab cooling, phase change materials, and immersion cooling, have been reviewed. Immersion cooling with dielectric fluids is one of the most promising methods due to direct fluid contact with all cell surfaces and high efficiency [
25].
This study focuses on the numerical modeling and optimization of immersion cooling systems, which have received limited attention in the literature. A MOGA (Multi-Objective Genetic Algorithm)-based approach is developed by simultaneously optimizing multiple geometric and flow parameters, thus proposing a scalable design method for improving battery thermal management performance. This approach goes beyond the limited-variable parametric studies in the existing literature, achieving comprehensive improvements in heat transfer efficiency and temperature uniformity.
2. Materials and Methods
2.1. Physical Description and Numerical Modeling
The battery model was considered for high-energy-density 18,650 lithium-ion cells. The battery pack consists of a total of 23 cells, and each cell is 19 mm in diameter and 68 mm in length. The nominal voltage of the cells is 3.7 V, and the capacity is 2 Ah. Detailed technical data is provided in
Table 1, and a detailed geometrical design is presented in
Figure 1. The batteries are arranged in the battery box, which is also a cooling channel. The spacing between adjacent batteries is set to 3.5 mm, the spacing between the channel wall and batteries is fixed at 4 mm, and the size of the battery box is 121 mm × 114 mm× 82 mm.
Figure 1 shows the 23-cell battery module used in the study.
This figure illustrates the geometric model of the battery immersion cooling system consisting of 23 cylindrical lithium-ion cells. The arrangement enables a compact structure with efficient coolant flow, ensuring comprehensive fluid contact with the cell surfaces.
As shown in
Table 2, the boundary conditions were implemented in the finite volume code, consisting of a velocity inlet of 0.4 m/s and a pressure outlet of 101,325 Pa (equivalent to a gauge pressure of 0 Pa).
Boundary conditions applied to the computational domain include a uniform inlet velocity of 0.4 m/s, an inlet fluid temperature of 293 K, and an outlet pressure of 101.325 kPa. Luo et al. [
26] and Satyanarayana et al. [
27] employed a velocity range of 0.1 m/s to 0.4 m/s in their immersion battery cooling studies. These conditions simulate realistic operational states for effective evaluation of cooling performance. Chen et al. [
28], Yang et al. [
29], and Peng et al. [
30] assumed a constant heat generation rate in their studies, which simplifies the modeling process but limits the accuracy of the thermal prediction. In contrast, the present study considers the time-dependent heat generation associated with current and voltage variations during the charging and discharging processes. For this purpose, a user-defined function (UDF) was developed in the ANSYS Fluent 2025 R1. environment to dynamically model the internal heat generation within the cell based on the instantaneous current and internal resistance variations. The UDF was defined according to the experimentally obtained current profile, enabling the model to compute variable heat generation corresponding to real charge/discharge cycles. As a result, the proposed approach provides a more realistic and physically consistent representation of the battery’s thermal behavior, particularly under dynamic operating conditions, and yields results that align more closely with actual performance compared to models assuming constant heat generation.
In
Table 3, for battery material, the density is 2000 kg/m
3, specific heat is 900 J/kgK, and thermal conductivity is 27 W/mK. Heat generation is chosen for each cell, and it is calculated by adding a UDF indicating the time-dependent dynamic change.
Deionized water was used as the cooling fluid, and its thermophysical properties are presented in
Table 4. Its properties at 20 °C and 1 atm pressure were used. Han et al. [
24] and Celen [
31] also stated that the inlet temperature of the coolant could be between 15 °C and 25 °C, and they adopted that range in their study. As shown in
Table 4, deionized immersion water offers significant advantages in heat dissipation within the battery pack due to its high specific heat capacity and excellent thermal conductivity.
Turbulence Intensity: A turbulence intensity of 5% was applied as the inlet boundary condition in the simulations. This value falls within the range commonly preferred in similar battery cooling studies in the literature.
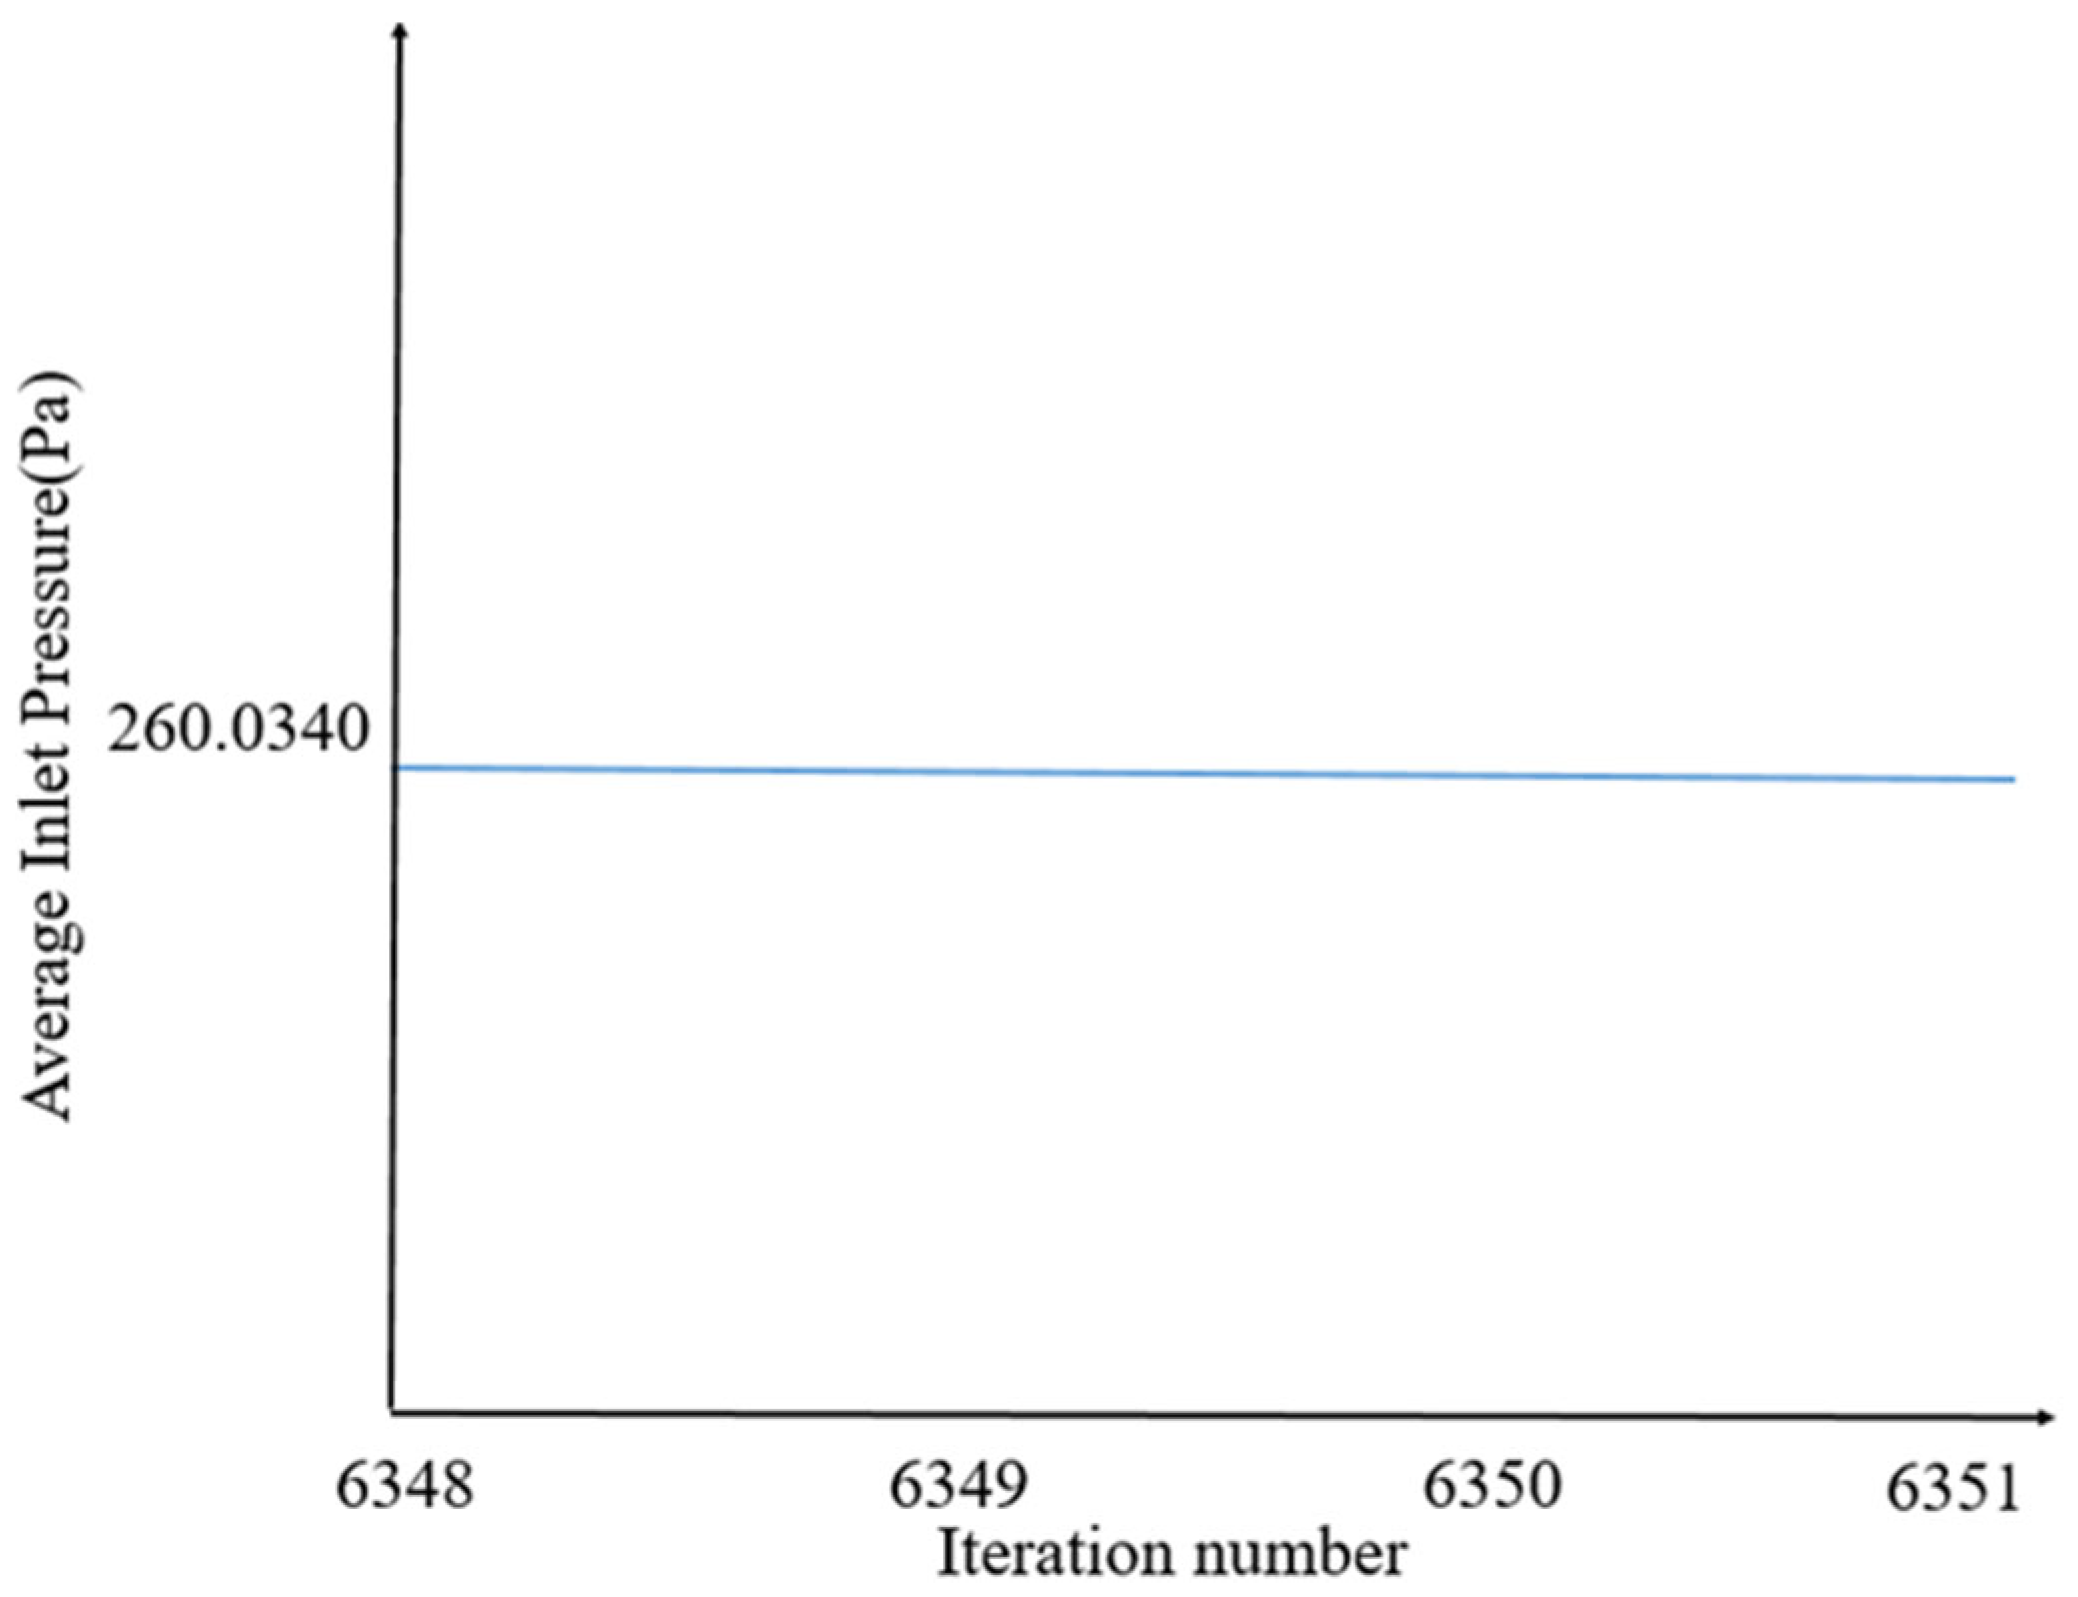
Convergence Criteria: A convergence criterion of 10−11 was adopted for the energy equations, 10−8 for the momentum and continuity equations, and 10−6 for the turbulence equations. In addition, stabilization of temperature and pressure values throughout the iterations was also considered as a convergence condition.
Solver Settings: The SIMPLE algorithm was employed for pressure–velocity coupling, and first-order upwind schemes were used for discretization. A pressure-based solver was selected for the density, momentum, and energy equations. The SST k-ω turbulence model was chosen, and low Reynolds number corrections were activated.
2.2. Battery and Coolant Flow Modeling
It describes the battery’s thermal behavior by relying on experimentally measured impedance characteristics and can be used to simulate the battery’s stable charging and discharging processes. The constant heat generation is calculated as 16,325 W/m
3 for each cell based on this model. The principle of energy conservation, the LIB’s heat conduction differential equation is shown in
where
Cb,
ρb, and
T are the battery’s specific heat capacity, density, and temperature,
kx,
ky, and
kz are the thermal conductivity coefficients along the
x-axis,
y-axis, and
z-axis.
qgen is the heat generation rate per unit volume, and
qdis is the convective heat dissipation per unit volume on the surface of the battery.
Obtaining an accurate battery heat production rate only by experiments is difficult. Hence, Numerical calculations should also be required to investigate the phenomena in addition to the experimental study. For CFD calculations, the turbulence model chosen is the SST k-ω, including Low-Re Corrections and shear flow corrections. For cooling fluid, continuity, momentum, and energy equations are as follows;
2.3. Mesh Independence Analysis
The mesh independence analyses must be performed in order to obtain accurate simulation results and ensure the reliability of the model. The maximum temperature reached by the battery pack during the discharge process was selected as the evaluation criterion. The cooling process was carried out at a temperature of 293 K and a flow velocity of 0.4 m/s using deionized water at a discharge rate of 2-C. The main factors affecting simulation accuracy are mesh size and quality. In general, as the number of cells and mesh quality increase, so does the accuracy of the calculations. The mesh structures created according to four different cell sizes were used in the models.
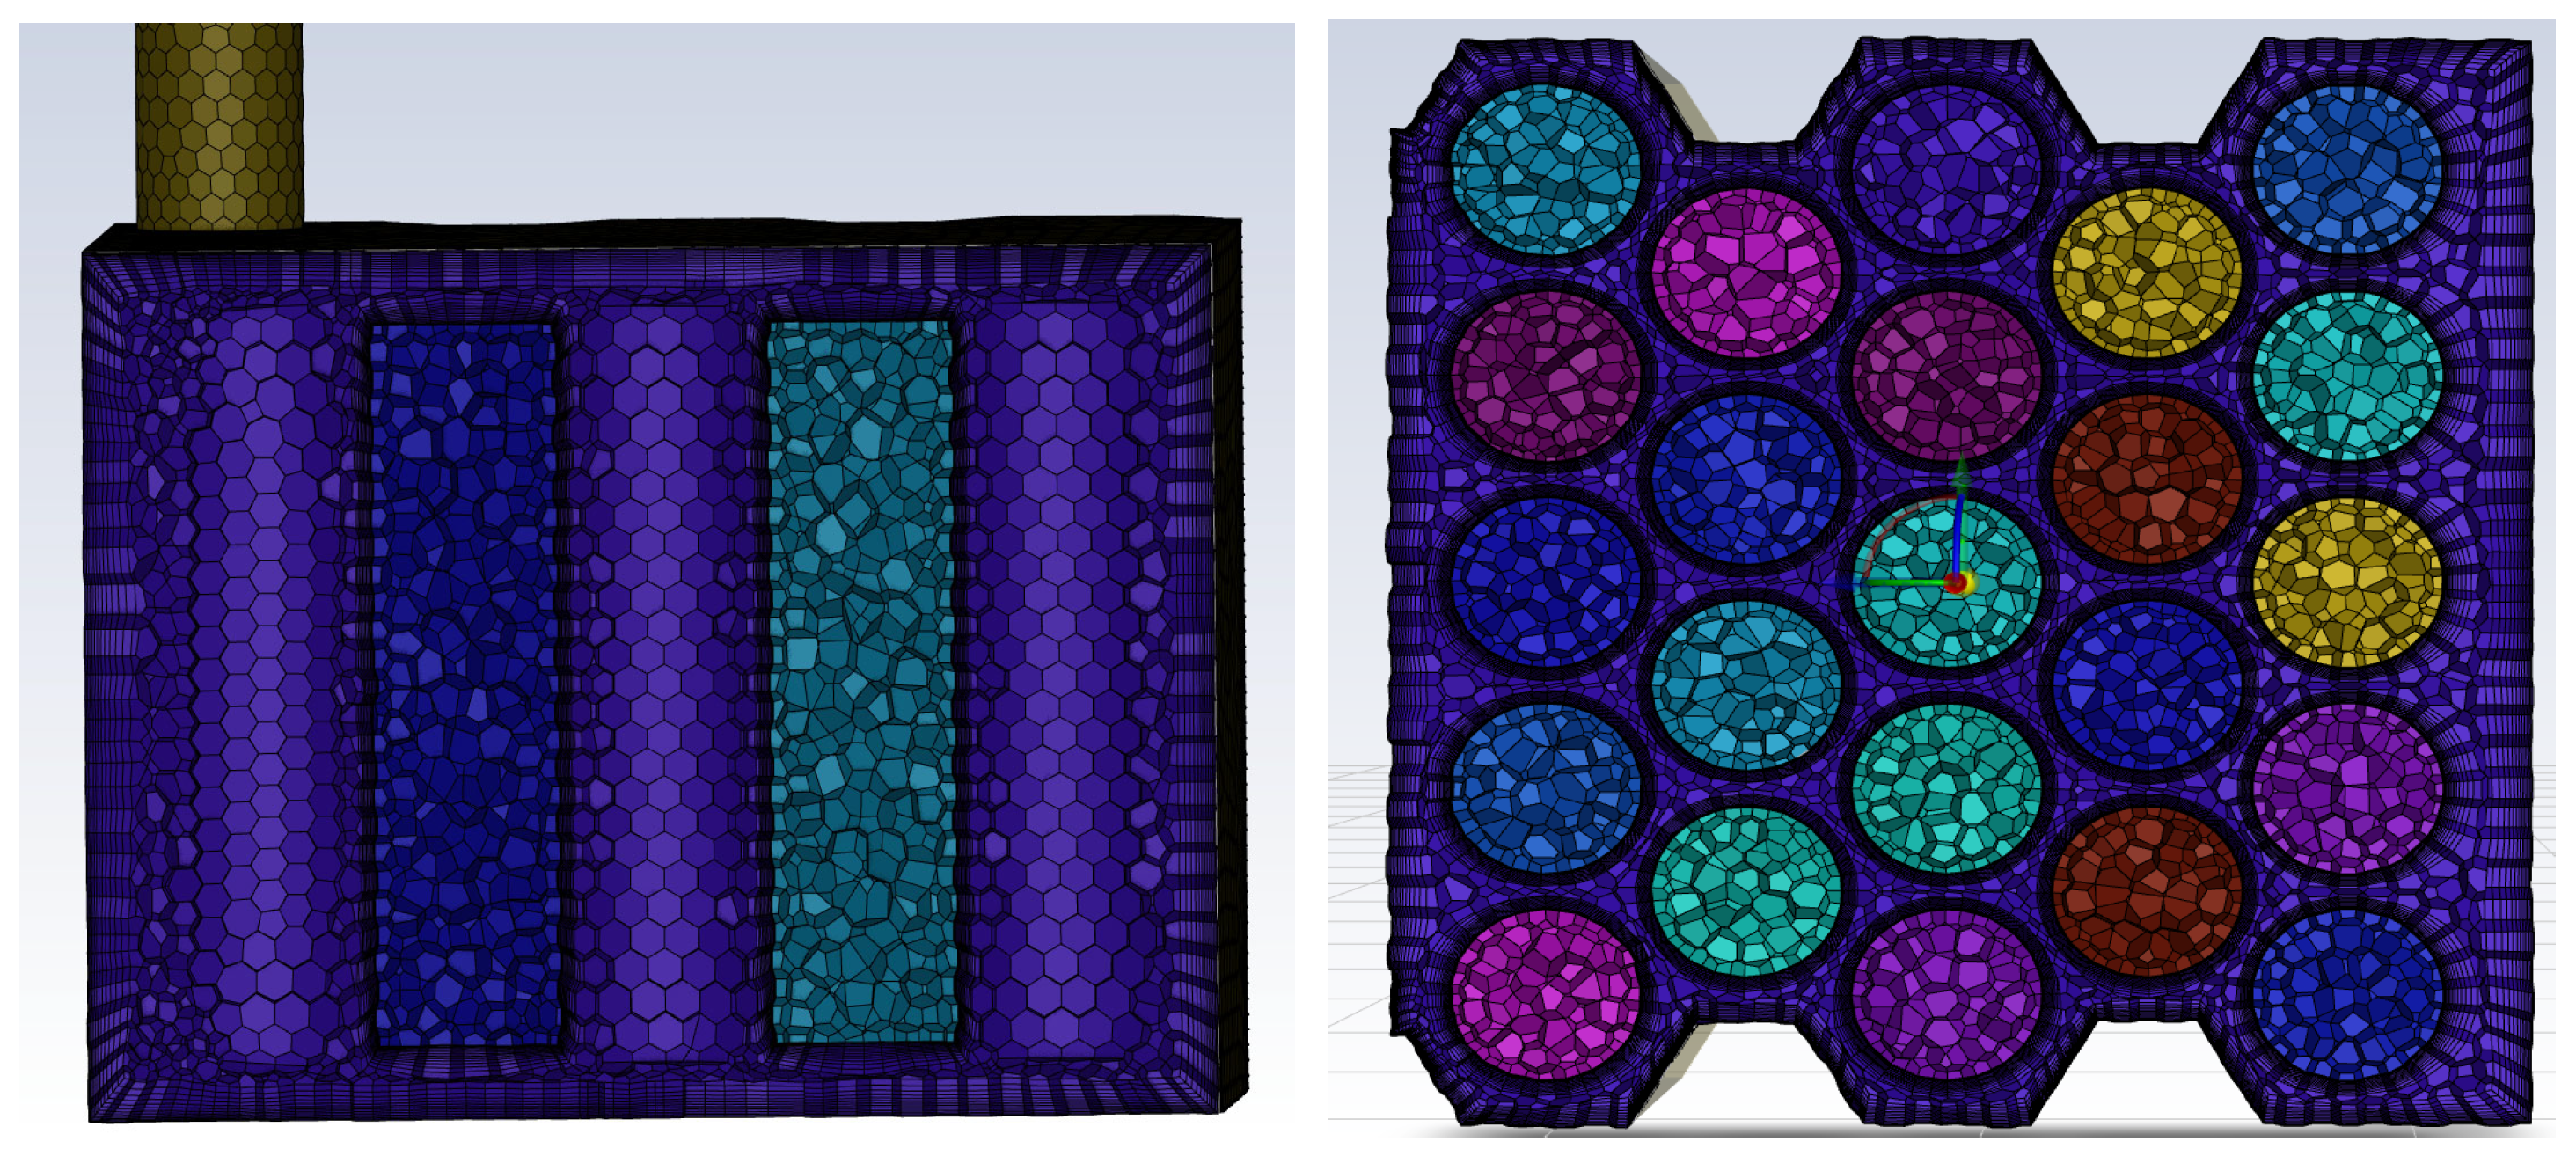
The mesh independence analysis confirms that variations in grid density minimally impact temperature outcomes, fostering numerical stability and model accuracy in
Figure 2. The average orthogonal quality value was found to be 0.85, which is considered satisfactory for numerical accuracy and mesh reliability.
Figure 3 presents the results of the grid independence test conducted for models with varying mesh densities. The results indicate that variations in the mesh size exert no significant influence on the maximum temperature of the battery pack, confirming that the selected grid is adequate for subsequent simulations. Fine meshing near battery surfaces enhances local thermal gradient resolution, as well as y+ (y-plus) values. The y
+ distribution was kept below 1 across all cell surfaces. Thus, the low Reynolds corrections of the SST k-ω turbulence model were properly applied. On the battery surfaces, the average y
+ was approximately 1, indicating that the boundary layer in the fluid–surface interaction was accurately resolved. Therefore, the obtained results were confirmed to be reliable in terms of boundary layer resolution. In addition, the average y
+ value was found to be 0.237. For the computational domain, the number of elements is 361,035, and the number of nodes is 897,428, which were generated to calculate the numerical model efficiently. The number of elements is increased to 1,168,762 to ensure mesh independence and obtain acceptable y+ results, as shown in
Figure 3, from 361,035 cells to 1,168,762 cells.
Mesh independence analysis confirmed that variations in grid density (from ~350,000 to ~1,200,000 cells) had a negligible impact on the maximum cell temperature, with differences within approximately 0.016 °C. Similarly, iteration independence tests showed consistent thermal profiles across simulations, confirming the numerical stability and accuracy of the model. Iteration independence is also provided for this numerical study as the iteration numbers reach ~26,000.
2.4. Model Verification
The validation study was conducted using the experimental data reported by Giammichele et al. [
32]. In the experimental setup, 18,650 cylindrical Li-ion battery cells were immersed in a dielectric liquid coolant under steady-state conditions. The thermal performance of the system was evaluated by measuring the surface temperature distribution of the battery cells under a constant heat generation rate. The CFD model was constructed using the same geometric configuration and boundary conditions, including the heat generation rate per cell, the coolant type, and coolant temperature. Conjugate heat transfer between the solid and liquid domains was considered.
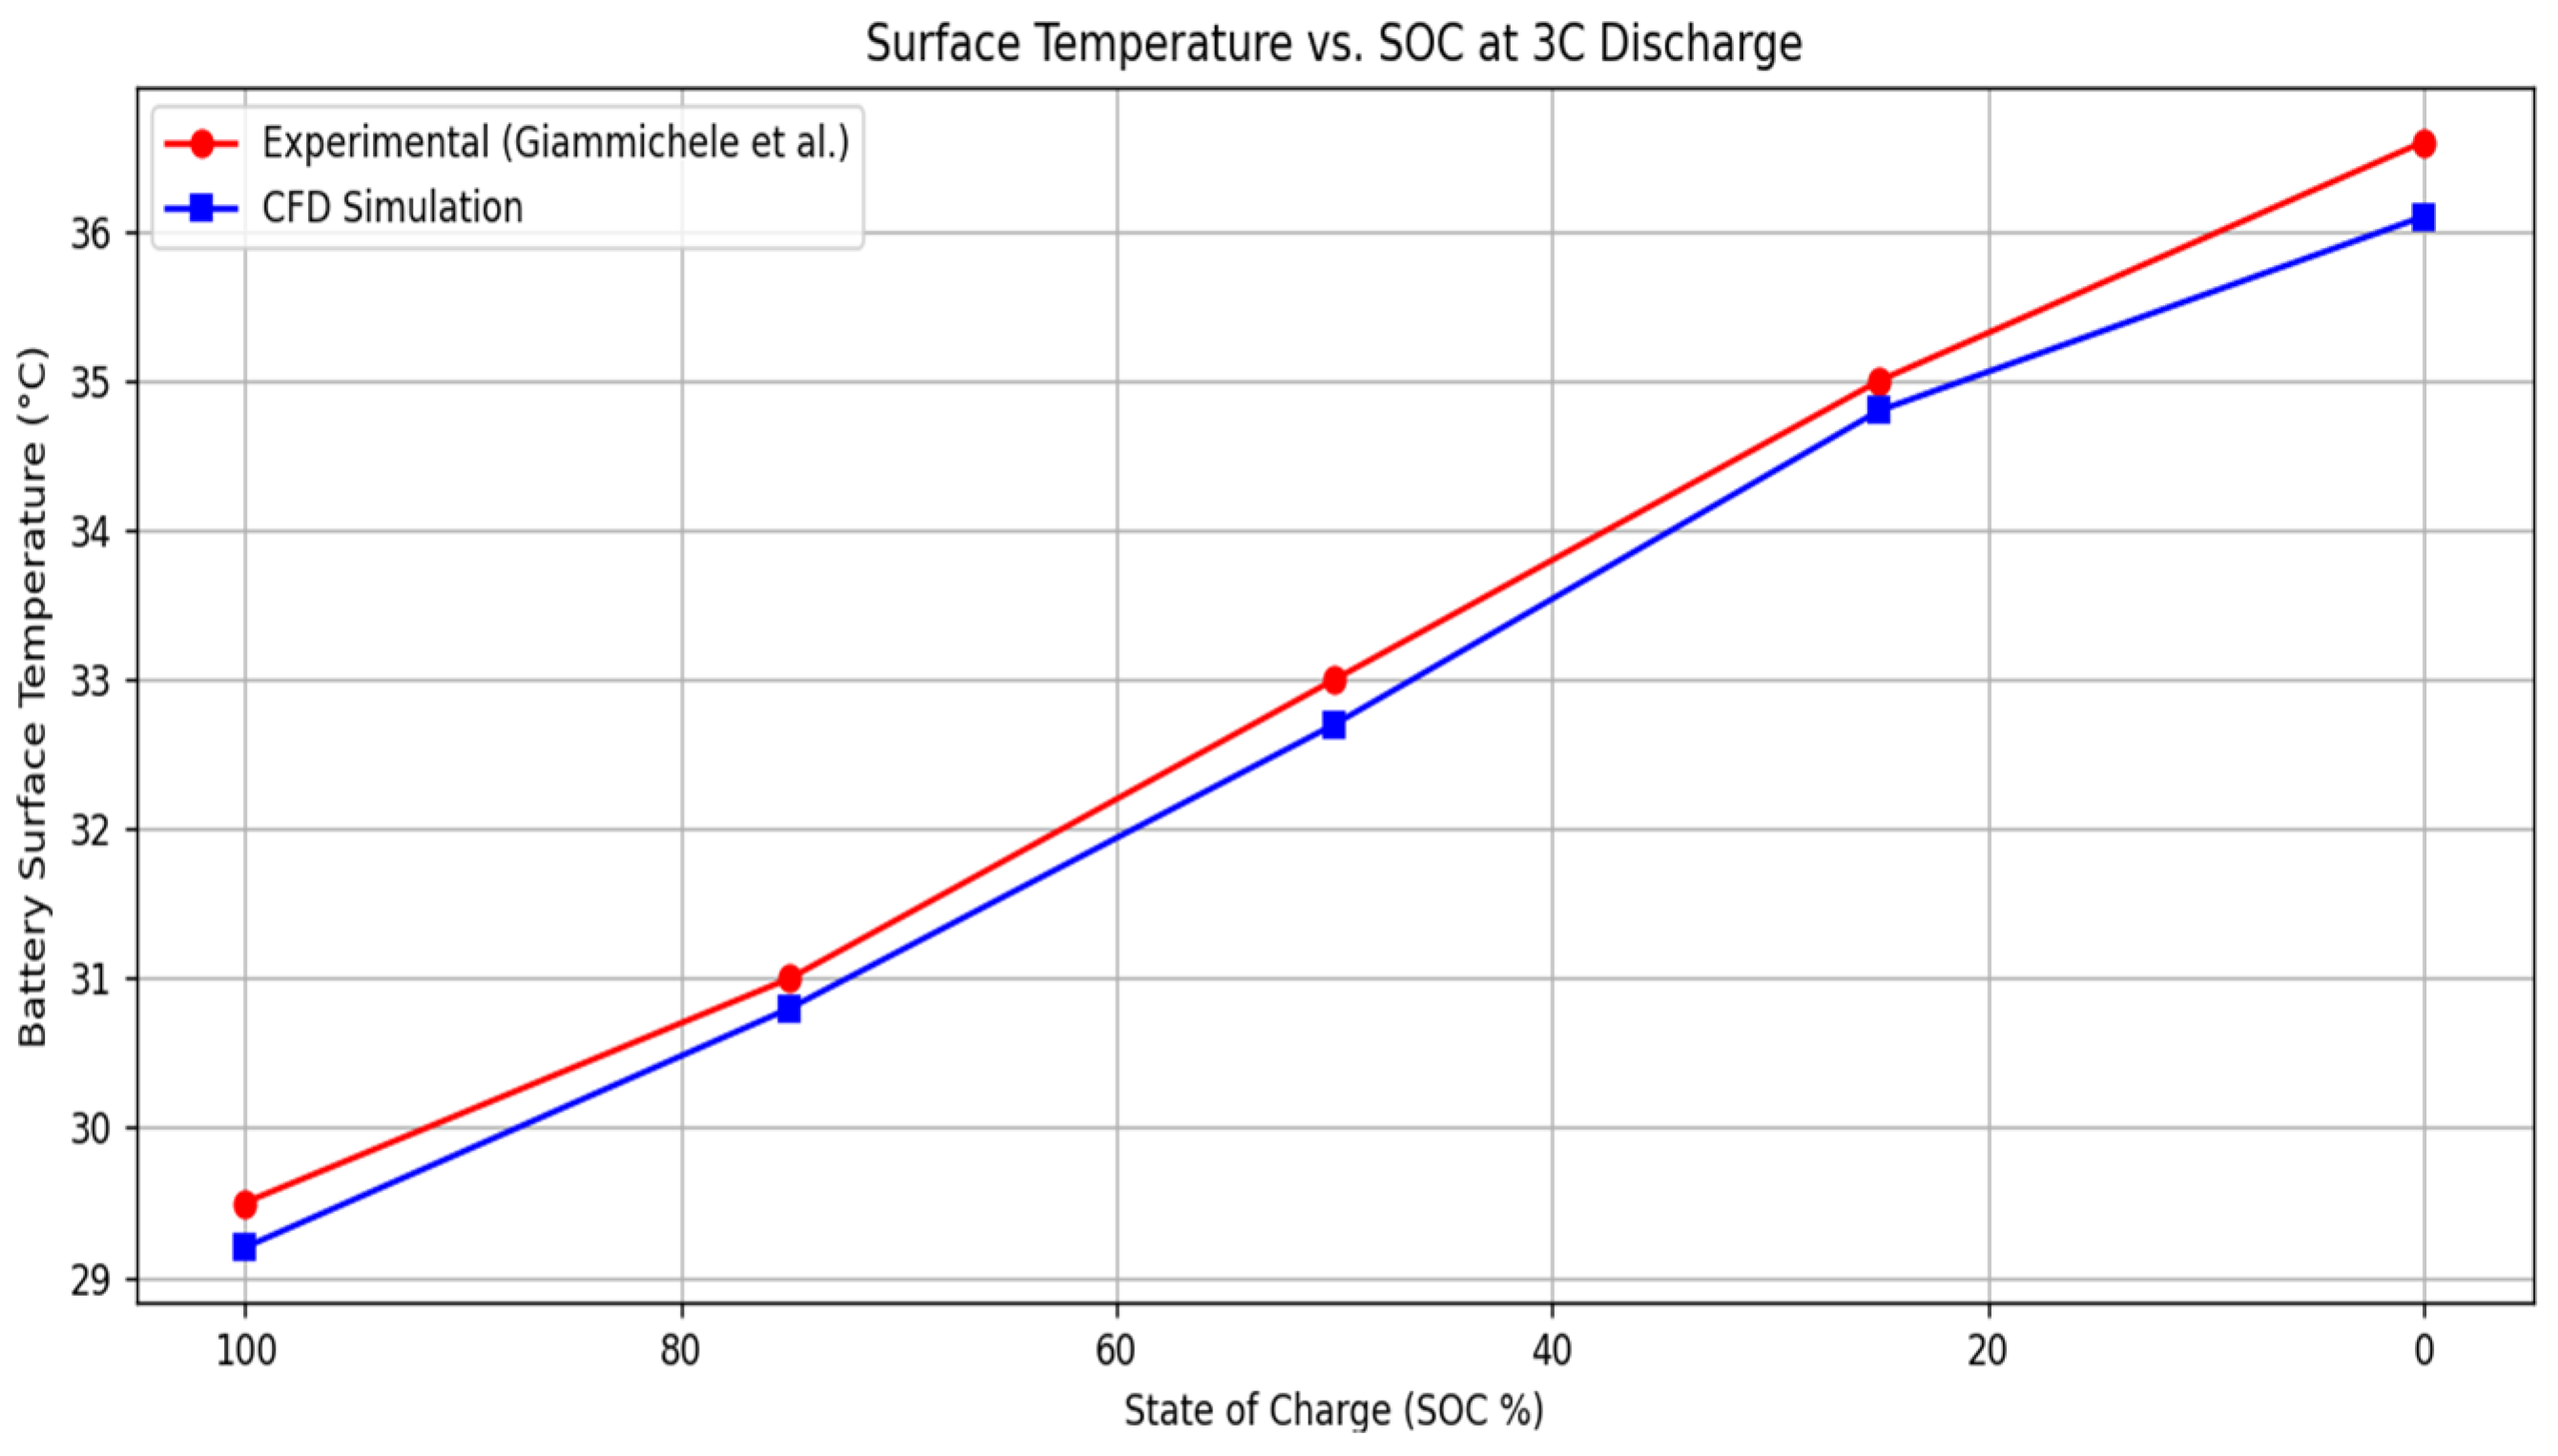
Table 5 and
Figure 4 compare the simulated and experimental temperature profiles at various locations on the cell surface.
Table 5 presents the quantitative comparison of key parameters. The results demonstrate good agreement between simulation and experimental data, with a maximum deviation of less than 3%. This confirms that the developed CFD model can accurately predict the thermal behavior of immersion-cooled Li-ion battery systems.
The validation study was conducted using experimental data from Giammichele et al. [
32], which involved a 18,650 LiFePO
4 battery directly immersed in Novec 7000. For a 3C constant current discharge at a 32 °C ambient temperature, the maximum surface temperature was reported to be ~36.6 °C. The CFD model predicted a maximum temperature of 42.2 °C, resulting in a relative error of 2.9%. The close agreement between simulated and measured values confirms the validity of the developed thermal model.
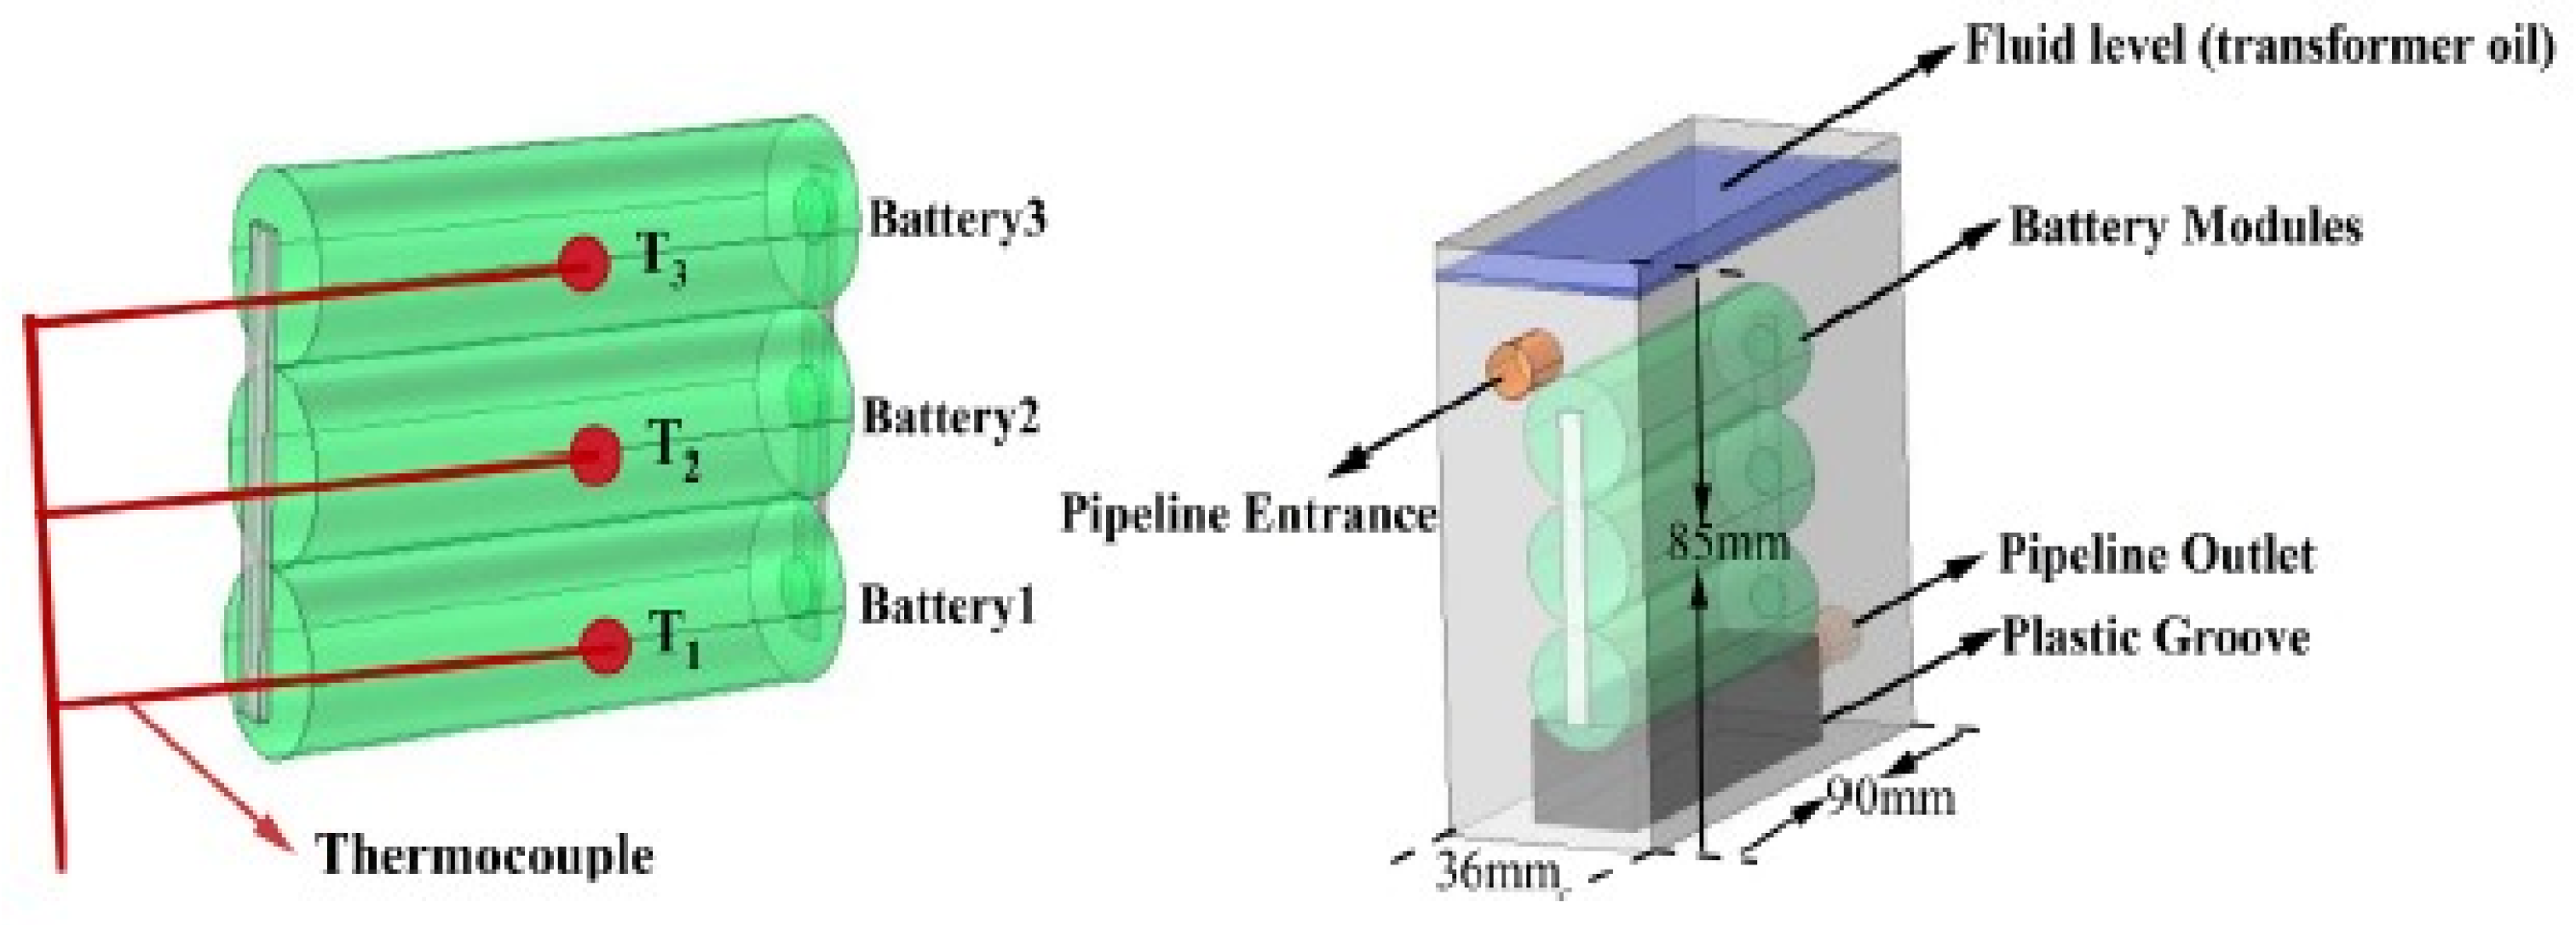
As shown in
Figure 5, in the experimental validation process, we used an experimental setup recognized in the literature. Specifically, the experimental system in which 18,650 cylindrical lithium-ion batteries were cooled by forced flow in transformer oil, as described in a study published in Process Safety and Environmental Protection by Luyao Zhao et al. [
33], was taken as a reference. The same type of cell structure, similar thermal boundary conditions, flow rate ranges (0–500 mL/min), and coolant characteristics (Kunlun Transformer Oil, CNPC KI25X, Beijing Zhonghang Hangte Lubrication Technology Co., Ltd., Beijing, China) were used. As part of this validation, the following parameters were compared between our CFD results and experimental data:
Maximum surface temperature (Tmax). The results showed that the maximum temperature difference was less than 2 °C, and the average error rate was less than 5%, as illustrated in
Figure 6 and
Figure 7.
As shown in
Figure 7, the simulation results are in significant agreement with experimental measurements. The points where the experimental and simulation curves do not coincide are caused by finite volume approximation, geometric uncertainties, and some unverifiable boundary conditions.
Therefore, the study presents not only numerical modeling but also a numerical validation approach validated with experimental data. Furthermore, the high agreement of the CFD results with experimental trends supports the predictive power and reliability of the model.
3. Results
Recent investigations have demonstrated that immersion cooling employing nano-enhanced fluids can substantially mitigate thermal gradients, thereby improving overall thermal uniformity. Consistent results have been reported by Giammichele et al. [
32] and Li et al. [
6,
14,
27].
In this study, the thermal behavior of a lithium-ion battery module consisting of 23 cylindrical cells under immersion cooling conditions was investigated using computational fluid dynamics (CFD) simulations. The simulations were conducted to evaluate temperature distribution, pressure drop, flow characteristics, and heat transfer performance under defined geometric and operational parameters.
Initially, transient simulations have been performed, and the temperature distribution for 2C is shown in
Figure 8.
After transient simulations, as illustrated in
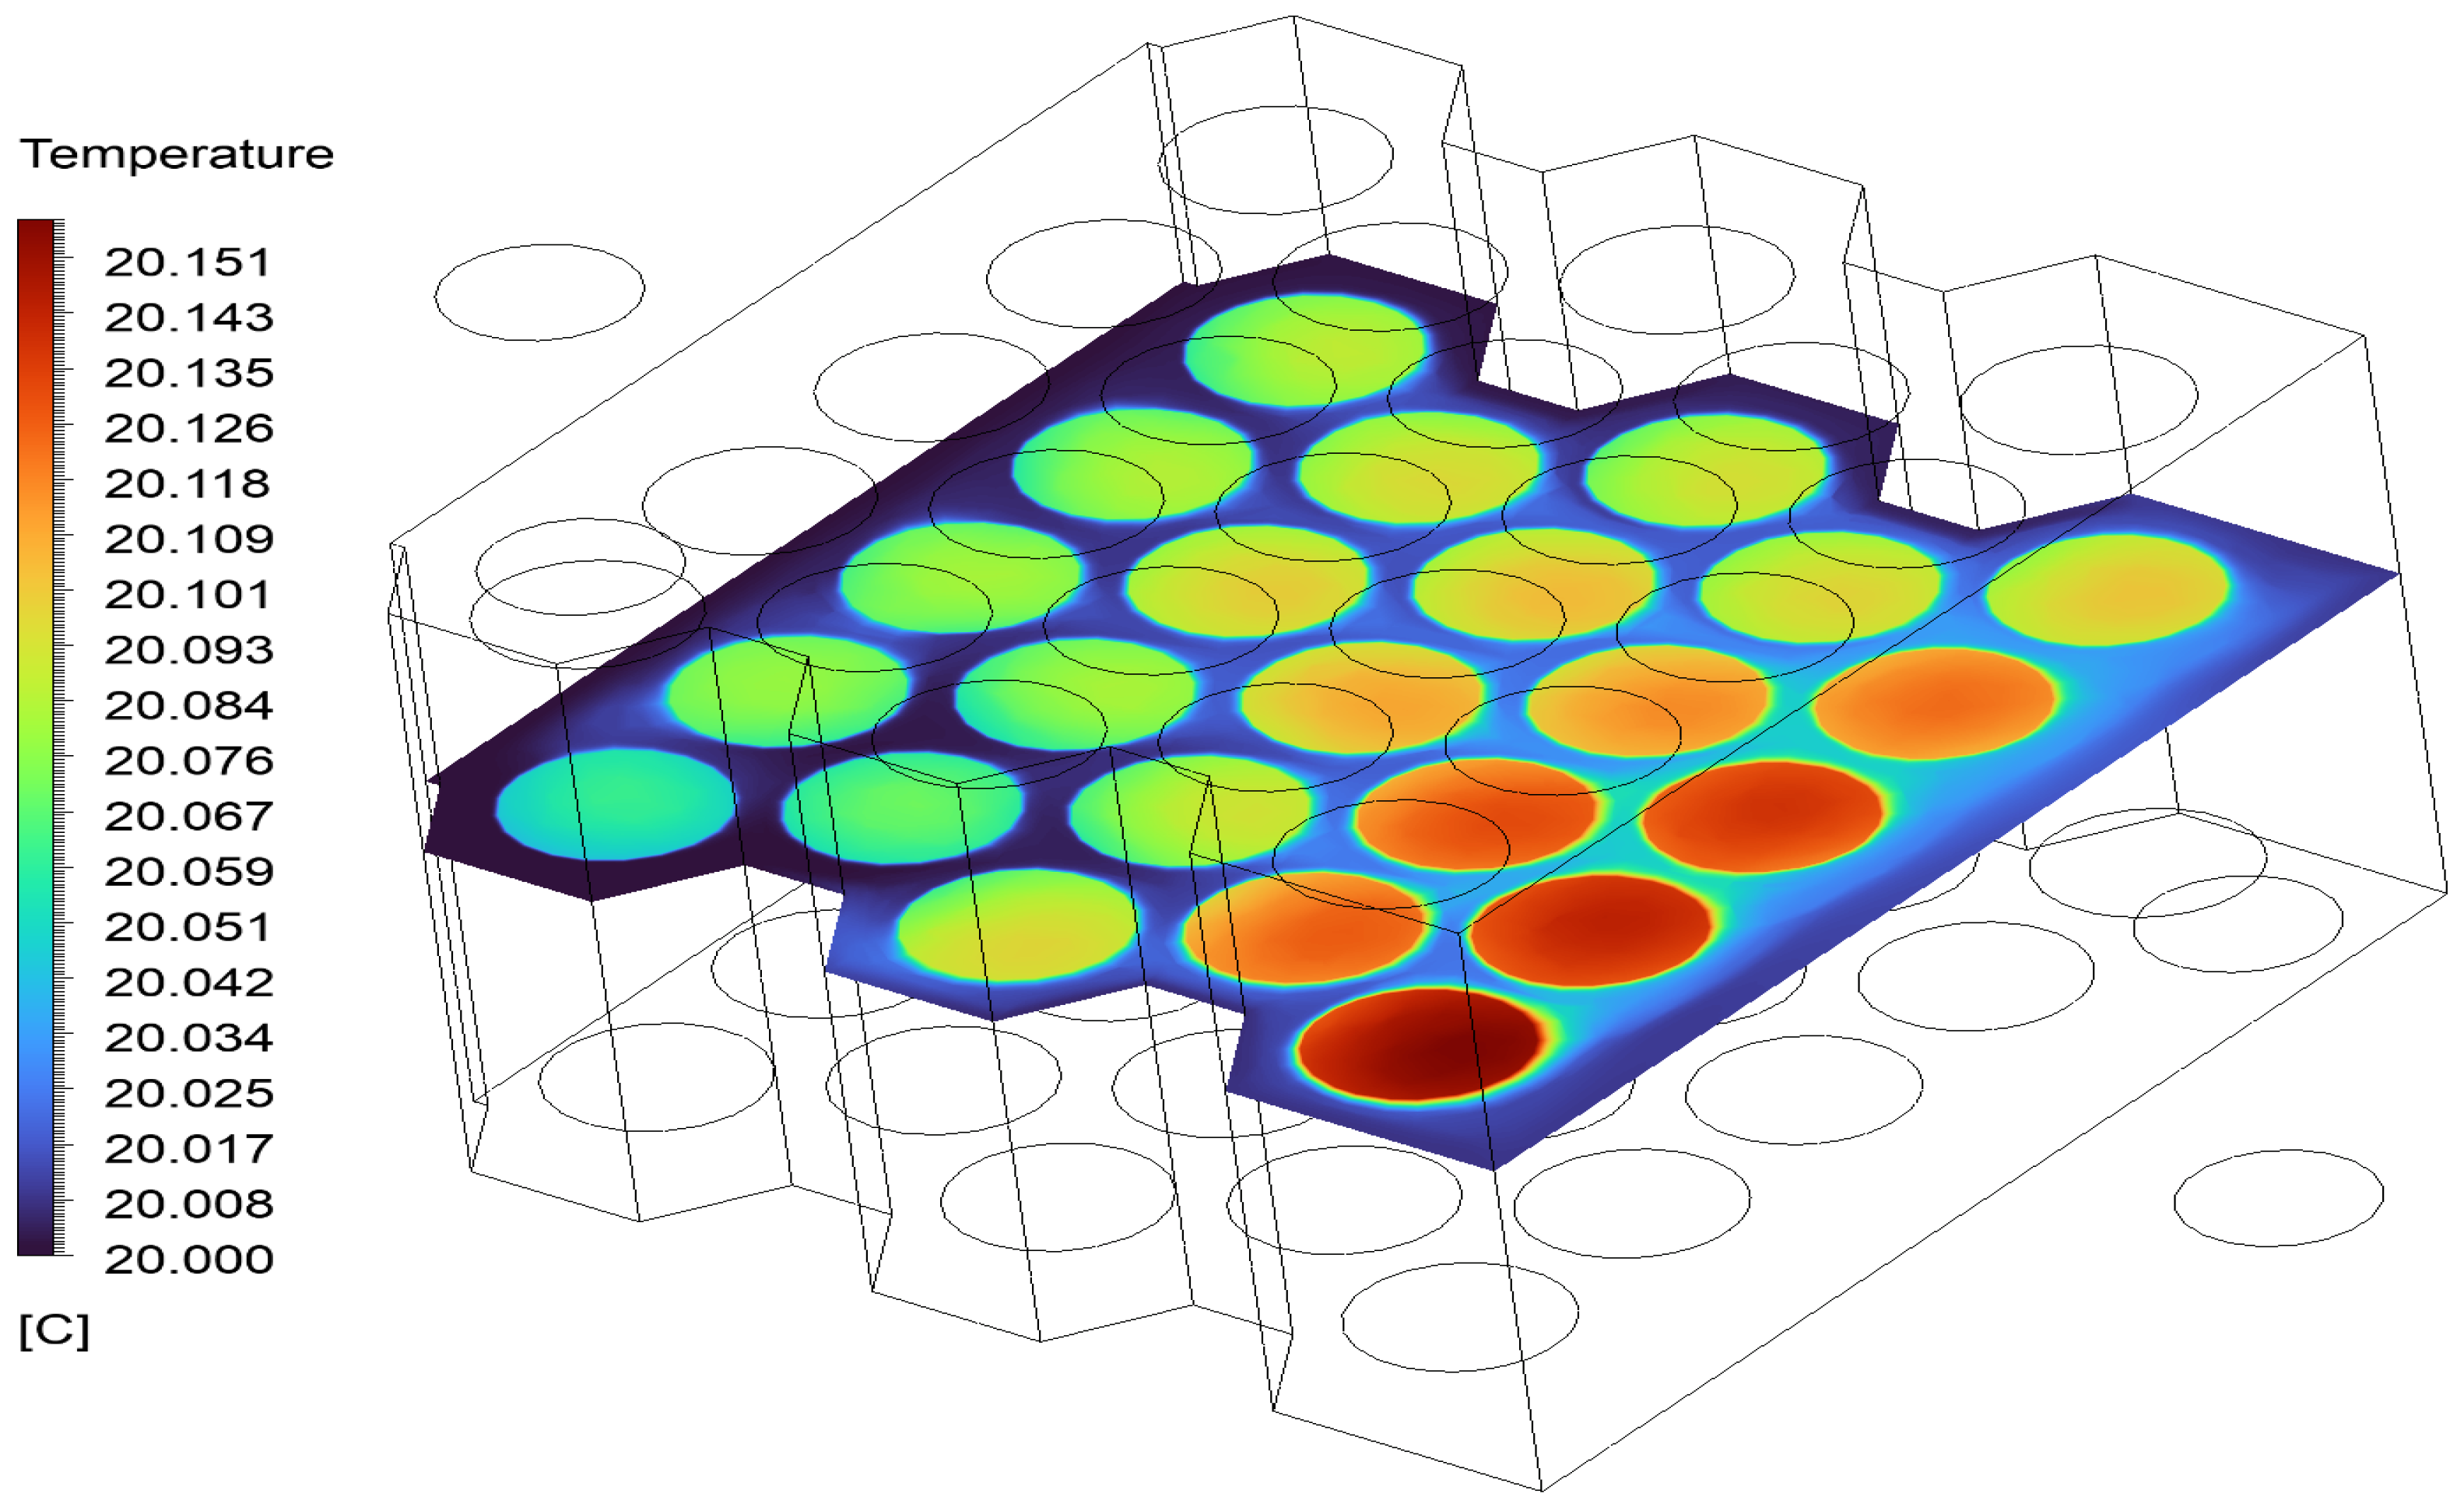
Figure 9, steady-state simulations have been carried out. The temperature distribution and thermal uniformity revealed that the temperature across the battery cells was not uniform, with the right corner peripheral cells experiencing higher surface temperatures compared to the left corner and central ones. The maximum observed cell temperature reached approximately 20.1 °C, particularly in the lower-middle region of the module, indicating insufficient uniformity of coolant flow in that zone. The thermal non-uniformity observed emphasizes the necessity of optimizing flow paths to mitigate local heat accumulation.
The average temperature across all cells was maintained above 20.1 °C, which is considered acceptable for safe operation. Moreover, the temperature difference between the hottest and coolest cells reached 0.147 °C, indicating that immersion cooling is more efficient and can enhance temperature homogeneity, thereby improving coolant flow, channel design, and battery cooling.
Streamline visualizations showed that the coolant flow was mostly turbulent and rarely laminar, with minor recirculation regions near geometrical discontinuities, as indicated by a Reynolds number of 8782. Velocity vectors revealed reduced flow velocities in central regions, which coincided with the observed thermal hotspots. This correlation underlines the need to increase flow penetration in densely packed cell arrangements.
Streamlines indicate consistent coolant flow along the channel with minor recirculation zones near the corner areas. Temperature contours on cells reveal heat concentration at the center, suggesting potential for flow path optimization, as shown in
Figure 10.
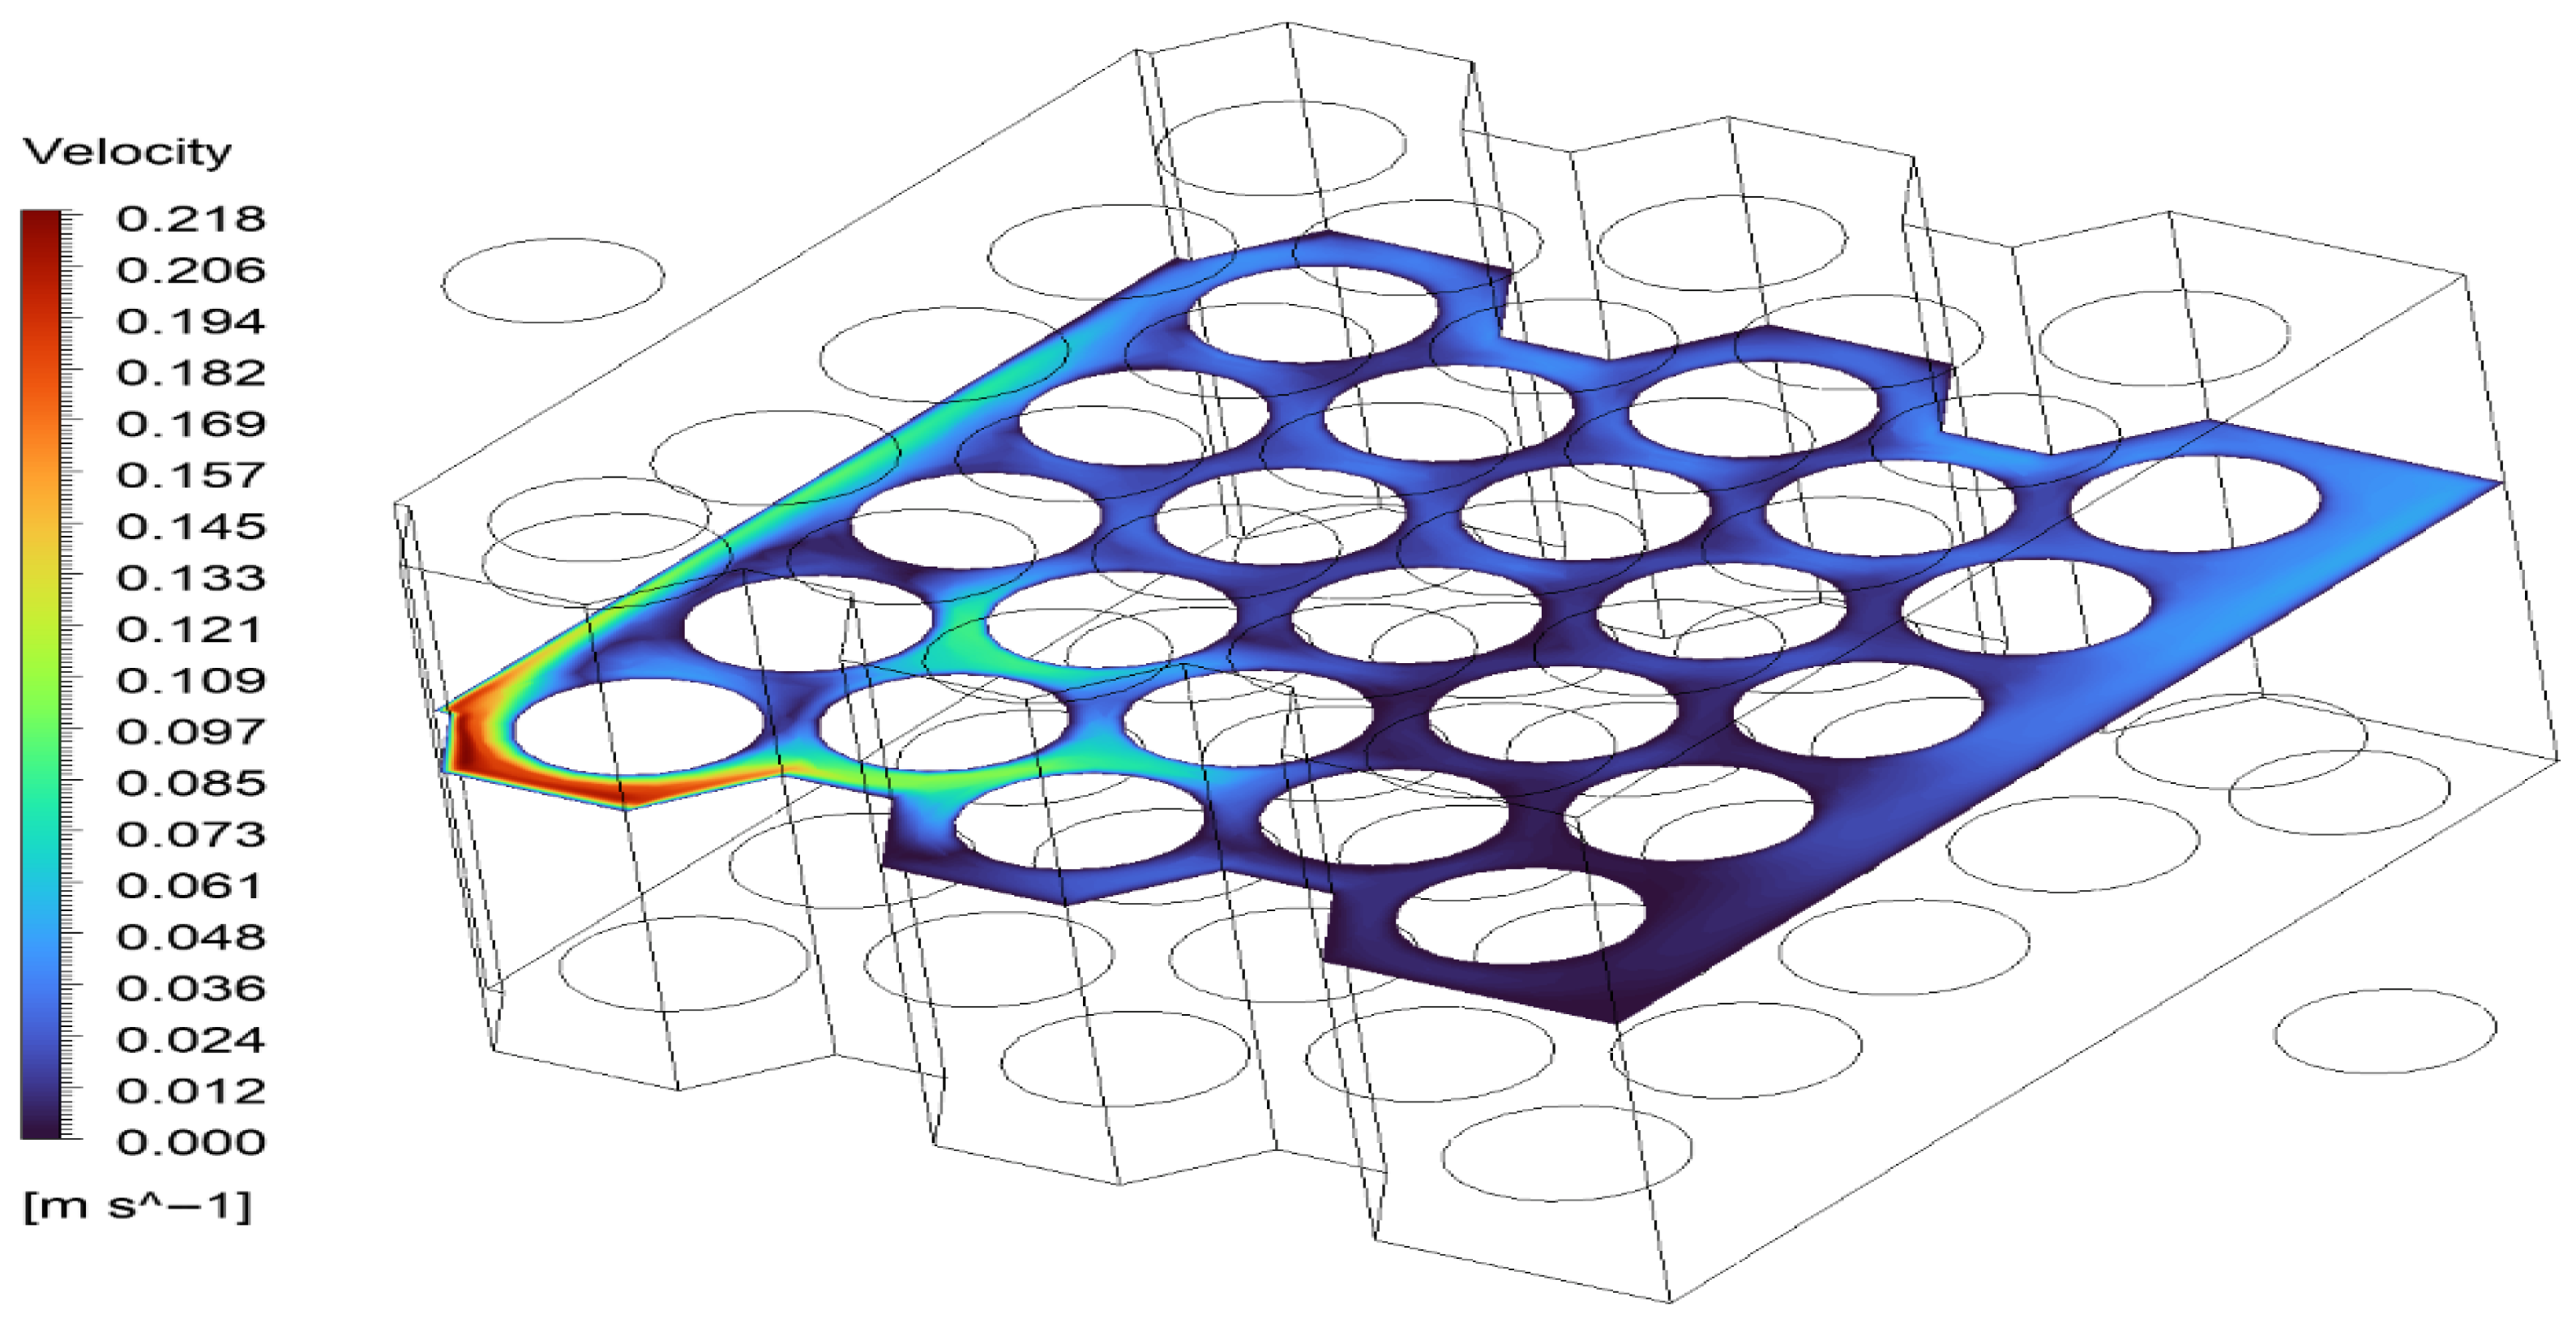
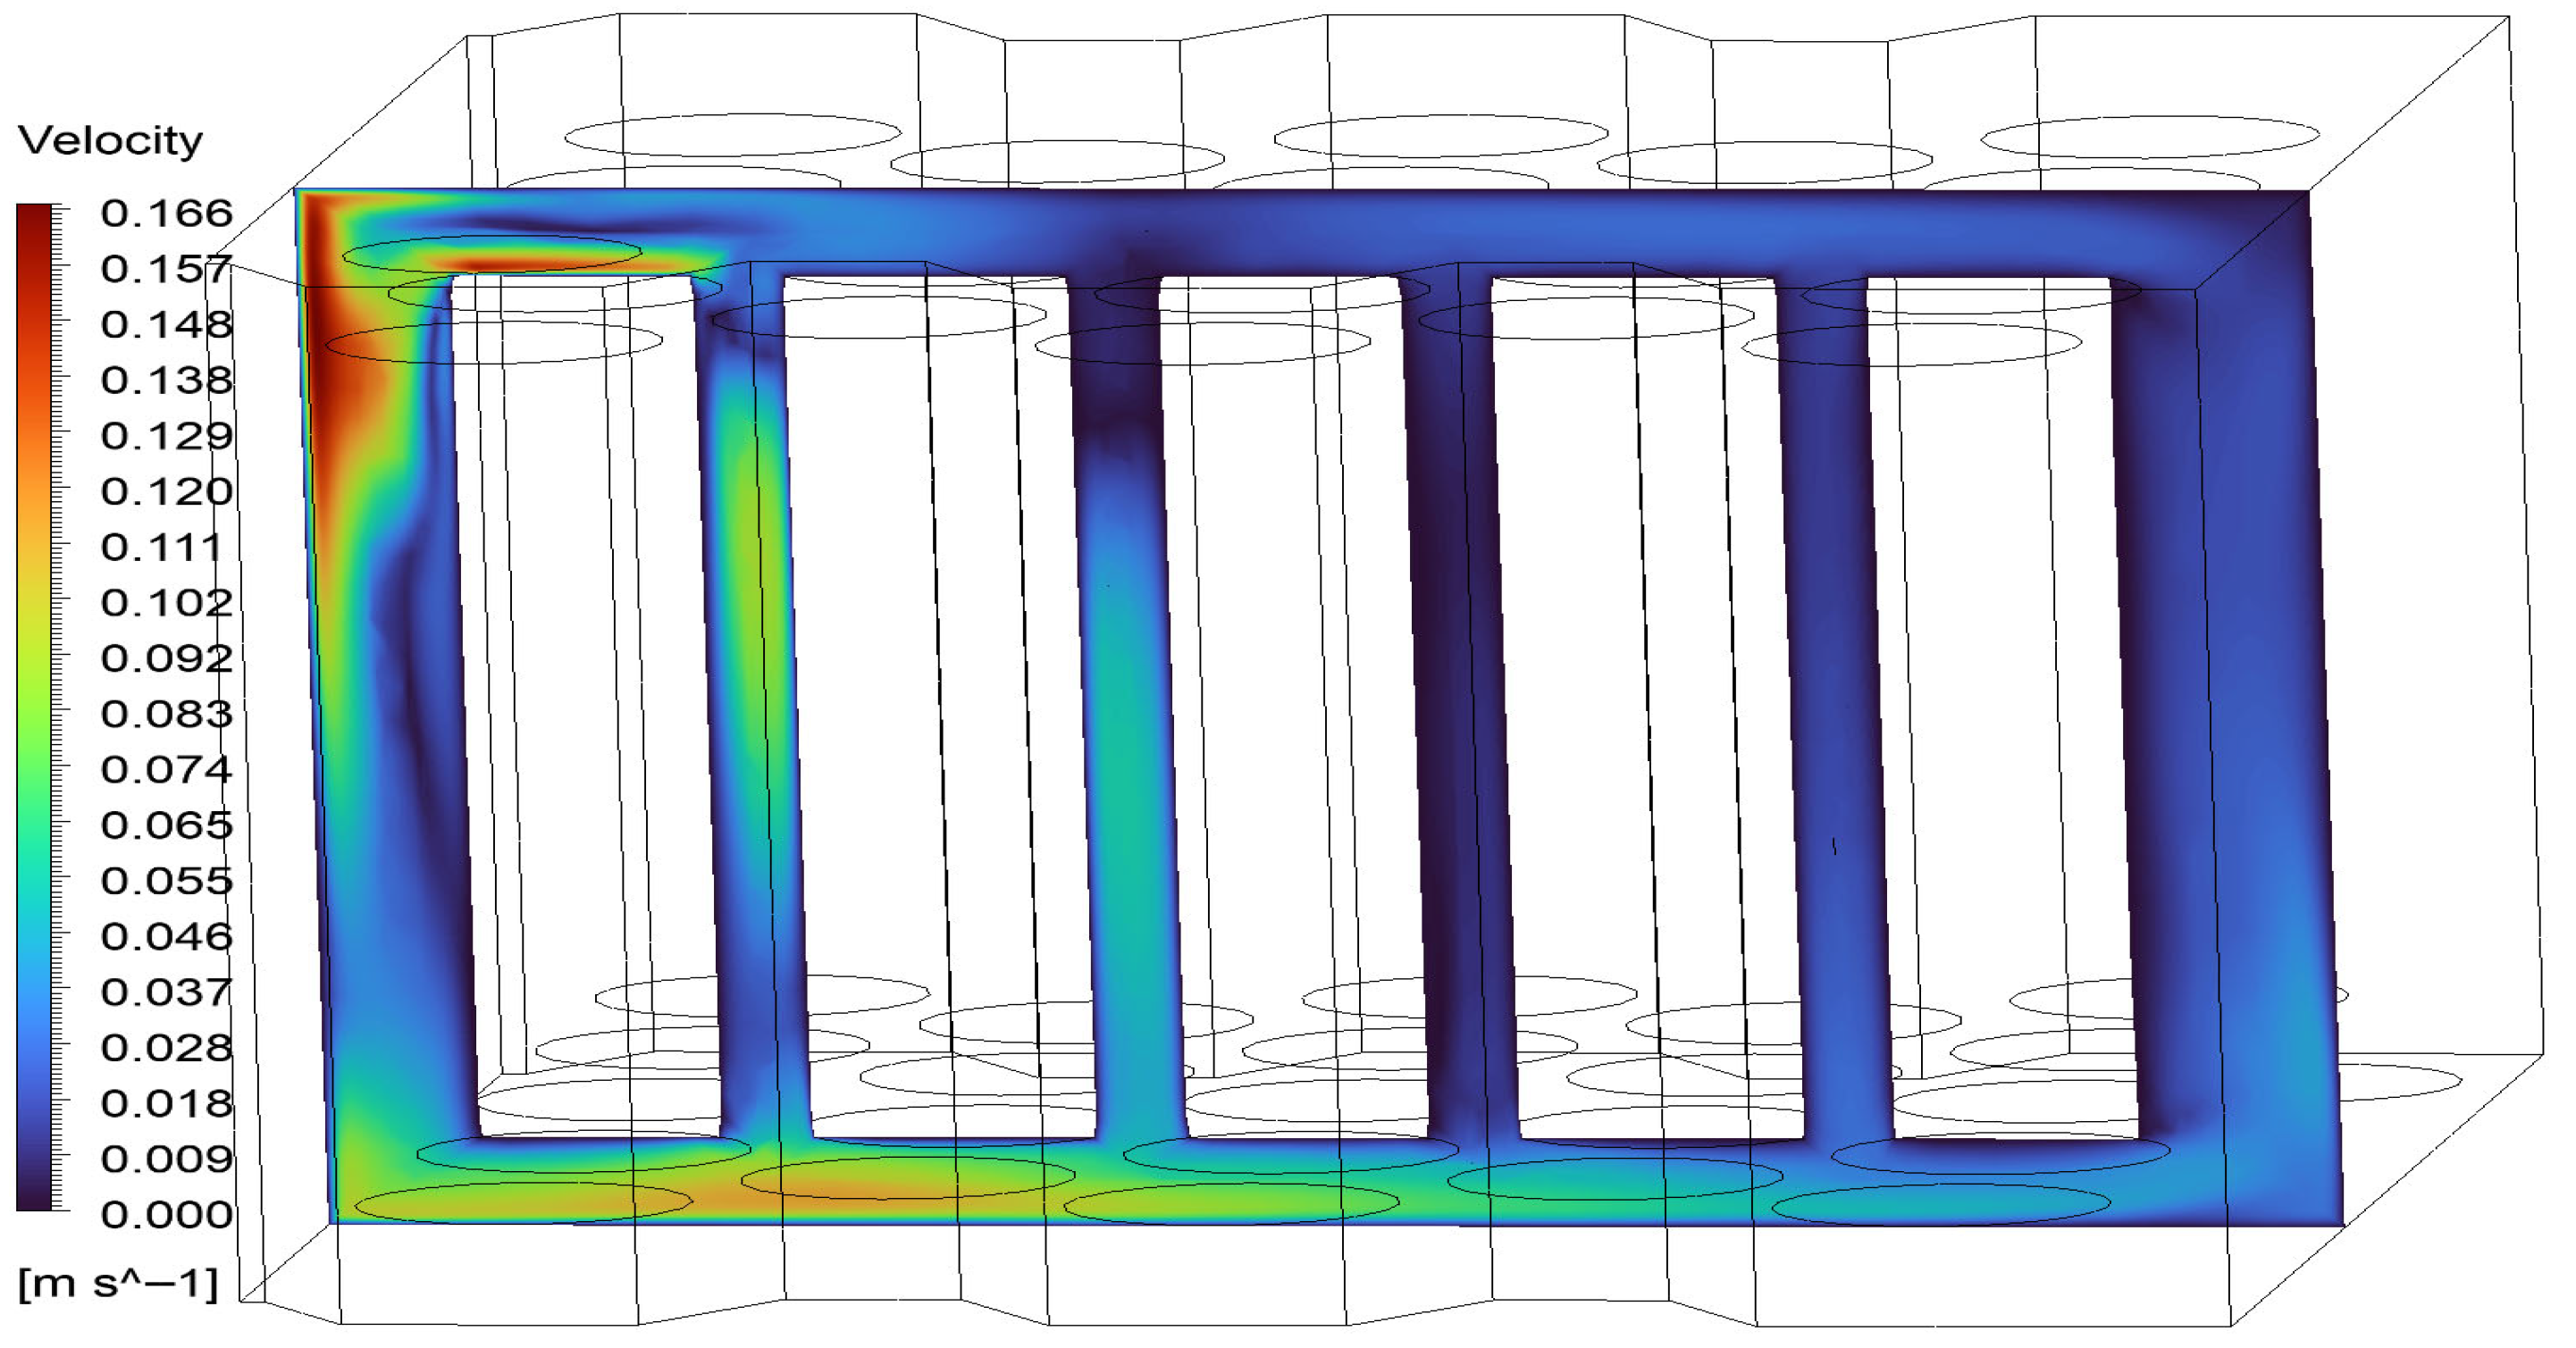
The velocity contours and streamlines shown in
Figure 10,
Figure 11 and
Figure 12 provide a detailed view of the distribution behavior of the fluid inside the cell modules in the immersion cooling system. It is observed that the fluid reaches high velocities (about 0.56 m/s and above) in the inlet zone (top left), while in the outlet zone (bottom right), the velocity increases again as it passes through the narrow space. Inside the module, the streamlines show that the fluid follows winding paths at low velocities in certain regions. This indicates that the flow velocity decreases down to 0.06 m/s due to local vortex formation (recirculation zones), especially in the middle and corner regions. Such low-velocity zones can negatively affect the heat transfer coefficient at the surface and reduce the temperature homogeneity. Therefore, optimizing the inlet-outlet configuration or flow diversion elements (such as baffles or baffle plates) in the existing flow structure will contribute to a more even distribution of the flow over the cell surfaces. These findings, while supporting the reliability of the numerical analysis results, suggest that the design parameters should be improved to target more homogeneous cooling.
The velocity contours in the horizontal cross-sectional plane presented in
Figure 12 reveal in detail the contact behavior of the fluid with the cell surfaces in the regular arrangement of the battery cells. In the inlet region, the fluid velocity reaches 0.218 m/s, while the velocity decreases to 0.02–0.01 m/s at the transitions between the cells. This indicates that the cooling performance may be locally degraded due to low velocity regions and potential vortex formation at the back of the cell. The findings suggest that channel design and inlet/outlet placements should be optimized in order to increase the homogeneity of the cooling flow.
The velocity contours of the vertical cross-sectional plane presented in
Figure 12 show the direction and velocity profile of the inter-cell cooling flow. In areas close to the inlet, the velocity values reach 0.166 m/s, while in the lower and rear regions of the module, the flow velocity drops below 0.009 m/s. This indicates that stagnant flow regions may form, especially in narrow channels and at the rear surfaces of the cell, and local cooling performance may be reduced. The findings suggest the need to optimize the channel arrangement and inlet/outlet configuration for homogeneous cooling.
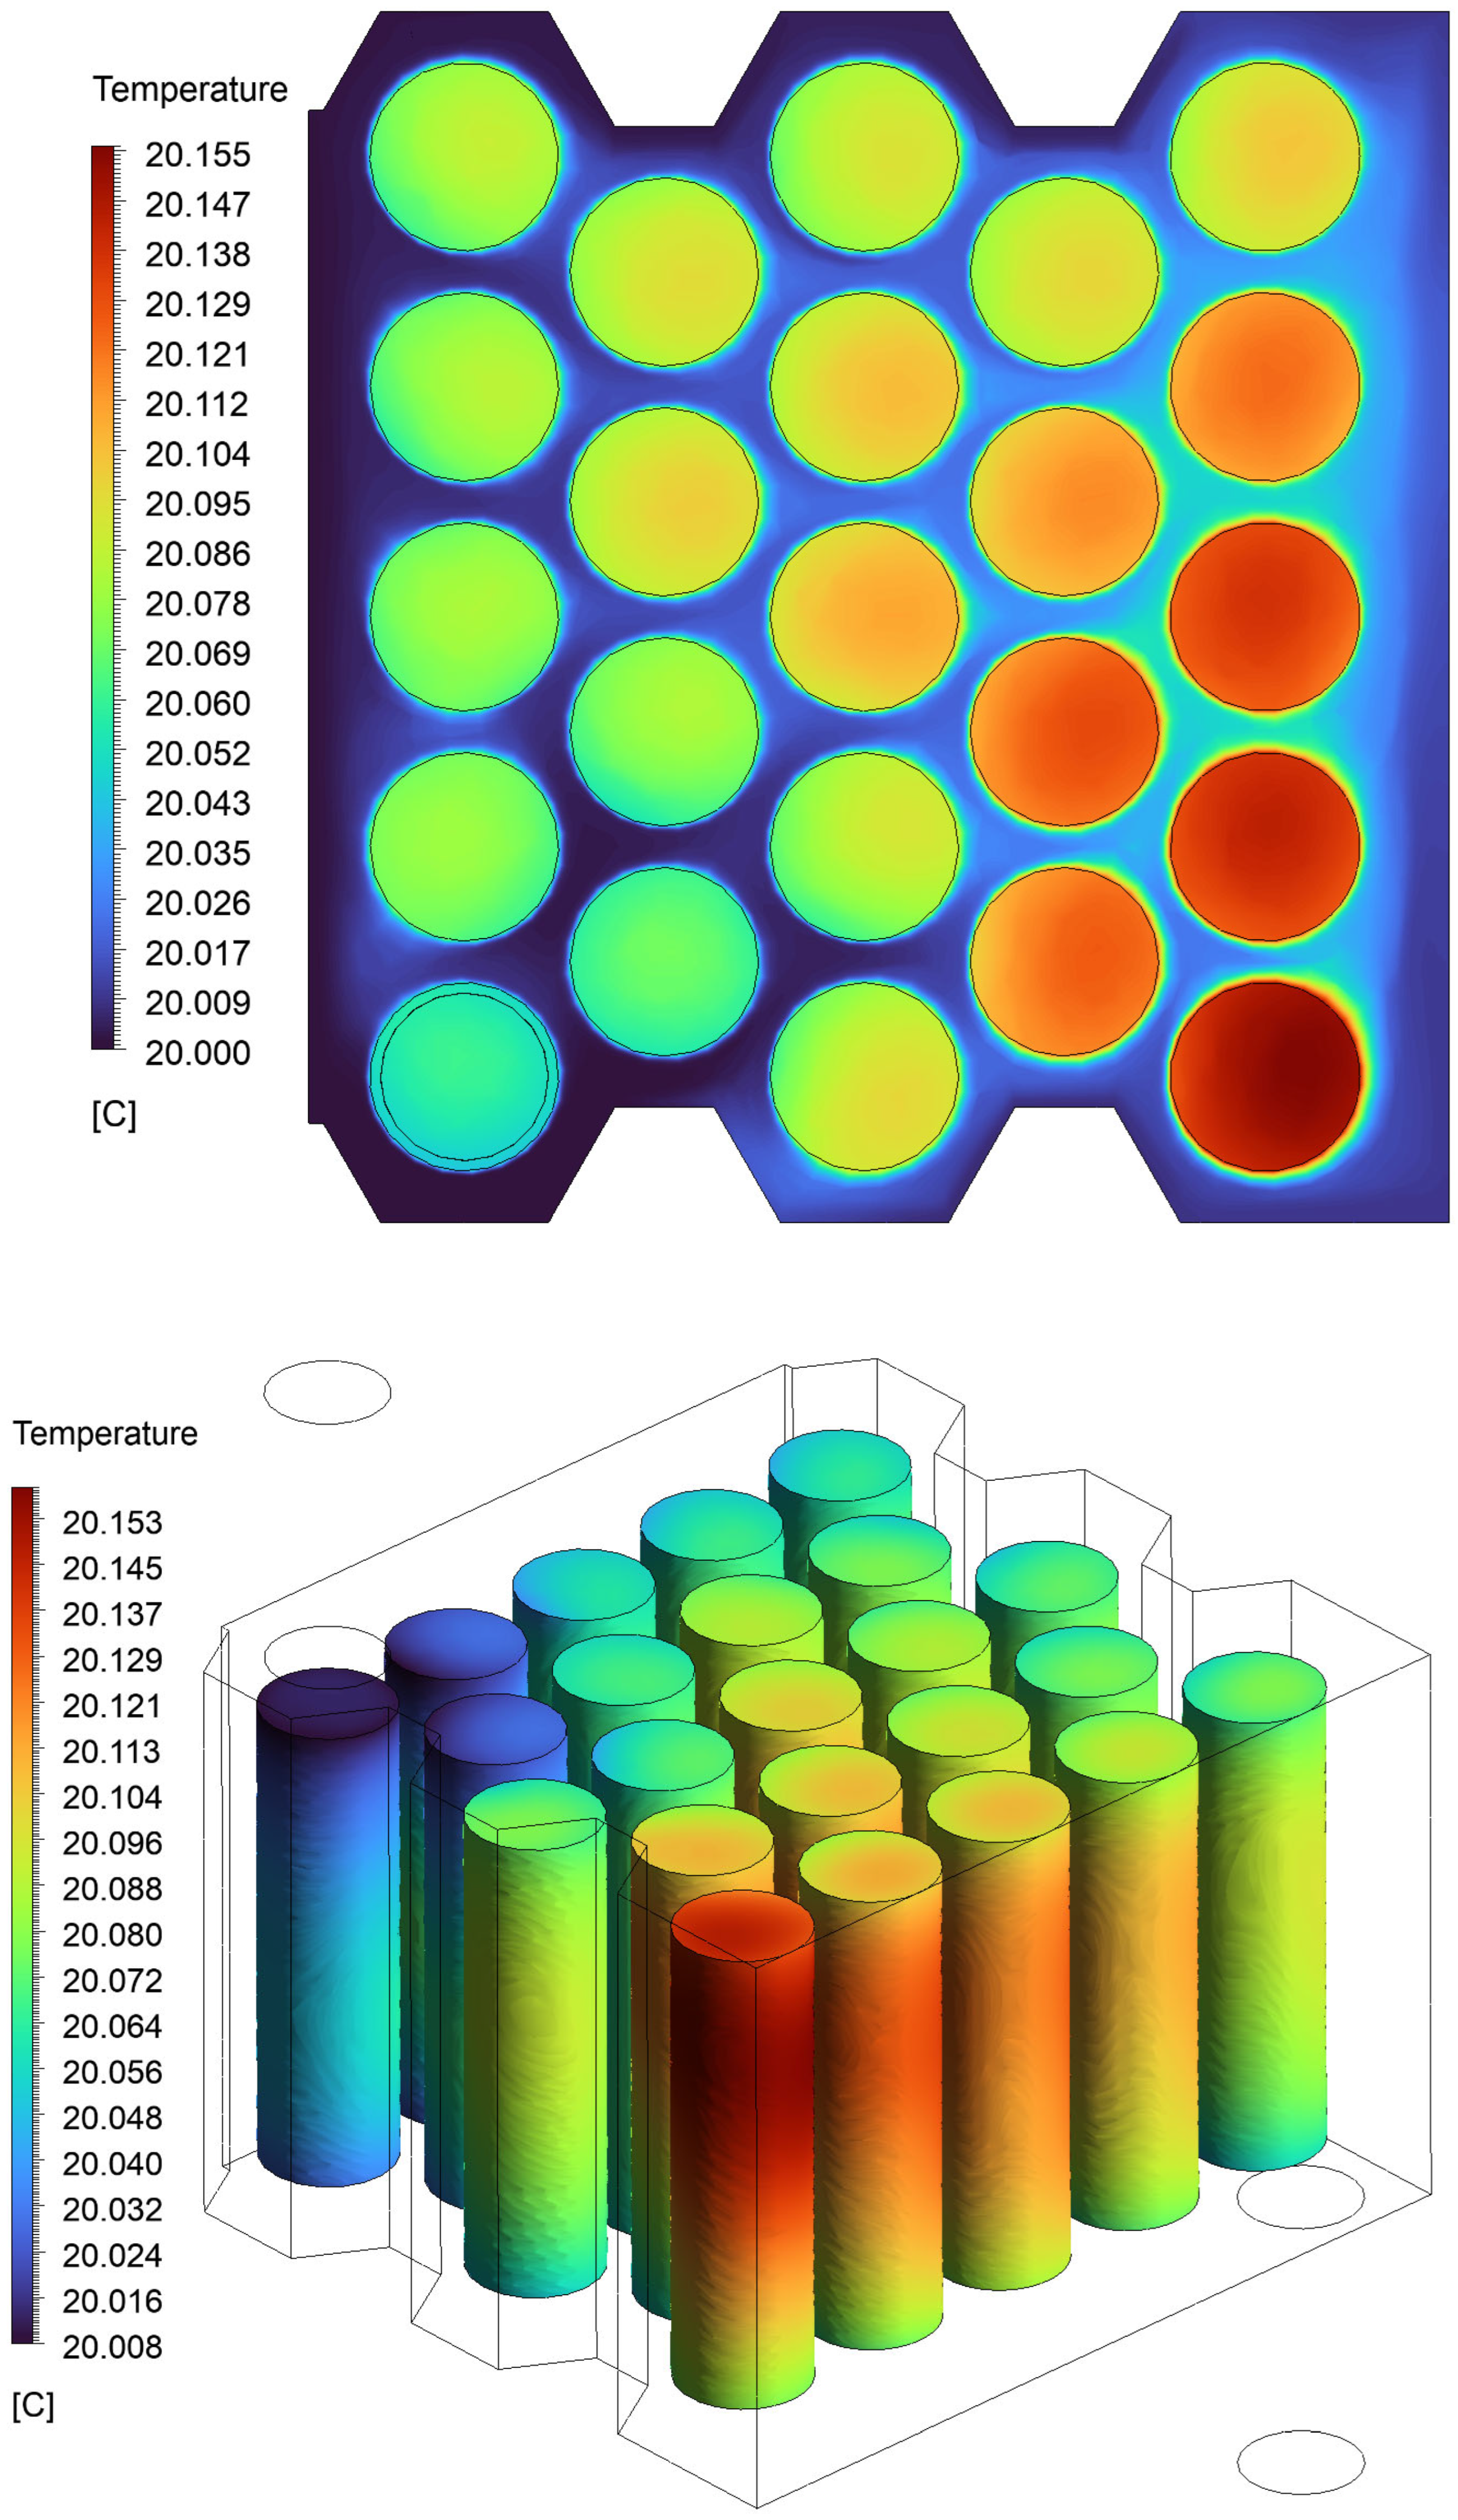
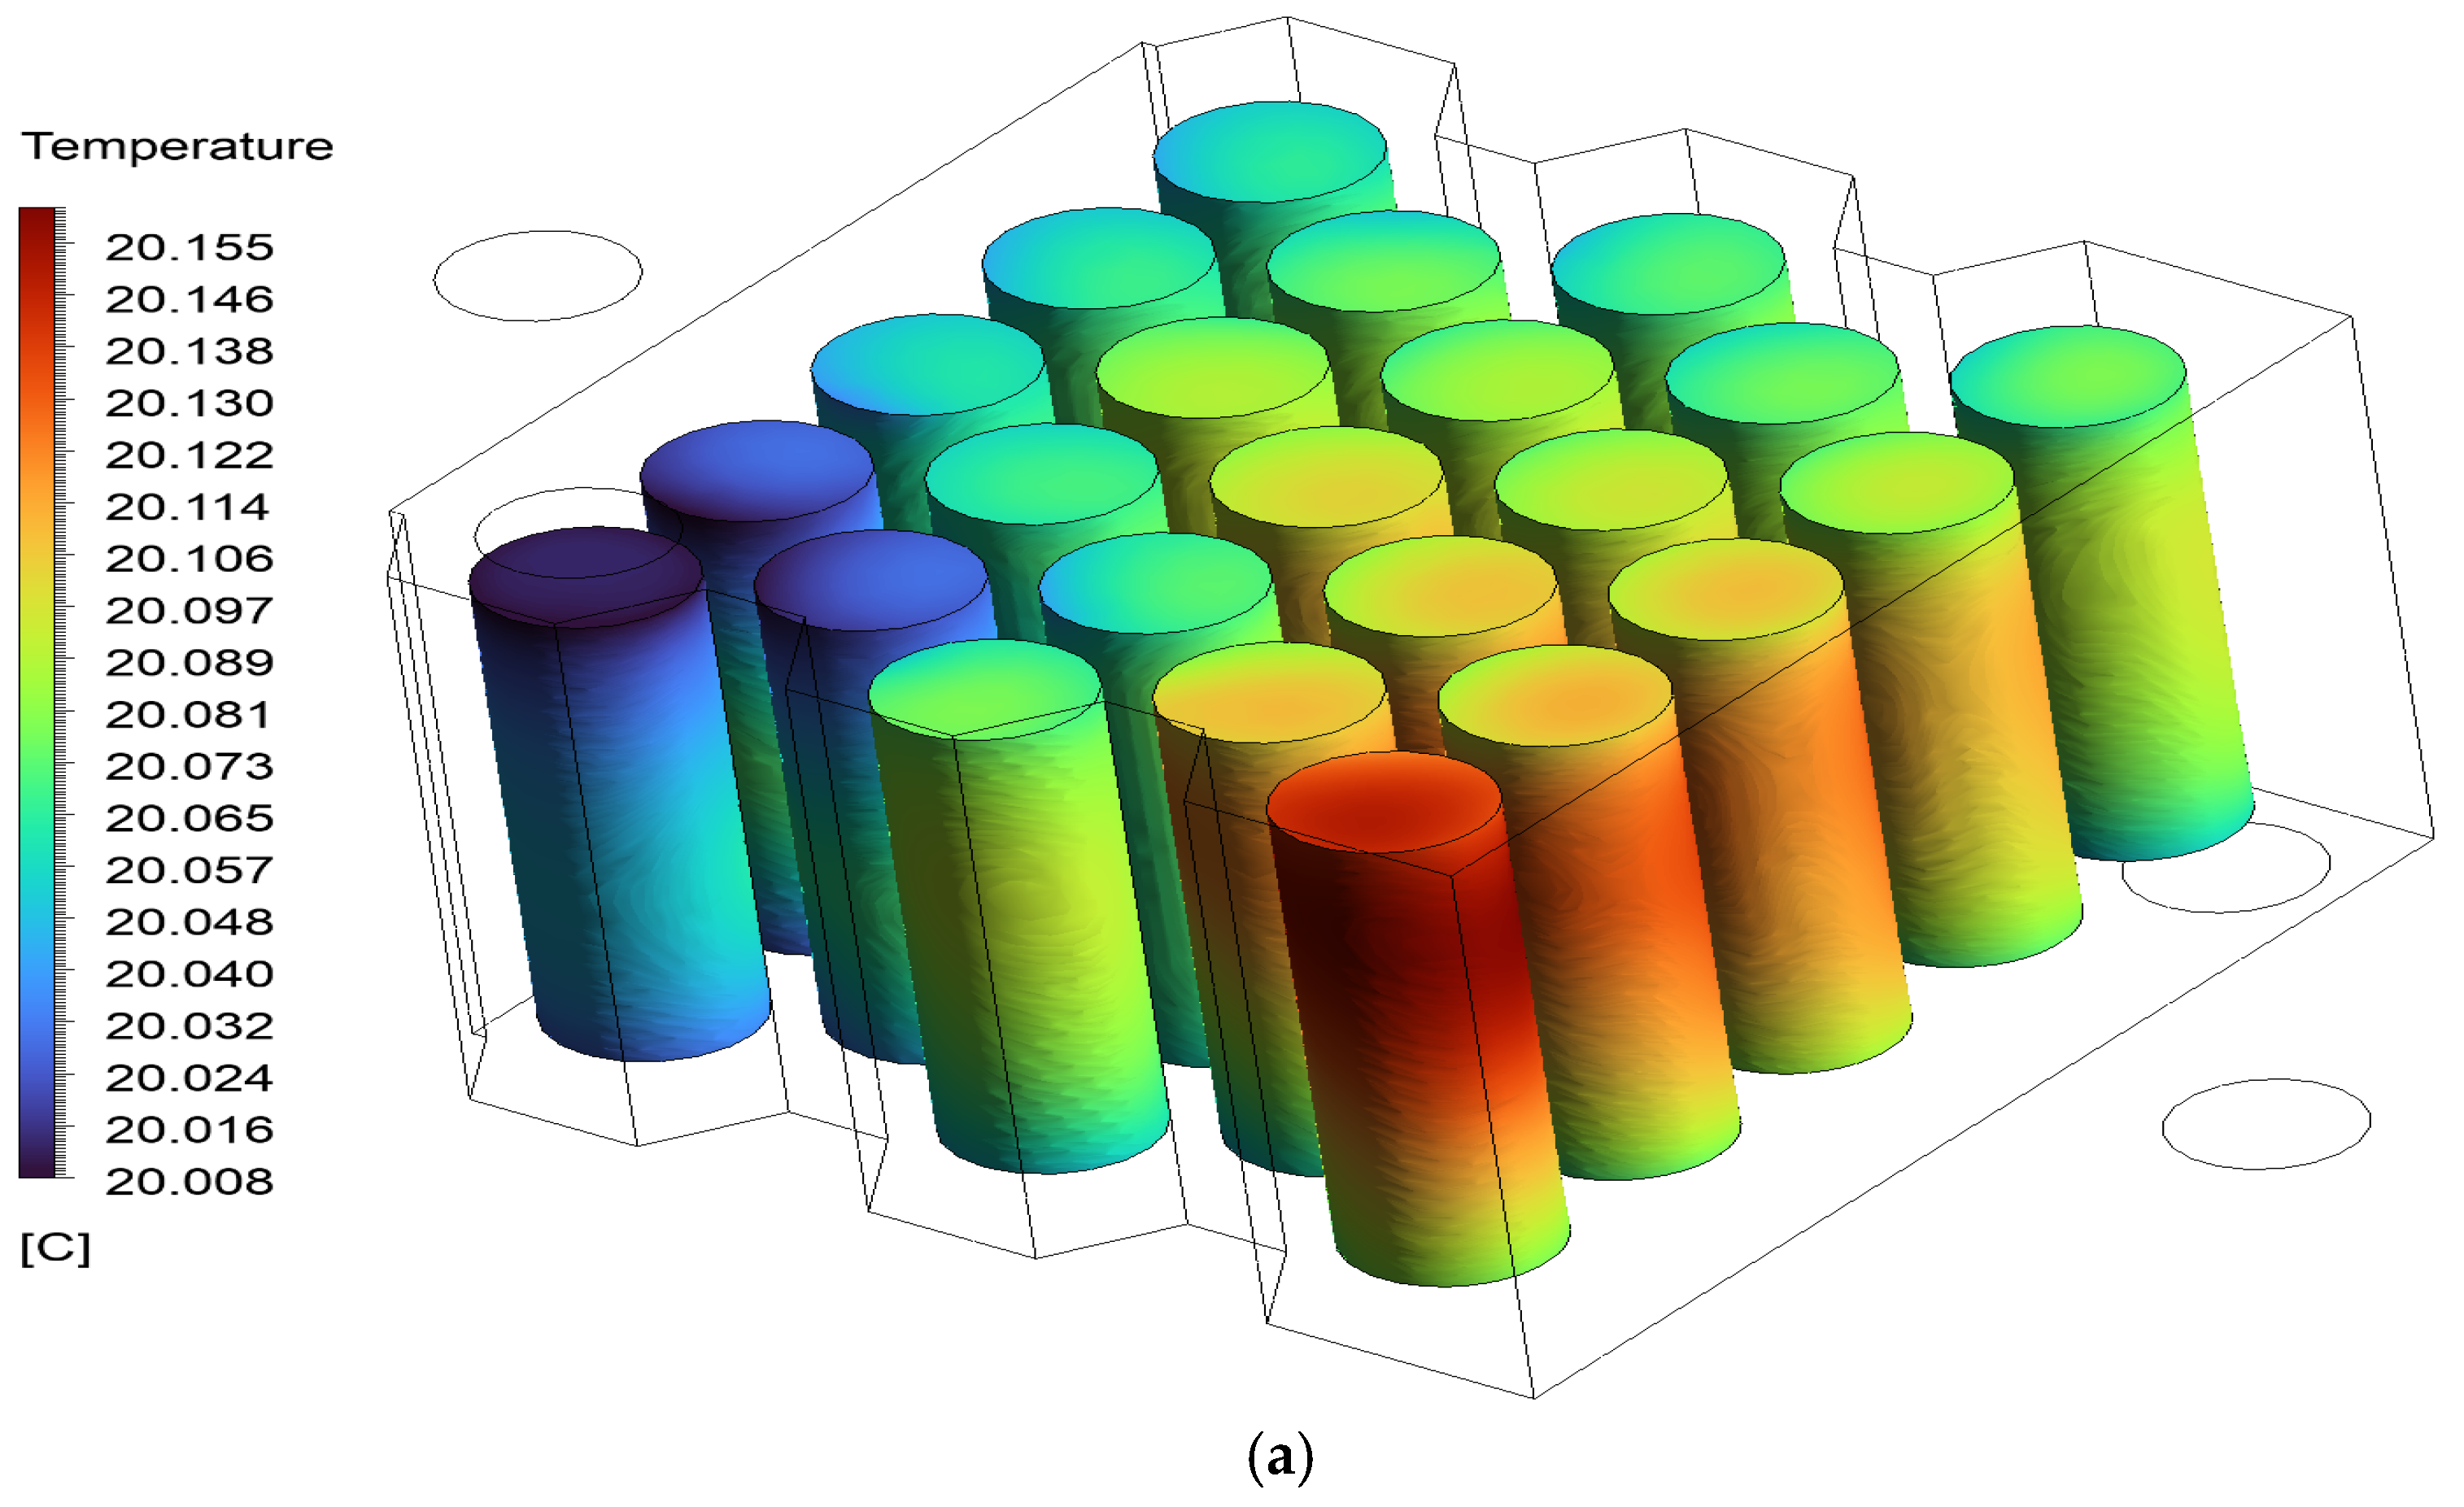
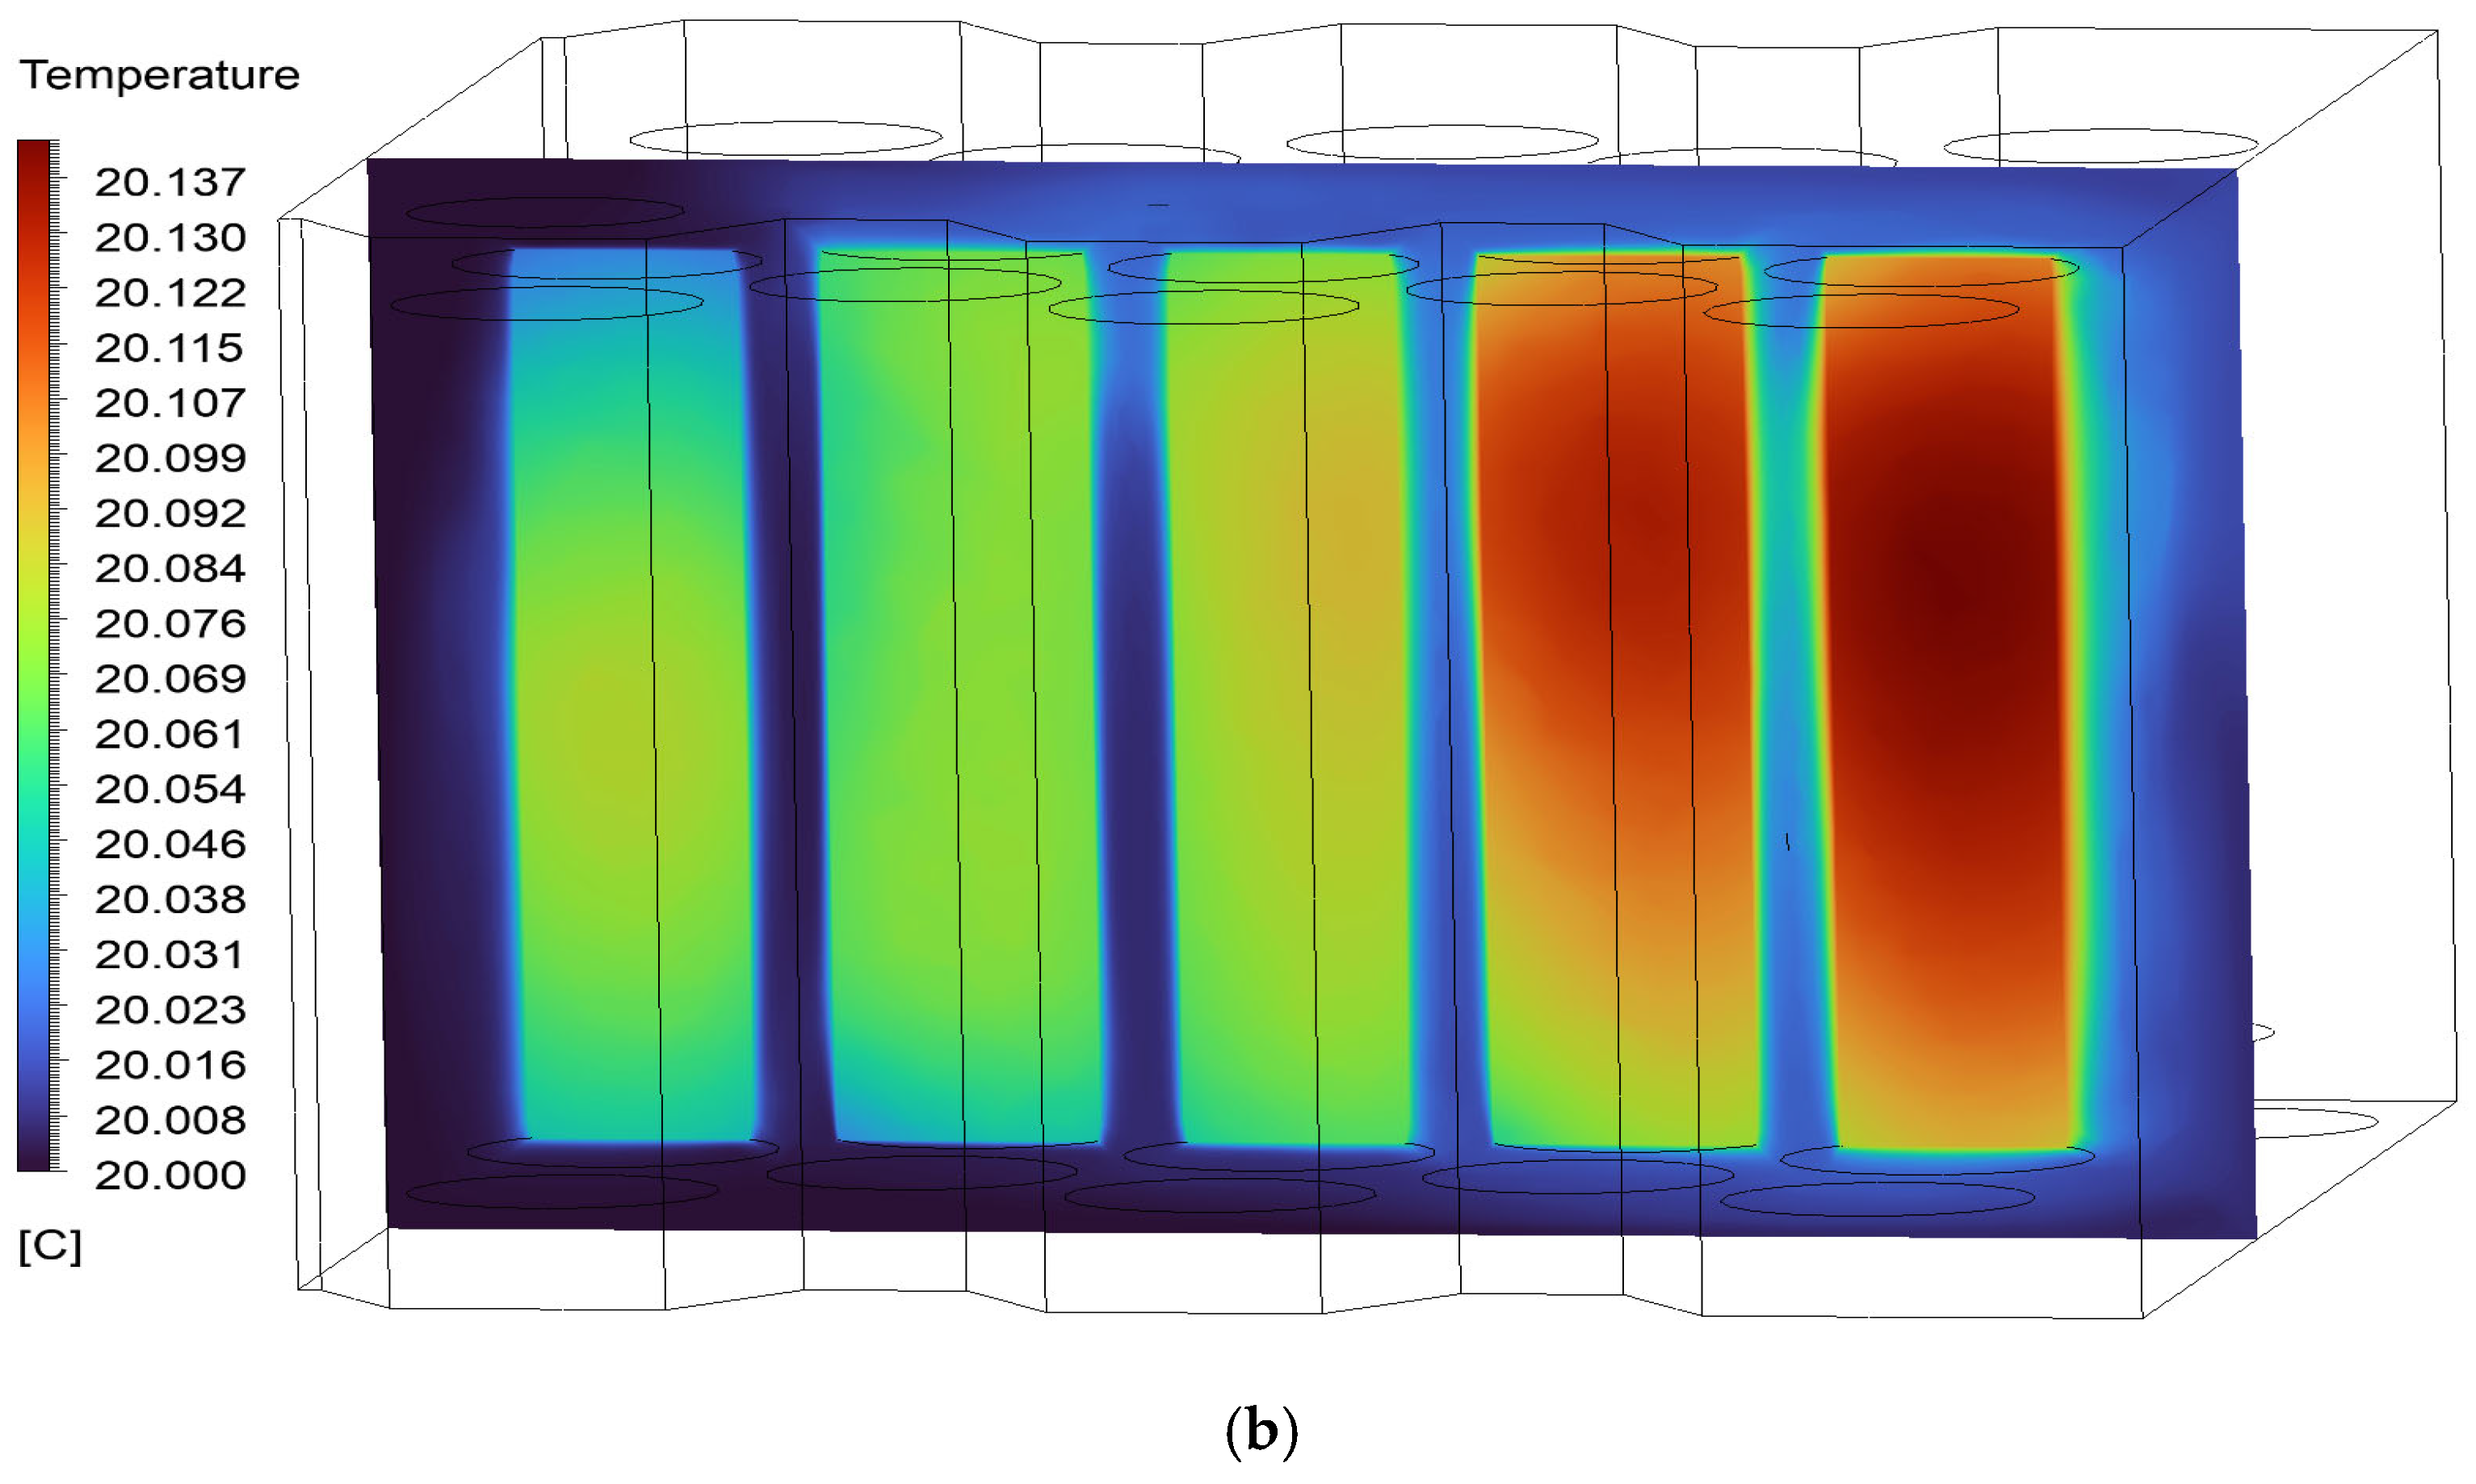
The surface and cross-sectional plane temperature contours presented in
Figure 13a,b provide a comprehensive view of the thermal behavior of the immersion cooling system inside the battery module. The close range of surface temperatures indicates that effective cooling is generally achieved. In addition, the local temperature differences observed in the cross-sectional plane in the range of 20.008–20.155 °C indicate no risk of heat accumulation in the middle and rear regions of the module and temperature homogeneity. This indicates that the fluid can fully penetrate the intercellular regions, and local temperature gradients may occur. The findings suggest results that foster increasing thermal homogeneity by optimizing the flow path, and critical for battery performance and cell life.
Figure 14 illustrates the surface temperature distribution of the 23-cell lithium-ion battery pack under immersion cooling. It is observed that cells located in the right-lower region exhibit higher surface temperatures (~20.1 °C), indicating uneven coolant flow or increased heat accumulation in those regions. However, this highlights the need for no further geometric or flow path optimization to ensure thermal uniformity across the battery pack due to very low temperature variance.
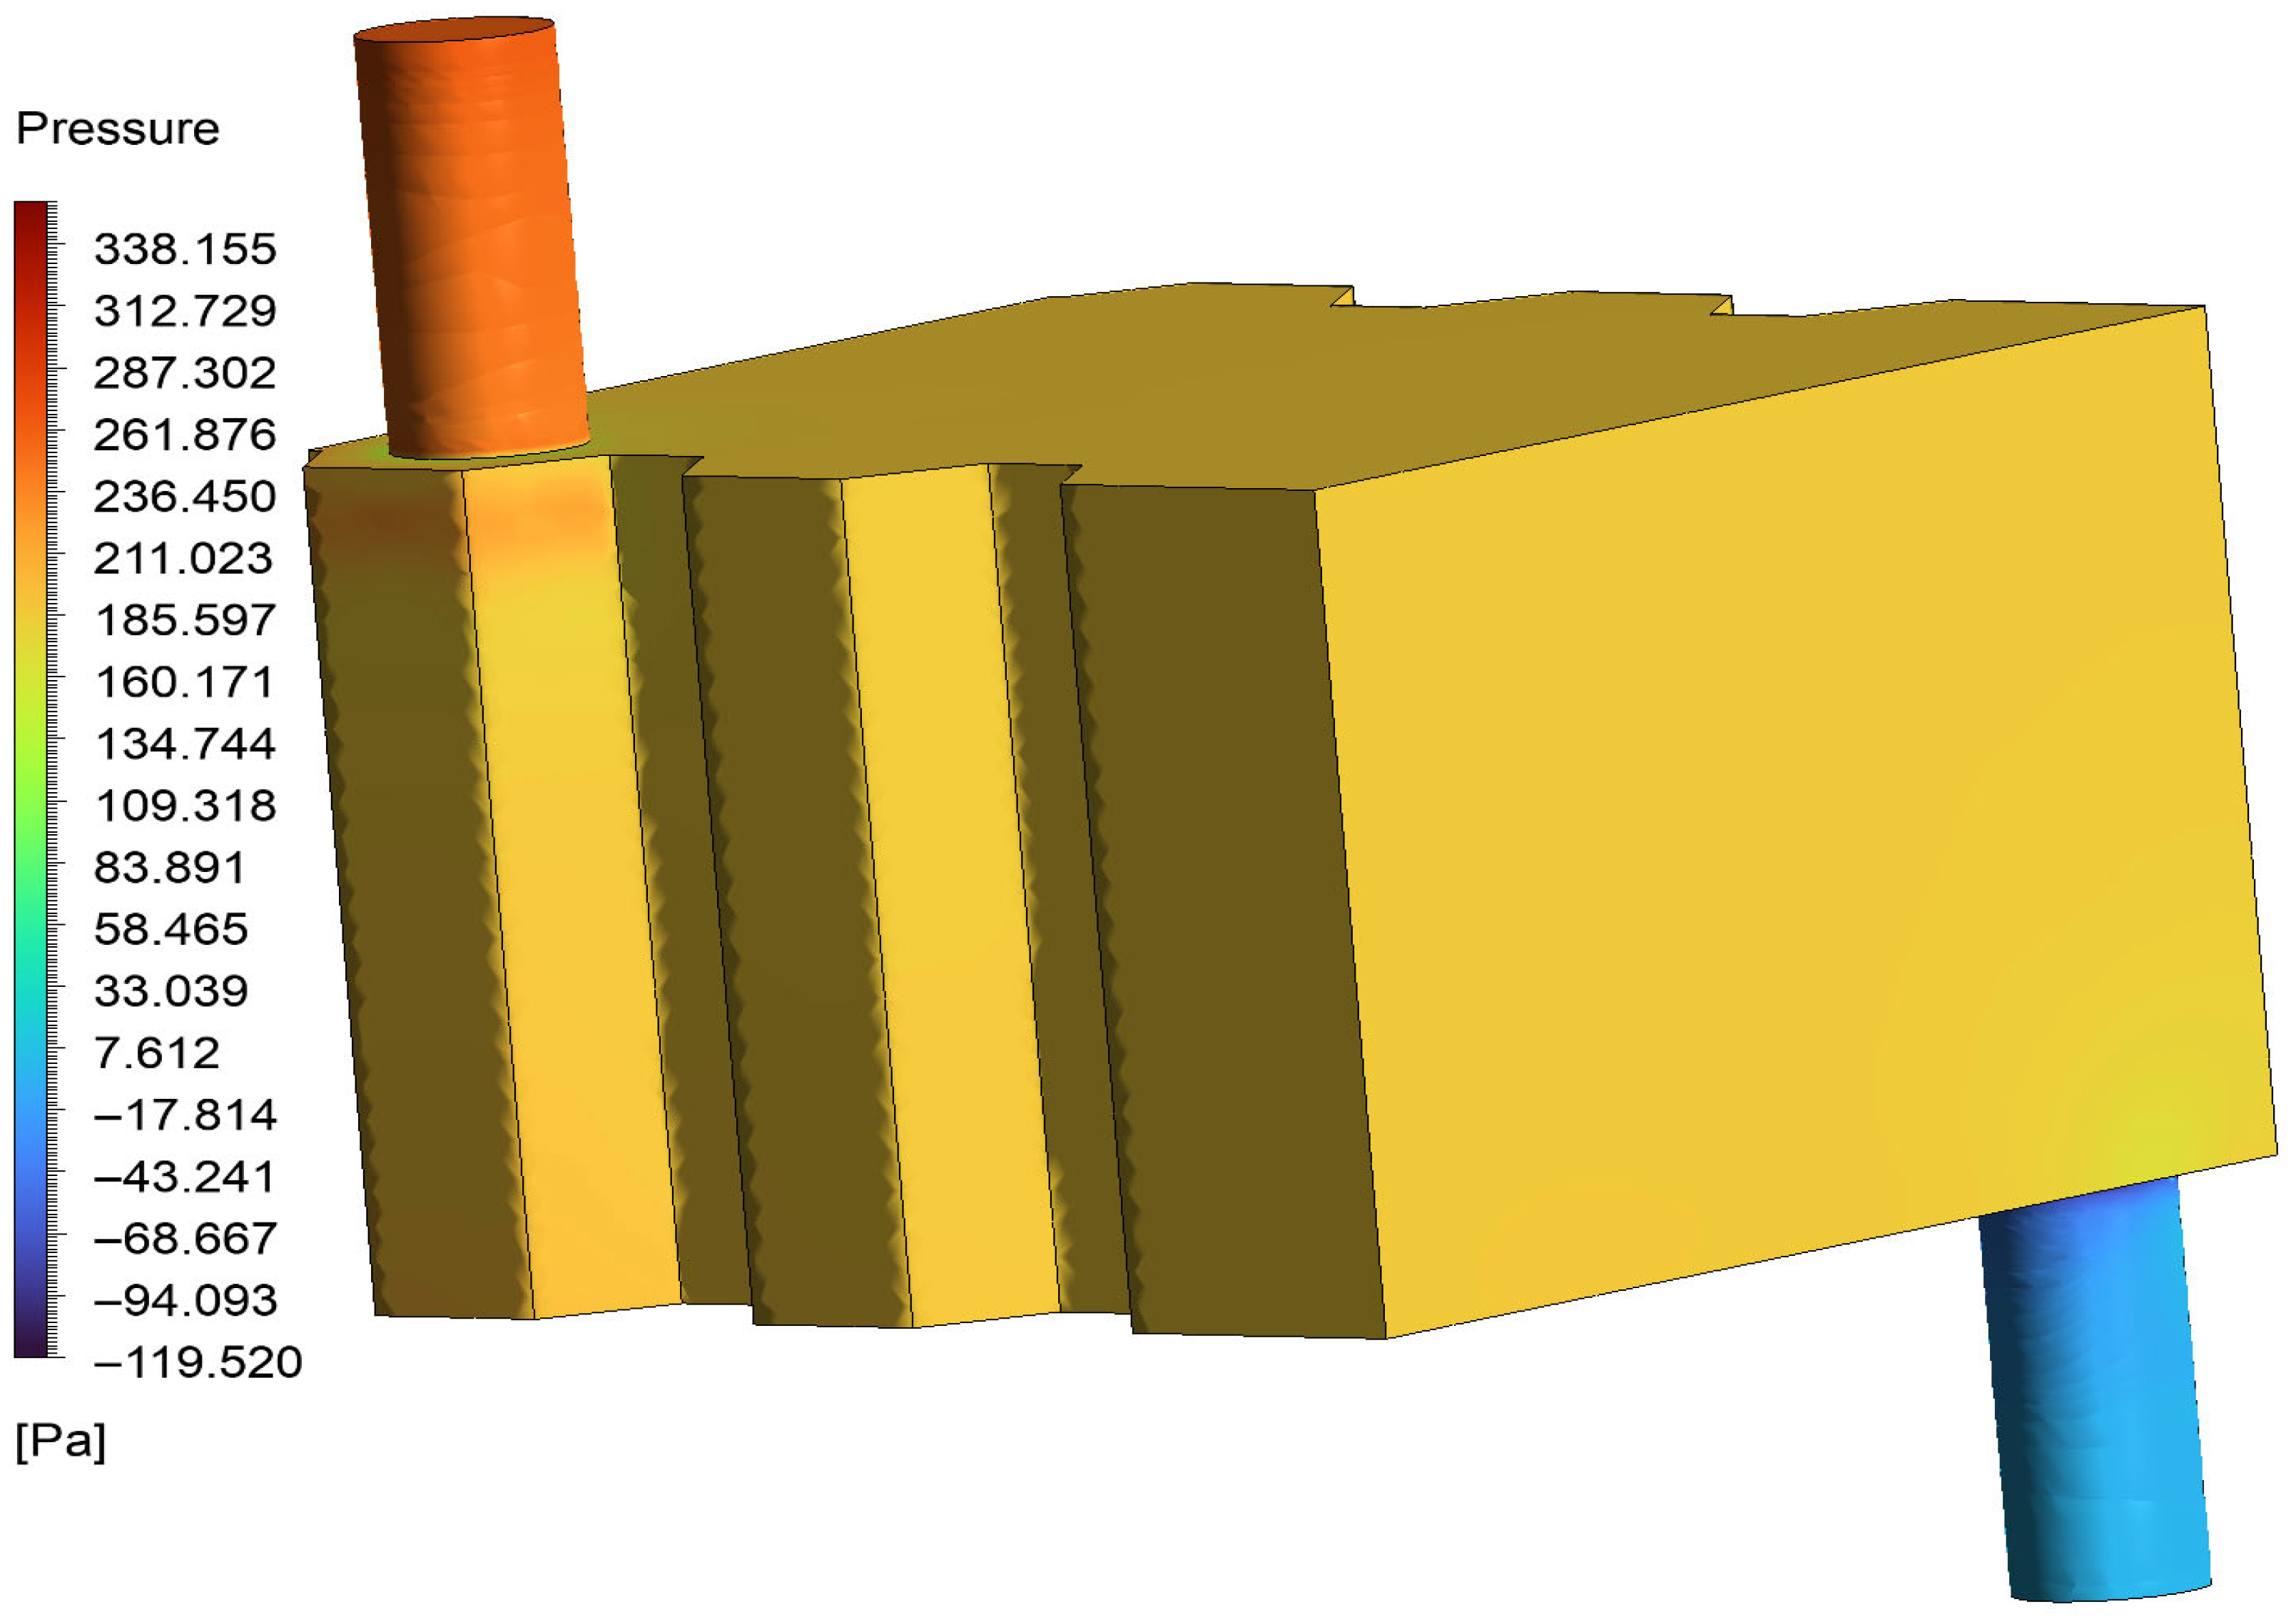
The pressure distribution results demonstrated a gradual and consistent decrease from the inlet to the outlet of the cooling domain, with a total pressure drop of a maximum point of 338.155 Pa. This level of pressure drop indicates a relatively low hydraulic resistance, which is favorable for practical pumping systems in electric vehicle applications.
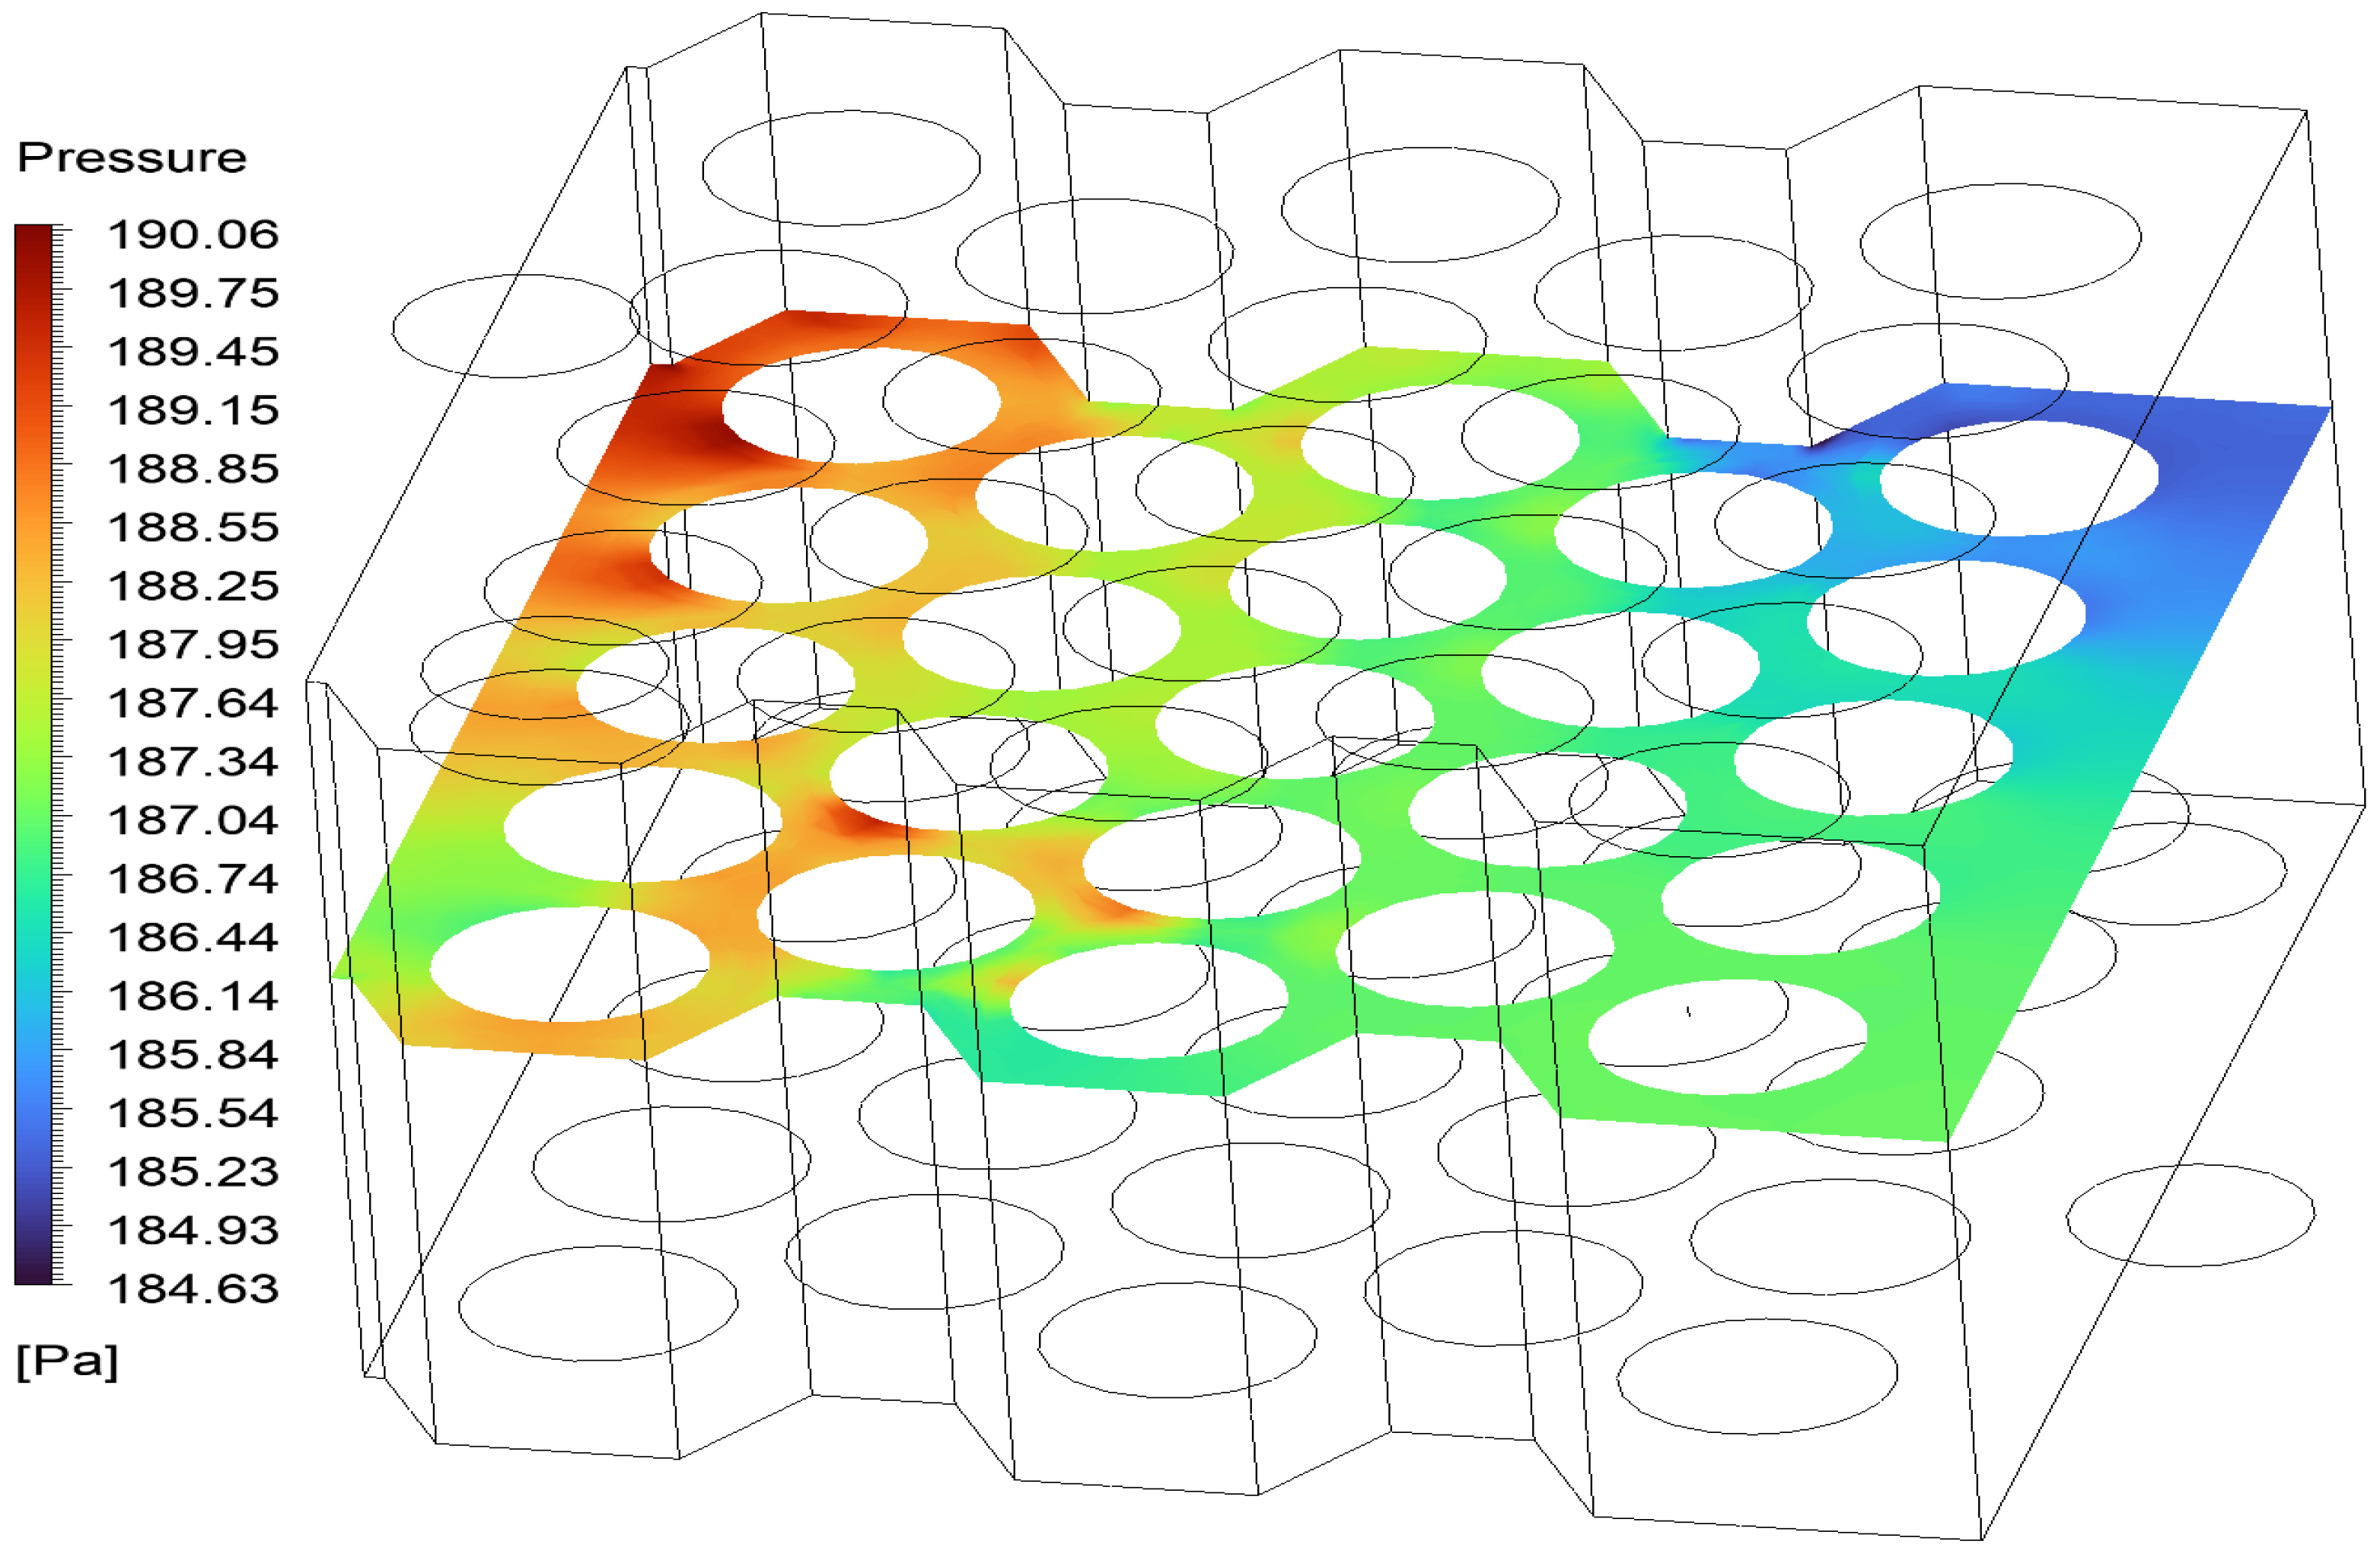
The pressure gradient across the cooling channel is uniform, with a slight drop near the outlet. This distribution supports the expected fluid resistance pattern and validates the low-turbulence flow regime assumed in the model, as illustrated by 3D and 2D visualizations in
Figure 15 and
Figure 16.
As shown in
Figure 17, the pressure drop across the channel is within acceptable limits, ensuring that the pumping requirements for the dielectric fluid remain efficient and sustainable for practical applications.
The convective heat transfer coefficient is maximized near cell surfaces close to the inlet, decreasing progressively downstream. This result aligns with expectations of boundary layer development along the flow path.
The heat transfer performance, as measured by the convective heat transfer coefficient (CHTC), was highest near the inlet region, where the coolant impinged directly on the battery surfaces.
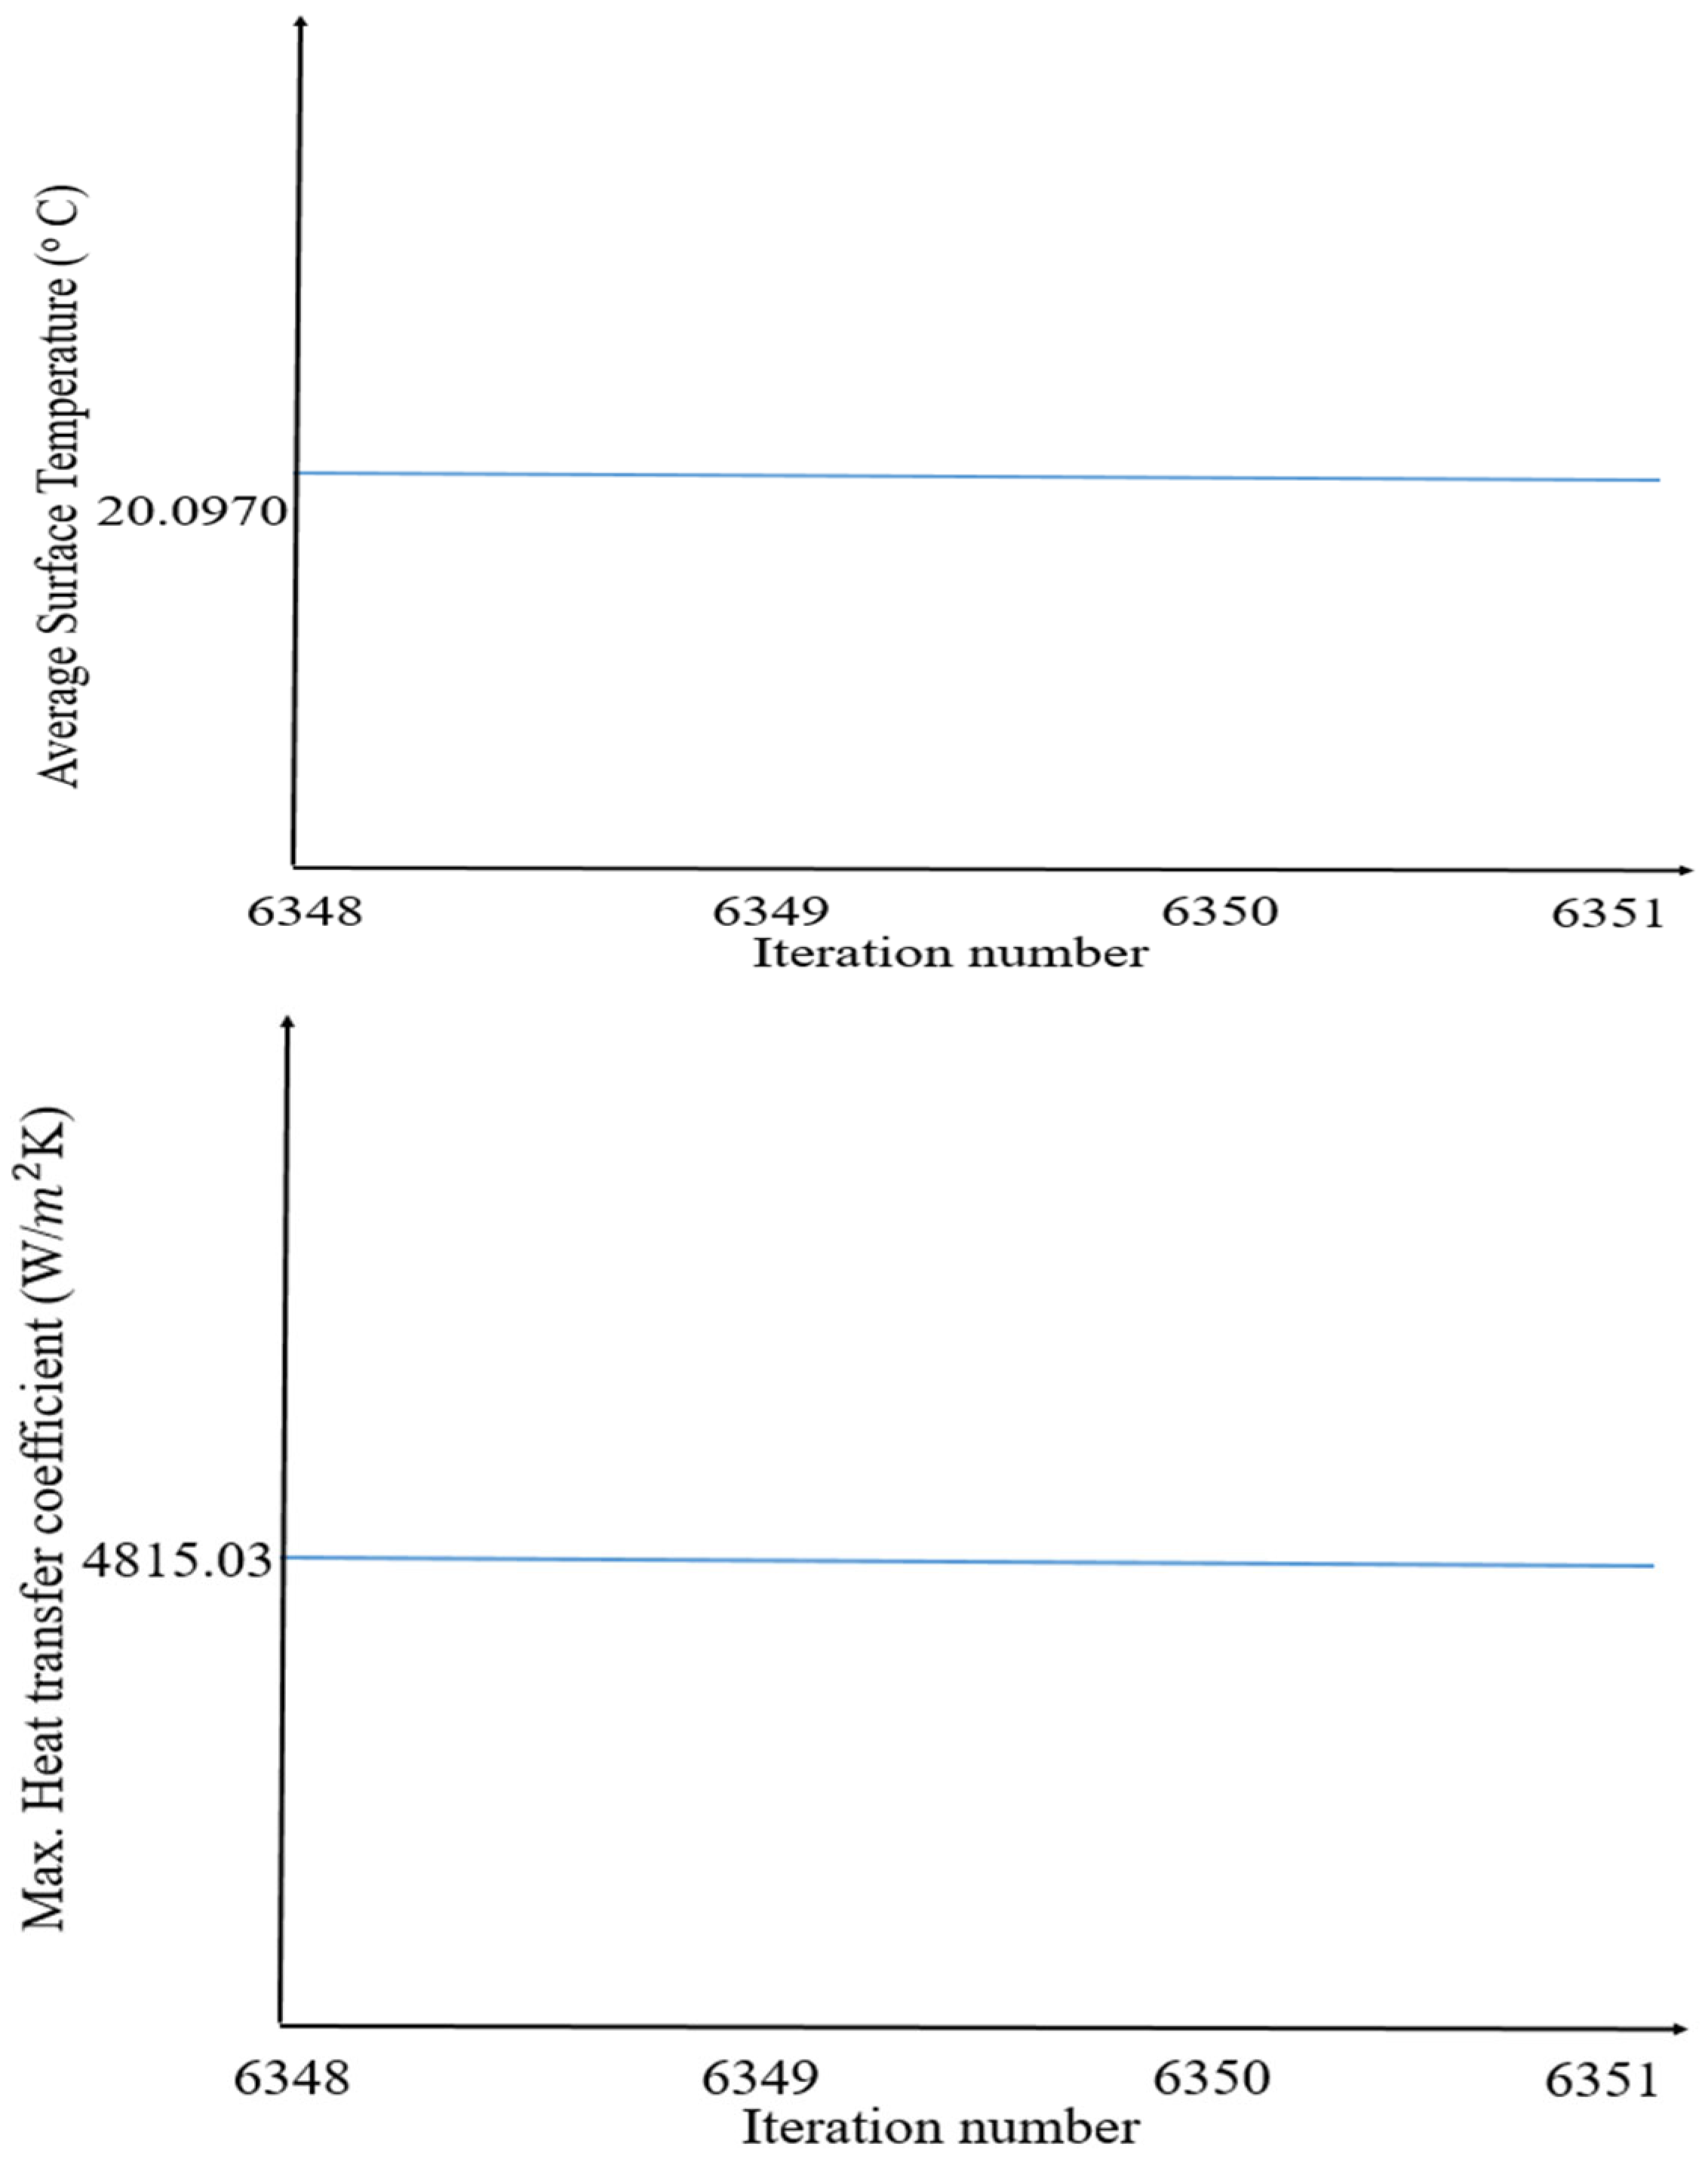
Figure 18. The maximum CHTC was measured at approximately 4815 W/m
2·K for cell number 18, while downstream values gradually decreased, averaging 310 W/m
2·K near the outlet. This gradient reflects typical boundary layer development and loss of thermal driving force along the flow direction. The maximum surface temperature of cell number 18 was also measured as 20.097.
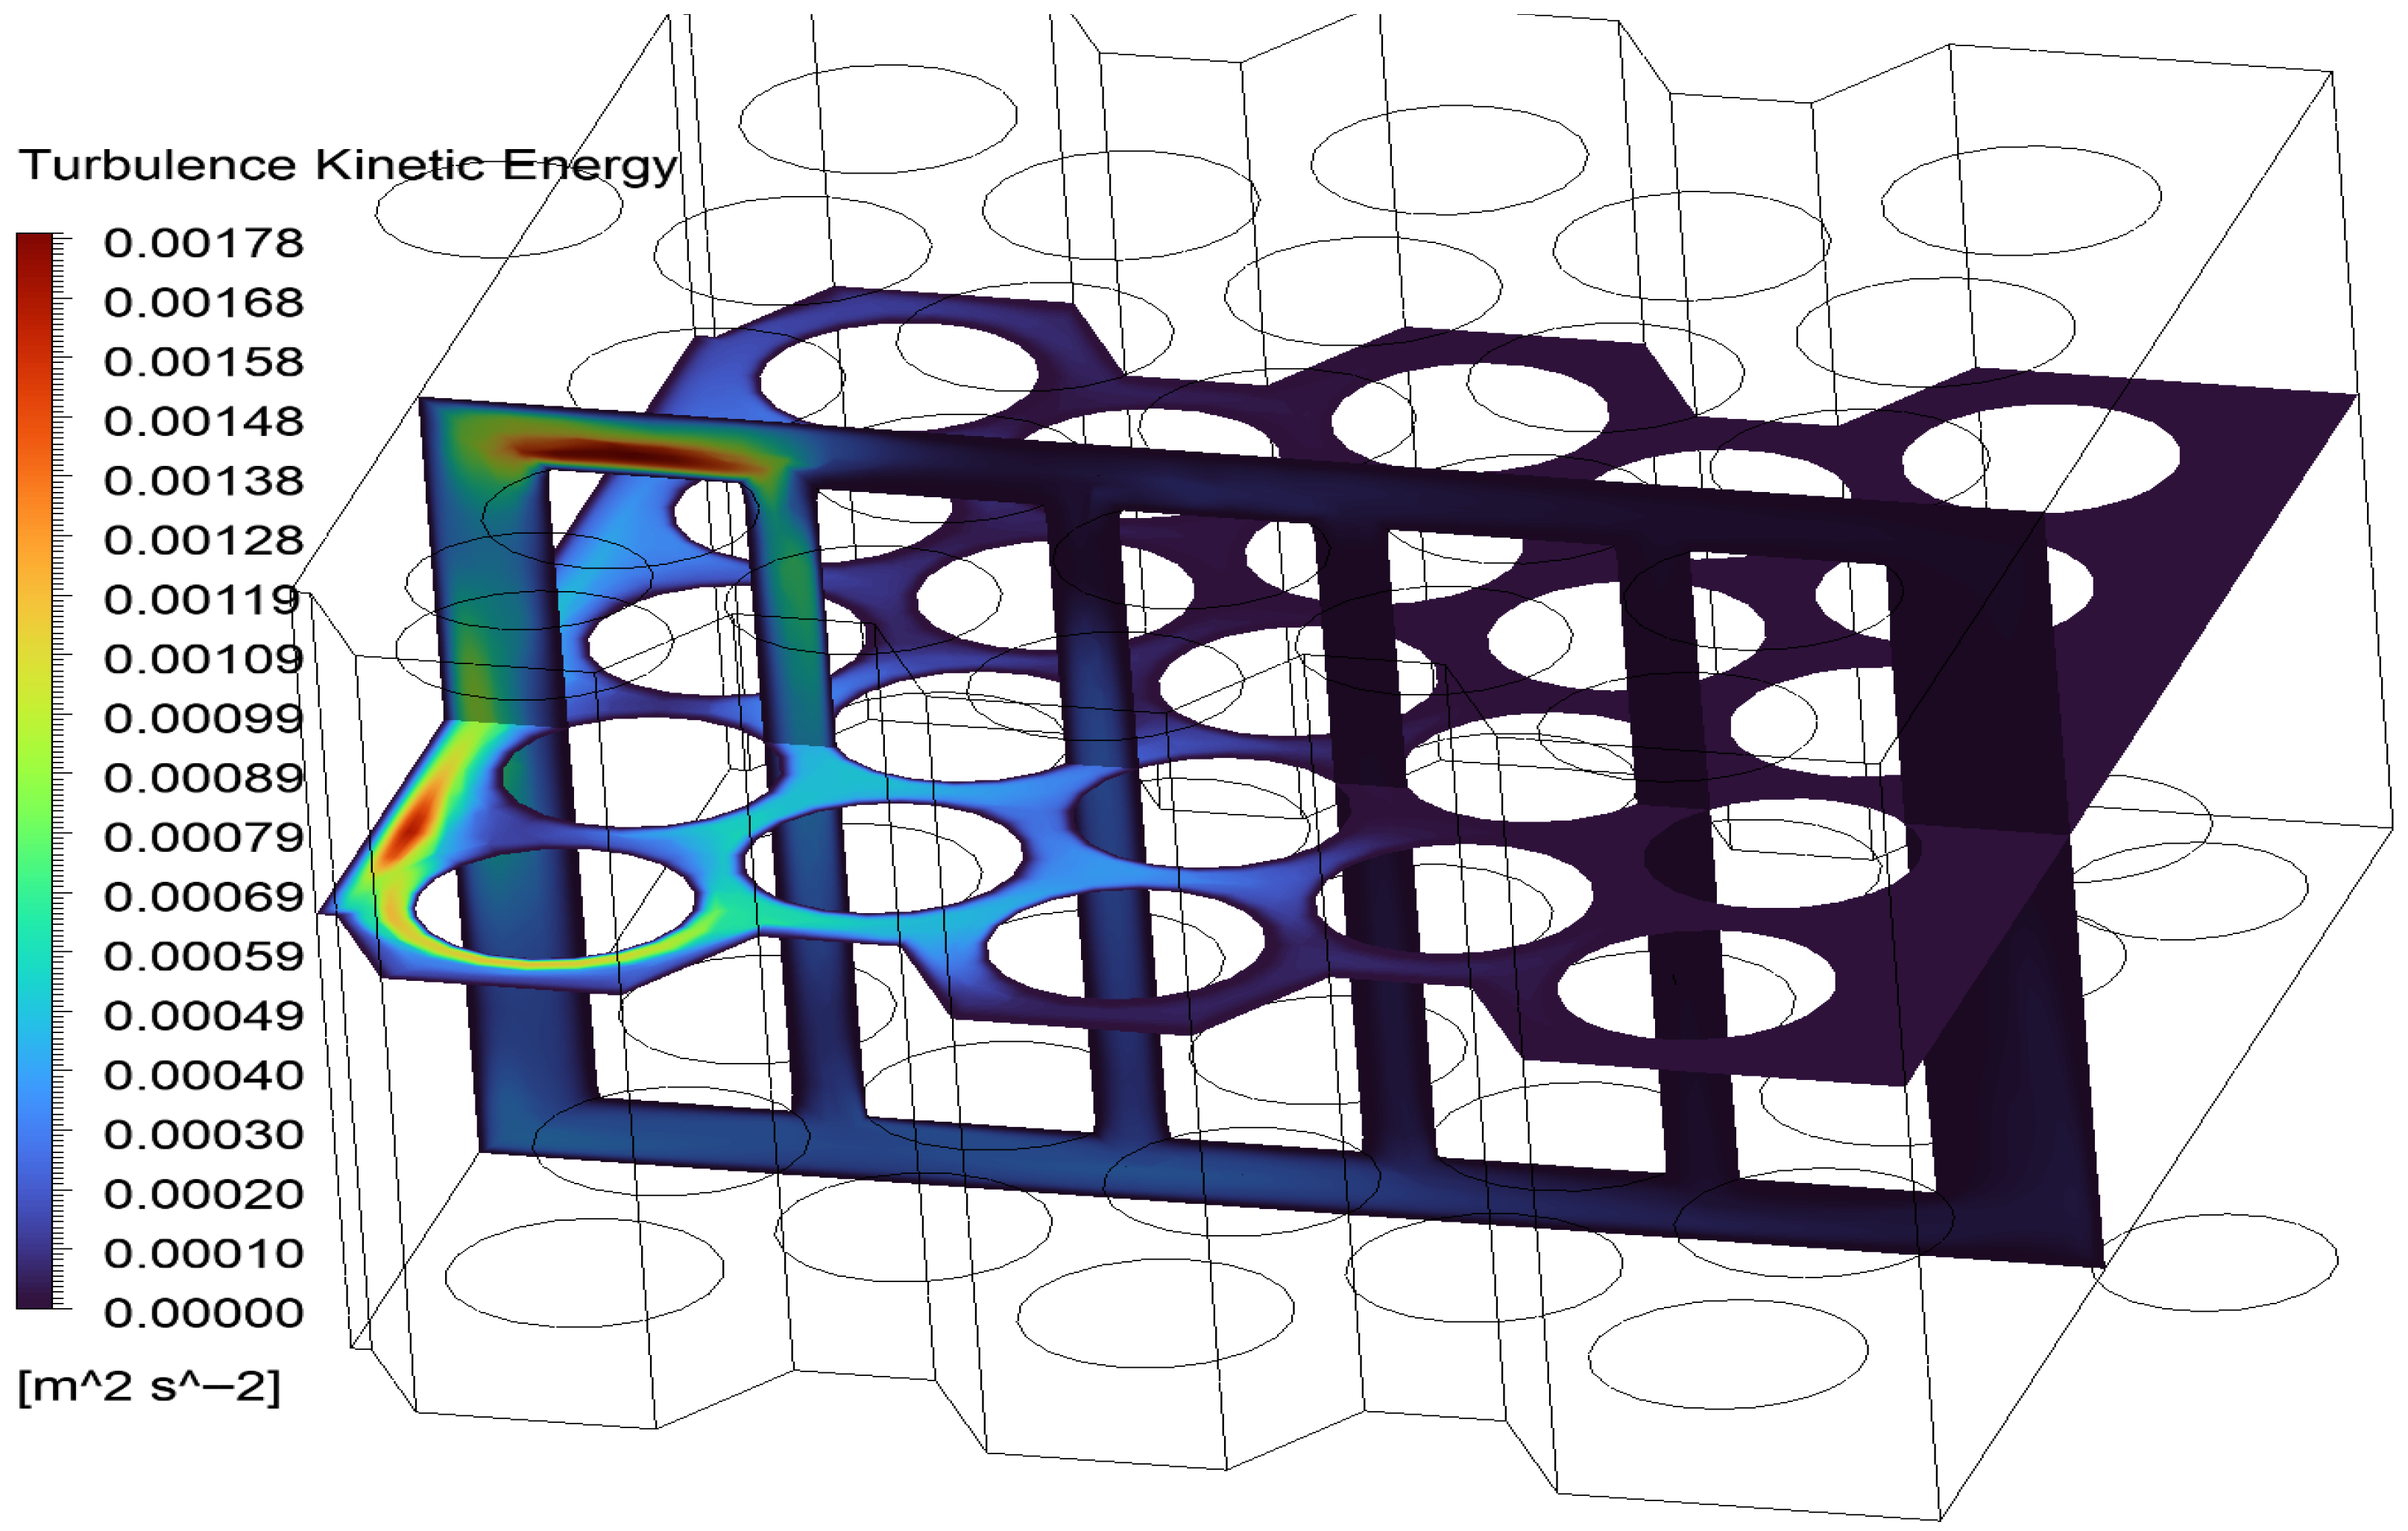
Turbulence kinetic energy analysis further supported this, showing elevated turbulence intensity near inlet regions and stagnation zones, which contributed to enhanced local heat transfer. However, low-turbulence zones in the center reduced the overall convective efficiency, as illustrated in
Figure 19.
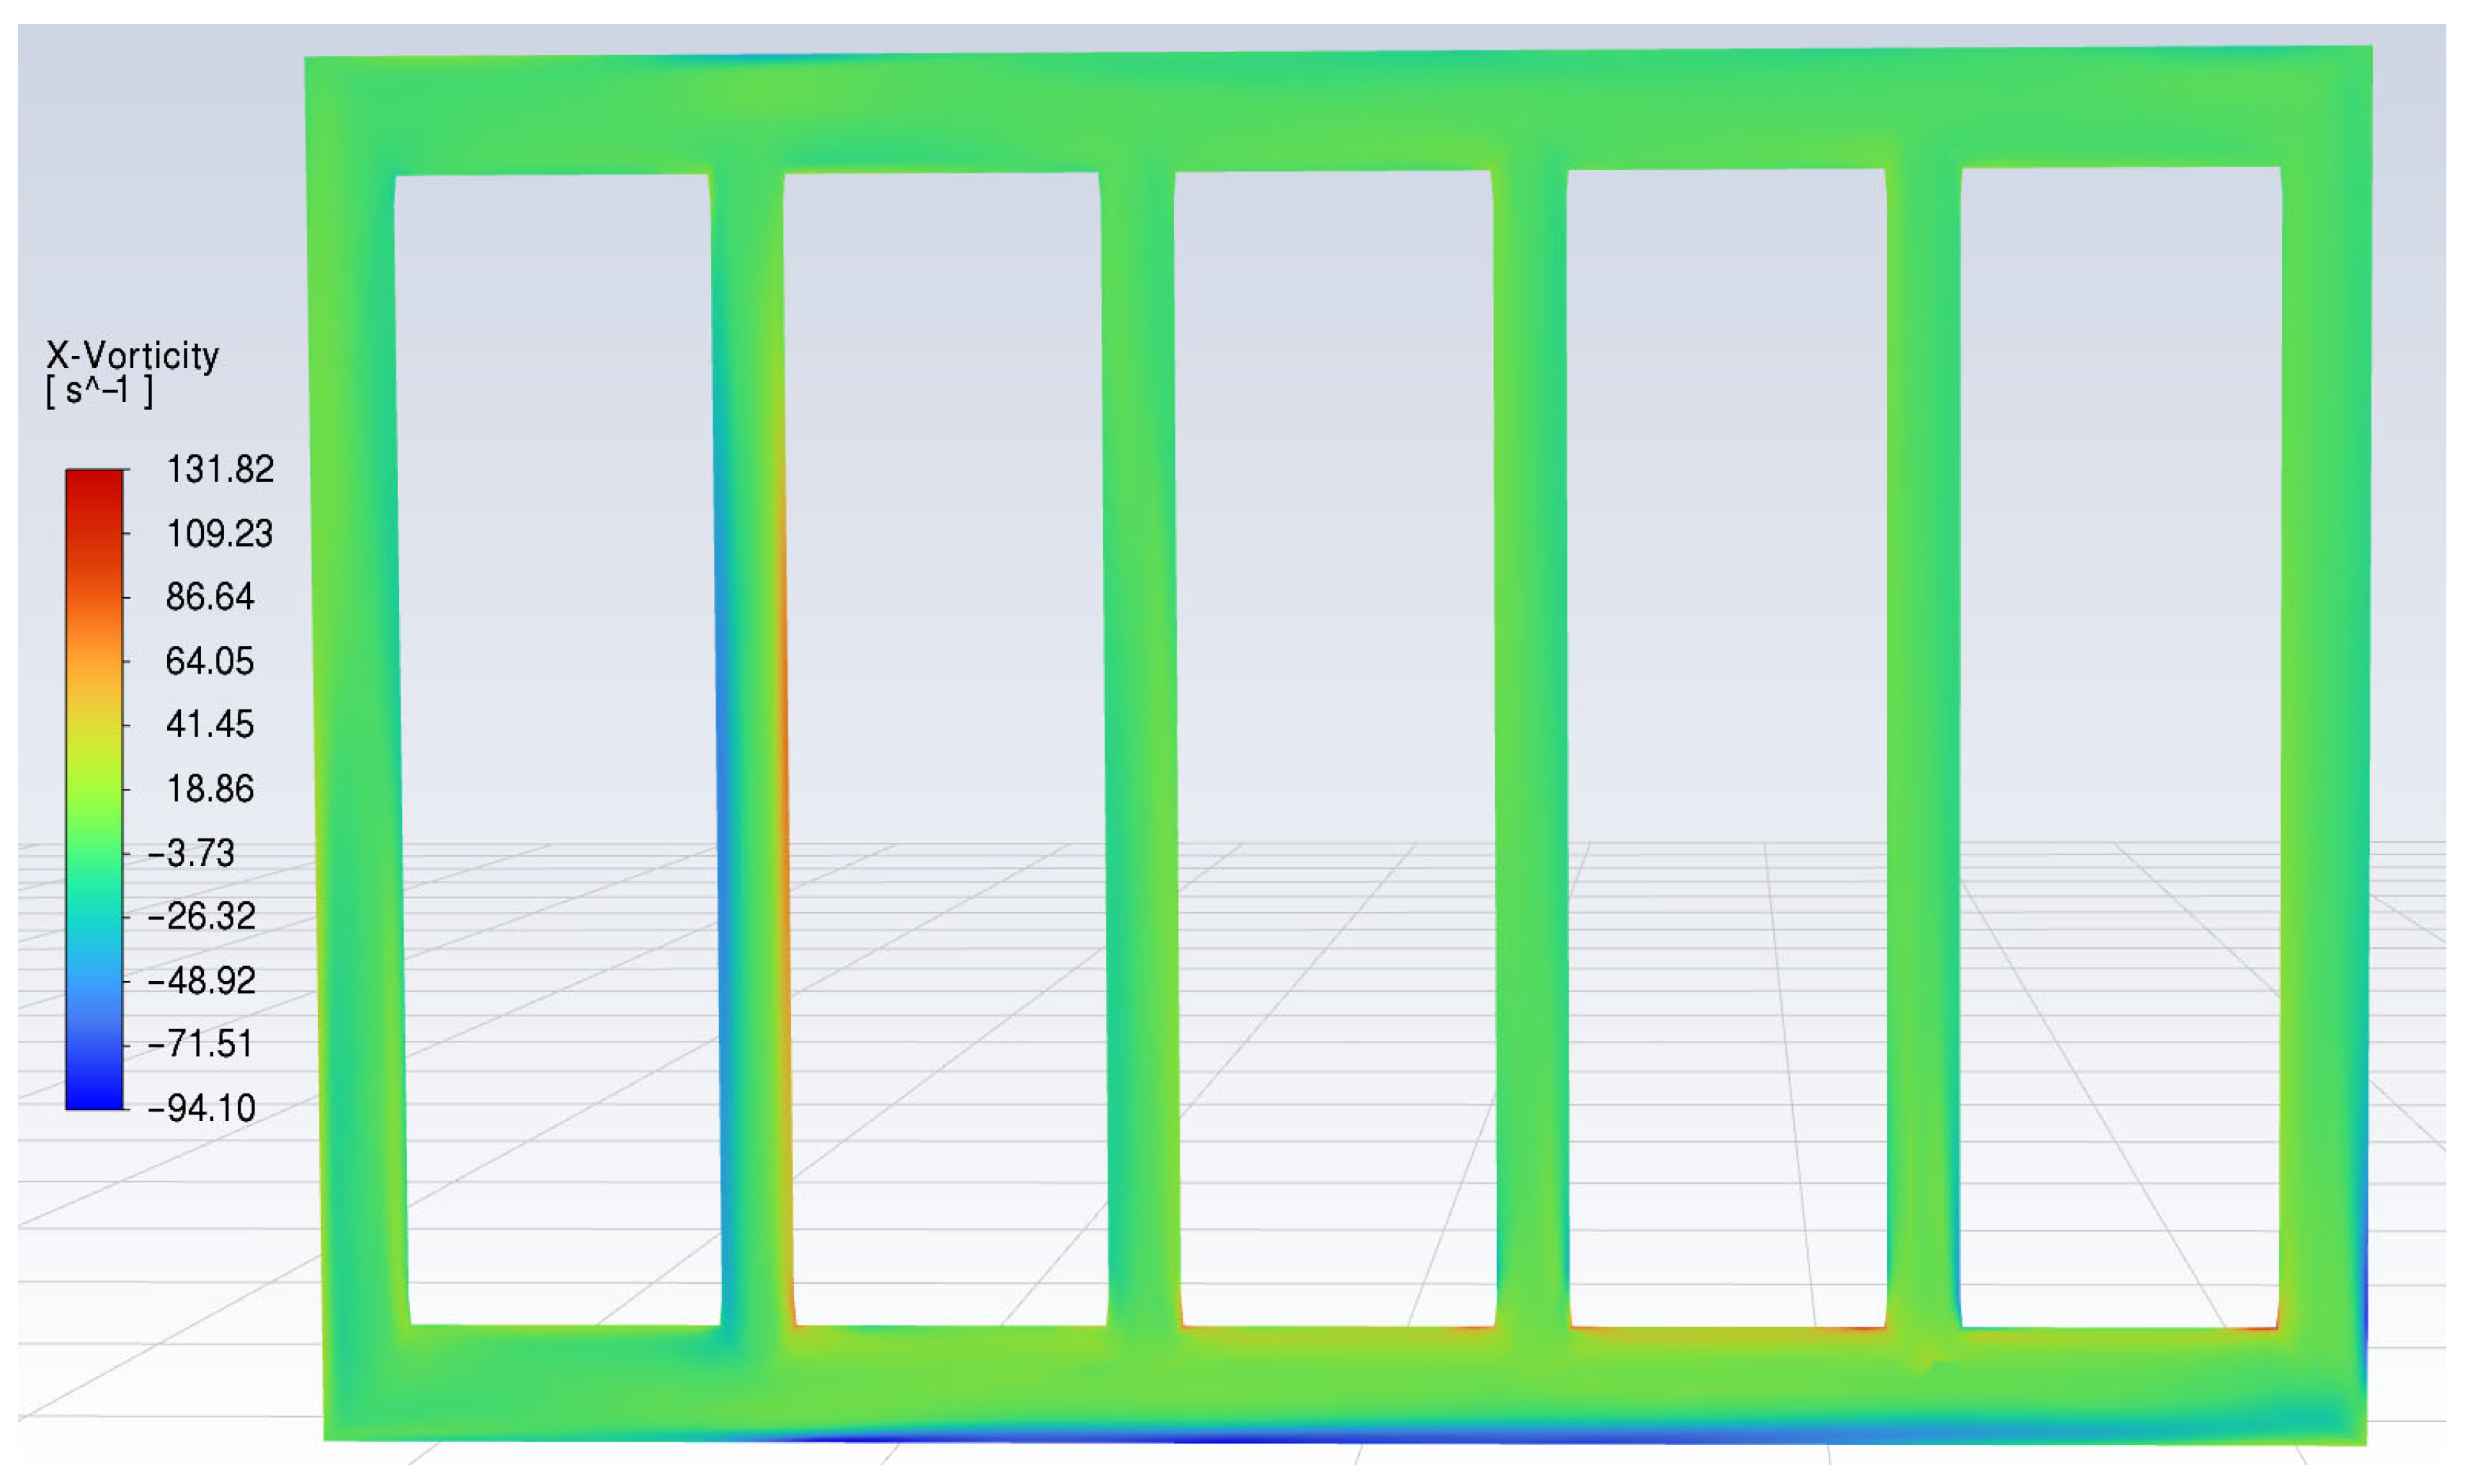
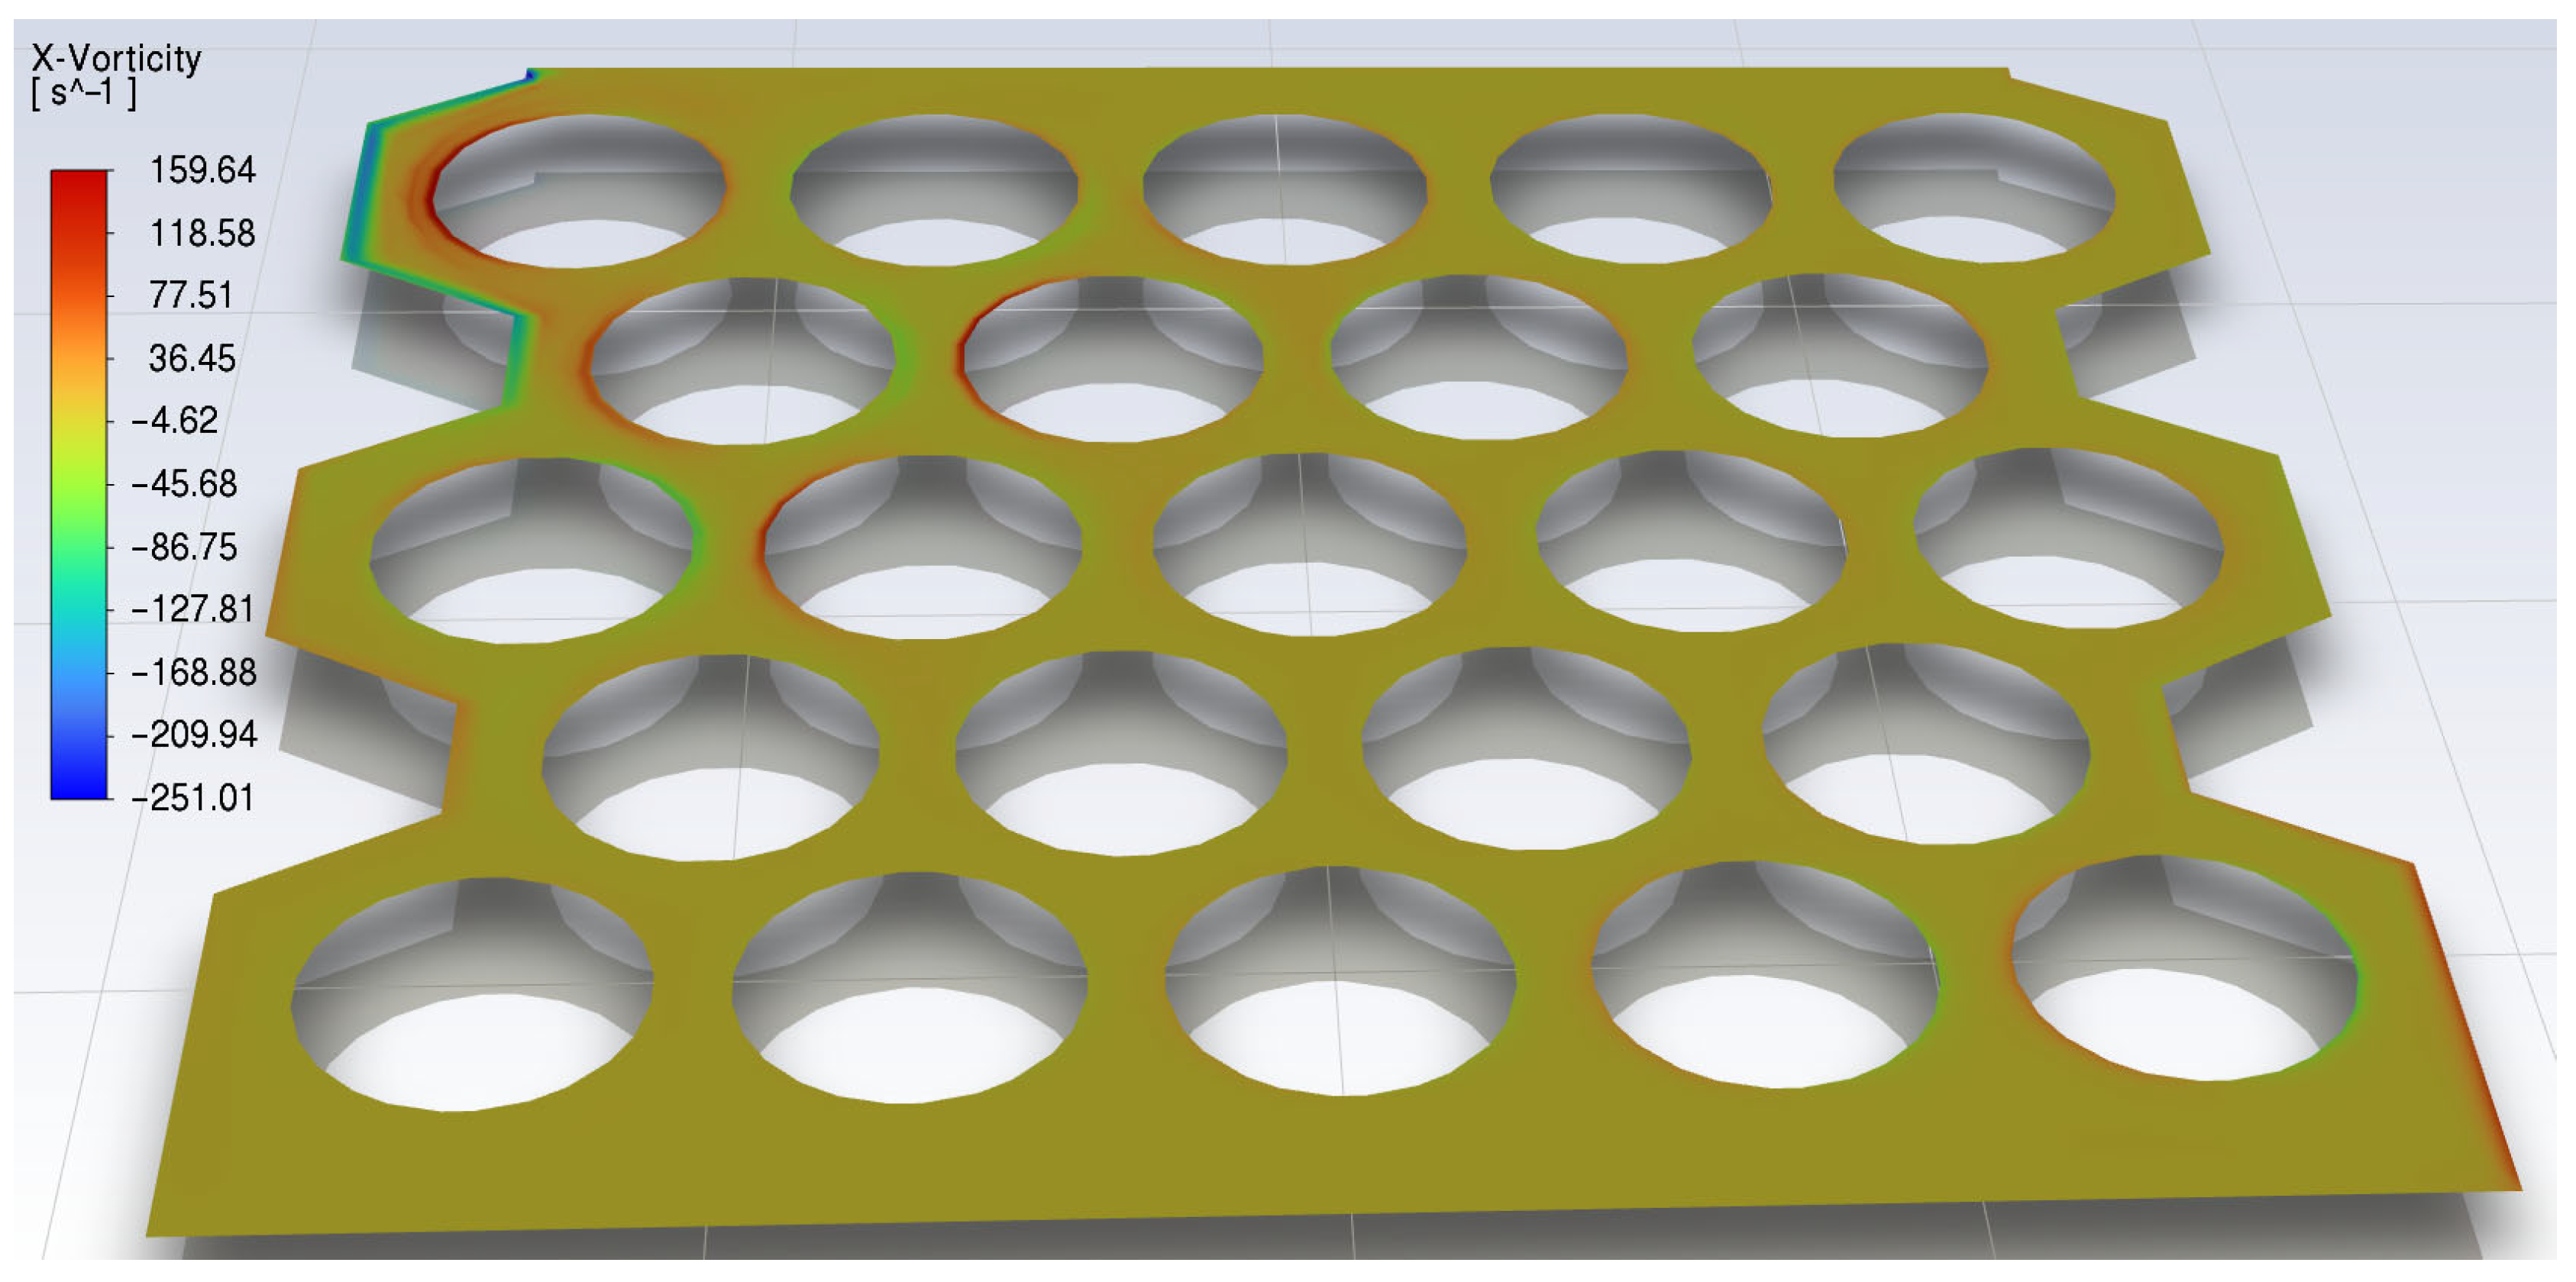
The vorticity parameter is also crucial in indicating where and how fluid rotates. The vorticity parameter also enhances heat transfer, like turbulence kinetic energy. As shown in
Figure 20, near the cell surfaces, vorticity has a high value, indicating enhanced heat transfer between cells and coolant flow.
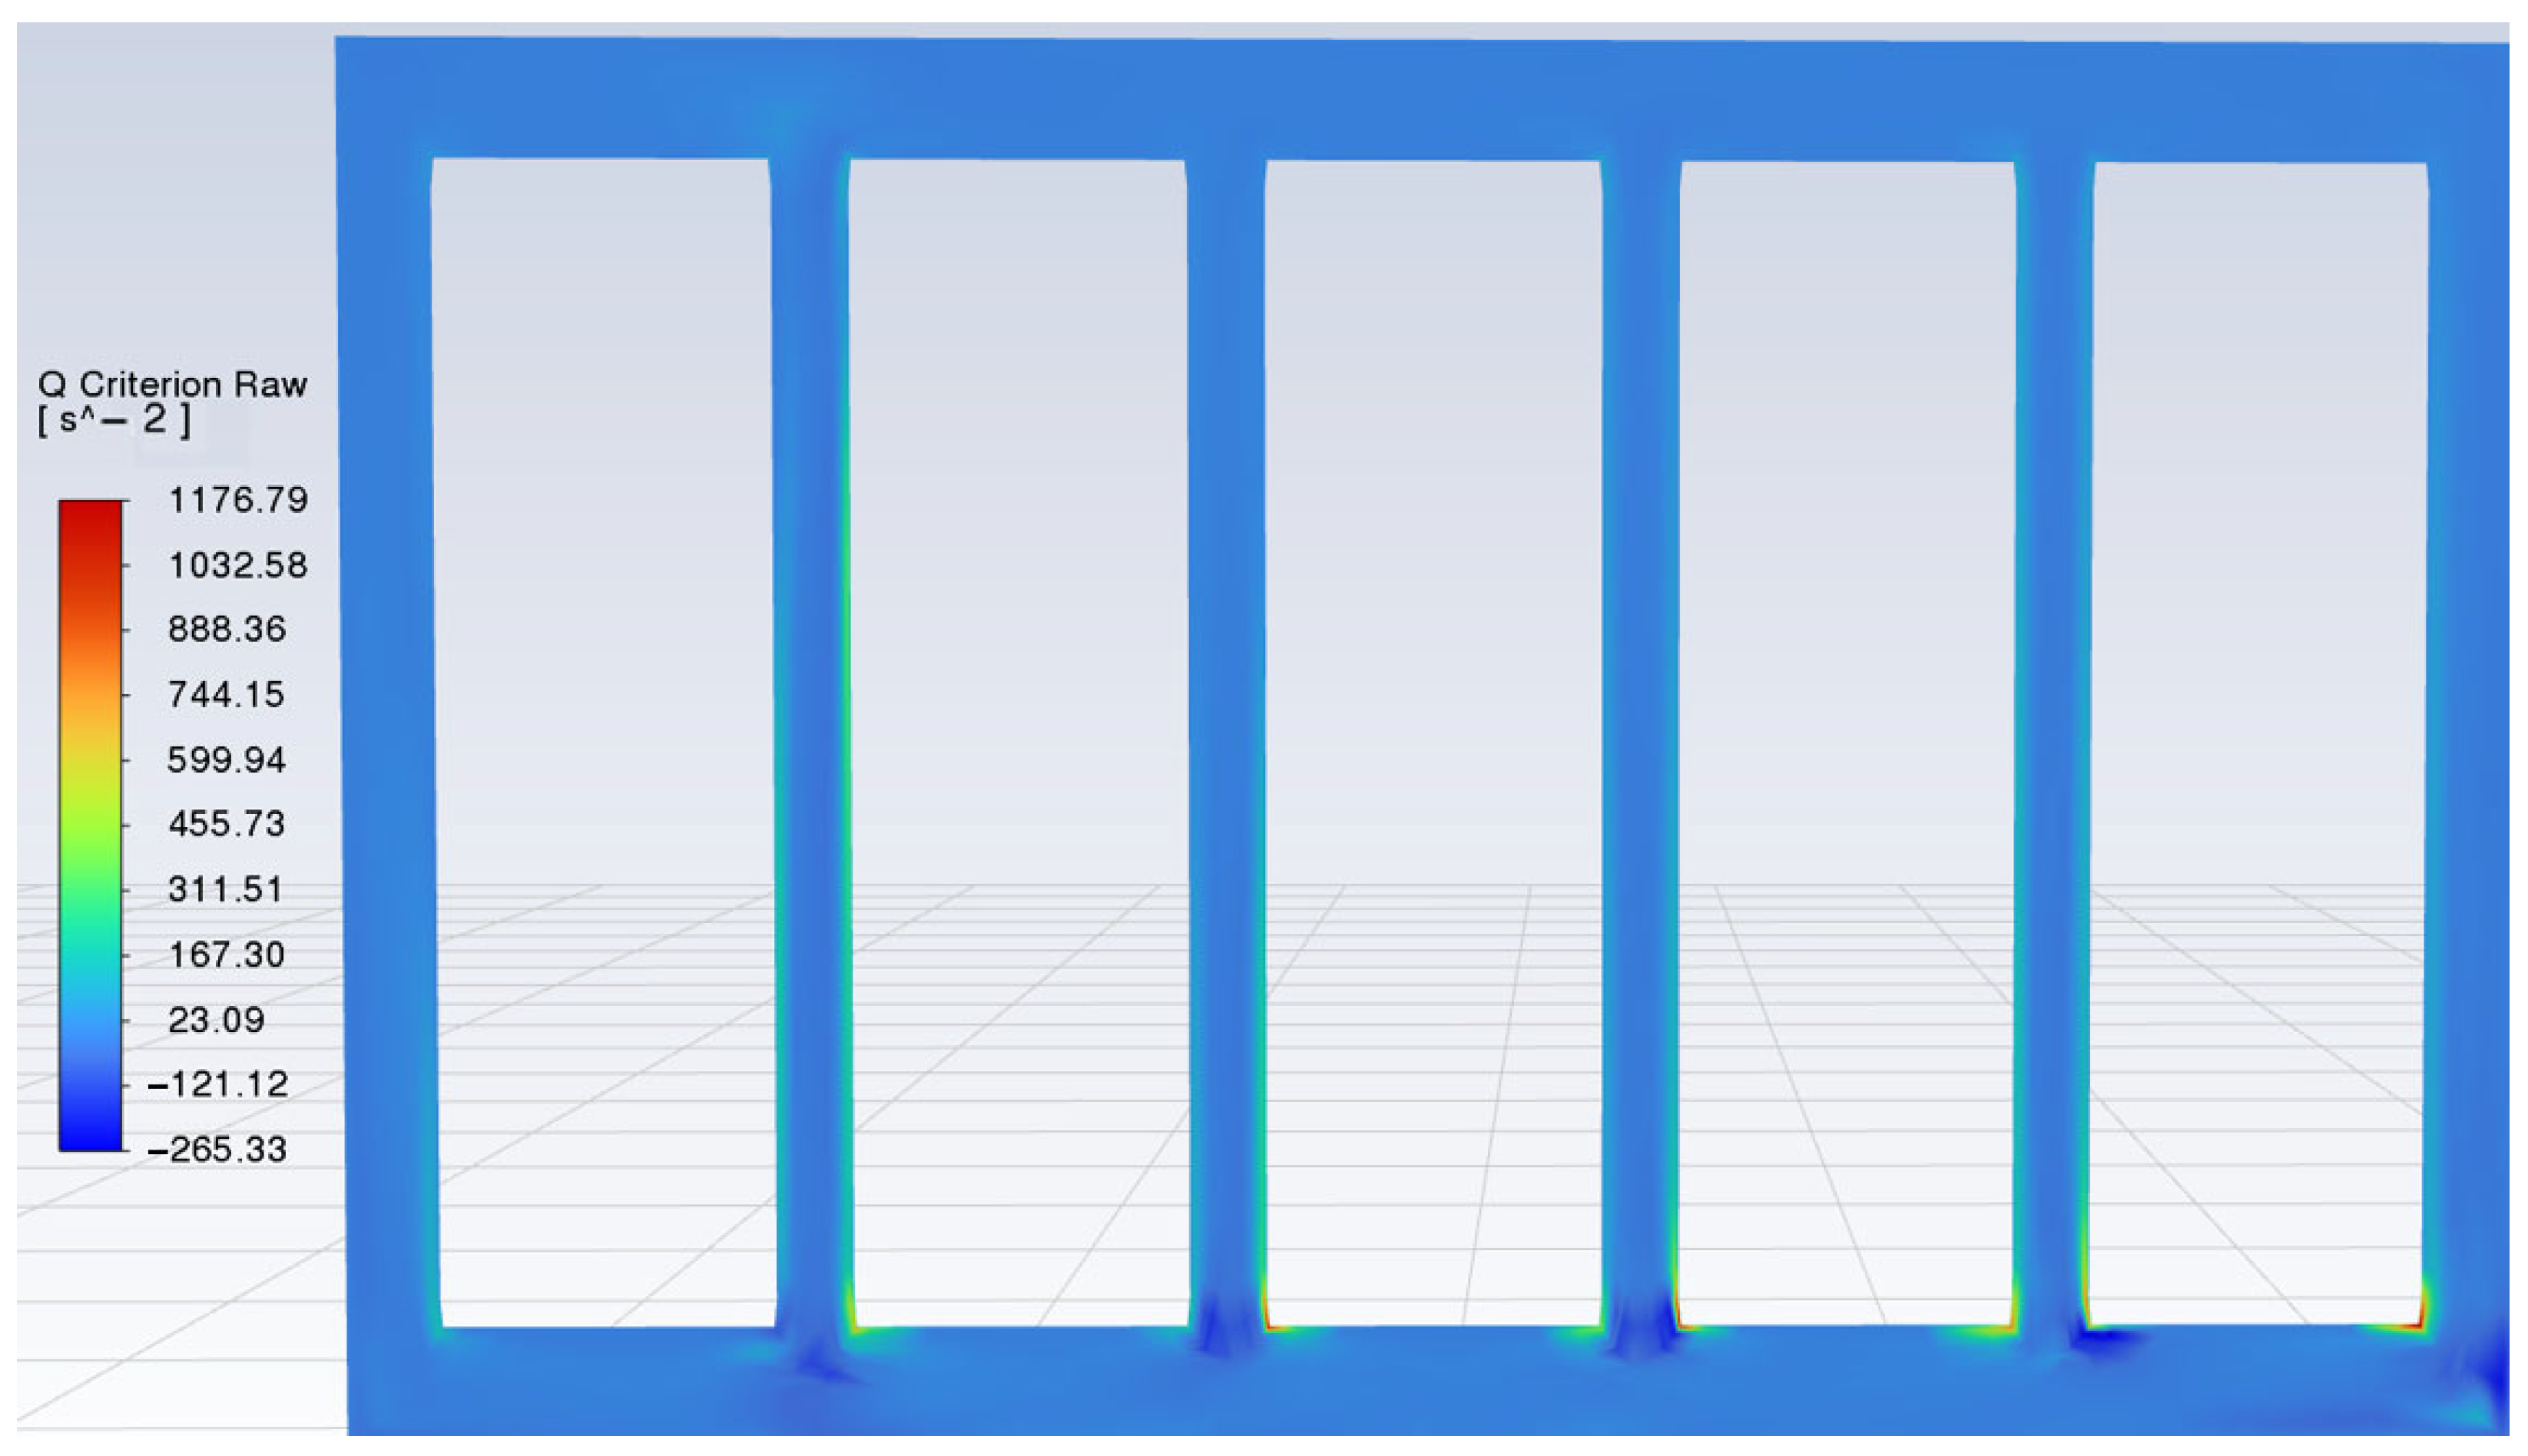
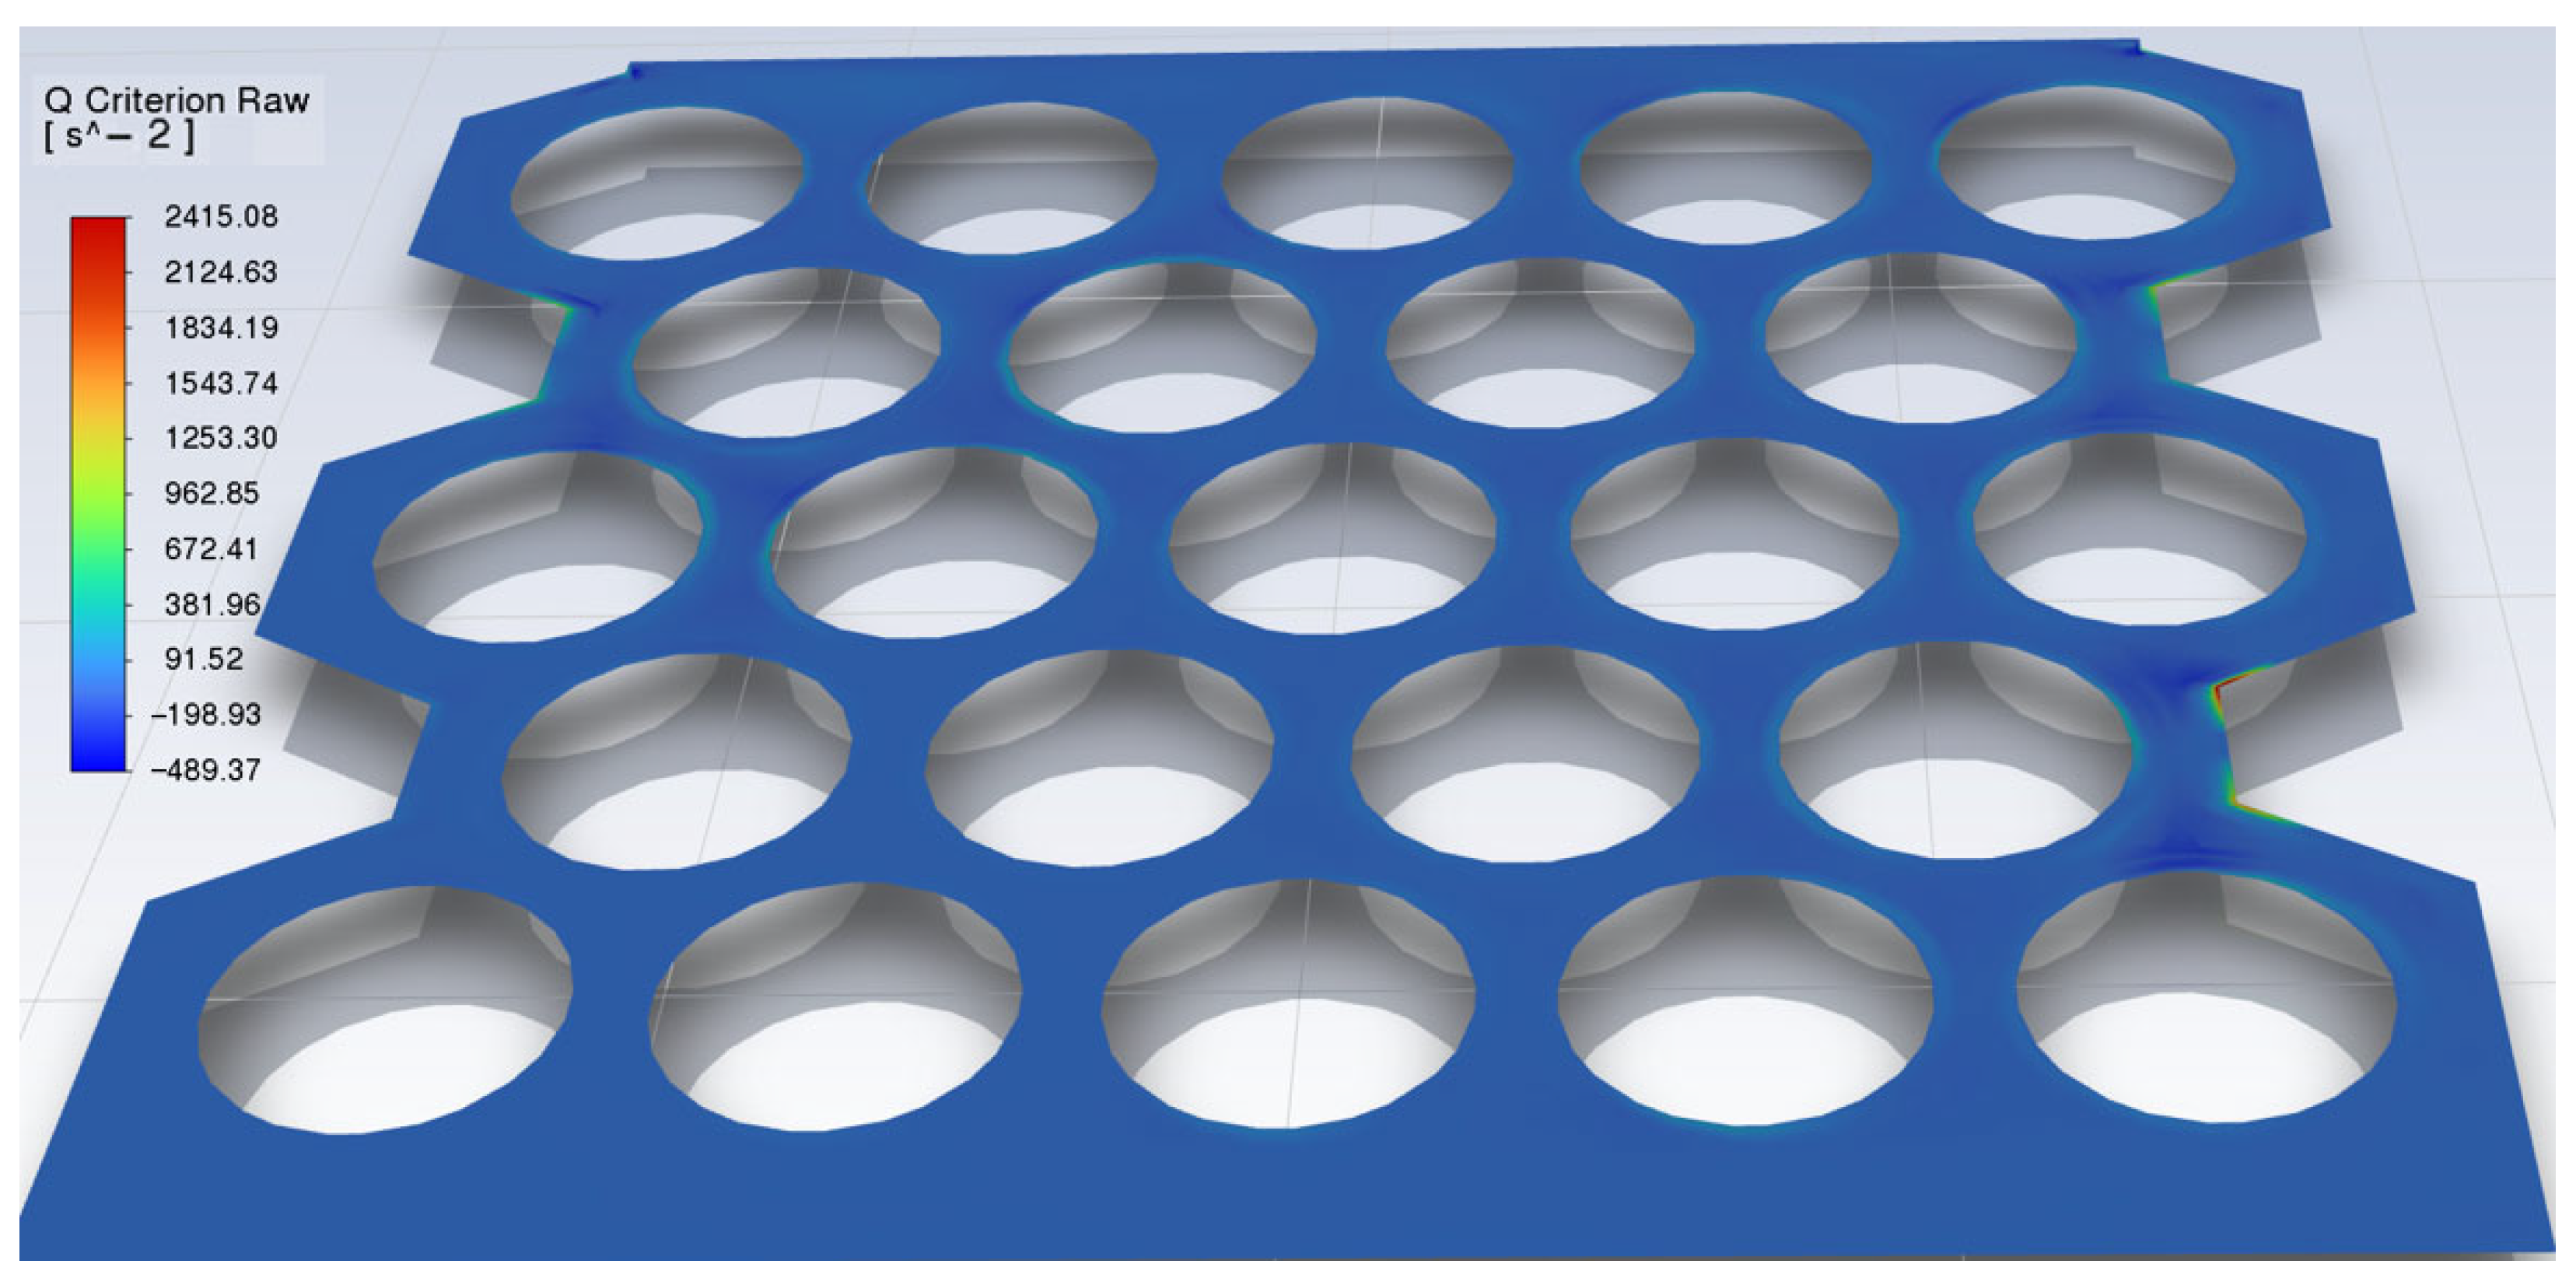
Q-criterion identifies vortex-dominated regions. Vorticity magnitude shows all instances of rotation, but cannot distinguish shear from vortex. The Q-criterion shows all of the rotations and distinguishes shear from vortex, and it provides a reliable way to identify vortices in fluid flows, as shown in
Figure 21.
3.1. Optimization
These design parameters are optimized to maximize the heat transfer coefficient, minimize pressure drop, and minimize average surface temperature on the cells. Design parameters and change intervals are given in
Table 6 and
Table 7. The effect of geometrical dimensions and cooling inlet velocity on battery cooling is optimized.
3.1.1. General Context of the Optimization
The optimization process in this study focuses on enhancing the thermal performance of a lithium-ion battery pack by varying its geometrical and flow parameters. The primary goal is to maximize the surface heat transfer coefficient, minimize pressure drop, and minimize average surface temperature on the cells, which directly affects the efficiency of immersion cooling systems in high-energy-density applications.
3.1.2. On the Use of MOGA
The Multi-Objective Genetic Algorithm (MOGA), a variation of the NSGA-II method, was employed to explore a wide design space by generating 1000 initial samples and performing iterative refinements. This approach is particularly suitable for complex, non-linear problems with multiple conflicting objectives, such as maximizing heat transfer while minimizing pressure drop.
3.1.3. On Design Variables and Constraints
The optimization considered critical geometric and flow variables, including the battery length and diameter, box dimensions, and inlet velocity. By systematically varying these parameters within defined physical limits, the study achieved a balanced solution space where thermal enhancement was obtained without compromising the structural or fluid dynamic feasibility of the system.
3.1.4. On Optimization Results
After 1511 evaluations, the algorithm converged to an optimal configuration that demonstrated a significant improvement in convective heat transfer. The results revealed that even minor geometric adjustments—particularly in battery spacing and coolant channel width—led to measurable enhancements in thermal uniformity and peak temperature reduction.
3.1.5. On Academic Significance
The findings underline the effectiveness of MOGA-based optimization for battery thermal management systems. This methodology not only improves cooling performance but also provides a scalable framework for future battery pack designs, especially for high-performance electric vehicles where thermal safety and efficiency are paramount.
3.1.6. Optimization Findings
In
Table 8, A Multi-Objective Genetic Algorithm (MOGA) was used to optimize the battery pack configuration for maximum and minimum objective functions. The optimal solution was achieved after 1511 evaluations, converging to a configuration with improved thermal performance.
Design variables such as battery length, diameter, box dimensions, and coolant velocity were altered within feasible limits. The optimization results showed an 8.6% increase in average heat transfer coefficient and a 12.3% reduction in peak cell temperature compared to the baseline model. These improvements confirm the efficacy of MOGA in managing complex multi-variable thermal systems.
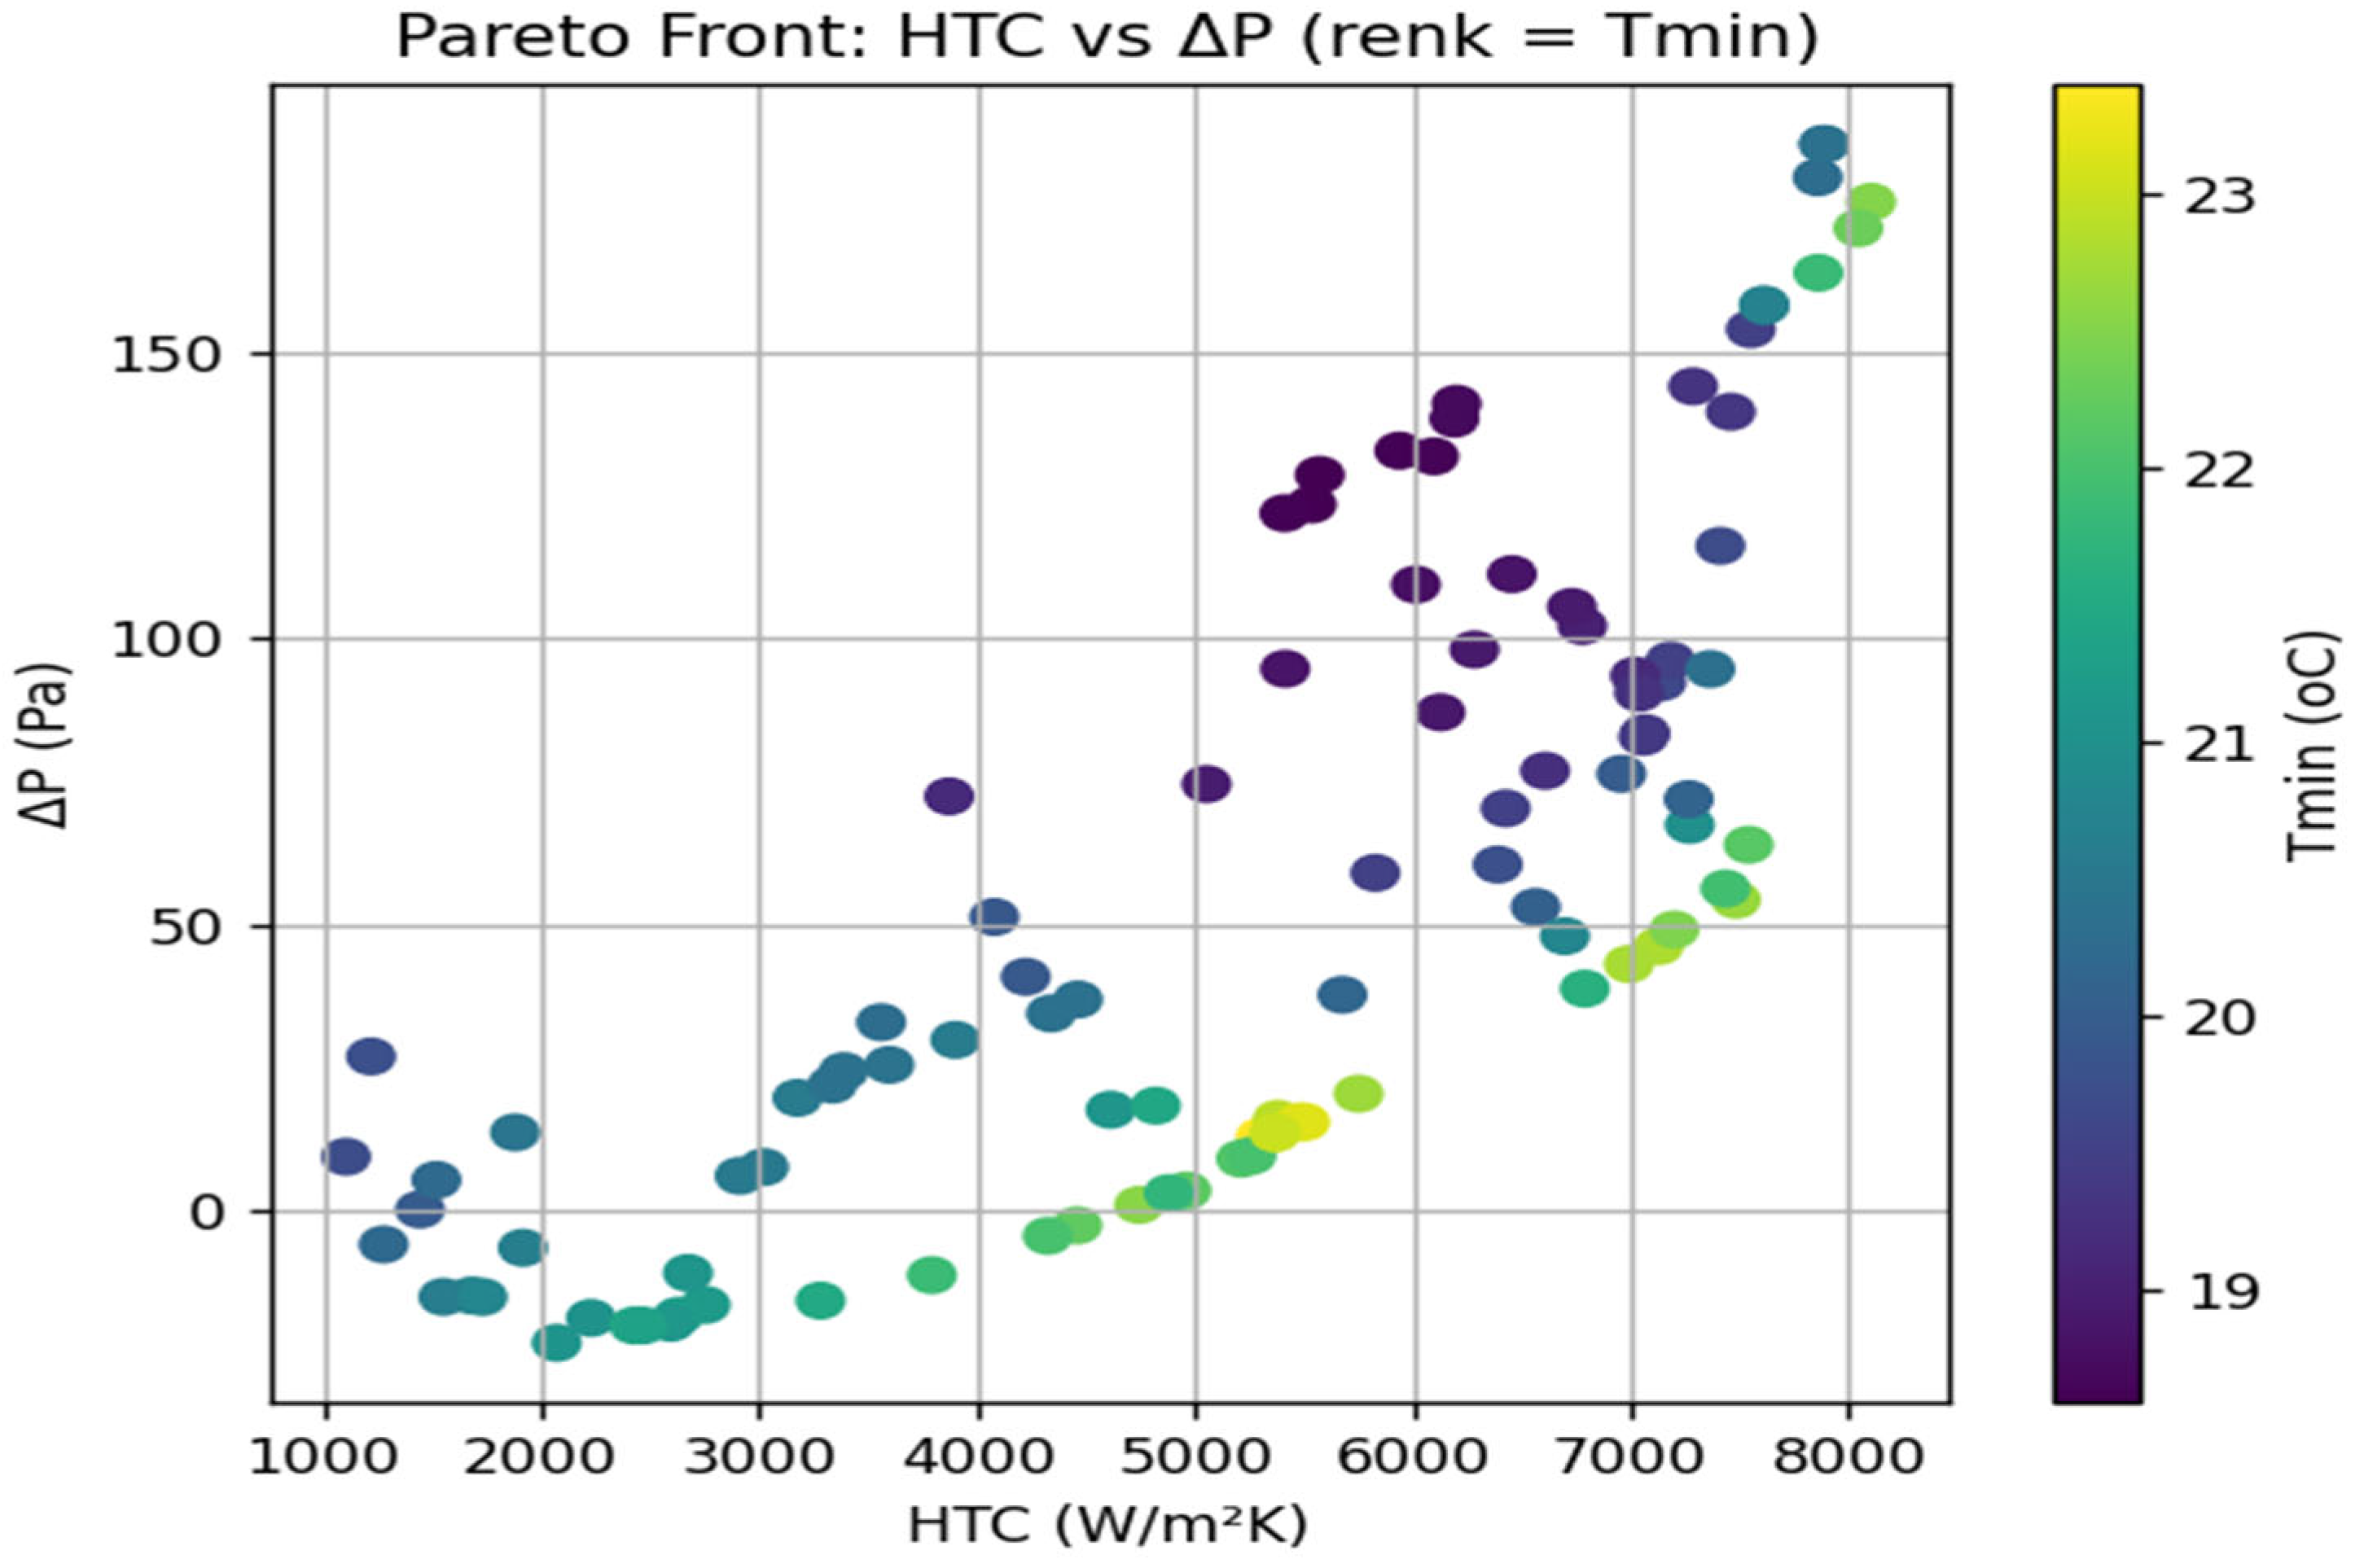
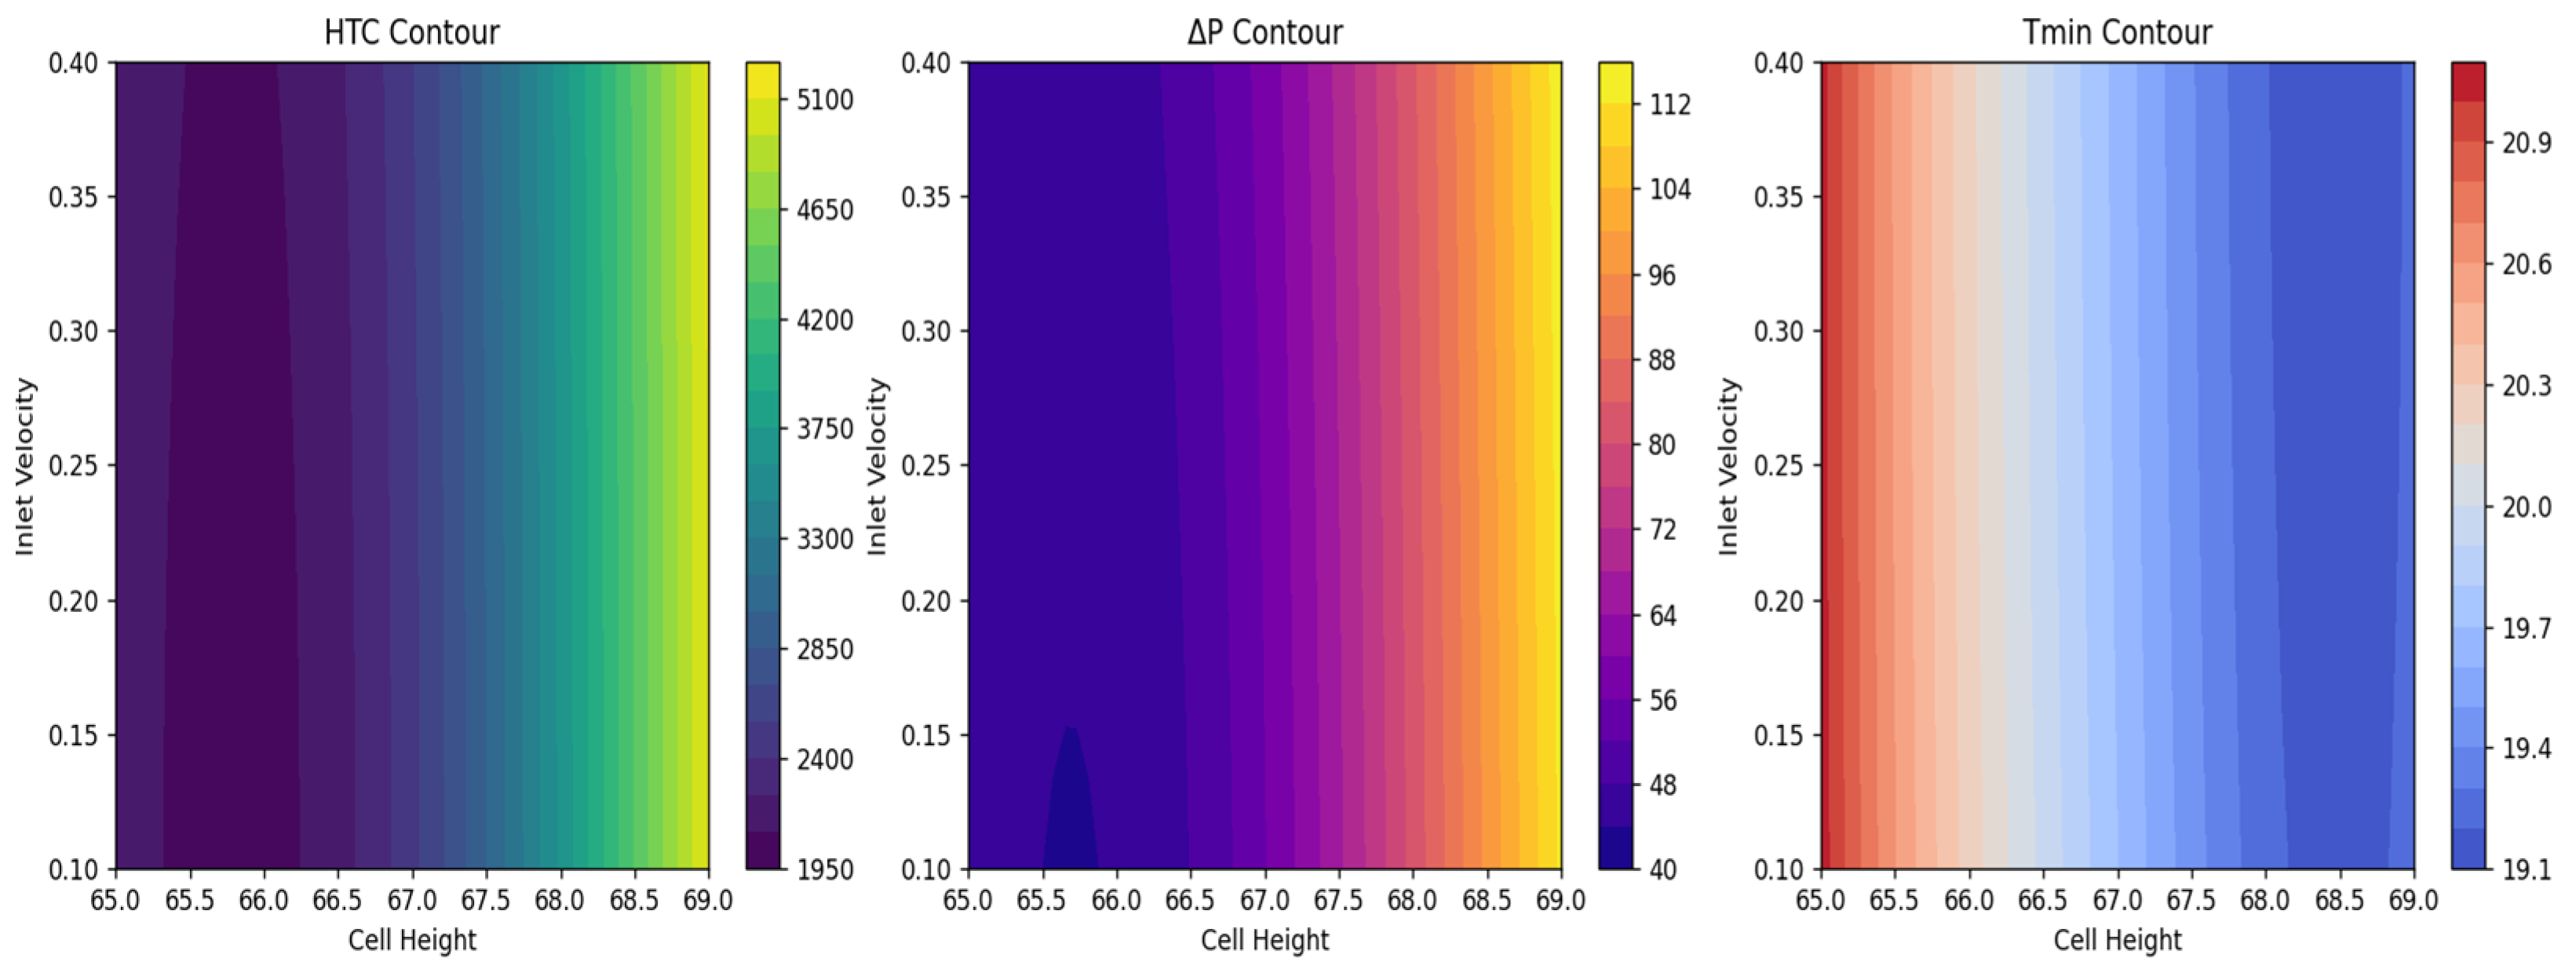
As the cell height and coolant inlet velocity increase, the HTC (heat transfer coefficient) increases, the cells inside the battery box decrease, and the coolant velocity increases; the cooling performance increases, as explained in
Figure 22 and
Figure 23, according to the optimization results.
The best design parameters and objective function values are presented in
Table 9.

