Abstract
Background/Objectives: Low-cost portable load cell dynamometers allow for real-time assessment of muscular strength. This study evaluated the reliability and repeatability of the G-Force load cell system during isometric hip abduction and adduction in young physically active Chilean adults. Methods: In total, 24 participants (19 men, 5 women) performed two maximal voluntary contractions per movement, repeated after a 24 h interval. Measured variables included Peak Force, peak rate of force development (Peak RFD), RFD at 50, 100, and 200 ms (RFD50, RFD100, RFD200), and maximum jerk. Reliability was assessed using intraclass correlation coefficients (ICCs), standard error of measurement (SEM), coefficient of variation (CV%) and Bland–Altman plots. Results: Peak Force showed excellent within-day (ICC = 0.94–0.96) and high between-day reliability (ICC = 0.87–0.89; CV = 20–30%). Bland–Altman analysis indicated negligible bias for Peak Force in abduction (−6.54 N; 95% CI −19.55 to 6.47) and adduction (−17.57 N; 95% CI −37.24 to 2.09), confirming the absence of systematic error. Peak RFD, RFD50–200, and maximum Jerk showed moderate repeatability and lower between-day reliability (ICCs = 0.39–0.70; CVs = 34–57%), indicating higher variability in explosive force indices compared with maximal strength. Conclusions: The G-Force load cell reliably measures maximal isometric hip strength, while Peak RFD, RFD50–200, and maximum jerk should be interpreted cautiously. These findings support the device as a practical, low-cost tool for sports and rehabilitation, though future studies should validate dynamic indices in larger and more diverse populations.
1. Introduction
Muscle strength, broadly defined as the capacity of the neuromuscular system to generate tension against external resistance, is a fundamental determinant of both athletic performance and musculoskeletal rehabilitation outcomes [1,2]. Accurate quantification of strength is essential for characterizing functional status, optimizing individualized training programs, preventing injuries, and monitoring adaptations during therapeutic interventions [1,2]. Consequently, valid, reliable, and feasible assessment methods are a priority in both sports’ science and clinical contexts.
Several approaches exist to evaluate muscular strength, each with specific advantages and limitations. Isokinetic dynamometry has traditionally been considered the gold standard due to its ability to assess concentric, eccentric, and isometric muscle actions with high validity [3,4,5]. However, its widespread use is limited by high cost, large size, and the need for specialized operators, which restricts accessibility in field or clinical settings. Even so, isokinetic devices are not immune to measurement errors, highlighting the need for alternative tools that provide accurate and reproducible assessments of muscle strength [3].
Portable dynamometry has emerged over the past decade as a practical approach for measuring isometric strength. These devices are easy to operate, safe during maximal voluntary contractions, and capable of delivering reproducible data in both laboratory and field conditions [6,7,8,9]. Most portable dynamometers rely on load cells, electrochemical sensors that convert applied force into electrical signals, enabling precise quantification of muscular strength [10,11,12]. Their low cost, portability, and adaptability have led to increased use in sports performance monitoring, rehabilitation programs, and educational environments.
Recent advances allow load-cell systems to capture real-time force–time curves and compute multiple neuromuscular parameters, including Peak Force and maximal RFD [10,11,12]. These indices provide complementary insights into explosive force production, motor unit recruitment, and neuro-muscular stability, which are relevant in both athletic and rehabilitative contexts.
However, the reproducibility of force-derived indices varies across devices and conditions, influenced by sensor design, signal acquisition, filtering, and processing algorithms [12,13,14]. Therefore, the reliability of any load-cell system cannot be assumed, underscoring the need for systematic validation studies tailored to the intended application.
Currently, there is a gap in validating low-cost, accessible dynamometers capable of accurately measuring both maximal isometric strength and indices of explosive neuromuscular performance. Addressing this gap is critical for expanding strength assessment to real-world contexts without compromising measurement quality.
Accordingly, this pilot study evaluated the reliability and repeatability of the G-Force load cell system during standardized isometric hip abduction and adduction in young, physically active Chilean adults. By assessing both Peak Force and dynamic force–time variables, this study aims to establish the device’s robustness while identifying potential limitations in interpreting explosive force indices in applied and research settings.
2. Materials and Methods
2.1. Design
This observational, descriptive, cross-sectional study was conducted in 2025 at the Athan Boxing Club in Concepción, Chile. The study design and reporting followed the Strengthening the Reporting of Observational Studies in Epidemiology (STROBE) guidelines [15]. The protocol was reviewed and approved by the Ethics Committee of the Central University of Chile (Protocol Code: 89/2025; Approval Date: 23 September 2025). Data collection was performed on 24 and 25 September 2025, with a 24 h interval between the test and retest sessions, following previous recommendations for reliability and validity assessments using isometric dynamometers [16]. All participants provided written informed consent prior to enrollment, in accordance with the principles of the Declaration of Helsinki [17].
2.2. Context
The capacity to generate rapid force is a critical component of both athletic performance and muscular rehabilitation, commonly assessed through the RFD. However, precise quantification of muscle strength parameters often requires expensive or technically demanding equipment, limiting accessibility for coaches, athletes, and practitioners in clinical or educational contexts [18]. In this regard, the present pilot study aims to validate the G-Force system, a low-cost load cell specifically designed to measure force during hip abduction and adduction movements.
2.3. Participants
A total of 24 physically active adults (19 men and 5 women) aged 18–44 years voluntarily participated. Recruitment was performed via non-probabilistic convenience sampling through social media announcements and direct invitation. All participants signed informed consent prior to data collection. In the adduction test, one participant did not complete the second session, resulting in a final sample of 23 for that condition.
Eligibility Criteria
Inclusion criteria:
- Physically active adults aged 18–44 years, able to safely perform maximal voluntary contractions.
- Abstention from moderate or vigorous physical activity within 48 h prior to testing, to avoid acute exercise interference.
- Capacity to understand and sign the informed consent form.
Exclusion criteria:
- Musculoskeletal disorders or chronic non-communicable diseases (e.g., hypertension, diabetes, cardiovascular/metabolic conditions) contraindicate maximal exertion.
- Use of medications influencing neuromuscular or cardiovascular function.
- Inability to correctly perform the required hip abduction/adduction movements.
2.4. Load Cell System
The device employed was the G-Force dynamometry system, integrating an S-type strain gauge load cell (model YZC-516C, Guangzhou, China) manufactured from alloy steel. This sensor has a nominal capacity of 0.5 t and a rated output of 2.0 ± 0.05 mV/V. Metrological characteristics include a combined error ≤ 0.03% RO, creep ≤ 0.02% RO at 30 min, input resistance 365 ± 5 Ω, output resistance 350 ± 3 Ω, and insulation resistance ≥ 5000 MΩ at 50 V. The compensated temperature range is −10 to +40 °C, with a safe overload tolerance of 120% RO and an ultimate overload of 150% RO. Although the manufacturer provides technical specifications and an accuracy class (C2), no validation studies or publicly available calibration certificates were found for the YZC-516C model.
For this reason, the load cell was calibrated following the basic protocol described in the Chronojump Boscosystem [19]. The calibration consisted of establishing a linear relationship between the sensor’s electrical signal and a known reference load. Specifically, a certified 5 kg (≈49.05 N) mass was used, suspended by a hanging system to simulate tensile conditions comparable to those used in hip abduction and adduction tests. This procedure allowed for verification of basic linearity within the limited force range used in the present study. Subsequently, a horizontal tare (zeroing) was performed with the sensor in a stable position to cancel the weight of the device itself and any attached accessories, in accordance with the manufacturer’s recommendations. However, no more exhaustive validation procedures were performed, such as evaluation of hysteresis, full-range linearity, or sensitivity, which is acknowledged as a limitation of this study.
The system was mounted on an adjustable fixation support with Velcro straps, ensuring stable and reproducible positioning and alignment of the sensitive axis with the applied force. This setup minimizes mechanical artifacts and enhances usability in both laboratory and field settings. Importantly, the G-Force system represents a low-cost and portable alternative to traditional isokinetic dynamometers, making it suitable for sports performance monitoring, rehabilitation, and applied research contexts (Figure 1).
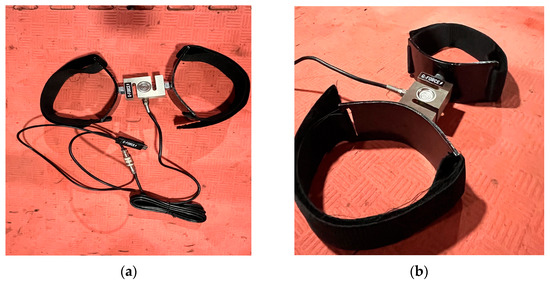
Figure 1.
(a) Schematic representation of the G-Force dynamometer with YZC-516 load cell and adduction–abduction adapter, top view; (b) side view.
2.4.1. Technical Functioning: Analog–Digital Conversion and Data Processing
Data acquisition was performed via USB–serial communication using the Modbus RTU protocol (38,400 bps, 8N1) [20], with calibration conducted using certified weights following the Chronojump basic protocol. The system included tare (zero or known load) and polarity inversion functionality, with direct export to CSV. A graphical user interface developed in Tkinter [21] allowed for real-time visualization of force–time curves and automatic computation of neuromuscular metrics.
The S-type load cell operates in a Wheatstone bridge configuration, with relative resistance changes expressed as ΔR/R = GF·ε and output voltage Vout = (ΔR/4R)·Vexc ≈ 2 mV/V. The differential signal was amplified using a low-noise instrumentation amplifier and converted to digital format via a 24-bit nominal ADC (~21 effective bits). The system exhibited an input noise < 1.5 µV RMS, nonlinearity < 0.05% FS, and an internal analog anti-aliasing filter with a cutoff frequency ≈ 10 Hz. The load cell was excited with 5 V DC ± 0.1 V.
For digital signal conditioning, the force signals were processed in Python (SciPy 1.12) using a fourth-order zero-phase Butterworth low-pass filter (cutoff frequency = 15 Hz, filtfilt method). Optional smoothing filters—including Savitzky–Golay (window = 7 samples, polynomial order = 2) and moving average (window = 5 samples)—were applied to reduce high-frequency noise without altering contraction dynamics, optimizing the estimation of Peak Force, rate of force development (RFD), and impulse. For RFD analysis, the force–time series could be interpolated to a uniform 1000 Hz grid. The calibration factor was calculated as K = (Mref × g)/Nraw_ref, with g = 9.91 m/s2.
Signal processing and metric computation (Peak Force, instantaneous and windowed RFD, and maximum Jerk) were performed as described in Supplement S1, which provides the full code and stepwise methodology for reproducibility, including filtering, interpolation, contraction onset detection, and export to CSV (Figure 2)
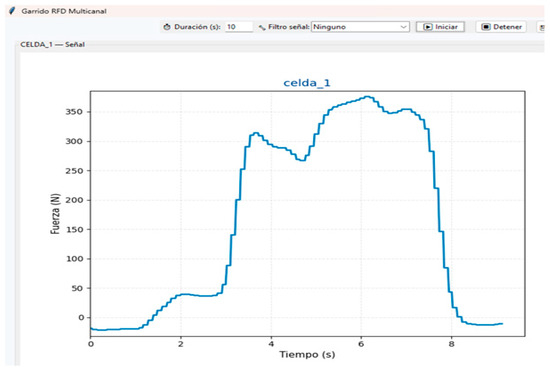
Figure 2.
Visual representation of the G-Force load cell force–time data.
2.4.2. Neuromuscular Metrics Computation
Peak RFD reflects the neuromuscular system’s capacity to generate explosive force within very short time windows (<50 ms) and is particularly sensitive to signal stability [22]. In this study, RFD at predefined time intervals was derived from the force–time curve following contraction onset (50, 100 and 200 ms) [23]. Maximum jerk refers to the rate of rapid changes in the slope of the force–time curve, capturing the stability and quality of neuromuscular activation [24]. Peak Force is defined as the highest force achieved during the contraction, considering directionality (negative for adduction, positive for abduction). The time to reach peak force was also recorded. These measures provide insights into movement symmetry, directional consistency, and measurement reproducibility [25]. The computational details of neuromuscular metrics are provided Supplement S1.
2.5. Sociodemographic and Anthropometric Variables
Age, stature, and body weight were measured using standardized procedures. Height was assessed with a portable stadiometer (Cescorf, São Paulo, Brazil; max 200 cm), and body weight with a digital scale (SECA model 803). Both instruments comply with the International Society for the Advancement of Kinanthropometry (ISAK) recommendations [26]. Body mass index (BMI) was calculated using the following standard equation [27]:
BMI = Weight (kg)/Height (m2)
2.6. Warm-Up Protocol
Participants completed a standardized 5 min warm-up consisting of dynamic stretching (flexion, extension, abduction, adduction of major joints) and mobility drills, followed by three submaximal isometric hip contractions at ~50–70% of estimated maximal effort. This procedure ensured neuromuscular preparation and familiarization with the device [28,29].
Isometric Hip Abduction and Adduction Tests
Testing was conducted with the hip and knee flexed at 90°, ensuring trunk stability and femoral alignment. Each participant first performed three familiarization contractions per movement. The order of abduction and adduction was alternated to minimize fatigue bias. Subsequently, two maximal voluntary contractions (MVCs) of each movement were executed, each sustained for 10 s with 2–3 min rest between efforts [23,30,31,32]. Reproducibility was evaluated by repeating the same protocol after 24 h under identical conditions [16] (Figure 3).
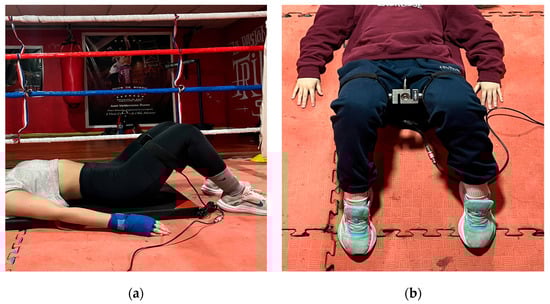
Figure 3.
(a) Hip abductor and adductor strength assessment using the G-Force, lateral view; (b) Hip abductor and adductor strength assessment using the G-Force, frontal view.
2.7. Bias
This study has several limitations and potential sources of bias that should be considered when interpreting the findings [33,34].
- ▪ Population bias: This study was conducted exclusively in young, physically active adults, which limits the generalizability of the results to other age groups, fitness levels, or individuals with musculoskeletal or neuromuscular disorders.
- ▪ Learning or fatigue bias: Although familiarization trials and rest periods were included, performance during MVCs may still have been affected by learning effects or residual fatigue between trials, particularly in the initial and final attempts of each session.
- ▪ Measurement bias: Although calibrated load cells were used, variability in RFD parameters may partly reflect the intrinsic sensitivity of the device and the signal processing algorithms, rather than true physiological differences.
2.8. Sample Size
The sample size was primarily determined considering the exploratory nature of this pilot study and the recommendations for reliability studies [35,36,37]. Bonett’s formula was applied to estimate the intraclass correlation coefficient (ICC) with a desired precision 95% confidence intervals (95% CI), width = 0.1 and assuming a true ICC of 0.9 with two repeated measurements per participant. To ensure an 80% probability that the CI would fall within the desired range, the minimum required sample size was 24 participants, a figure that aligns with the recommendations of Koo et al. [36] and Bonett [37], who suggest samples of 20 to 30 individuals as appropriate sizes for pilot reproducibility studies.
2.9. Statistical Analysis
Data analysis was performed using SPSS v27.0 (IBM Corp., Armonk, NY, USA). Normality was assessed with the Shapiro–Wilk test, and homogeneity of variances was evaluated using Levene’s test. Parametric variables (e.g., height, peak force) were analyzed using Student’s t-tests, while non-parametric variables (e.g., age, weight, BMI, RFDs and maximum jerk) were analyzed using Wilcoxon tests. Descriptive statistics included mean (X), standard deviation (SD), and 95% CI.
Repeatability (intra-session) was assessed by comparing MVC1 and MVC2 within the same session (Day 1), reflecting measurement consistency under identical conditions. Reliability (inter-session) was evaluated by comparing measurements between different days (Day 1 vs. Day 2), reflecting stability over time. The ICC (two-way mixed-effects, absolute agreement, single measures) with 95% CI was calculated and interpreted as poor (<0.50), moderate (0.50–0.75), good (0.75–0.90), or excellent (>0.90) [35,36,37,38].
The coefficient of variation (CV%) while a CV < 15% was used as a criterion for minimum acceptable reliability in MCVs protocols [39]. The standard error of measurement (SEM) and the minimum detectable change (MDC) were also calculated according to a previous recommendation for functional testing in athletes [40]. Based on these metrics, a Bland–Altman plot was generated for peak force, which was considered an uncensored variable due to its high levels of absolute and relative reliability obtained in our study [41]. Statistical significance for all analyses was set at an alpha level of <0.05.
3. Results
3.1. Basal Characteristics
Table 1 presents the demographic and anthropometric characteristics of the sample (n = 24), stratified by sex. Significant differences were observed in body weight (p = 0.02) and height (p < 0.001), with men being heavier and taller than women. No differences were found in age (p = 0.37) or BMI (p = 0.41). Given the homogeneity in age and BMI, and the fact that the tests involve isolated, isometric hip contractions with static segments, body size is unlikely to significantly affect measured force. Therefore, Peak Force and related metrics primarily reflect local hip muscle capacity. Additionally, due to the small number of female participants (n = 5), analyses were conducted on the whole sample, assuming that differences in force are mainly driven by sex and individual strength rather than age or body dimensions, in line with previous findings [42].

Table 1.
Basic characteristics of the sample (n = 24).
It is important to mention that of the 24 participants, there was 1 loss of follow-up for the Isometric Hip Adduction Strength Test because a participant did not complete said test.
3.2. Within-Day Repeatability (Day 1)
Table 2 and Table 3 summarize intra-session repeatability for hip abduction (n = 24) and hip adduction (n = 23). Peak Force showed high repeatability for both abduction (ICC = 0.94; CV = 20.25%) and adduction (ICC = 0.96; CV = 30.5%), indicating that maximal strength measures remain stable within a single session.
Table 2.
Repeatability of isometric hip abduction strength test (n = 24).
Table 3.
Repeatability of isometric hip adduction strength test (n = 23).
In contrast, variables related to RFD exhibited moderate repeatability. For abduction, ICCs ranged from 0.55 to 0.59 with CVs of 36.7–46.6%, while adduction values were slightly higher but more heterogeneous (ICC = 0.61–0.67; CV = 47.6–57.2%). These findings indicate that measures of rapid force production are more variable than maximal voluntary strength, reflecting lower consistency across repeated trials. When analyzing maximum jerk, results also showed moderate repeatability (ICC = 0.55–0.56), with CVs ranging from 29.2% in abduction to 42.1% in adduction.
3.3. Between-Day Reliability
Inter-session reliability is summarized in Table 4 and Table 5. Peak Force demonstrated high reliability for both abduction (ICC = 0.87; CV = 20.2%) and adduction (ICC = 0.89; CV = 30.0%), with SEMs ranging from 32.75 to 47.9 N and MDCs of 90.78–132.8 N, confirming the reproducibility of this measure across days.
Table 4.
Reliability of isometric hip abduction strength test (n = 24).
Table 5.
Reliability of isometric hip adduction strength test (n = 23).
In contrast, variables related to RFD showed lower reliability between days. For abduction, ICCs ranged from 0.39 to 0.45 with CVs of 38.7–48.1%, while adduction values were more heterogeneous (ICC = 0.64–0.70; CV = 50.7–56.5%). These results indicate that RFD measures exhibit greater variability and should be interpreted with caution in longitudinal assessments.
Regarding maximum jerk, values showed moderate reliability across days (ICC = 0.57–0.62), with CVs ranging from 33.6% in abduction to 49.5% in adduction. Although maximum jerk was more consistent than most RFD variables, its reproducibility did not reach the levels observed for peak force. This supports its interpretation as a complementary marker of neuromuscular activation quality rather than a robust stand-alone outcome.
Table 6 and Figure 4 present the Bland–Altman analysis for peak force measurements during hip abduction and adduction. The mean bias for abduction was −6.54 N, with a standard deviation of 46 N, indicating minimal systematic differences between repeated measurements and relatively narrow limits of agreement (95% CI: −19.55 to 6.47 N). In contrast, adduction showed a slightly larger mean bias of −17.57 N and a higher standard deviation of 68.1 N, reflecting greater variability between repeated measurements (95% CI: −37.24 to 2.09 N). Overall, these results suggest that the low-cost G-Force load cell system provides reliable and reproducible estimates of peak force for both abduction and adduction, with slightly greater measurement variability observed for adduction. Bland–Altman plots further confirm the absence of significant proportional bias, supporting the consistency of the system across the range of observed forces.
Table 6.
Results of Bland–Altman statistics.
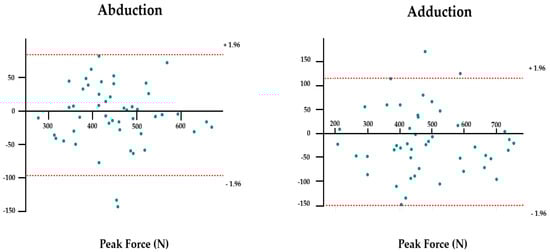
Figure 4.
Bland–Altman plots of peak force abduction and adduction. Standard deviation of bias.
4. Discussion
The present study assessed the reliability and repeatability of the G-Force load cell system during isometric hip abduction and adduction tests in young, physically active adults in Chile, a context where access to commercial, low-cost, and calibrated dynamometers is very limited. According to standard reproducibility classifications [35,36,37,38,39], Peak Force demonstrated excellent intra- and inter-session reliability (ICC = 0.87–0.96), although the coefficients of variation were relatively high (20.2–30.5%), which exceeds the generally accepted thresholds (<10–15%) for strength testing. Courel-Ibáñez et al. (2024) [43] suggest that such elevated variability may result from protocols with a limited MVCs per participant, which reduce movement familiarization and increase interaction effects.
Bland–Altman analysis revealed negligible bias values for peak force in both abduction (−6.54 N) and adduction (−17.57 N), confirming the absence of systematic error and supporting the stability of this parameter [41]. However, adduction exhibited greater bias and wider dispersion (SD = 68.1 N) compared with abduction (SD = 46 N), likely due to higher biomechanical complexity and the recruitment of deeper stabilizing muscles [44,45,46,47].
In contrast, abduction tends to be more stable and less prone to compensatory strategies, resulting in more consistent measurements. These results suggest that abduction measurements may be more reproducible, while adduction requires stricter standardization of body positioning to reduce variability. From a clinical perspective, this also underscores the relevance of adductor testing in sports such as soccer and hockey, where strength deficits are strongly associated with groin pain and increased injury risk [44,45,46,47].
In contrast, the curve-derived force–time metrics (peak RFD, RFD50, RFD100, RFD200) and maximum Jerk demonstrated only moderate reproducibility within sessions (ICC = 0.55–0.67) and low-to-moderate reproducibility between sessions (ICC = 0.39–0.70). These metrics were associated with higher variability than Peak Force, reflecting their greater sensitivity to signal processing, contraction onset detection, and computational algorithms [10,11,22,37,47,48,49,50]. Consequently, RFD and Jerk should be considered exploratory outcomes rather than primary endpoints in small cross-sectional studies.
These results confirm previous findings showing that Peak Force is more stable than explosive force metrics. For instance, Merino-Muñoz et al. [32] reported good to excellent reliability for hip adductor Peak Force (ICC = 0.706–0.819) and lower consistency for RFD (ICC = 0.367–0.660). Similarly, Pichardo et al. [11] and Montoro-Bombú et al. [12] confirmed the validity of load cell-based systems for maximal force assessment while emphasizing the limitations in explosive force measurements. Together, these findings support the use of Peak Force for both research and applied contexts while highlighting that caution is needed when interpreting RFD and Jerk.
From a practical standpoint, the findings of our study and reports in the literature support the use of load cell systems as a low-cost, portable, and reliable tool for maximal isometric hip strength assessment, particularly in Chile and similar contexts where access to commercial isokinetic equipment is restricted, suitable for sports, clinical, and rehabilitation settings where access to isokinetic dynamometry is limited [10,11,12,23,48,49,50,51]. RFD and maximum Jerk may provide complementary information on neuromuscular activation but should be interpreted cautiously and preferably in longitudinal studies where intra-individual changes can yield more meaningful trends [23,49,50].
Moreover, the MDC values of 90–130 N observed for peak force represent a relevant functional threshold. In young, physically active adults, this magnitude of change corresponds to approximately 20–25% of average force values, suggesting that only substantial adaptations—such as multi-week strength training or rehabilitation programs—would surpass the measurement error and qualify as true improvements [51]. This implies that small early gains (<100 N), expected during the first weeks of rehabilitation, may not be reliably detected, limiting sensitivity in short-term recovery assessment. Conversely, in athletic populations, a change of 100 N can translate into meaningful performance gains in acceleration, change in direction, and joint stability, reinforcing the device’s value for high-performance monitoring [51]. Importantly, given that adductor strength deficits are strongly linked to groin pain and hip-related injuries in sports such as soccer and hockey, a measurable gain of ≥100 N could signify not only improved performance but also a clinically meaningful reduction in injury risk.
Nevertheless, the relatively high CV values observed in peak force (20–30%) indicate that measurement variability is a limitation. Although peak force was the most stable metric in this study, these values exceed the <10–15% CV thresholds often cited as benchmarks for strength testing reliability, thereby constraining its capacity to detect subtle physiological or clinical changes [39]. This highlights the importance of multiple MVC trials and strict protocol standardization, particularly for reducing random variability for adduction testing, where the high test demands limit performance.
Another key limitation relates to external validity. Since this study involved only young, physically active adults, the results cannot be generalized to older, sedentary, or clinical populations. This lack of representativeness, combined with the limitations inherent to observational designs, must be considered when extrapolating the use of the G-Force system beyond the study group [52,53].
Additionally, the YZC-516C model lacks publicly available scientific certification, introducing uncertainty regarding absolute measurement accuracy. External factors such as sleep, nutrition, and fatigue were not controlled and could influence RFD and Jerk metrics, despite familiarization and rest periods [54,55,56]. Finally, the cross-sectional design precludes evaluation of sensitivity to long-term training or intervention-induced changes [57].
Future research should focus on validating the G-Force system in diverse populations, comparing outcomes with reference standards (e.g., isokinetic dynamometry), and improving signal processing for RFD and Jerk. Longitudinal studies are also needed to determine if the 90–130 N MDC threshold is consistent and whether smaller but clinically meaningful changes can be reliably detected.
5. Conclusions
The G-Force load cell system reliably measures maximal isometric hip strength assessment, particularly for Peak Force, while force–time variables (RFD and Jerk) demonstrated moderate reproducibility. These findings indicate that the G-Force system can serve as a practical, low-cost, and portable alternative for evaluating maximal strength in sports and rehabilitation contexts, especially when access to isokinetic equipment is limited.
However, due to the relatively high variability observed and the absence of external calibration, the results should be interpreted with caution, and further research is required to refine signal processing, improve measurement precision, and confirm the system’s external validity. Future longitudinal and comparative studies will help establish the broader applicability and sensitivity of this tool for detecting meaningful neuromuscular adaptations.
Supplementary Materials
The following supporting information can be downloaded at: https://www.mdpi.com/article/10.3390/app152111457/s1, Supplement S1: programming codes G-Force load cell system.
Author Contributions
Conceptualization, V.G.-O. and H.F.-B.; methodology, V.G.-O., H.F.-B. and R.A.-E.; software, V.G.-O.; validation, V.G.-O., H.F.-B., S.S.-G., C.S.-J. and R.A.-E.; formal analysis, V.G.-O., H.F.-B., S.S.-G., C.S.-J. and R.A.-E.; investigation, V.G.-O., H.F.-B., S.S.-G., C.S.-J. and R.A.-E.; data curation, V.G.-O., H.F.-B., S.S.-G. and C.S.-J.; writing—original draft preparation, V.G.-O., H.F.-B., S.S.-G., C.S.-J., R.A.-E., D.R.-G., Á.R.-V. and M.C.-O.; writing—review and editing, V.G.-O., H.F.-B., S.S.-G., C.S.-J., R.A.-E., D.R.-G., Á.R.-V. and M.C.-O.; visualization, V.G.-O., H.F.-B., S.S.-G., C.S.-J., R.A.-E., D.R.-G., Á.R.-V. and M.C.-O.; supervision, V.G.-O. and H.F.-B.; project administration, V.G.-O. and H.F.-B. All authors have read and agreed to the published version of the manuscript.
Funding
This research received no external funding.
Institutional Review Board Statement
This study was conducted according to the guidelines of the Declaration of Helsinki and was approved by the Institutional Ethics Committee of the Central University of Chile (protocol Code: 89/2025; Approval Date: 23 September 2025).
Data Availability Statement
The data from this article will be made available by the author’s on reasonable request.
Acknowledgments
The authors acknowledge the Athan Boxing Club and everyone who made this study possible. During the preparation of this manuscript, the authors used ChatGPT-5-turbo to improve the grammatical style. The authors have reviewed and edited the output and take full responsibility for the content of this publication.
Conflicts of Interest
The authors declare no conflicts of interest.
Abbreviations
The following abbreviations are used in this manuscript:
| RFD | Rate of Force Development |
| MVCs | maximal voluntary contractions |
References
- Suchomel, T.J.; Nimphius, S.; Bellon, C.R.; Stone, M.H. The Importance of Muscular Strength: Training Considerations. Sports Med. 2018, 48, 765–785. [Google Scholar] [CrossRef]
- Suchomel, T.J.; Nimphius, S.; Stone, M.H. The Importance of Muscular Strength in Athletic Performance. Sports Med. 2016, 46, 1419–1449. [Google Scholar] [CrossRef] [PubMed]
- Wilk, K.E.; Arrigo, C.A.; Davies, G.J. Isokinetic Testing: Why it is More Important Today than Ever. Int. J. Sports Phys. Ther. 2024, 19, 374–380. [Google Scholar] [CrossRef] [PubMed]
- Thompson, B.J. It’s time to re-evaluate the reporting of common measures from isokinetic dynamometers: Isokinetic for torque, isotonic for power. Front. Sports Act. Living 2025, 7, 1472712. [Google Scholar] [CrossRef] [PubMed]
- Sahu, P.K.; Goodstadt, N.; Ramakrishnan, A.; Silfies, S.P. Test-retest reliability and concurrent validity of knee extensor strength measured by a novel device incorporated into a weight stack machine vs. handheld and isokinetic dynamometry. PLoS ONE 2024, 19, e0301872. [Google Scholar] [CrossRef]
- Benfica, P.D.A.; Aguiar, L.T.; Brito, S.A.F.; Bernardino, L.H.N.; Teixeira-Salmela, L.F.; Faria, C.D.C.M. Reference values for muscle strength: A systematic review with a descriptive meta-analysis. Braz. J. Phys. Ther. 2018, 22, 355–369. [Google Scholar] [CrossRef]
- Warneke, K.; Wagner, C.M.; Keiner, M.; Hillebrecht, M.; Schiemann, S.; Behm, D.G.; Wallot, S.; Wirth, K. Maximal strength measurement: A critical evaluation of common methods—A narrative review. Front. Sports Act. Living 2023, 5, 201. [Google Scholar] [CrossRef]
- Garcia, D.; de Sousa Neto, I.V.; de Souza Monteiro, Y.; Magalhães, D.P.; Ferreira, G.M.L.; Grisa, R.; Prestes, J.; Rosa, B.V.; Abrahin, O.; Martins, T.M.; et al. Reliability and Validity of a Portable Traction Dynamometer in Knee-Strength Extension Tests: An Isometric Strength Assessment in Recreationally Active Men. Healthcare 2023, 11, 1466. [Google Scholar] [CrossRef]
- Oyama, S.; Garza, E.; Dugan, K. Intrasession and Intersession Reliability of Isometric Trunk and Hip Strength Measurements Using the Portable Tension Dynamometer. J. Sport Rehabil. 2021, 30, 1111–1114. [Google Scholar] [CrossRef]
- Al-Dahiree, O.S.; Tokhi, M.O.; Hadi, N.H.; Hmoad, N.R.; Ghazilla, R.A.R.; Yap, H.J.; Albaadani, E.A. Design and Shape Optimization of Strain Gauge Load Cell for Axial Force Measurement for Test Benches. Sensors 2022, 22, 7508. [Google Scholar] [CrossRef]
- Pichardo, A.W.; Neville, J.; Tinwala, F.; Cronin, J.B.; Brown, S.R. Validity and Reliability of Force-Time Characteristics Using a Portable Load Cell for the Isometric Midthigh Pull. J. Strength Cond Res. 2024, 38, 185–191. [Google Scholar] [CrossRef] [PubMed]
- Montoro-Bombú, R.; Gomes, B.B.; Santos, A.; Rama, L. Validity and Reliability of a Load Cell Sensor-Based Device for Assessment of the Isometric Mid-Thigh Pull Test. Sensors 2023, 23, 5832. [Google Scholar] [CrossRef] [PubMed]
- Du, W.; Cornett, K.M.D.; Donlevy, G.A.; Burns, J.; McKay, M.J. Variability between Different Hand-Held Dynamometers for Measuring Muscle Strength. Sensors 2024, 24, 1861. [Google Scholar] [CrossRef] [PubMed]
- Labott, B.K.; Held, S.; Wiedenmann, T.; Rappelt, L.; Wicker, P.; Donath, L. Validity and Reliability of a Commercial Force Sensor for the Measurement of Upper Body Strength in Sport Climbing. Front. Sports Act. Living 2022, 4, 838358. [Google Scholar] [CrossRef]
- Cuschieri, S. The STROBE guidelines. Saudi J. Anaesth. 2019, 13, S31–S34. [Google Scholar] [CrossRef]
- de Vasconcelos, R.A.; Bevilaqua-Grossi, D.; Shimano, A.C.; Paccola, C.J.; Salvini, T.F.; Prado, C.L.; Junior, W.A. Reliability and validity of a modified isometric dynamometer in the assessment of muscular performance in individuals with anterior cruciate ligament reconstruction. Rev. Bras. Ortop. 2015, 44, 214–224. [Google Scholar] [CrossRef]
- World Medical Association. World Medical Association Declaration of Helsinki: Ethical Principles for Medical Research Involving Human Participants. JAMA 2025, 333, 71–74. [Google Scholar] [CrossRef]
- van der Zee, T.J.; Wong, J.D.; Kuo, A.D. On the rate-limiting dynamics of force development in muscle. J. Exp. Biol. 2024, 227, jeb247436. [Google Scholar] [CrossRef]
- Chronojump Boscosystem. Chronojump Manual. English Translation by Olsson H. 5 September 2023. Available online: https://chronojump.org/docs/chronojump_manual_en.pdf (accessed on 13 October 2025).
- Zhao, S.; Zhang, Q.; Zhao, Q.; Zhang, X.; Guo, Y.; Lu, S.; Song, L.; Zhao, Z. Enhancing Bidirectional Modbus TCP ↔ RTU Gateway Performance: A UDP Mechanism and Markov Chain Approach. Sensors 2025, 25, 3861. [Google Scholar] [CrossRef]
- Python Software Foundation. Tkinter—Python interface to Tcl/Tk. En: Python 3.13.7 Library Reference. 2025. Available online: https://docs.python.org/es/3/library/tkinter.html (accessed on 8 September 2025).
- Saito, S.; Nakao, Y.; Hasegawa, Y.; Nagai, K.; Sano, K.; Uchiyama, Y.; Kishimoto, H.; Shinmura, K.; Domen, K. Relationship between Rate of Force Development of Tongue Pressure and Physical Performance. J. Clin. Med. 2022, 11, 2347. [Google Scholar] [CrossRef]
- Pimenta, R.; Pimenta, A. πForce—Repeatability and Reliability of Peak Force and Rate of Force Development in a Portable Multi-Exercise Device. Muscles 2025, 4, 36. [Google Scholar] [CrossRef] [PubMed]
- Lin, D.C.; McGowan, C.P.; Blum, K.P.; Ting, L.H. Yank: The time derivative of force is an important biomechanical variable in sensorimotor systems. J. Exp. Biol. 2019, 222, jeb180414. [Google Scholar] [CrossRef] [PubMed]
- Zemková, E.; Poór, O.; Pecho, J. Peak Rate of Force Development and Isometric Maximum Strength of Back Muscles Are Associated With Power Performance During Load-Lifting Tasks. Am. J. Mens. Health 2019, 13, 1557988319828622. [Google Scholar] [CrossRef] [PubMed]
- Silva, V.S.; Vieira, F. International Society for the Advancement of Kinanthropometry (ISAK) Global: International accreditation scheme of the competent anthropometrist. Rev. Bras. Cineantropom. Desempenho Hum. 2020, 22, e70517. [Google Scholar] [CrossRef]
- Weir, C.B.; Jan, A. BMI Classification Percentile and Cut Off Points; StatPearls Publishing: St. Petersburg, FL, USA, 2025. [Google Scholar]
- Griech, S.F.; Karagiannopoulos, C. Accuracy of Two Methods in Estimating Target Muscle Force During Shoulder Submaximal Isometric Contractions. Int. J. Sports Phys. Ther. 2025, 20, 79–86. [Google Scholar] [CrossRef]
- Haraldsson, B.T.; Andersen, C.H.; Erhardsen, K.T.; Zebis, M.K.; Micheletti, J.K.; Pastre, C.M.; Andersen, L.L. Submaximal Elastic Resistance Band Tests to Estimate Upper and Lower Extremity Maximal Muscle Strength. Int. J. Environ. Res. Public Health 2021, 18, 2749. [Google Scholar] [CrossRef]
- Lanza, M.B.; Rock, K.; Marchese, V.; Addison, O.; Gray, V.L. Hip Abductor and Adductor Rate of Torque Development and Muscle Activation, but Not Muscle Size, Are Associated With Functional Performance. Front. Physiol. 2021, 12, 744153. [Google Scholar] [CrossRef]
- Kadlec, D.; Jordan, M.J.; Snyder, L.; Alderson, J.; Nimphius, S. Test Re-test Reliability of Single and Multijoint Strength Properties in Female Australian Footballers. Sports Med. Open. 2021, 7, 5. [Google Scholar] [CrossRef]
- Merino-Muñoz, P.; Hermosilla-Palma, F.; Gómez-Álvarez, N.; Pérez-Contreras, J.; Miarka, B.; de Oliveira, C.G.; Brito, C.J.; Menegaldo, L.L.; Kipp, K.; Aedo-Muñoz, E. New Hip Adductor Isometric Strength Test on Force Platform Shows Good and Acceptable Intra-Test Reliability for Peak Force Measurement. Biomechanics 2025, 5, 23. [Google Scholar] [CrossRef]
- Skopec, M.; Issa, H.; Reed, J.; Harris, M. The role of geographic bias in knowledge diffusion: A systematic review and narrative synthesis. Res. Integr. Peer Rev. 2020, 5, 2. [Google Scholar] [CrossRef]
- Hess, D.R. Observational Studies. Respir. Care 2023, 68, 1585–1597. [Google Scholar] [CrossRef]
- Borg, D.N.; Bach, A.J.E.; O’Brien, J.L.; Sainani, K.L. Calculating sample size for reliability studies. PMR 2022, 14, 1018–1025. [Google Scholar] [CrossRef] [PubMed]
- Koo, T.K.; Li, M.Y. A Guideline of Selecting and Reporting Intraclass Correlation Coefficients for Reliability Research. J. Chiropr. Med. 2016, 15, 155–163. [Google Scholar] [CrossRef] [PubMed]
- Bonett, D.G. Sample size requirements for estimating intraclass correlations with desired precision. Stat. Med. 2002, 21, 1331–1335. [Google Scholar] [CrossRef] [PubMed]
- Juneau, C.M.; Oranchuk, D.J.; Cahill, M.; Forster, J.W.; Diewald, S.; Cronin, J.B.; Neville, J. Reliability and Utility of Load-Cell Derived Force–Time Variables Collected During a Constrained and Unconstrained Isometric Knee Extension Task on a Plinth. J. Sci. Sport Exerc. 2023, 6, 81–89. [Google Scholar] [CrossRef]
- Soriano, M.A.; García-Ramos, A.; Torres-González, A.; Castillo-Palencia, J.; Ayuso, V.; Marín, P.J.; Comfort, P. Validity and Reliability of a Standardized Protocol for Assessing the One Repetition Maximum Performance During Overhead Pressing Exercises. J. Strength Cond. Res. 2021, 35, 2988–2992. [Google Scholar] [CrossRef]
- Serafim, T.T.; Ramos, A.P.; Prudêncio, D.A.; Migliorini, F.; Maffulli, N.; Okubo, R. Reliability, minimal detectable change, and standard error of measurement of functional tests for athletes: A systematic review. J. Orthop. 2025, 70, 283–291. [Google Scholar] [CrossRef]
- Lotz, A.; Behrens, T.; Jöckel, K.H.; Taeger, D. Bland-Altman Plot for Censored Variables. Stat. Med. 2025, 44, e70147. [Google Scholar] [CrossRef]
- Comfort, P.; McMahon, J.J.; Lake, J.P.; Ripley, N.J.; Triplett, N.T.; Haff, G.G. Relative strength explains the differences in multi-joint rapid force production between sexes. PLoS ONE 2024, 19, e0296877. [Google Scholar] [CrossRef]
- Courel-Ibáñez, J.; Hernández-Belmonte, A.; Cava-Martínez, A.; Pallarés, J.G. Familiarization and Reliability of the Isometric Knee Extension Test for Rapid Force Production Assessment. Appl. Sci. 2020, 10, 4499. [Google Scholar] [CrossRef]
- Secomb, J.L. A practitioner’s guide to isometric hip adduction and abduction test selection: Maximal force, asymmetry, and muscle activity comparisons between assessment positions. J. Sports Sci. 2024, 42, 2368–2375. [Google Scholar] [CrossRef] [PubMed]
- Ribič, A.; Hadzic, V.; Spudić, D. Hip adduction and abduction strength in different test positions and their relationship to previous groin injuries in women footballers. Res. Sports Med. 2024, 32, 1055–1066. [Google Scholar] [CrossRef] [PubMed]
- O’Brien, J.; Huthöfer, M.; Santner, E.; Becker, T.; Stöggl, T. Comparing apples and pears? Evaluating the interchangeability of three different positions for hip abduction and adduction strength testing in academy footballers. J. Athl. Train. 2025, 60, 492–501. [Google Scholar] [CrossRef] [PubMed]
- Welsh, P.; Howitt, S.; Howarth, S.J. The influence of hip joint angle on the ratio between adduction and abduction torque in experienced, recreational male ice hockey players. Int. J. Sports Phys. Ther. 2020, 15, 22–33. [Google Scholar] [CrossRef]
- Hernandez, W. Improving the Response of a Load Cell by Using Optimal Filtering. Sensors 2006, 6, 697–711. [Google Scholar] [CrossRef]
- Maffiuletti, N.A.; Aagaard, P.; Blazevich, A.J.; Folland, J.; Tillin, N.; Duchateau, J. Rate of force development: Physiological and methodological considerations. Eur. J. Appl. Physiol. 2016, 116, 1091–1116. [Google Scholar] [CrossRef]
- Rodríguez-Rosell, D.; Pareja-Blanco, F.; Aagaard, P.; González-Badillo, J.J. Physiological and methodological aspects of rate of force development assessment in human skeletal muscle. Clin. Physiol. Funct. Imaging 2018, 38, 743–762. [Google Scholar] [CrossRef]
- Badby, A.J.; Ripley, N.J.; McMahon, J.J.; Mundy, P.D.; Comfort, P. Scoping review of methods of monitoring acute changes in lower body neuromuscular function via force plates. PLoS ONE 2025, 20, e0322820. [Google Scholar] [CrossRef]
- Pratt, S.; Seto, J.; Scott, A.; Merry, K.; Mitchell, C.J.; Waugh, C.M. Validation of a bluetooth-enabled load cell for objective and accessible assessment of lower extremity strength. J. Sports Sci. 2023, 41, 1263–1270. [Google Scholar] [CrossRef]
- Rezigalla, A.A. Observational Study Designs: Synopsis for Selecting an Appropriate Study Design. Cureus 2020, 12, e6692. [Google Scholar] [CrossRef]
- Currier, B.S.; Mcleod, J.C.; Banfield, L.; Beyene, J.; Welton, N.J.; D’Souza, A.C.; Keogh, J.A.J.; Lin, L.; Coletta, G.; Yang, A.; et al. Resistance training prescription for muscle strength and hypertrophy in healthy adults: A systematic review and Bayesian network meta-analysis. Br. J. Sports Med. 2023, 57, 1211–1220. [Google Scholar] [CrossRef]
- Roman-Liu, D. The influence of confounding factors on the relationship between muscle contraction level and MF and MPF values of EMG signal: A review. Int. J. Occup. Saf. Ergon. 2016, 22, 77–91. [Google Scholar] [CrossRef]
- Kudzia, P.; Wakeling, J.M.; Robinovitch, S.N.; Donelan, J.M. Neuromuscular fatigue reduces force responsiveness when controlling leg external forces. Physiol. Rep. 2025, 13, e70498. [Google Scholar] [CrossRef]
- Savitz, D.A.; Wellenius, G.A. Can Cross-Sectional Studies Contribute to Causal Inference? It Depends. Am. J. Epidemiol. 2023, 192, 514–516. [Google Scholar] [CrossRef]


Disclaimer/Publisher’s Note: The statements, opinions and data contained in all publications are solely those of the individual author(s) and contributor(s) and not of MDPI and/or the editor(s). MDPI and/or the editor(s) disclaim responsibility for any injury to people or property resulting from any ideas, methods, instructions or products referred to in the content. |
© 2025 by the authors. Licensee MDPI, Basel, Switzerland. This article is an open access article distributed under the terms and conditions of the Creative Commons Attribution (CC BY) license (https://creativecommons.org/licenses/by/4.0/).