Abstract
Stabilized soils are used as structural components in pavement construction and highway engineering. Due to their broad application, practical methods for predicting their strength are essential. The unconfined compressive strength (UCS) test is a fundamental technique for assessing mechanical properties. This study focuses on the development of a new method for predicting the strength of cement-stabilized soils. The analysis was based on three series of tests. The first series examined the effect of variable initial moisture content, ranging from 6% to 13%. The second series focused on the impact of cement content, ranging from 1% to 9%. The third series examined the effect of cement content on strength increase over a period of 1 to 56 days of curing. Based on the collected data, an empirical relationship was developed to predict strength using three key parameters: porosity (n), cement index (Ci), and curing time (TC). Nomograms were created using this relationship, allowing strength to be easily predicted. Additionally, the study presents correlations between the proposed model and deformation parameters, as determined by both destructive testing (DT) and non-destructive testing (NDT), including the E50 modulus, EUPV, and GUPV. The statistical validation of the determined empirical relationship showed a MAPE value of 15.928% and an RMSE value of 0.318 MPa. The results confirm the accuracy of the developed model and the derived correlations.
1. Introduction
Soil stabilization is a method aimed at enhancing the mechanical and physical properties of soil, achieved by blending and mixing it with other materials to achieve the required engineering properties [1]. This technique has been known to humanity for thousands of years, with the first historical records of stabilized soil dating back over 5000 years [2]. Nowadays, various stabilizers can be added to the soil to enhance its properties. They can be divided into three main groups: traditional stabilizers such as hydrated lime, Portland cement, and fly ash; stabilizers that are by-products, for example, cement kiln dust, lime kiln dust; non-traditional stabilizers, including sulfonated oils, potassium compounds, ammonium chloride, enzymes, or polymers [3]. Of all the stabilizing agents mentioned, cement is the most widely used to improve the mechanical properties of the soil [4,5,6]. The mechanical properties of the soil are improved by mixing the soil with cement, which leads to the formation of a new material. The process is based on hydraulic reactions, which only require the presence of water to initiate chemical reactions. As a result, the cement effectively glues the soil particles together, creating a material with increased strength [7,8]. As a result, the cement stabilization technique is commonly used in geotechnical projects, where it is applied in protecting the slopes of earth dams, as a bearing layer for shallow foundations, in preventing sand liquefaction [9], as well as in the construction of embankments, retaining walls, storage tanks, pavements, dams, and tunnels on soft soils [10,11,12,13,14,15]. This type of stabilization is considered one of the most economical and practical techniques used to improve the sub-base and base layers of roadways or airfield pavements [11,16]. The literature also indicates the effectiveness of stabilization methods using geosynthetics [17,18] and recycled concrete aggregates [19,20,21]. Therefore, soil stabilization has been widely used in constructing linear structures such as highways, as early as 1915, when cement stabilization was used to build a road in Saracosta, Florida [22]. The popularity of this method quickly began to rise, and by 1938, over 150 miles of roads made from cement-stabilized soil had been constructed in the United States of America alone [23]. Since then, the technique has been widely used and has become standard in geotechnical engineering.
To utilize cement-stabilized soil in engineering projects, it is essential to ensure it has adequate strength and stiffness. To determine these properties, destructive testing (DT) is performed, which involves altering the dimensions and structural integrity of the specimen. One of the basic DT tests used to evaluate the effect of strengthening is the unconfined compressive strength (UCS) test. It is a widely used and convenient parameter in engineering practice [24]. The second type of testing used to identify mechanical properties is non-destructive testing (NDT). This type of testing is increasingly used in research, as confirmed by the rapid increase in the number of scientific publications in this area [25]. Among the many measurement techniques available, the measurement of ultrasonic wave propagation velocity is most commonly used by researchers [26,27]. The Ultrasonic Pulse Velocity (UPV) test measures the time it takes an ultrasonic wave to pass through the material being tested. There are several basic types of ultrasound waves, the most important of which are the compression wave, also known as the longitudinal wave or P-wave. Another important type is shear waves, also known as transverse waves or S-waves. In addition, surface waves can be identified, including Rayleigh and Lamb waves [28,29]. The wave’s transition time depends on the material’s density and stiffness [30]. Also, the degree of water saturation of the test medium can affect the measured wave velocities [31,32]. Knowledge of wave velocity enables the determination of deformation parameters of the tested material and establishes correlations between measured wave velocities and the strength of the stabilized soil [33,34,35].
In spite of the numerous applications and testing techniques for cement-stabilized soils, there is still no developed methodology for selecting the amount of cement based on reasonable and precise criteria. Unlike concrete technology, where the water/cement ratio plays a key role in evaluating the target strength, the relevant criteria for stabilized soils are still insufficiently defined [9]. Therefore, in recent years, numerous studies have been conducted to better understand the behavior and mechanical properties of cement-stabilized soils. It has been found that the behavior of cement-stabilized soils largely depends on the interaction between various factors, including soil properties, amount of binder [34,36,37,38,39,40], porosity [9,14,36,38,41,42,43,44], and curing time [36,45,46,47,48]. Studies have shown that cement content has a significant effect on the strength development of stabilized soils. Even a small increase in cement content can significantly improve the strength of such mixtures. In addition, the change in the number of contact points between soil grains after the addition of cement leads to a significant increase in both cohesion and the internal friction angle. Consequently, the strength of cement-stabilized soils increases linearly with increasing cement content [49]. Another important factor affecting UCS is the water content of the mixture. Studies have shown that an increase in the moisture content of the mixture leads to a decrease in the strength of the cement-stabilized soil [9,50,51,52]. It is important to note that the increased moisture content of the mixture during compaction leads to an increase in the porosity of the cement-stabilized soil, which can also result in a decrease in strength. In this regard, it is essential to understand the effect of porosity on the mechanical properties of stabilized soils. The next important factor is the curing time because, as the curing time passes, there is an increase in stiffness, peak strength, Young’s modulus, and shear modulus [48]. However, the rate of change depends not only on the type and amount of cement but also on the water content in the mixture and its porosity.
In pursuit of an effective methodology for assessing the mechanical properties of cement-stabilized soils, Consoli et al. [9] conducted a study based on which they proposed a method for predicting the strength of cement-stabilized soil based on the relationship between porosity (n) and the index of cement (Ci). Where Ci was defined as the ratio of the volume of cement and the volume of the stabilized soil sample, which is a key parameter in this methodology [53]. The presented method proves the existence of a relationship in the form of a power function between UCS and the n/Ci ratio. The presented method makes it possible to determine UCS more accurately than the traditional method based on the water/cement ratio. A key advantage of this approach is its greater versatility. While the method based on the water/cement ratio has high accuracy only in conditions of optimal moisture content of the mixture, the method taking into account the porosity/cement index provides a better match regardless of the initial moisture content of the cement-stabilized soil [54]. Consequently, the n/Ci parameter approach shows broader applicability and reliability under variable moisture content. This relationship was then adapted by numerous researchers to different types of soils, binders and curing times, allowing new relationships to be developed [36,38,41,42,43,44,55].
To take the presented methodology further, this study conducted an analysis to determine a new empirical relationship between UCS and a parameter that takes into account porosity, cement index and curing time. To achieve the research objectives, a three-stage experimental study was conducted. In the first stage, the influence of initial moisture content on the mechanical parameters of the tested material was analyzed. In the second stage, the impact of varying cement content was verified. The third stage focused on assessing changes in the strength of stabilized soil as a function of curing time.
Within the framework of the study, destructive tests were conducted to determine the unconfined compressive strength and the secant modulus determined at half the unconfined compressive strength (E50). At the same time, non-destructive tests were carried out to determine the propagation velocity of ultrasonic waves, followed by the determination of the elastic modulus (EUPV) and shear modulus (GUPV).
An innovative aspect of the work is the proposal of a methodology that considers the impact of curing time on the empirical relationship, allowing for the prediction of the strength of stabilized soil. Based on the results obtained, a nomogram was developed to facilitate the practical use of this relationship. In addition, the possibility of using the proposed relationship to predict deformation parameters was investigated. Furthermore, an analysis was conducted to assess the impact of porosity, cement index, and curing time on the predicted strength and error.
2. Materials and Methods
The research was conducted on eight mixtures of stabilized soil. All mixtures were prepared based on soil classified as clSa, the detailed characteristics of which are presented in Section 2.1. CEM V multi-component cement (Górażdże Cement S.A., Chorula, Poland) was used as a binder, the fundamental properties of which are discussed in Section 2.2. The tests were carried out in three stages. In the first stage, the effect of the initial moisture content of the mixtures on the strength of stabilized soil was assessed. In the second stage, the impact of the binder content on the strength parameters of the mixtures compacted at the initial moisture content, which ensured the highest strength, was determined. In the third stage, the effect of the cement content on the increase in strength over time was examined. A detailed research methodology, including the procedure for preparing mixtures and samples as well as their curing, is presented in Section 2.3. Non-destructive and destructive tests were conducted to determine the mechanical properties of the tested samples. A full description of the testing equipment used is provided in Section 2.4. Section 2.5 presents the methodology for determining the porosity of the samples and the cement index.
2.1. Soil
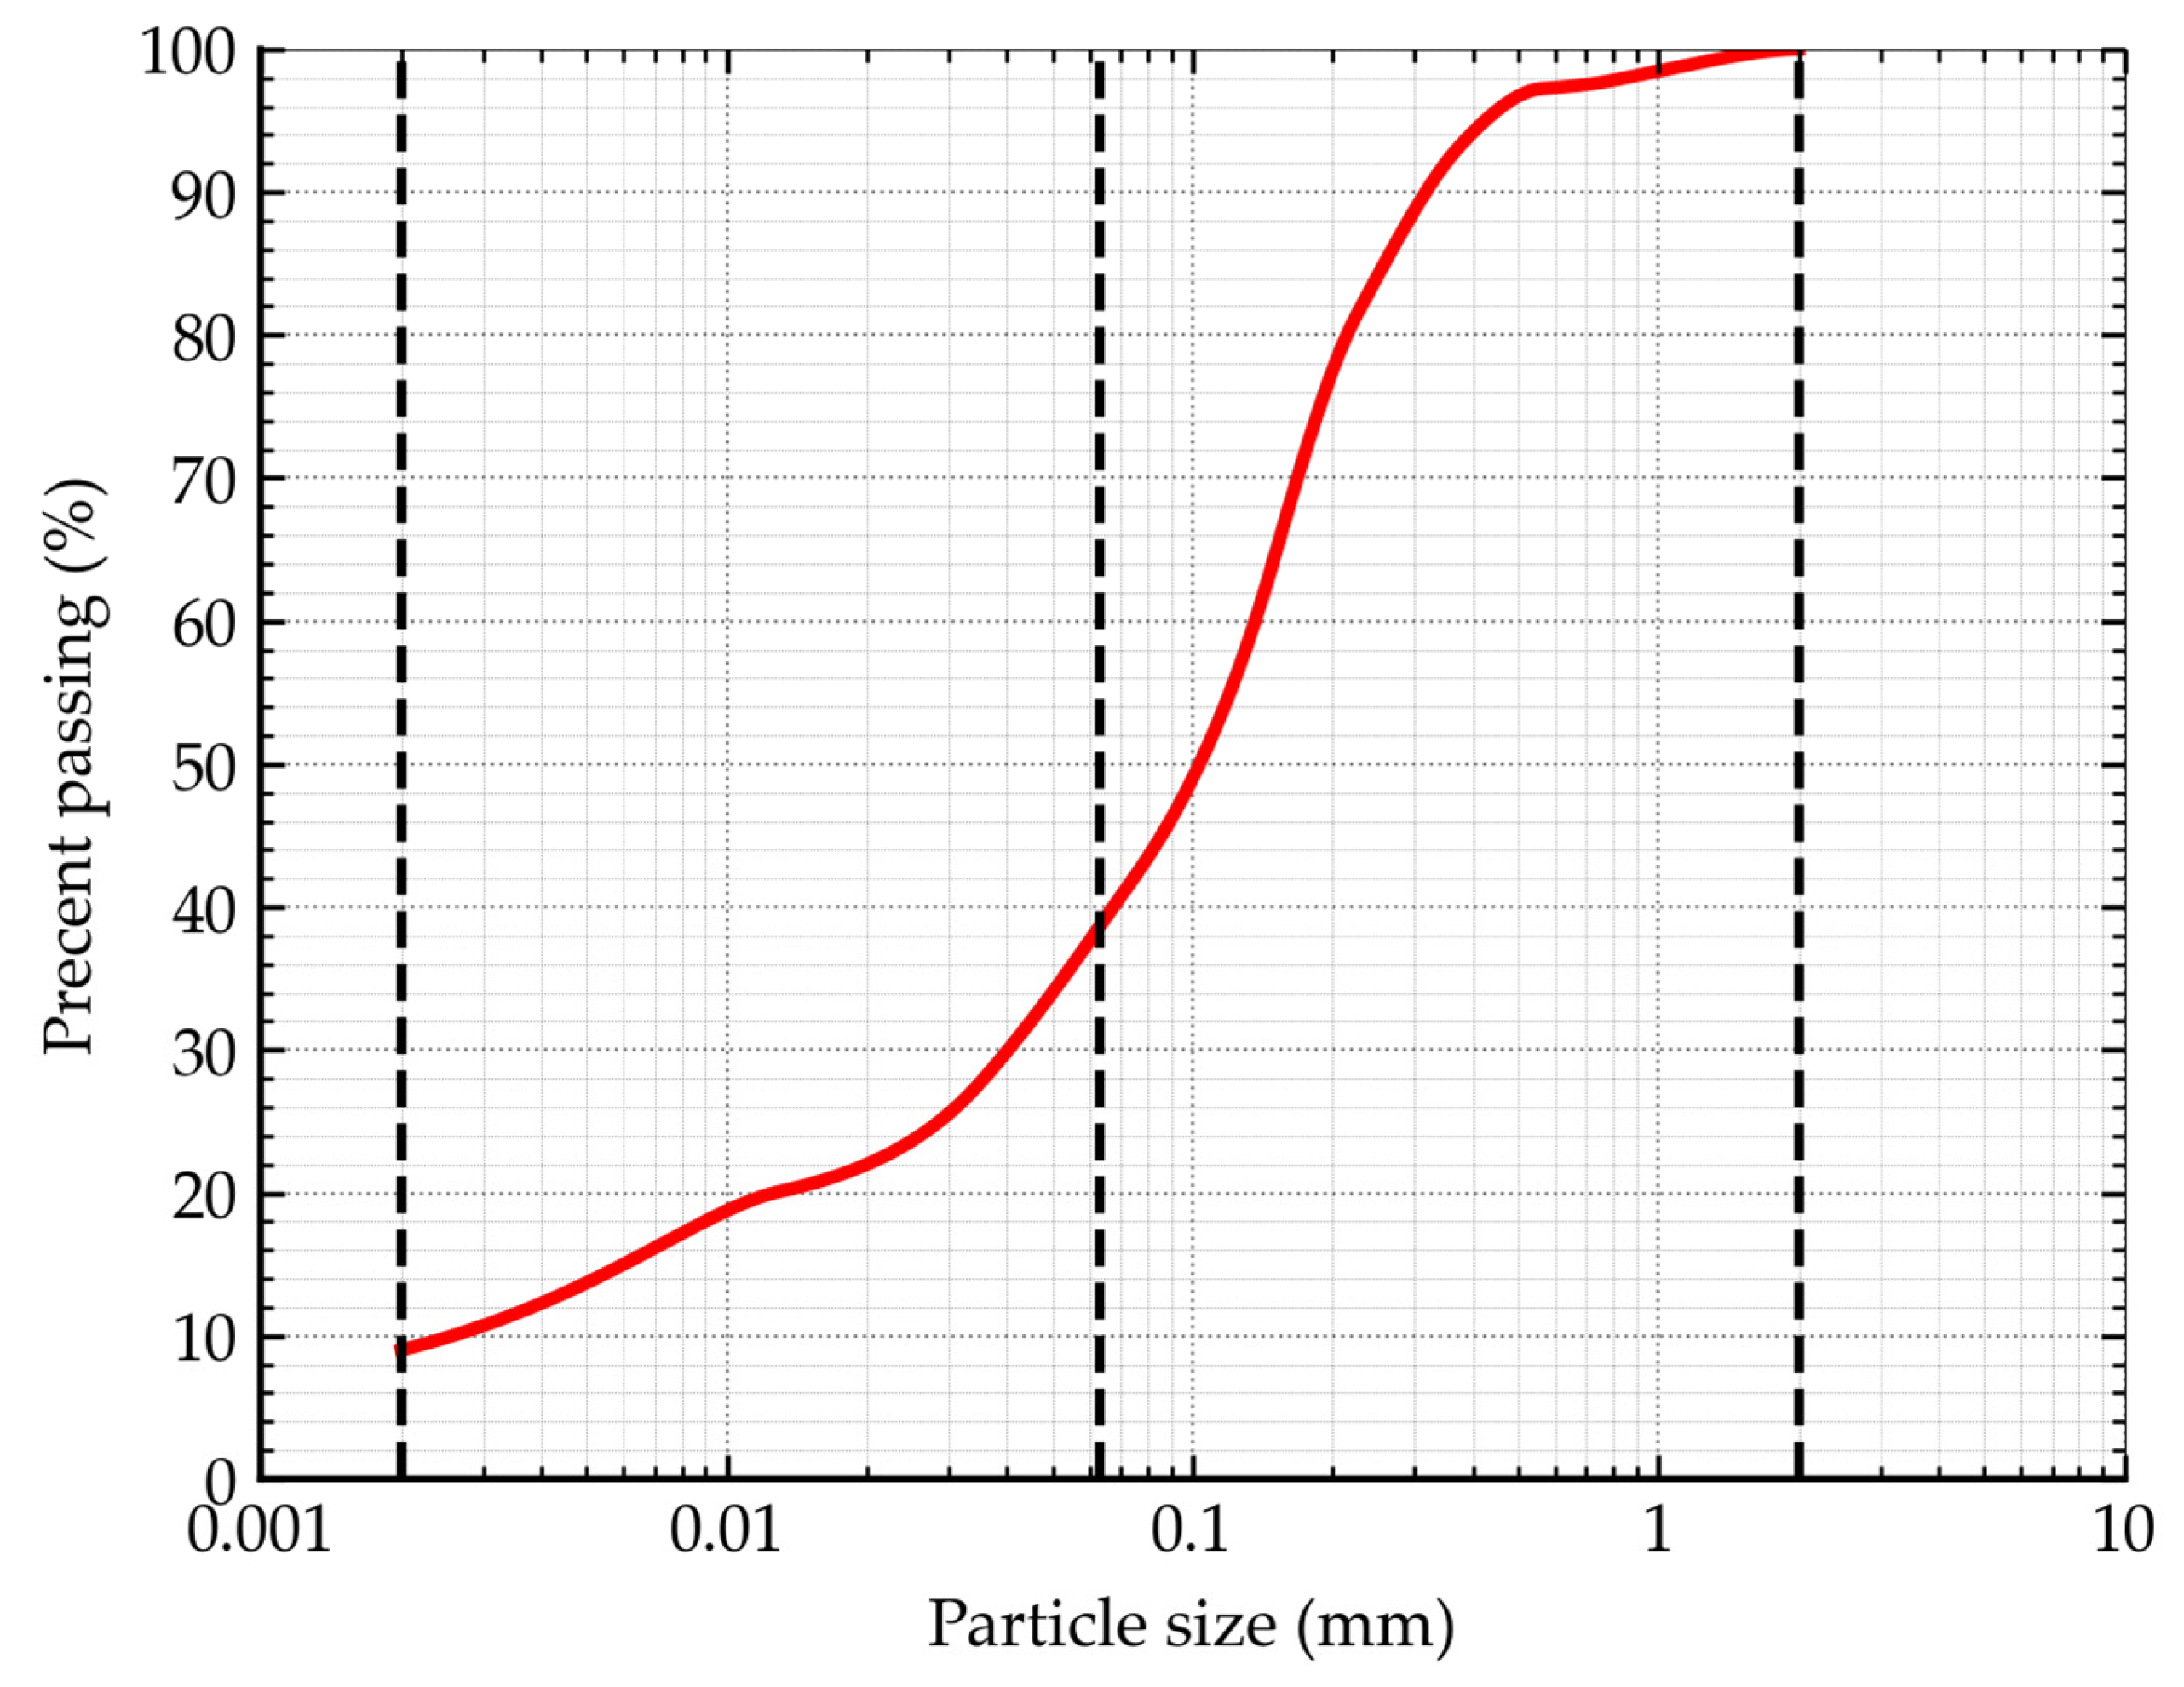
The soil intended for testing was analyzed to determine its basic physical properties. The tests included an areometric analysis and a sieve analysis using a complete set of sieves. The plasticity index (PI) was also determined based on the liquid limit (WL) and plastic limit (WP) that were previously defined. The liquid limit (WL) was determined using a Casagrande apparatus, while the plastic limit (WP) was determined using the rolling method. Based on the results obtained, the soil was classified as clayey sand (clSa). The specific density (GS) was determined using a Micromeritics gas pycnometer, model Accupyc II 1340. The device used is a fully automated material density and volume analyzer, compliant with ISO 12154:2014 [56]. The tests were performed in a chamber with a volume of 100 cm3. All determined properties are summarized in Table 1. The soil grain size distribution curve is shown in Figure 1.

Table 1.
Properties of the soil.
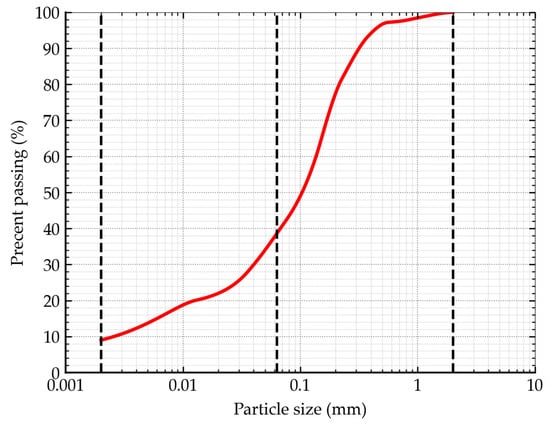
Figure 1.
Grain size distribution curve of soil.
2.2. Binder
The binder used in the tests was a multi-component cement produced at the Górażdżecement plant. A composite cement with a declared compressive strength of 10 MPa after 2 days and 32.5 MPa after 28 days was used. The cement consists of Portland clinker, granulated blast furnace slag, silica fly ash, and a setting time regulator. The cement was classified in accordance with PN-EN 197-1 [57] as CEM V/A (S-V) 32.5 R-LH. The binder used is characterized by low hydration heat and high resistance to chemical aggression. This cement is used for soil stabilization and sub-bases. In addition, its specific gravity (GC) was determined using a gas pycnometer; the value obtained was 2.97 g·cm−3.
2.3. Research Methodology
The research was conducted in three stages, during which stabilized soil mixtures were prepared, consisting of a combination of soil, binder, and water. The individual variants of the mixtures differed in the proportion of their individual components, which was determined in relation to the dry mass of the soil. In the first stage of the research, the amount of water varied, whereas in the subsequent stages, it was selected to achieve the maximum strength of the stabilized soil. The individual stages of the research were designed to complement each other, which made it possible to carry out an analysis aimed at developing an empirical relationship for predicting the strength of stabilized soil.
In the first stage, an analysis was conducted of the influence of the initial moisture content of the mixtures on the strength parameters of the stabilized soil. The initial moisture content ranged from 6% to 13%. Mixtures containing 3%, 5%, and 7% cement were prepared for testing, with strength tests performed after 28 days of curing. This stage aimed to determine the moisture content (wopt) at which the highest strength of the stabilized soil was achieved. The determined moisture content was then adopted as a reference parameter in subsequent stages of the tests. In addition, this stage, due to the variation in initial moisture content, allowed for the analysis of the effect of porosity on the stabilized soil over a broader range. A total of 27 samples were tested during the first stage of the tests. The second stage of the research aimed to determine the impact of varying binder content on the mechanical properties of stabilized soil in a broader range than in the other stages of the study. The tests were conducted on samples containing 1%, 3%, 5%, 7%, and 9% cement by weight. The tested cement content ranges within the active zone, i.e., where an increase in cement content increases the amount at grain contact points. After hardening, this ensures adequate bonding strength at these points [58]. For each of the adopted binder contents, a series of three samples was prepared, which were compacted at the density determined in the first stage of the research. In the second stage of testing, a total of 15 samples were examined following a 28-day curing period. In the third stage of the research, the change in the strength of stabilized soil as a function of time was examined. Soil samples with 2%, 4%, and 6% cement binder were used for the tests, which were cured for 1, 3, 7, 14, 28, and 56 days. Each series consisted of three samples, which were compacted to the density determined during the first stage of the study. During the third stage of the study, 54 samples were tested.
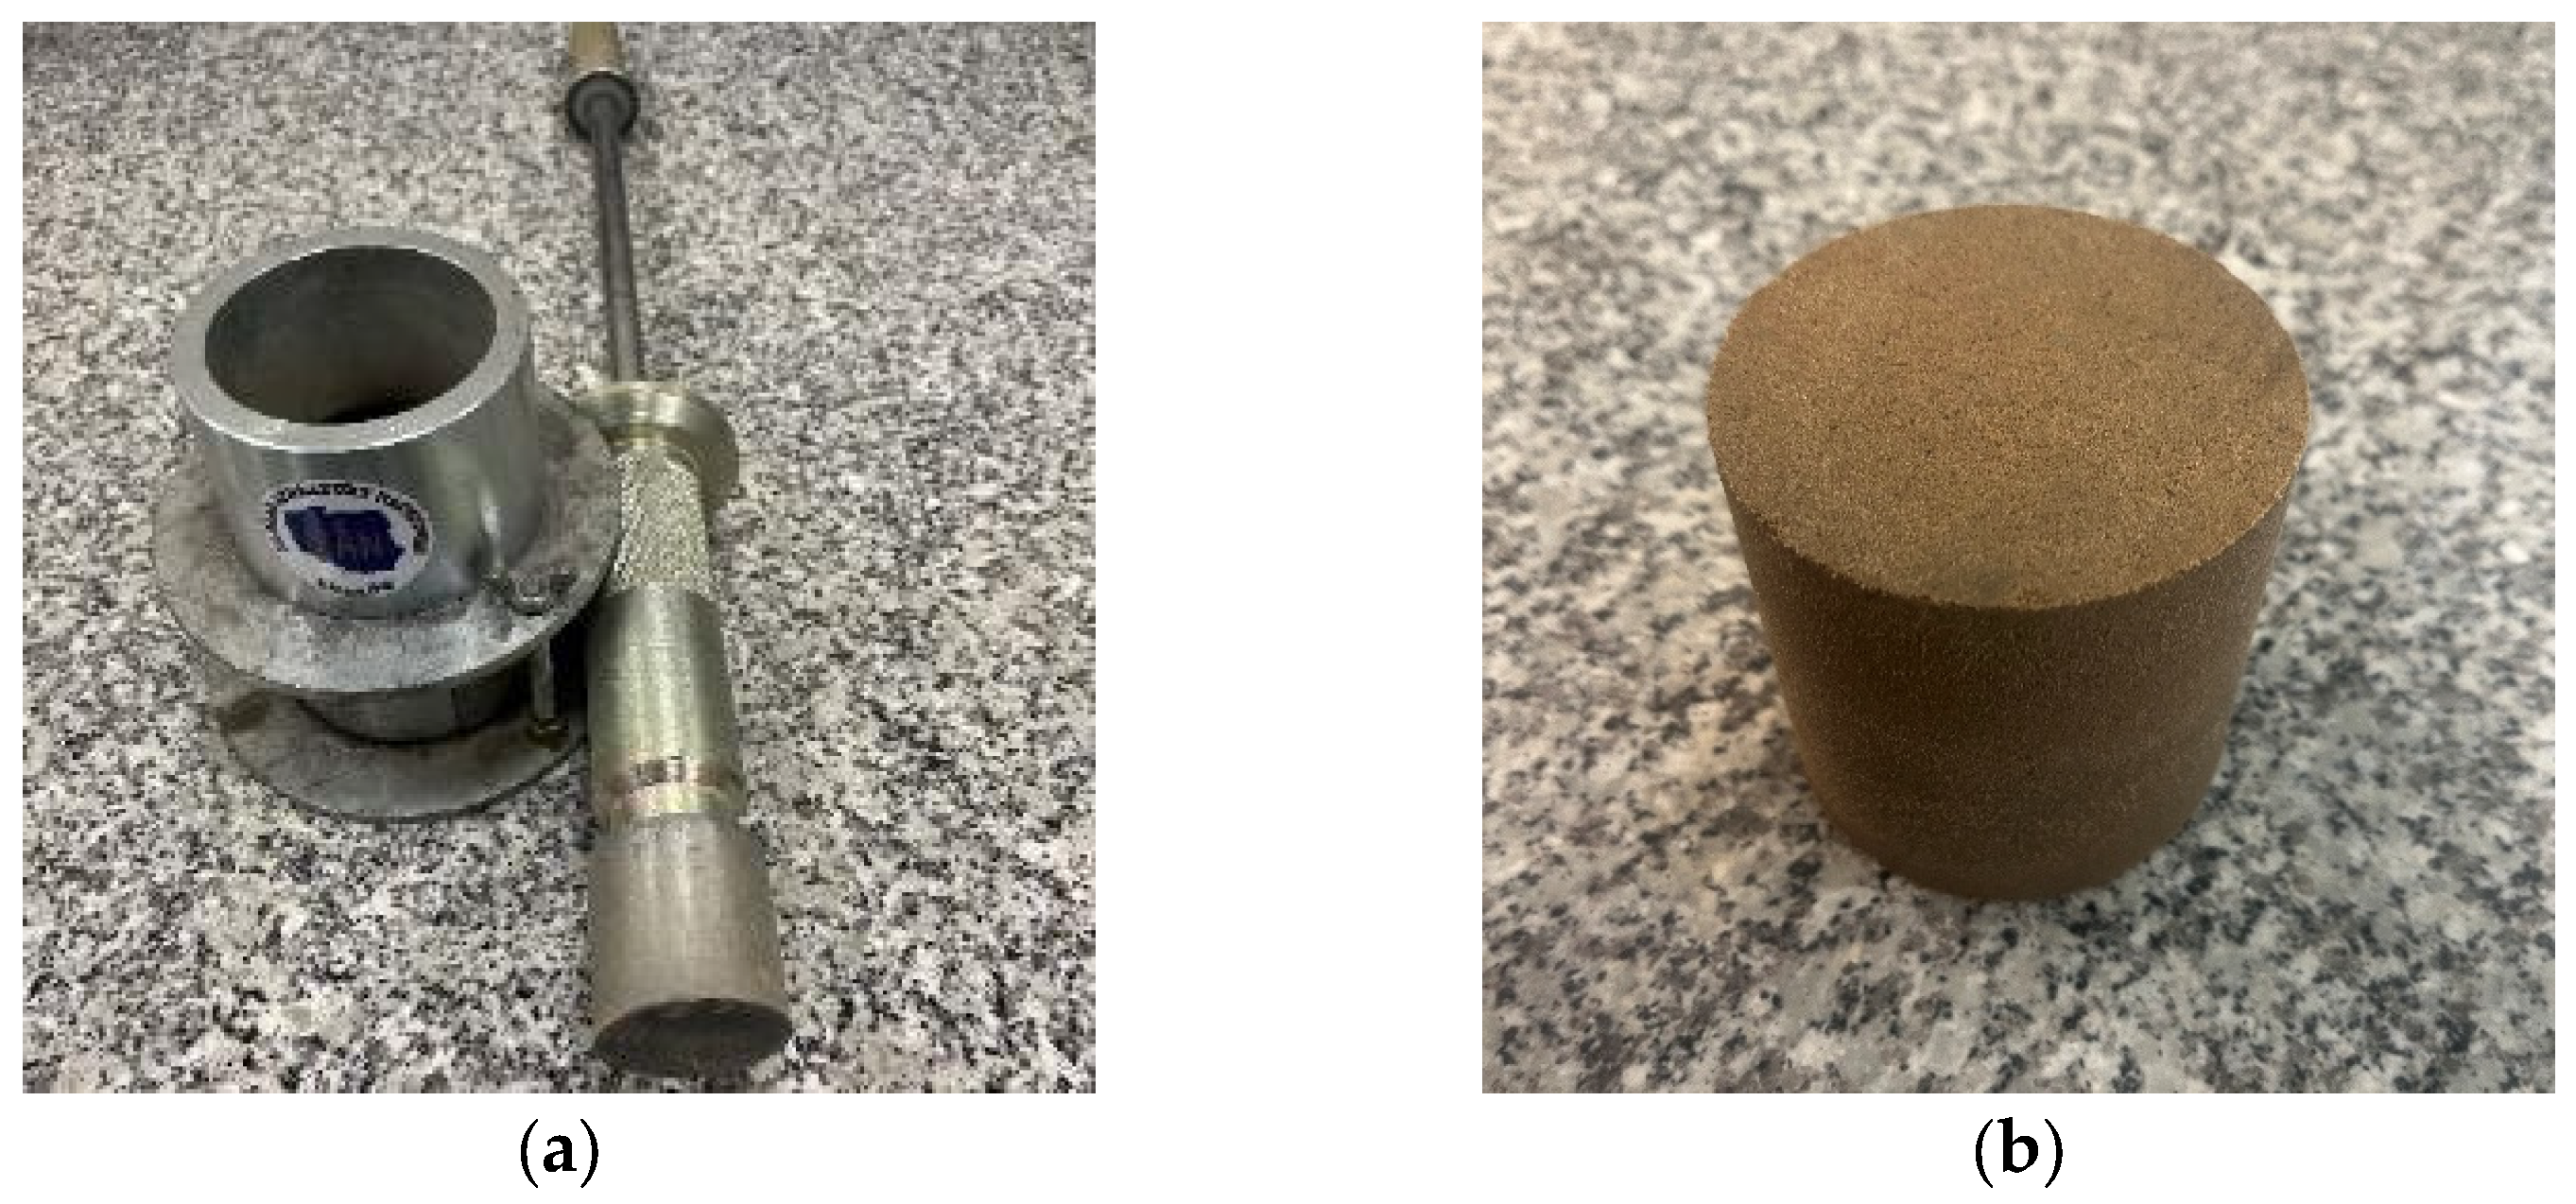
A total of 96 soil samples were tested in three stages. All samples were prepared according to a uniform procedure. First, the soil was crushed into fine fractions to reduce the clumping of larger particles, which could hinder the proper mixing of the soil with the binder. Next, the appropriate amount of binder was weighed in relation to the dry soil mass, after which mechanical mixing was carried out to obtain a homogeneous mixture. Next, water was added in an amount corresponding to the assumed initial moisture content, and then mechanical mixing was performed again to get a homogeneous structure. Samples were taken from the prepared mixtures to determine the real initial moisture content. Then, the samples were formed in cylindrical molds with a diameter of 8 cm and a height of 8 cm. Each mold was weighed before the compaction process. Each mold was then filled with the prepared mixture and compacted using a constant energy of 0.59 J/cm3. After compaction, the molds were weighed again to determine the initial mass of the samples. Immediately after molding, the sample curing process began, during which the samples were stored in a room with a constant humidity and temperature of 22 ± 2 °C. Figure 2 presents the mold, the Proctor rammer, and the compacted sample, while Table 2 summarizes the curing time, cement, and water contents for each test series.
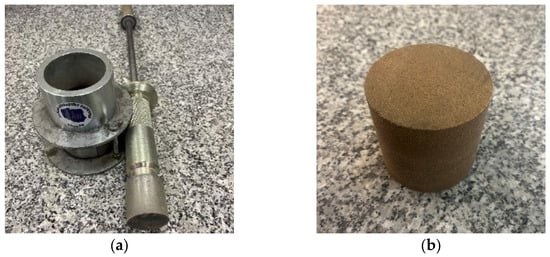
Figure 2.
(a) Two-part mold with Proctor rammer; (b) sample of stabilized soil.

Table 2.
Types of test series.
2.4. Measuring Device
After the treatment process was completed, each sample was subjected to both non-destructive testing and destructive testing. Non-destructive testing included measuring the propagation of UPV and shear waves in soil that had been stabilized. The measurements were performed using a Pundit Lab+ device (Proceq AG, Schwerzenbach, Switzerland) equipped with two types of transducers with different frequencies. The longitudinal wave velocities were determined using 54 kHz transducers. A layer of non-toxic gel was used to ensure proper adhesion to the sample surface and effective wave transmission between the transducer and the sample. The propagation of shear waves was measured using 40 kHz transducers, which, thanks to Dry Point Contact (DPC) technology, did not require the use of a gel layer. Based on the determined wave velocities and measured density (ρ), deformation parameters were calculated in the range of very small strain, including elastic modulus (EUPV) and shear modulus (GUPV). A detailed description and scheme of the measurement system used are provided in an earlier publication [52].
Destructive testing was conducted using a universal testing machine (Instron, Norwood, MA, USA). The load was applied continuously using steel pressure plates, which ensured uniform impact on the samples. The recorded stress–strain relationship was used to determine the ultimate compressive strength (RC) and the secant modulus of elasticity (E50), defined as the ratio of half the ultimate compressive stress to the corresponding strain. Basic information about measuring devices is presented in Table 3.

Table 3.
Basic measurement parameters of testing equipment.
2.5. Indicators Analyzed
In this study, indicators such as porosity (n) and cement index (), defined as the ratio of cement volume to total sample volume, were used in the analysis. Porosity was determined according to Equation (1), while the cement index was determined according to Equation (2). Both parameters refer to the initial state of the mixtures, in which the cement setting process has not yet been initiated. In addition, the curing time () of the samples and calibration parameters were included in the analysis.
3. Results
This chapter is divided into four subsections. Section 3.1 presents the results of non-destructive and destructive testing. The destructive tests considered only the unconfined compressive strength (RC), determined at individual stages of the tests. The non-destructive tests are presented collectively, illustrating the relationship between strength and the propagation velocities of particular waves. Section 3.2 discusses the analysis of the results obtained, based on which an empirical relationship was derived for predicting the strength of stabilized soil. In Section 3.3, an additional analysis was conducted to assess the possibility of predicting deformation parameters based on porosity, cement index, and curing time. The sensitivity analysis of the determined relationships was performed in Section 3.4.
3.1. Presentation of Results from Three Testing Stages
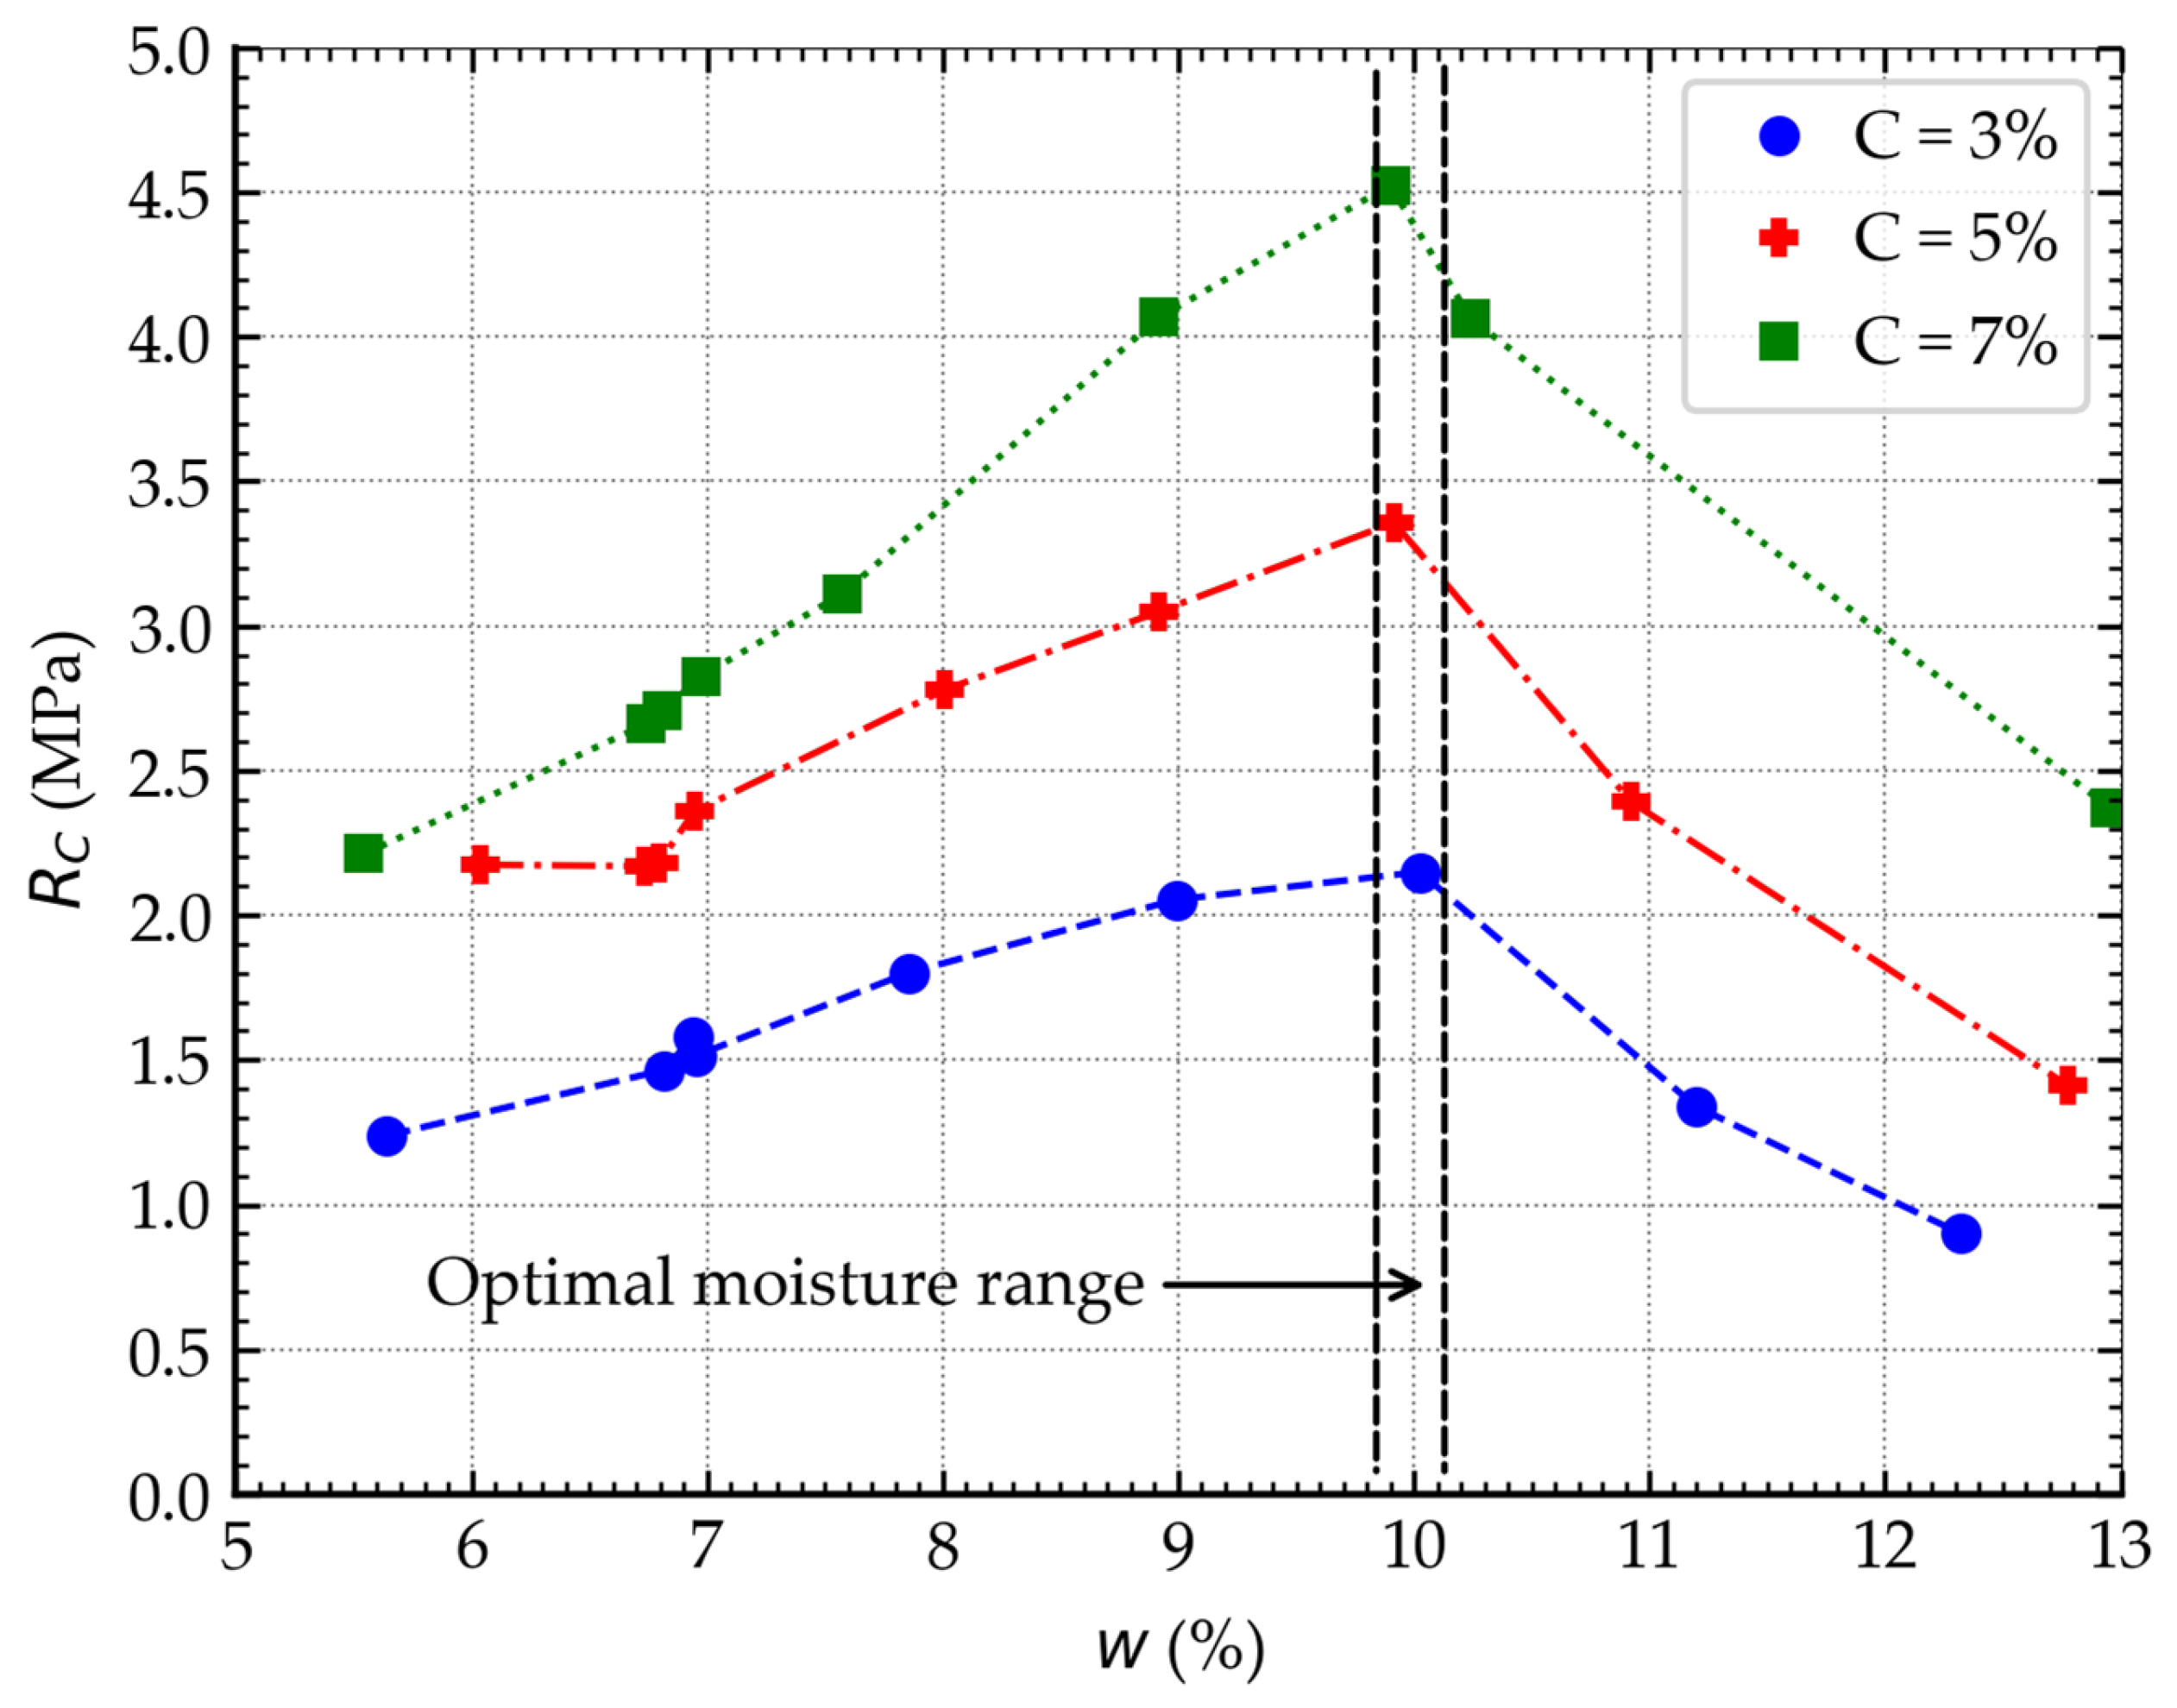
Based on the results of the first stage of research, it was found that the highest strength of the stabilized soil was achieved at a moisture content of approximately 10%, ranging from 9.89% to 10.03%. At the same time, a slight decrease in the moisture content at which the maximum strength of the cement-stabilized soil could be achieved was observed with an increase in the cement content, as illustrated in Figure 3. Any deviation from the optimum value resulted in a significant decrease in strength. In view of the results obtained, a moisture content of wopt = 10% was adopted for further stages of the research.
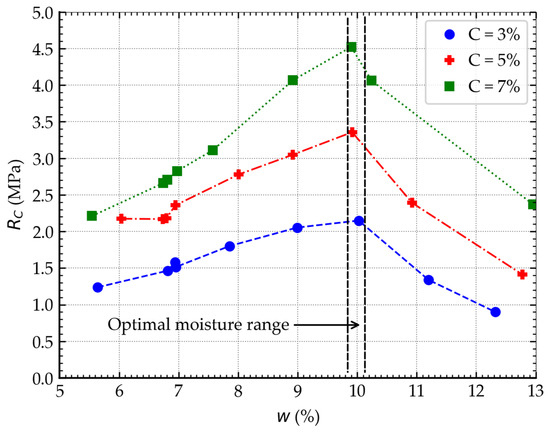
Figure 3.
The effect of moisture content on the strength of stabilized soil—stage 1.
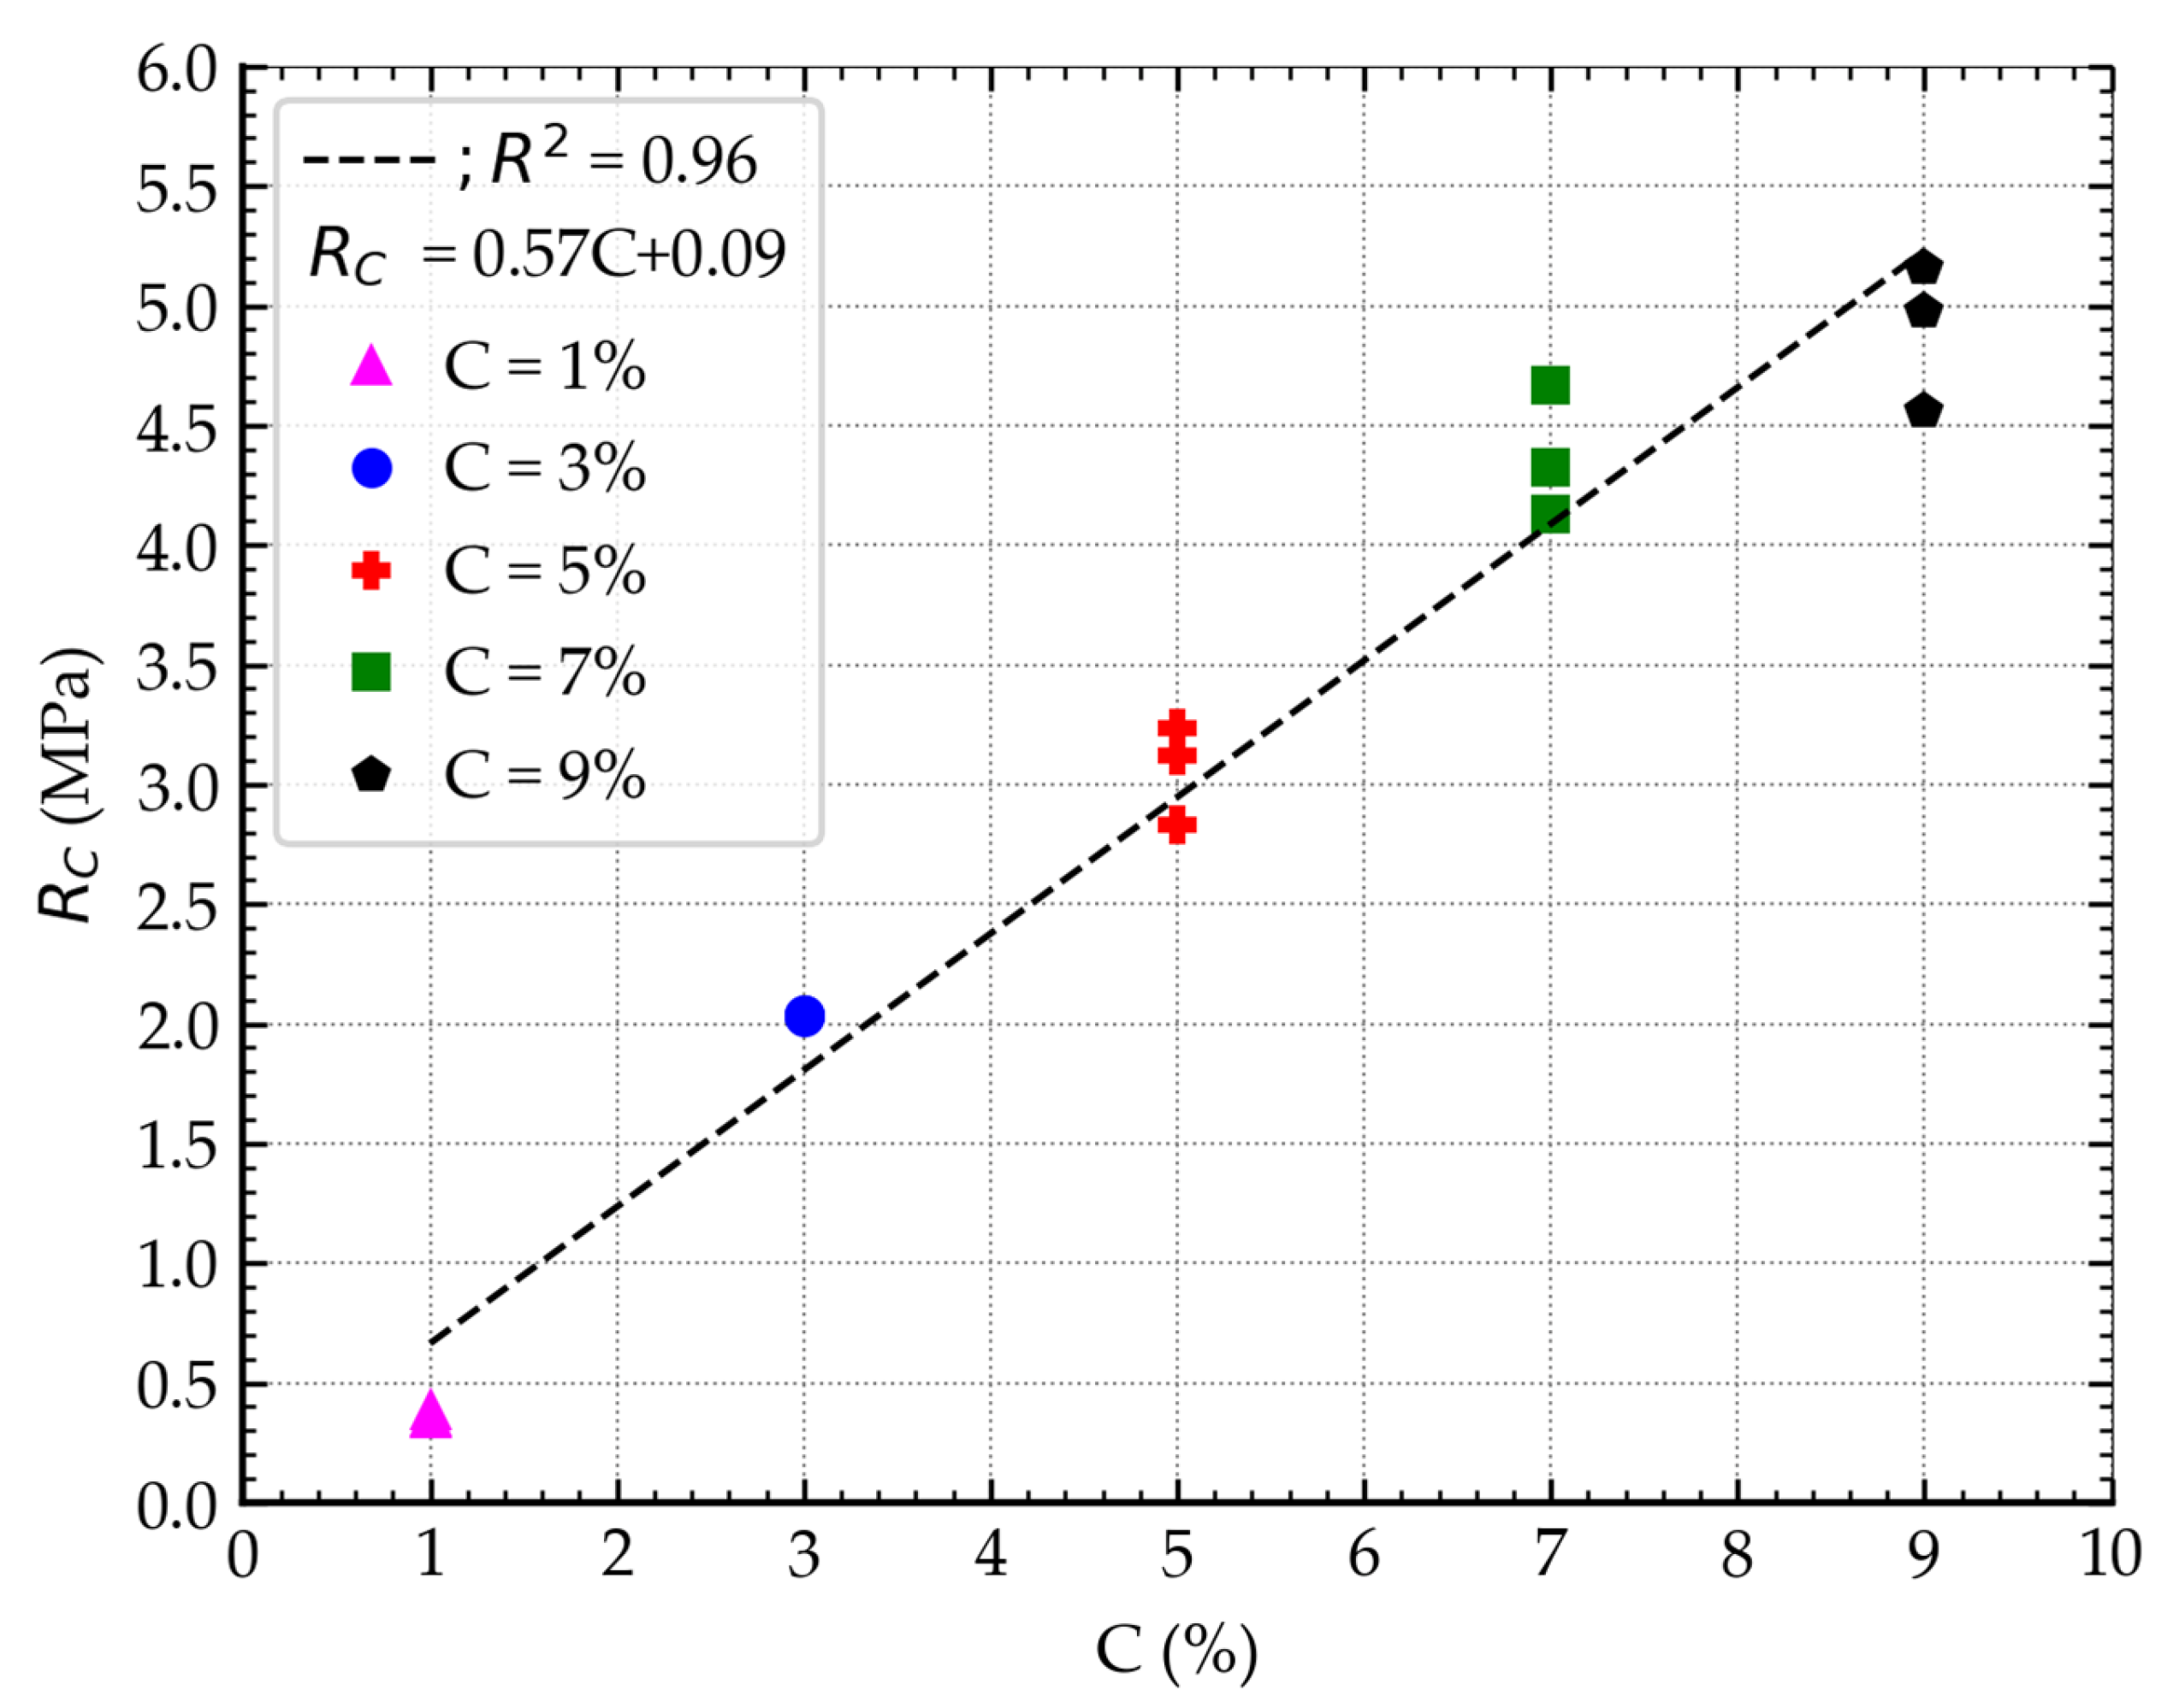
In the second stage of the research, the influence of binder content on mechanical parameters, including unconfined compressive strength (RC), was analyzed. The results obtained were consistent with expectations, indicating a linear increase in strength with increasing cement content in the mixtures, as can be seen in Figure 4. This relationship was achieved thanks to the use of homogeneous soil, constant moisture content, and uniform compaction and curing conditions, which, however, limits its universality from a practical point of view. It should also be emphasized that the use of a cement content of 1% is not an engineering practice due to the extremely low strength values; it was only used to extend the range of the cement index during the analysis stage.
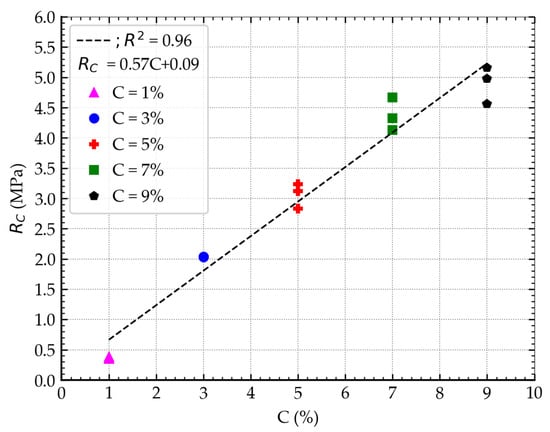
Figure 4.
The influence of cement content on the strength of stabilized soil—stage 2.
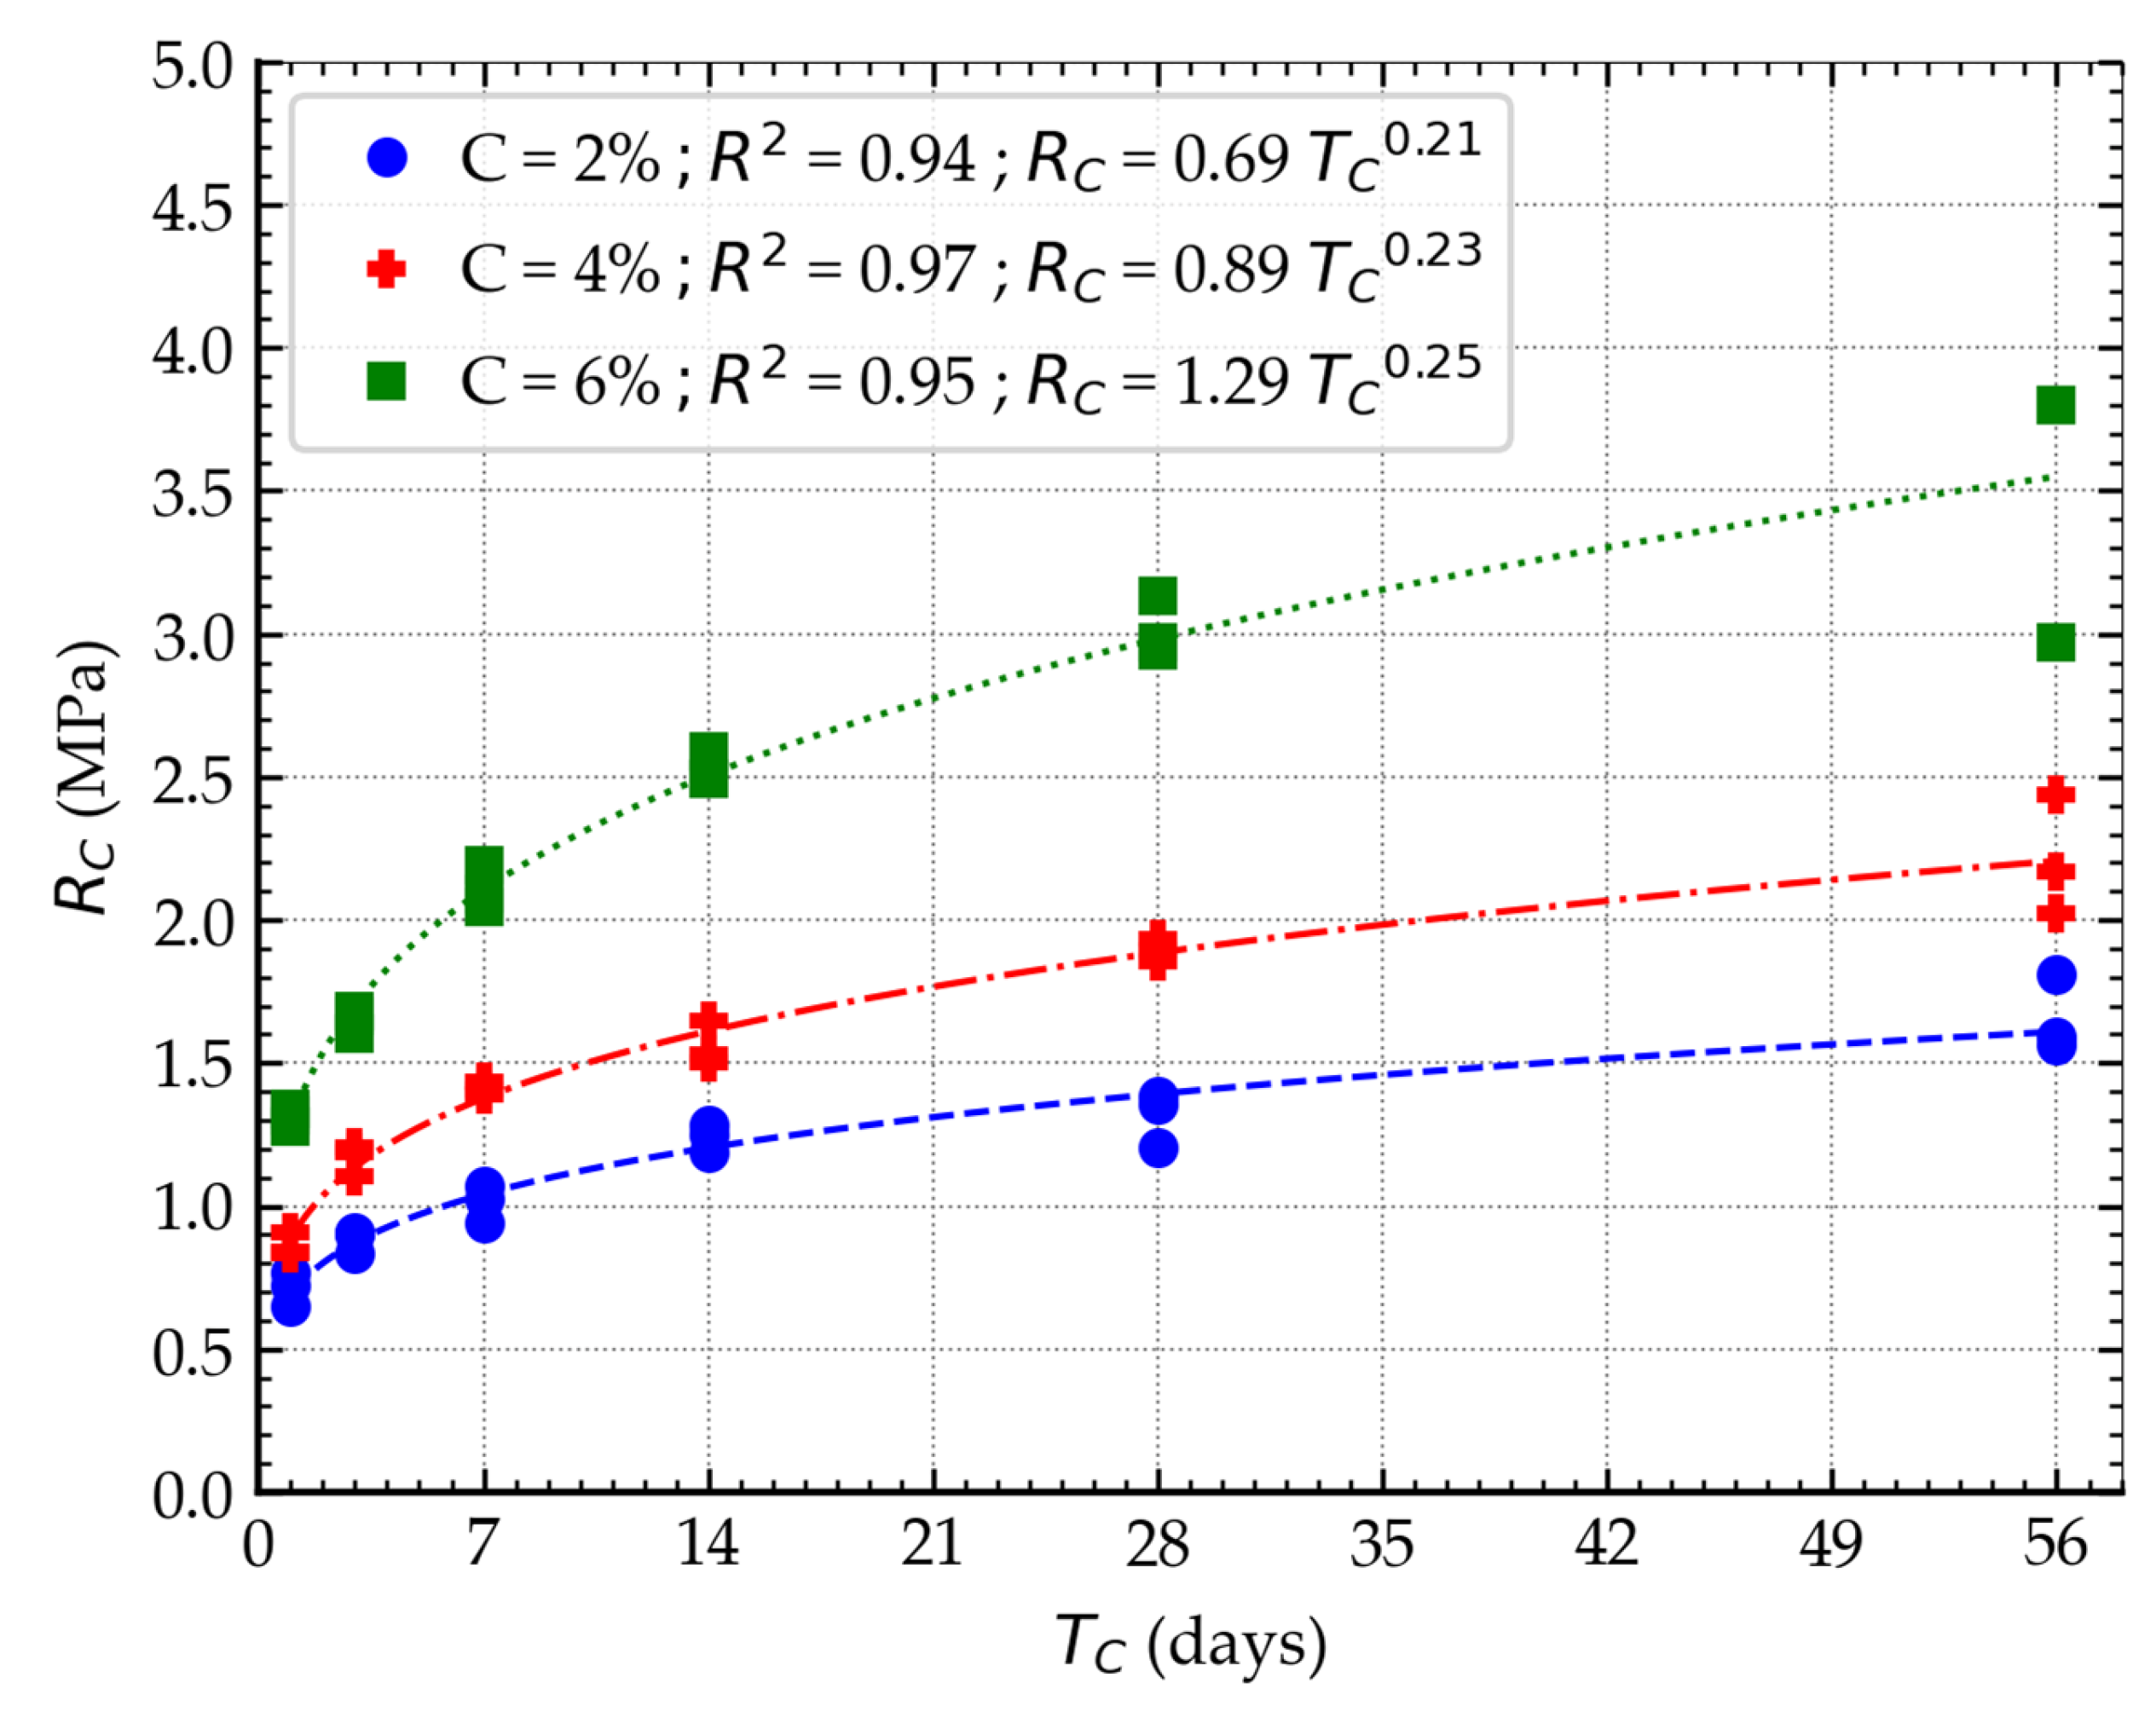
The third stage of the research focused on analyzing the impact of cement content on the increase in soil-stabilized strength over time. Based on the analysis presented in Figure 5, it was found that increasing the amount of binder in the mixture causes a change in the dynamics of strength increase, with higher cement content contributing to greater early strength. A power function can describe the empirical relationship between curing time and the strength of stabilized soil. However, it should be noted that the obtained relationships apply only to specific mixtures. Therefore, when using a different type of soil, varying mixture moisture content, or other binder content, it is necessary to determine new relationships specific to the mixture in question. The results highlight the need to develop a universal empirical relationship to predict the strength of stabilized soils regardless of composition.
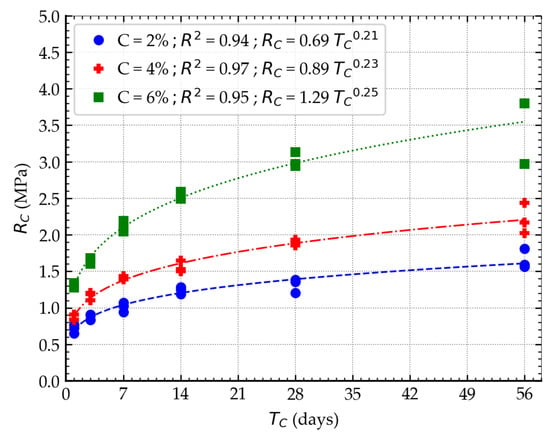
Figure 5.
The effect of curing time on the strength of stabilized soil—stage 3.
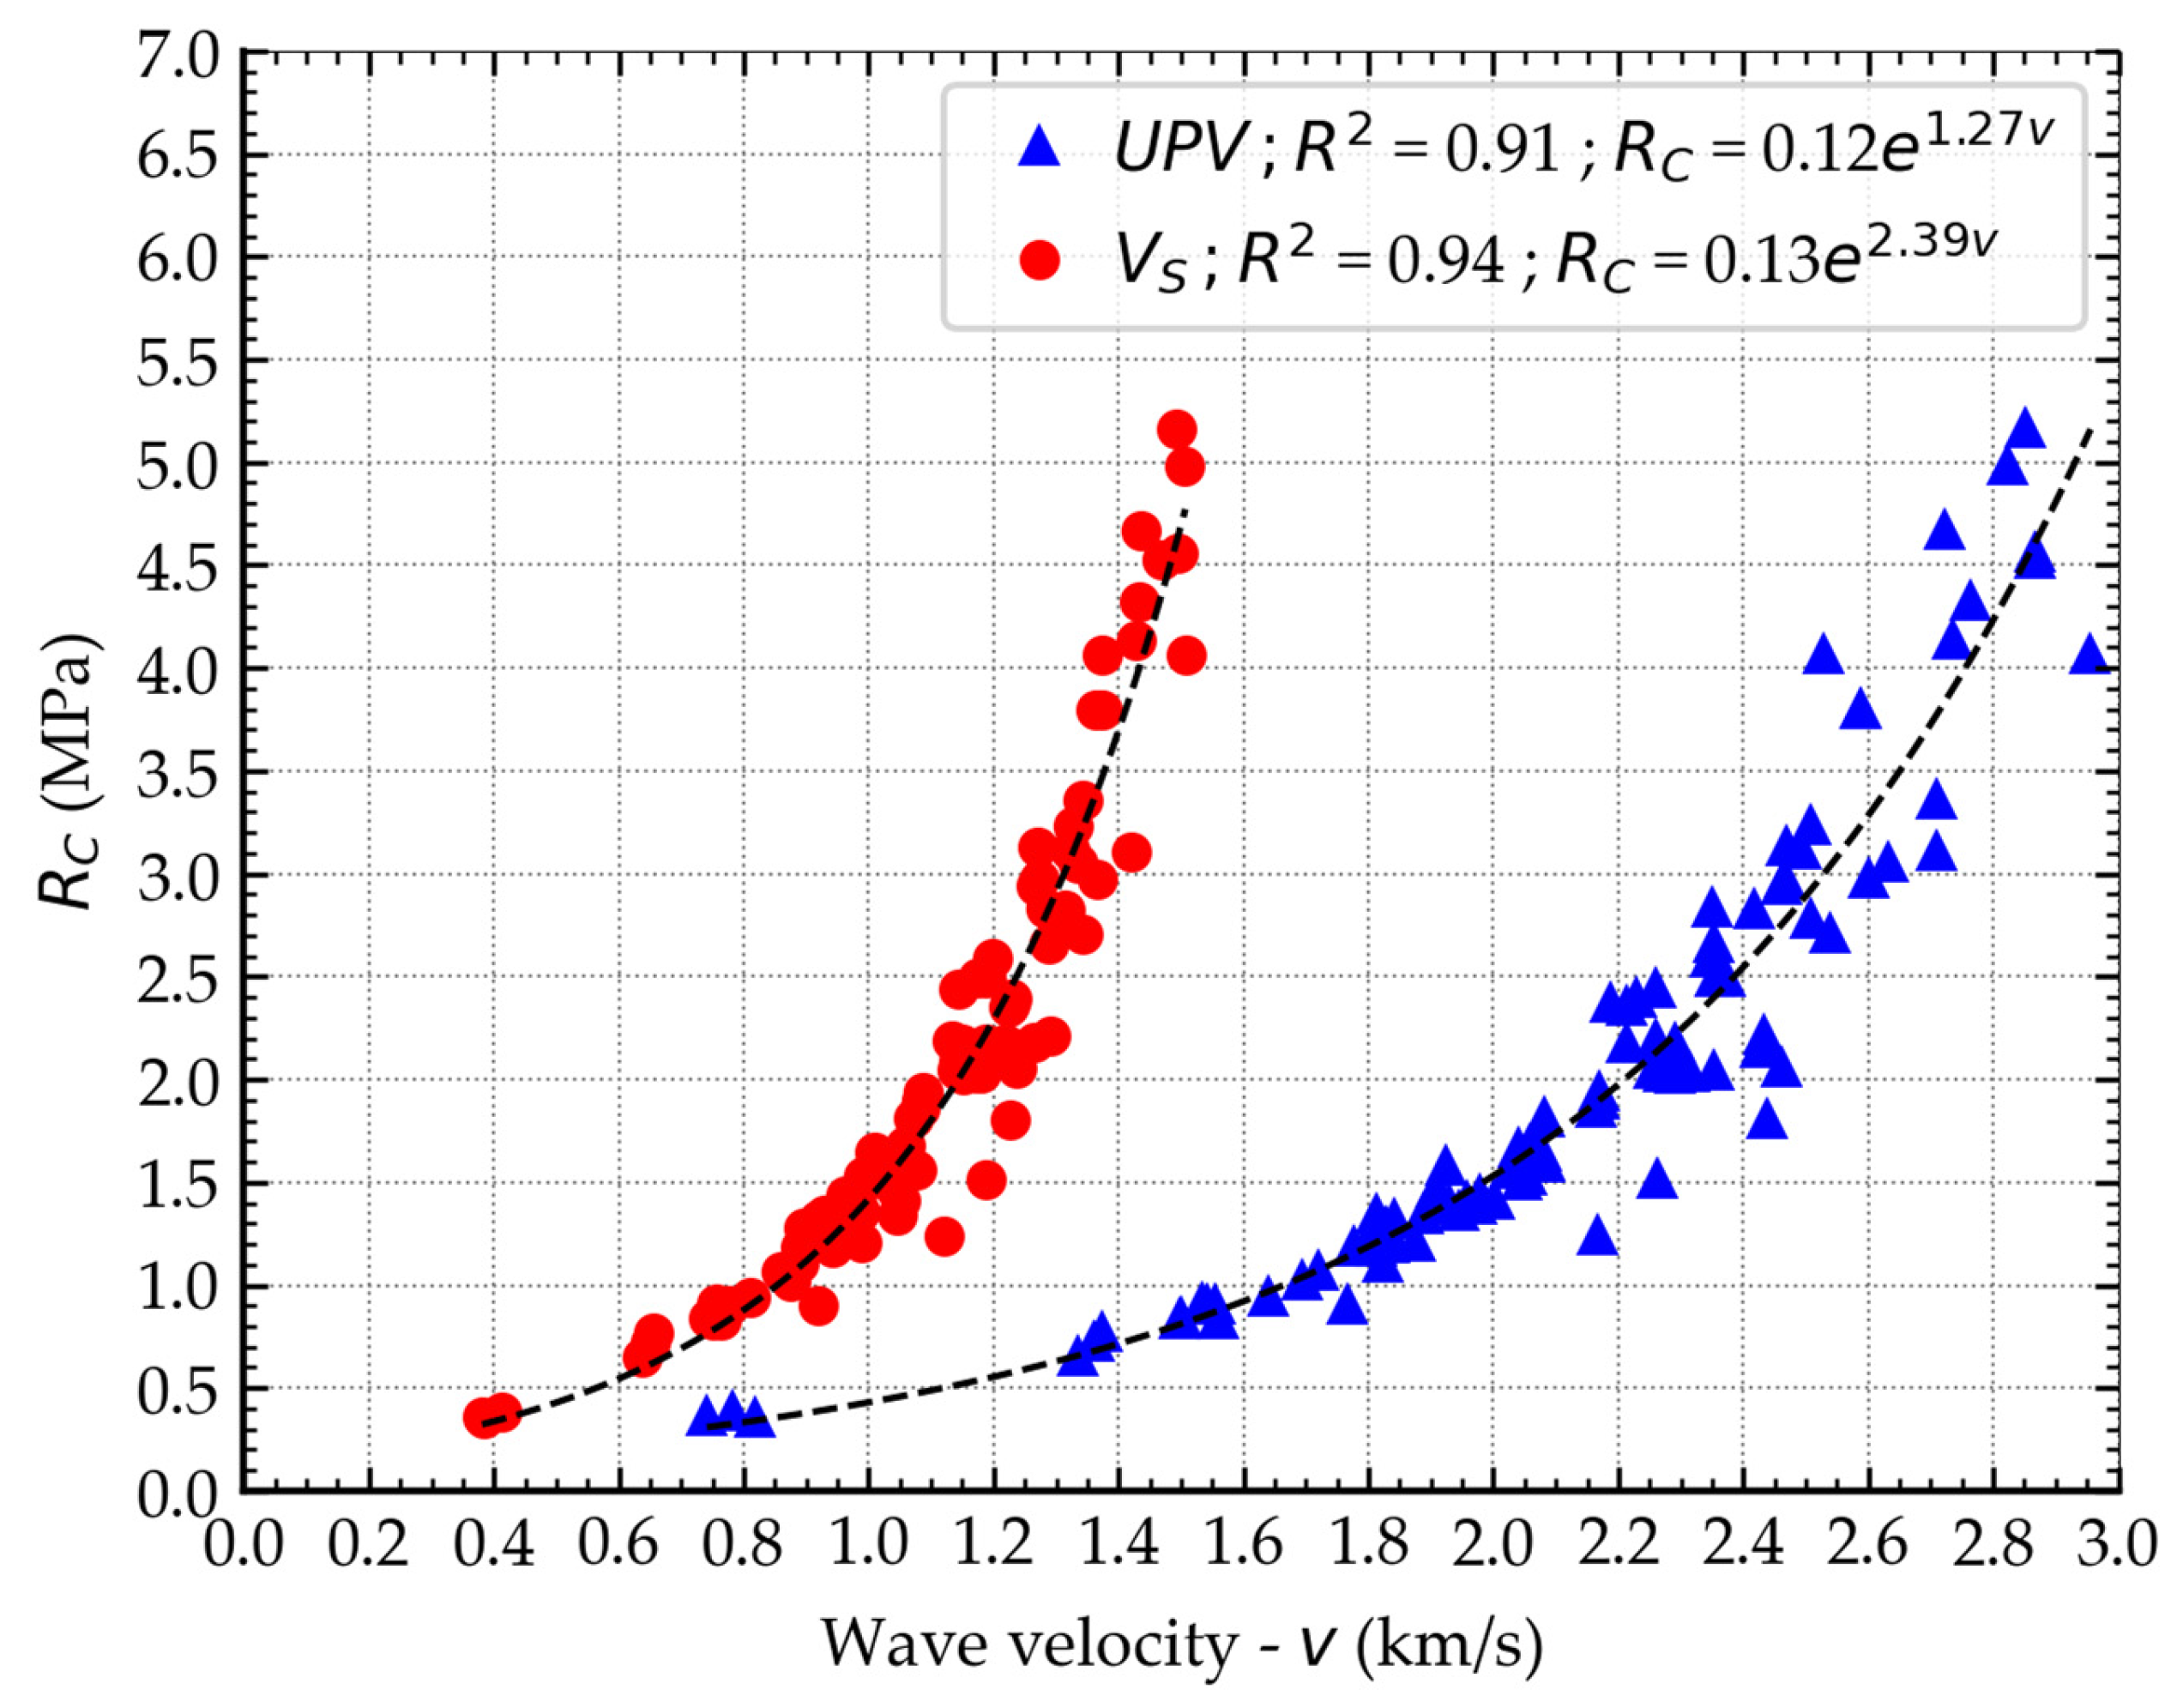
Measurements of ultrasonic pulse velocity and shear wave velocity showed a strong correlation between these values and the unconfined compressive strength of stabilized soil, as illustrated in Figure 6. Based on the results obtained, it was found that the empirical relationships described by the exponential function were more suitable for shear waves than for longitudinal waves. The results obtained can be successfully used to predict the strength of stabilized soil in both field and laboratory conditions, regardless of moisture content, curing time, or binder content. In the further part of the study, these results were used to determine deformation parameters and subjected to further analysis.
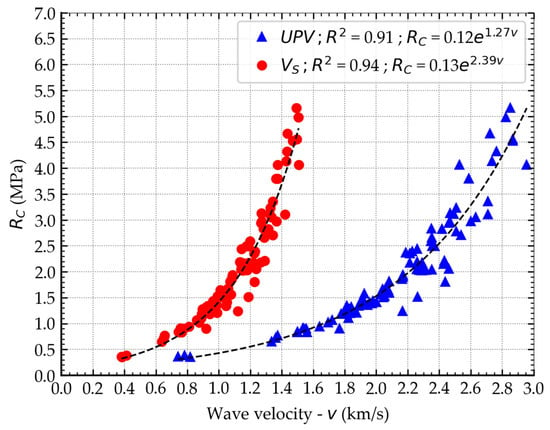
Figure 6.
Longitudinal and shear wave velocities from all stages of the study.
3.2. Determination of Empirical Relationships for Strength Prediction
Based on the results obtained at individual stages of the research, an analysis was conducted to determine an empirical relationship that allows for the prediction of the strength of stabilized soil. The empirical relationship determined is an extension of the concept presented in earlier works by other authors [9]. The analytical procedure included an assessment of the influence of porosity, cement index, and curing time.
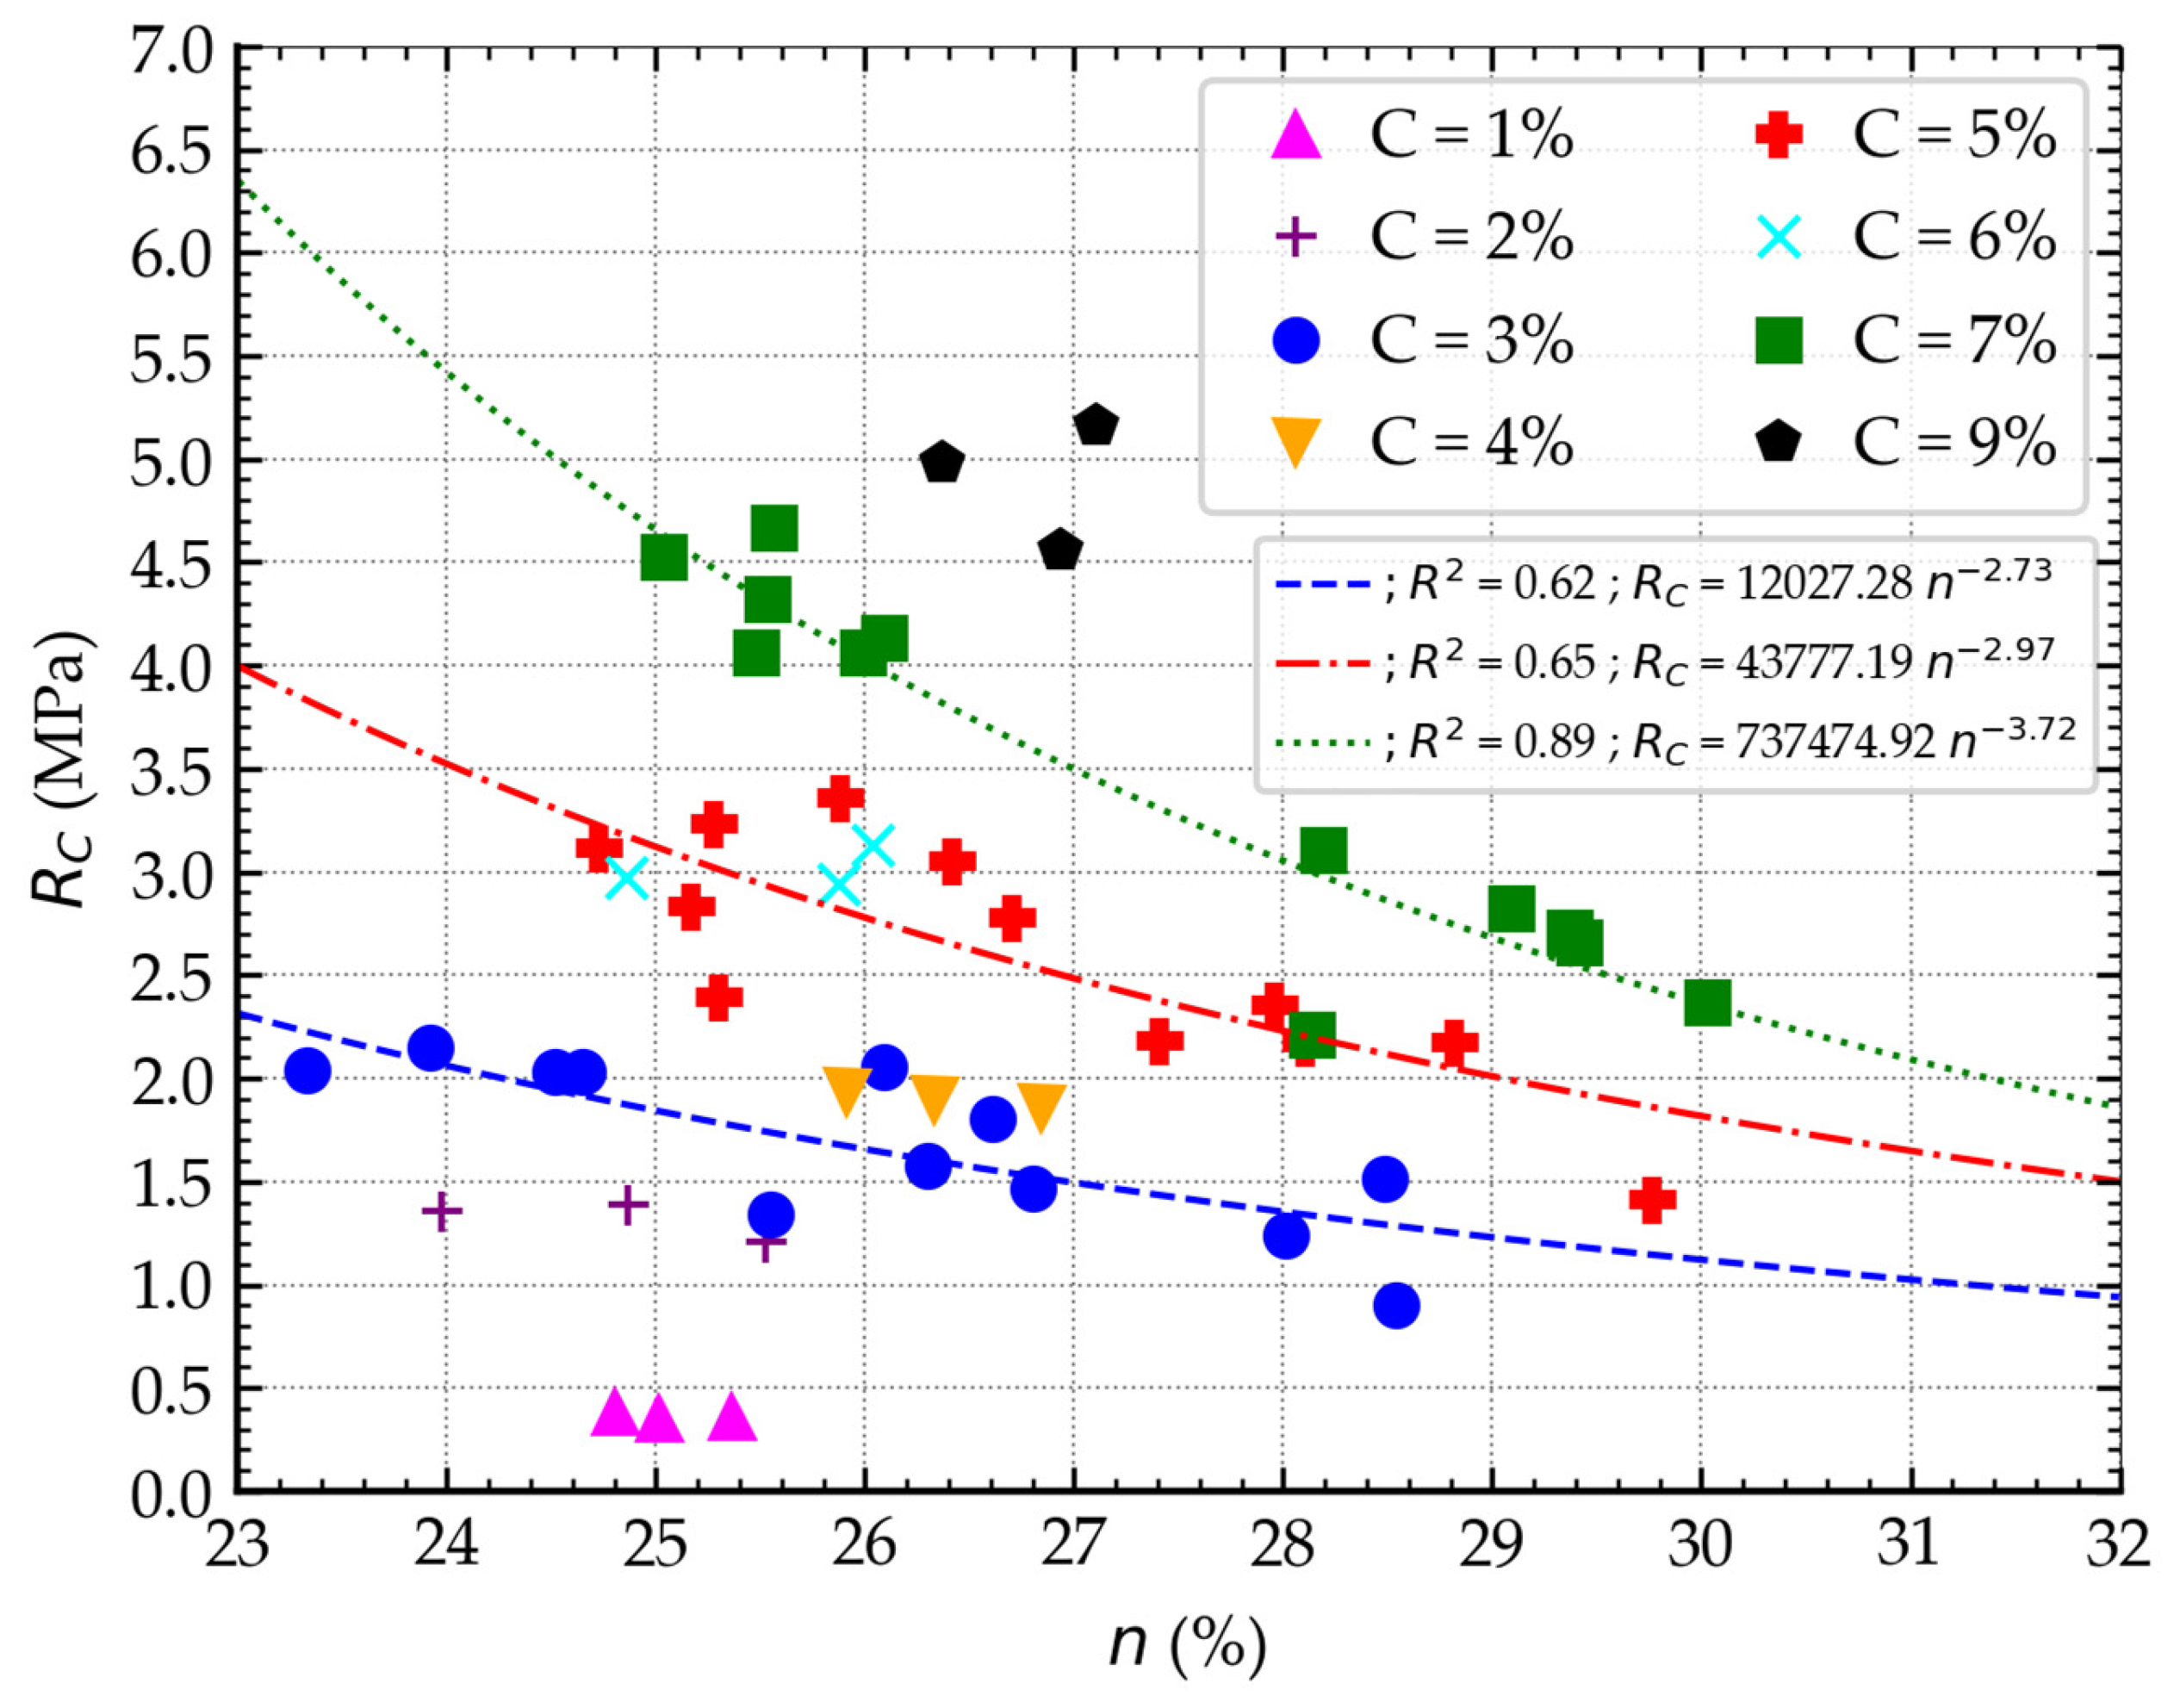
As a first step, the impact of porosity on unconfined compressive strength was analyzed. Based on the test results presented in Figure 7, obtained after 28 days of curing the stabilized soil, it was found that as porosity increases, the material’s strength decreases. The nature of the observed changes proved to be independent of the amount of binder used and can be described by a power function. At the same time, it was observed that an increase in binder content leads to an increase in strength. On this basis, it was concluded that the proportion of air and water in the medium under consideration has a significant impact on its strength properties, which justifies the inclusion of porosity in the analysis.
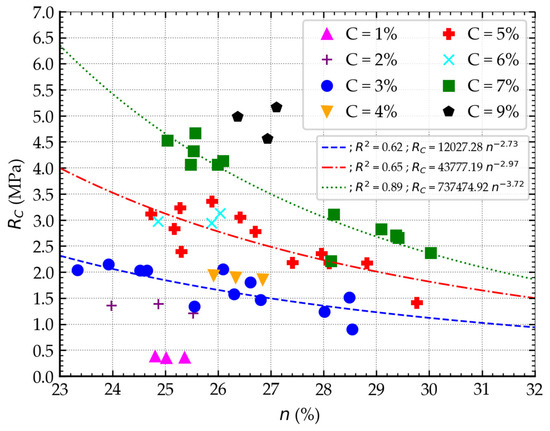
Figure 7.
The relationship between porosity and RC.
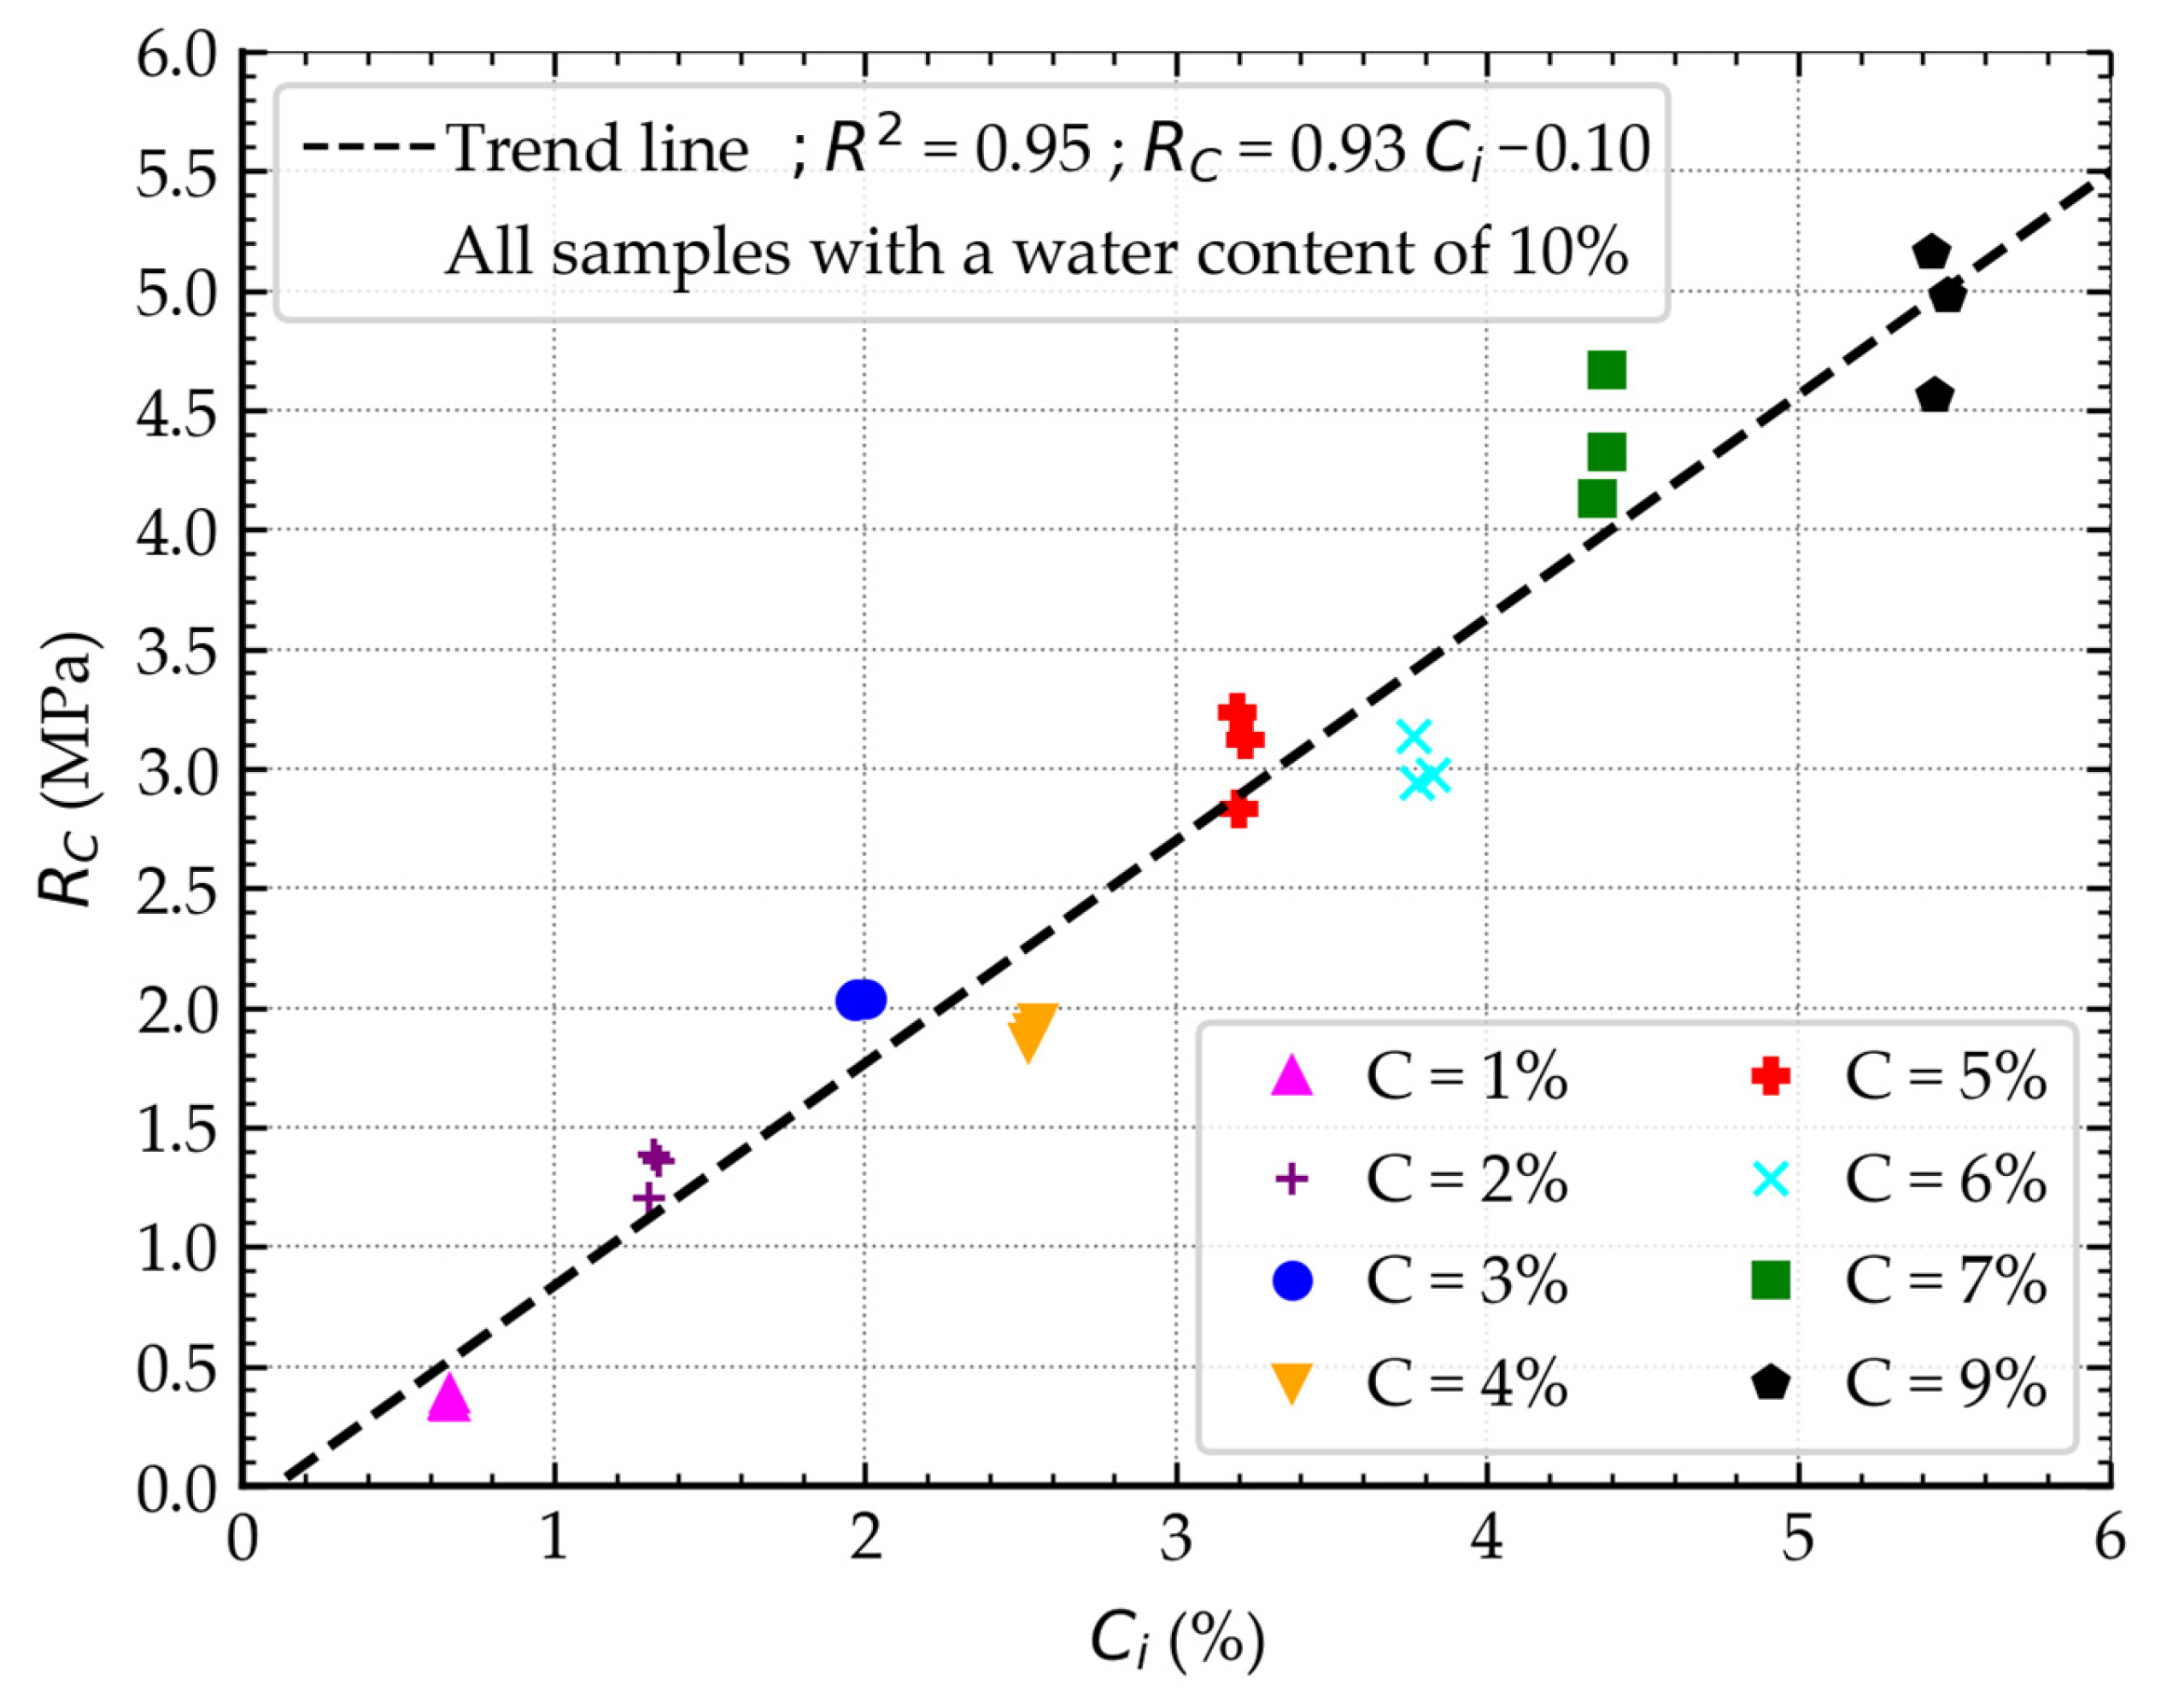
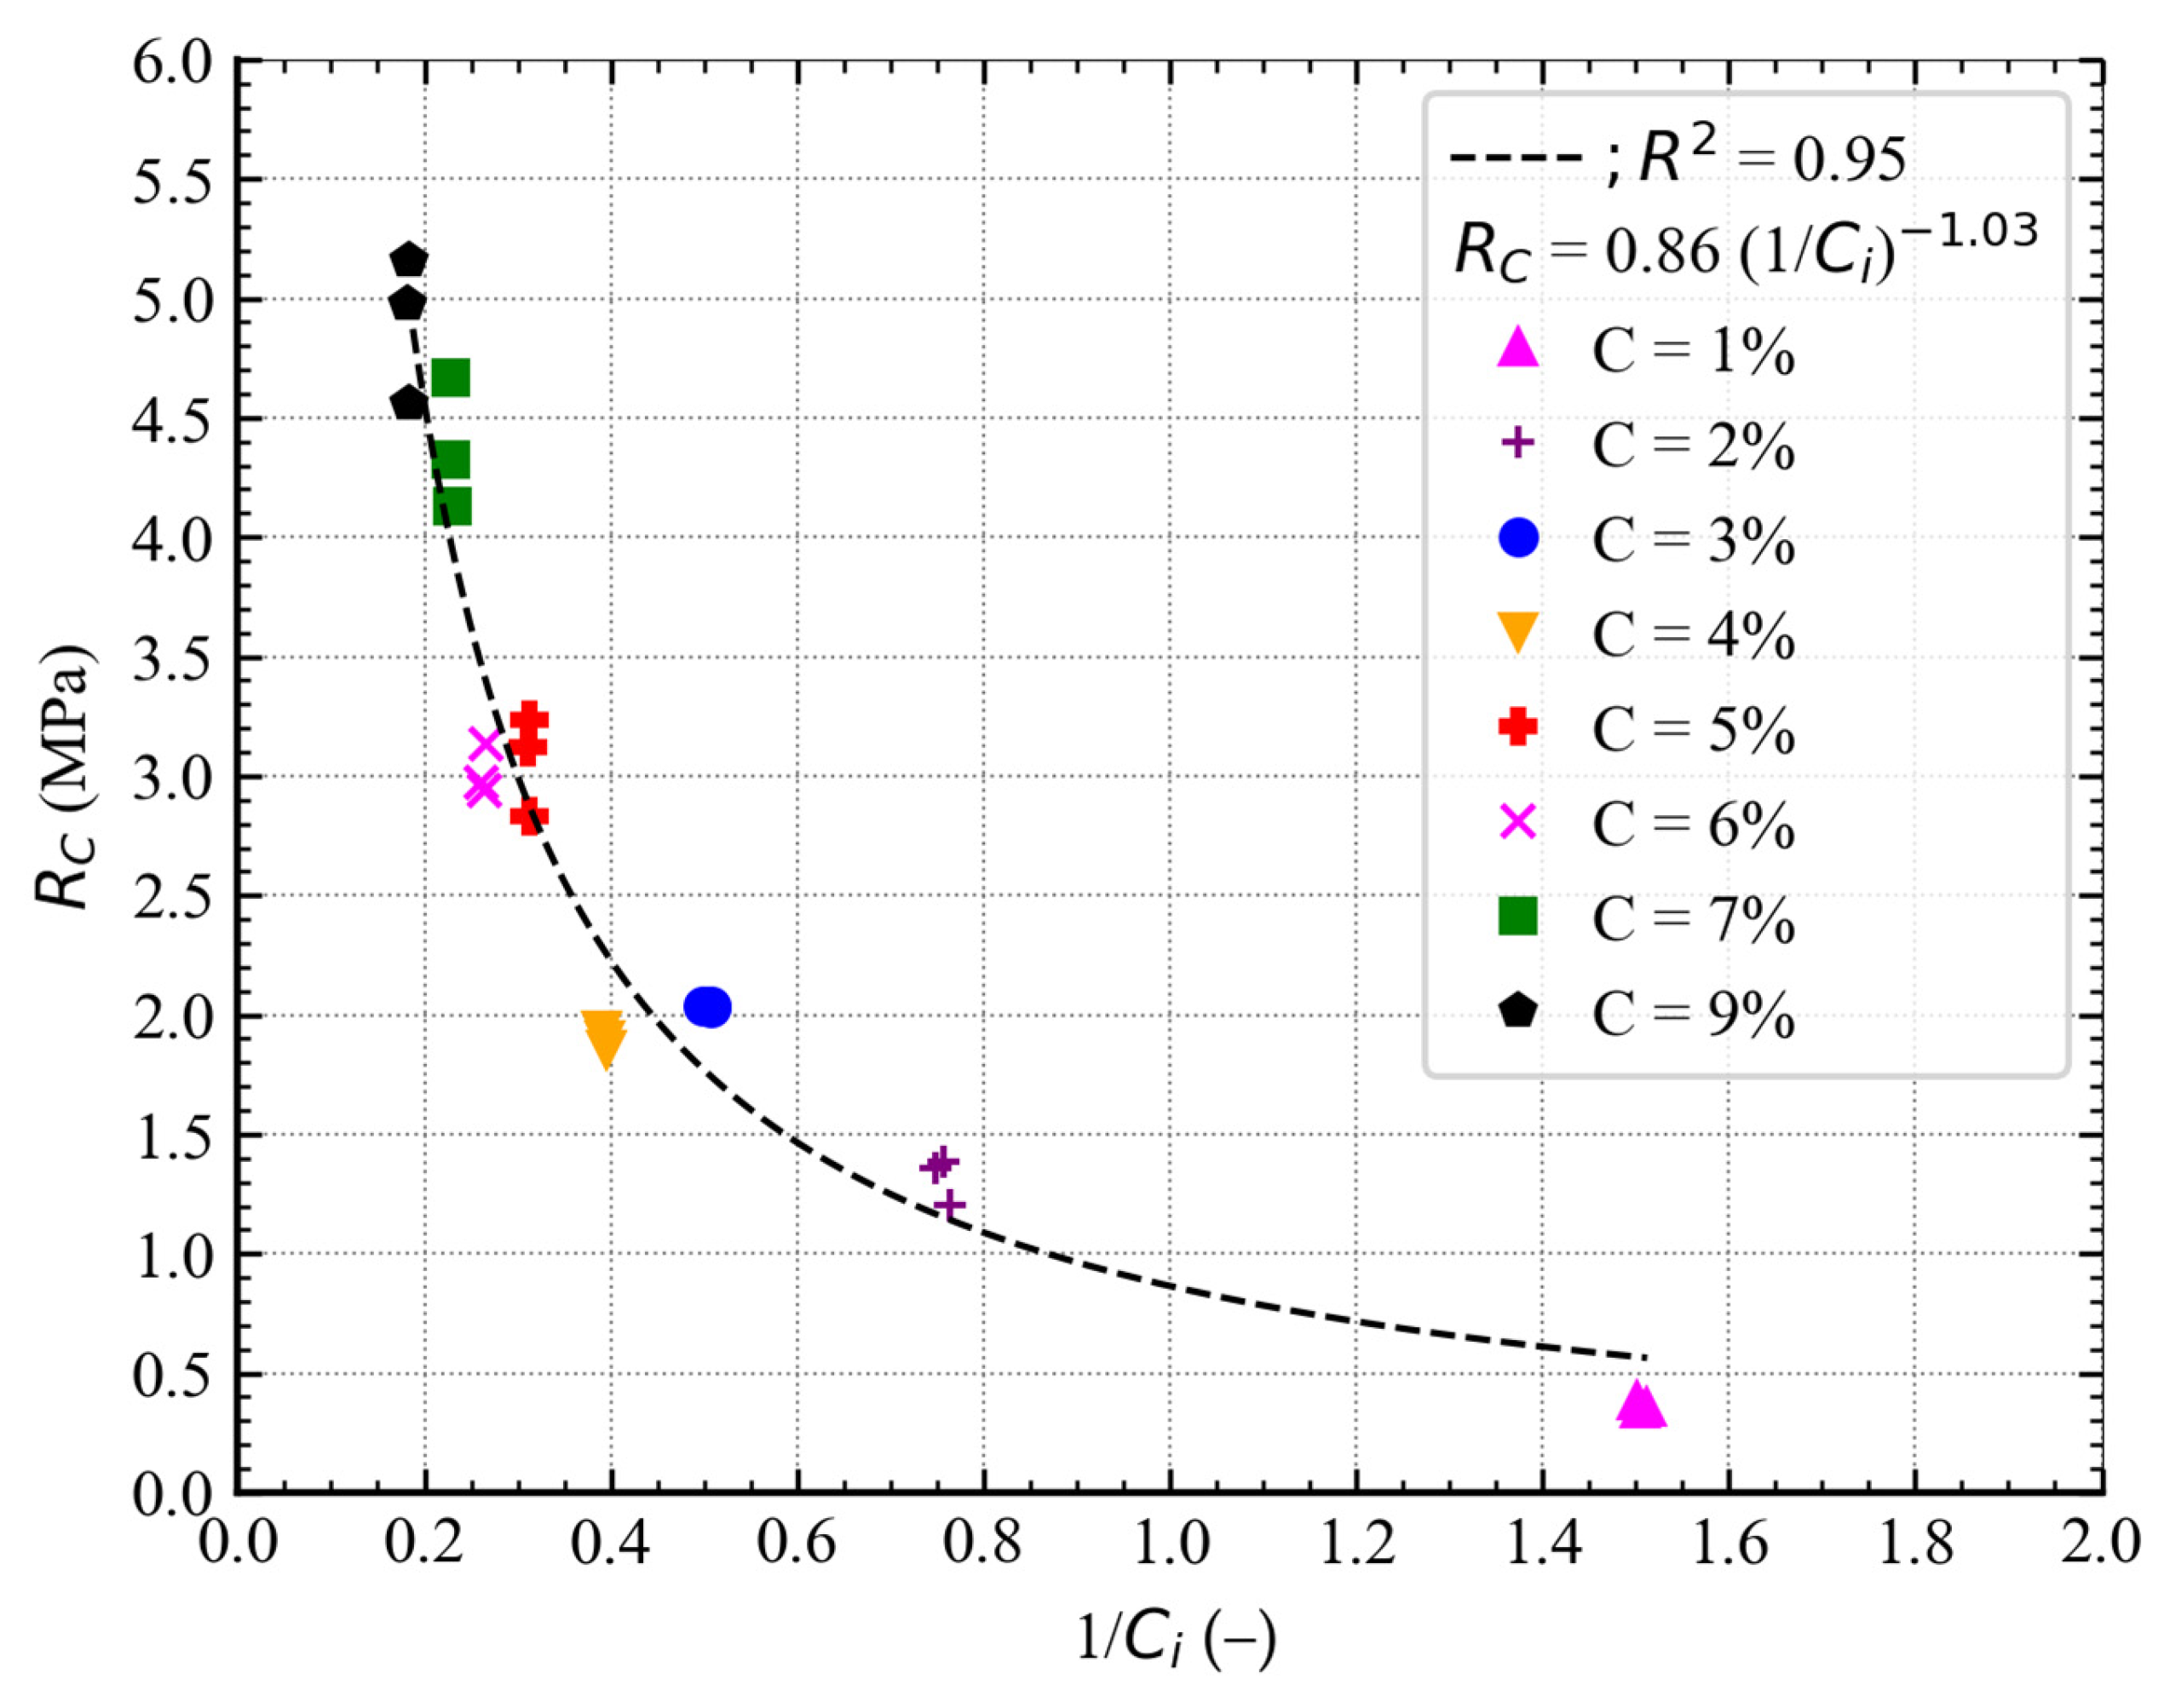
In the next stage, an analysis was conducted to assess the impact of the cement index on the strength of stabilized soil. Samples compacted at 10% moisture content and subjected to a 28-day curing process were tested. The results showed that as the cement index increases, the material’s strength increases linearly, as illustrated in Figure 8. For the analyses, the inverse of the cement index, i.e., 1/Ci, was used. This allowed the nature of the changes in the empirical relationship between the cement index and porosity to be adjusted. As a result, as the 1/Ci parameter increased, the strength of the stabilized soil decreased, similarly to the case of porosity, as illustrated in Figure 9. The determined relationship, similar to the relationship shown in Figure 8, is characterized by a very high coefficient of determination. However, it should be noted that despite the similar nature of the changes in strength, the rate of these changes remains different.
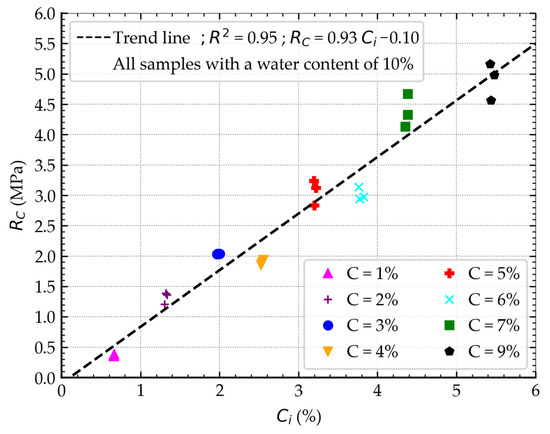
Figure 8.
The relationship between cement index and RC.
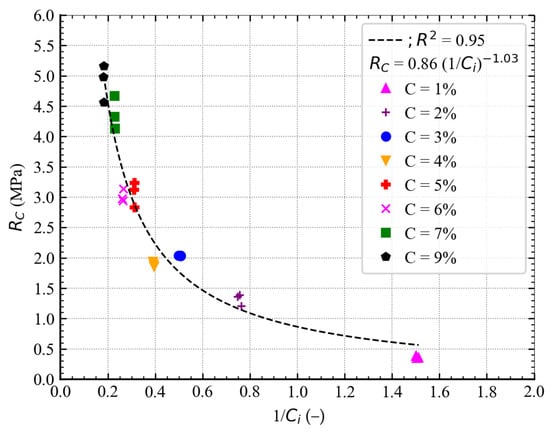
Figure 9.
The relationship between the inverse of the cement index and RC.
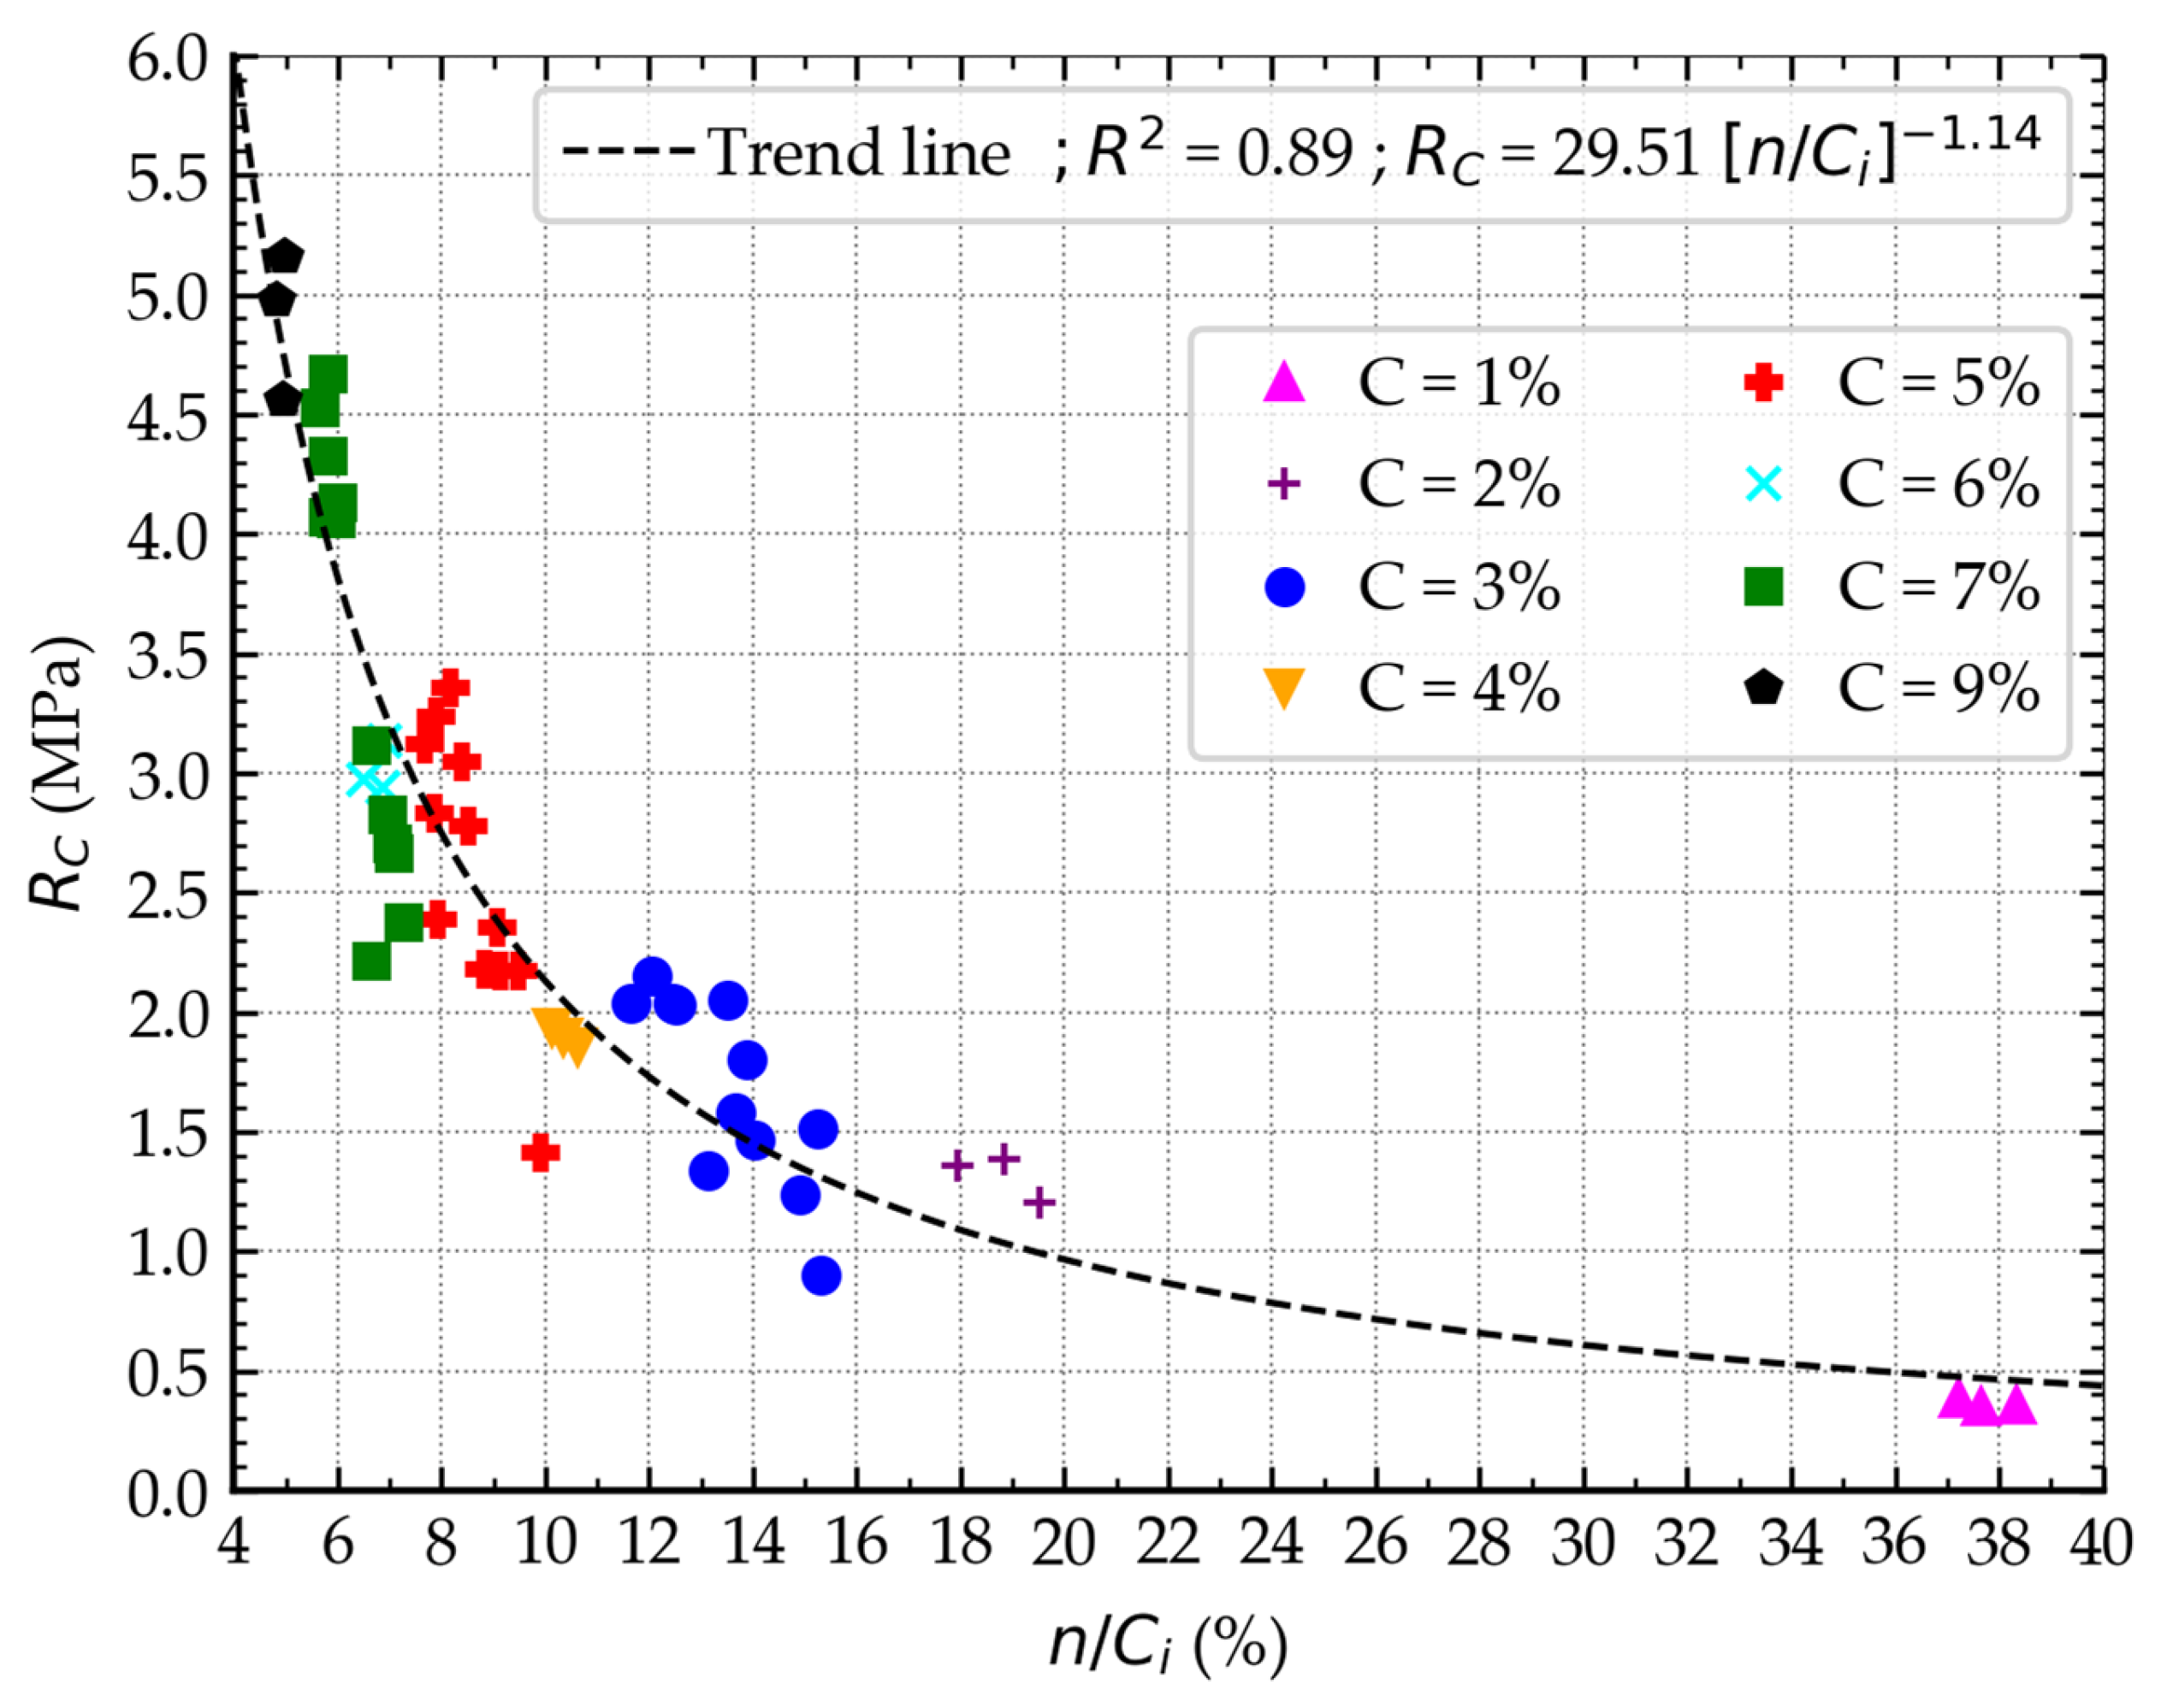
In the next stage, the relationship between porosity and cement index was analyzed. All samples subjected to a 28-day curing process were included in the analysis. It was demonstrated that the empirical relationship, described by a power function, has a coefficient of determination of 0.89, as shown in Figure 10. The accuracy of this relationship can be increased by adjusting the rate of change in porosity and the inverse of the cement index. This can be achieved by applying a power transformation to one of these parameters [42]. In this study, a calibration parameter A was introduced, which modifies the rate of change in strength by including it as an exponent in the cement index. The value of parameter A was determined by analyzing the coefficient of determination, selecting it to obtain the best possible fit of the relationship. The determined empirical relationship is described by Equation (3), in which the parameter α serves as a scaling factor and β as a power exponent.
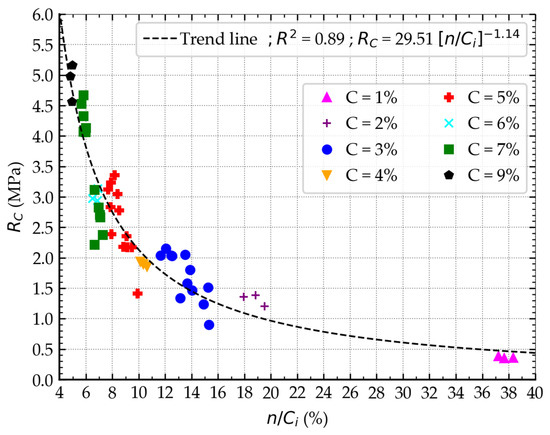
Figure 10.
The relationship between n/Ci and Rc.
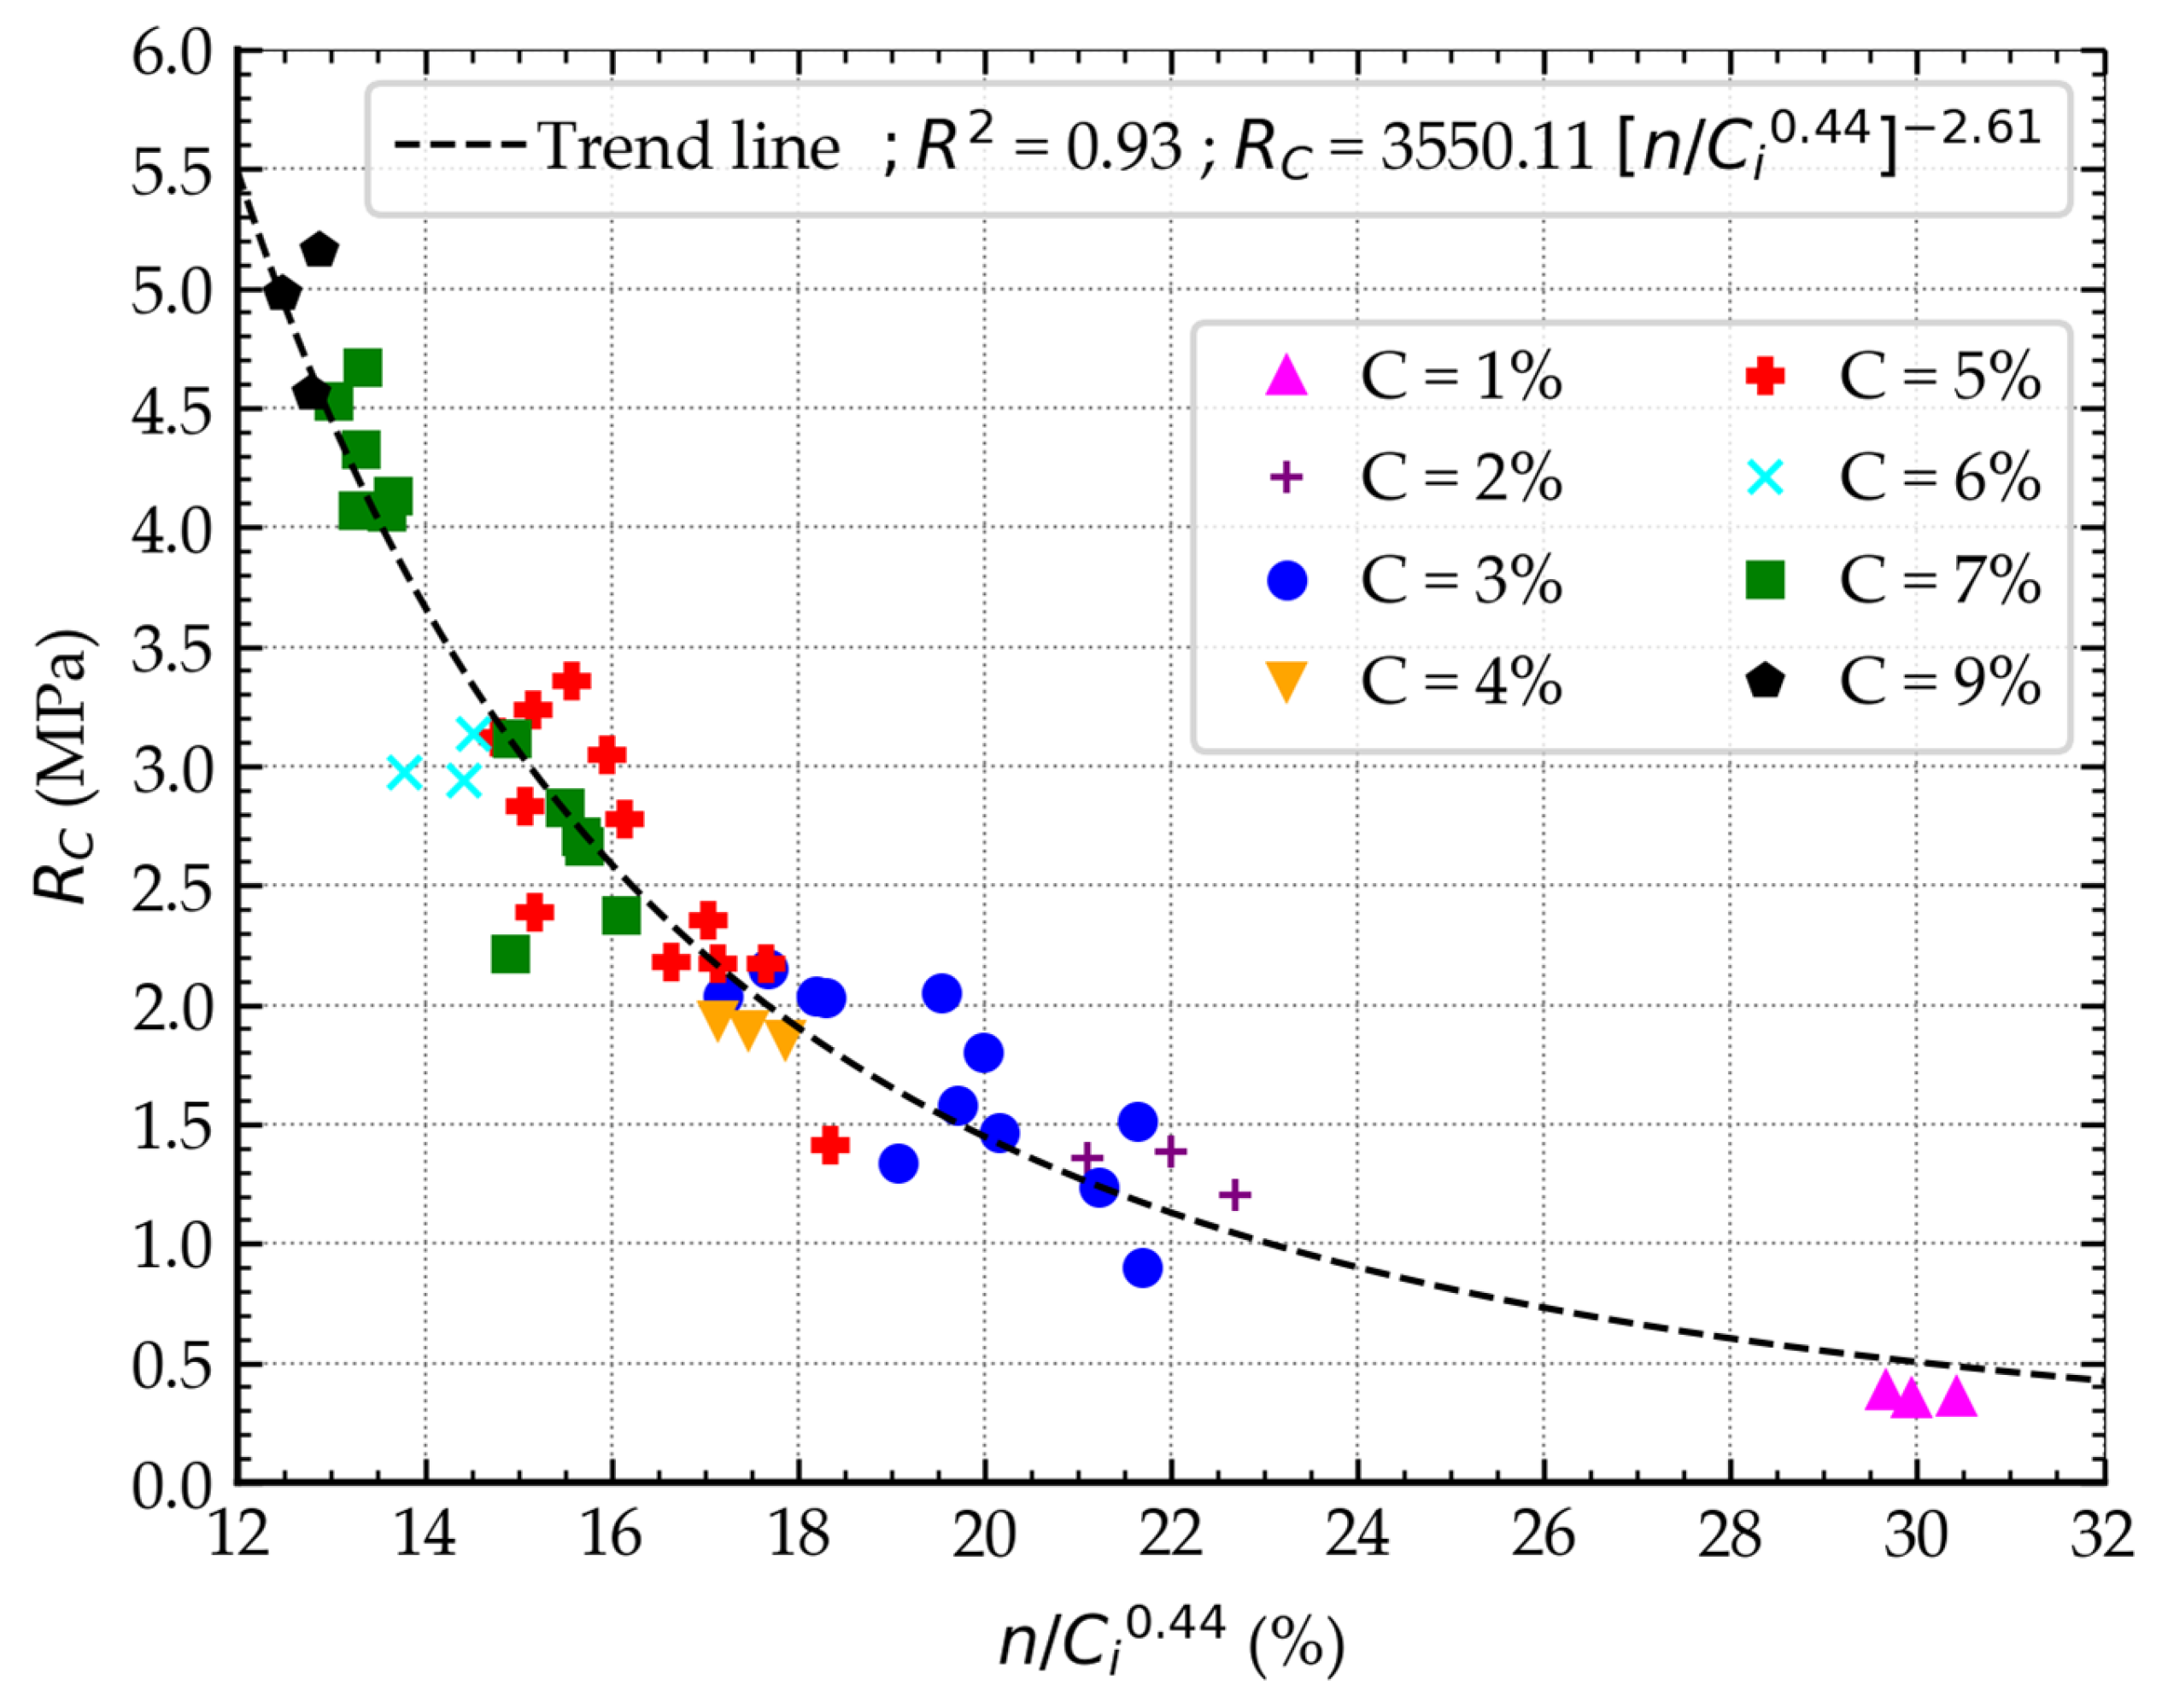
During the analysis, it was determined that the best fit of the empirical relationship was obtained for parameter A = 0.44, which is confirmed by the coefficient of determination of 0.93, as shown in Figure 11. The parameters for assessing the model’s quality also improved. In the case of the mean absolute percentage error (MAPE), a decrease in its value from 15.195% to 12.049% was recorded. In contrast, the root mean square error (RMSE) was reduced from 0.385 MPa to 0.309 MPa. The results obtained clearly indicate an improvement in the model’s prediction accuracy and a better agreement between the predicted values and the experimental results. The methodology described has been widely presented in the literature by other authors [9,38,42,43,59,60]. The following section of the analysis presents a new approach that directly incorporates the curing time into the analyzed relationships.
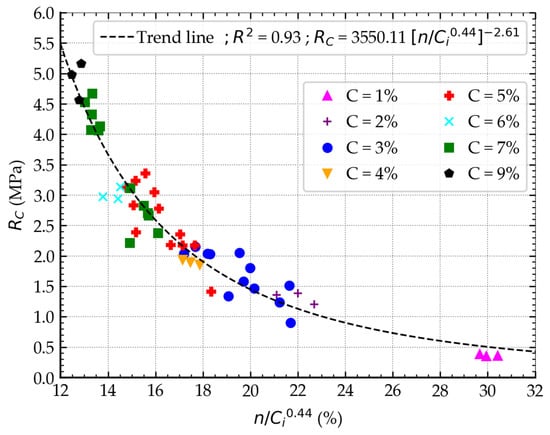
Figure 11.
The relationship between n/CiA and Rc.
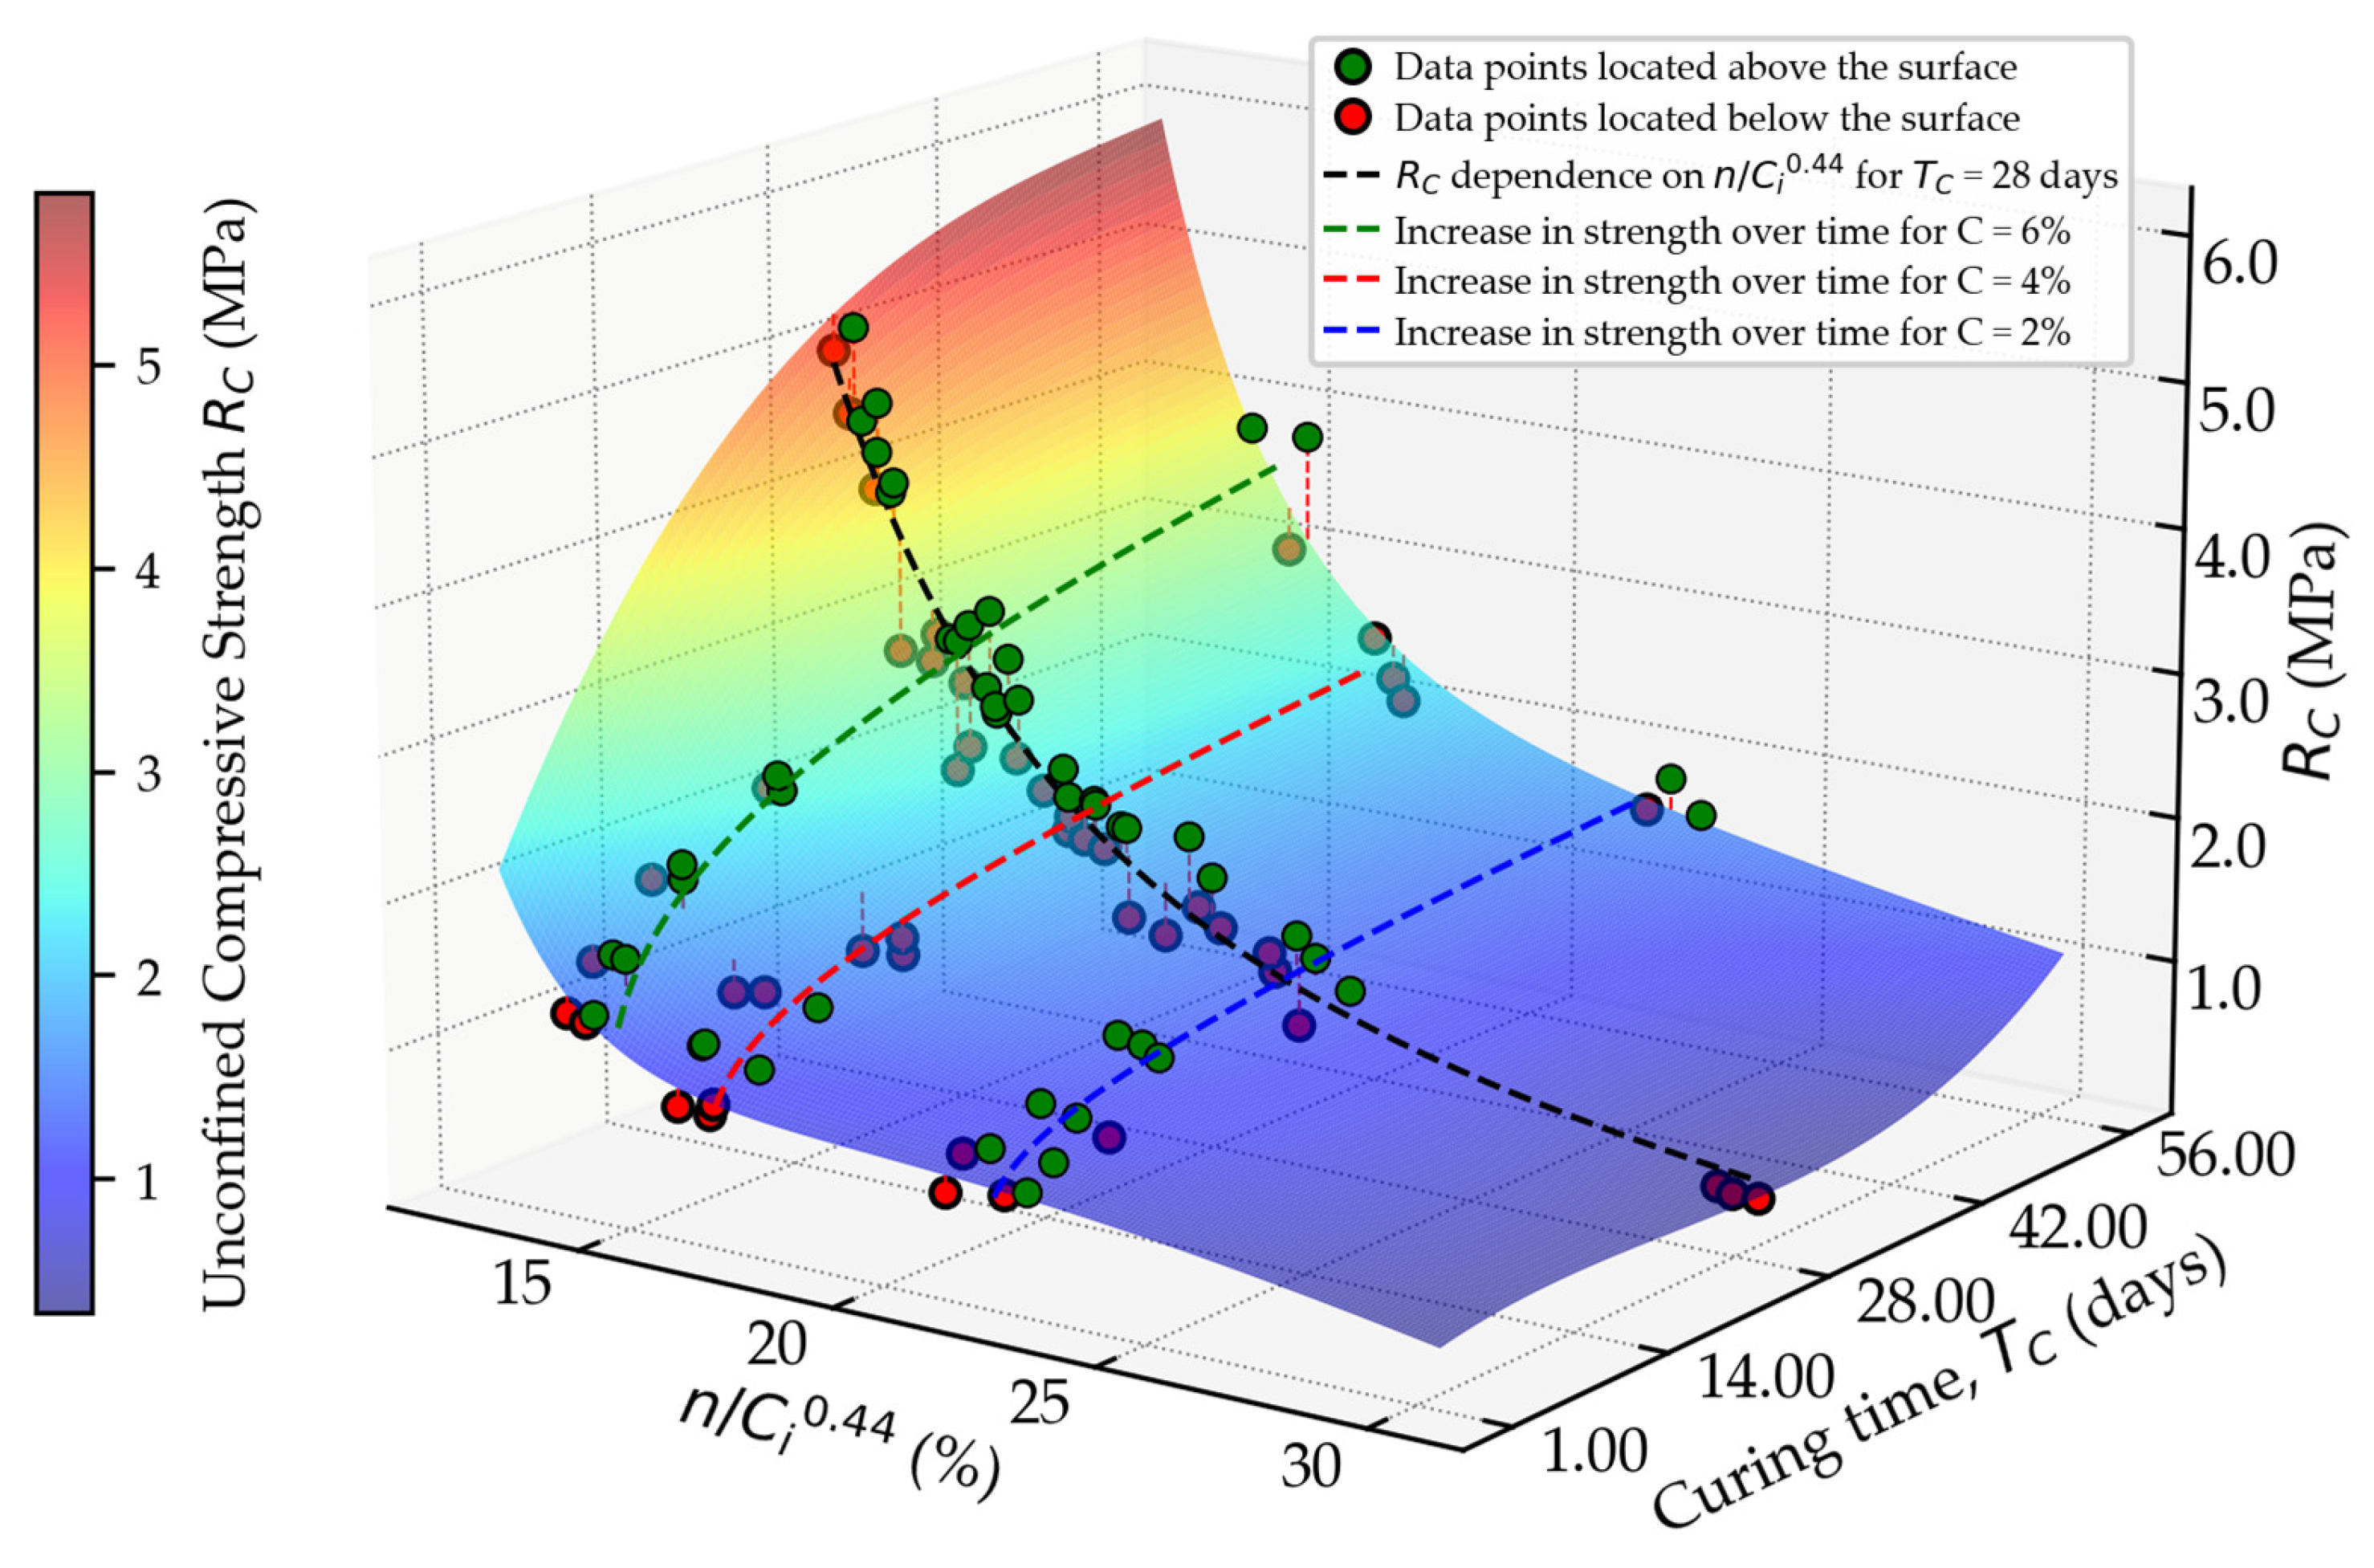
Based on the analyses, it was found that the strength of stabilized soil is highly dependent on the porosity-to-cement index ratio. In the proposed methodology, the values of these parameters were determined immediately after sample preparation, thereby remaining constant over time. This dependence is illustrated in Figure 12, where, despite the constant n/CiA ratio, an increase in strength over time is observed. It should be noted, however, that the determined improvement surface represents only a description of the trends in the strength development of the stabilized soil. The nature of this phenomenon is described by the surface defined by Equation (4), in which the following parameter values were assumed: a = −6.2380164, b = 394.93627, c = −0.029185371, d = −7546.0721, e = 0.00018412605, f = 0.66295721, g = 48685.818, h = 1.9958241 × 10⁻⁵, i = −0.043371589, j = 26.071567.
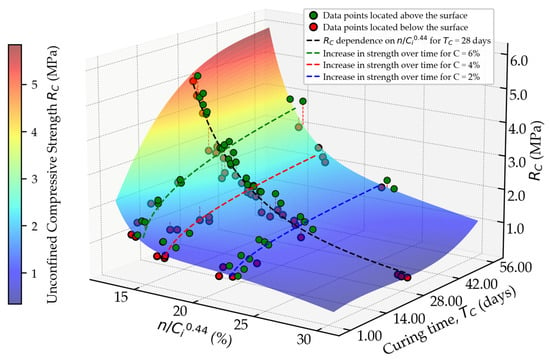
Figure 12.
Surface of stabilized soil improvement.
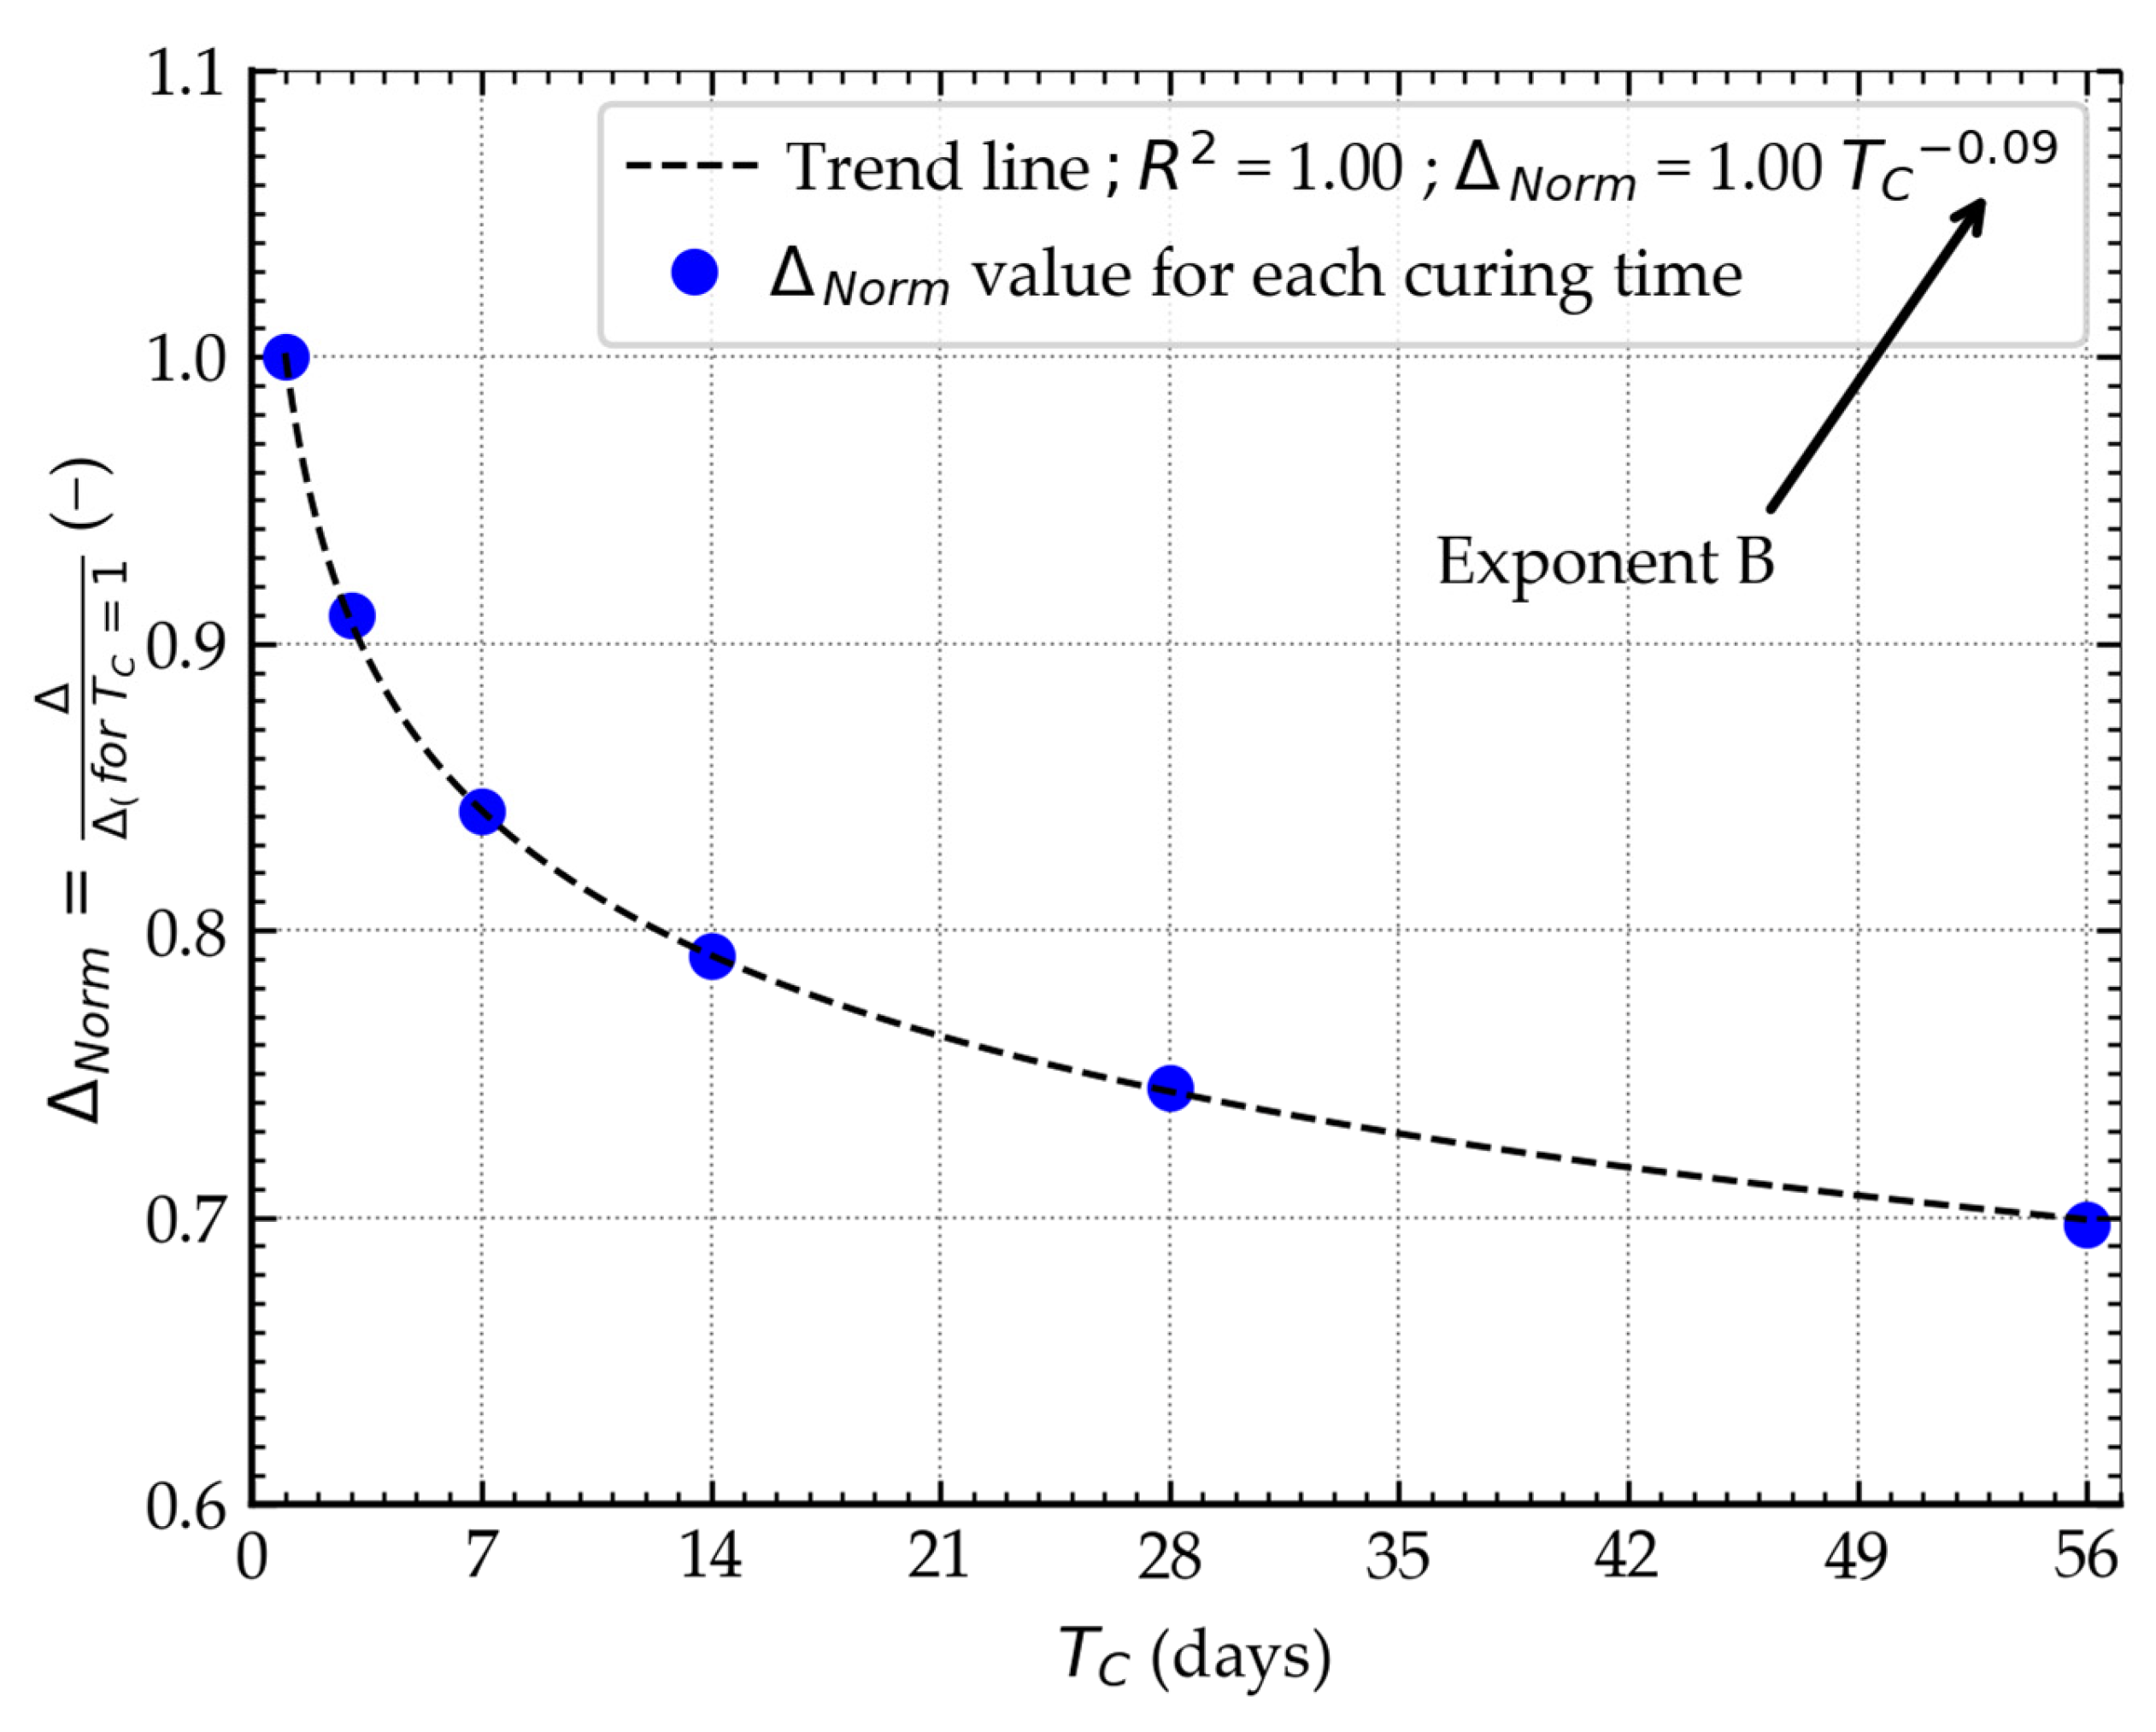
For this reason, an additional parameter was determined, which allows for the direct consideration of the influence of the curing time in the analyzed empirical relationship. This parameter was defined as a function describing the change in the normalized value of n/CiA relative to the first day of curing. This parameter was included as a multiplier of the characteristic values under consideration, i.e., porosity and cement index. This solution enables the extension of the existing empirical relationship, allowing for the description of strength changes as a function of time. The following section of the paper presents a detailed course of progress:
- First, the average values of the unconfined compressive strength of the stabilized soil for individual curing periods were determined, calculated based on stage 3 tests.
- Based on the determined values, the normalized strength relative to the first day of curing was determined, denoted as and described by Equation (5).
- Based on the converted empirical relationship shown in Figure 11, the value of the parameter n/CiA was determined, corresponding to the values. The converted relationship is described by Equation (6).
- The n/CiA parameter was normalized to the value from the first curing day. The normalized parameter is denoted as and described by Equation (7).
- The variability of the parameter as a function of time was examined, as shown in Figure 13.
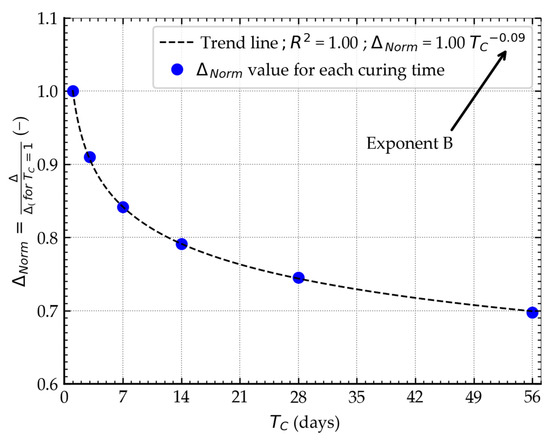 Figure 13. Determining the value based on stage 3 of the study.
The relationship between and curing time was described using a power function, as shown in Figure 13. This relationship was then incorporated into Equation (3). The argument in the determined function is the curing time. This function was defined with a scaling parameter equal to 1, while the power exponent was treated as an additional calibration parameter, denoted by the symbol B. This parameter can be adjusted to the type of binder used, as each binder may have a different rate of strength development compared to the cement analyzed in this study. Parameter B acts as an exponent and describes the rate of change in the n/CiA ratio as a function of time. In practice, it is considered a modulating factor that shapes the curvature of the power function and determines how quickly the value of n/CiA decreases, and thus how strongly time affects the development of strength. Consequently, the rate of strength increase over time is directly dependent on the value of parameter B. If B = 0, has no effect, and strength depends only on the ratio n/CiA. If B < 0, an increase in causes a decrease in the expression , and thus a reduction in the parameter n/CiA, and consequently an increase in strength. It should be emphasized that parameter B takes negative values; therefore, to present it in a positive form, it was written as a divisor in the formula. The modified empirical relationship was described by Equation (8), while the intermediate values obtained during the analysis are summarized in Table 4.

Table 4.
Intermediate values from the analysis.
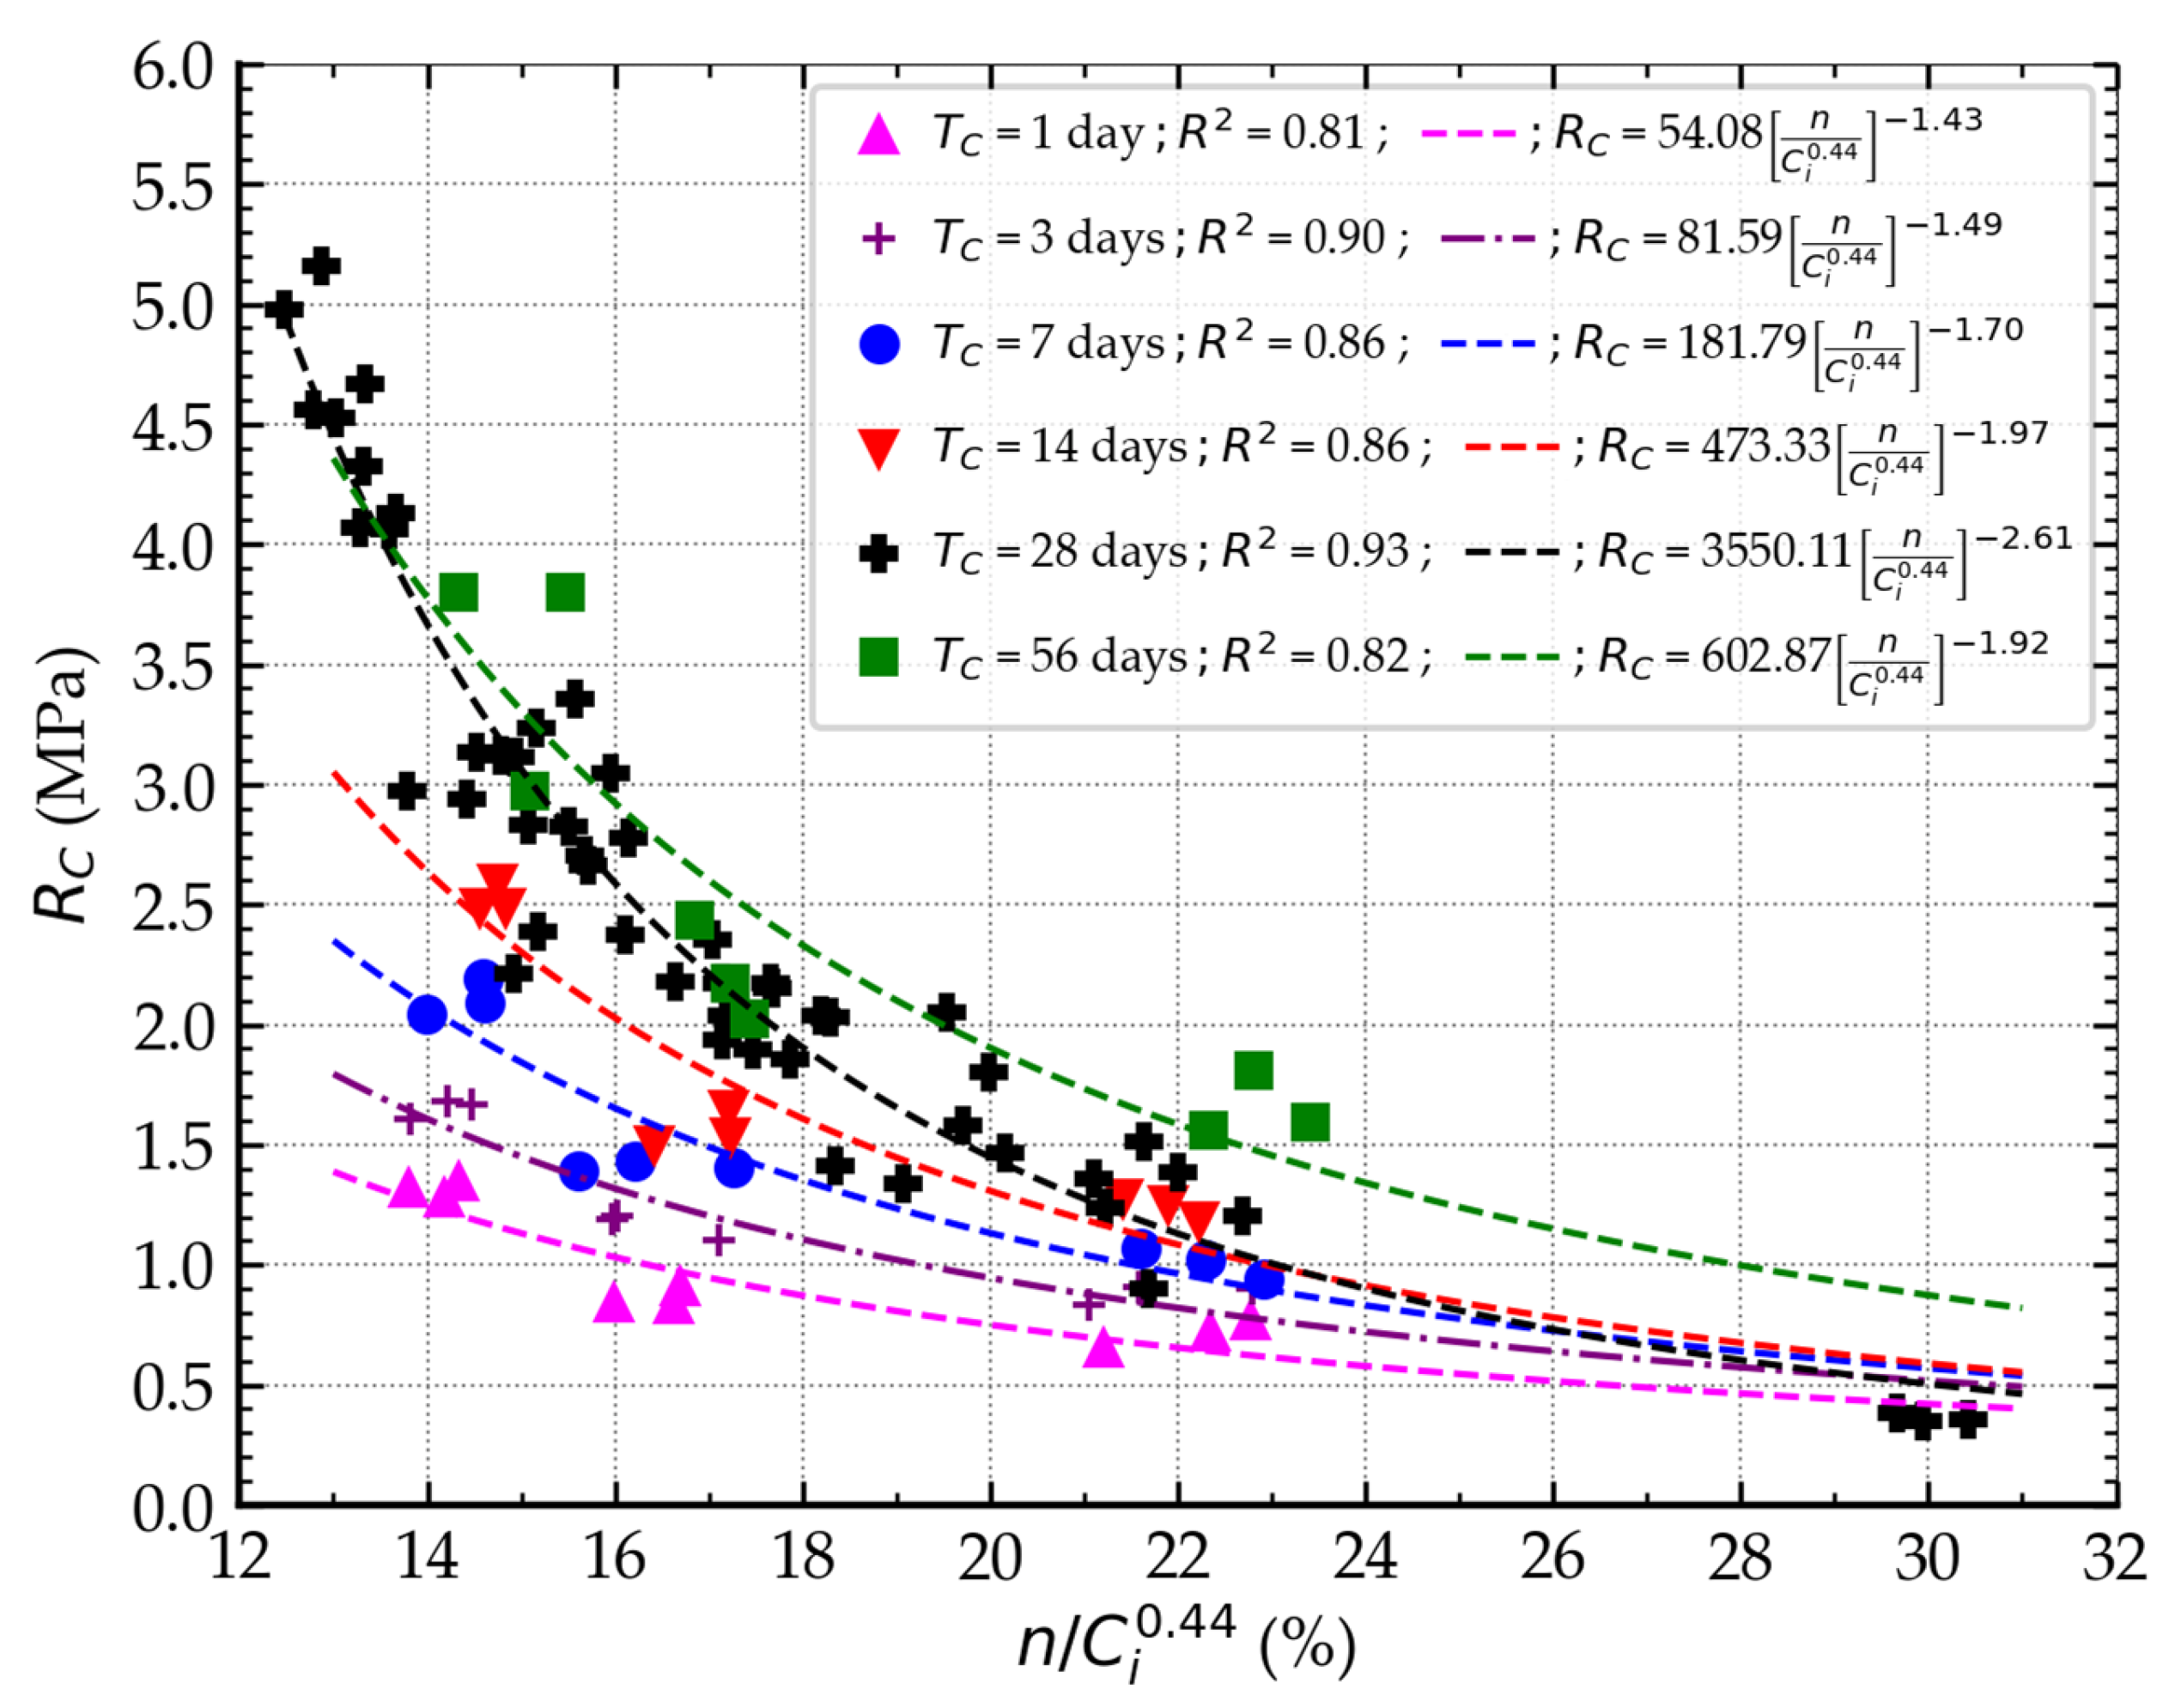
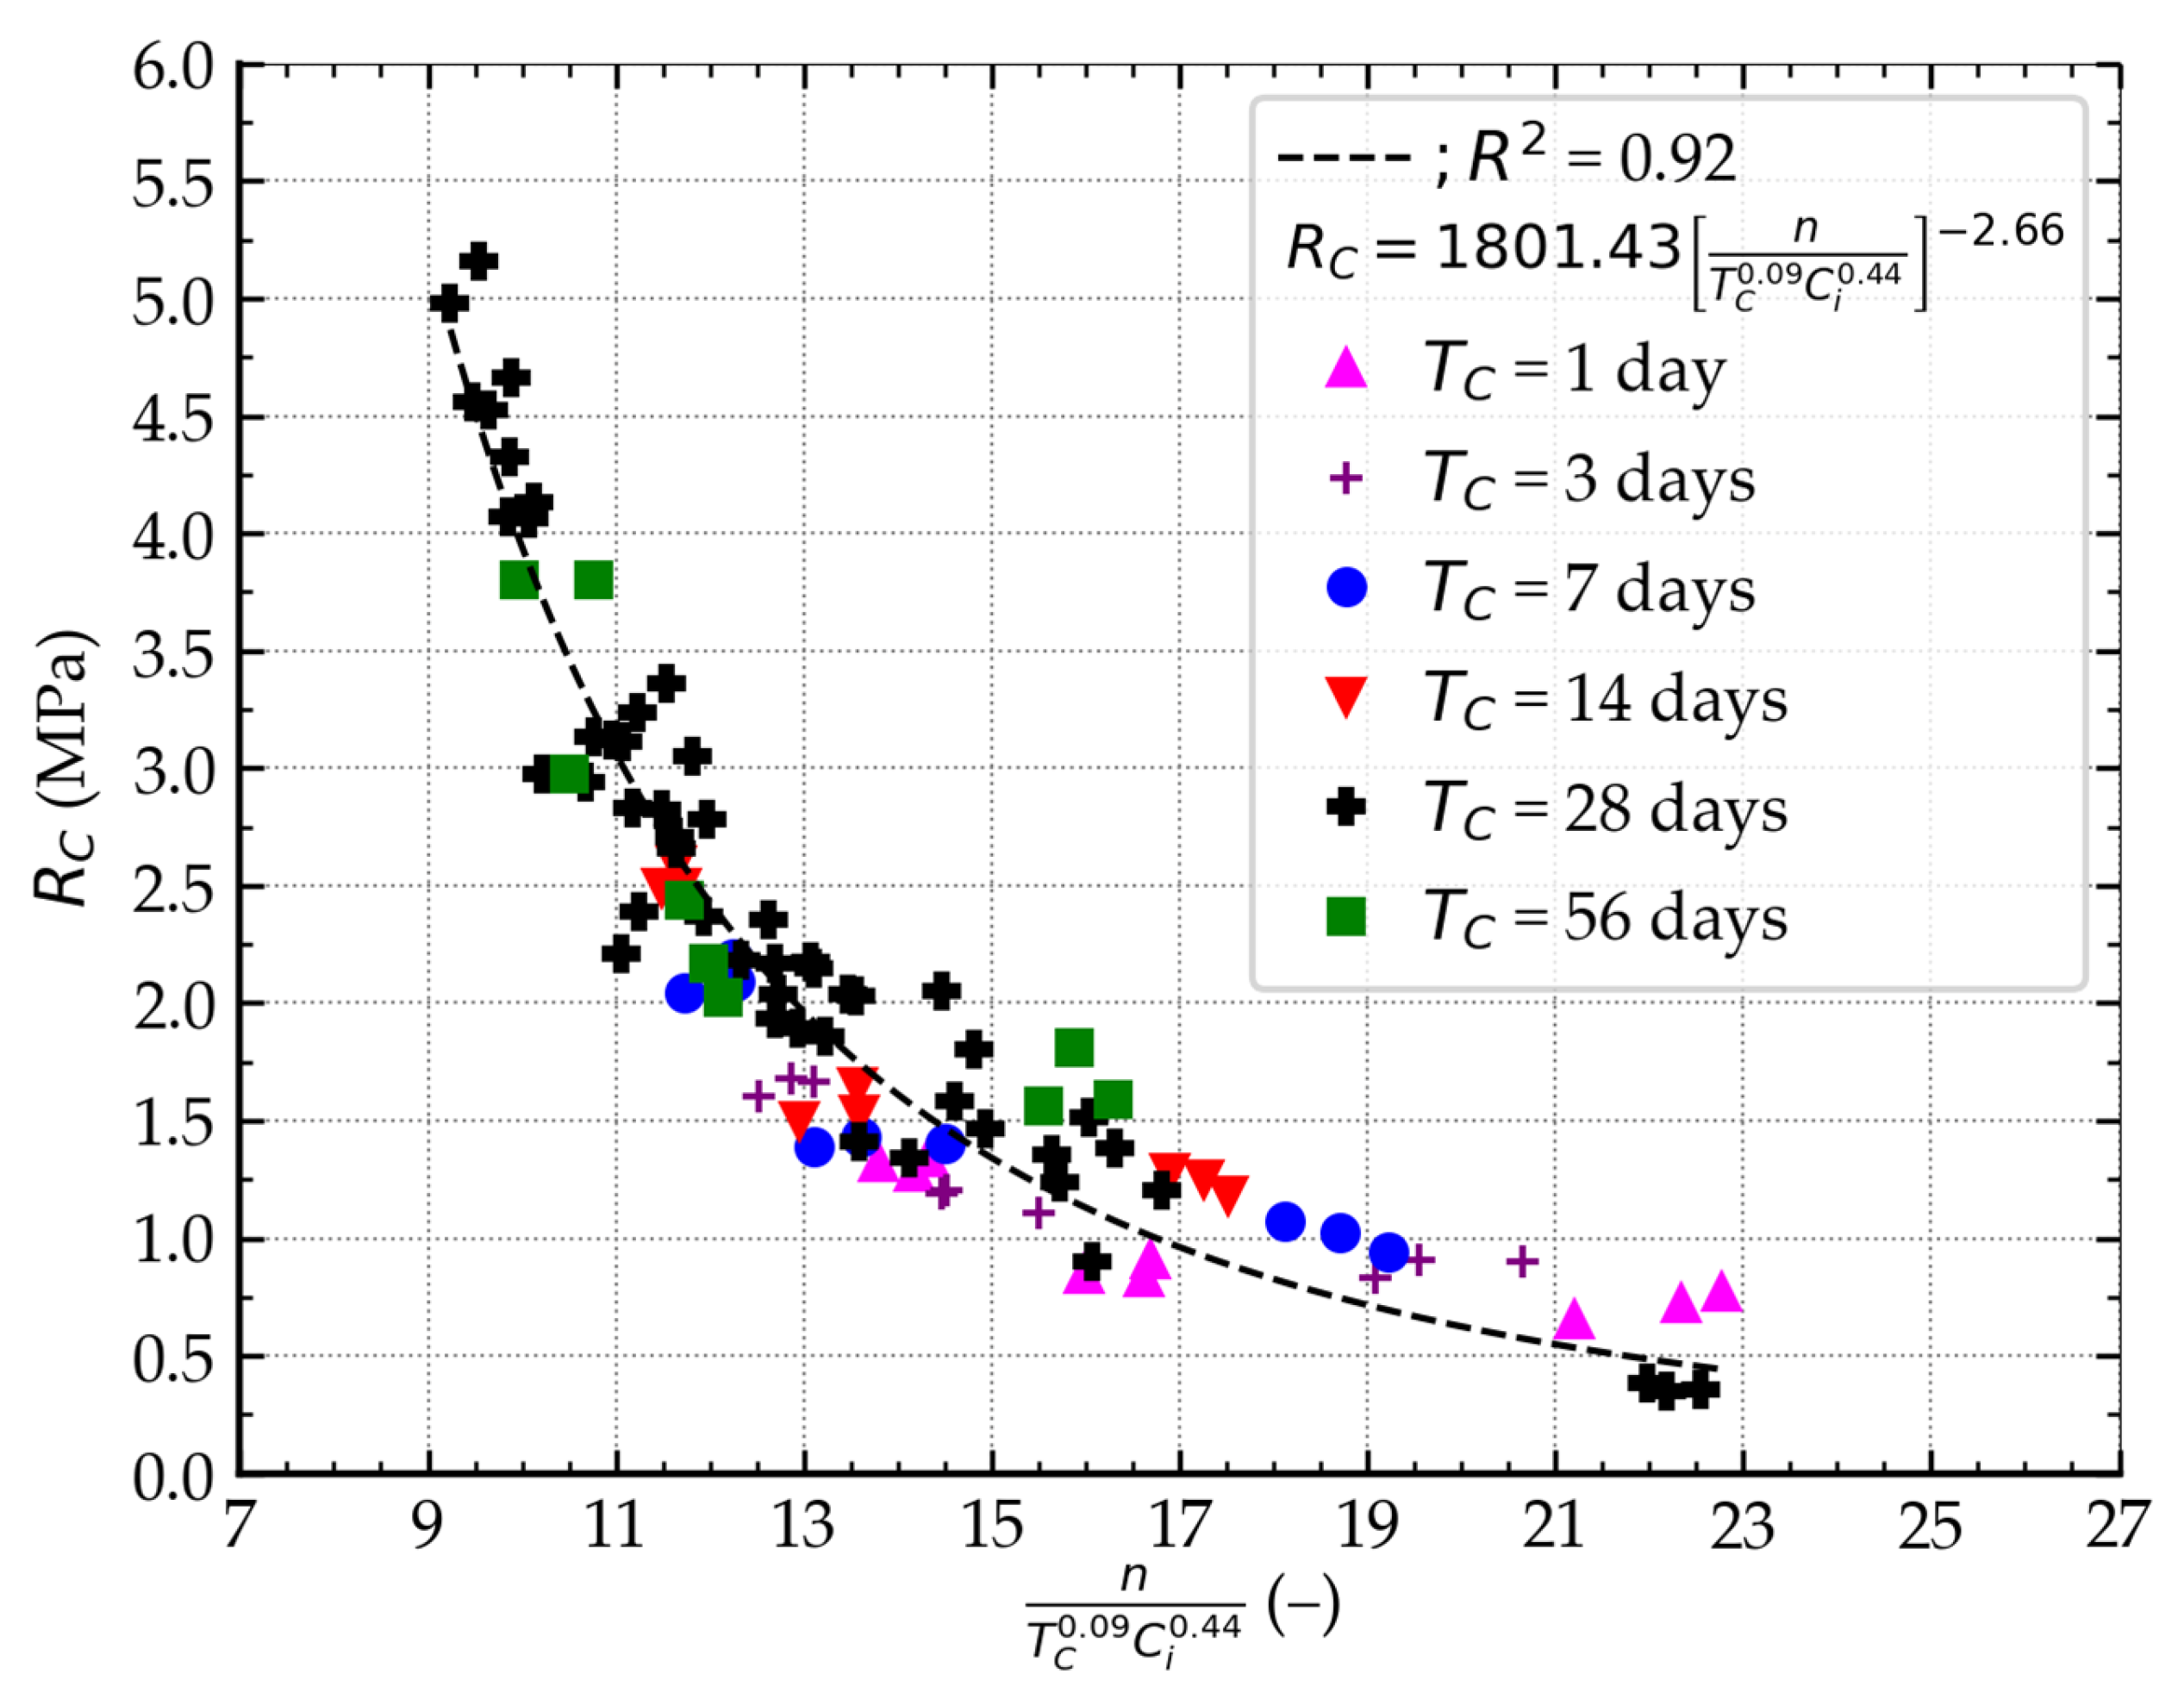
The final phase involves analyzing all the samples that have been tested. For comparison purposes, power functions were first examined using Equation (2). Based on the data presented in Figure 14, it can be concluded that as the curing time increases, the strength increases for the same n/CiA values, which is consistent with the assumptions made. In the next stage, after taking into account the parameter in the analysis, a new empirical relationship was determined, as presented in Figure 15. A coefficient of determination of 0.92 characterizes this relationship. Additionally, the MAPE and RMSE values were calculated, which were 15.928% and 0.318 MPa, respectively. The results obtained confirm the validity of the approach used and indicate its potential in further research on modeling the properties of stabilized soil. Furthermore, by applying the calibration factor B, the equation presented can be easily adapted to other types of binders, making it a universal approach to predicting the strength of stabilized soil.
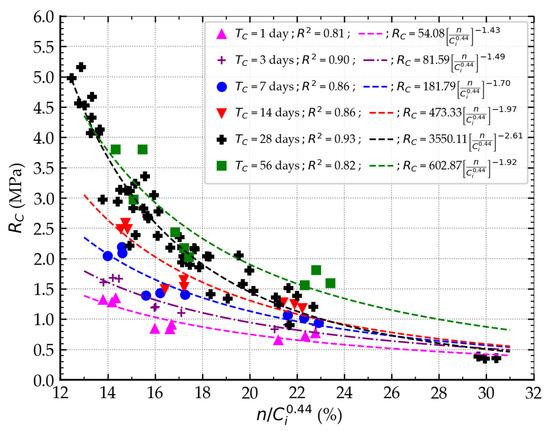
Figure 14.
Relationship between RC and porosity and cement index at different curing times.
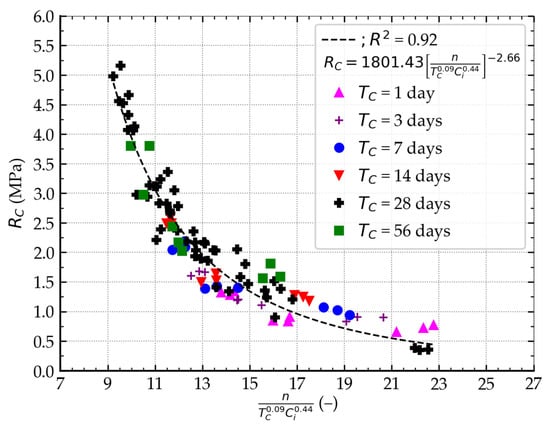
Figure 15.
The relationship between RC and porosity, cement index, and curing time.
3.3. Determination of Empirical Relationships for Deformation Parameter Prediction
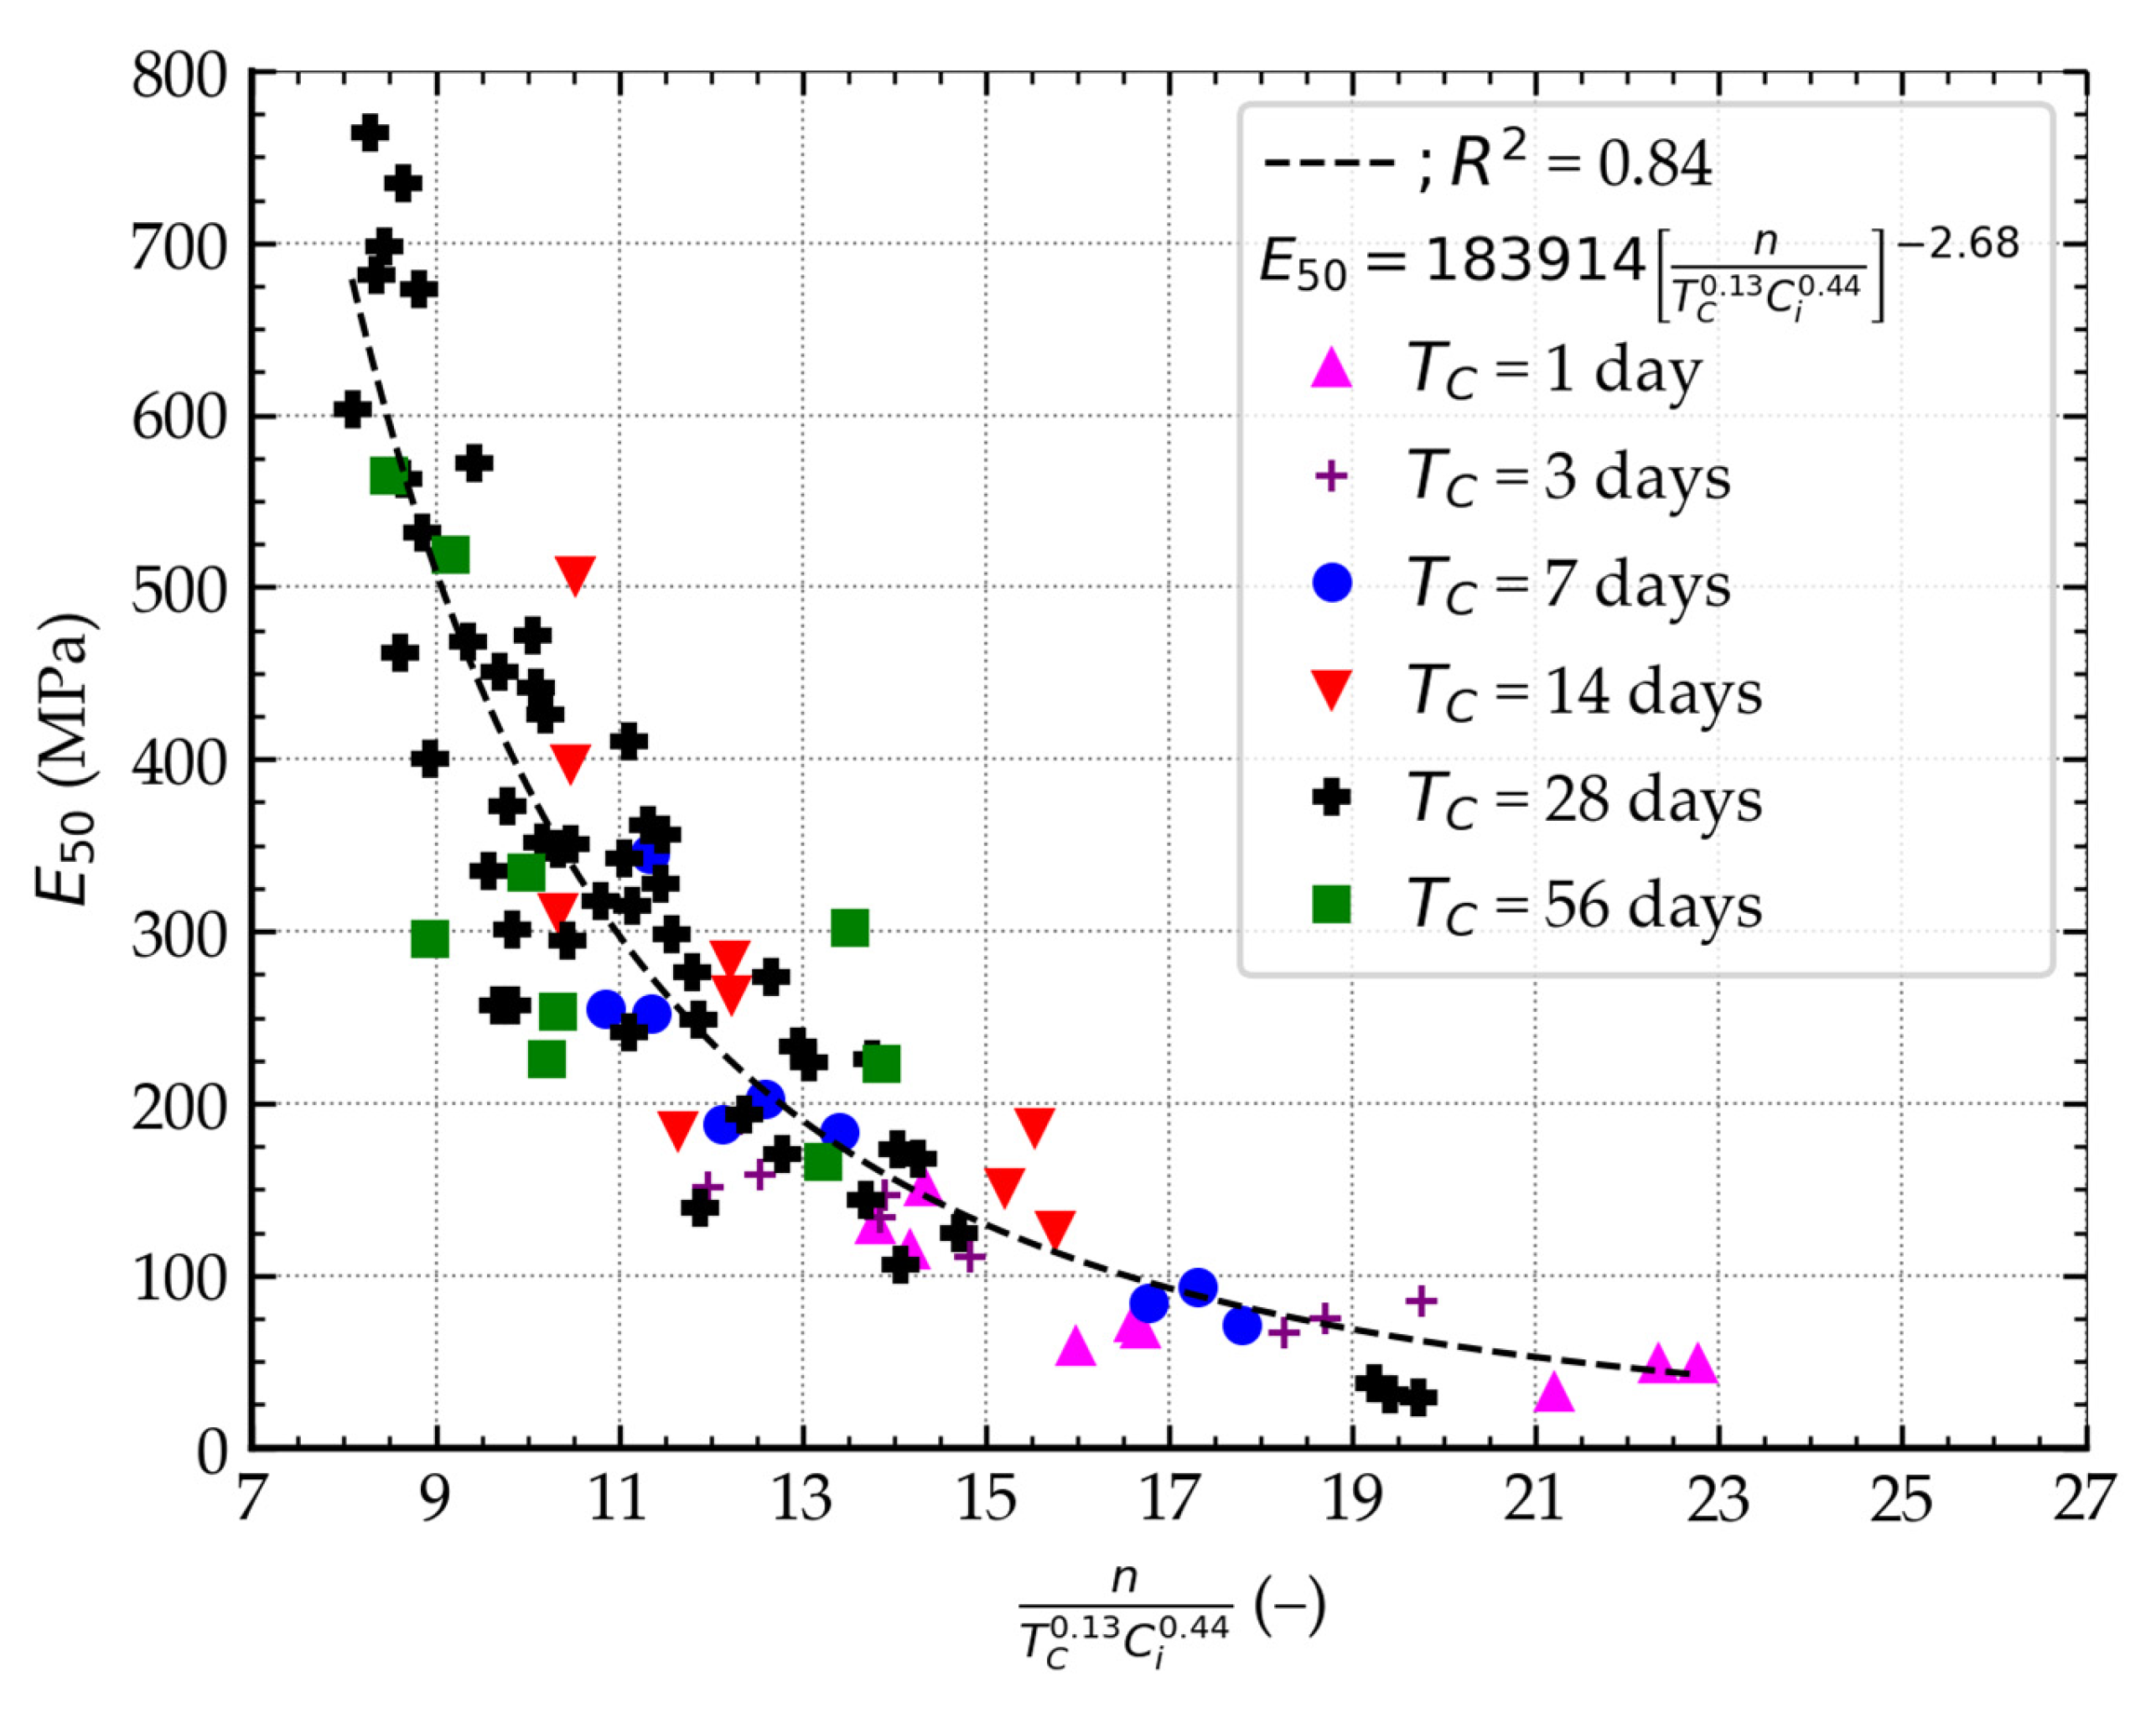
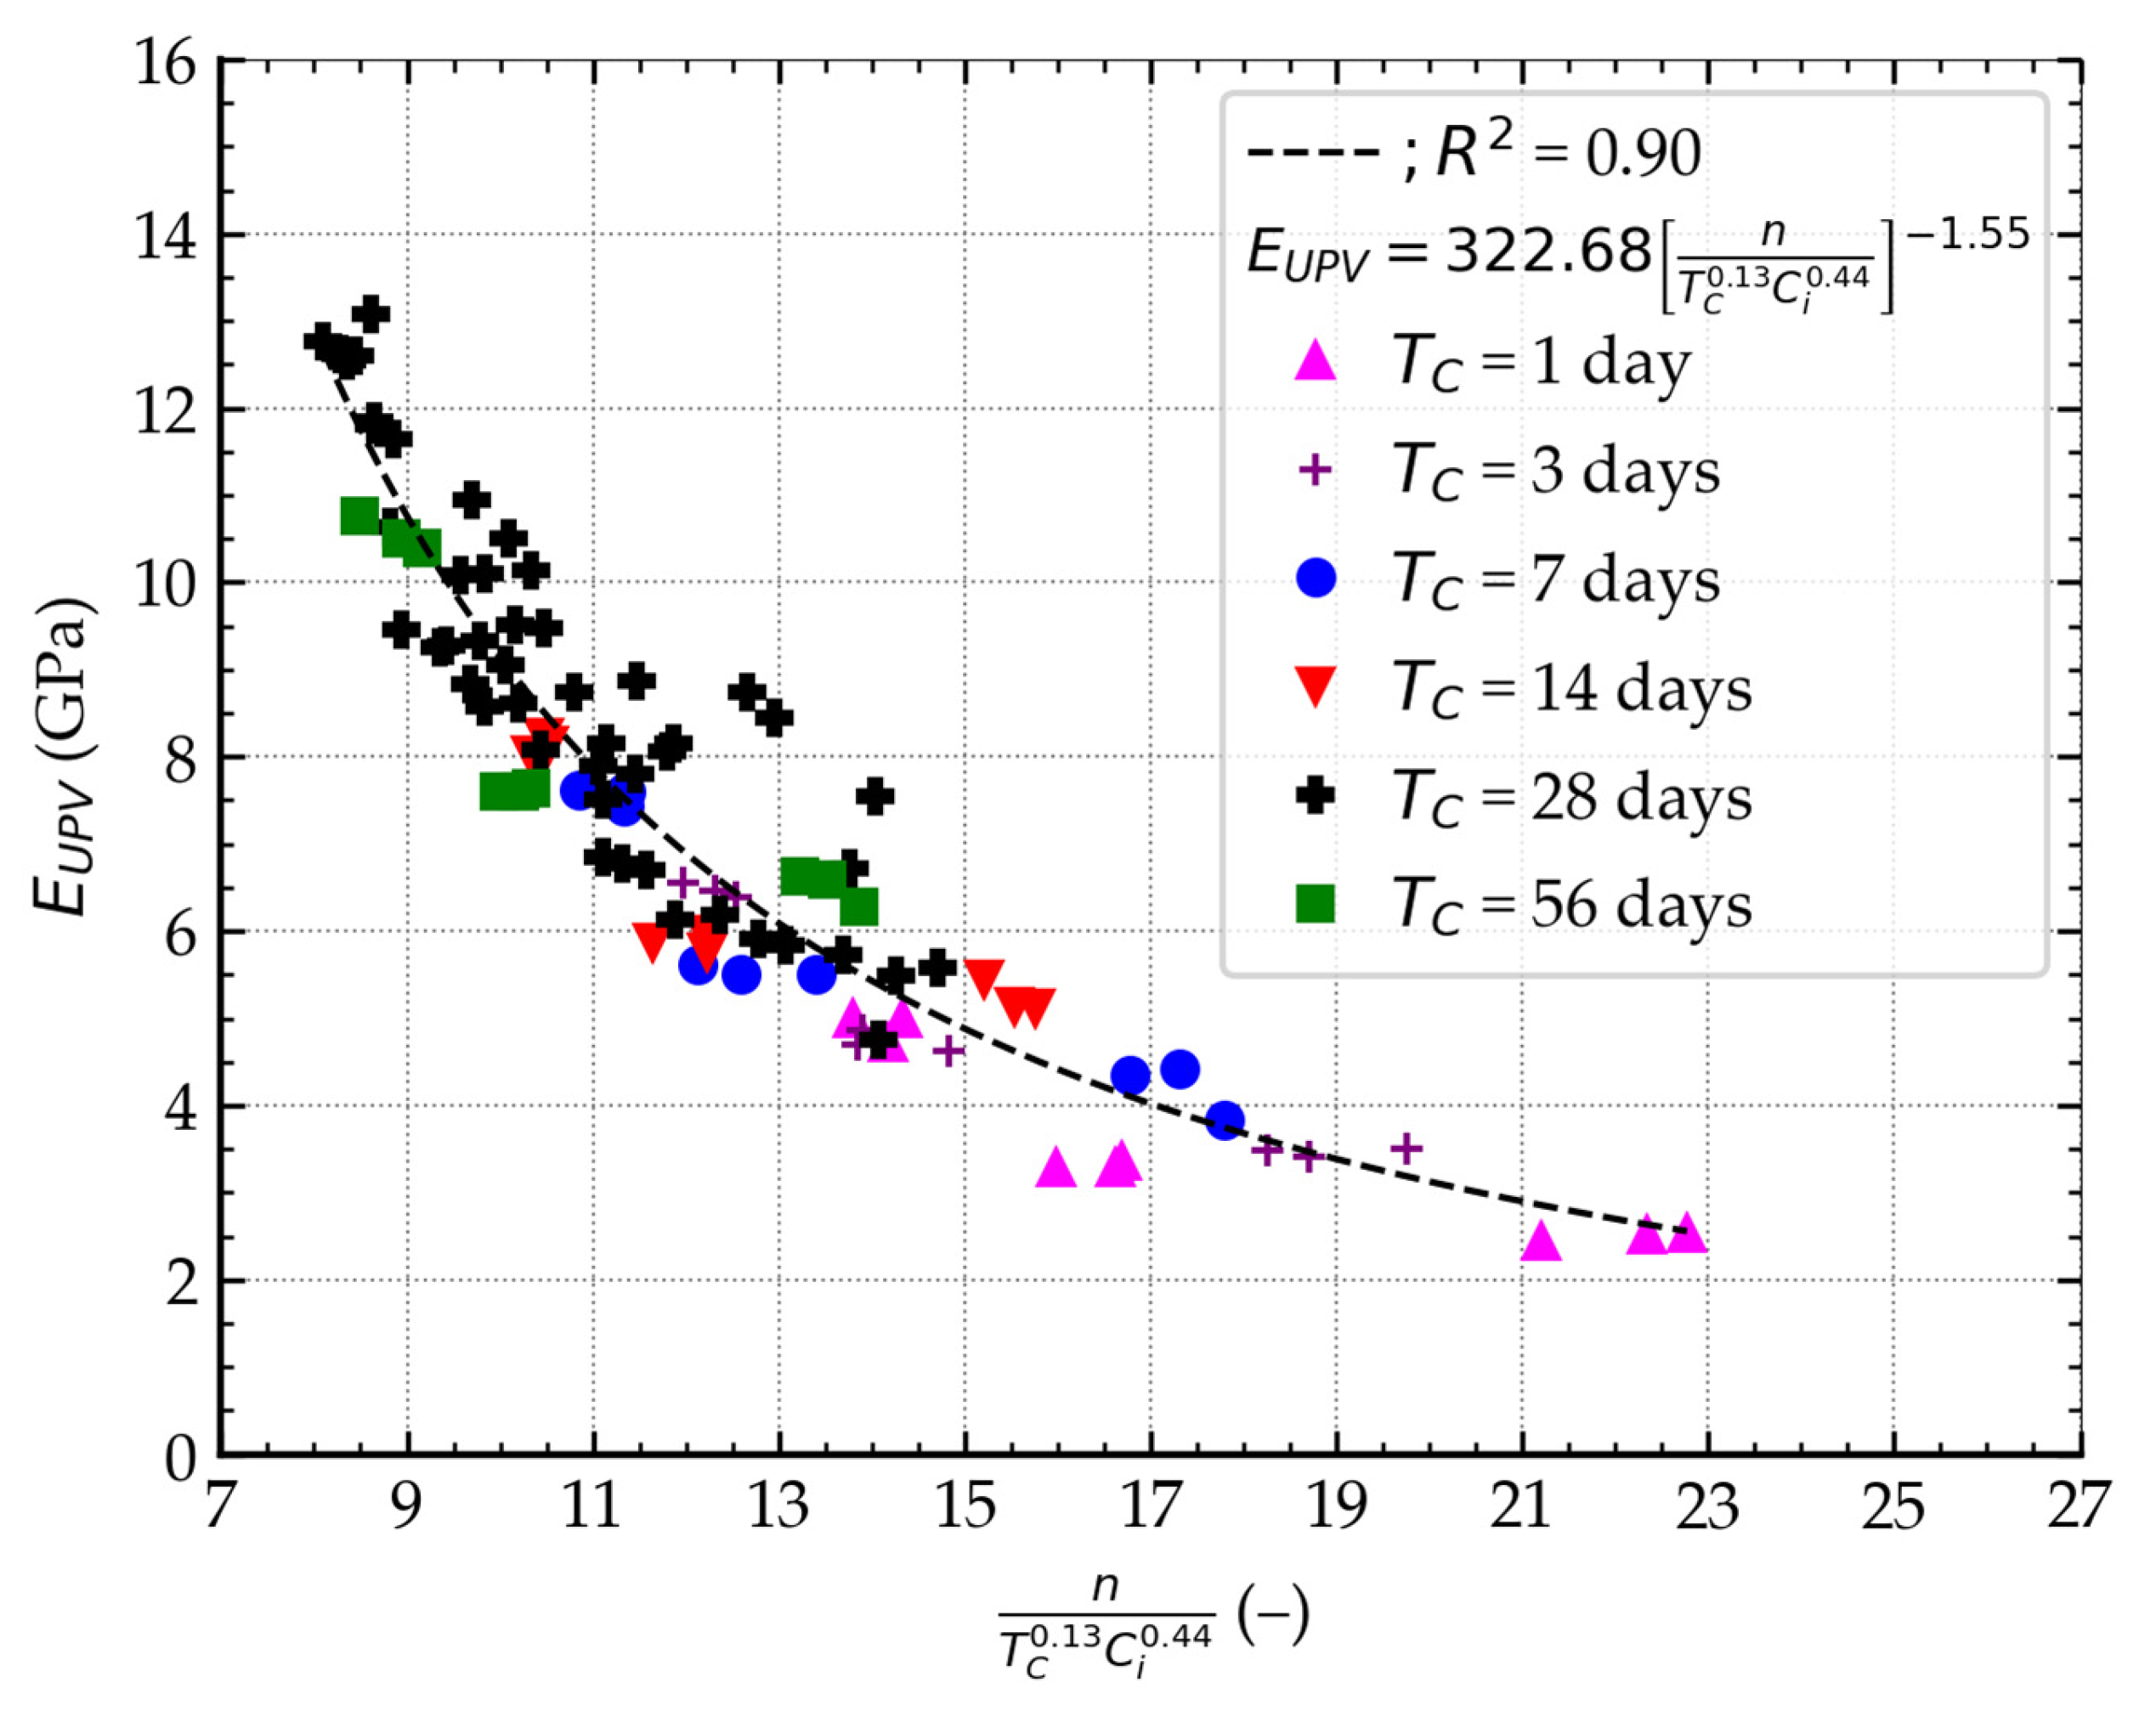
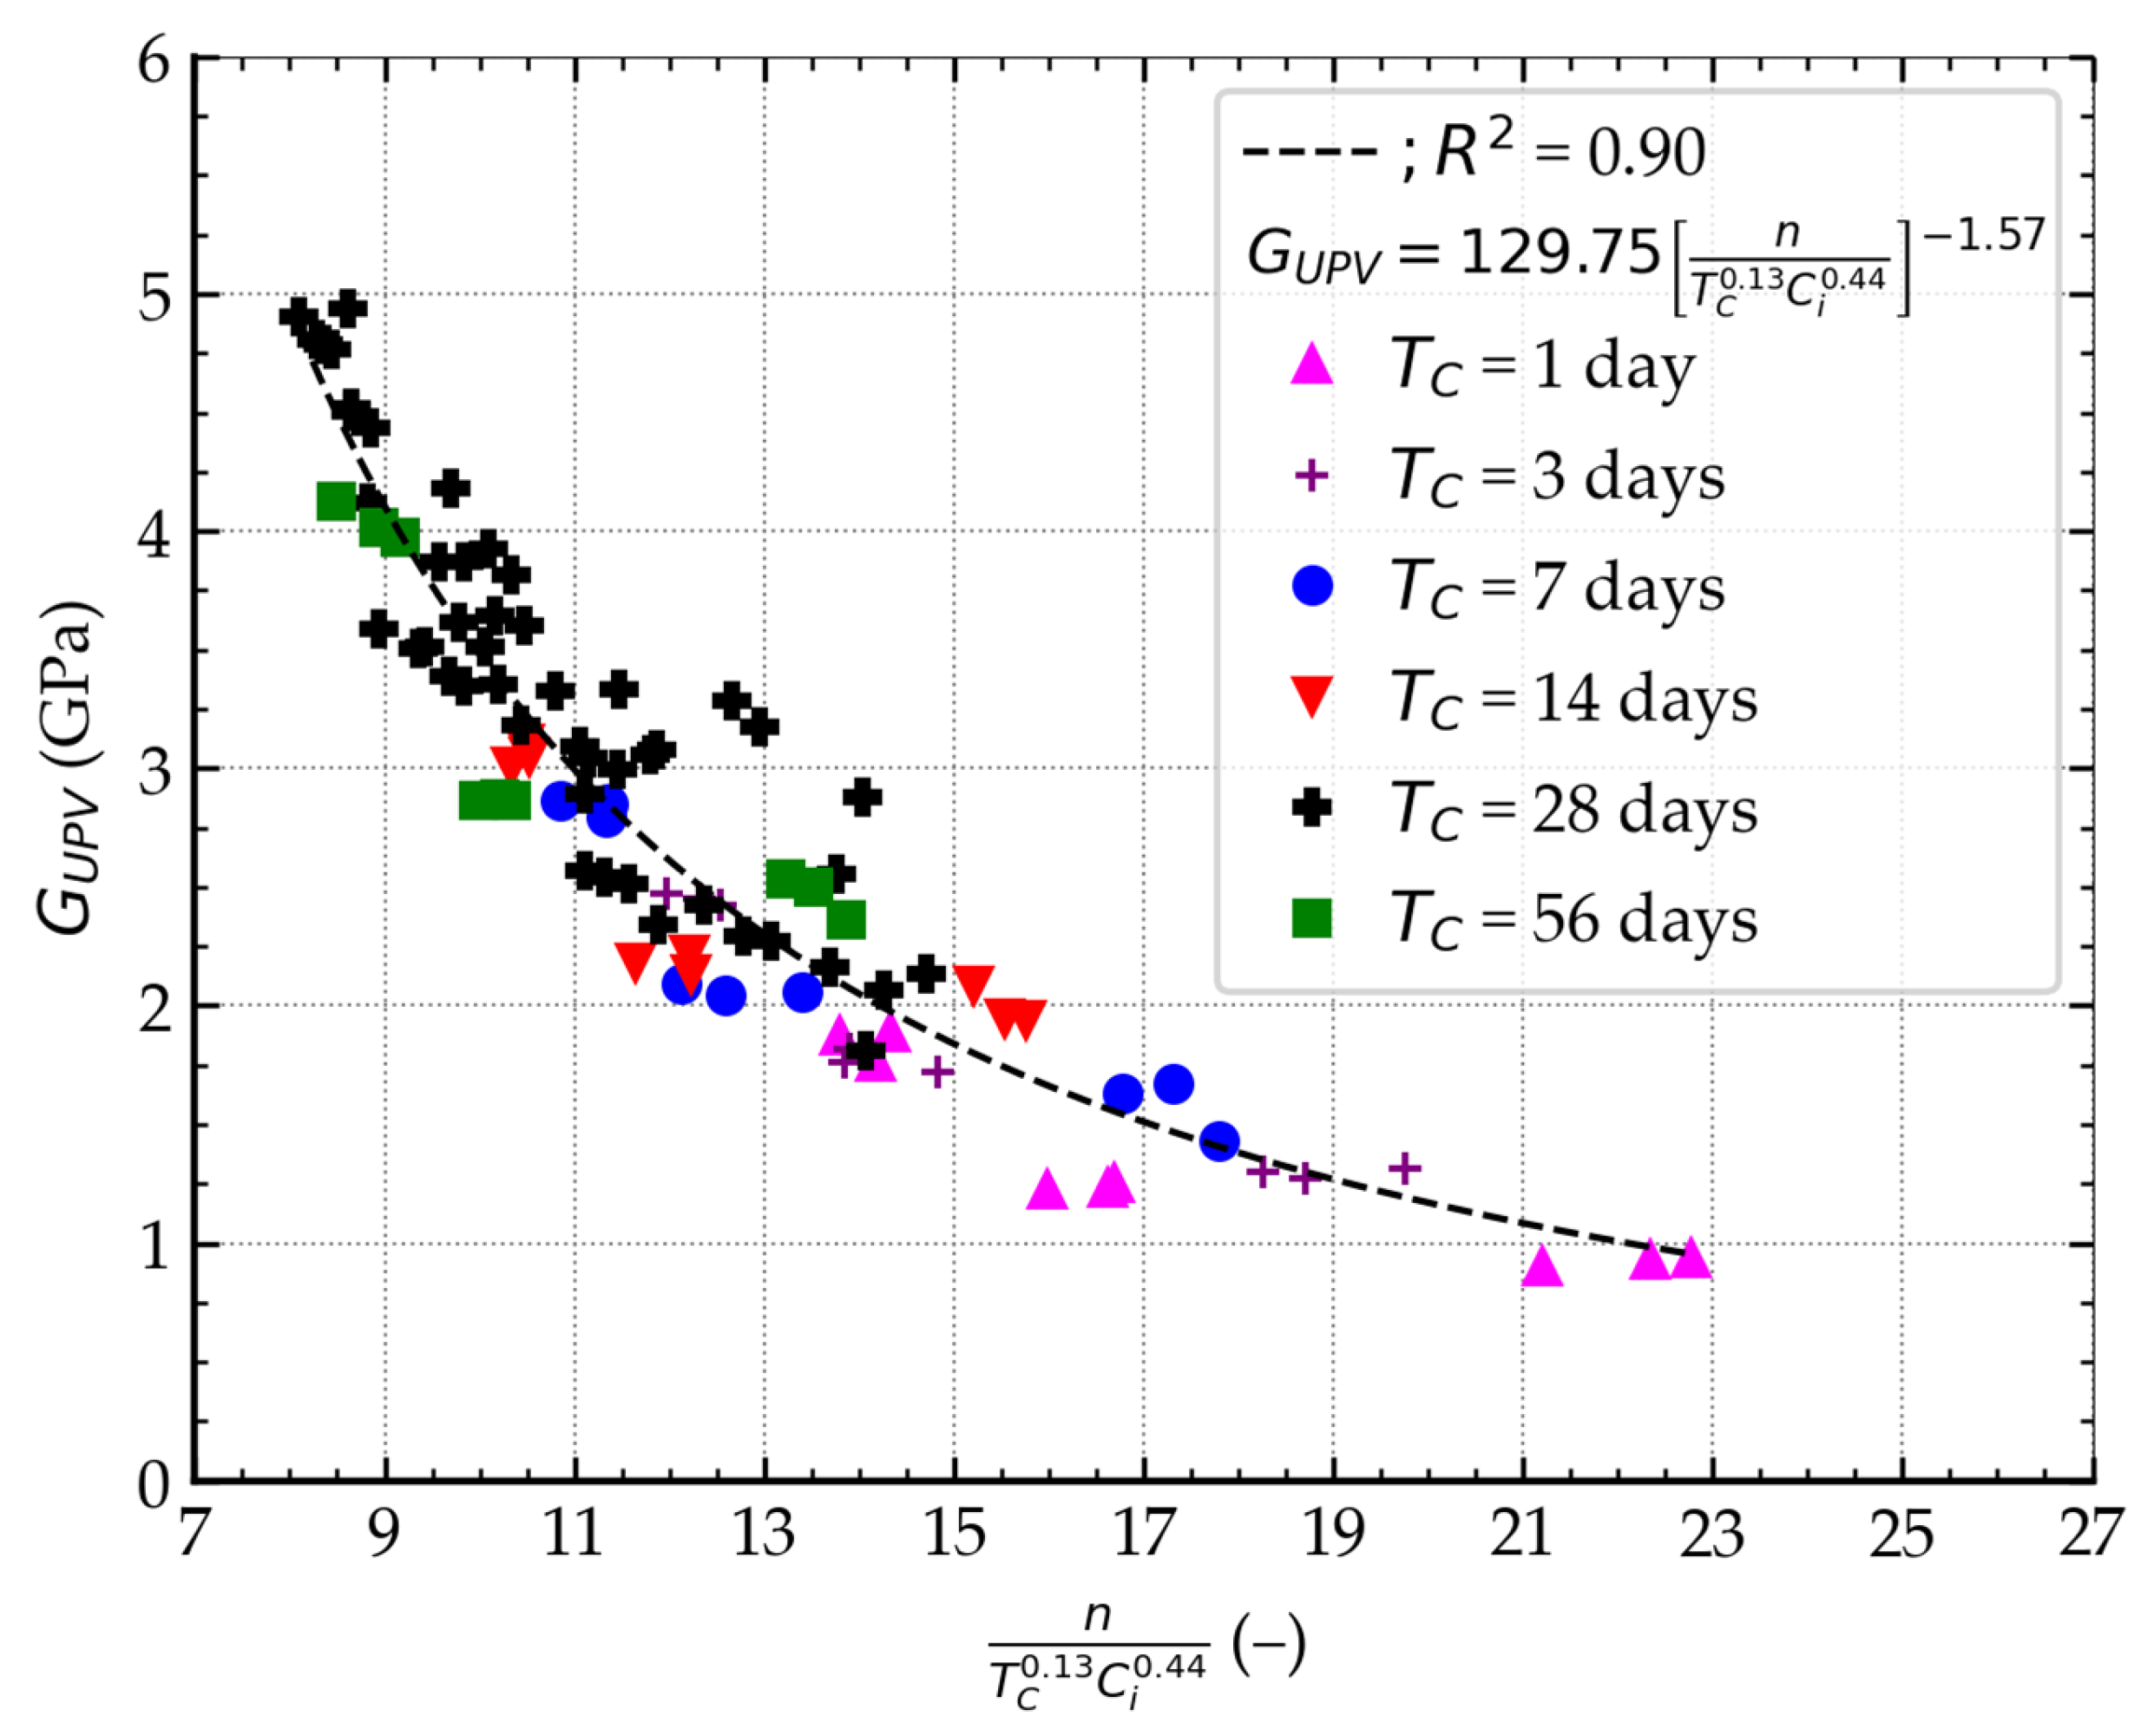
Although unconfined compressive strength is the basic parameter characterizing stabilized soil, its deformation parameters are also important. For this reason, an analysis was conducted to determine whether the equation could be used to predict the deformation parameters of stabilized soil. As part of this process, parameters A and B were recalibrated to achieve the highest possible prediction accuracy. The analysis determined that only parameter A required calibration, and a value of 0.14 was finally adopted.
Based on the presented relationships, it was found that the lowest prediction accuracy was achieved in the case of modules determined based on destructive tests. On the other hand, modules determined based on wave propagation velocity are characterized by greater accuracy. Figure 16 presents the results of the analysis for the E50 module, for which the following error measures were obtained: MAPE = 23.904%, RMSE = 69.780 MPa. Figure 17 illustrates the relationship for the EUPV modulus, which achieved error measures of MAPE = 9.633% and RMSE = 0.830 GPa. Figure 18 shows the empirical relationship for the GUPV modulus, for which the following values were obtained: MAPE = 9.839% and RMSE = 0.317 GPa. The presented results confirm the possibility of using the established relationships to predict deformation parameters.
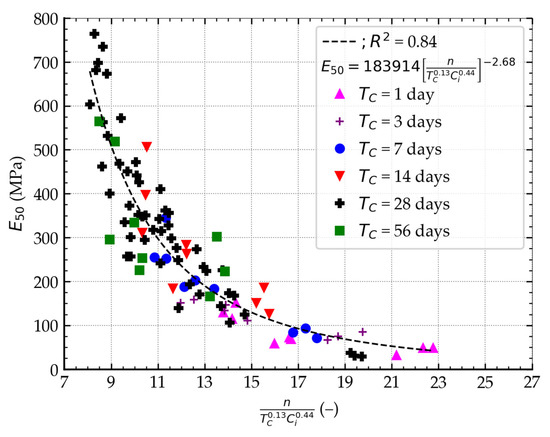
Figure 16.
The influence of porosity, cement index, and curing time on the E50 modulus value.
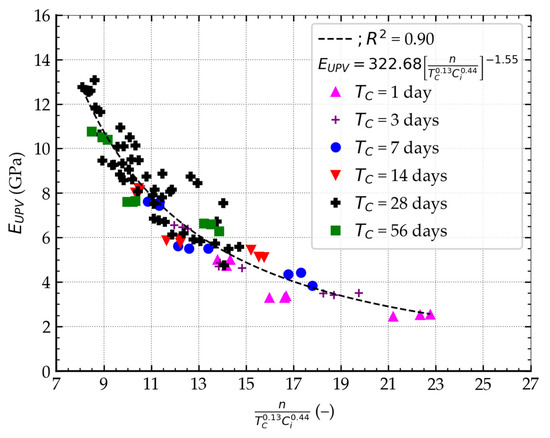
Figure 17.
The influence of porosity, cement index, and curing time on the EUPV modulus value.
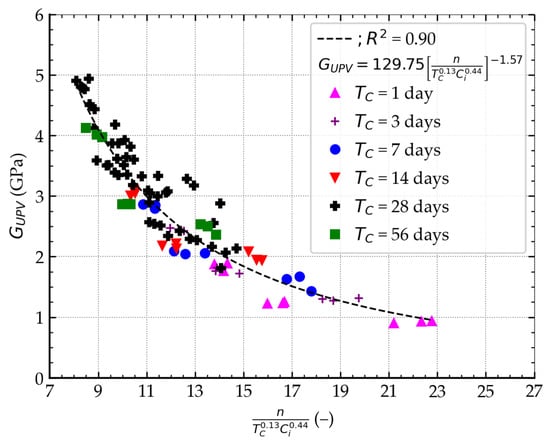
Figure 18.
The influence of porosity, cement index, and curing time on the GUPV modulus value.
3.4. Sensitivity Analysis
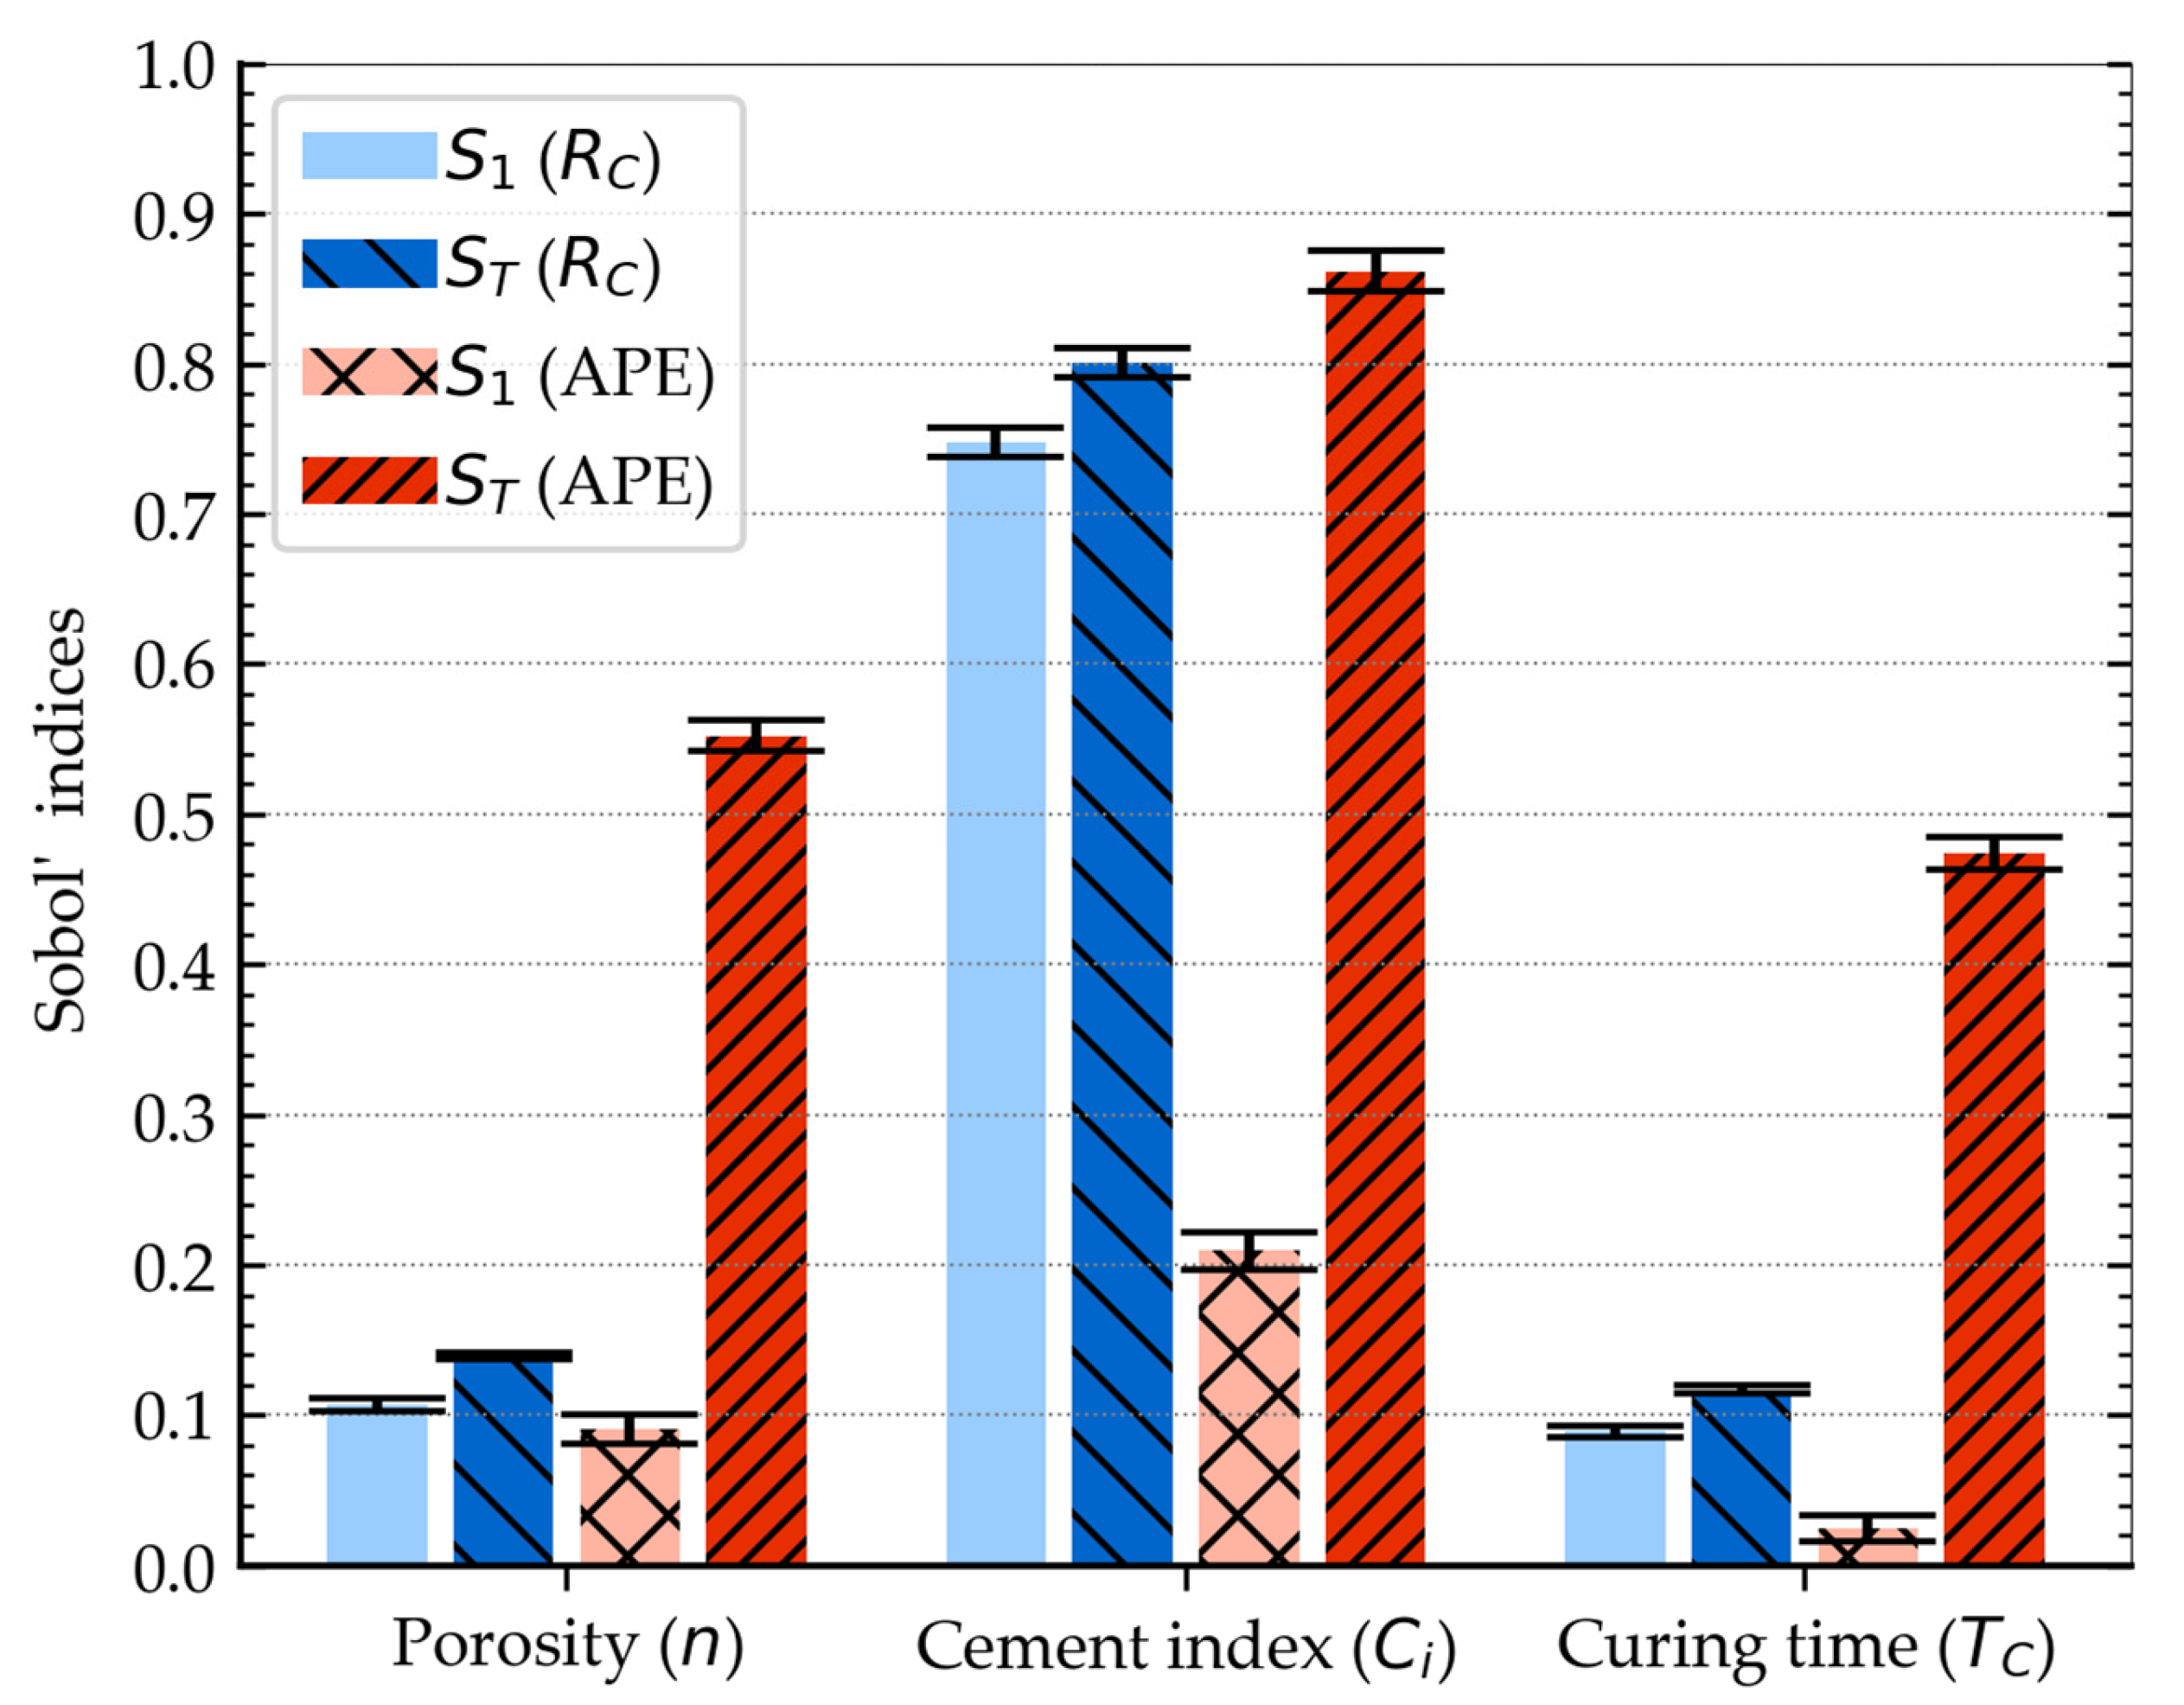
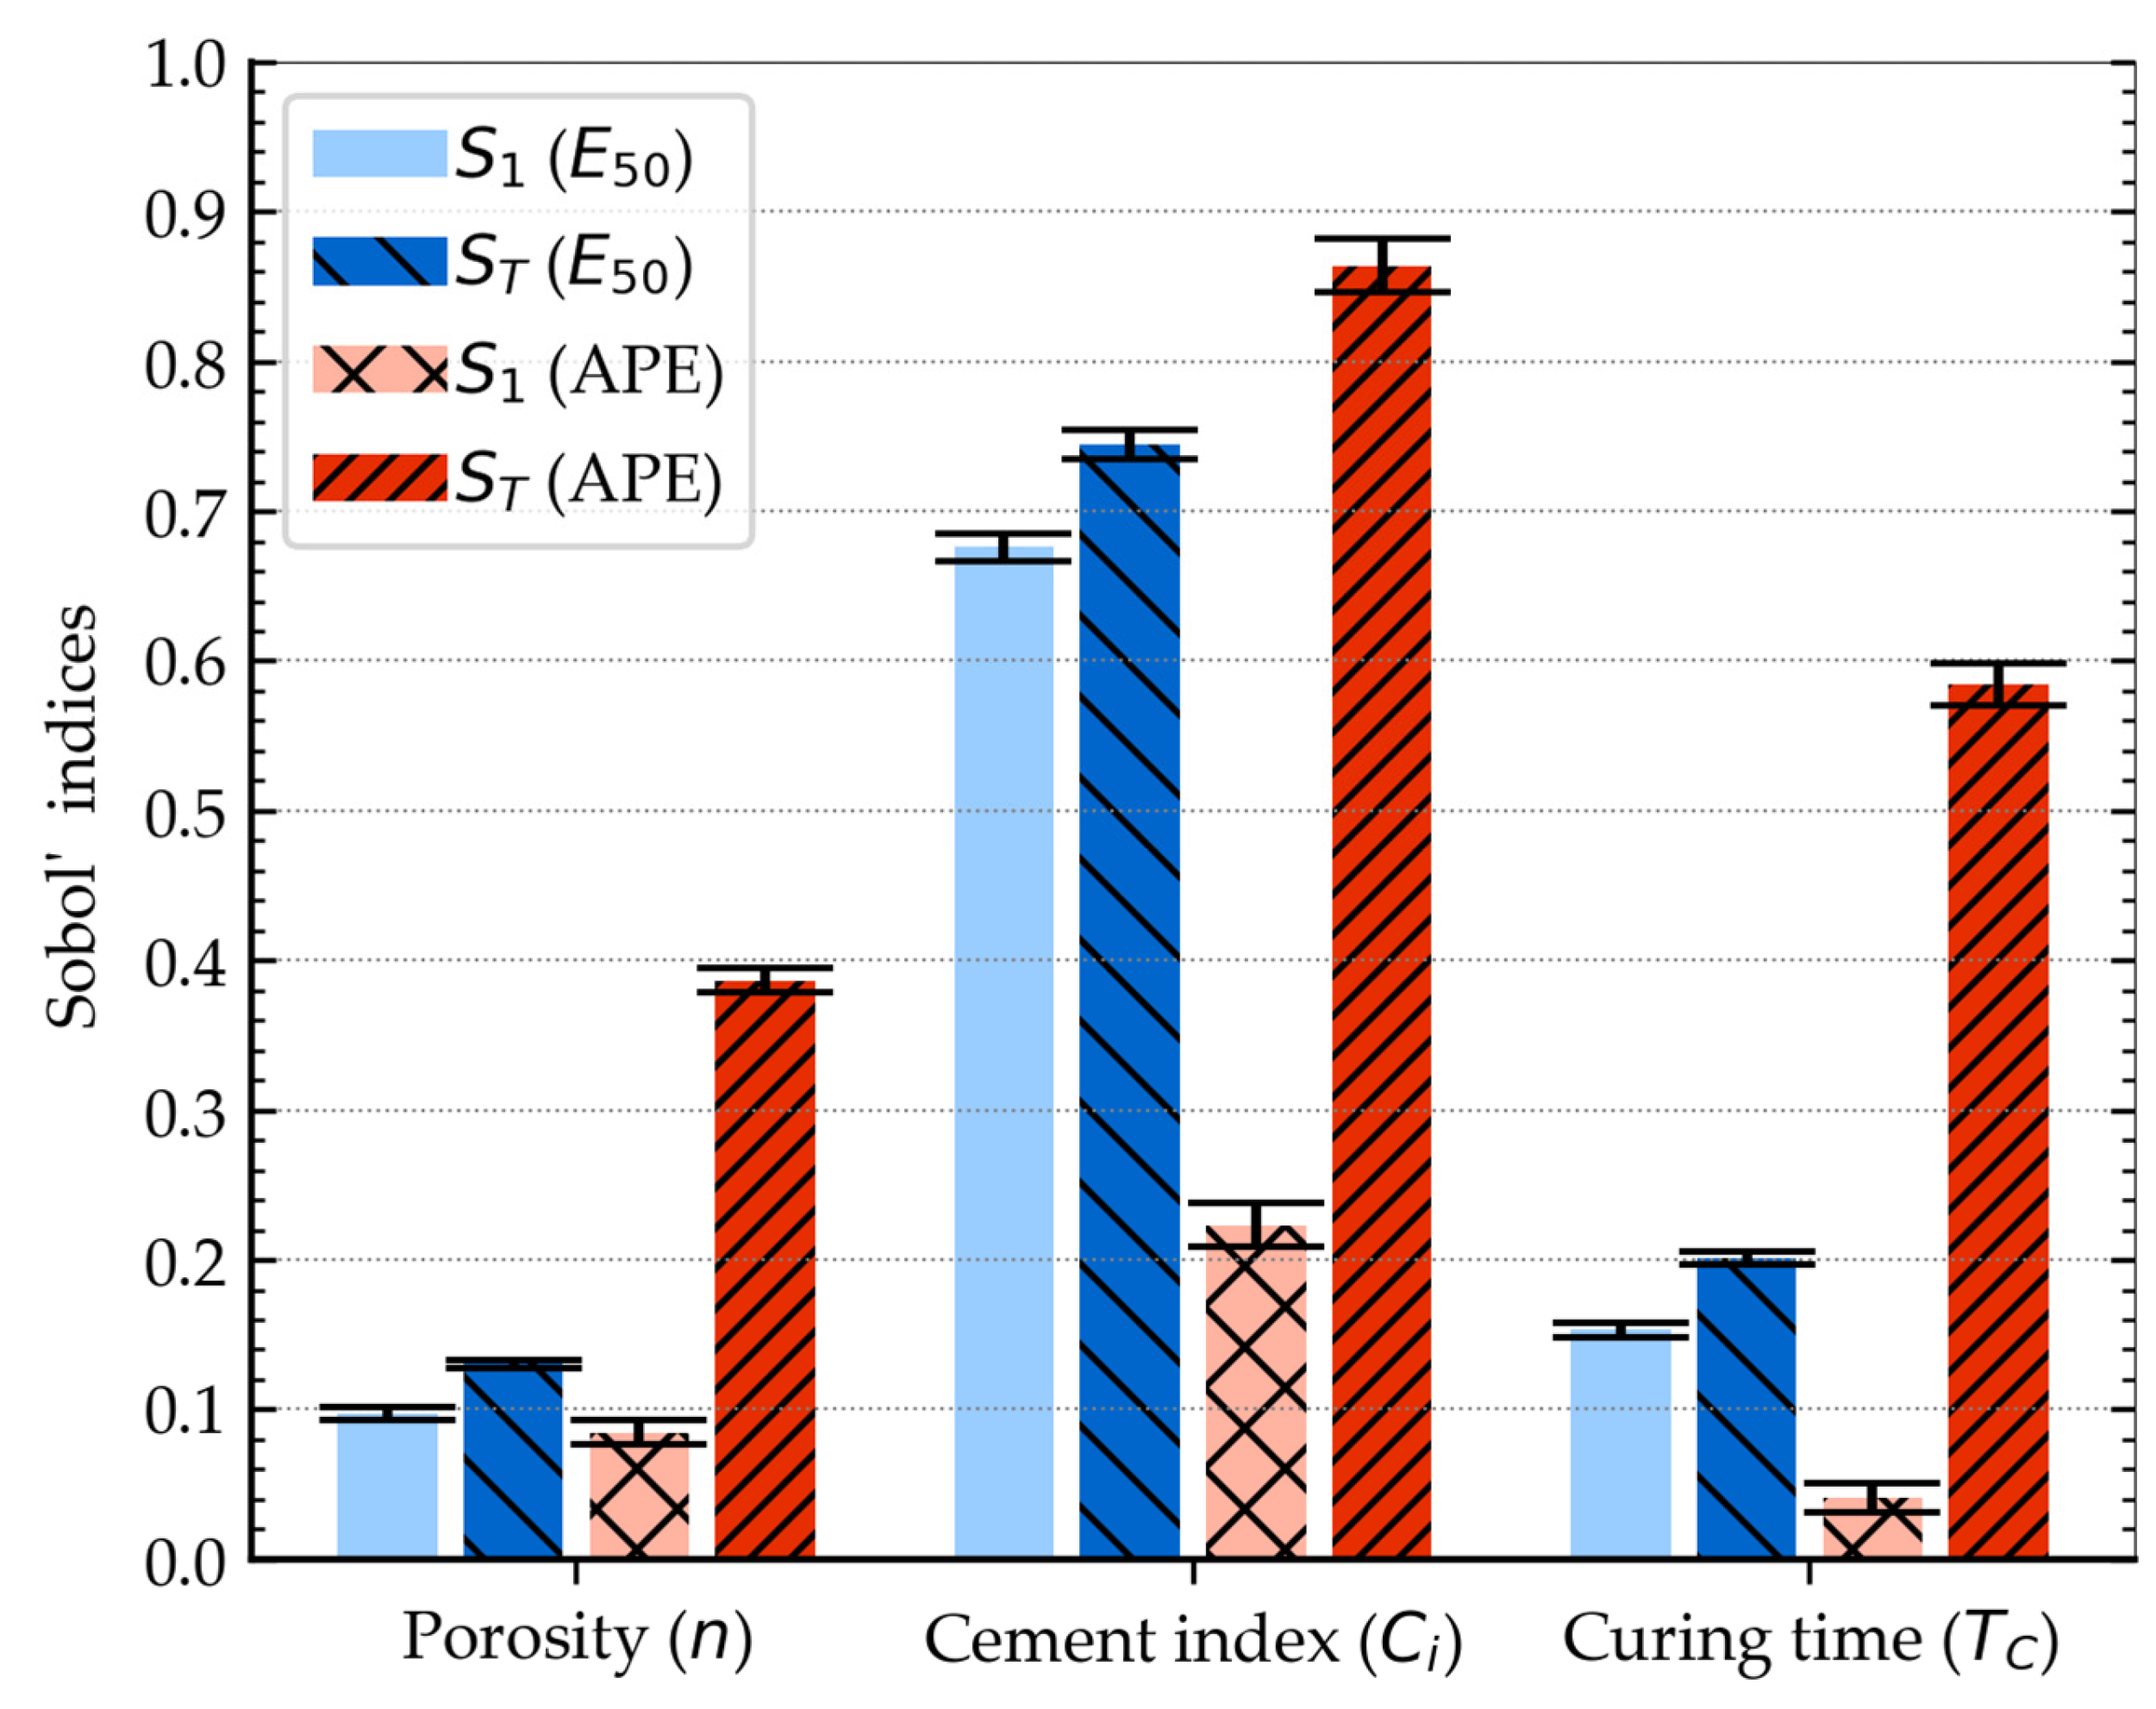
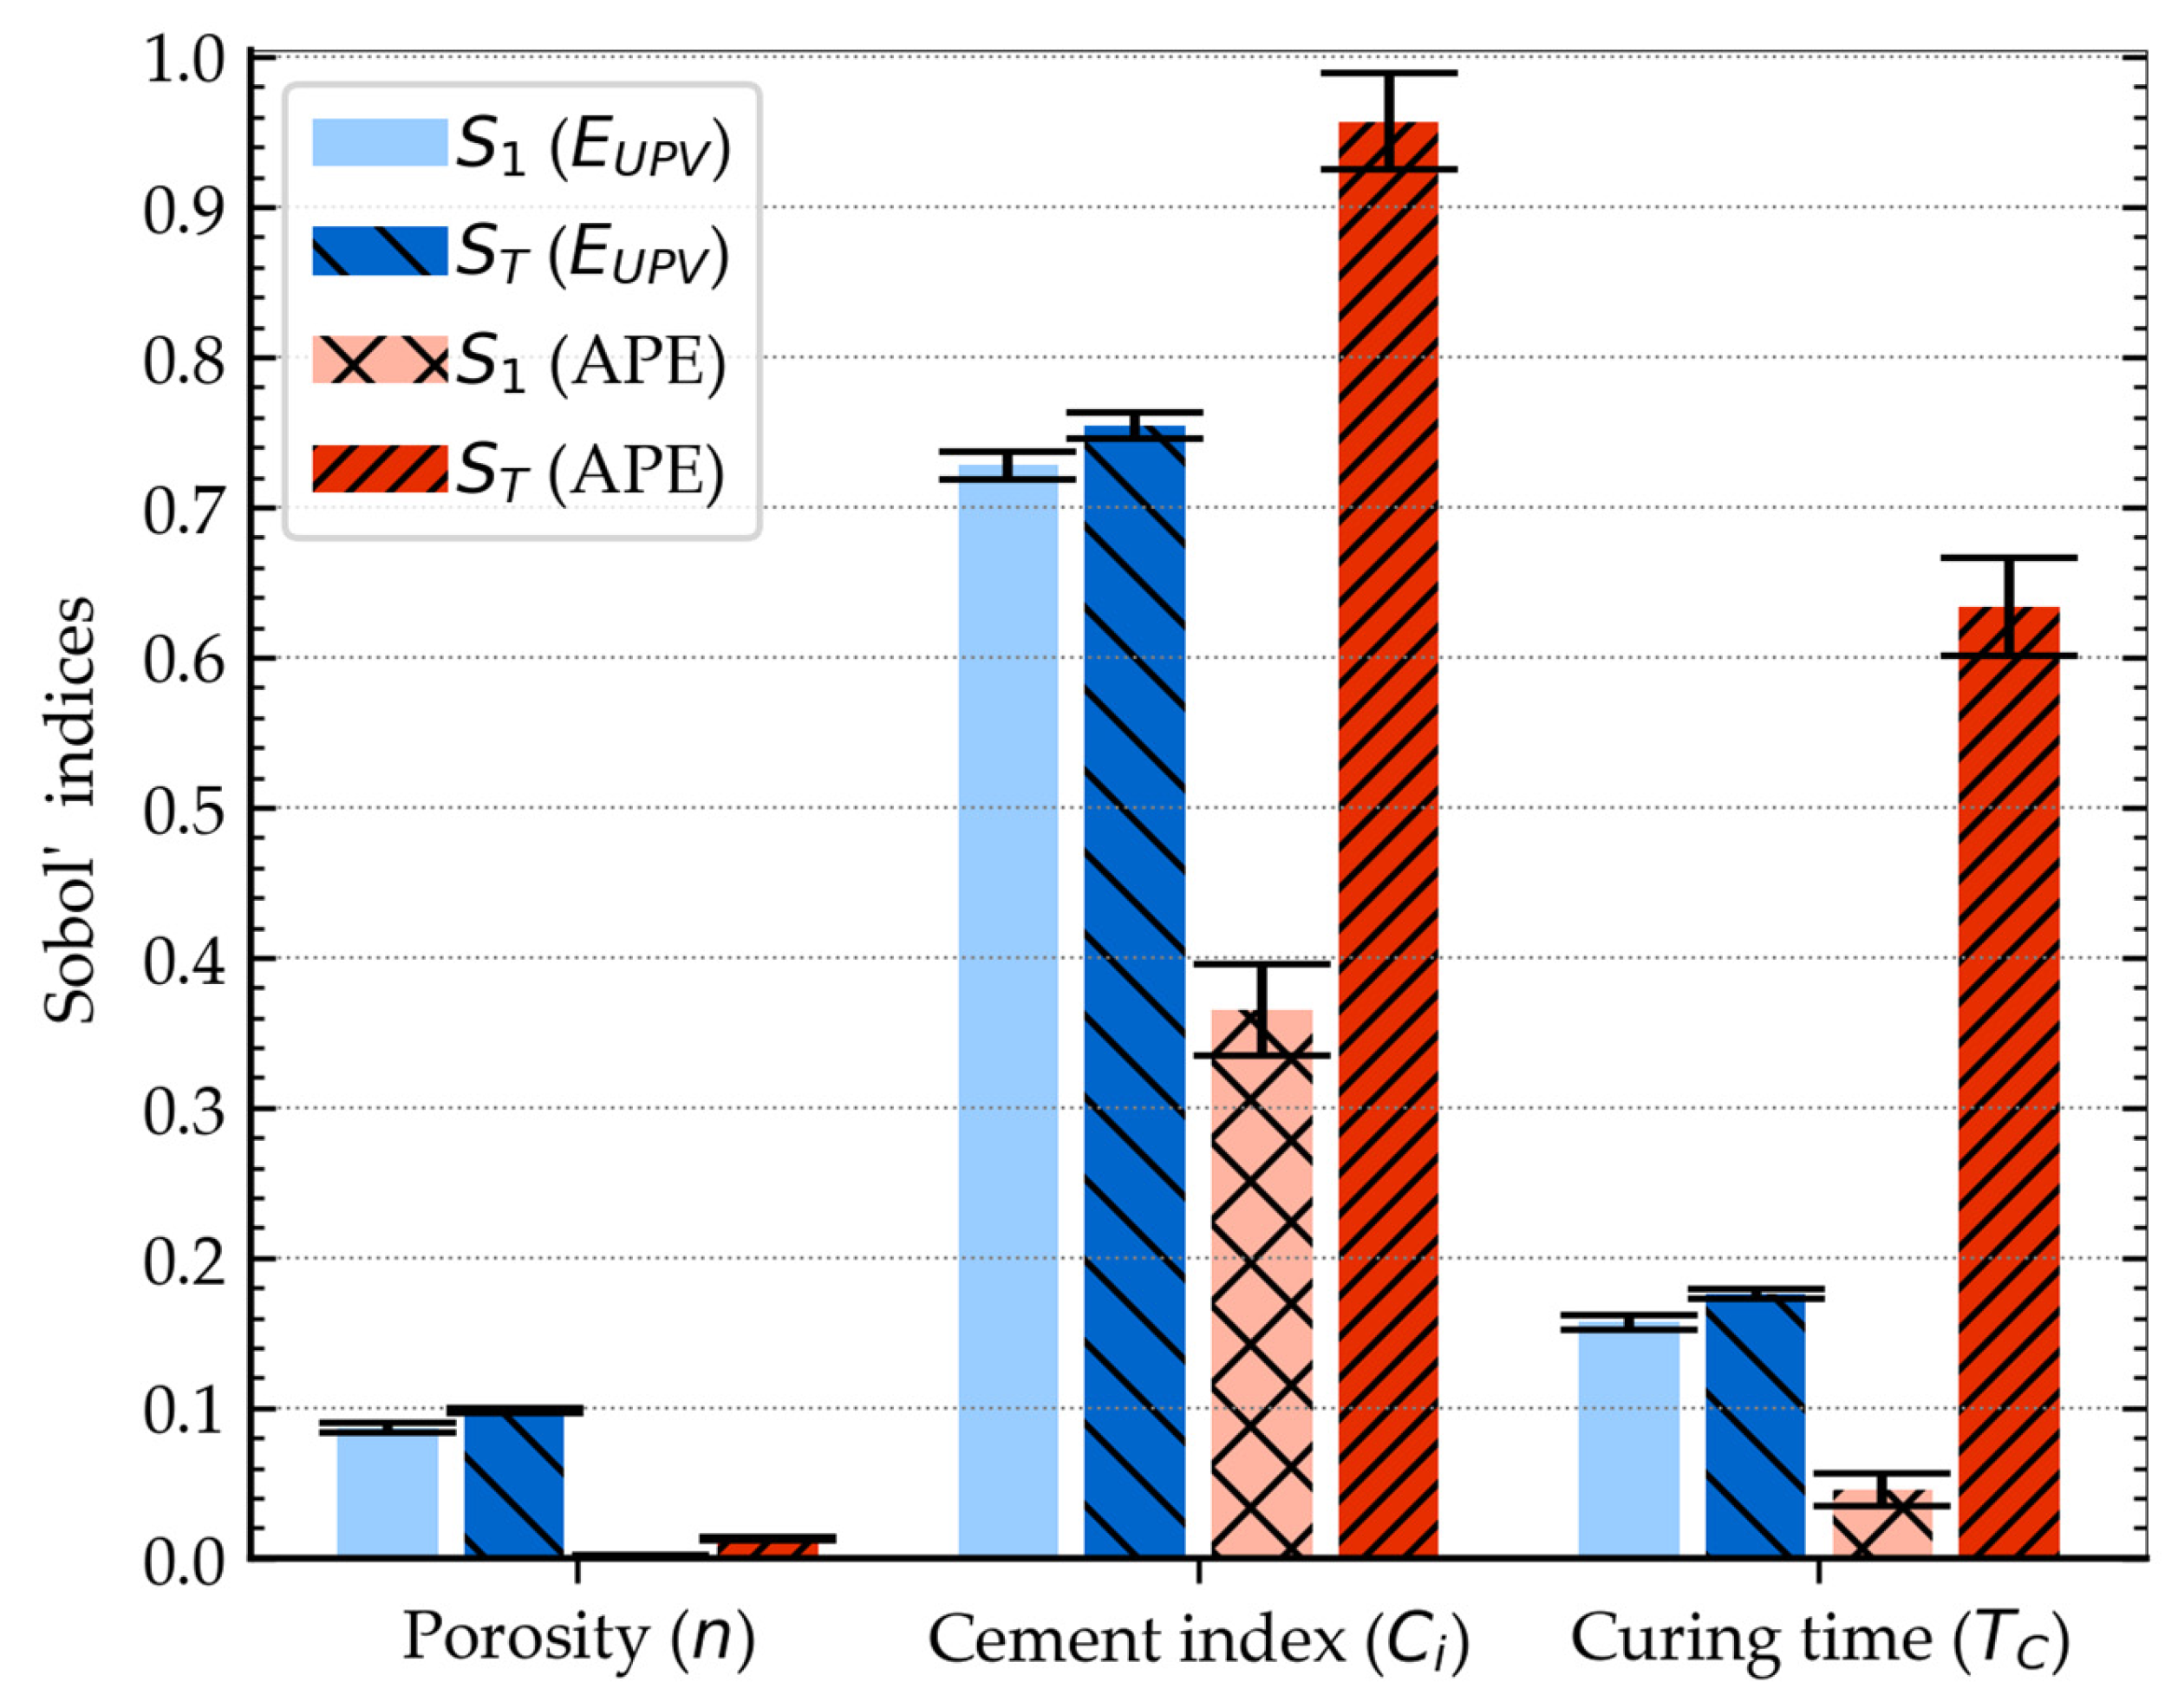
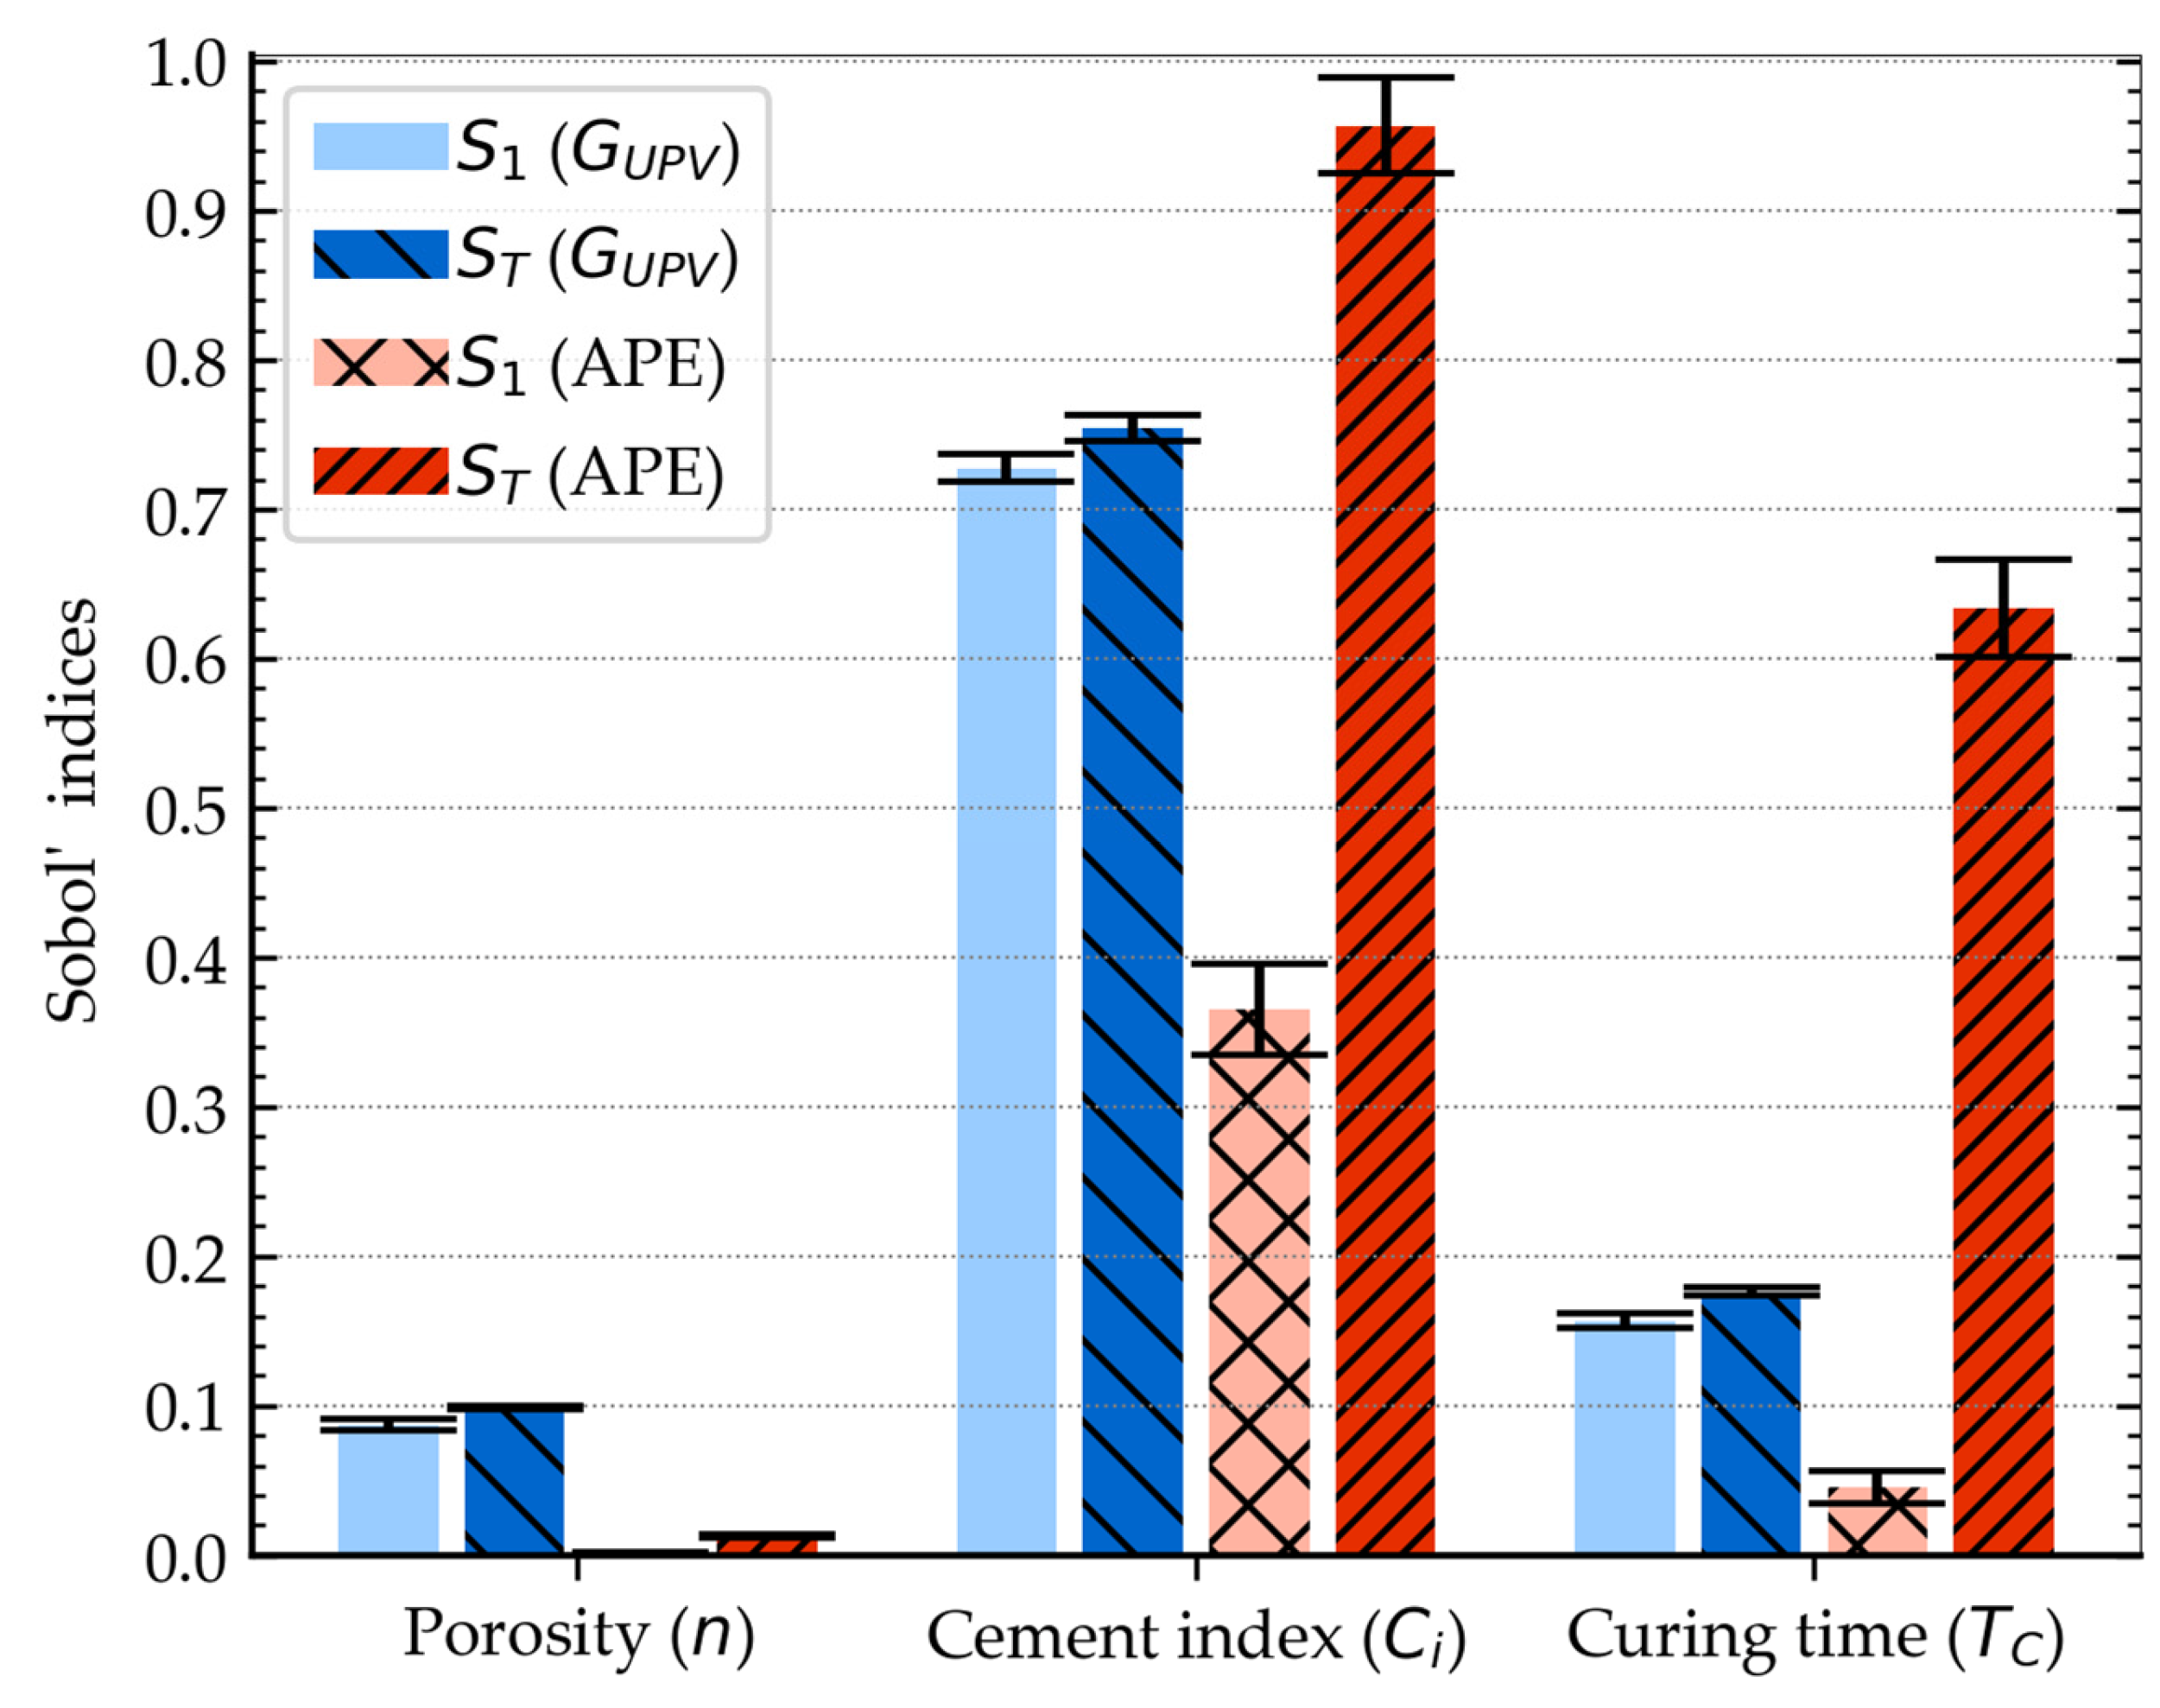
A sensitivity analysis is of key importance because it allows the extent to which each parameter contributes to the generation of output uncertainty to be determined. In this study, a variance-based sensitivity analysis was conducted to assess the extent to which the variability of the input data influences the variability of the output data [61,62]. For this purpose, first-order Sobol indices (S1) and total Sobol indices (ST) were used. First-order Sobol indices allow the identification of those input parameters that have the most significant impact on the variability of results. S1 index values range from 0 to 1, where 0 means that a given variable does not affect the result, while 1 indicates that the variability of this variable is fully responsible for the result. Total Sobol indices enable the assessment of the impact of both individual input variables and their interactions on the total variability of the results. ST values are generally higher than the corresponding S1 values, which results from the inclusion of the effects of interaction between input parameters. The following input parameters were used for the sensitivity analysis: porosity, cement index, and curing time. The following output parameters were analyzed: RC, E50, EUPV, and GUPV. For each of the output parameters listed, an additional analysis was performed to determine the absolute percentage error (APE), which is a measure of the difference between the calculated values and the measured values. The results obtained are presented with 95% confidence intervals. The calculations were performed in Python (v3.9.12) using the SALib library, which allows the determination of Sobol indices [63].
The empirical relationship shown in Figure 14 was analyzed first. The analysis showed that the cement index has the most significant impact on the strength of stabilized soil, as presented in Figure 19. The determined Sobol index values indicate both a substantial direct effect and a significant contribution of interactions with other variables. On the other hand, porosity and curing time have a minor impact and interaction with different variables. Subsequently, an analysis of the sources of errors was conducted, which indicated that the cement index has a significantly smaller direct impact on prediction errors than on the strength of stabilized soil. A similar phenomenon was observed for the other parameters. However, although the direct effects of individual parameters have decreased, the impact of their interaction with different parameters on model errors has increased significantly.
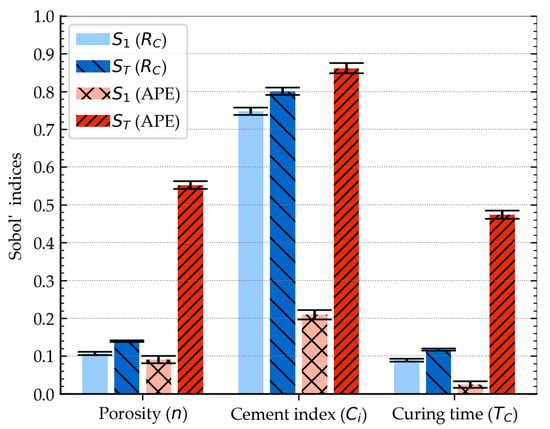
Figure 19.
Sobol indices for RC.
Subsequently, an analysis of the impact of each variable on the predicted deformation parameters was performed, based on the empirical relationships presented in Section 3.3. Sobol indices were calculated for the deformation modules E50, Eᵤₚᵥ, and Gᵤₚᵥ, and their results are presented in Figure 20, Figure 21 and Figure 22, respectively. Based on the results obtained, it was found that the cement index has a dominant influence on the values of the analyzed moduli. At the same time, porosity and curing time are less important in the prediction process. A similar relationship was observed for all analyzed deformation parameters. In addition, the APE analysis showed that the values of errors are influenced to a much greater extent by interactions between variables than by their direct effects. Therefore, the prediction error is primarily shaped by the interaction of input variables, while their individual influences are of secondary importance.
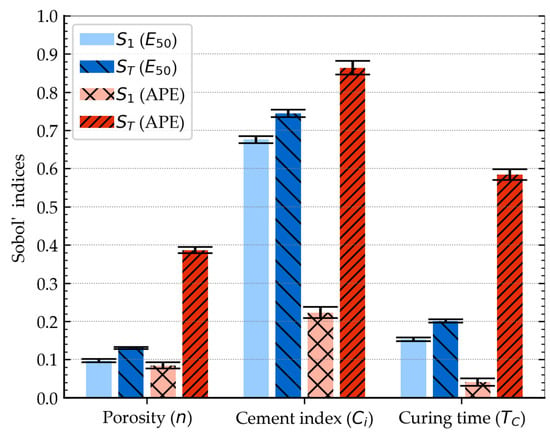
Figure 20.
Sobol indices for E50 modulus.
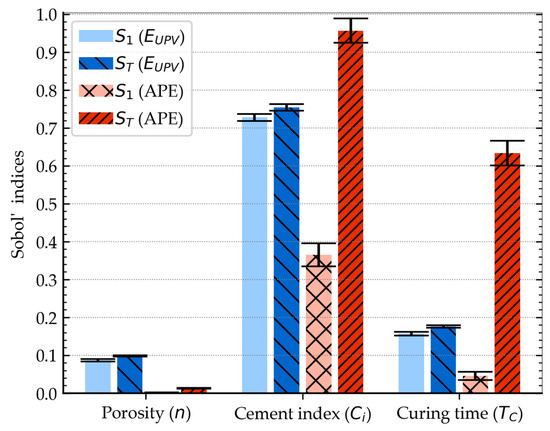
Figure 21.
Sobol indices for EUPV modulus.
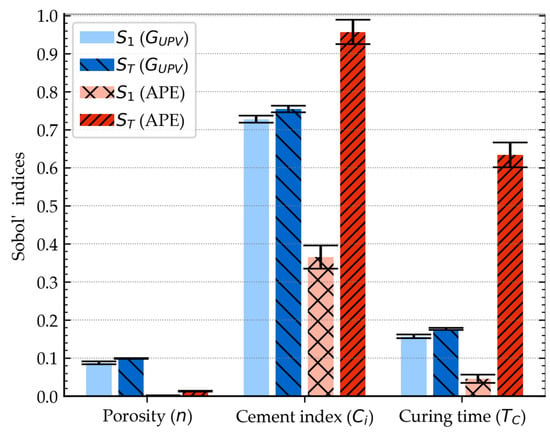
Figure 22.
Sobol indices for GUPV modulus.
4. Practical Applications
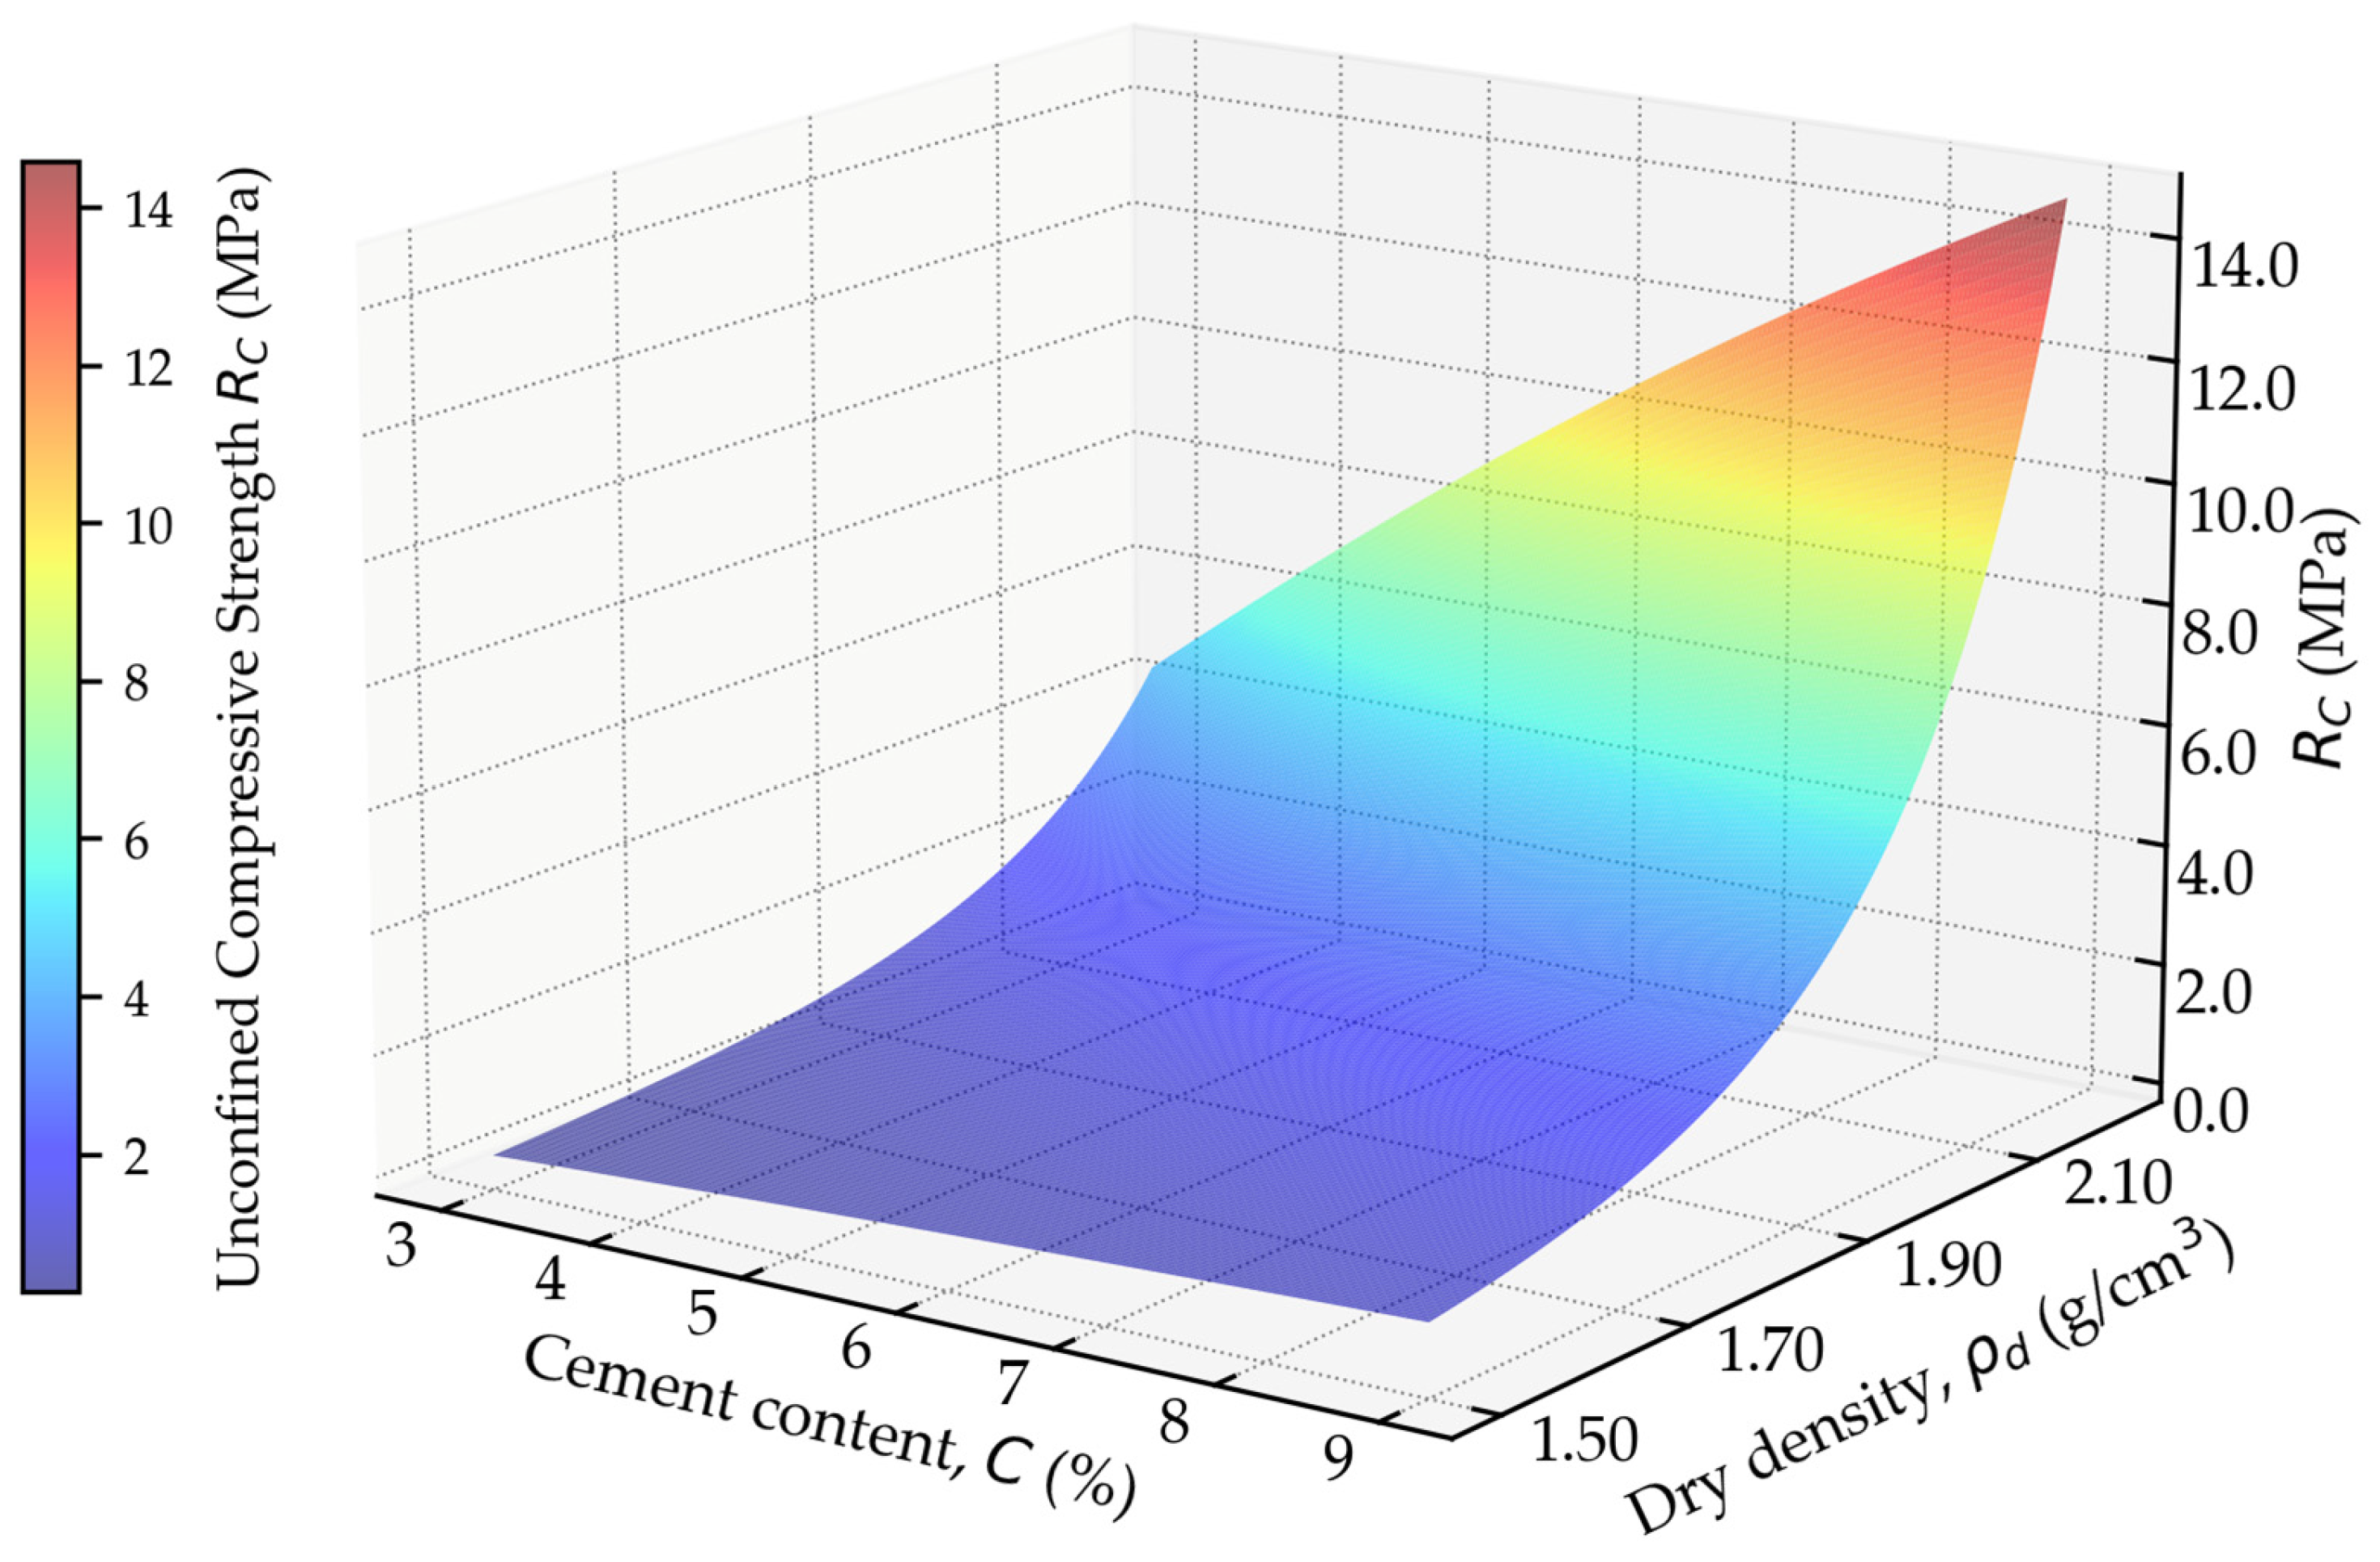
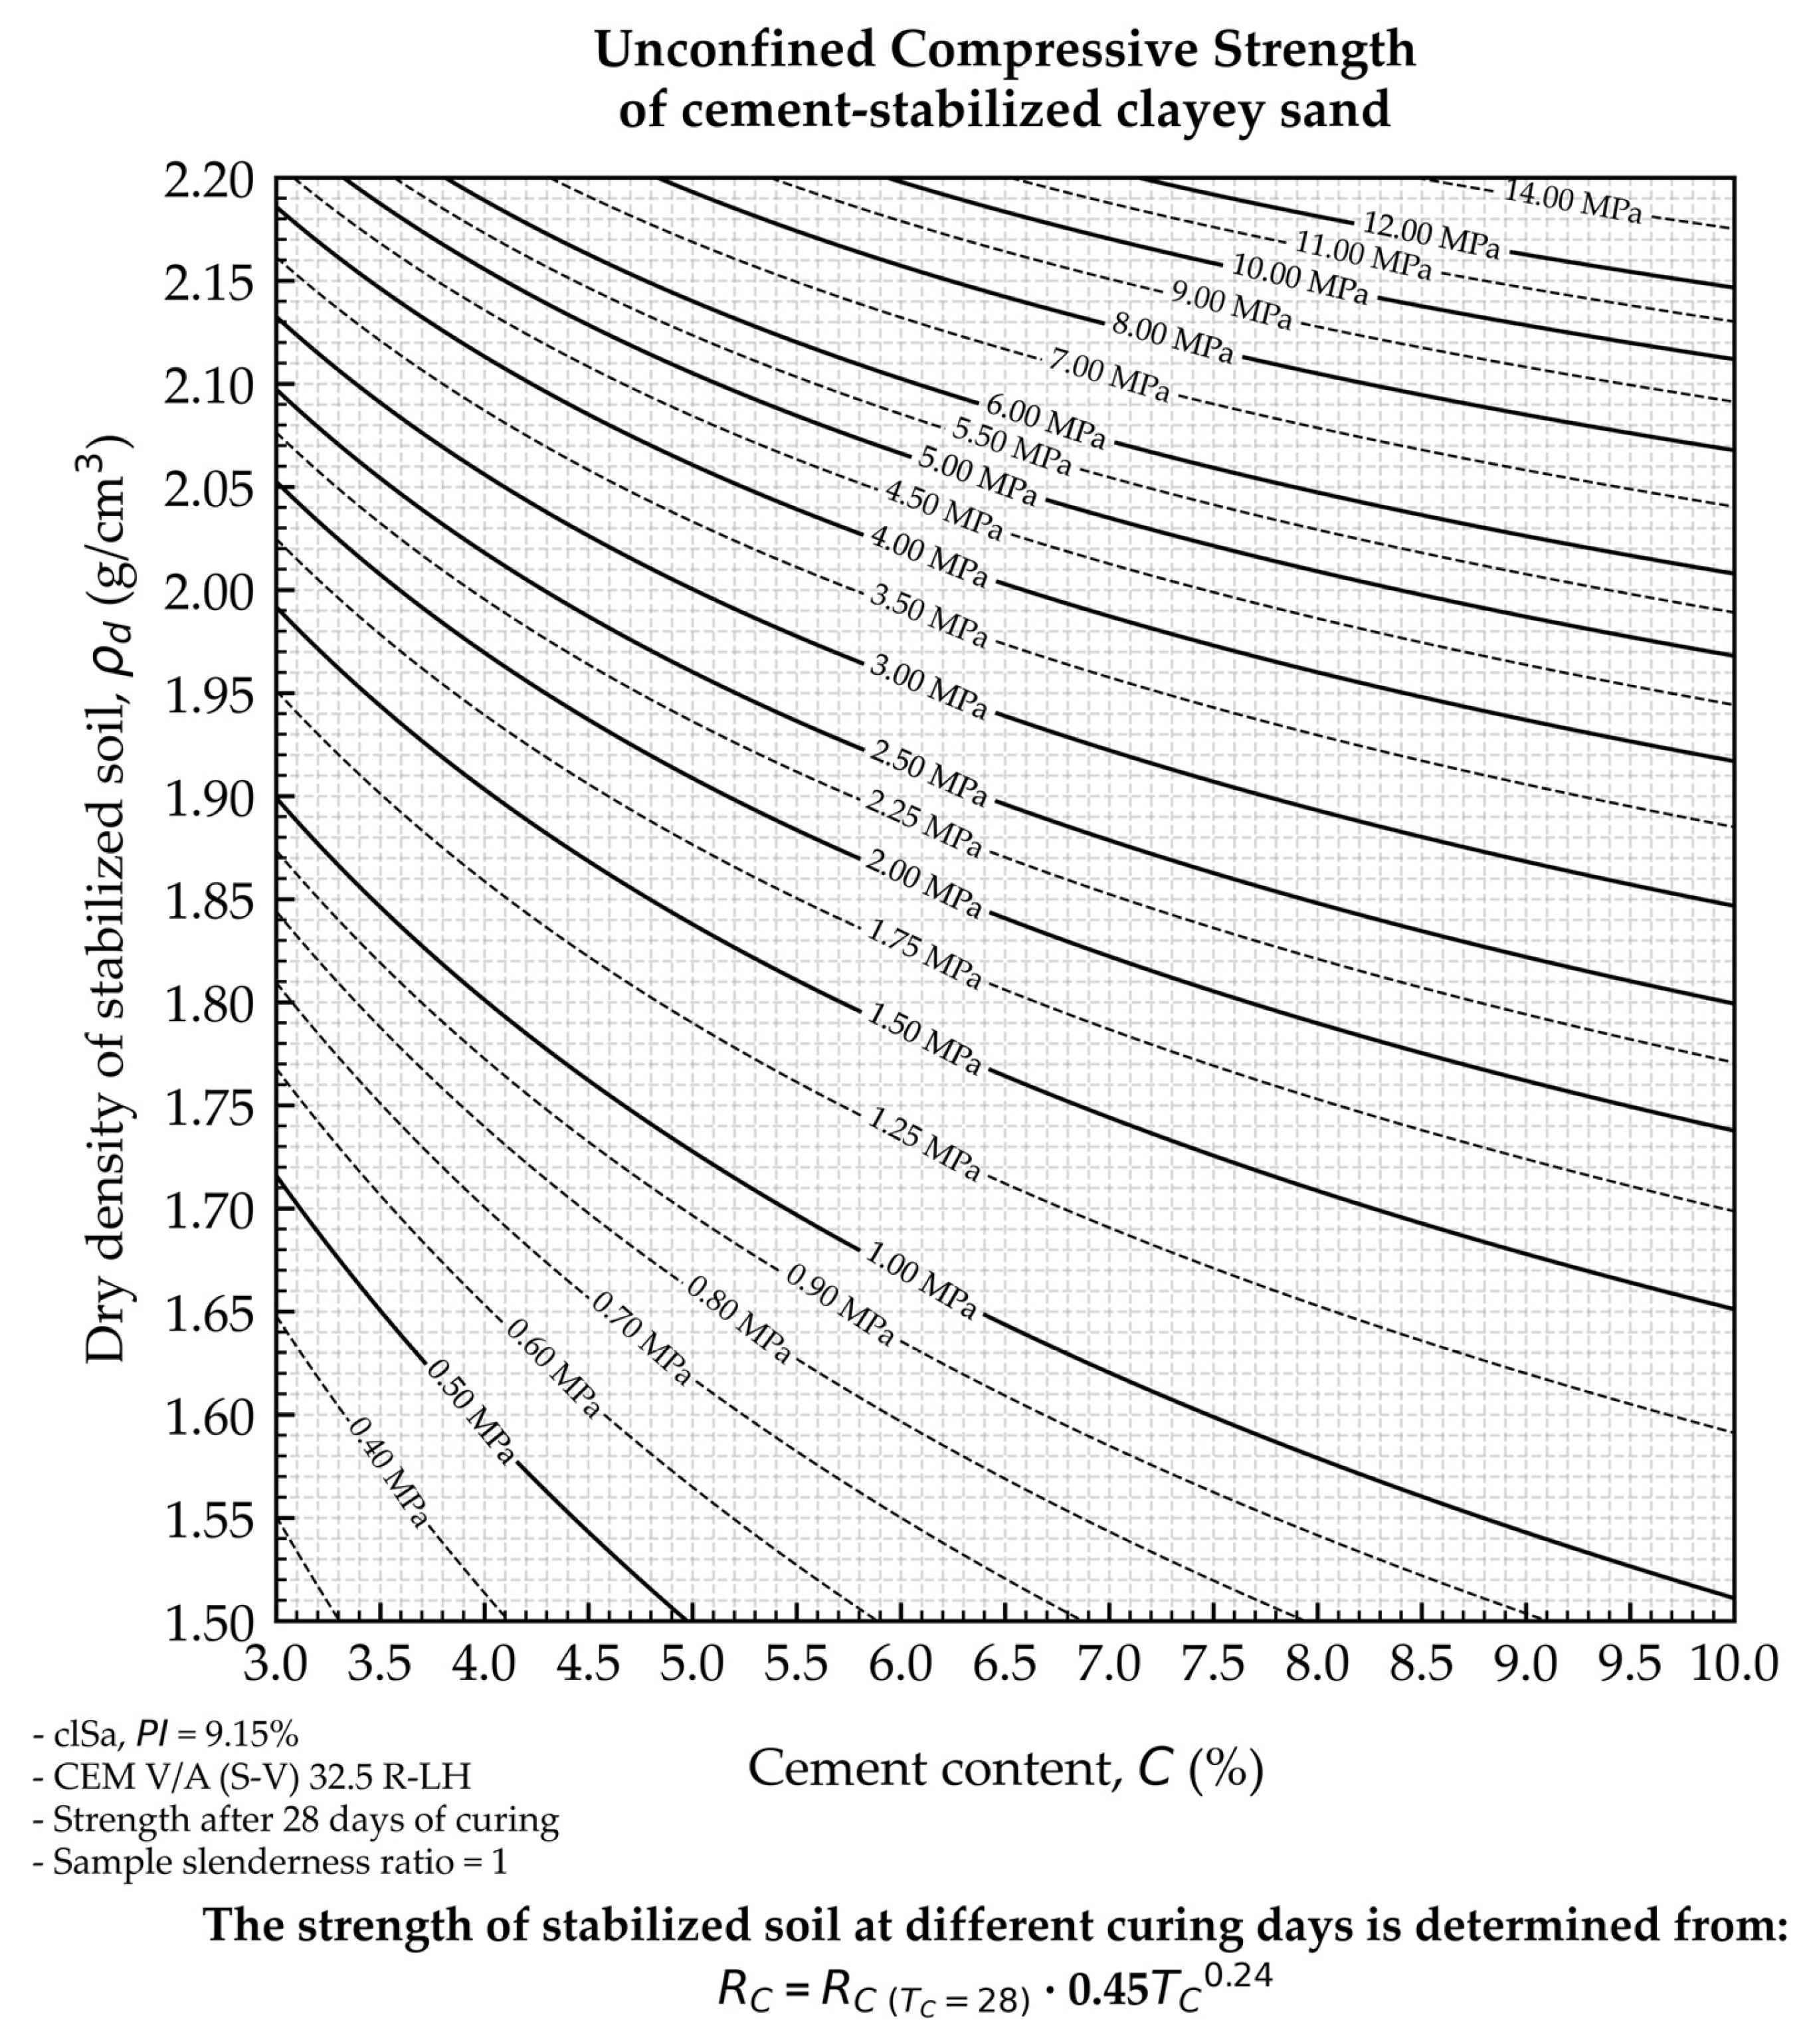
To simplify the use of the proposed method for predicting the strength of stabilized soil, a nomogram has been developed to determine unconfined compressive strength. Only knowledge of the percentage of cement in the mixture and the dry density of the mix is required to use it. In addition, an equation describing the change in strength over time has been derived in accordance with the proposed model. During the creation of the nomogram, the first step was to determine how the predicted strength after 28 days of curing varies as a function of cement content and dry density of the mixture. It was assumed that these parameters would be variables in porosity and cement index. On this basis, the relationship between strength and cement content and dry density of the mixture was determined, which is described by Equation (9), where a = 0.25787541, b = −5.0245922, c = 0.38574654, and is shown in Figure 23.
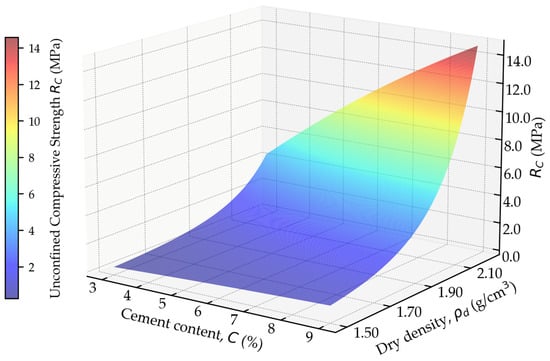
Figure 23.
The influence of dry density and cement on predicted strength.
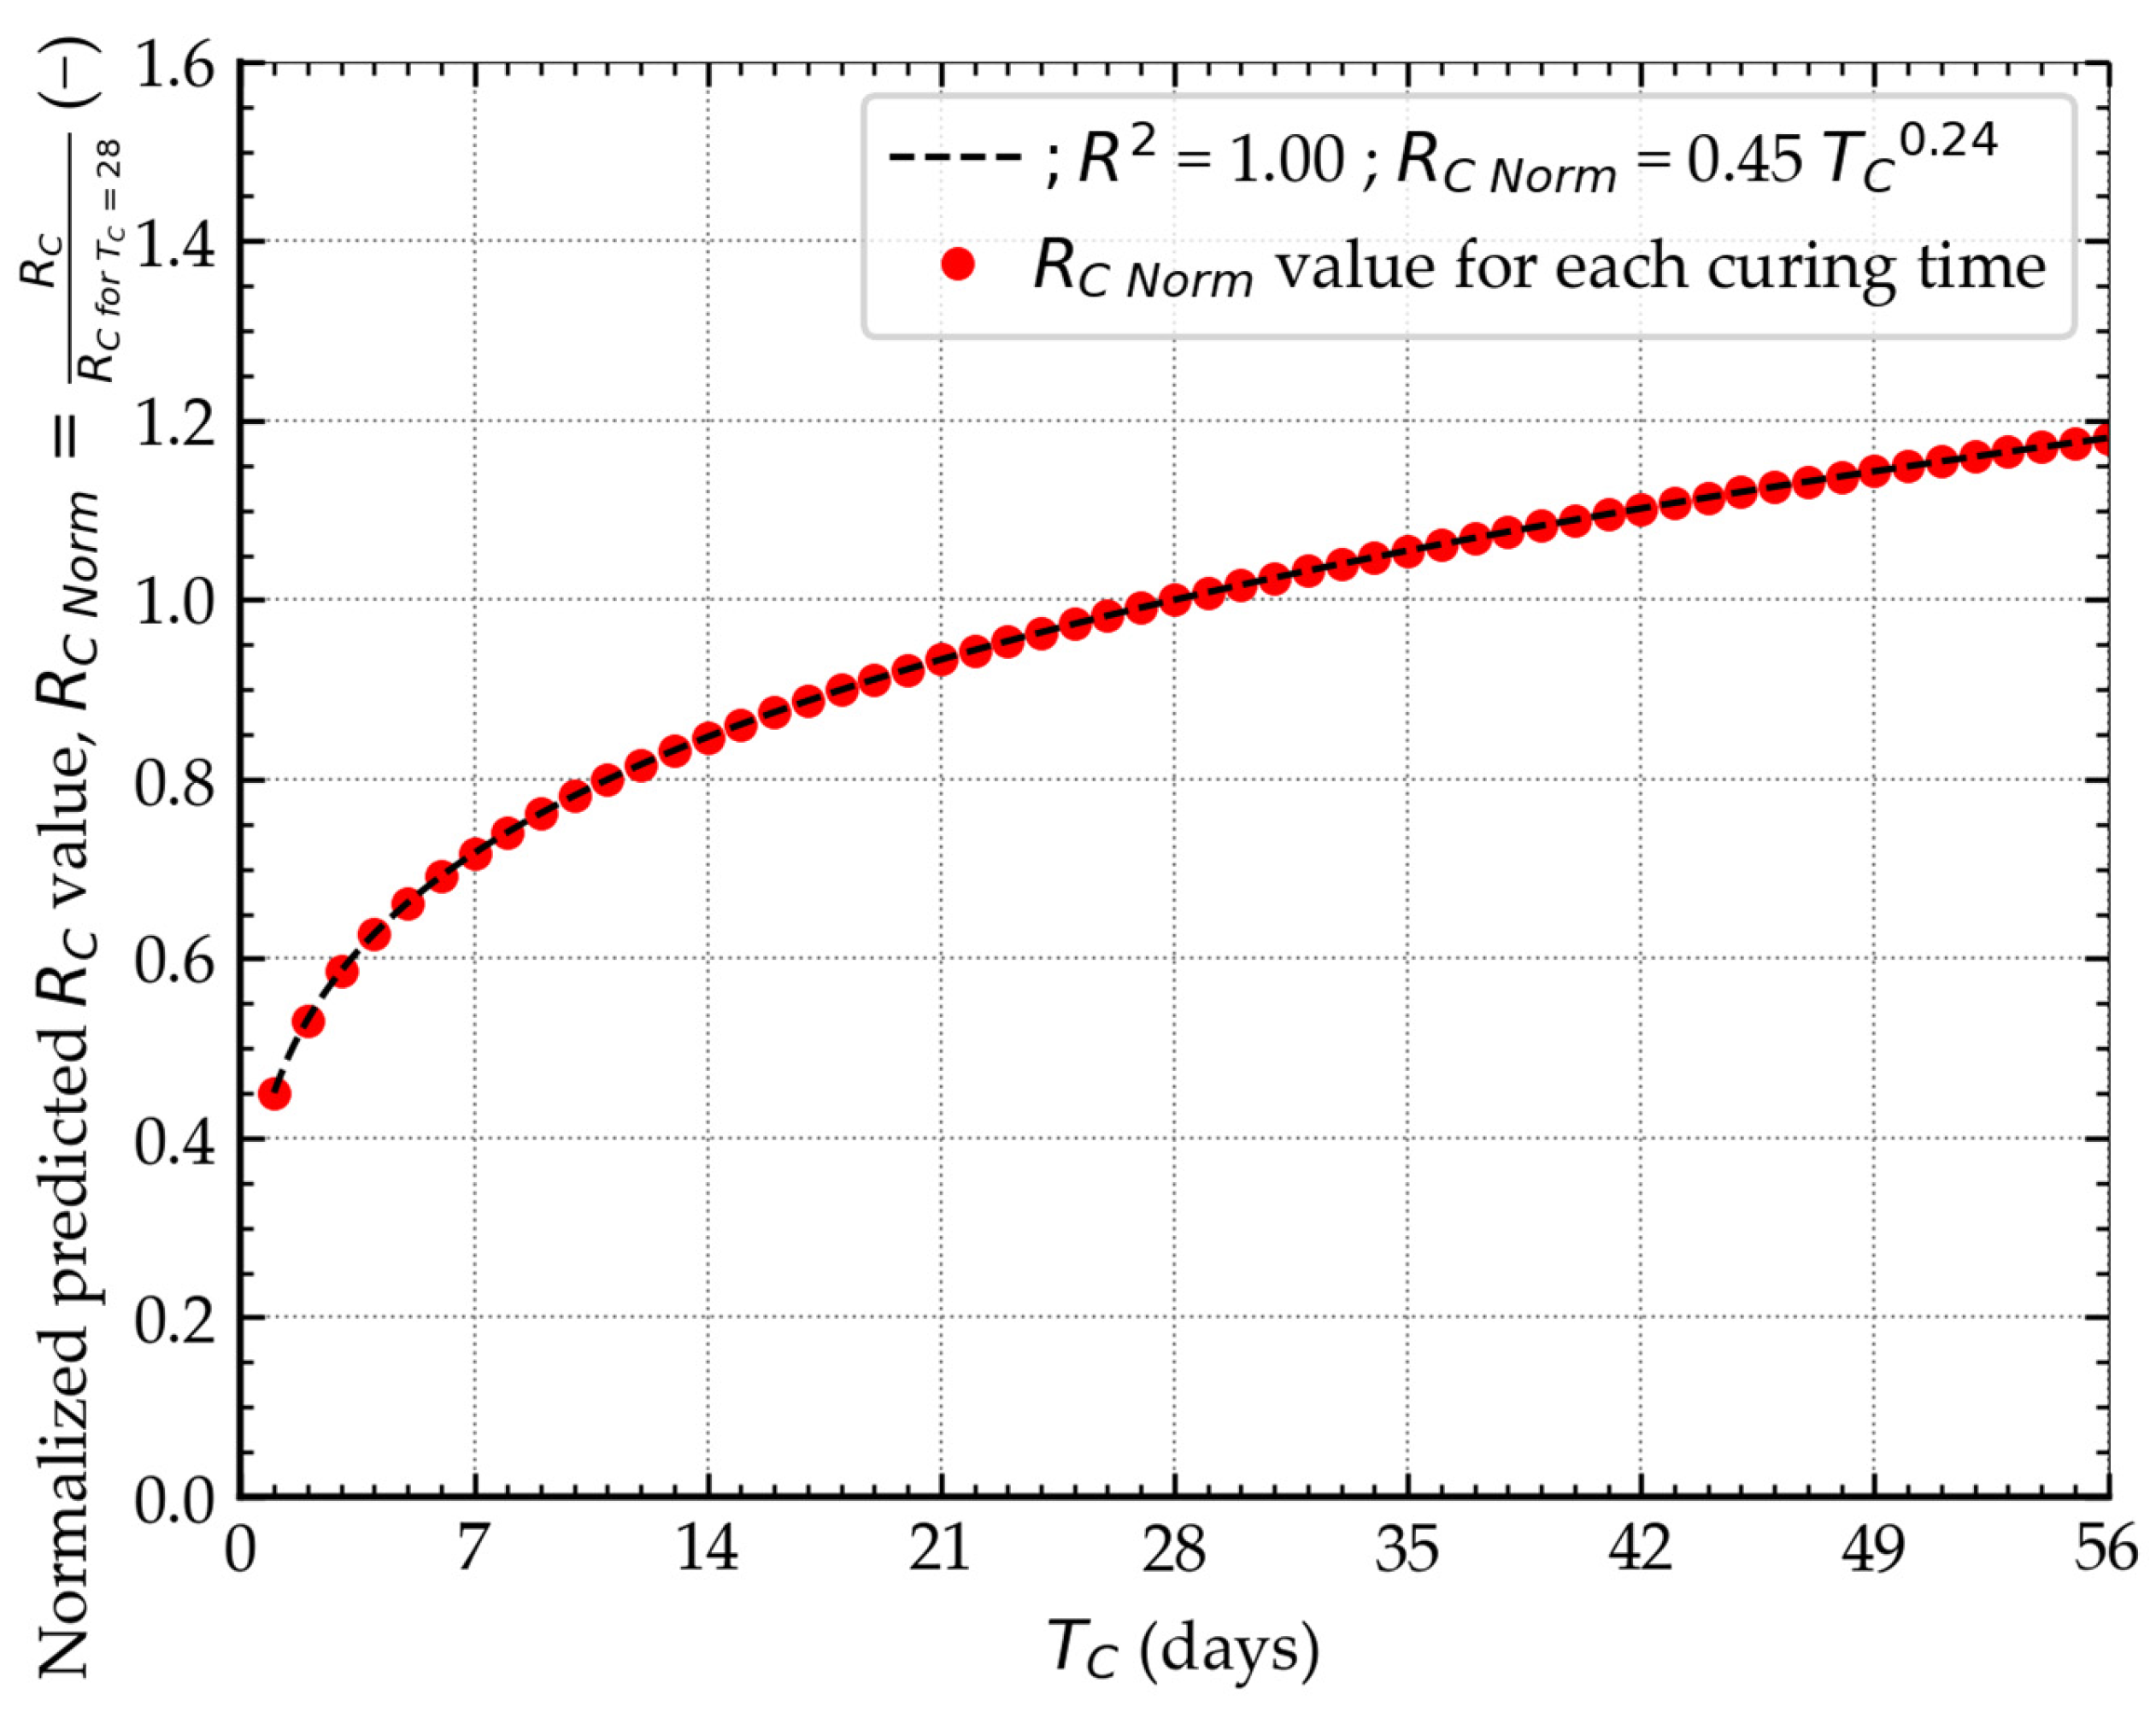
In the next stage, the variability of the predicted strength over time was analyzed, as illustrated in Figure 24. The purpose of this analysis was to determine how the predicted normalized strength of stabilized soil develops in subsequent curing times. It was decided to normalize the strength relative to the 28th day of curing, as in engineering practice, this period is considered crucial. A power function described the variability in normalized strength. On this basis, the strength on any day of curing can be determined by multiplying the strength value after 28 days of curing by the corresponding normalized value. This means that to determine the strength on a selected day, it is only necessary to know the strength after 28 days, which can be determined from the nomogram shown in Figure 25 or from Equation (9). The nomogram presented does not include the value C = 1%, as this data was used only to determine the general trend of the relationship. The nomogram presented covers a range of 3–10% cement, which is typical in engineering practice. However, it should be noted that the determined strength value of the stabilized soil is subject to an error of MAPE = 15.928% and RMSE = 0.318 MPa. Furthermore, if a different type of binder, other soil, or soil containing impurities or organic matter is used, the strength value obtained may change.
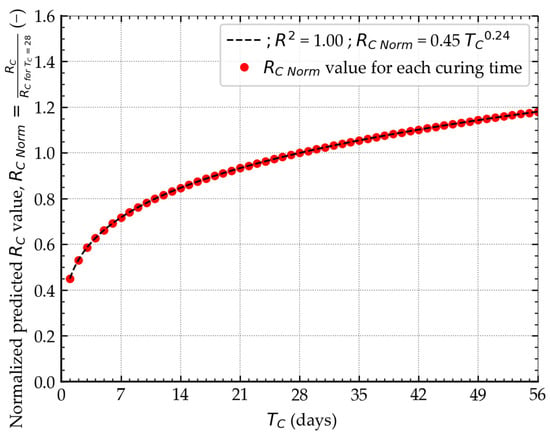
Figure 24.
The change in the predicted normalized strength over time.
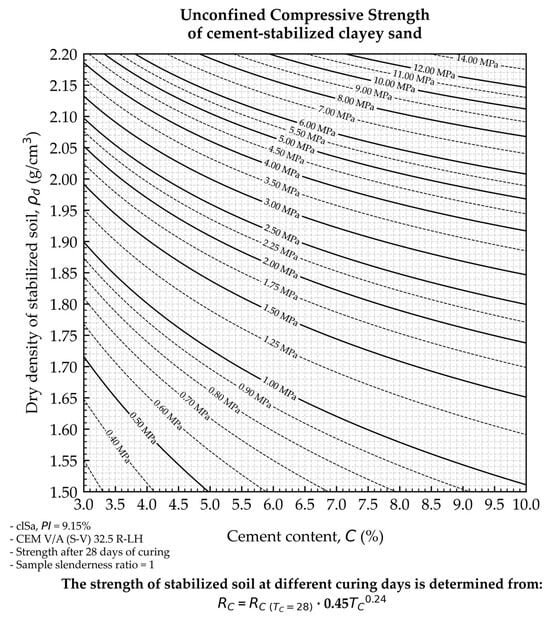
Figure 25.
Nomogram for predicting the strength of stabilized soil.
5. Conclusions
The experimental study conducted allowed us to answer several key questions and achieve the research objective of this work, which was to develop a new method for predicting the strength of cement-stabilized soil. This method extends the previously proposed methodology for determining empirical relationships to assess the strength of stabilized soil. The methodology has been expanded by including curing time in the equation. In addition, a calibration parameter B has been introduced, which can be adjusted to different types of binders. This approach makes the proposed method universal, as this parameter can be used to modify the rate of strength development over time. The effectiveness and accuracy of the determined empirical correlation were confirmed by statistical analysis, which enabled the following forecast errors to be calculated: MAPE = 15.928% and RMSE = 0.318 MPa. In addition, a sensitivity analysis showed that the cement index has the greatest impact on the predicted strength, while porosity and curing time have a lesser impact. It was also found that the prediction error is most significantly affected by interactions between the input data used to determine the relationship, including porosity and curing time. Based on the relationship obtained, a nomogram was proposed to allow quick and transparent determination of the strength of stabilized soil. This constitutes a practical novelty and a tool resulting directly from this work. In addition, the applicability of the determined empirical relationship for predicting deformation parameters, such as the E50, EUPV, and GUPV modules, was confirmed.
Empirical relationships for predicting deformation modules were determined using the same variables as those in the equation developed to predict stabilized soil strength, i.e., porosity, cement index, and curing time. These relationships also used the calibration parameter B, which was adjusted to achieve the best possible agreement between the calculated results and the experimental data. It was observed that the prediction errors for the deformation modulus E50 are greater than those for the EUPV and GUPV moduli, and also greater than those for the strength relationships. The greater discrepancies in the case of E50 can be explained by the greater measurement uncertainty associated with its determination. The other moduli showed minor errors, indicating greater repeatability of the ultrasonic method results. It was also found that, for modules determined by wave propagation velocity, the material’s porosity has a negligible effect on the magnitude of prediction errors, confirming the dominant role of cement and curing time in shaping the deformation parameters of stabilized soils.
The strengths of the developed relationship include its relatively small prediction errors, the ability to adapt it to other soil and binder types using calibration parameters, and the ability to determine both the strength and deformation parameters of stabilized soil. However, the limitations of the proposed relationship include that it was developed based on a single type of binder and soil and does not account for pH and organic content. Therefore, in order to further develop the proposed relationship, further research is needed to eliminate weaknesses. The most important conclusions from this study are presented below:
- Regardless of the stabilized soil’s initial moisture content, the highest strength was achieved at a moisture content near 10%. It was shown that the cement content had a slight effect on the moisture content required to achieve maximum strength.
- It was found that the strength of stabilized soil increased linearly with a cement content ranging from 1% to 9%.
- With an increase in the binder content of the mixture, the dynamics of strength gain in the stabilized soil changed.
- It has been demonstrated that it is possible to predict compressive strength from ultrasonic pulse velocity, with the resulting relationships being exponential.
- It has been confirmed that the strength of stabilized soil can be predicted from porosity, cement index, and curing time, made possible by normalizing the parameters relative to the first day of curing.
- Based on the determined relationship, a nomogram was developed to predict the strength of stabilized soil as a function of dry density and cement content. Furthermore, it was shown that the same relationship can be used to predict deformation parameters.
- These results of the sensitivity analysis indicate that the strength of stabilized soil is most closely related to the cement index and less dependent on porosity and curing time. The observed errors are mainly due to interactions between individual variables, while the direct impact of these variables on the error is relatively small.
Funding
This research received no external funding.
Institutional Review Board Statement
Not applicable.
Informed Consent Statement
Not applicable.
Data Availability Statement
Dataset available upon request from the author.
Conflicts of Interest
The author declares no conflicts of interest.
Abbreviations
The following abbreviations are used in this manuscript:
| Coefficient of proportionality | |
| Exponent of the power function | |
| C | Cement content |
| Ci | Cement index |
| CC | Coefficient of curvature |
| CU | Uniformity coefficient |
| E50 | Secant modulus determined at half the unconfined compressive strength |
| EUPV | Modulus of elasticity determined by ultrasonic method |
| Specific gravity of cement | |
| Specific gravity of soil | |
| GUPV | Shear modulus determined by ultrasonic method |
| n | Porosity |
| PI | Plasticity index |
| ρ | Density |
| Dry density of stabilized soil | |
| RC | Unconfined compressive strength |
| Mean unconfined compressive strength | |
| Normalized unconfined compressive strength | |
| S1 | First-order Sobol indices |
| ST | Total Sobol indices |
| TC | Curing time |
| UPV | Ultrasonic pulse velocity |
| Volume of sample | |
| Volume of cement | |
| Volume of pores | |
| v | Wave velocity |
| vs | Shear wave velocity |
| WP | Plastic limit |
| WL | Liquid limit |
| w | Water content |
| wopt | Water content at which maximum strength was achieved |
| Normalized ratio of porosity to cement index |
References
- Firoozi, A.A.; Guney Olgun, C.; Firoozi, A.A.; Baghini, M.S. Fundamentals of Soil Stabilization. Int. J. Geo-Eng. 2017, 8, 26. [Google Scholar] [CrossRef]
- McDowell, C. Stabilization of Soils with Lime, Lime-Flyash, and Other Lime Reactive Materials. Highw. Res. Board Bull. 1959, 231, 60–66. [Google Scholar]
- Petry, T.M.; Little, D.N. Review of Stabilization of Clays and Expansive Soils in Pavements and Lightly Loaded Structures—History, Practice, and Future. J. Mater. Civ. Eng. 2002, 14, 447–460. [Google Scholar] [CrossRef]
- Askarani, K.K.; Pakbaz, M.S. Drained Shear Strength of Over-Consolidated Compacted Soil-Cement. J. Mater. Civ. Eng. 2016, 28, 04015207. [Google Scholar] [CrossRef]
- Ayeldeen, M.; Hara, Y.; Kitazume, M.; Negm, A. Unconfined Compressive Strength of Compacted Disturbed Cement-Stabilized Soft Clay. Int. J. Geosynth. Ground Eng. 2016, 2, 28. [Google Scholar] [CrossRef]
- Tran, K.Q.; Satomi, T.; Takahashi, H. Improvement of Mechanical Behavior of Cemented Soil Reinforced with Waste Cornsilk Fibers. Constr. Build. Mater. 2018, 178, 204–210. [Google Scholar] [CrossRef]
- Cristelo, N.; Glendinning, S.; Fernandes, L.; Pinto, A.T. Effects of Alkaline-Activated Fly Ash and Portland Cement on Soft Soil Stabilisation. Acta Geotech. 2013, 8, 395–405. [Google Scholar] [CrossRef]
- Cristelo, N.; Glendinning, S.; Miranda, T.; Oliveira, D.; Silva, R. Soil Stabilisation Using Alkaline Activation of Fly Ash for Self Compacting Rammed Earth Construction. Constr. Build. Mater. 2012, 36, 727–735. [Google Scholar] [CrossRef]
- Consoli, N.C.; Foppa, D.; Festugato, L.; Heineck, K.S. Key Parameters for Strength Control of Artificially Cemented Soils. J. Geotech. Geoenviron. Eng. 2007, 133, 197–205. [Google Scholar] [CrossRef]
- Do, D.H.; Pham, T.A. Investigation of Performance of Soil-Cement Pile in Support of Foundation Systems for High-Rise Buildings. Civ. Eng. J. 2018, 4, 266–277. [Google Scholar] [CrossRef]
- Eyo, E.U.; Ng’ambi, S.; Abbey, S.J. Performance of Clay Stabilized by Cementitious Materials and Inclusion of Zeolite/Alkaline Metals-Based Additive. Transp. Geotech. 2020, 23, 100330. [Google Scholar] [CrossRef]
- Hata, T.; Suetsugu, D.; Kasama, K. A Biomediated Deterioration Mitigation Method for Cement-Treated Soil. Environ. Geotech. 2020, 7, 435–444. [Google Scholar] [CrossRef]
- Odumade, A.O.; Ezeah, C.; Ugwu, O.O. Performance Analysis of Cement-Stabilised Laterite for Road Construction in the Tropics. Environ. Geotech. 2019, 6, 555–561. [Google Scholar] [CrossRef]
- Pham, T.A.; Koseki, J.; Dias, D. Optimum Material Ratio for Improving the Performance of Cement-Mixed Soils. Transp. Geotech. 2021, 28, 100544. [Google Scholar] [CrossRef]
- Sariosseiri, F.; Muhunthan, B. Effect of Cement Treatment on Geotechnical Properties of Some Washington State Soils. Eng. Geol. 2009, 104, 119–125. [Google Scholar] [CrossRef]
- Nazari, Z.; Tabarsa, A.; Latifi, N. Effect of Compaction Delay on the Strength and Consolidation Properties of Cement-Stabilized Subgrade Soil. Transp. Geotech. 2021, 27, 100495. [Google Scholar] [CrossRef]
- Rowe, R.K.; Li, A.L. Geosynthetic-Reinforced Embankments over Soft Foundations. Geosynth. Int. 2005, 12, 50–85. [Google Scholar] [CrossRef]
- Abd, A.H.; Utili, S. Design of Geosynthetic-Reinforced Slopes in Cohesive Backfills. Geotext. Geomembr. 2017, 45, 627–641. [Google Scholar] [CrossRef]
- Sas, W. Application of Recycled Concrete Aggregate in Road Engineering. Acta Sci. Polonorum. Archit. 2015, 14, 11. [Google Scholar]
- Giwangkara, G.G.; Mohamed, A.; Khalid, N.H.A.; Nor, H.M.; Hainin, M.R.; Jaya, R.P.; Sani, W.N.H.M.; Ismail, C.R.; Aziz, M.M.A. Recycled Concrete Aggregate as a Road Base Material. IOP Conf. Ser. Mater. Sci. Eng. 2019, 527, 012061. [Google Scholar] [CrossRef]
- Maduabuchukwu Nwakaire, C.; Poh Yap, S.; Chuen Onn, C.; Wah Yuen, C.; Adebayo Ibrahim, H. Utilisation of Recycled Concrete Aggregates for Sustainable Highway Pavement Applications; a Review. Constr. Build. Mater. 2020, 235, 117444. [Google Scholar] [CrossRef]
- ACI Committee 230. State-of-the-Art Report on Soil Cement. ACI Mater. J. 1990, 87, 395–417. [Google Scholar] [CrossRef]
- Myers, B. Road Stabilization with Portland Cement. Eng. Ext. Dep. 1939, 44, 93–100. [Google Scholar]
- Liu, L.; Deng, T.; Deng, Y.; Zhan, L.; Horpibulsuk, S.; Wang, Q. Stabilization Nature and Unified Strength Characterization for Cement-Based Stabilized Soils. Constr. Build. Mater. 2022, 336, 127544. [Google Scholar] [CrossRef]
- Wang, B.; Zhong, S.; Lee, T.-L.; Fancey, K.S.; Mi, J. Non-Destructive Testing and Evaluation of Composite Materials/Structures: A State-of-the-Art Review. Adv. Mech. Eng. 2020, 12, 168781402091376. [Google Scholar] [CrossRef]
- Mandal, T.; Tinjum, J.M.; Edil, T.B. Non-Destructive Testing of Cementitiously Stabilized Materials Using Ultrasonic Pulse Velocity Test. Transp. Geotech. 2016, 6, 97–107. [Google Scholar] [CrossRef]
- Yesiller, N.; Hanson, J.L.; Rener, A.T.; Usmen, M.A. Ultrasonic Testing for Evaluation of Stabilized Mixtures. Transp. Res. Rec. 2001, 1757, 32–42. [Google Scholar] [CrossRef]
- Ensminger, D.; Bond, L.J. Ultrasonics: Fundamentals, Technologies, and Applications, 3rd ed.; CRC Press: Boca Raton, FL, USA, 2011; ISBN 978-0-429-11948-4. [Google Scholar]
- Malhotra, V.M.; Carino, N.J. Handbook on Nondestructive Testing of Concrete, 2nd ed.; CRC Press: Boca Raton, FL, USA, 2004; ISBN 978-0-8493-1485-8. [Google Scholar]
- Bortolotto, M.S. Bender Elements, Ultrasonic Pulse Velocity, and Local Gauges for the Analysis of Stiffness Degradation of an Artificially Cemented Soil. Master’s Thesis, Federal University of Rio Grande do Sul, Farroupilha, Brazil, 2017; 273p. [Google Scholar]
- Wei, X.; Liu, H.; Ku, T. Microscale Analysis to Characterize Effects of Water Content on the Strength of Cement-Stabilized Sand–Clay Mixtures. Acta Geotech. 2020, 15, 2905–2923. [Google Scholar] [CrossRef]
- Miturski, M. Impact of Curing Process on Ultrasonic Pulse Velocity in Stabilized Soils. Acta Sci. Pol.-Archit. Bud. 2022, 20, 69–74. [Google Scholar] [CrossRef]
- Panzera, T.H.; Christoforo, A.L.; de Paiva Cota, F.; Ribeiro Borges, P.H.; Bowen, C.R. Ultrasonic Pulse Velocity Evaluation of Cementitious Materials. In Advances in Composite Materials-Analysis of Natural and Man-Made Materials; Tesinova, P., Ed.; InTech: London, UK, 2011; ISBN 978-953-307-449-8. [Google Scholar]
- Vinoth, G.; Moon, S.-W.; Moon, J.; Ku, T. Early Strength Development in Cement-Treated Sand Using Low-Carbon Rapid-Hardening Cements. Soils Found. 2018, 58, 1200–1211. [Google Scholar] [CrossRef]
- Miturski, M.; Sas, W.; Radzevičius, A.; Šadzevičius, R.; Skominas, R.; Stelmaszczyk, M.; Głuchowski, A. Effect of Dispersed Reinforcement on Ultrasonic Pulse Velocity in Stabilized Soil. Materials 2021, 14, 6951. [Google Scholar] [CrossRef] [PubMed]
- Baldovino, J.D.J.A.; Izzo, R.L.D.S.; Pereira, M.D.; Rocha, E.V.D.G.; Rose, J.L.; Bordignon, V.R. Equations Controlling Tensile and Compressive Strength Ratio of Sedimentary Soil–Cement Mixtures under Optimal Compaction Conditions. J. Mater. Civ. Eng. 2020, 32, 04019320. [Google Scholar] [CrossRef]
- Ghadakpour, M.; Choobbasti, A.J.; Kutanaei, S.S. Investigation of the Kenaf Fiber Hybrid Length on the Properties of the Cement-Treated Sandy Soil. Transp. Geotech. 2020, 22, 100301. [Google Scholar] [CrossRef]
- Moreira, E.B.; Baldovino, J.A.; Rose, J.L.; Luis Dos Santos Izzo, R. Effects of Porosity, Dry Unit Weight, Cement Content and Void/Cement Ratio on Unconfined Compressive Strength of Roof Tile Waste-Silty Soil Mixtures. J. Rock Mech. Geotech. Eng. 2019, 11, 369–378. [Google Scholar] [CrossRef]
- Sharma, K.; Kumar, A. Influence of Rice Husk Ash, Lime and Cement on Compaction and Strength Properties of Copper Slag. Transp. Geotech. 2021, 27, 100464. [Google Scholar] [CrossRef]
- Miturski, M.; Głuchowski, A.; Sas, W. Influence of Dispersed Reinforcement on Mechanical Properties of Stabilized Soil. Materials 2021, 14, 5982. [Google Scholar] [CrossRef]
- Consoli, N.C.; Vaz Ferreira, P.M.; Tang, C.-S.; Veloso Marques, S.F.; Festugato, L.; Corte, M.B. A Unique Relationship Determining Strength of Silty/Clayey Soils—Portland Cement Mixes. Soils Found. 2016, 56, 1082–1088. [Google Scholar] [CrossRef]
- Consoli, N.C.; Arcari Bassani, M.A.; Festugato, L. Effect of Fiber-Reinforcement on the Strength of Cemented Soils. Geotext. Geomembr. 2010, 28, 344–351. [Google Scholar] [CrossRef]
- Rios, S.; Viana Da Fonseca, A.; Baudet, B.A. Effect of the Porosity/Cement Ratio on the Compression of Cemented Soil. J. Geotech. Geoenviron. Eng. 2012, 138, 1422–1426. [Google Scholar] [CrossRef]
- Stracke, F.; Jung, J.G.; Korf, E.P.; Consoli, N.C. The Influence of Moisture Content on Tensile and Compressive Strength of Artificially Cemented Sand. Soils Rocks 2012, 35, 303–308. [Google Scholar] [CrossRef]
- Cardoso, R.; Ribeiro, D.; Néri, R. Bonding Effect on the Evolution with Curing Time of Compressive and Tensile Strength of Sand-Cement Mixtures. Soils Found. 2017, 57, 655–668. [Google Scholar] [CrossRef]
- Chakraborty, S.; Nair, S. Impact of Curing Time on Moisture-Induced Damage in Lime-Treated Soils. Int. J. Pavement Eng. 2020, 21, 215–227. [Google Scholar] [CrossRef]
- Pani, A.; Singh, S.P. Effect of Temperature on the Strength of Lime-Stabilised Fly Ash. Environ. Geotech. 2020, 7, 189–199. [Google Scholar] [CrossRef]
- Rabbi, A.T.M.Z.; Kuwano, J.; Deng, J.; Boon, T.W. Effect of Curing Stress and Period on the Mechanical Properties of Cement-Mixed Sand. Soils Found. 2011, 51, 651–661. [Google Scholar] [CrossRef]
- Pham, T.A.; Kyokawa, H.; Koseki, J.; Dias, D. A New Index for the Strength Analysis and Prediction of Cement-Mixed Soils. Eur. J. Environ. Civ. Eng. 2023, 27, 1512–1534. [Google Scholar] [CrossRef]
- Sasanian, S.; Newson, T.A. Basic Parameters Governing the Behaviour of Cement-Treated Clays. Soils Found. 2014, 54, 209–224. [Google Scholar] [CrossRef]
- Wang, C.; Li, W. Factors Affecting the Mechanical Properties of Cement-Mixed Gravel. Adv. Mater. Sci. Eng. 2016, 2016, 8760325. [Google Scholar] [CrossRef]
- Miturski, M.; Dzięcioł, J.; Szlachetka, O. Effect of Dispersed Polypropylene Fibers on the Strength and Stiffness of Cement-Stabilized Clayey Sand. Sustainability 2025, 17, 5803. [Google Scholar] [CrossRef]
- Consoli, N.C.; da Fonseca, A.V.; Silva, S.R.; Cruz, R.C.; Fonini, A. Parameters Controlling Stiffness and Strength of Artificially Cemented Soils. Géotechnique 2012, 62, 177–183. [Google Scholar] [CrossRef]
- Miturski, M. Influence of Porosity and Cement Index on the Strength of Cement-Stabilized Soil. Mod. Eng. 2024, 4, 1–10. [Google Scholar]
- Consoli, N.C.; Prietto, P.D.M.; Da Silva Lopes, L.; Winter, D. Control Factors for the Long Term Compressive Strength of Lime Treated Sandy Clay Soil. Transp. Geotech. 2014, 1, 129–136. [Google Scholar] [CrossRef]
- ISO 12154; Determination of Density by Volumetric Displacement—Skeleton Density by Gas Pycnometry. International Organization for Standardization (ISO): Geneva, Switzerland, 2014.
- EN 197-1:2011; Cement—Part 1: Composition, Specifications and Conformity Criteria for Common Cements. PKN: Warsaw, Poland, 2013; ISBN 978-83-275-1867-5.
- Horpibulsuk, S.; Rachan, R.; Chinkulkijniwat, A.; Raksachon, Y.; Suddeepong, A. Analysis of Strength Development in Cement-Stabilized Silty Clay from Microstructural Considerations. Constr. Build. Mater. 2010, 24, 2011–2021. [Google Scholar] [CrossRef]
- Baldovino, J.D.J.A.; Nuñez De La Rosa, Y.E.; Calabokis, O.P. Effect of Porosity/Binder Index on Strength, Stiffness and Microstructure of Cemented Clay: The Impact of Sustainable Development Geomaterials. Materials 2024, 17, 921. [Google Scholar] [CrossRef] [PubMed]
- Consoli, N.C.; Marques, S.F.V.; Sampa, N.C.; Bortolotto, M.S.; Siacara, A.T.; Nierwinski, H.P.; Pereira, F.; Festugato, L. A General Relationship to Estimate Strength of Fibre-Reinforced Cemented Fine-Grained Soils. Geosynth. Int. 2017, 24, 435–441. [Google Scholar] [CrossRef]
- Sobol′, I.M. Global Sensitivity Indices for Nonlinear Mathematical Models and Their Monte Carlo Estimates. Math. Comput. Simul. 2001, 55, 271–280. [Google Scholar] [CrossRef]
- Tennøe, S.; Halnes, G.; Einevoll, G.T. Uncertainpy: A Python Toolbox for Uncertainty Quantification and Sensitivity Analysis in Computational Neuroscience. Front. Neuroinform. 2018, 12, 49. [Google Scholar] [CrossRef]
- Saltelli, A.; Annoni, P.; Azzini, I.; Campolongo, F.; Ratto, M.; Tarantola, S. Variance Based Sensitivity Analysis of Model Output. Design and Estimator for the Total Sensitivity Index. Comput. Phys. Commun. 2010, 181, 259–270. [Google Scholar] [CrossRef]
Disclaimer/Publisher’s Note: The statements, opinions and data contained in all publications are solely those of the individual author(s) and contributor(s) and not of MDPI and/or the editor(s). MDPI and/or the editor(s) disclaim responsibility for any injury to people or property resulting from any ideas, methods, instructions or products referred to in the content. |
© 2025 by the author. Licensee MDPI, Basel, Switzerland. This article is an open access article distributed under the terms and conditions of the Creative Commons Attribution (CC BY) license (https://creativecommons.org/licenses/by/4.0/).

