Article

Assessment of the Accumulation Characteristics of Pollutants in the Soil of Permeable Pavement and the Risk of Heavy Metal Pollution Based on the Simulated Rainfall Experiment

1
School of Mechanical Engineering, Jiangsu Ocean University, Lianyungang 222005, China
2
School of Civil and Ocean Engineering, Jiangsu Ocean University, Lianyungang 222005, China
3
Institute of Oceanology, Chinese Academy of Sciences, Qingdao 266071, China
4
Centre for Climate Resilient and Low–Carbon Cities, School of Architecture and Urban Planning, Chongqing University, Chongqing 400045, China
*
Authors to whom correspondence should be addressed.
Appl. Sci. 2025, 15(21), 11369; https://doi.org/10.3390/app152111369
Submission received: 4 September 2025 / Revised: 20 October 2025 / Accepted: 21 October 2025 / Published: 23 October 2025

Abstract

In this study, aiming to determine the potential pollution risks to the soil foundation caused by permeable pavement after its operation, a fully permeable asphalt pavement system is constructed. Through an accelerated simulation of a three-year cumulative rainfall test, the cumulative characteristics of pollutants in the soil foundation of the permeable asphalt pavement were studied, and a risk assessment of heavy metal pollution was carried out. The results show that N and P pollution is relatively serious. TN and NH4+-N decrease with the increase of the soil foundation depth (0–50 cm), and there is an obvious surface accumulation phenomenon. The average contents at a depth of 0–10 cm are 1219 mg/kg and 443 mg/kg, respectively. The content of TP first shows a decreasing trend and then an increasing one, and it faces the risks of surface accumulation and leaching loss in the middle and lower parts. Although the average contents of Cu, Pb and Zn at different depths all meet the requirements of the Soil Environmental Quality Standard (for agricultural land), they are all higher than the background values of soil elements in Jiangsu Province. Among them, Cu and Zn pose a considerable ecological risk to the environment, especially with serious enrichment in the surface layer. The above cumulative characteristics of pollutants in the fully permeable asphalt pavement provide reference value for extending the service life of the permeable pavement system.

1. Introduction

With the acceleration of urbanization, the number of impervious pavements in urban areas has increased sharply, resulting in a decrease in soil rainwater infiltration and an increase in rainwater runoff [1]. Rainfall runoff contains a variety of pollutants, such as suspended solids, oxygen-consuming substances, nutrients, toxic substances, and oil substances. These pollutants enter rivers and lakes with runoff, causing water pollution. In severe cases, it can pose a threat to human health through the food chain [2]. Therefore, determining how to effectively control and manage urban rainwater runoff has become an urgent and crucial task for the current sustainable urban development [3].
In order to reduce various pollutants in road rainwater runoff and regulate rainwater runoff, low-impact development (LID) runoff management technology is adopted [4]. The low-impact development (LID) strategy has now been integrated into land planning practices, aiming to optimize rainfall as a highly available water resource in the urban system [5]. The LID technology focuses on the control of runoff, reducing the transportation of pollutants to water bodies. At the same time, it relies on natural processes to improve water quality. Moreover, the LID is composed of a series of systems, including bioretention basins, rain gardens, green roofs, ecological ditches, permeable pavements, etc. [6,7]. Among them, the permeable pavement system (PPS) plays a crucial role in runoff management. It serves as the last filtering barrier before the runoff infiltrates into the soil or is discharged into nearby water bodies [8]. The PPS is constructed from porous materials, which not only facilitates the infiltration and storage of rainwater but also reduces the degree of environmental pollution by intercepting pollutants within its internal structural layers [9]. As a Low-Impact Development (LID) measure for controlling rainwater runoff at the source, the permeable pavement system (PPS) has demonstrated extensive effectiveness in promoting infiltration, reducing peak flood flows, and purifying rainwater [10]. The PPS has been widely applied in sidewalks, public squares, and parking lots [11]. Commonly used permeable pavements include pervious concrete pavements, permeable asphalt pavements, and permeable brick pavements. Table 1 presents the working principles and application scenarios of these three main types of permeable pavements.
Considerable progress has been made in research on the pollutant removal by permeable pavements. The research mainly focuses on the removal of total suspended solids (TSS), ammonium nitrogen (NH4+-N), total phosphorus (TP), chemical oxygen demand (COD), and heavy metals such as lead (Pb), copper (Cu), zinc (Zn), and cadmium (Cd). Tota-Maharaj and others found that the removal efficiencies of ammonium nitrogen (NH4+-N) and total suspended solids (TSS) in rainwater by the permeable pavement block system reached 84.6% and 91.0%, respectively [12]. Liu et al. studied the runoff purification performance of the surface layer and the crushed stone layer of the permeable pavement and confirmed that the surface layer has a significant removal effect on total suspended solids (TSS), ammonium nitrogen (NH4+-N), total phosphorus (TP) and chemical oxygen demand (COD) in the entire pavement system [13]. Drake et al. compared the winter rainwater quality of the runoff from three permeable pavement systems (one pervious concrete (PC) system and two porous interlocking concrete pavement (PICP) systems) with that from the asphalt control pavement, and found that the permeable pavement systems performed similarly in reducing the event mean concentrations (EMCs) of Cu, Fe, Mn, and Zn, as well as the total pollutant loads [14]. However, with the operation of the PPS, pollutants in rainwater runoff will accumulate on the surface of the media within the facility [15]. Due to the continuous enrichment of pollutants in the media, potential ecological risks may arise. It may even become a pollution source, contaminating the nearby soil and groundwater resources.
At present, the impact of pollutant accumulation on the operation of permeable pavement facilities is rarely considered, and the cumulative effect of soil pollutants caused by the concentrated infiltration of rainwater runoff should be studied. Therefore, in view of the characteristics of large flow rate and low pollutant concentration of runoff rainwater, this study constructs a fully permeable asphalt pavement system. The objectives of this study are (1) to study the accumulation characteristics of pollutants in the substrate of the PPS (permeable pavement system) after a simulated three-year cumulative rainfall test; (2) to analyze the heavy metal pollution risk of the PPS by using three different soil pollutant evaluation methods; and (3) to provide reference value for strengthening environmental pollution risk management and extending the service life of the PPS.

2. Materials and Methods

2.1. Materials

In this study, a typical permeable asphalt pavement was selected for testing. The size of the permeable asphalt pavement is 0.2 m (length) × 0.2 m (width) × 0.05 m (depth). It was prepared with permeable asphalt mixture (fine-grained type) by the Laboratory of the School of Civil Engineering, Nanjing Forestry University in accordance with the technical requirements specified in the Technical Specification for Permeable Brick Pavement (CJJ/T 188-2012) [16] and the Technical Specification for Permeable Asphalt Pavement (CJJ/T 190-2012) [17]. The relevant parameters of the permeable asphalt pavement are as follows: the asphalt content is 5.4%, the pore diameter is less than 16 mm, the permeability coefficient is 2.3 × 10⁻² cm/s, the porosity is 21.9%, and the Marshall stability is 5.

2.2. Experimental System

A bench-scale device for the fully permeable asphalt pavement system was designed for the experiment, which is mainly composed of three parts: a stainless steel bracket, a water outlet container, and a permeable device. The length × width of the permeable device is 0.2 m × 0.2 m, and the effective depth is 0.6 m. The materials of the device are all plexiglass. In this study, the permeable device, from top to bottom, consists of a permeable asphalt surface layer (0.05 m), a crushed stone base layer (0.2 m), a sand cushion layer (0.2 m), and an anti-filtration isolation layer. The sprinkler head is located above the permeable device, and the simulated rainfall amount is controlled by a peristaltic pump. The bench-scale device is shown in Figure 1.
The surface permeable asphalt layer first filters large particulate matter and adsorbs part of the dissolved pollutants via its porous structure. The underlying crushed stone base and sand cushion further intercept fine particles and enhance adsorption of heavy metals and nutrients through their large specific surface area. The geotextile anti-filtration layer at the bottom prevents the loss of sand particles while allowing water to infiltrate, avoiding clogging of the soil foundation and ensuring continuous pollutant retention capacity.
The substrate needs to be replaced regularly. The specific steps are as follows: Firstly, remove the surface sand cushion in sections to avoid damaging the pavement surface layer. Secondly, replace with clean, graded sand and compact to the original bulk density. Finally, conduct post-replacement permeability tests to ensure the infiltration capacity meets the design requirements.

2.3. Rainfall Simulation Experiment

According to the typical rainfall characteristics of Nanjing, the Chicago rainfall pattern is adopted as the design rainfall pattern. In order to be closer to the real rainfall situation, we consulted the historical rainfall data of Nanjing. During the operation of the device, the total amount of water entering the permeable pavement was made equivalent to the rainfall amount in Nanjing over a period of three years. In the experiment, the rainfall simulation test of the permeable pavement system included an intermittent dry period. The average annual rainfall in Nanjing is approximately 1200 mm, and the simulation lasted for 3 days with a total rainfall equivalent of 3600 mm. In this study, the rainwater runoff monitoring data of Nanjing and the method of preparing synthetic rainwater proposed by Lin et al. were taken as the basis for preparing simulated rainwater [18]. Based on existing monitoring data, the concentrations of the target substances are shown in Table 2 in detail.

2.4. Test Sampling Method

Prior to the simulated rainfall experiment, sampling and testing for TN, NH4+-N, and TP contents were conducted on the crushed stone base course and sand cushion layer to determine the initial pollutant levels within the permeable paving system’s structural layers. For the 0.2 m thick crushed stone base and thick sand cushion layer, three representative sampling points were selected per layer at the same depth. Samples from the same depth were combined into a composite sample. Collected samples were air-dried naturally, lightly crushed, passed through a 100-mesh sieve to remove impurities, and stored in clean amber glass bottles for subsequent testing. Sampling procedures for the 0.2 m thick sand cushion layer mirrored those for the crushed stone base course. Test results are presented in Table 3 below. To minimize the influence of residual nitrogen and phosphorus in the sand cushion and gravel layers on subsequent test results, we subjected these layers to multiple rounds of washing and filtration. The untreated sand and gravel were spread evenly in a container fitted with a filter screen. Deionized water was slowly poured over the material at a volume 2–3 times that of the soil and gravel mass. After air-drying, the treatment was complete. The filtered and washed sand and gravel were re-measured, with the test results shown in Table 3. The results indicate that although nitrogen and phosphorus were not completely removed from the raw materials, the residual content had a negligible impact on subsequent test outcomes.
Table 4 shows the organic matter, pH, and particle size at different depths. In order to analyze more comprehensively the accumulation characteristics of pollutants in soil roadbeds, we determined the organic matter content, pH and particle composition of soils at different depths. These parameters are key factors influencing the adsorption, transport and transformation behavior of pollutants.
After the simulated rainfall experiment, three representative sampling points were selected within the permeable pavement. At each sampling point, soil samples were collected at different depths (0–10 cm, 10–20 cm, 20–30 cm, 30–40 cm, and 40–50 cm). Subsequently, the soil samples of the same depth were thoroughly mixed, air-dried naturally, gently crushed, and passed through a 100-mesh sieve. Finally, the samples were stored in brown glass bottles for the analysis of TP, TN, NH4+-N, Cu, Zn, and Pb.

2.5. Detection and Evaluation Methods of Soil Pollutants

Following sampling, various analytical methods were employed to test the soil samples. Copper (Cu), lead (Pb), and zinc (Zn) were analyzed by flame atomic absorption spectrophotometry. Table 5 details the tested parameters and analytical methods for the soil samples. The specific testing procedures for NH4+-N, TN, and TP are as follows:
NH4+-N: The indophenol blue colorimetric method was employed to measure NH4+-N content. First, NH4+-N was extracted from the sample using KCl solution at pH 7. Subsequently, 1 mL of phenol-sodium hypochlorite reagent was added. The hypochlorite ions in the extract reacted with phenol to produce a blue indophenol dye. Using a blank experiment as reference, the absorbance of the colored solution is measured at 625 nm using a UV spectrophotometer. The NH4+-N concentration in the filtrate is calculated based on the NH4+-N standard curve.
TN and TP: TN is determined by the Kjeldahl method. Samples are digested using concentrated H2SO4 and a catalyst to convert nitrogen into ammonium salts. NaOH solution is added and nitrogen is distilled off. A 2% boric acid solution is then added, producing boric acid salt while the absorption solution changes from burgundy to blue-green. Titration with HCl solution is performed, and the TN content is finally calculated. Titrate the absorption solution in the conical flask with standard HCl solution until the solution changes precisely from blue-green to wine-red. Total phosphorus (TP) content is determined using the alkali fusion-molybdenum antimony spectrophotometric method. Soil samples are alkali-fused using anhydrous Na2CO3. Add 2 mL of molybdenum antimony coloring agent to the sample solution, mix thoroughly, and allow to stand in the dark. Using a blank experiment as reference, measure the absorbance at 700 nm wavelength. Calculate the TP concentration in the test solution based on the TP standard curve.
After sampling, various indicator detection methods are adopted to detect the soil samples. For the soil samples, TN was determined by the Kjeldahl method, NH4+-N was measured by the indophenol blue colorimetry method, and TP was detected by the alkali fusion-molybdenum antimony resistance spectrophotometry method. Cu, Pb, and Zn were detected by atomic absorption spectrophotometry. When evaluating soil pollutants in permeable pavement, in order to avoid homogeneity, three evaluation methods for soil pollutant indexes were selected for analysis. The detailed information is shown in Table 6. The “Soil Environmental Quality Standard for Agricultural Land” (GB 15618-2018) [19] and the background values of soil elements in Jiangsu Province were selected as the background values of heavy metals (Table 7).

2.6. Statistical Analysis Methods for Regression Models

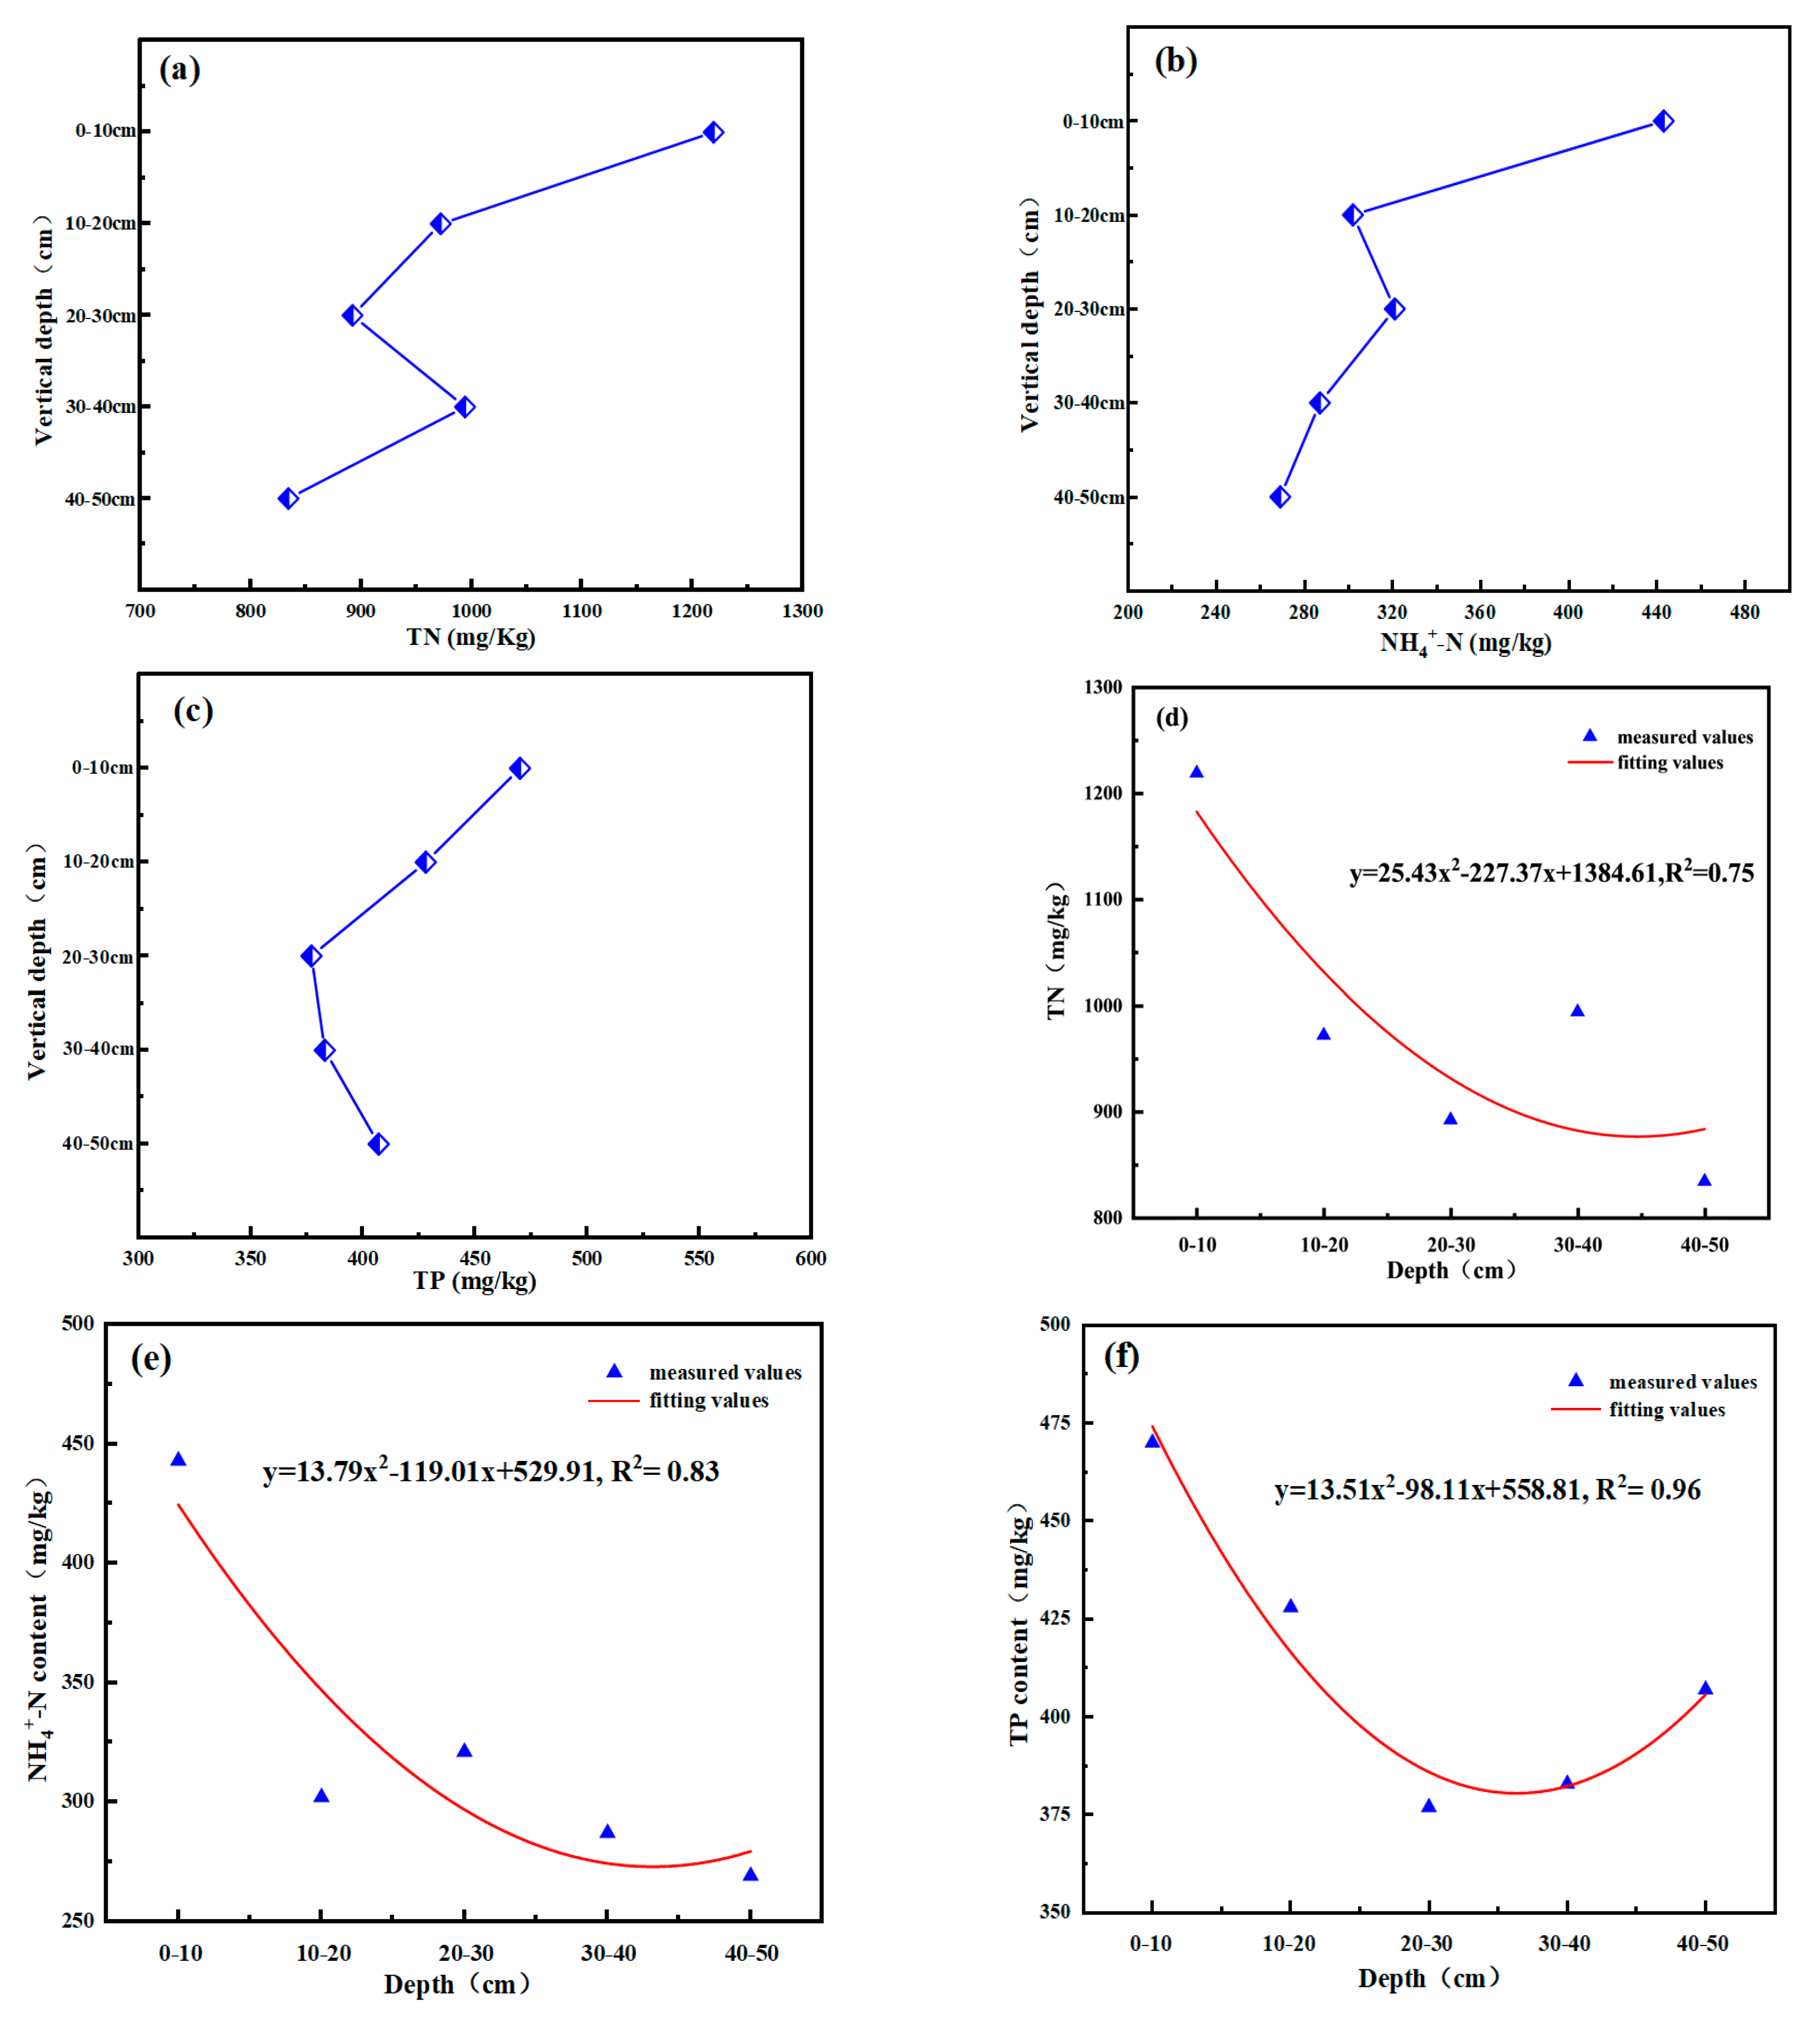
Based on the preliminary scatter plot trends of pollutant content versus depth (Figure 2a–c), a quadratic polynomial regression model was selected for fitting and comparison. The relationship is modeled as y = ax2 + bx + c, where y represents the pollutant content, x denotes the soil depth, and a, b, c are the regression coefficients. The goodness of fit was evaluated using the coefficient of determination (R2).
To further quantify the relationship between TN, TP and NH4+-N content and soil depth, Pearson correlation analysis was conducted to calculate the correlation coefficient (r) and determine the strength of the linear association. The correlation strength was classified as follows: |r| ≥ 0.7 indicates a strong correlation, 0.3 ≤ |r| < 0.7 indicates a moderate correlation, and |r| < 0.3 indicates a weak correlation.

3. Results and Analysis

3.1. N and P Accumulation Characteristics

In the subgrade soil beneath the road structural layer, the contents of organic matter, N and P are important ecological indicators, and they play a crucial role in the circulation of groundwater and soil nutrients. The distribution patterns of these components can reveal the accumulation status of pollutants in the subgrade soil. Figure 2 shows the changing trends of the contents of N and P with depth in the soil foundation of the permeable asphalt pavement.
From Figure 2a, it can be observed that the TN content in the permeable asphalt pavement subgrade generally shows a fluctuating decrease with increasing depth. The content of TN is the highest in the surface layer (0–10 cm) of the soil foundation of the permeable asphalt pavement, with an average value of 1219 mg/kg. However, the TN content at a depth of 40–50 cm is only 834 mg/kg, which is 31.58% lower than that in the soil foundation at a depth of 0–10 cm. This indicates that TN in the soil foundation of the permeable asphalt pavement mainly accumulates in the surface layer (0–10 cm) of the soil. It may be caused by the obvious scouring effect on the surface layer when rainwater passes through the structural layer and enters the soil foundation of the permeable asphalt pavement, which is consistent with the previous research results. Jiang et al. found a significant positive correlation between the surface enrichment of TN in soil under permeable paving and the filtration and interception efficiency of the pore structure of the paving over a period of 5 years of field monitoring [20]. Razzaghmanesh studied the long-term effects of different types of permeable road surfaces on the quality of rainwater infiltration and believed that the TN in rainwater is likely to accumulate in the surface layer of permeable road surfaces [21]. Van Meter et al. studied the accumulation characteristics of nitrogen content in agricultural soils in the Midwest of the United States. The results showed that the TN concentration in agricultural soils increased with the increase of soil depth, presenting the order of 0–25 cm > 25–50 cm > 50–75 cm, and exhibited the characteristic of surface layer aggregation [22]. Wang et al. conducted a simulated rainfall experiment to study the distribution characteristics of pollutants in the substrate of ecological ditches after three years of operation and found that the TN content in the horizontal direction of the ecological ditch substrate was higher at the front end than at the rear end [23]. Additionally, the accumulation characteristics were influenced by factors such as the physical and chemical properties of the substrate and the hydrological and climatic environment.
The variation trend of NH4+-N content in the permeable asphalt pavement subgrade is similar to that of TN (Figure 2b). The highest NH4+-N concentration is found in the surface layer of the subgrade (0–10 cm), with a concentration of 443.1 mg/kg. At a depth of 20–30 cm, the NH4+-N content increases compared to the 10–20 cm layer, with a growth rate of 5.9%. In the subgrade at depths of 30–50 cm, the NH4+-N content fluctuates significantly, especially at the 30–40 cm depth, where the concentration drops from 327.1 mg/kg at 20–30 cm to 286.4 mg/kg, a decrease of 40.7 mg/kg. Therefore, it can be seen that NH4+-N is primarily distributed within the 0–20 cm layer of the permeable asphalt pavement subgrade. Wang et al. observed in a simulated rainfall experiment that the vertical transport of NH4+-N in soil was significantly affected by the content of soil clay particles, and that for every 5% increase in the proportion of clay particles [24]. Feng et al. suggested that the main sources of nitrogen in soil include the decomposition of plant residues, the application of organic fertilizers, soil microbial activity, nitrogen fixation, and the use of chemical fertilizer [25]. The spatial distribution characteristics of nitrogen in the soil are influenced by various factors, including soil type, climate conditions, soil moisture status, organic matter content, and rainfall characteristic. Among them, the scouring effect of rainwater runoff can lead to the accumulation of nitrogen-containing pollutants on the soil surface. In the process of nitrogen migration and transformation, the soil has a strong adsorption capacity for NH4+-N. Therefore, the NH4+-N concentration is higher in the surface layer of the permeable pavement. This phenomenon is consistent with the findings of Hu et al. [26]. In our previous research, it was found that the role of microorganisms and the mineralization process of inorganic nitrogen also affect the content of NH4+-N [23]. Therefore, the variation in nitrogen content in the soil is a complex process influenced by the combined effects of multiple factors.
Figure 2c shows that the variation trend of the TP content in the soil foundation of the permeable asphalt pavement is significantly different from that of the TN. The content gradually decreases within the range of 0–30 cm, and then slightly increases within the range of 30–50 cm. Specifically, the highest value of the TP content occurs at a soil foundation depth of 0–10 cm, with an average content of 470.3 mg/kg, while the minimum value of 376.7 mg/kg is found at a depth of 20–30 cm. However, when the depth continues to increase to 30–40 cm and 40–50 cm, respectively, the TP content increases to 378.5 mg/kg and 407.8 mg/kg, respectively. Scholz et al. for different types of permeable paving showed that the risk of deep transport of TP under permeable brick paving was 17–22% lower than that of permeable asphalt paving because the adsorption capacity of brick material for phosphate was significantly higher than that of asphalt material [27]. This indicates that phosphorus has an obvious migration trend during the runoff process and accumulates in the deep layer. In addition, the relatively gentle vertical change in the TP content further confirms the migration phenomenon of phosphorus. This is because after the dissolved phosphorus in the rainwater runoff infiltrates into the soil foundation of the permeable asphalt pavement, it is affected by the scouring of rainwater and migrates to a deeper depth [28].
The nonlinear quadratic fitting results for TN, NH4+-N, and TP concentrations at different vertical depths are shown in Figure 2d–f. The study indicates that the N and P content in the soil base beneath permeable asphalt pavement exhibits a strong quadratic nonlinear relationship with depth, with all R2 values exceeding 0.7. Notably, TP shows an exceptionally high R2 of 0.96, demonstrating a very strong quadratic curve relationship. This suggests that as depth increases, the TP concentration first decreases and then slightly increases. Additionally, NH4+-N exhibited an R2 of 0.83, indicating a distinct quadratic relationship between TP and NH4+-N concentrations and vertical depth within the permeable pavement system.
Figure 3 presents Pearson correlation analyses between vertical depth and TN, NH4+-N, and TP concentrations. The figure reveals a negative correlation between vertical depth and concentrations of TN, NH4+-N, and TP. Specifically, the correlation coefficient r between TP concentration and depth is −0.72, indicating a moderate correlation. Meanwhile, the correlation coefficients for TN and NH4+-N concentrations with vertical depth are −0.80 and −0.83, respectively, reflecting a strong correlation. Moreover, nitrogen (especially NH4+-N) exhibits a stronger correlation with depth than phosphorus. This may be due to the fact that nitrogen migration is constrained by both structural interception and soil adsorption, resulting in a stronger dependence on depth. In contrast, phosphorus, with its partially soluble forms capable of diffusing into deeper layers, shows a relatively weaker correlation.

3.2. The Evaluation of N and P Pollution Characteristics

Table 8 shows the classification standards and distribution proportions of TN and TP in the soil foundation of the permeable asphalt pavement. According to the “Classification Standards of the Second National Soil Census”, in the soil foundation of 0–50 cm, the proportions of the TN content reaching the third-level, fourth-level and fifth-level standards are 40%, 40% and 20%, respectively; at the surface layer of 0–20 cm, the TN generally meets the third-level standard, indicating that the scouring of TN in the rainwater runoff has a certain degree of accumulation on the surface layer of the subgrade soil. In contrast, the proportions of the TP content reaching the fourth-level and fifth-level standards are 60% and 40%, respectively. Specifically, in the soil of the surface layer of 0–20 cm and 40–50 cm, the TP reaches the fourth-level standard, while in the depth range of 20–40 cm, the TP content reaches the fifth-level standard, indicating that there is partial accumulation of phosphorus in the surface layer and loss in the middle and lower parts.
Therefore, in areas with a shallow groundwater table, measures should be taken to prevent soluble nitrogen and phosphorus from triggering secondary soil disasters. In the design of permeable roads, a water storage layer can be added at a specific depth to enhance the removal efficiency of nitrogen. Liu et al. designed a “permeable pavement—water storage layer” composite system by installing a gravel water storage layer at a depth of 20–30 cm, the TN removal efficiency can be increased by 30~35%, and the retention effect of the water storage layer prolongs the contact time of the rainwater with the soil, and promotes microbial denitrification [13]. At the same time, it is particularly important to increase the use of materials for the water storage layer and cushion layer, such as industrial and agricultural waste and immobilized slag. This can increase the contents of calcium, magnesium, aluminum and iron salts in the structural layer of the permeable pavement, thereby promoting the complexation of phosphates with metal ions and the formation of precipitates in the infiltrated runoff. Wu et al. added steel slag to the base layer of permeable pavement and found that its removal rate of phosphate roots increased from 45% of the conventional base layer to 78%. This is because Ca2+ and Fe3+ in the steel slag can form stable precipitates (Ca3(PO4)2, FePO4) with phosphate roots [29]. In addition, based on the concept of “infiltration, storage and drainage”, the permeable asphalt pavement can be designed as a Type II or Type I semi-permeable structure. This can effectively guide rainwater to other rainwater treatment facilities for reuse, thus achieving more rational water resource management.

3.3. The Characteristics of Heavy Metal Accumulation

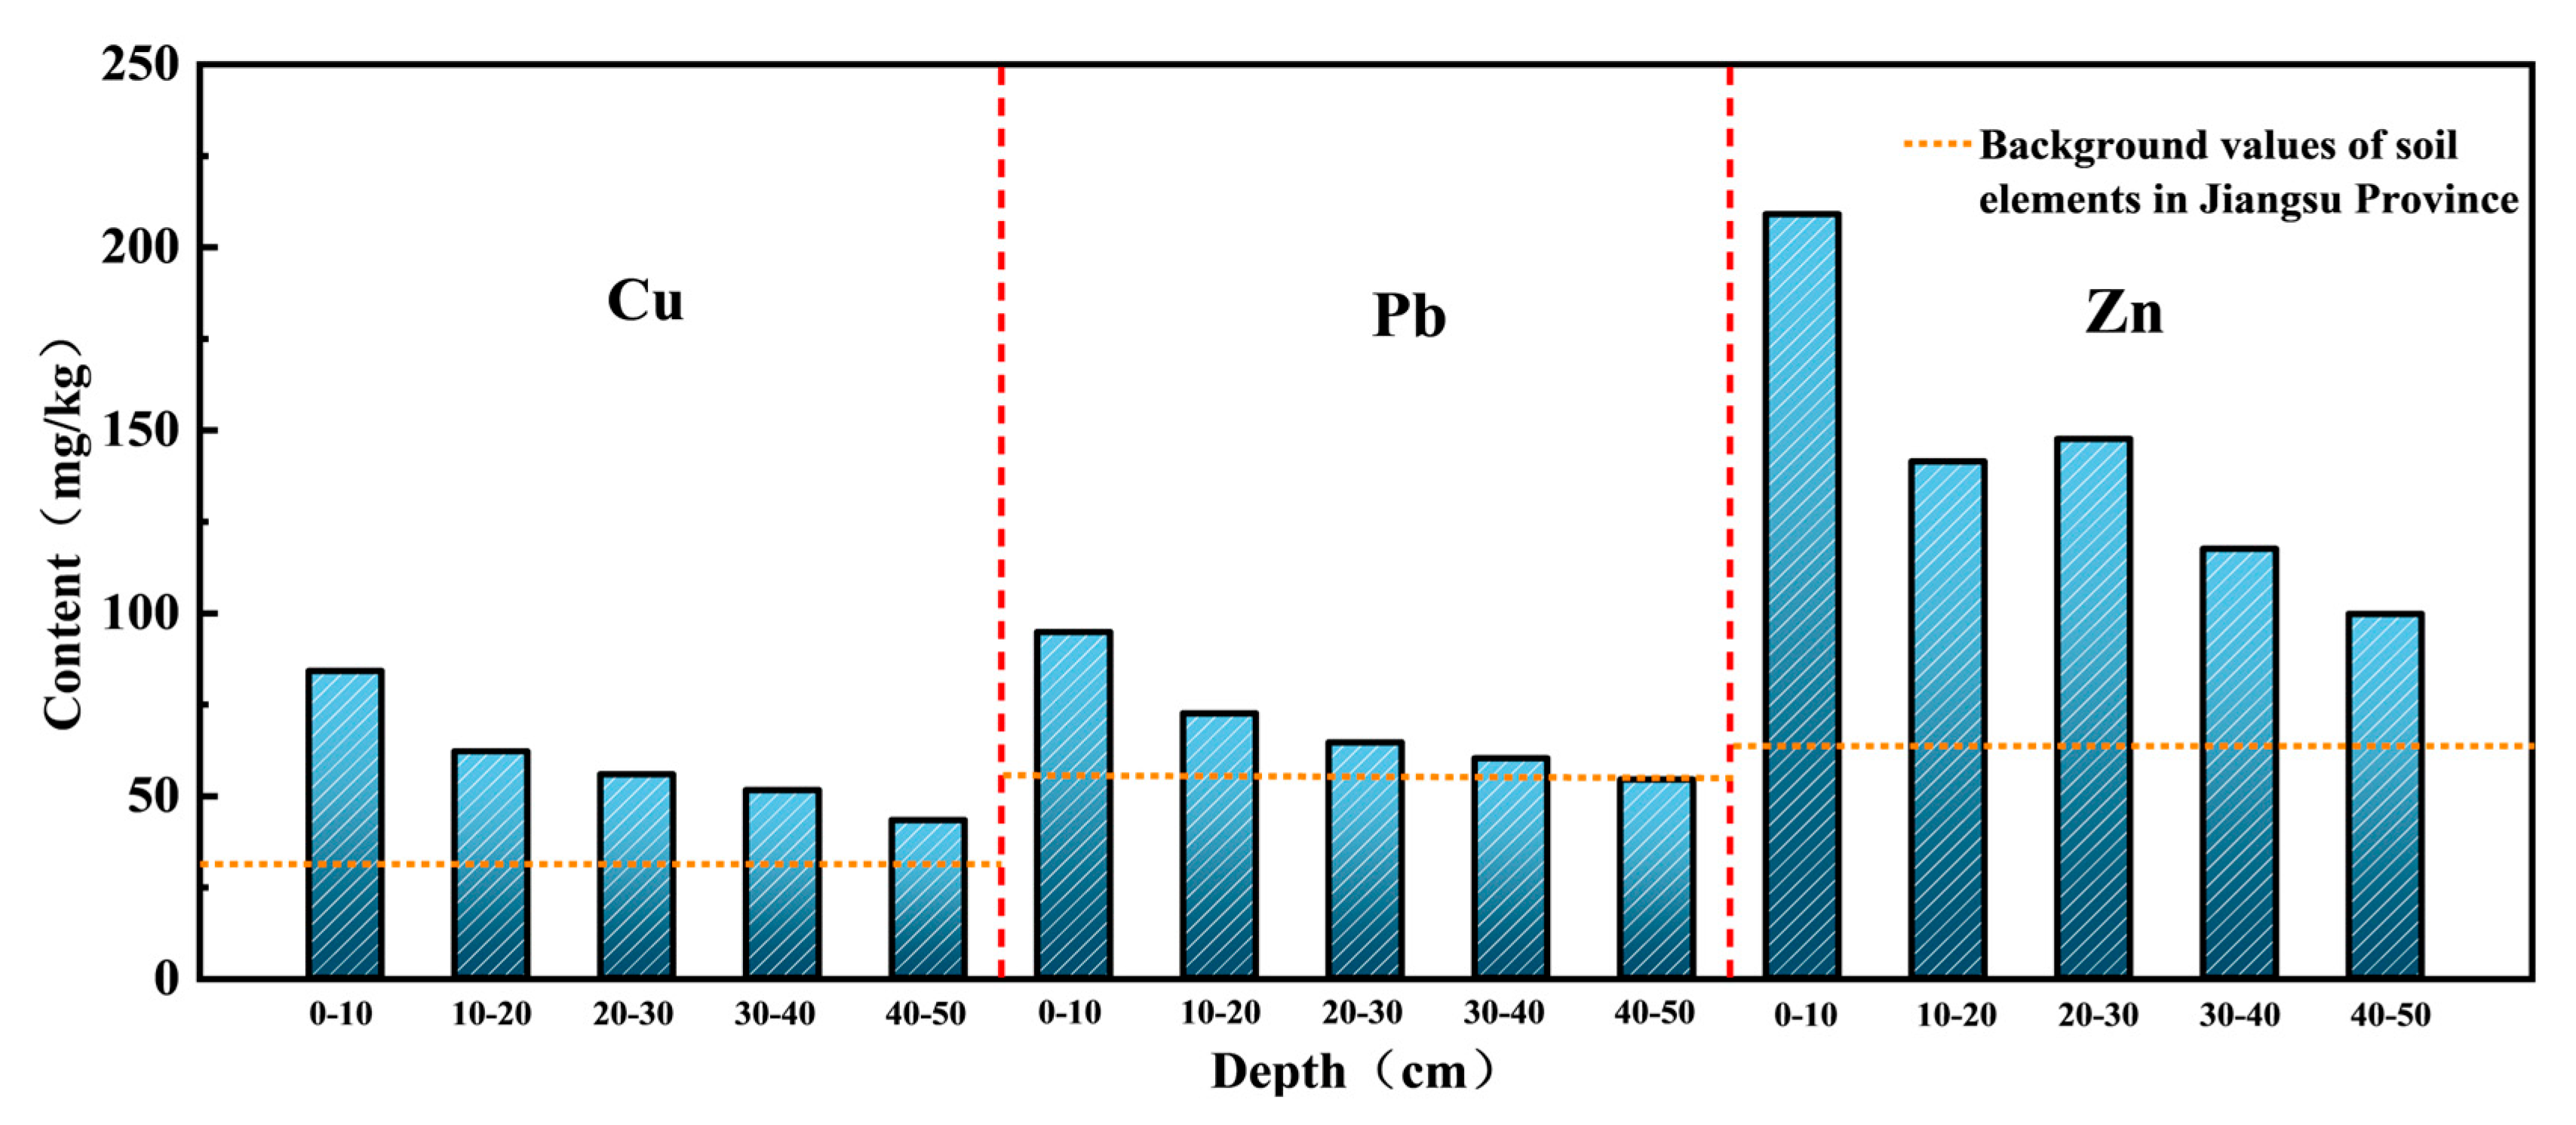
The infiltration of rainwater runoff causes the heavy metals in the surface sediments of the road to seep down into the soil foundation. This will contaminate the urban soil ecosystem and the groundwater ecosystem, exerting a serious impact on the ecological environment [30,31]. The variation patterns of the contents of Cu, Pb and Zn in the soil foundation of the permeable asphalt pavement with the depth of the soil foundation are shown in Figure 4. Figure 4 shows that as the depth increases, the contents of the three heavy metals all show a decreasing trend, and they all accumulate seriously at the soil foundation depth of 0–10 cm. In the measurements at different depths, the content of Zn is significantly higher than those of Cu and Pb. Especially at the depth of 0–10 cm, the concentration of Zn reaches 208.4 mg/kg, which is 2.48 times and 2.19 times that of Cu and Pb, respectively. This phenomenon indicates that Zn pollution in the soil foundation of the permeable asphalt pavement is relatively remarkable. Previous studies have also found the same results. Wang studied the characteristics of urban road surface runoff pollution emissions in Xi’an City and found that the concentration of Zn in the rainwater runoff was higher than that of Cu and Pb. Luo et al. show that tire wear contributes 65–72% of Zn and brake wear contributes 58–63% of Pb to urban road runoff [32]. Subsequently, after the Zn in the rainwater runoff migrates to the subgrade with the rainwater runoff, the Zn will be intercepted on the surface layer at this time. Liu et al. analyzed using XPS and found that in soil beneath permeable pavement, Cu mainly exists in an organically bound state, while Zn is primarily in the ion exchangeable state. Due to different forms, the migration capacity of Zn is significantly higher than that of Cu [33]. Due to the limited adsorption sites in the subgrade and the relatively high concentration of Zn in the rainwater, the Zn will migrate and diffuse downward with the infiltration of the rainwater [34]. Previous studies have pointed out that the main sources of Zn in road runoff include factors such as vehicle tire wear, traffic emissions, and construction activities [31].
Compared with Cu (43.2~84.5 mg/kg), Pb accumulates more, with a concentration range of 54.1~96.7 mg/kg. In addition, the content of Pb at a depth of 40~50 cm is very close to the soil background value in Jiangsu Province, which indicates that the removal effect of Pb in the subgrade within the depth range of 0~20 cm is relatively good. In conclusion, the removal efficiencies of the permeable pavement for the three heavy metals are as follows: Zn > Pb > Cu. Chang et al. studied the adsorption capacity of soil for heavy metals in simulated rainwater runoff and found that the adsorption capacity of soil for heavy metals is in the order of Pb, Cr, As, and Cu, which further validates the results of this study [35]. Although the contents of Cu, Zn, and Pb all meet the requirements of GB15618-2018 (<100 mg/kg, <120 mg/kg, <1250 mg/kg), they are higher than the soil background values in Jiangsu Province. Moreover, with the continuous operation of the permeable pavement system, heavy metals in the subgrade will continue to accumulate. Ingvertsen et al. found that the bioretention system has a good treatment effect on pollutants in rainwater runoff. However, after long-term operation, there is still a pollution risk of heavy metal migration and accumulation [36]. Nsenga Kumwimba et al. evaluated the metal pollution risks in the sediments of artificial ditches. The results showed that Cd in the ditch sediments posed a considerable ecological risk to the environment [15]. These findings highlight the need to pay special attention to the characteristics and behaviors of different heavy metals in the design and management of permeable pavements so as to formulate targeted pollution prevention and control strategies and more effectively protect the urban environment and the quality of groundwater.

3.4. The Assessments of Heavy Metal Pollution Characteristics

Using (GB15618-2018) and the background values of soil elements in Jiangsu Province as the evaluation criteria, three methods, namely the Nemerow Index Method, the Potential Ecological Analysis Method, and the Geoaccumulation Index Method, were employed to assess the pollution situation of heavy metals. The relevant evaluation criteria are shown in Table 9, Table 10 and Table 11. The three evaluation methods are based on different theoretical frameworks, and the results they yield vary. However, these differences are not contradictory but rather reveal the pollution characteristics of heavy metals in the soil beneath permeable pavements from different dimensions. Through comparative analysis, a more comprehensive understanding of the pollution status can be achieved, providing a scientific basis for engineering practices.
The Nemero Comprehensive Index Method employs a weighted calculation between the “maximum single-factor pollution index” and the “average single-factor pollution index”, which not only highlights the contribution of high-concentration pollutants but also takes into account the overall pollution level. It is a classical method in soil heavy metal pollution assessment that addresses both extreme pollution and average pollution [37]. The core advantage of the Potential Ecological Risk Index (RI) lies in its introduction of the “heavy metal toxicity response coefficient” (Ti), which links the “content characteristics” of heavy metals with their “biological toxicity”. This addresses the limitation of the Nemero Index, which focuses solely on concentration [38]. The Geoaccumulation Index (Igeo) compares the “measured content” with the “background value” and introduces a constant k (k = 1.5 in this study) to correct for the influence of natural factors such as rock weathering on the background value. Its core objective is to distinguish between “natural pollution” and “anthropogenic pollution”, making it particularly valuable for pollution source tracing [39].

3.4.1. Nemerow Comprehensive Index Method

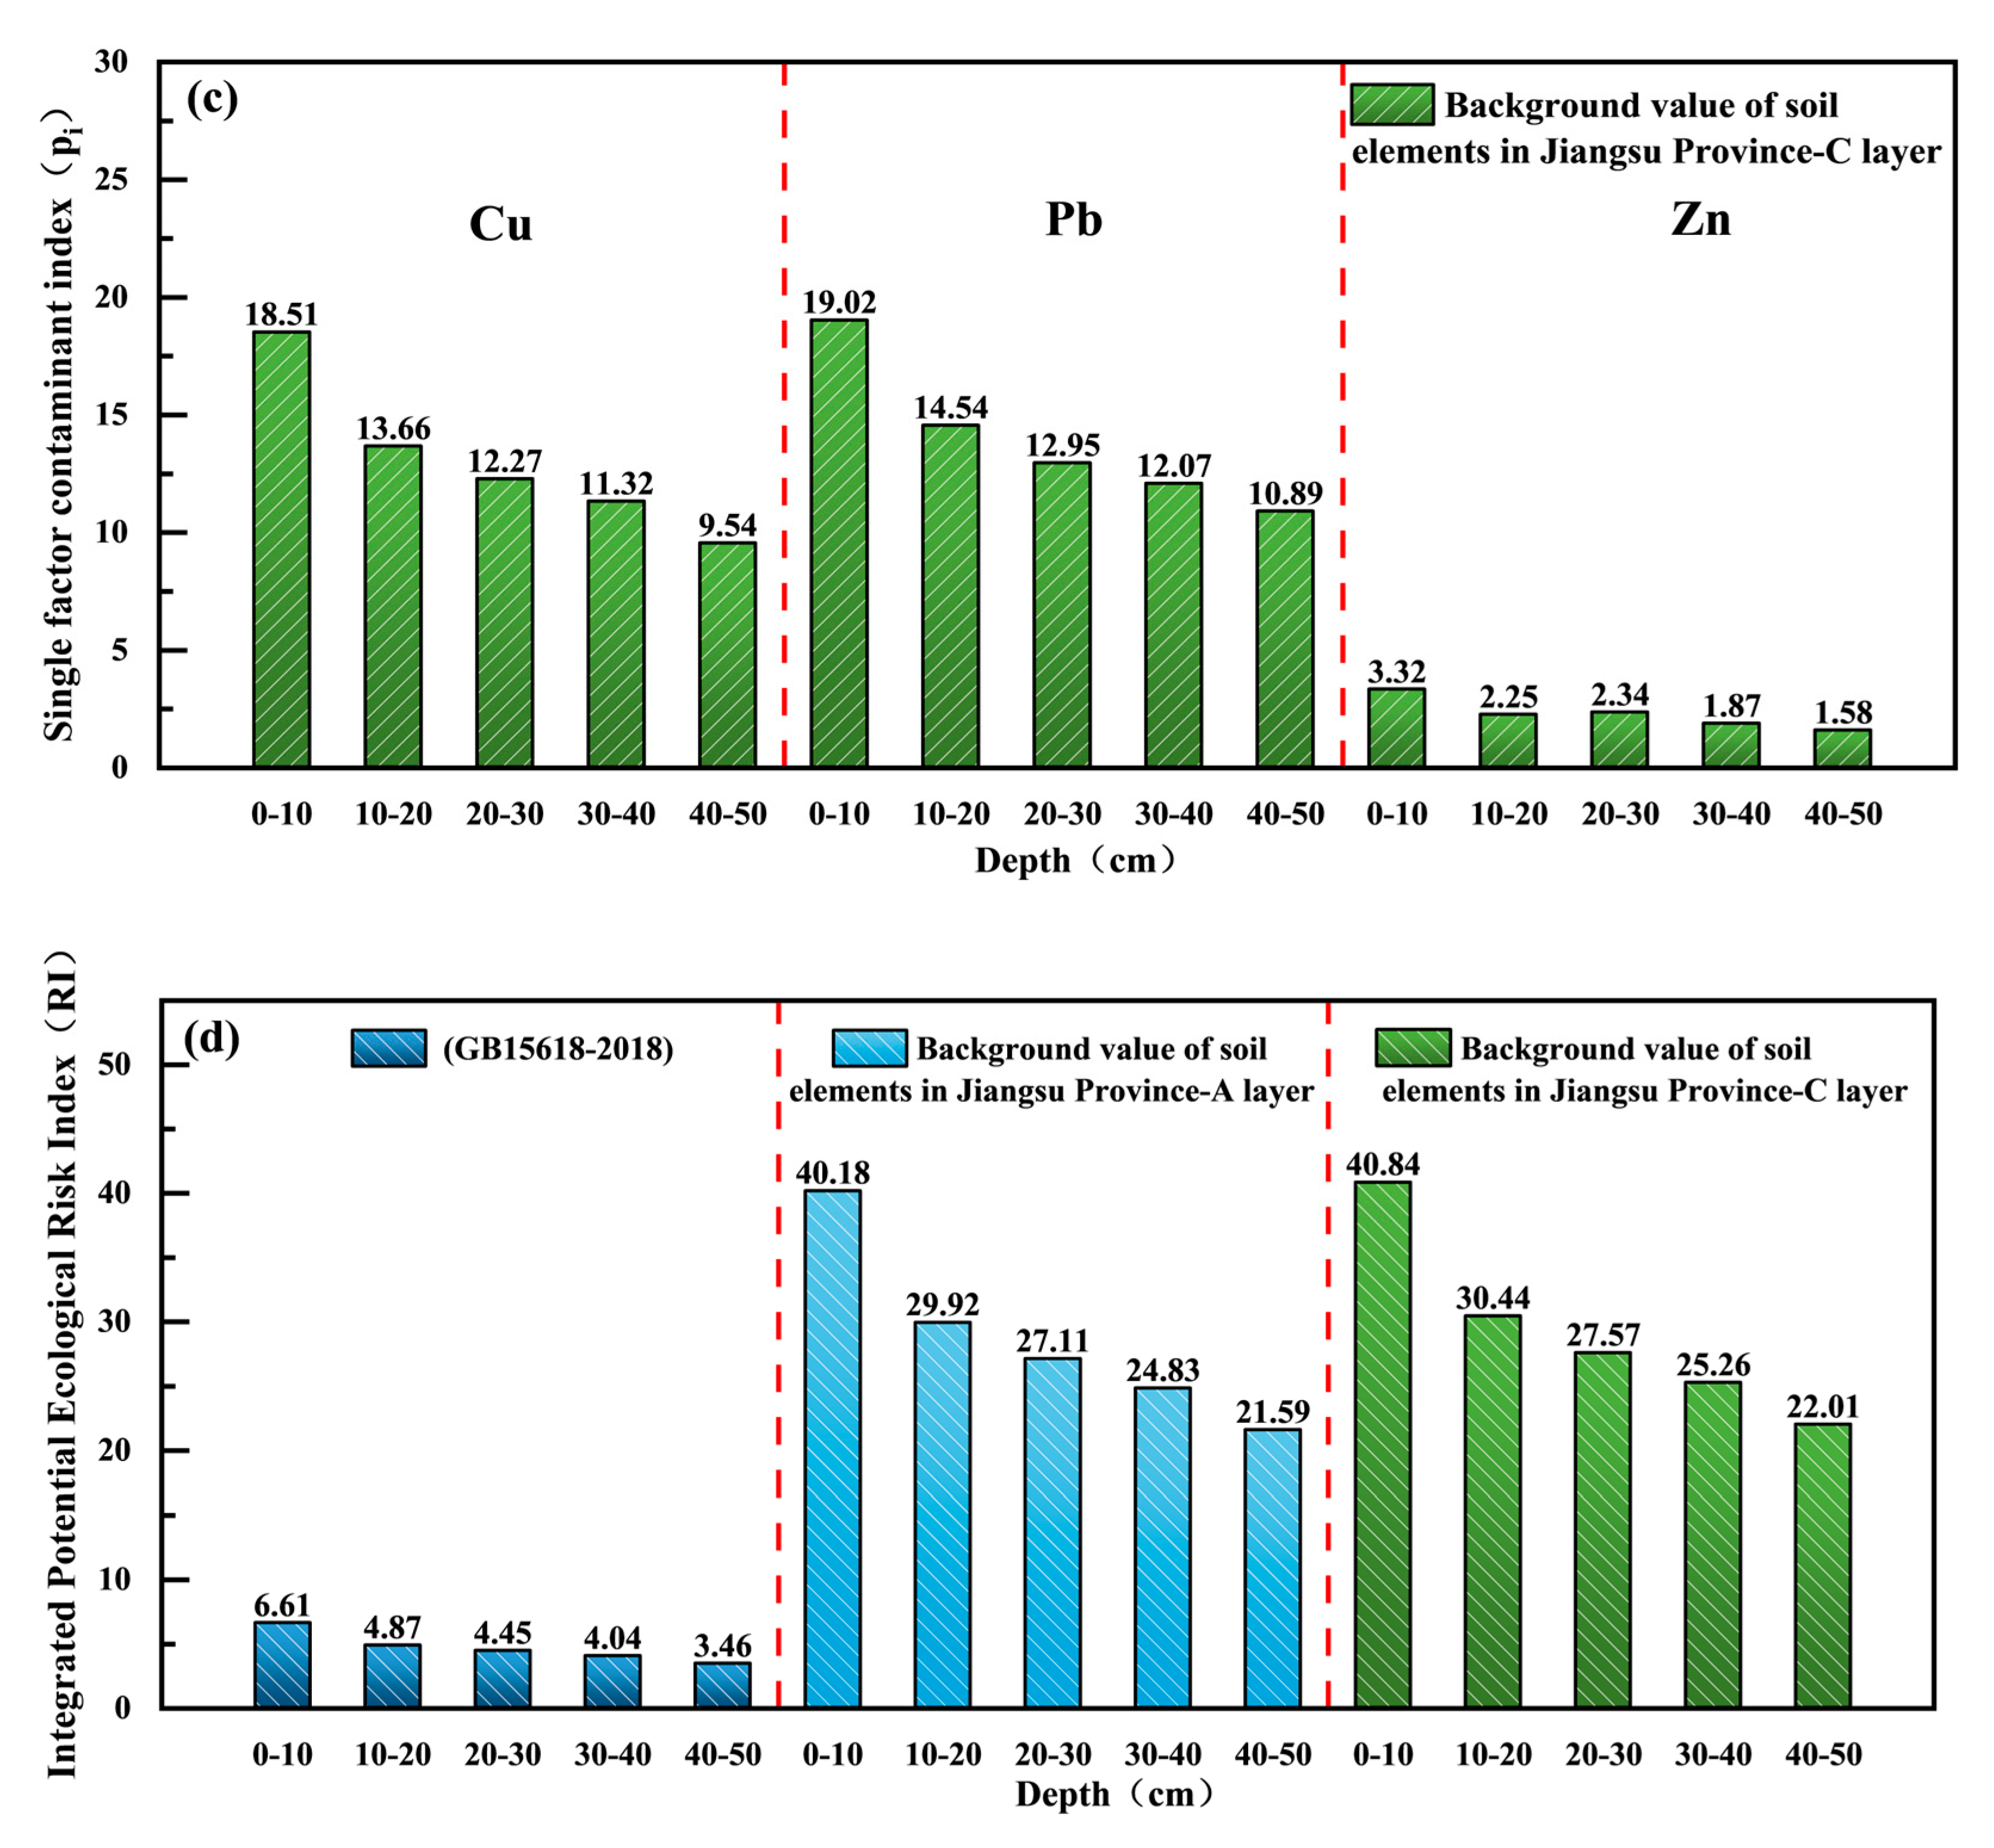
The calculation results of the Nemerow comprehensive index of the subgrade of the permeable asphalt pavement are shown in Figure 5. As shown in Figure 5a, taking (GB15618-2018) as the evaluation standard, from the perspective of single heavy metal pollution, Cu and Zn at different depths are the main pollution factors, while Pb contributes less. The single-factor pollution indices (pi) of the three heavy metals at different depths are all between 0 and 1, indicating a pollution-free level. Considering the pollution situation of the three heavy metals comprehensively (Figure 5d), except the Nemerow comprehensive pollution index (PI), which exceeds 0.7 at the depth of 0–10 cm and reaches the warning line, the PI values at other depths are between 0.39 and 0.55, showing no pollution.
In contrast, taking the soil background values of Jiangsu Province as the standard, the pi values of the three heavy metals in both Layer A and Layer C all exceed 1. In particular, the pi values at a depth of 0–10 cm all exceed 3, reaching the level of severe pollution. The PI ranges of the three heavy metals at different depths in Layer A and Layer C are 1.89–3.67 and 2.04–3.65, respectively, which are between moderate pollution and severe pollution. This indicates that the pollution caused by the three heavy metals to the subgrade of the permeable asphalt pavement is extremely serious, and the pollution on the surface layer is more serious than that in the lower layers. Among them, Cu and Pb are the main pollution factors. Kluge et al. monitored the risk of heavy metal pollution during the operation of bioretention facilities for several years and found similar results and recommended replacing the accumulated sediments or soil at the inflow points regularly as part of the daily maintenance [40].

3.4.2. Potential Ecological Analysis Method

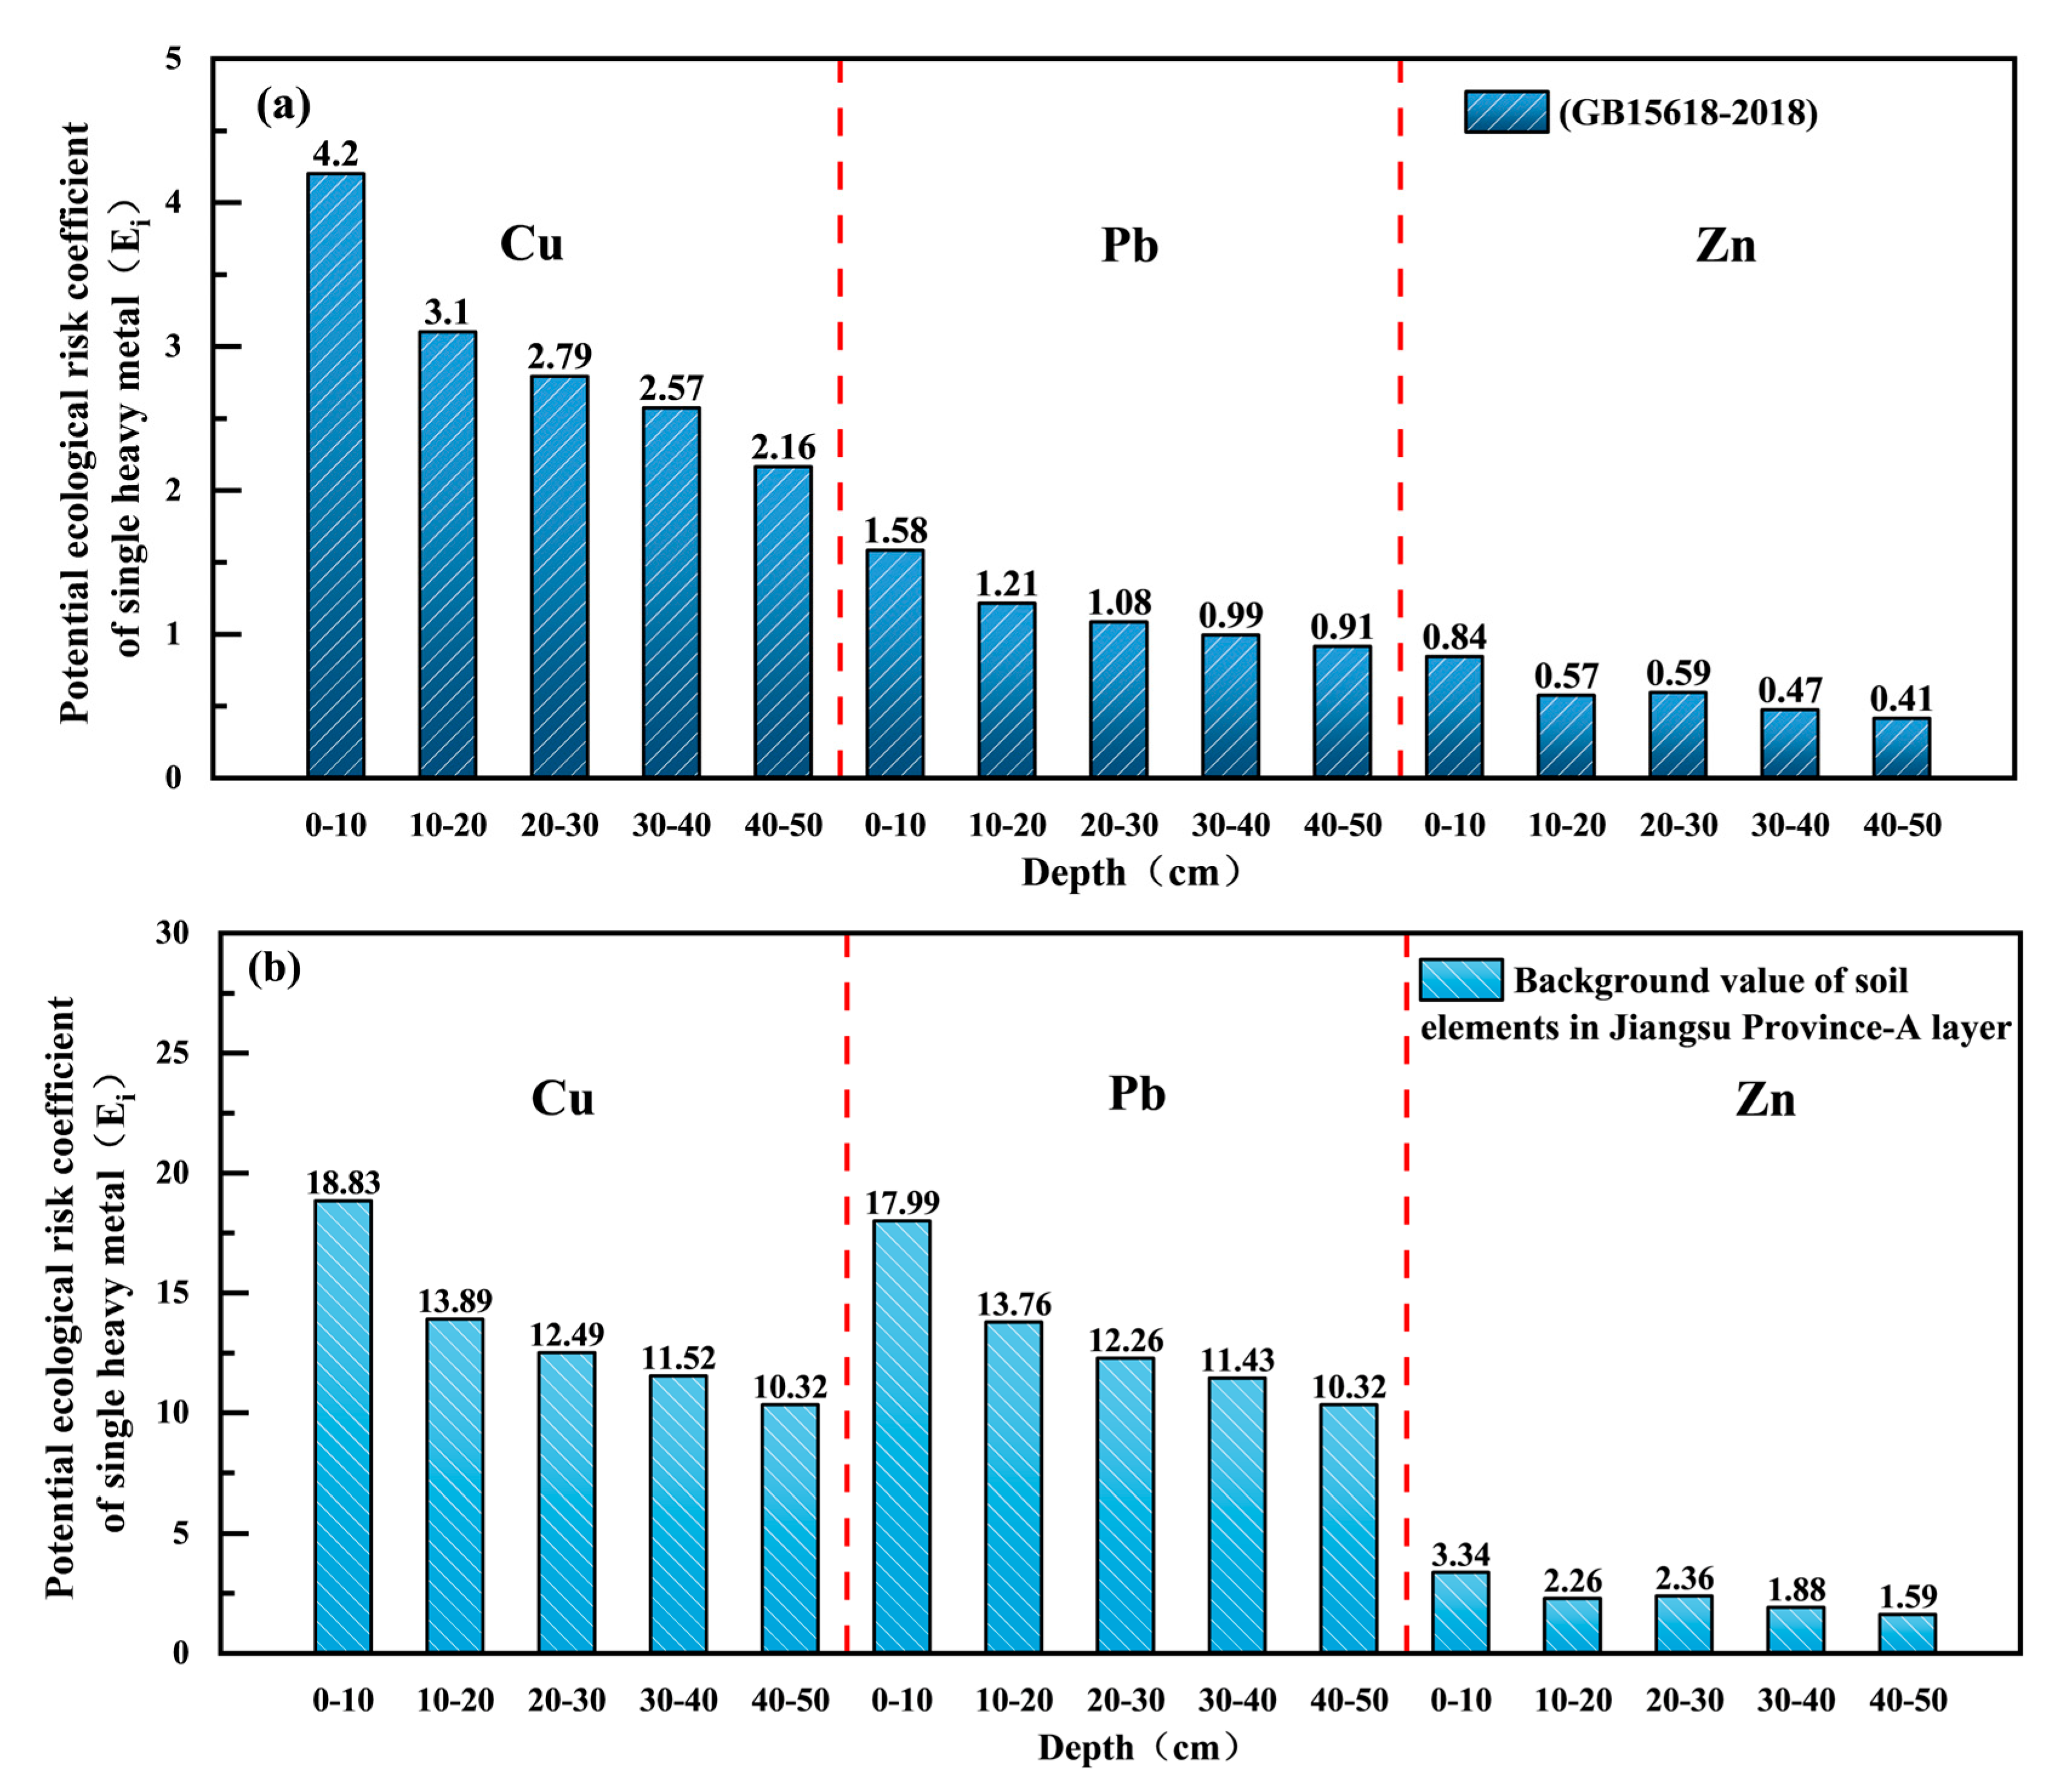
Figure 6 shows the calculation results of the Potential Ecological Risk Index Method for the subgrade of the permeable asphalt pavement. As can be seen from Figure 6a, when taking (GB15618-2018) as the evaluation standard, the potential ecological pollution coefficients Ei of the three heavy metals at different depths are all negative values, classified as the clean level in the evaluation standard of the potential ecological analysis method index, indicating that the heavy metals have not caused pollution to the permeable asphalt pavement facilities. The comprehensive potential ecological risk index (RI) of the permeable asphalt pavement facilities ranges from 3.46 to 6.61, which is at the slight pollution level. This is because the thresholds in GB 15618-2018 already account for the bioavailability of heavy metals—even if the heavy metal content in the soil is relatively high, if the metals exist in stable forms (such as the residual fraction) and cannot be absorbed by organisms, they will not pose actual toxicity. When taking the soil environmental background values of Jiangsu Province as the standard, the Ei values of the heavy metals in both Layer A and Layer C are also less than 40, classified as slight pollution. Considering the pollution situation of the three heavy metals comprehensively, although the RI values (40.18, 40.84) at a depth of 0–10 cm in both Layer A and Layer C exceed 40, they are still classified as slight pollution. This finding suggests that although the absolute concentrations of heavy metals have not reached “toxic levels”, their enrichment relative to the natural background has led to a significant increase in ecological risks. Liu et al. also put forward a point in their study on the bio-toxicity of heavy metals in wetland sediments of the Yellow River Delta [41]. Specifically, Cu and Pb in the soil may inhibit microbial activity (e.g., by reducing soil urease and phosphatase activities), thereby impairing nutrient cycling. Moreover, if the groundwater table is high, soluble forms of Cu and Pb may migrate into groundwater, posing potential threats to aquatic organism. Similarly to the evaluation by the Nemerow comprehensive index method, the pollution on the surface layer of the permeable asphalt pavement facilities is much higher than that of the deep subgrade, and Cu and Pb cause the greatest pollution to the facilities.
However, the Potential Ecological Risk Index (RI) method also has notable limitations. First, the toxicity response coefficient (Ti) is a fixed value and does not account for the influence of soil physicochemical properties (such as pH and organic matter content) on the bioavailability of heavy metals. For instance, in acidic soils, the solubility of Cu and Pb increases, leading to potentially higher actual toxicity compared to neutral soils. However, the method does not adjust for this. Second, the RI value represents the cumulative effect of multiple heavy metals and cannot distinguish the contribution of individual heavy metals. If one heavy metal (e.g., Cu) has a high Ei value, it may be masked by the lower Ei values of other less toxic heavy metals (e.g., Zn), resulting in an underestimation of the overall risk assessment. Third, the method was originally developed for lake ecosystems, and its applicability to urban soil–groundwater systems requires further validation. Urban soils, with their distinct compaction levels and organic matter content compared to natural soils, exhibit more complex pathways for heavy metal migration and transformation. Direct application of the method may lead to biased assessment results.
To address these limitations, practical applications should incorporate adjustments based on soil physicochemical properties. For example, in acidic soils (pH < 6.5), the toxicity coefficients of Cu and Pb could be appropriately increased (e.g., to 6–7) to reflect their higher bioavailability. Additionally, the “bioavailable content” (e.g., using DTPA-extractable fractions) could replace the “total content” when calculating Ei values, making the assessment results more aligned with actual ecological risks. Furthermore, for permeable pavement systems, the “structural layer interception effect” must be considered—the adsorption of heavy metals by the gravel base layer and sand bedding layer can reduce the amount entering the soil. Therefore, when calculating the RI, the heavy metal content already intercepted by the structural layers should be deducted to avoid overestimating the actual ecological risk in the soil.

3.4.3. Geoaccumulation Index Method

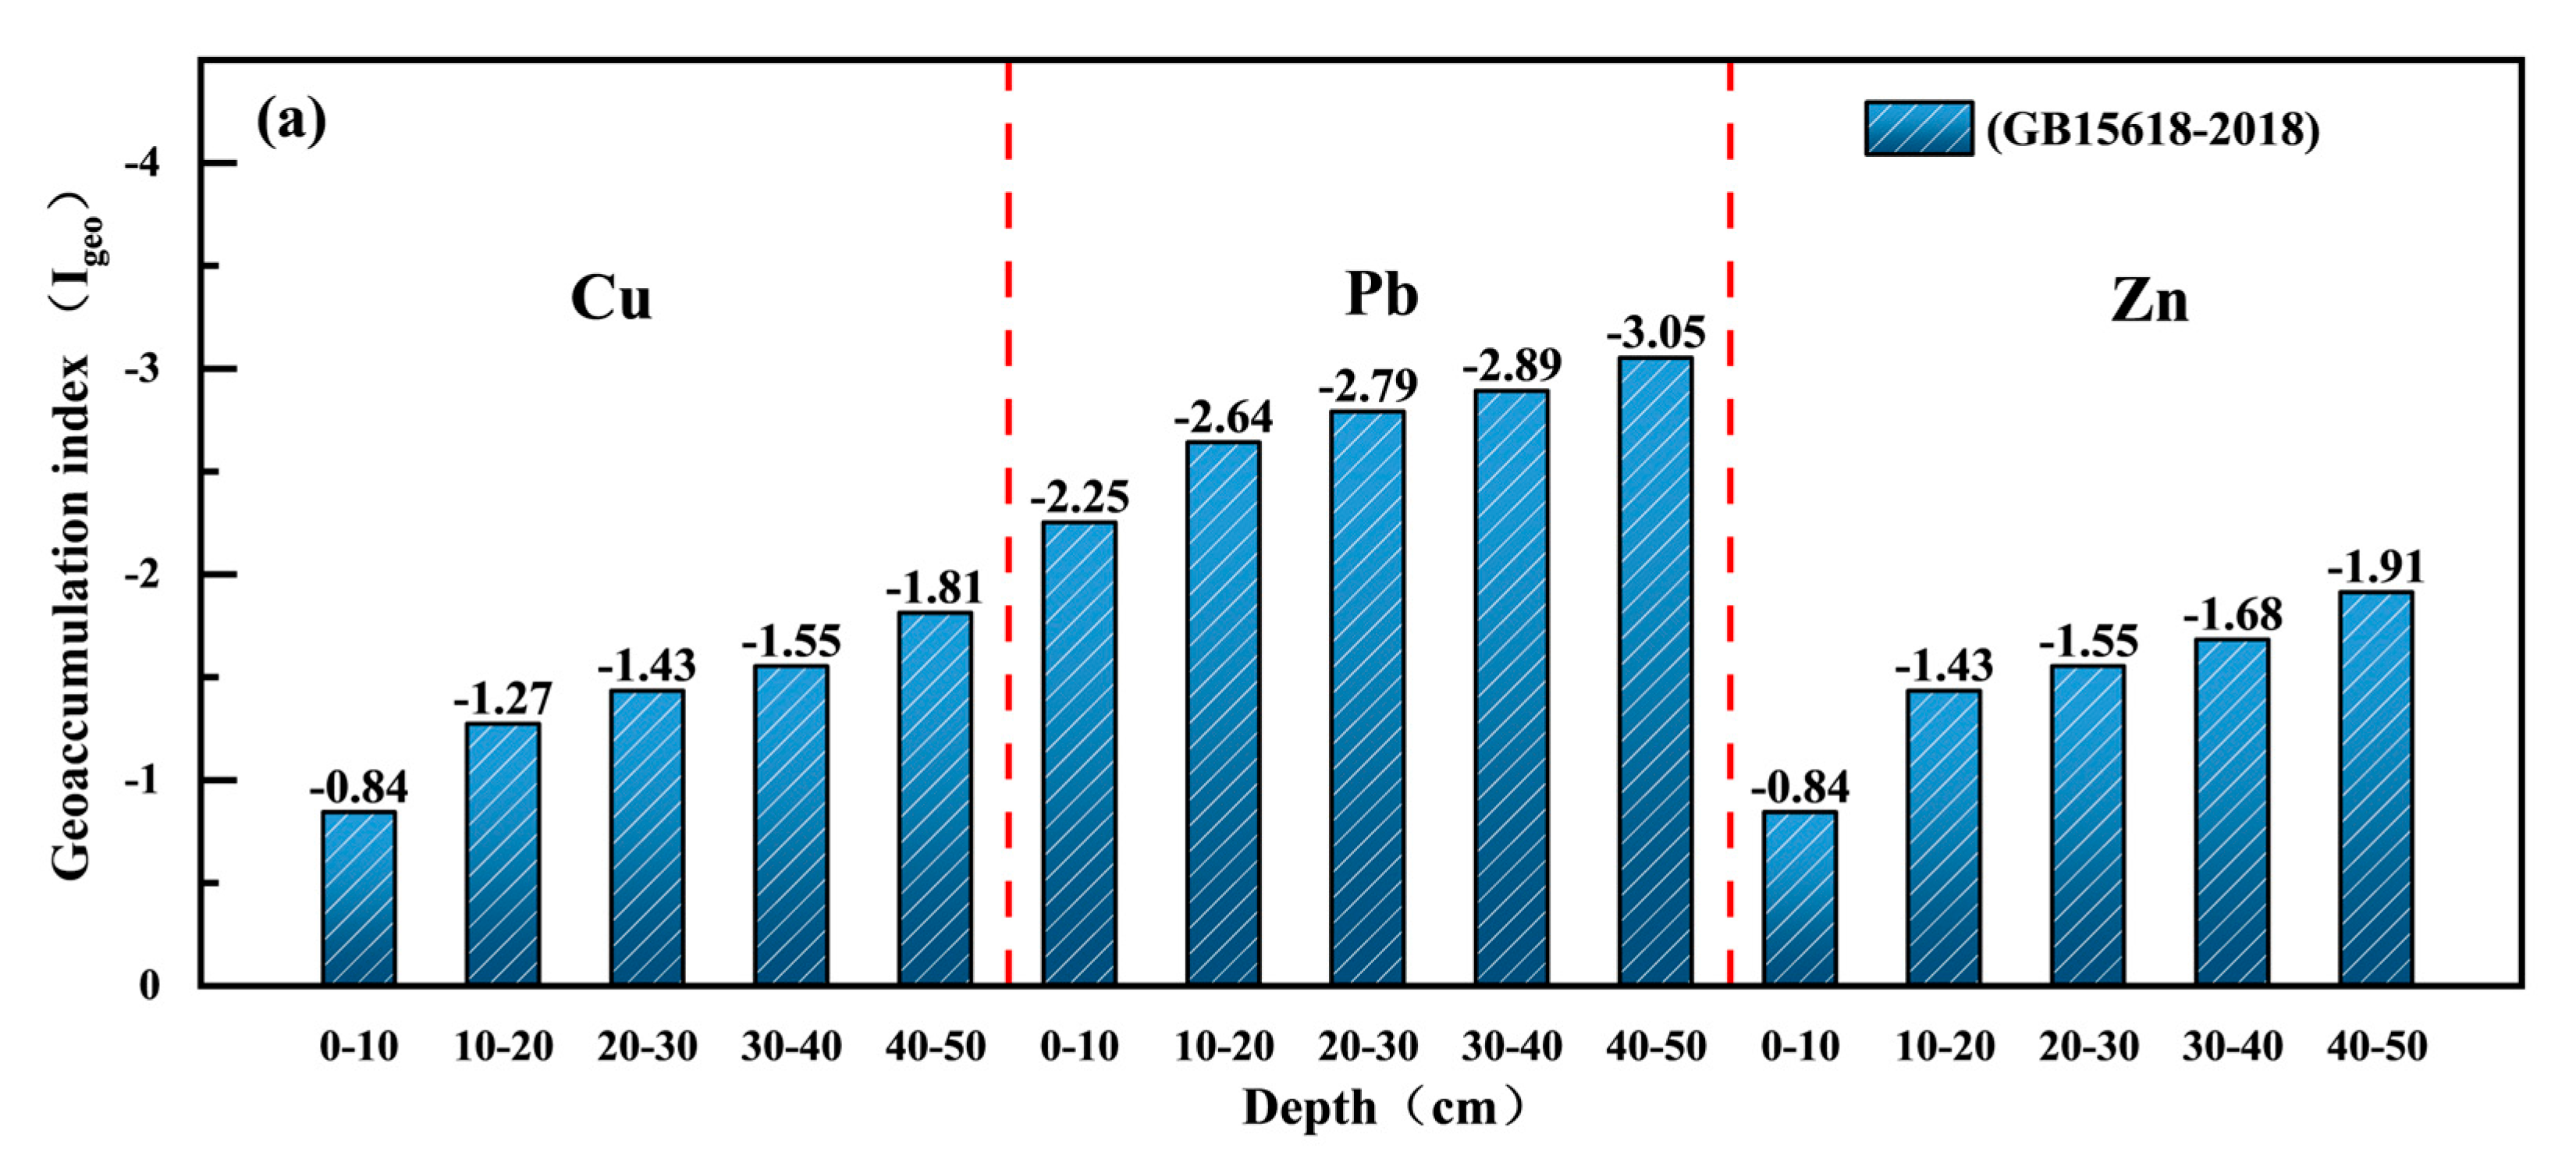
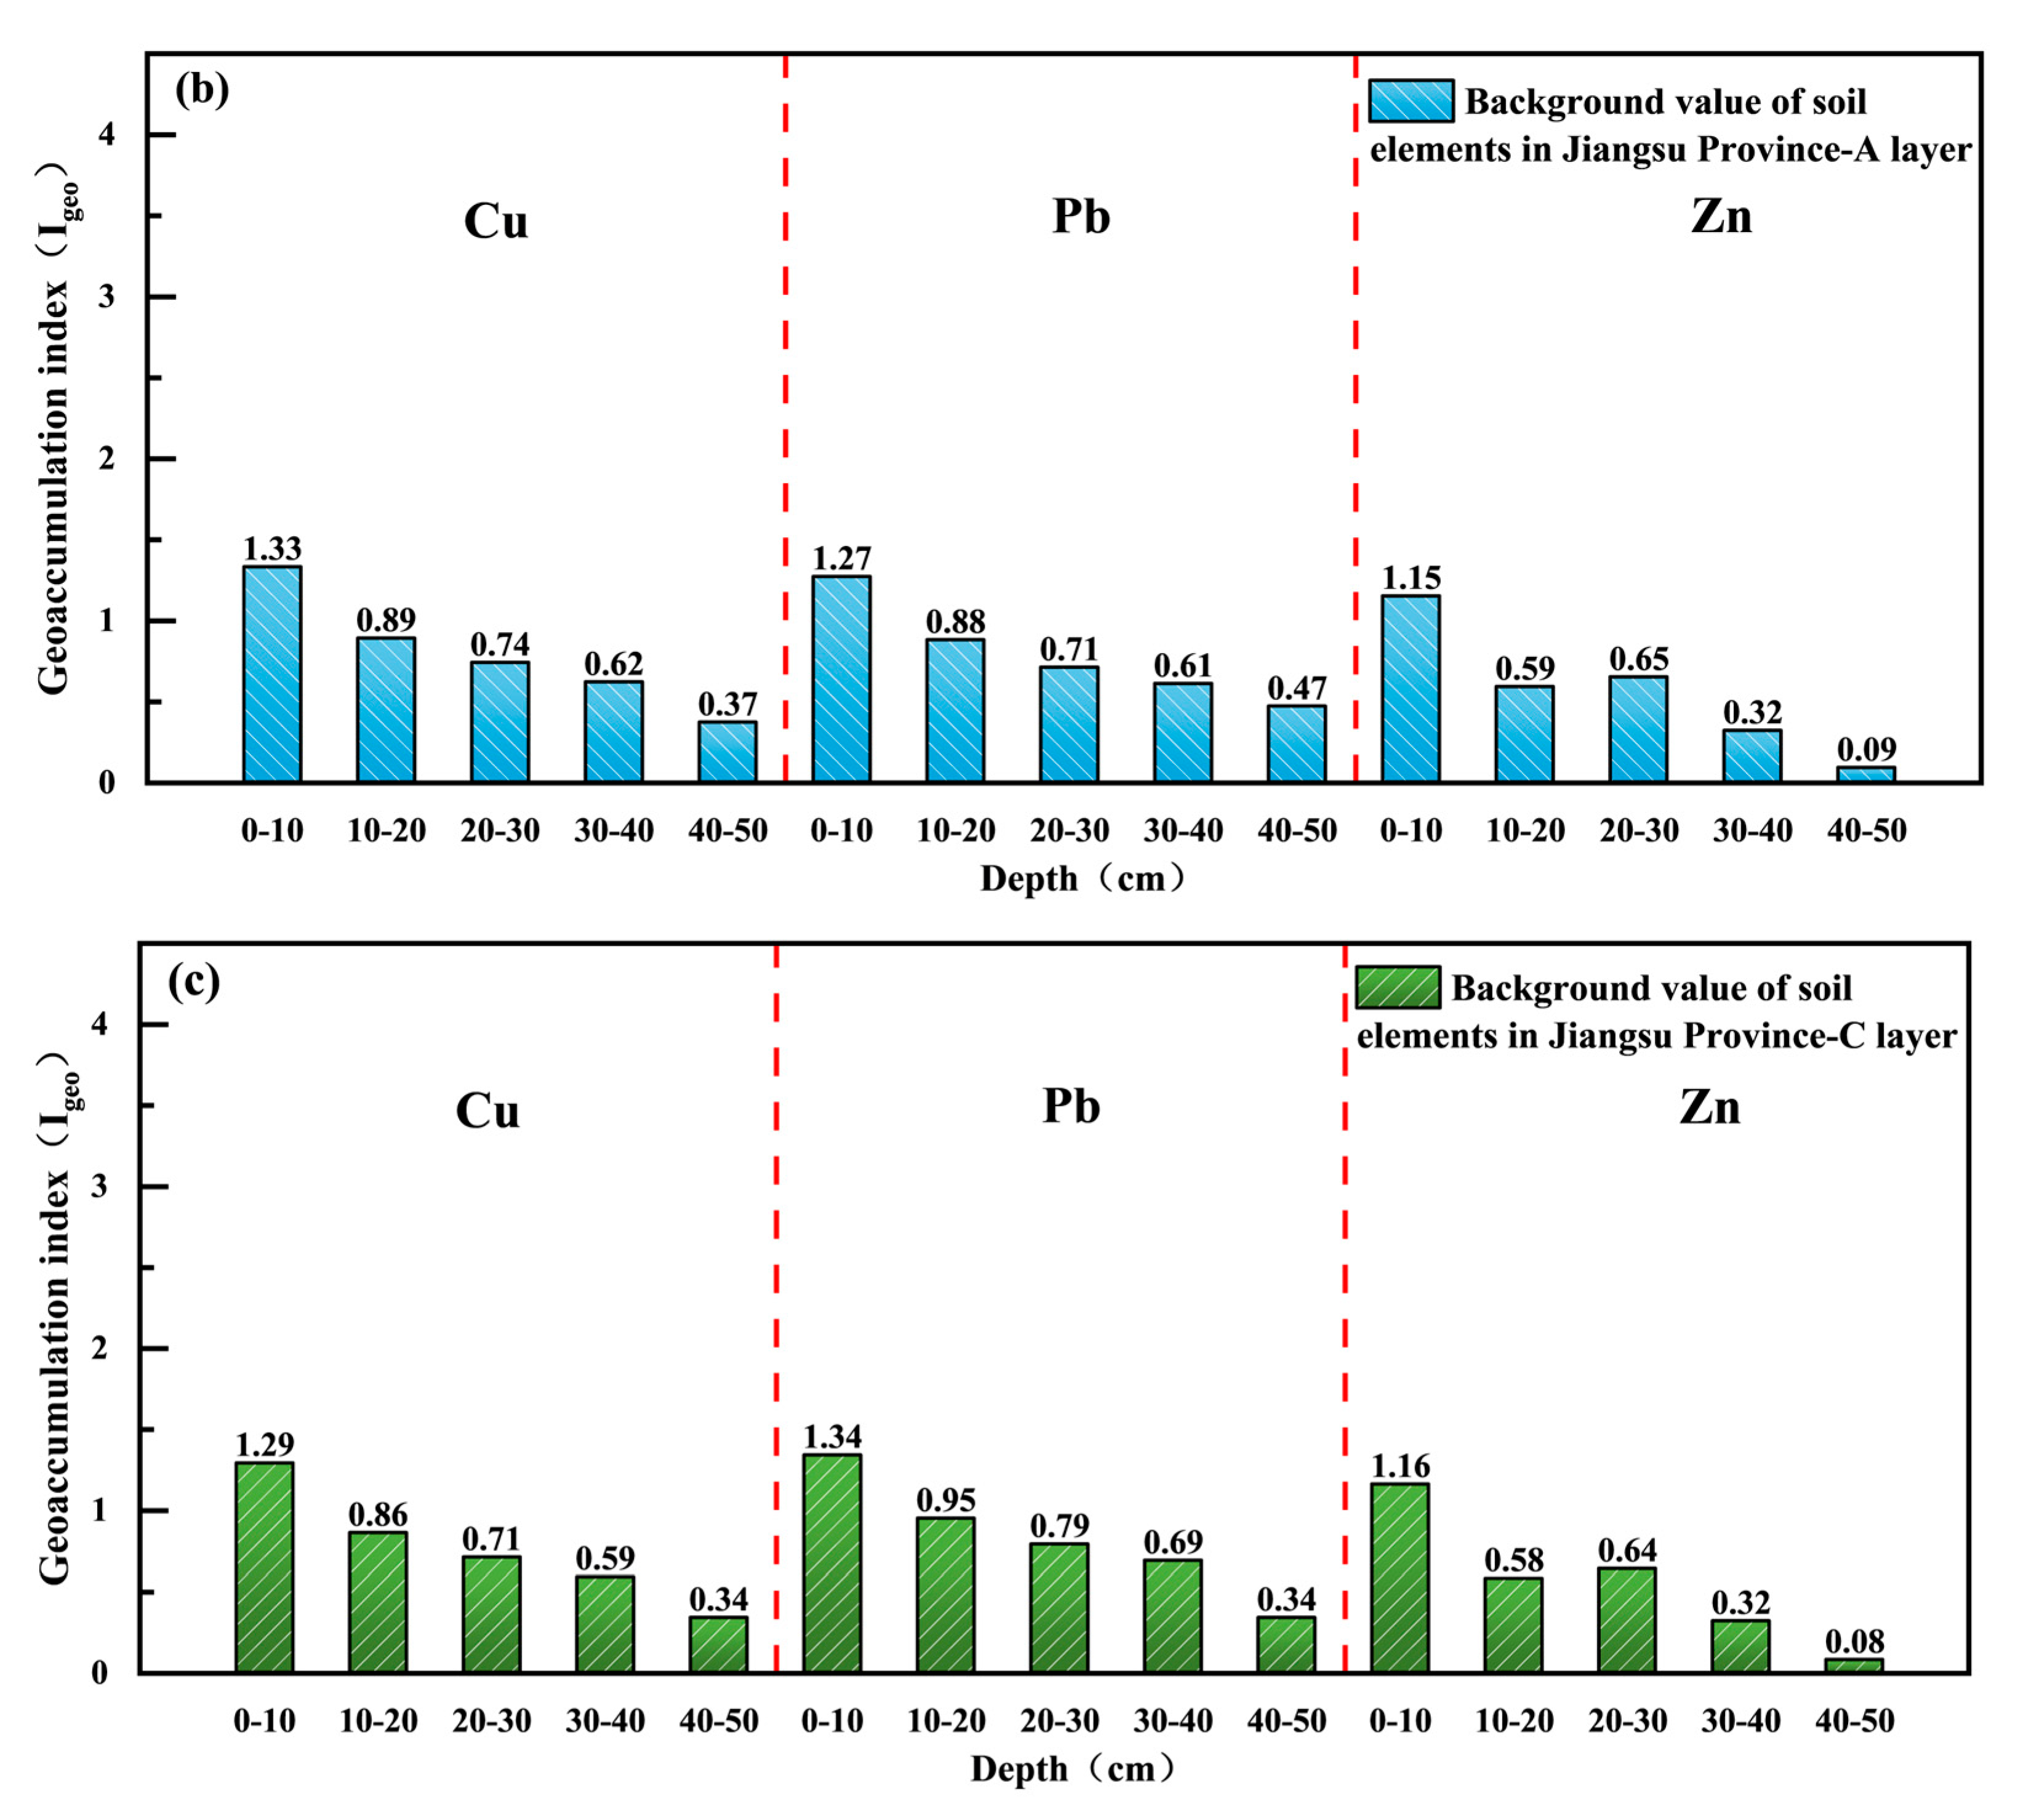
Figure 7 shows the calculation results of the geoaccumulation index of heavy metals. As shown in Figure 7a, the geoaccumulation indices (Igeo) of the three heavy metals in the subgrade of the permeable asphalt pavement, according to the evaluation standard of (GB15618-2018), are all negative values, classified as the pollution-free level in the evaluation standard of the geoaccumulation index [42]. This finding is consistent with the results of both the Nemero Index and the Potential Ecological Risk Index (RI), further confirming that the heavy metal content in the soil beneath permeable pavements has not exceeded the “safety threshold”. However, when taking the soil background standard of Jiangsu Province as the reference, for the three heavy metals in both Layer A and Layer C, the Igeo values at a depth of 10–50 cm are all greater than 0, ranging between 0.08 and 0.89, reaching the level of light pollution. And the Igeovalues at a depth of 0–10 cm reach 1.33 and 1.29, respectively, indicating that this layer has already suffered from moderate heavy metal pollution. Among the three heavy metals, the pollution risks are in the order of Cu, Pb, and Zn.
This stratified distribution is directly linked to the processes of “input-migration-retention” of pollutants: heavy metals from urban stormwater runoff first infiltrate into the soil through the surface layer of the permeable pavement. Since the surface soil is in direct contact with the gravel base layer, the pore structure of the base layer facilitates the retention of pollutants, leading to significant enrichment of heavy metals in the 0–10 cm soil layer. Additionally, the surface soil has a higher organic matter content (typically 10–30 g/kg in urban soils), which can form stable complexes with Cu and Pb, further inhibiting their downward migration. As a result, this layer becomes the most contaminated zone.
Some heavy metals (e.g., Zn, Cu) that are not retained in the surface layer continue to infiltrate into the middle soil layer (10–30 cm) with rainwater. At this depth, the clay content increases (compared to the surface layer), enhancing the soil’s adsorption capacity for heavy metals and causing their renewed retention in this layer. The Igeo values here remain at a “moderately contaminated” level. However, due to reduced input, the concentrations are significantly lower than in the surface layer. In the deep soil layer (30–50 cm), the volume of infiltrating water decreases, and the input of heavy metals is substantially reduced after multiple retention processes in the upper layers. Consequently, the heavy metal content gradually approaches the natural background values. However, Cu and Zn, being more mobile, still exhibit some enrichment in the deep layer, preventing the Igeo values from dropping below zero. In contrast, Pb, with its weaker mobility, approaches background levels in the deep layer.
By combining the three soil heavy metal risk assessment methods [43,44], the potential ecological analysis method evaluates the pollution degree of the permeable pavement facilities as slight, while the other two methods evaluate the pollution degree of the facilities to reach a moderate level or above. In terms of different heavy metals, compared with the other two heavy metals, Cu poses the highest pollution risk. The above research shows that different heavy metals have different accumulation patterns in the permeable pavement facilities. Since the cumulative pollution of heavy metals in the subgrade is relatively high, it is necessary to replace it regularly to reduce the toxic effects on plants and organisms. Secondly, when constructing new permeable pavement facilities, it is essential to consider how to prevent Cu pollution.

4. Conclusions

The above cumulative characteristics of pollutants provide reference value for optimizing the maintenance cycle of permeable pavement systems and reducing the secondary pollution risk of soil and groundwater, thereby ensuring the long-term environmental benefits of the system. We conducted an experiment by simulating the cumulative rainfall over three years, studied the pollutant accumulation characteristics of permeable pavements, and evaluated the pollution risks of heavy metals. The results show that the vertical distribution patterns of TN and NH4+-N in the subgrade of permeable pavements are similar, decreasing with the increase of depth. The content of TP first decreases and then increases with the increase of subgrade depth, indicating that TP has the risk of downward migration and leaching in permeable pavement facilities. The overall content of heavy metals in permeable pavement facilities is in the order of Zn > Pb > Cu. Three soil pollution evaluation methods show that the three heavy metals have caused different degrees of pollution to permeable pavement facilities. Among them, Cu and Zn are the main contributing factors to the pollution risk of permeable pavement facilities. It is necessary to replace the subgrade of permeable pavements regularly to reduce the toxic effects on plants and organisms. In addition, this study used synthetic rainwater. To better simulate actual rainfall conditions, it is necessary to collect real rainwater for simulation experiments in the follow-up to study the pollutant accumulation characteristics of permeable pavement facilities.

Author Contributions

Conceptualization, H.L. (Hui Luo) and B.S.; methodology, H.L. (Hui Luo); software, B.H.; validation, B.H.; formal analysis, B.S.; investigation, H.L. (Hongxiu Leng) and W.W.; resources, H.W.; data curation, R.H.; writing—original draft preparation, B.S.; writing—review and editing, H.W. and B.S.; visualization, B.H., W.W. and H.W.; supervision, H.L. (Hongxiu Leng); project administration, H.L. (Hui Luo); funding acquisition, H.L. (Hui Luo). All authors have read and agreed to the published version of the manuscript.

Funding

This study was supported by the National Natural Science Foundation of China (52108322), the Xinjiang Biomass Solid Waste Resources Technology and Engineering Center of China (KSUGCZX2022), the Lianyungang Key Research and Development Plan (Social Development) project of China (SF2130), and the Postgraduate Research & Practice Innovation Program of Jiangsu Province (SJCX25_2114).

Institutional Review Board Statement

Not applicable.

Informed Consent Statement

Not applicable.

Data Availability Statement

The datasets used and/or analyzed during the current study are available from the corresponding author upon reasonable request.

Conflicts of Interest

The authors declare no competing interests.

References

  1. Maniquiz-Redillas, M.C.; Kim, L.-H. Evaluation of the capability of low-impact development practices for the removal of heavy metal from urban stormwater runoff. Environ. Technol. 2016, 37, 2265–2272. [Google Scholar] [CrossRef]
  2. Zhao, C.; Wang, C.-C.; Li, J.-Q.; Wang, P.; Ou, J.-Q.; Cui, J.-R. Interactions between copper (II) and DOM in the urban stormwater runoff: Modeling and characterizations. Environ. Technol. 2018, 39, 120–129. [Google Scholar] [CrossRef] [PubMed]
  3. Tan, K.; Wang, J. Substrate modified with biochar improves the hydrothermal properties of green roofs. Environ. Res. 2023, 216, 114405. [Google Scholar] [CrossRef] [PubMed]
  4. Luo, H. Study on Ecological Control Technology and Mechanism of Stormwater Runoff. Ph.D. Thesis, Nanjing Forestry University, Nanjing, China, 2021. (In Chinese). [Google Scholar]
  5. Taheri, P.; Moghaddam, M.R.A.; Piadeh, F. Sustainability assessment of low-impact development methods for urban stormwater management: A multi-criteria decision-making approach. Sustain. Cities Soc. 2025, 118, 106025. [Google Scholar] [CrossRef]
  6. Dietz, M.E. Low impact development practices: A review of current research and recommendations for future directions. Water Air Soil Pollut. 2007, 186, 351–363. [Google Scholar] [CrossRef]
  7. Xiao, F.; Qin, H.; Sun, T. Effects of low impact development on runoff pollution and water quality resilience in an urbanized estuary area. J. Hydrol. 2024, 644, 132129. [Google Scholar] [CrossRef]
  8. Mullaney, J.; Lucke, T.; Trueman, S.J. The effect of permeable pavements with an underlying base layer on the growth and nutrient status of urban trees. Urban For. Urban Green. 2015, 14, 19–29. [Google Scholar] [CrossRef]
  9. Raimondi, A.; Marrazzo, G.; Sanfilippo, U.; Becciu, G. A probabilistic approach to stormwater runoff control through permeable pavements beneath urban trees. Sci. Total Environ. 2023, 905, 167196. [Google Scholar] [CrossRef]
  10. Li, T.; Song, X.; Ding, X.; Wang, Y.H. Preliminary research on hydrodynamic process of sponge permeable pavement. South-North Water Transf. Water Sci. Technol. 2023, 20, 1220–1230. [Google Scholar]
  11. Cao, H.; Li, H.; Zhang, Z.; Zhang, Z.Y.; Bai, X.J. Construction Waste Recycled Aggregate for Heavy Metals Removal inPermeable Pavement. China Water Wastewater 2023, 39, 126–133. [Google Scholar] [CrossRef]
  12. Tota-Maharaj, K.; Scholz, M. Efficiency of permeable pavement systems for the removal of urban runoff pollutants under varying environmental conditions. Environ. Prog. Sustain. Energy 2010, 29, 358–369. [Google Scholar] [CrossRef]
  13. Liu, J.; Yan, H.; Liao, Z.; Zhang, K.; Schmidt, A.R.; Tao, T. Laboratory analysis on the surface runoff pollution reduction performance of permeable pavements. Sci. Total Environ. 2019, 691, 1–8. [Google Scholar] [CrossRef] [PubMed]
  14. Drake, J.; Bradford, A.; Van Seters, T. Winter effluent quality from partial-infiltration permeable pavement systems. J. Environ. Eng. 2014, 140, 04014036. [Google Scholar] [CrossRef]
  15. Nsenga Kumwimba, M.; Zhu, B.; Wang, T.; Muyembe, D.K. Distribution and risk assessment of metals and arsenic contamination in man-made ditch sediments with different land use types. Environ. Sci. Pollut. Res. 2016, 23, 24808–24823. [Google Scholar] [CrossRef] [PubMed]
  16. CJJ/T 188-2012; Technical Specification for Pavement of Water Permeable Brick. China Architecture & Building Press: Beijing, China, 2012.
  17. CJJ/T 190-2012; Technical Specification for Permeable Asphalt Pavement. China Architecture & Building Press: Beijing, China, 2012.
  18. Lin, Z.-Z.; Chen, H.-M.; Yang, H. The potential pollution risk of groundwater by a ceramic permeable brick paving system. Water Air Soil Pollut. 2020, 231, 356. [Google Scholar] [CrossRef]
  19. GB 15618-2018; Soil Environmental Quality-Risk Control Standard for Soil Contamination of Agricultural Land. National Standard of the People’s Republic of China: Beijing, China, 2009.
  20. Jiang, W.; Sha, A.; Xiao, J.; Li, Y.; Huang, Y. Experimental study on filtration effect and mechanism of pavement runoff in permeable asphalt pavement. Constr. Build. Mater. 2015, 100, 102–110. [Google Scholar] [CrossRef]
  21. Razzaghmanesh, M.; Borst, M. Long-term effects of three types of permeable pavements on nutrient infiltrate concentrations. Sci. Total Environ. 2019, 670, 893–901. [Google Scholar] [CrossRef]
  22. Van Meter, K.J.; Basu, N.B.; Veenstra, J.J.; Burras, C.L. The nitrogen legacy: Emerging evidence of nitrogen accumulation in anthropogenic landscapes. Environ. Res. Lett. 2016, 11, 035014. [Google Scholar] [CrossRef]
  23. Wang, H.; Luo, H.; Yang, J.; Qin, T.; Yang, M.; Chen, L.; Liu, M.; He, B.-J. Pollutant accumulation characteristics of substrates and mechanism of microbial action in different ecological ditches. Environ. Technol. 2025, 46, 651–667. [Google Scholar] [CrossRef]
  24. Wang, S.; Chen, J. Study on the integrated distribution coefficient of ammonium N migration in layered soil. Environ. Sci. Pollut. Res. 2020, 27, 25340–25352. [Google Scholar] [CrossRef]
  25. Bingcong, F.; Ma, J.; Liu, Y.; Zhang, X.; Chen, Y.; Liping, W. Research progress of nitrogen transport and transformation in farmland soils. J. Agric. Resour. Environ. 2025, 42, 277. [Google Scholar]
  26. Hu, R.; Wang, X.-P.; Xu, J.-S.; Zhang, Y.-F.; Pan, Y.-X.; Su, X. The mechanism of soil nitrogen transformation under different biocrusts to warming and reduced precipitation: From microbial functional genes to enzyme activity. Sci. Total Environ. 2020, 722, 137849. [Google Scholar] [CrossRef] [PubMed]
  27. Scholz, M.; Grabowiecki, P. Review of permeable pavement systems. Build. Environ. 2007, 42, 3830–3836. [Google Scholar] [CrossRef]
  28. Bao, W.; Zhu, S.; Guo, S.; Wang, L.; Huang, S.; Fu, J.; Ye, Z. Particle size distribution mathematical models and properties of suspended solids in a typical freshwater pond. Environ. Pollut. 2018, 241, 164–171. [Google Scholar] [CrossRef]
  29. Wu, F.; Yu, Q.; Brouwers, H. Phosphorus removal enhancement by porous adsorptive mortar using miscanthus and steel slag for highly adsorptive concrete. Constr. Build. Mater. 2021, 295, 123686. [Google Scholar] [CrossRef]
  30. Yu, S.; Qin, H.; Ye, Y.; Sun, C. Modeling the influences of rainfall conditions on nitrogen removal effects of a permeable pavement system. J. Environ. Manag. 2024, 370, 122686. [Google Scholar] [CrossRef]
  31. Liu, A.; Ma, Y.; Gunawardena, J.M.; Egodawatta, P.; Ayoko, G.A.; Goonetilleke, A. Heavy metals transport pathways: The importance of atmospheric pollution contributing to stormwater pollution. Ecotoxicol. Environ. Saf. 2018, 164, 696–703. [Google Scholar] [CrossRef] [PubMed]
  32. Luo, X.-S.; Xue, Y.; Wang, Y.-L.; Cang, L.; Xu, B.; Ding, J. Source identification and apportionment of heavy metals in urban soil profiles. Chemosphere 2015, 127, 152–157. [Google Scholar] [CrossRef]
  33. Liu, J.; Borst, M. Performances of metal concentrations from three permeable pavement infiltrates. Water Res. 2018, 136, 41–53. [Google Scholar] [CrossRef] [PubMed]
  34. Wang, Z. Study on the Discharge Characteristies of Road Runoffllution of Xi’an City. Master’s Thesis, China Chang’an University, Xi’an, China, 2016. (In Chinese). [Google Scholar]
  35. Chang, Y.; Bao, J.; Nan, X.; Li, Y.X. Exploration of soil adsorption capacity on heavy metals in simulated rainfall Runoff. Environ. Chem. 2024, 43, 4145–4156. [Google Scholar]
  36. Ingvertsen, S.T.; Cederkvist, K.; Jensen, M.B.; Magid, J. Assessment of existing roadside swales with engineered filter soil: II. Treatment efficiency and in situ mobilization in soil columns. J. Environ. Qual. 2012, 41, 1970–1981. [Google Scholar] [CrossRef]
  37. Zhang, Y.; Song, B.; Zhou, Z. Pollution assessment and source apportionment of heavy metals in soil from lead–Zinc mining areas of south China. J. Environ. Chem. Eng. 2023, 11, 109320. [Google Scholar] [CrossRef]
  38. Hakanson, L. An ecological risk index for aquatic pollution control. A sedimentological approach. Water Res. 1980, 14, 975–1001. [Google Scholar] [CrossRef]
  39. Loska, K.; Cebula, J.; Pelczar, J.; Wiechuła, D.; Kwapuliński, J. Use of enrichment, and contamination factors together with geoaccumulation indexes to evaluate the content of Cd, Cu, and Ni in the Rybnik water reservoir in Poland. Water Air Soil Pollut. 1997, 93, 347–365. [Google Scholar] [CrossRef]
  40. Kluge, B.; Markert, A.; Facklam, M.; Sommer, H.; Kaiser, M.; Pallasch, M.; Wessolek, G. Metal accumulation and hydraulic performance of bioretention systems after long-term operation. J. Soils Sediments 2018, 18, 431–441. [Google Scholar] [CrossRef]
  41. Liu, Z.-J.; Li, P.-Y.; Zhang, X.-L.; Li, P.; Zhu, L.-H. Regional distribution and ecological risk evaluation of heavy metals in surface sediments from coastal wetlands of the Yellow River Delta. Huan Jing Ke Xue Huanjing Kexue 2012, 33, 1182–1188. [Google Scholar] [PubMed]
  42. Muller, G. Index of geoaccumulation in sediments of the Rhine River. GeoJournal 1969, 2, 108–118. [Google Scholar]
  43. Ying, L.; Shaogang, L.; Xiaoyang, C. Assessment of heavy metal pollution and human health risk in urban soils of a coal mining city in East China. Hum. Ecol. Risk Assess. Int. J. 2016, 22, 1359–1374. [Google Scholar] [CrossRef]
  44. Liu, B.; Zhang, W.; Chi, G. Distribution and risk assessment of heavy metals in sediment from Bohai Bay, China. Minerals 2019, 9, 111. [Google Scholar] [CrossRef]
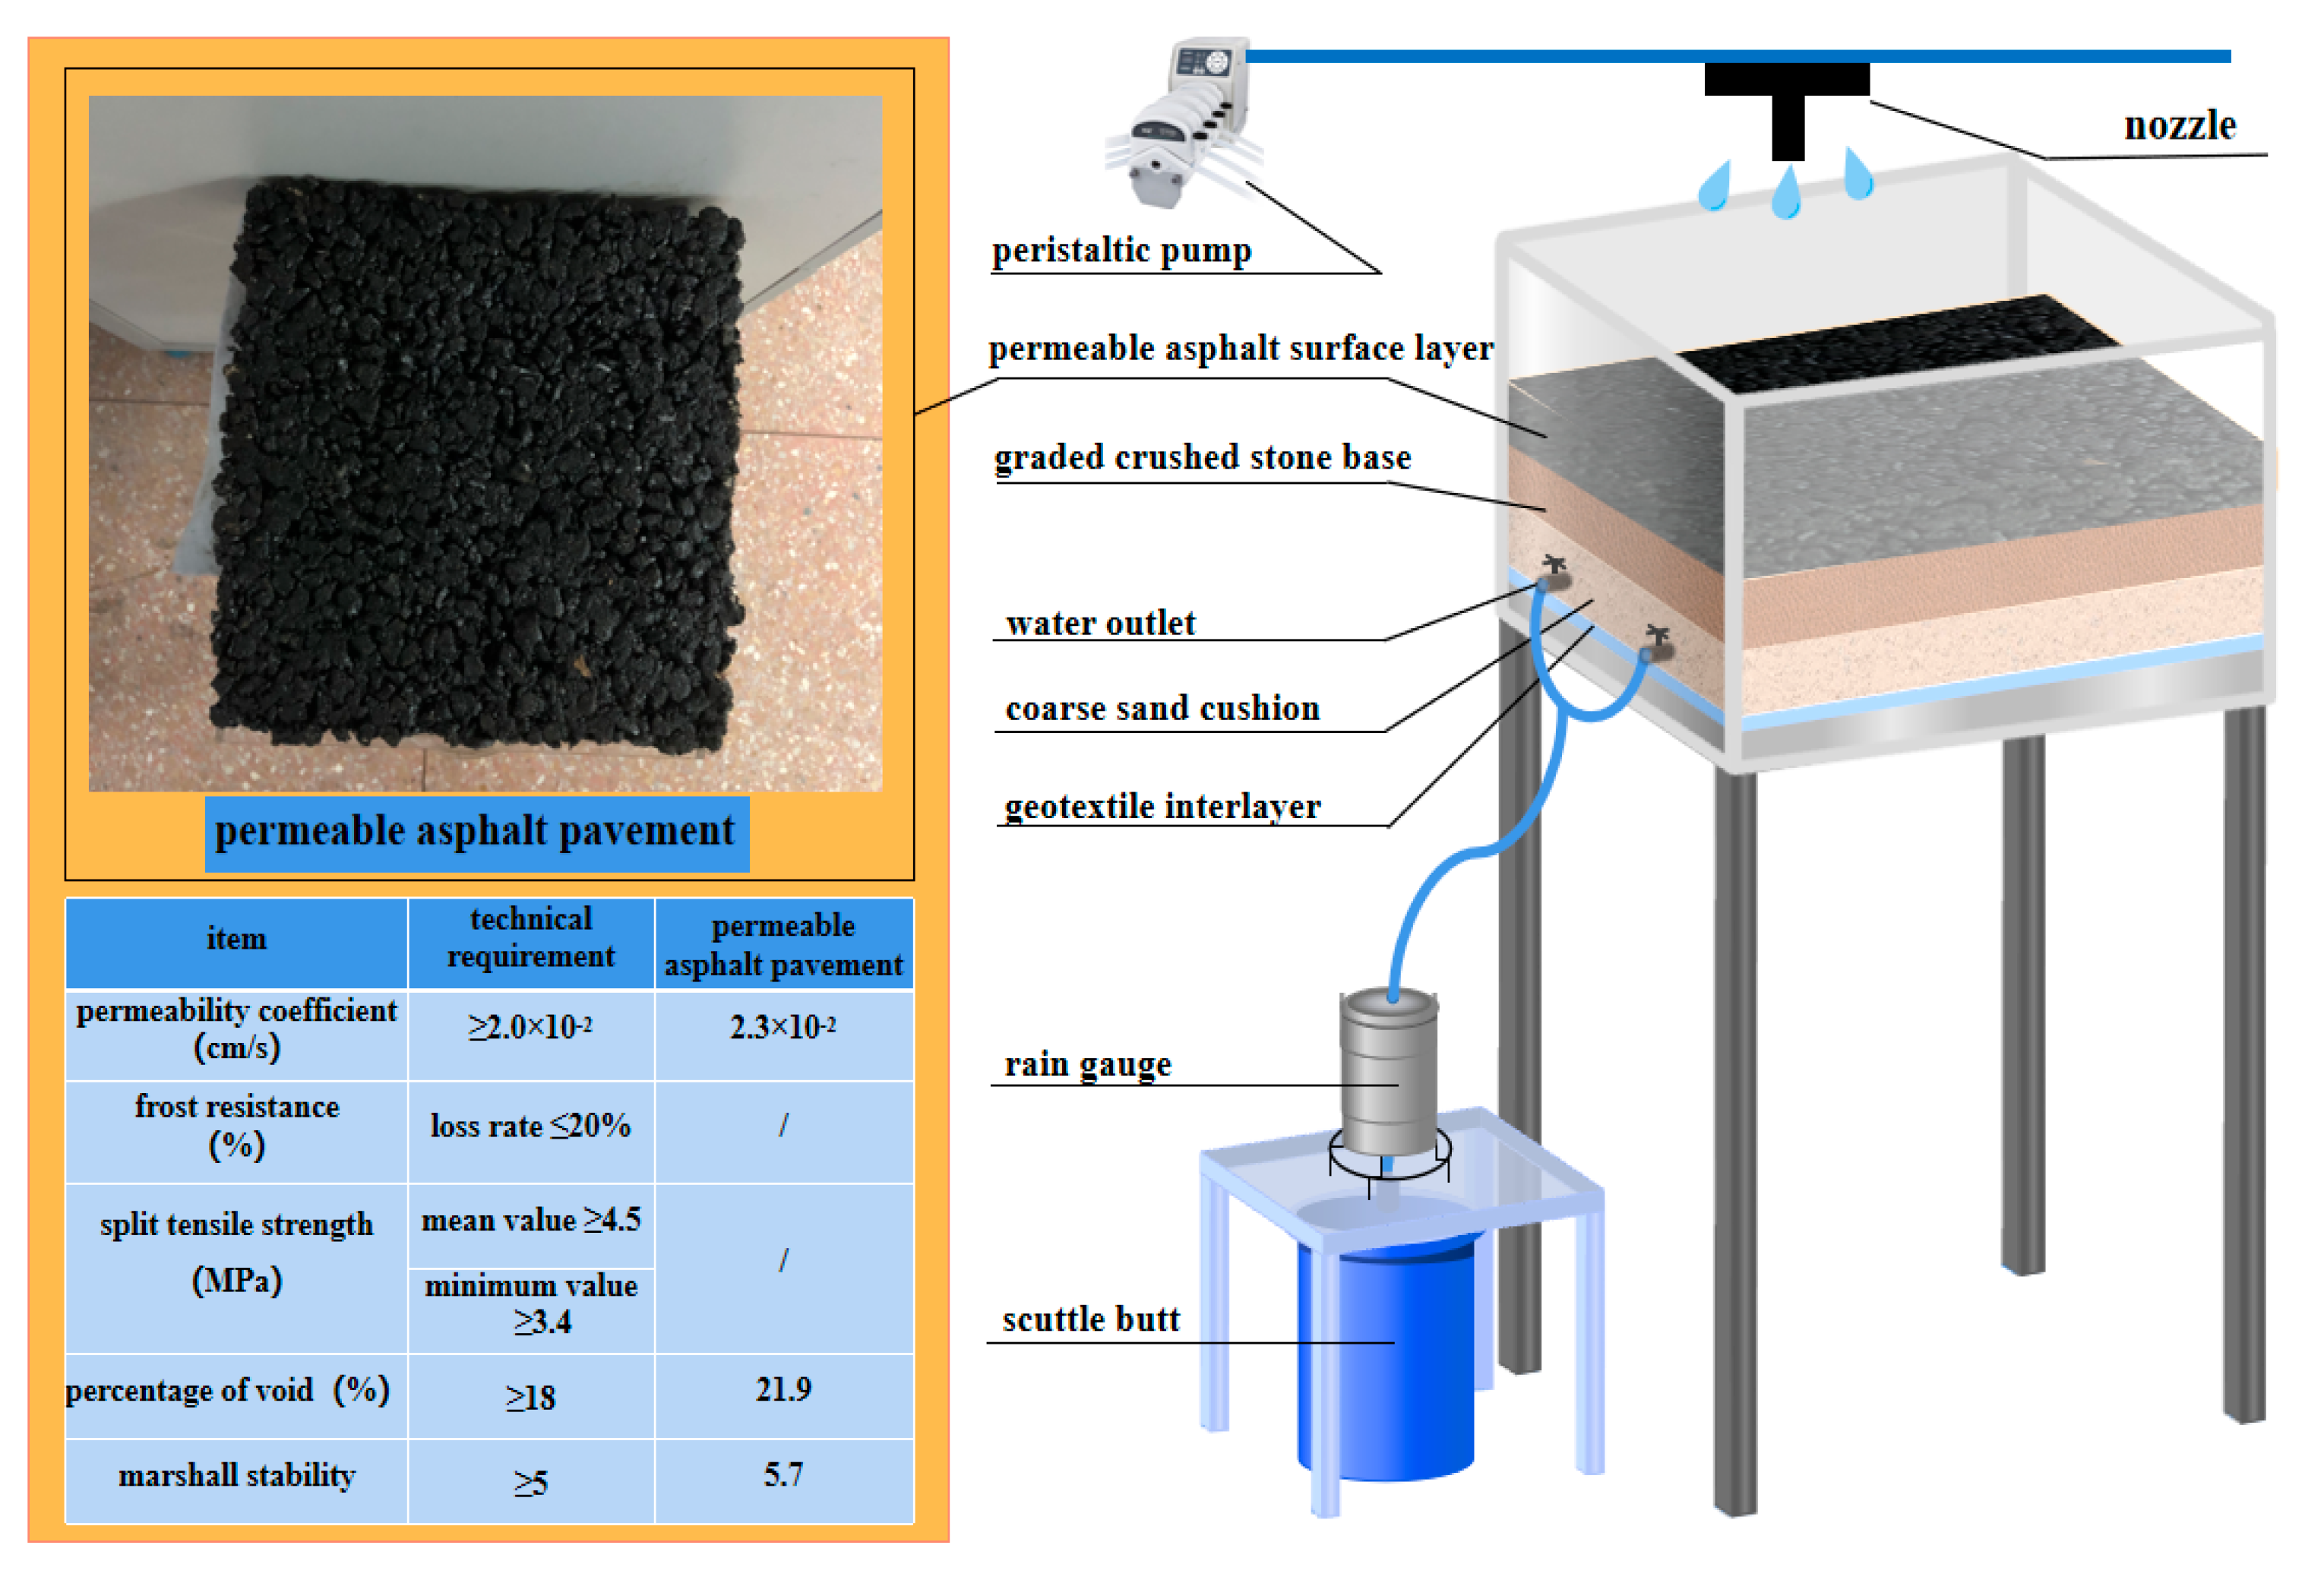
Figure 1. Schematic diagram of small test setup.
Applsci 15 11369 g001
Figure 2. (ac) The content of TP, NH4+-N, and TN accumulants at different depths; (df) Quadratic Fitting of TP, NH4+-N, and TN Accumulation Content at Different Depths.
Applsci 15 11369 g002
Figure 3. Correlation Analysis of TN, NH4+-N, and TP Concentrations with Different Vertical Depths.
Applsci 15 11369 g003
Figure 4. Characterization of soil heavy metal accumulation in permeable asphalt pavement.
Applsci 15 11369 g004
Figure 5. (a) Pi values of the three heavy metals in GB 15618-2018. (b) Pi values of the three heavy metals in Background value of soilelements in Jiangsu Province Layer A. (c) Pi values of the three heavy metals in Background value of soilelements in Jiangsu Province Layer C. (d) PI values at various depths under different standards.
Applsci 15 11369 g005aApplsci 15 11369 g005b
Figure 6. (a) Ei values of the three heavy metals in GB 15618-2018. (b) Ei values of the three heavy metals in Background value of soilelements in Jiangsu Province Layer A. (c) Ei values of the three heavy metals in Background value of soilelements in Jiangsu Province Layer C. (d) RI values at various depths under different standards.
Applsci 15 11369 g006aApplsci 15 11369 g006b
Figure 7. (a) Igeo values of the three heavy metals in GB 15618-2018. (b) Igeo values of the three heavy metals in Background value of soilelements in Jiangsu Province Layer A. (c) Igeo values of the three heavy metals in Background value of soilelements in Jiangsu Province Layer C.
Applsci 15 11369 g007aApplsci 15 11369 g007b
Table 1. Main types of permeable pavements and their characteristics.
TypeMaterialWorking PrincipleCommon Applications
Porous AsphaltSimilar to conventional asphalt but with a reduced or absent fraction of fine aggregates.Stormwater infiltrates directly through the porous surface into the underlying stone reservoir. Pollutants are removed through filtration by the asphalt matrix and adsorption within the aggregate layers.Low-traffic roadways, parking lots.
Pervious ConcreteA mixture of Portland cement, uniform-sized coarse aggregate, and water, with little to no fine aggregates.Water passes through the large, interconnected pores of the concrete surface. The sub-surface layers provide additional filtration, adsorption, and temporary storage before infiltration or collection.Sidewalks, plazas, low-traffic parking areas.
Permeable Interlocking Concrete PaversPrecast concrete paving units placed on a granular bedding course, with joints filled with small, open-graded aggregates.Stormwater enters through the permeable joints, then is filtered, treated, and stored by the subsurface layersHeavy-duty applications like industrial pavements, commercial parking lots.
Table 2. Pollutant concentrations of simulated rainfall test.
IndicatorsTPTNNH4+~NCODPbZnCuSS
Experimental solution concentration0.71~1.83.2~8.01.5~5.580~2000.1~0.30.3~0.720.2~0.86150~550
Table 3. Initial TN, NH4+-N, and TP content under different substrates.
Base TypeWashing and Filtration TreatmentInitial TN Content (mg/kg)Initial NH4+ Content
(mg/kg)
Initial TP Content
(mg/kg)
Crushed stone layerBefore processing752–78618–23536–557
After processing82–895–1355–63
sand cushion layerBefore processing642–66725–28485–511
After processing67–757–1650–61
Table 4. Basic physicochemical properties of the soil foundation at different depths.
Depth (cm)Organic Matter (g/kg)pH ValueParticle Size Distribution (%)
Clay
(<0.002 mm)
Silt
(0.002~0.02 mm)
Sand
(0.02~2 mm)
0–10 cm25.46.818.536.245.3
10–20 cm22.16.917.835.546.7
20–30 cm19.37.016.934.848.3
30–40 cm16.87.116.033.550.5
40–50 cm15.27.215.232.152.7
Table 5. Soil Sample Testing Parameters and Analytical Methods.
IndicatorTesting MethodName of Inspection Equipment
NH4+-NIndophenol Blue Colorimetric MethodBurette
TNKjeldahl methodSemi-automatic nitrogen analyser (Producer: Labtron Equipment Ltd., Camberley, UK, Model: LKA-A20)
TPAlkali fusion-molybdenum antimony spectrophotometric methodDual-beam ultraviolet-visible spectrophotometer
(Producer: Puxi General Instrument Co., Ltd., Beijing, China, Model: TU-1810)
CuFlame Atomic Absorption Spectrophotometry (FAAS)Atomic Absorption Spectrophotometer
(Producer: PerkinElmer, Waltham, MA, USA, Model: PinAAcle 900T)
Atomization Type: Air-acetylene flam
Pb
Zn
Table 6. Evaluation methods for soil contaminant indicators.
Nemiro Index MethodGeoaccumulation Index MethodPotential Ecological Risk Index Methods
Math formula P i = C i S i P I = ( 1 n 1 n P i ) 2 + ( P i max ) 2 2 I g e o = log 2 C i / ( k × B i ) E r i = i = 1 n T r i ( C m e a n i / C n i ) R I = i = 1 n E r i
Parameter definitionPi represents the single-factor pollution index; Ci represents the measured value of the pollutant, in mg/kg; Si is the standard value of the pollutant at the sampling point, in mg/kg; PI is the comprehensive pollution index, and Pimax is the maximum single-factor pollution index.Ci represents the measured content of element i in the soil, with the unit of mg/kg; Bi represents the soil background value of element i, also in mg/kg; k is a constant (here
k = 1.5 is taken into account the differences in rock background values in different regions), and Igeo represents the geoaccumulation index.
RI is the comprehensive potential ecological risk index of heavy metals; T r i is the toxicity response coefficient of heavy metals at different depths (obtained according to the standardized heavy metal toxicity coefficients formulated by Hakanson); E r i is the pollution coefficient of heavy metal elements; C m e a n i is the measured value of heavy metals; and C n i is the reference value of this element.
FeaturesConsidering the comprehensive effects of various pollutants, the maximum value has a great influence on the results. Sometimes, the influence of some factors may be over-emphasized due to individual outliers.Taking into account the possible changes in background values caused by natural rock formation and human activities. However, it can only evaluate one kind of heavy metal, without considering the contributions of different heavy metals to pollution.Taking into account the differences in the environmental toxicity of heavy metals and other factors, this reflects the biological toxicity of heavy metals and the proportion of their relative contributions.
Table 7. Background values for heavy metals in soil.
Assessment StandardsDepth (cm)Cu (mg/kg)Pb (mg/kg)Zn (mg/kg)
(GB 15618-2018)/100120250
Background values of soil elements in Jiangsu ProvinceLayer A22.3 ± 8.0226.2 ± 10.9262.6 ± 20.95
Layer C22.7 ± 8.0224.9 ± 8.9562.9 ± 18.09
Table 8. Soil nitrogen and phosphorus classification criteria and percentages.
PollutantsClassification Standards (g/kg)Proportion (%)Depth (cm)
TNI > 20/
II ∈ (1.5, 2]0/
III ∈ (1, 1.5]400~20
IV ∈ (0.75, 1]4020~40
V ∈ (0.5, 0.75]2040~50
VI ≤ 0.50/
TPI > 10/
II ∈ (0.8, 1]0/
III ∈ (0.6, 0.8]40/
IV ∈ (0.4, 0.6]400~20, 40~50
V ∈ (0.2, 0.4]2020~40
VI ≤ 0.20/
Note: The classification standards are based on the “Nutrient Classification Standards of the Second National Soil Census” (issued by the Ministry of Agriculture of the People’s Republic of China in 1984), which classifies soil nitrogen and phosphorus contents into six grades to evaluate the nutrient status and pollution accumulation level of soil.
Table 9. Nemero Integrated Pollution Evaluation Levels.
Class of PollutionPiLevel of PollutantPILevel of Pollutant
I0~1no pollution0~0.7No pollution
II1~2slight pollution0.7~1warning line
III2~3moderate pollution1~2slight pollution
IV3heavy pollution2~3moderate pollution
V-->3heavy pollution
Table 10. Potential Ecological Hazard Rating.
Class of PollutionPotential Hazard LevelEi GradingRI Grading
Islight<400~150
IImoderate40~80150~300
IIIstrong80~160300~600
IVstronger160~320600~1200
Vvery strong>320>1200
Table 11. Geological accumulation index method evaluation grades.
Class of PollutionGeological Accumulation IndexLevel of Pollutant
IIgeo ≤ 0no pollution
II0 < Igeo ≤ 1slight pollution
III1 < Igeo ≤ 2moderate pollution
IV2 < Igeo ≤ 3moderately strong pollution
V3 < Igeo ≤ 4heavy pollution
VI4 < Igeo ≤ 5severe–extremely strong pollution
VIIIgeo > 5very strong pollution
Disclaimer/Publisher’s Note: The statements, opinions and data contained in all publications are solely those of the individual author(s) and contributor(s) and not of MDPI and/or the editor(s). MDPI and/or the editor(s) disclaim responsibility for any injury to people or property resulting from any ideas, methods, instructions or products referred to in the content.