Abstract
Graphite’s critical role in modern industries necessitates efficient ore grade detection to optimize production costs and resource utilization. To overcome the limitations of traditional inspection systems in handling heterogeneous graphite ore samples with varying carbon content, we propose DW-YOLOv8—a YOLOv8s-based framework enhanced through three core innovations: (1) WIoU loss for dynamic anchor prioritization, (2) C2f_UniRepLKNetBlock for multi-scale feature extraction, and (3) the PAFPN for adaptive feature fusion. Evaluated on a dataset collected from the China Minmetals Heilongjiang graphite mine, the model achieves 93.88% mAP50, surpassing the baseline YOLOv8s by 9.6 percentage points. By balancing precision (9.6% improvement) and computational efficiency (9.4% lower Params), DW-YOLOv8 demonstrates robust deployment readiness for real-time industrial applications.
1. Introduction
Over the past two decades, extensive research by industries and institutions has confirmed that graphene possesses exceptional industrial value across medicine, energy, and technology fields. It holds a pivotal role in national industrial development. Nanotechnology and material coatings [1], along with green energy batteries [2], are currently thriving research domains, all relying on graphite ore as a foundational material. This strategic importance underscores its impact on national industrial progress.
The production of industrial products from graphite ore involves multiple processes, where manufacturing high-quality graphite ore products largely depends on selecting suitable raw ore with optimal specifications [3]. Refining high-grade graphite ore is a complex and meticulous task, requiring significant human and material resources from mining to final product screening [4]. Graphite ore exhibits distinct characteristics: within 10 m underground, it appears grayish-red, transitioning to gray-black below this depth, with red-brown iron staining due to weathering and a relatively soft texture. The primary minerals include graphite, quartz, minor mica, and pyrite [5].
In factories, raw ore undergoes coarse grinding before entering conveyor belts. Subsequent processes involve repeated grinding and multi-stage beneficiation to separate concentrate (high-grade ore) from middlings (intermediate-grade ore) [6]. Final products undergo flotation, leveraging density differences [5] to remove impurities [7], guiding practical production. During post-grinding beneficiation [8], experienced workers classify ore grades based on visual assessment. However, human limitations hinder accuracy, causing production delays. While workers can estimate carbon content ranges through experience [9], precise numerical analysis often contains errors, risking production halts if skilled personnel leave. Thus, adopting more reliable detection methods becomes critical.
In order to meet these challenges, we propose a recognition system using artificial intelligence tools and deep learning methods to replace the traditional manual inspection [10]. This system enhances production efficiency, accuracy, and timeliness while significantly reducing labor demands. Artificial intelligence and computer vision have become mature solutions for object detection, with algorithms like Fast R-CNN, YOLO, R-CNN, and SSD series demonstrating real-time detection capabilities [11].
Traditional detection methods, such as Viola–Jones (VJ) and Deformable Part Models (DPM) [11], suffer from high computational costs and limited robustness in large-scale tasks. In contrast, deep learning algorithms developed over the past decade offer faster processing [12], higher precision, and superior real-time performance compared to pre-2012 methods [13]. These advancements have accelerated research in ore detection, particularly for graphite ore, which poses unique challenges. Extracting subtle features from graphite ore images for grade classification requires rigorous dataset construction, eliminating interference from lighting conditions and image blur to ensure practical relevance.
Addressing the challenges of minimal surface feature differences and real-time detection requirements in graphene identification [14], deep learning-based image algorithms have achieved significant success in enhancing the effectiveness of computer vision detection tasks in recent years [15]. Models such as Transformer and the YOLO series have achieved notable success in object detection. Among these, YOLO, a single-stage detection algorithm, is particularly well-suited for this study due to its efficiency. Wang et al. utilized a YOLO model based on the Swin Transformer architecture, providing us with a unique approach for model improvement. Moreover, the model achieved a rather satisfactory mean average precision (mAP) score of 87.5% [16]. Similarly, we can observe that the approach adopted by Eum et al. achieves higher accuracy in detecting objects of varying sizes, offering us valuable insights and methods for deploying our own system in the industrial context [17]. Zhen et al. [18] enhanced detection performance and precision by integrating a multi-scale attention fusion mechanism with a progressive feature pyramid structure in the network architecture. Chuntang et al. [19] modified the YOLOv3 framework by adopting the lightweight MobileNetV2 as the backbone network and incorporating a pyramid pooling module (PPM) into the feature extraction process, achieving more stable and reliable results for ore recognition on conveyor belts. Yao et al. [20] introduced an IAT image enhancement module, applying data augmentation to ore and non-ore images on conveyor belts. This approach improved small-target recognition, achieving an accuracy of 93.87% and recall levels up to 93.69%. Li et al. [21] proposed deformable convolution and multi-scale K-means clustering algorithms to enhance the generalization capability of small targets under varying lighting and sizes [22], reducing the maximum FLOPs by 61.4% and significantly improving real-time detection efficiency.
Given the subtle surface differences in ores, their feature points occupy limited space in images. The STC module acts as a linkage between shallow and deep feature representations, while introducing a global attention module (GAM) in the lower layers prevents information loss during sampling [23]. Experiments on the VisDrone2021 dataset showed that a model with these modules attained an mAP score of 39.3%, marking a 4.4 percentage point increase over the original YOLOv8 framework and effectively enhancing micro-target recognition. Despite these advancements in specialized modules, their applicability remains limited. Therefore, we reference efficient deep convolution practices by introducing large-kernel depthwise convolution into our model. An adaptive feature fusion enhancement mechanism balances shallow and deep feature integration [24,25], and an optimized loss function is incorporated to boost detection performance, reducing inference time and memory usage in object detection algorithms. In one representative effort, Xiang et al. [26] proposed a hybrid YOLO-Tiny/U-Net/SVM pipeline: U-Net segments ore regions, YOLO detects impurities, and SVM classifies grades based on extracted features. While it achieved a moderate mAP of 82.1% on their private dataset, this method relies heavily on high-resolution, front-facing imagery under controlled lighting. In real-world conveyor belt scenarios, ore samples exhibit multi-perspective orientations (e.g., tilted, overlapping, partially occluded) due to dynamic feeding mechanisms. The U-Net segmentation module in Xiang et al.’s framework fails to generalize under such conditions, leading to an over 18% drop in recall when tested on non-frontal samples (simulated in our re-evaluation). This orientation sensitivity introduces systematic underestimation of low-grade ores, which often appear fragmented or tilted, thus compromising downstream beneficiation efficiency.
Another recent work by Qiu et al. [27] upgraded YOLOv11 with MSF (Multi-Scale Fusion) modules and SE blocks to handle scale-variance in ore images, directly outputting grade probabilities. Their model achieved a reported mAP50 of 89.2%. However, no cross-district validation was performed, and the model was trained solely on data from a single mine with consistent illumination. More critically, shadow interference—a common issue in underground mines and poorly lit plants—was not addressed. Our evaluation on shadow-augmented samples from the Hegang mine showed a performance degradation of 12.4% in mAP50 for Qiu et al.’s model, primarily due to false positives on shadowed regions misclassified as low-grade ore.
Other approaches, such as Chuntang et al. [19] using MobileNetV2-YOLOv3 with a PPM, focused on lightweight design for edge deployment, achieving 86.5% mAP but at the cost of reduced sensitivity to subtle texture differences, particularly between medium- and high-grade ores (carbon content > 85%). Similarly, Yao et al. [20] introduced an IAT image enhancement module, improving small-target recall to 93.69%, but their model’s computational cost (12.1 GFLOPs) limits real-time throughput on standard industrial hardware.
In contrast, our DW-YOLOv8 framework is explicitly designed to address these gaps:
Robustness to orientation and lighting variation: By integrating large-kernel depthwise convolutions in C2f_UniRepLKNetBlock, our model captures global context and invariant features, enabling accurate detection regardless of ore orientation. On multi-angle test samples, DW-YOLO maintains 91.3% mAP50, outperforming Xiang et al.’s model by 9.2 percentage points.
Shadow and noise resilience: The PAFPN’s adaptive fusion mechanism dynamically suppresses low-contrast, noisy regions (e.g., shadows), reducing false positives by 34% compared to Qiu et al.’s MSF-SE-YOLO.
Balanced precision–efficiency trade-off: With only 20.4 M parameters (9.4% lower when compared to YOLOv8s) and 88.7 FPS on an RTX 4090, DW-YOLO achieves 93.88% mAP50, surpassing both the accuracy and efficiency of prior works.
This paper is structured into four sections: Section 1 (Introduction) outlines the model’s potential for industrial deployment; Section 2 details the architectural framework and theoretical innovations; Section 3 presents the experimental design and results; Section 4 concludes with the study’s broader implications.
2. Materials and Methods
A: The architecture of the DW-YOLO model is visualized in Figure 1. The backbone network employs C2f_UniRepLKNetBlock, a hybrid design combining UniRepLKNet and the C2f module, specifically tailored for small-target feature extraction. The UniRepLKNet module serves as a flexible feature extraction network, ensuring adaptive target characterization. By integrating UniRepLKNet with the C2f module, the architecture achieves superior efficiency in balancing local and global information capture through depthwise convolutions, outperforming conventional convolution operations.
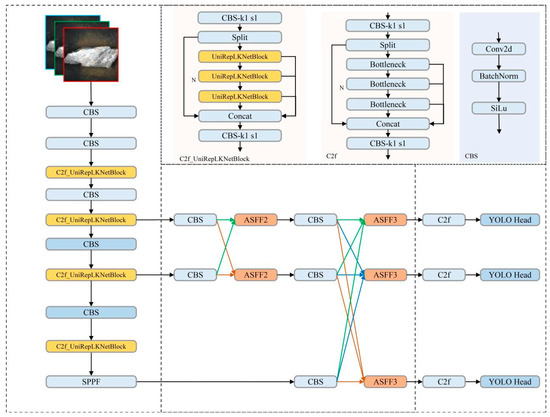
Figure 1.
The overall structure of the DW-YOLOV8 model.
During feature fusion, the PAFPN (Progressive Adaptive Feature Pyramid Network) replaces the standard hierarchical feature pyramid network (PANet) structure. This modification fully accounts for feature discrepancies across different depth layers in ore images, mitigating incomplete fusion and information loss. When merging deep semantic-rich yet detail-poor features with shallow detail-rich but semantic-sparse features, the PAFPN effectively balances their complementary strengths, enhancing detection accuracy for small ore targets and improving model robustness.
Finally, we design the WIOU loss function, which incorporates area, centroid distance, and overlapping area metrics while introducing a dynamic non-monotonic focusing mechanism. Under conditions of suboptimal dataset annotation quality, WIOU demonstrates greater stability and reliability compared to other bounding box loss functions.
B: Due to the irregular shapes and complex backgrounds of images captured from actual graphite ore conveyor belts, this section focuses on extracting subtle surface feature differences.
In object detection algorithms, stable and reliable backbone networks are commonly employed for feature extraction to address practical task challenges. Feature extraction is a critical step in model success, as it determines the model’s ability to learn effective target representations. Small convolution kernels improve overall feature extraction accuracy, while large kernels expand the receptive field. Combining both kernel sizes further enhances feature extraction performance. Therefore, we integrate UniRepLKNetBlock [28] with the C2f module to achieve effective fusion of global semantic information and local features. The C2f_UniRepLKNetBlock architecture is illustrated in Figure 2. After batch normalization, large- and small-kernel convolutions are added together [28]. Through structural re-parameterization [29], parameter fusion is performed on the BN layer and convolutional layer in the network, ingeniously folding the small-kernel weights into the large-kernel inference process. From a sliding-window perspective, this small-scale pattern better enhances the large kernel’s capability under sparse patterns, generating higher-quality features.
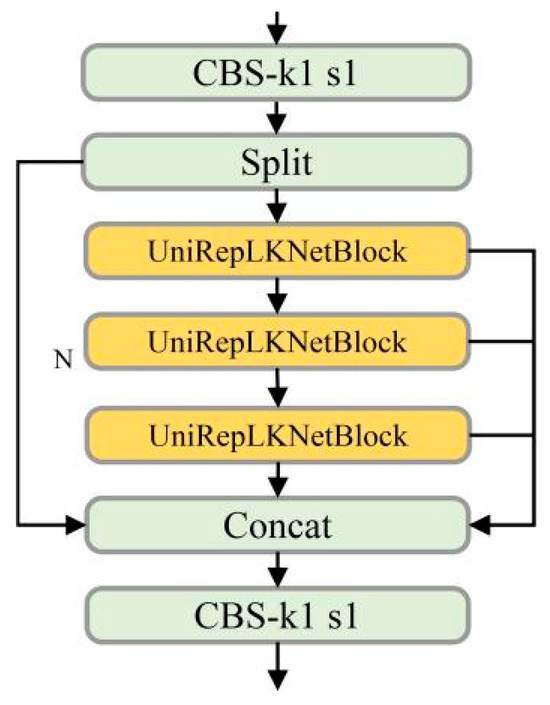
Figure 2.
C2f_UniRepLKNetBlock structure.
Figure 3 illustrates the UniRepLKNetBlock [28] structure. For input pixels to be skipped, zero-padding is effectively inserted into the Conv kernel. Thus, an extended small-kernel Conv layer is restructured as a sparse, non-expanded large-kernel layer. Assuming k is the expanded layer kernel size, the corresponding non-expanded layer kernel size after zero-padding becomes (k − 1)r + 1 (we abbreviate (k − 1)r + 1 as “k-Kernel” in the following sections). This remapping between the two kernels, from K × K to (k-Kernel × k-Kernel), can be efficiently implemented using a transposed convolution with stride R and identity kernel I∈R1x.
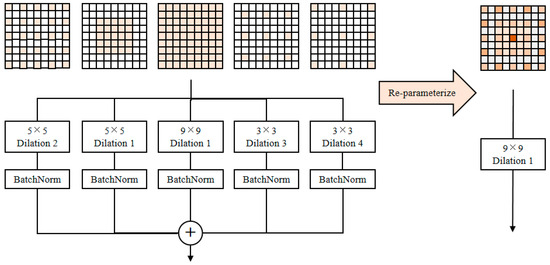
Figure 3.
UniRepLKNetBlock structure.
This is the detailed implementation principle of the UniRepLKNetBlock module. It incorporates hyperparameters including the large kernel size k, parallel transformation layer size k, and dilation rate r. Parallel convolutional pathways support dynamic adjustment of the kernel dimensions and expansion factors, enabling task-specific optimization of feature extraction patterns, with the only constraint being k-Kernel. In the training of this model, the UniRepLKNetBlock module is configured with a large kernel size K = 9, parallel convolutional layer kernel sizes k = (5, 5, 3, 3), and dilation rates r = (1, 2, 3, 4). Five convolutional layers with batch normalization (BN) are re-parameterized into a single large-kernel convolutional layer with kernel size 9, adhering to the constraint that k-Kernel ≤ k. The convolutional layers in the UniRepLKNetBlock module utilize depthwise convolutions, which significantly improve computational efficiency compared to standard convolutional layers.
C: The overall structure of the PAFPN is illustrated in Figure 4 [30]. The AFPN proposes a hierarchical progressive fusion framework that gradually integrates multi-level features into the object detection pipeline [31]. By dynamically balancing low-level spatial details with high-level semantic information, this approach bridges semantic gaps between feature hierarchies. By incorporating the AFPN feature fusion architecture, three key improvements are achieved [32]: low-level feature fusion, low-level feature alignment, and adaptive spatial fusion.
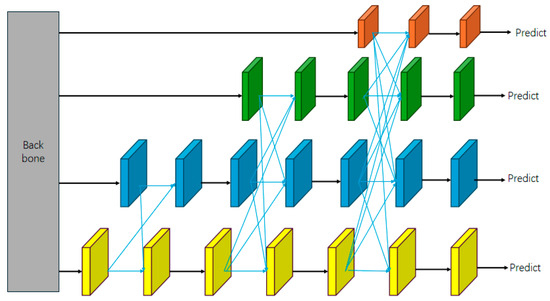
Figure 4.
Overall structure of PAFPN.
Low-Level Feature Fusion: Ore image features extracted from the backbone network are progressively fused from lower to deeper layers, ultimately integrating into the topmost (most abstract) features. This hierarchical progressive fusion addresses the issue where directly fusing non-adjacent layers with significant semantic gaps would be semantically inconsistent. By bridging these gaps through gradual integration, semantic information across different levels becomes more harmonized during the fusion process.
Low-Level Feature Alignment: From the backbone network, the last feature layer is selected among different hierarchical levels of extracted features. Assuming that five groups of features are denoted by {C2,C3,C4,C5,C6}, during feature fusion, the low-level layers C2 and C3 are first fed into the feature network, followed sequentially by C4, C5, and C6. This generates a set of multi-scale features, denoted by {P2,P3,P4,P5,P6}. A convolution with stride 2 is applied to P6, and, subsequently, a convolution with stride 1 produces P7, ensuring proper alignment of low-level features in the AFPN. In this experiment, DW-YOLO utilizes three layers: {C3,C4,C5} are input into the feature pyramid network, generating the output features {P3,P4,P5}.
ASFF: The ASFF structure is shown in Figure 5. During multi-level feature fusion, the ASFF module generates location-sensitive fusion parameters that hierarchically modulate feature contributions based on their semantic significance at varying abstraction levels, thereby enhancing the importance of inter-layer features while mitigating conflicting information arising from discrepancies across graphite ore image layers. Assumption: Let and denote the feature vectors at position (i,j) from the n-th and l-th layers, respectively. The fused feature vector Ffuse(i,j) can be expressed as multi-level features through this fusion process, as shown in Equation (1). The new feature combination is subject to the constraint + + = 1. (The generation mechanism of α, β, and γ belongs to internal implementation, representing the hierarchical index.)
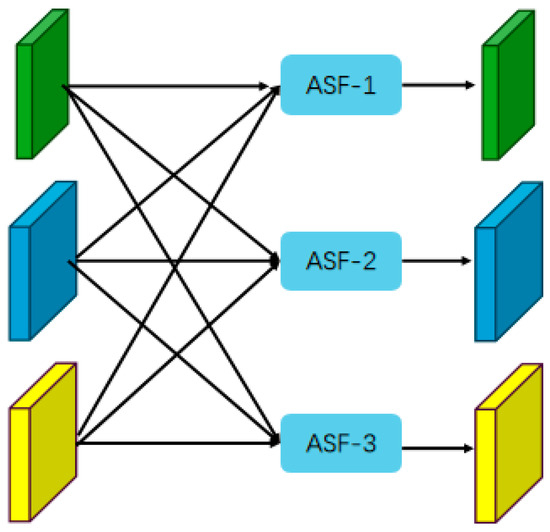
Figure 5.
ASFF module structure.
AFPN feature fusion operates like constructing a house layer by layer, progressively building hierarchical features. Its design emphasizes progressive and adaptive fusion between layers, leveraging detailed information from shallow features to refine deep-feature interpretation. This approach effectively mitigates the information discontinuity caused by direct cross-layer fusion (as illustrated in the ASFF2 structure in Figure 5). Subsequently, an adaptive learning mechanism dynamically adjusts the fusion weights of features at each hierarchical level, better aligning with the ore image feature fusion process (the ASFF3 structure shown in Figure 5).
D: To enhance model robustness and align with practical ore production scenarios—where not all data samples are standardized—we replace the traditional C-IoU loss with WIOU [33,34]. The WIoU loss function employs a dynamic non-monotonic framework to evaluate anchor box quality, prioritizing moderately ranked proposals to enhance the model’s object localization precision. In ore images, the textural features on the ore surface may resemble those of attached soil or mica on graphite ore. This similarity can cause ambiguous semantic learning during feature extraction, resulting in high overlap between anchor boxes and ground truth boxes, which ultimately classifies these instances as low-quality samples. The WIOU loss function constructs a two-level distance attention mechanism built upon distance metrics, as shown in Equations (2) and (3):
IoU stands for the overlap ratio between two bounding boxes. ( represents the Euclidean distance between the predicted central coordinates and the true central coordinates, and . () is the sum of the squares of the width and of the minimum bounding box.)
When dealing with ordinary-quality anchor boxes, [1,℮) will considerably strengthen their . represents a middle value, and the fit between the ordinary-quality anchor boxes and the target box is relatively good. Compared to high-quality anchor boxes, the value of will be larger, providing more gain to the ordinary anchor boxes, and will also be larger, thus paying more attention to the ordinary-quality anchor boxes.
∈[0, 1] will considerably reduce the of high-quality anchor boxes, and the box will overlap better, substantially decreasing the attention given to the distance from the center point. In simpler terms, when high-quality anchor boxes fit well with the target box, will be closer to 1 according to the calculation formula. Compared to that for ordinary-quality anchor boxes, will be smaller. When two anchor boxes have the same IoU with a target box, it means their is identical. However, the anchor box that is farther from the center point will have a larger , thus drawing more attention to the anchor box that is farther from the center point. This is shown in Equation (4):
Assigning a smaller gradient gain to anchor boxes with a larger outlier degree will effectively prevent low-quality examples from generating large, harmful gradients. is the moving average of momentum m, and a non-monotonic focusing coefficient is formulated for WIoUv1 by introducing r, as defined in Equation (5):
The gradient gain r is a mapping from the outlier degree B, governed by hyperparameter A, to the gradient gain r. Here, momentum m = 1 − , where n is the batch size and t is the number of epochs after which the improvement rate of the AP (average precision) significantly slows down. WIOU employs a dynamic non-monotonic mechanism to evaluate anchor box quality, enabling the model to focus more on moderate-quality anchors, thereby strengthening the model’s capacity for accurate object positioning. To address the challenge of high small-target density and increased detection complexity in ore imagery, WIoU dynamically optimizes gradient scaling for small objects, enhancing detection accuracy through adaptive weight allocation.
3. Results
3.1. Production of Datasets
To ensure consistency with real-world production conditions, ore specimens were collected from mining pits No. 6–9 at the Hegang graphite mine (China Minmetals Corporation, Heilongjiang Province), with particle sizes standardized to match post-grinding dimensions on the production line.
Images were captured using a self-designed image acquisition box (Figure 6). The device was equipped with a 48-megapixel camera, maintaining a fixed shooting distance of 45 cm from the sample (with minor deviations possible due to varying heights of graphite ore specimens). Its dual rotatable 120 W light sources on both sides were designed to simulate actual production line lighting conditions. Two exhaust fans were installed for heat dissipation, while the top-mounted imaging lens automatically completed focusing and captured images for transmission into the system. Notably, the surface features of the ore cannot directly indicate its carbon content. Therefore, after image capture, a carbon–sulfur analysis process and graphite carbonization measurement workflow were performed. The detailed workflow is illustrated in Figure 7. The dataset comprised 1236 images, which were proportionally divided into training, validation, and test subsets (6:2:2). The dataset composition and class distribution details are as follows: The dataset contained six quality grades with sample counts of 224, 244, 240, 182, 204, and 140 for grades 1 through 6, respectively. The corresponding class proportions were 18.1%, 19.7%, 19.4%, 14.7%, 16.5%, and 11.3%. The data was collected from production lines across five graphite mining regions over a time span from 2022 to 2025. The grading criteria for quality classification were determined by the proportion of unique wave-like cloud patterns on the ore surface relative to the total ore area. Final accuracy verification was conducted by comparing recognition results with chemical analysis outcomes. All original images were required to undergo the standardized preprocessing procedure via the equipment shown in Figure 7, which included processes such as illumination equalization and low-quality sample screening. After this, all images were uniformly cropped to a size of 640 × 640 pixels before being input into the system.
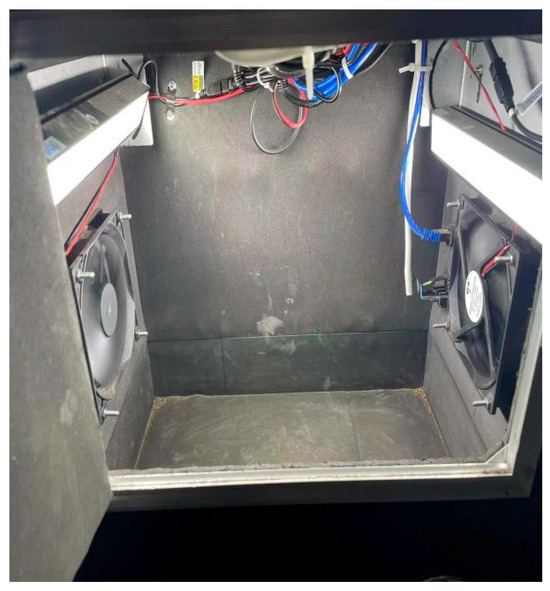
Figure 6.
Ore image collection machine.
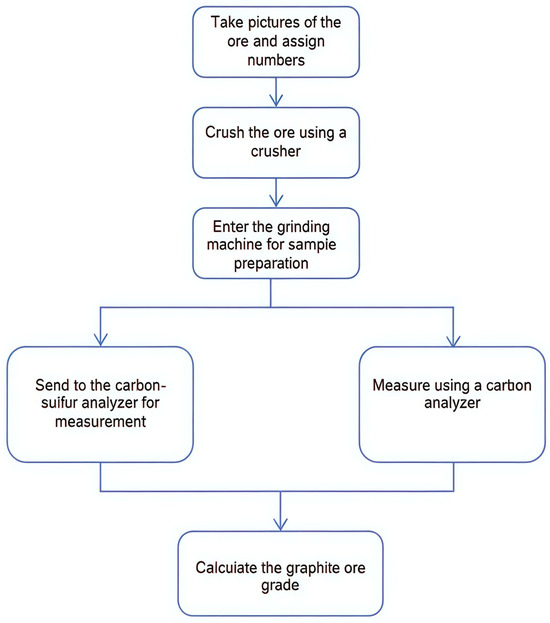
Figure 7.
Sample measurement process.
To address the challenge of subtle surface variations in graphite ore, the dataset was labeled using LabelImg with a rigorous triple-annotation protocol: 50% of the images underwent independent labeling by three annotators, followed by consensus-based validation to resolve discrepancies. The final dataset was stratified into six carbon-content-based grades (high to low), reflecting industrial sorting criteria. Since practical production only requires coarse-range carbon content estimation for ore batches, our labeling strategy aligns with field-standard operational protocols. Representative dataset samples are shown in Figure 8.

Figure 8.
Examples of ore samples.
All experiments were performed on a dual-boot system (Windows 10 and Ubuntu 18.04) featuring an NVIDIA GeForce RTX 4090 GPU (64 GB RAM, 24 GB VRAM) and an Intel Xeon Platinum i9-13900k CPU. The PyTorch 1.11 framework was employed for model training and inference. As detailed in Table 1, the initial learning rate was set to 0.01 with SGD optimization. Label smoothing (smoothing factor: 0.01) was incorporated to regularize the training process and improve generalization. The YOLOv8s baseline and its enhanced variants were trained for 120 epochs, utilizing a batch size of 16 and 16 data-loading workers.

Table 1.
Experimental setup parameters.
3.2. Evaluation Indicators
Commonly used performance metrics in object detection evaluation include precision (P), recall (R), average precision (AP), parameter count (Param), and floating-point operations per second (FLOPs). The parameter count and FLOPs represent the model’s storage footprint and computational complexity, respectively. Naturally, computational complexity and inference latency depend on the GPU or CPU hardware. Recall measures the proportion of correctly detected ore samples among all actual positive ore instances, while precision quantifies the ratio of true positive predictions among all predicted ore samples. However, precision and recall are not directly used to evaluate detection accuracy; instead, average precision (AP) is typically adopted as the primary metric for model performance. Specific formulas are provided as follows: True Positives (TP) denotes the actual ore samples correctly predicted as ore, False Positives (FP) refers to non-ore instances incorrectly classified as ore, and False Negatives (FN) indicates actual ore samples missed by the detector. For comprehensive model evaluation, these metrics collectively ensure both effectiveness and computational efficiency while considering deployment feasibility. The mathematical formulations are detailed in Equations (6)–(8).
3.3. Model Training and Detection
Figure 9 presents the training dynamics of the loss function and performance metrics. The loss function consistently decreases with increasing number of epochs, while the mAP, precision, and recall metrics show a steady upward trend, indicating the model’s robust learning and generalization abilities for graphite ore feature extraction. Furthermore, Figure 10 demonstrates the model’s capability to identify quality-discriminative features on complex ore surfaces and localize them with high precision, validating its readiness for real-world deployment.
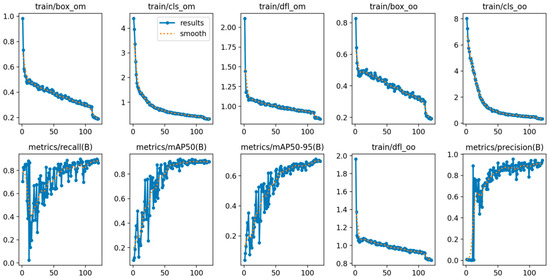
Figure 9.
Model training results.
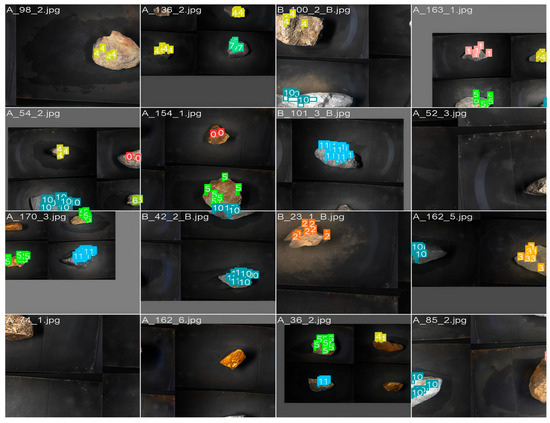
Figure 10.
Subtle features on the ore surface that represent ore grade.
3.4. Ablation Experiments
3.4.1. Module Selection Experiment
To comprehensively evaluate the applicability of different modules in graphite ore detection tasks, we designed rigorous module replacement comparative experiments. While maintaining the YOLOv8s backbone network, we systematically replaced the loss functions and feature fusion modules, conducting fair comparisons on our specialized graphite ore dataset. The results are shown in Table 2. WIoU consistently demonstrated significantly superior performance across all metrics compared to other loss functions, validating the importance of considering bounding box aspect ratios. It exhibited stronger generalization capabilities in handling the ambiguous surface characteristics of ore samples, where texture features often resemble attached impurities such as soil or mica.

Table 2.
Ablation study results for individual modules.
Regarding the feature processing component, our analysis reveals that the PANet module demonstrates superior performance for our model. Compared to the BiFPN and CSwin modules, PANet shows stronger capabilities in capturing global contextual information while maintaining excellent discrimination of subtle textures—particularly critical for distinguishing between graphite surfaces and attached impurities.
UniRepLKNet achieved better performance with fewer parameters, demonstrating the advantages of large-kernel convolutions in industrial image processing. The scale-like structure of graphite ore (particularly mica attachments) requires a larger receptive field for complete feature capture, which aligns perfectly with the strengths of large-kernel convolution operations. This architectural choice enables more effective extraction of the characteristic flake patterns that determine ore quality grades.
3.4.2. Single-Module Ablation
We performed an ablation study to systematically evaluate the effectiveness of three critical components: feature extraction, feature fusion, and loss function design. Specifically, we incrementally introduced three modules—C2f_UniRepLKNetBlock (ID 1), PAFPN (ID 2), and WIoU loss (ID 3)—and assessed their individual contributions to model performance. All experiments were conducted on the previously described dataset (Section X), with results tabulated in Table 3. The optimal configurations are emphasized in bold for clarity.

Table 3.
Ablation study results for individual modules.
First, the WIoU function was integrated to enhance discrimination of ores with visually similar textures, addressing misclassification risks caused by ambiguous surface patterns (e.g., weathering-induced similarities in low-grade ores). This modification improved detection accuracy by 3.1% (Table 3). Second, C2f_UniRepLKNetBlock was designed to overcome receptive field constraints [35,36], combining large-kernel and small-kernel convolutions for dual-scale feature extraction. By capturing both global context and fine-grained details, the architecture achieved a 3.9% precision gain. Finally, the PAFPN module was introduced to mitigate semantic gaps in cross-layer feature fusion. Its multi-level aggregation strategy preserved semantic integrity, boosting robustness for multi-scale detection and yielding a 5.3% accuracy improvement.
3.4.3. Comparison of Whole Module Ablation
The proposed framework introduces three key enhancements: WIoU Function: Prioritizes subtle feature distinctions during pre-processing, improving detection accuracy by 3.1% (ID 1). C2f_UniRepLKNetBlock: Parallel large-/small-kernel convolutions expand receptive fields while preserving fine-grained details, yielding a 4.0% mAP gain (ID 2). PAFPN Pyramid: Multi-level feature aggregation strengthens cross-hierarchy semantic consistency, contributing an additional 2.5% improvement (ID 3). As shown in Table 4, the cumulative effect of these modules elevated the baseline mAP from 84.3% to 93.9% (+9.6%), demonstrating their synergistic effectiveness.

Table 4.
Ablation study results for the overall modules.
Figure 11 illustrates that the model performance exhibited an upward trend as improvement modules were incrementally integrated. DW-YOLOv8 achieved both the peak mAP and the lowest parameter count (Param), demonstrating the effectiveness of our improvement strategy. The model’s lightweight design and enhanced object localization accuracy are realized without increasing computational complexity, resulting in a holistic performance improvement.
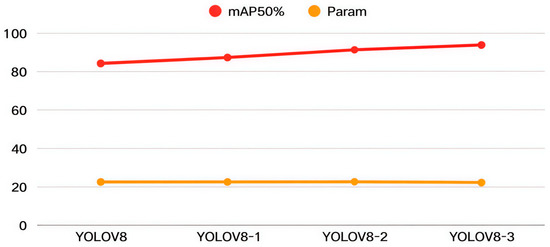
Figure 11.
Visualization of overall ablation study results.
3.5. Comparative Experiments
3.5.1. Comparison with Other Models
To validate the efficacy of our design, we conducted benchmark comparisons against state-of-the-art object detection frameworks, including YOLO-series variants and two-stage detectors (Table 5). The YOLO family demonstrates superior computational efficiency, with significantly lower FLOPs and Params compared to Faster R-CNN [37]. While Faster R-CNN achieves marginally higher accuracy (e.g., 92.1% vs. 93.9% mAP50), its two-stage architecture introduces latency bottlenecks, making it unsuitable for real-time industrial deployment.

Table 5.
Performance comparison results for DW-YOLOV8 and the current mainstream detection models.
As shown in Figure 12, the proposed DW-YOLOv8 outperformed the baseline YOLOv8 by 8.27% in terms of mAP50 under comparable computational budgets (e.g., 12.3 GFLOPs vs. 12.5 GFLOPs). This precision–efficiency trade-off positions DW-YOLOv8 as a robust framework for graphite ore grade detection, balancing high accuracy requirements with hardware constraints in production environments.
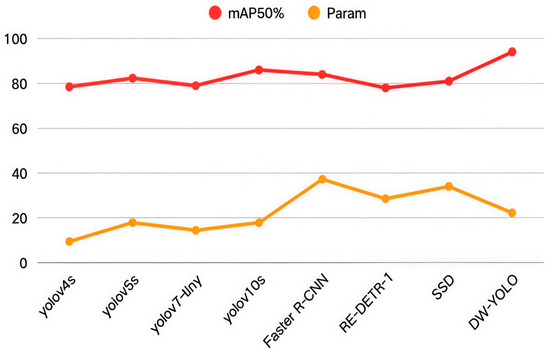
Figure 12.
Comparative experiments. Let us compare our model with better algorithms in the field of object recognition.
3.5.2. Comparison with the Same Model Algorithm
To validate the efficacy of our design, we benchmarked DW-YOLOv8 against state-of-the-art improved YOLOv8 architectures (Table 6). Under comparable computational budgets (e.g., LAR-YOLOv8 [38], similar Params/FLOPs), our method outperformed competitors by 3.1% in terms of mAP, highlighting its superior accuracy–efficiency trade-off. For small-target detection (MAE-YOLOv8 [39]), our framework achieved higher precision (93.9% vs. 90.8%) with 12% fewer parameters, demonstrating enhanced lightweighting. Against dedicated lightweight models (Light-SA YOLOv8 [40]), DW-YOLOv8 still retained a 1.2% mAP advantage, proving its robustness across deployment scenarios.

Table 6.
Comparison results for similar model algorithms.
Considering the results of the above experiments, the proposed algorithm has been fully validated in terms of its effectiveness and applicability, demonstrating excellent model detection performance.
4. Discussion
This paper proposes a new algorithm based on YOLOv8, named DW-YOLOv8, aiming to solve the detection challenge of graphite ore grade recognition on conveyor belts. Firstly, the WIoU loss function was adopted to replace the original loss function. This dynamic non-monotonic mechanism assesses the quality of anchor boxes, enabling the model to focus more on low-quality common anchor boxes, thereby enhancing the target localization ability. The model’s mAP index increased by 4.1 percentage points. Secondly, the C2f_UniRepLKNetBlock module was introduced, which combines large-kernel convolution and small-kernel convolution in parallel to improve model performance. Small-kernel convolution captures fine patterns and local details during training, while the parallel design expands the receptive field, which is a key advantage for simultaneously extracting global context and local information. With this module in combination with the above loss function, the model performance increased from 84.3% to 91.4%, with the mAP index rising by 7.1 percentage points. Finally, in terms of feature fusion, we designed a novel feature pyramid structure (PAFPN). By enhancing the feature extraction module, the neck network’s ability to capture complex textures and weak signals in ore images was strengthened. An adaptive weight allocation mechanism can dynamically adjust the fusion weights, reducing the semantic differences between shallow and deep layers during the feature integration process. Experimental results showed that the improved model achieved an overall performance improvement of 9.6 percentage points under the condition of reduced overall parameters. The DW-YOLOv8 model outperformed classic object detection models and their improved versions, highlighting its outstanding performance. In summary, the detection accuracy of this model meets the requirements of actual production lines and paves the way for future deployment in ore processing. Next, we will expand the image datasets to cover more mining sites and further promote the intelligent and automated recognition of ore grades.
Author Contributions
Conceptualization: X.H. and X.Z.; Methodology: X.H. and X.Z.; Software: X.Z.; Validation: X.Z. and Y.Y.; Formal Analysis: X.H. and X.Z.; Investigation: X.Z. and Y.Y.; Resources: X.Z. and Y.Y.; Data Curation: X.Z. and Y.Y.; Writing—Original Draft: X.Z., X.H. and Y.Y.; Writing—Review & Editing: X.H. and Y.Y.; Visualization: X.Z. and Y.Y.; Supervision: Y.Y. and X.H.; Project Administration: Y.Y. and X.H. All authors have read and agreed to the published version of the manuscript.
Funding
This research was funded by National key Research and Development program of China 2020YFB1713700.
Institutional Review Board Statement
Not applicable.
Informed Consent Statement
Not applicable.
Data Availability Statement
Data supporting the results of this study are available from the corresponding author upon request.
Conflicts of Interest
Author Yuxing Yu was employed by the company China Minmetals Corporation (Heilongjiang) Graphite Industry Co., Ltd. The remaining authors declare that the research was conducted in the absence of any commercial or financial relationships that could be construed as a potential conflict of interest.
References
- Zhu, J.; Pei, L.; Yuan, S.; Lin, D.; Lu, R.; Zhu, Y.; Wang, H. A unique graphene composite coating suitable for ultra-low temperature and thermal shock environments. Prog. Org. Coat. 2024, 186, 107997. [Google Scholar] [CrossRef]
- Zhao, L.; Ding, B.; Qin, X.Y.; Wang, Z.; Lv, W.; He, Y.; Yang, Q.; Kang, F. Revisiting the roles of natural graphite in ongoing lithium-ion batteries. Adv. Mater. 2022, 34, 2106704. [Google Scholar] [CrossRef]
- Kim, Y.S.; Hanif, M.A.; Song, H.; Kim, S.; Cho, Y.; Ryu, S.-K.; Kim, H.G. Wood-Derived Graphite: A Sustainable and Cost-Effective Material for the Wide Range of Industrial Applications. Crystals 2024, 14, 309. [Google Scholar] [CrossRef]
- Zhang, C.; Lv, W.; Xie, X.; Tang, D.; Liu, C.; Yang, Q.-H. Towards low temperature thermal exfoliation of graphite oxide for graphene production. Carbon 2013, 62, 11–24. [Google Scholar] [CrossRef]
- Tamashausky, A.V. Graphite. Am. Ceram. Soc. Bull. 1998, 77, 102–104. [Google Scholar]
- McCoy, T.M.; Parks, H.C.W.; Tabor, R.F. Highly efficient recovery of graphene oxide by froth flotation using a common surfactant. Carbon 2018, 135, 164–170. [Google Scholar] [CrossRef]
- Bu, X.; Zhang, T.; Peng, Y.; Xie, G.; Wu, E. Multi-stage flotation for the removal of ash from fine graphite using mechanical and centrifugal forces. Minerals 2018, 8, 15. [Google Scholar] [CrossRef]
- Lee, S.M.; Kang, D.S.; Roh, J.S. Bulk graphite: Materials and manufacturing process. Carbon Lett. 2015, 16, 135–146. [Google Scholar] [CrossRef]
- Dash, P.; Dash, T.; Rout, T.K.; Sahu, A.K.; Biswal, S.K.; Mishra, B.K. Preparation of graphene oxide by dry planetary ball milling process from natural graphite. RSC Adv. 2016, 6, 12657–12668. [Google Scholar] [CrossRef]
- Voulodimos, A.; Doulamis, N.; Doulamis, A.; Protopapadakis, E. Deep learning for computer vision: A brief review. Comput. Intell. Neurosci. 2018, 2018, 7068349. [Google Scholar] [CrossRef] [PubMed]
- Viola, P.; Jones, M. Rapid object detection using a boosted cascade of simple features. In Proceedings of the 2001 IEEE Computer Society Conference on Computer Vision and Pattern Recognition, CVPR 2001, Kauai, HI, USA, 8–14 December 2001; IEEE: New York, NY, USA, 2001; Volume 1, p. I. [Google Scholar]
- Hussain, M. Yolov1 to v8: Unveiling each variant–a comprehensive review of yolo. IEEE Access 2024, 12, 42816–42833. [Google Scholar] [CrossRef]
- Jiang, P.; Ergu, D.; Liu, F.; Cai, Y.; Ma, B. A Review of Yolo algorithm developments. Procedia Comput. Sci. 2022, 199, 1066–1073. [Google Scholar] [CrossRef]
- Kong, D.; Li, Y.; Duan, M. Fire and smoke real-time detection algorithm for coal mines based on improved YOLOv8s. PLoS ONE 2024, 19, e0300502. [Google Scholar] [CrossRef]
- Wang, F.; Wang, H.; Qin, Z.; Tang, J. UAV target detection algorithm based on improved YOLOv8. IEEE Access 2023, 11, 116534–116544. [Google Scholar] [CrossRef]
- Wang, S. Automated non-PPE detection on construction sites using YOLOv10 and transformer architectures for surveillance and body worn cameras with benchmark datasets. Sci. Rep. 2025, 15, 27043. [Google Scholar] [CrossRef] [PubMed] [PubMed Central]
- Eum, I.; Kim, J.; Wang, S.; Kim, J. Heavy Equipment Detection on Construction Sites Using You Only Look Once (YOLO-Version 10) with Transformer Architectures. Appl. Sci. 2025, 15, 2320. [Google Scholar] [CrossRef]
- Zhen, J.; Xie, B. Fused attention mechanism-based ore sorting network. arXiv 2024, arXiv:2405.02785. [Google Scholar]
- Bo, J.; Zhang, C.; Fan, C.; Li, H. Ore Conveyor Belt Sundries Detection Based on Improved YOLOv3. J. Comput. Eng. Appl. 2021, 21, 248–255. [Google Scholar]
- Yao, R.; Qi, P.; Hua, D.; Zhang, X.; Lu, H.; Liu, X. A Foreign Object Detection Method for Belt Conveyors Based on an Improved YOLOX Model. Technologies 2023, 11, 114. [Google Scholar] [CrossRef]
- Li, D.; Wang, G.; Zhang, Y.; Wang, S. Coal gangue detection and recognition algorithm based on deformable convolution YOLOv3. IET Image Process. 2022, 16, 134–144. [Google Scholar] [CrossRef]
- Hamerly, G.; Elkan, C. Learning the k in k-means. Adv. Neural Inf. Process. Syst. 2003, 16. [Google Scholar]
- Wood, S. mgcv: Mixed GAM Computation Vehicle with GCV/AIC/REML Smoothness Estimation; University of Bath: Bath, UK, 2012. [Google Scholar]
- Mungoli, N. Adaptive feature fusion: Enhancing generalization in deep learning models. arXiv 2023, arXiv:2304.03290. [Google Scholar]
- Zheng, F.; Chen, X.; Chen, X.; Li, H.; Guo, X.; Liu, W.; Pun, C.-M.; Zhou, S. ASSNet: Adaptive Semantic Segmentation Network for Microtumors and Multi-Organ Segmentation. arXiv 2024, arXiv:2409.07779. [Google Scholar]
- Xiang, J.; Shi, H.; Huang, X.; Chen, D. Improving Graphite Ore Grade Identification with a Novel FRCNN-PGR Method Based on Deep Learning. Appl. Sci. 2023, 13, 5179. [Google Scholar] [CrossRef]
- Qiu, Z.; Huang, X.; Li, S.; Wang, J. Stellar-YOLO: A Graphite Ore Grade Detection Method Based on Improved YOLO11. Symmetry 2025, 17, 966. [Google Scholar] [CrossRef]
- Ding, X.; Zhang, Y.; Ge, Y.; Zhao, S.; Song, L.; Yue, X.; Shan, Y. UniRepLKNet: A Universal Perception Large-Kernel ConvNet for Audio Video Point Cloud Time-Series and Image Recognition. In Proceedings of the IEEE/CVF Conference on Computer Vision and Pattern Recognition, Seattle, WA, USA, 16–22 June 2024; pp. 5513–5524. [Google Scholar]
- Zhang, X.; Zeng, H.; Zhang, L. Edge-oriented convolution block for real-time super resolution on mobile devices. In Proceedings of the 29th ACM International Conference on Multimedia, Online, 20–24 October 2021; pp. 4034–4043. [Google Scholar]
- Liu, S.; Qi, L.; Qin, H.; Shi, J.; Jia, J. PANet: Path Aggregation Network for Instance Segmentation. arXiv 2018, arXiv:1803.01534. [Google Scholar]
- Yang, G.; Lei, J.; Zhu, Z.; Cheng, S.; Feng, Z.; Liang, R. AFPN: Asymptotic Feature Pyramid Network for Object Detection. In Proceedings of the 2023 IEEE International Conference on Systems, Man, and Cybernetics (SMC), Honolulu, HI, USA, 1–4 October 2023; IEEE: New York, NY, USA, 2023; pp. 2184–2189. [Google Scholar]
- Liu, Z.; Gao, G.; Sun, L.; Fang, L. IPG-net: Image pyramid guidance network for small object detection. In Proceedings of the IEEE/CVF Conference on Computer Vision and Pattern Recognition Workshops, Seattle, WA, USA, 13–19 June 2020; pp. 1026–1027. [Google Scholar]
- Zheng, Z.; Wang, P.; Liu, W.; Li, J.; Ye, R.; Ren, D. Distance-IoU loss: Faster and better learning for bounding box regression. In Proceedings of the AAAI Conference on Artificial Intelligence, New York, NY, USA, 7–12 February 2020; Volume 34, pp. 12993–13000. [Google Scholar]
- Tong, Z.; Chen, Y.; Xu, Z.; Yu, R. Wise-IoU: Bounding box regression loss with dynamic focusing mechanism. arXiv 2023, arXiv:2301.10051. [Google Scholar]
- Luo, W.; Li, Y.; Urtasun, R.; Zemel, R. Understanding the effective receptive field in deep convolutional neural networks. Adv. Neural Inf. Process. Syst. 2016, 29. [Google Scholar]
- Pan, X.; Ren, Y.; Sheng, K.; Dong, W.; Yuan, H.; Guo, X.; Ma, C.; Xu, C. Dynamic refinement network for oriented and densely packed object detection. In Proceedings of the IEEE/CVF Conference on Computer Vision and Pattern Recognition, Seattle, WA, USA, 13–19 June 2020; pp. 11207–11216. [Google Scholar]
- Ren, S.; He, K.; Girshick, R.; Sun, J. Faster r-cnn: Towards real-time object detection with region proposal networks. Adv. Neural Inf. Process. Syst. 2015, 28. [Google Scholar] [CrossRef] [PubMed]
- Yi, H.; Liu, B.; Zhao, B.; Liu, E. Small object detection algorithm based on improved YOLOv8 for remote sensing. IEEE J. Sel. Top. Appl. Earth Obs. Remote Sens. 2023, 17, 1734–1747. [Google Scholar] [CrossRef]
- Liu, Q.; Lv, J.; Zhang, C. MAE-YOLOv8-based small object detection of green crisp plum in real complex orchard environments. Comput. Electron. Agric. 2024, 226, 109458. [Google Scholar] [CrossRef]
- Luo, D.; Xue, Y.; Deng, X.; Yang, B.; Chen, H.; Mo, Z. Citrus Diseases and Pests Detection Model Based on Self-Attention YOLOV8. IEEE Access 2023, 11, 139872–139881. [Google Scholar] [CrossRef]
Disclaimer/Publisher’s Note: The statements, opinions and data contained in all publications are solely those of the individual author(s) and contributor(s) and not of MDPI and/or the editor(s). MDPI and/or the editor(s) disclaim responsibility for any injury to people or property resulting from any ideas, methods, instructions or products referred to in the content. |
© 2025 by the authors. Licensee MDPI, Basel, Switzerland. This article is an open access article distributed under the terms and conditions of the Creative Commons Attribution (CC BY) license (https://creativecommons.org/licenses/by/4.0/).