Article

Multi-Class Segmentation and Classification of Intestinal Organoids: YOLO Stand-Alone vs. Hybrid Machine Learning Pipelines

1
Department of Physics and Chemistry, University of Palermo, 90128 Palermo, Italy
2
Laboratory of Advanced Data Analysis for Medicine (ADAM), University of Salento and Local Health Authority (ASL) of Lecce, 73100 Lecce, Italy
3
National Institute for Nuclear Physics, Laboratori Nazionali del Sud, 95123 Catania, Italy
4
Laboratory of Biomedical Physics and Environment, Department of Mathematics and Physics “E. De Giorgi”, University of Salento, via per Monteroni, 73100 Lecce, Italy
5
National Institute for Nuclear Physics, Branch of Lecce, 73100 Lecce, Italy
*
Author to whom correspondence should be addressed.
Appl. Sci. 2025, 15(21), 11311; https://doi.org/10.3390/app152111311
Submission received: 29 August 2025 / Revised: 14 October 2025 / Accepted: 16 October 2025 / Published: 22 October 2025

Abstract

Background: The automated analysis of intestinal organoids in microscopy images are essential for high-throughput morphological studies, enabling precision and scalability. Traditional manual analysis is time-consuming and subject to observer bias, whereas Machine Learning (ML) approaches have recently demonstrated superior performance. Purpose: This study aims to evaluate YOLO (You Only Look Once) for organoid segmentation and classification, comparing its standalone performance with a hybrid pipeline that integrates DL-based feature extraction and ML classifiers. Methods: The dataset, consisting of 840 light microscopy images and over 23,000 annotated intestinal organoids, was divided into training (756 images) and validation (84 images) sets. Organoids were categorized into four morphological classes: cystic non-budding organoids (Org0), early organoids (Org1), late organoids (Org3), and Spheroids (Sph). YOLO version 10 (YOLOv10) was trained as a segmenter-classifier for the detection and classification of organoids. Performance metrics for YOLOv10 as a standalone model included Average Precision (AP), mean AP at 50% overlap (mAP50), and confusion matrix evaluated on the validation set. In the hybrid pipeline, trained YOLOv10 segmented bounding boxes, and features extracted from these regions using YOLOv10 and ResNet50 were classified with ML algorithms, including Logistic Regression, Naive Bayes, K-Nearest Neighbors (KNN), Random Forest, eXtreme Gradient Boosting (XGBoost), and Multi-Layer Perceptrons (MLP). The performance of these classifiers was assessed using the Receiver Operating Characteristic (ROC) curve and its corresponding Area Under the Curve (AUC), precision, F1 score, and confusion matrix metrics. Principal Component Analysis (PCA) was applied to reduce feature dimensionality while retaining 95% of cumulative variance. To optimize the classification results, an ensemble approach based on AUC-weighted probability fusion was implemented to combine predictions across classifiers. Results: YOLOv10 as a standalone model achieved an overall mAP50 of 0.845, with high AP across all four classes (range 0.797–0.901). In the hybrid pipeline, features extracted with ResNet50 outperformed those extracted with YOLO, with multiple classifiers achieving AUC scores ranging from 0.71 to 0.98 on the validation set. Among all classifiers, Logistic Regression emerged as the best-performing model, achieving the highest AUC scores across multiple classes (range 0.93–0.98). Feature selection using PCA did not improve classification performance. The AUC-weighted ensemble method further enhanced performance, leveraging the strengths of multiple classifiers to optimize prediction, as demonstrated by improved ROC-AUC scores across all organoid classes (range 0.92–0.98). Conclusions: This study demonstrates the effectiveness of YOLOv10 as a standalone model and the robustness of hybrid pipelines combining ResNet50 feature extraction and ML classifiers. Logistic Regression emerged as the best-performing classifier, achieving the highest ROC-AUC across multiple classes. This approach ensures reproducible, automated, and precise morphological analysis, with significant potential for high-throughput organoid studies and live imaging applications.

1. Introduction

The intestinal epithelium, a highly dynamic tissue, is extensively studied to elucidate stem cell biology and the pathogenesis of critical diseases, particularly colorectal cancer. Three-dimensional (3D) ex vivo organoid culture systems have revolutionized this field by providing physiologically relevant models that replicate key features of in vivo tissue architecture, such as crypt-villus domains and niche-derived growth factor dependence [1,2].
As organoids progress in culture, they exhibit distinct morphological transitions—from cystic structures enriched with stem and Paneth cells to budding organoids with crypt-like protrusions, and eventually, spheroid-like morphologies under specific conditions [3]. These changes serve as vital readouts for processes such as stemness, epithelial regeneration, and differentiation. For example, crypt budding quantifies stem cell activity, while spheroid morphology is associated with Wnt signaling, cellular plasticity, and tumorigenesis [3]. These spheroid-like morphologies represent a less differentiated epithelial state, occurring under particular growth conditions and often associated with specific signaling pathways, such as Wnt regulation [4]. These changes serve as vital readouts for processes such as stemness, epithelial regeneration, and differentiation. For instance, crypt budding quantifies stem cell activity, while spheroid morphology is associated with Wnt signaling, cellular plasticity, and tumorigenesis [3,5]. The ability to analyze these morphological transitions has been critical for studies investigating the effects of signaling pathways, drugs, and genetic perturbations on intestinal tissue homeostasis. For example, studies have demonstrated the role of Wnt and Notch signaling pathways in driving organoid growth and differentiation [6]. Furthermore, high-throughput organoid systems have been leveraged to investigate the impact of oncogenic mutations, such as APC loss or KRAS activation, on epithelial architecture and proliferative capacity [1,3]. Additionally, recent advancements have enabled the development of co-culture models where organoids are paired with stromal or immune cells to mimic more complex tissue microenvironments, facilitating translational studies on inflammation and cancer [7,8].
Despite these advances, current approaches to analyze organoid morphology remain largely manual, involving visual inspection and classification, which is time-consuming, subjective, and prone to variability between researchers [5,9,10,11,12,13,14,15,16,17]. This limitation becomes particularly evident when dealing with large datasets or longitudinal experiments that require continuous monitoring. Recent efforts have introduced computational tools to address medical challenge [18,19,20,21,22]. For instance, deep learning (DL)-based methods such as convolutional neural networks (CNNs) have been applied to automate the quantification of organoid size, shape, and viability [23,24]. In addition, new approaches leveraging machine learning (ML) algorithms, including object-detection frameworks like YOLO (You Only Look Once), have demonstrated significant promise for automating organoid analysis in real time [25]. These tools enable rapid detection of organoids across multiple morphological classes, overcoming the limitations of manual analysis while maintaining high accuracy. For instance, OrganoID provides a versatile platform for tracking and morphological classification of organoids in brightfield and phase-contrast microscopy, offering high accuracy and broad applicability for various organoid types [11]. Similarly, OrBITS facilitates label-free, real-time, and time-lapse monitoring of organoids, making it particularly valuable for drug screening and longitudinal studies [26].On the other hand, D-CryptO focuses specifically on colon organoid morphology, leveraging DL to evaluate structural features such as crypt formation and opacity from brightfield images, thus providing insights into organoid maturity and development.
Recent studies have underscored the transformative potential of computational approaches for organoid analysis, particularly in addressing the limitations of manual methods. Xiang et al. [27] reviewed the applications of intestinal organoids in disease modeling, drug screening, and regenerative medicine. They highlighted the use of cutting-edge technologies, including organoid-on-chip systems, genome editing, and microfluidics, to enhance high-throughput cultivation and better mimic patient-specific genetic characteristics.
Laudadio et al. [28] developed a fibrosis model using patient-derived intestinal organoids (PDOs) exposed to pro-inflammatory cytokines, such as TNF-α and TGF-β1. Their study revealed upregulation of epithelial–mesenchymal transition (EMT) genes in fibrotic PDOs, particularly in Crohn’s disease samples. This model provides an advanced tool for studying fibrogenesis in inflammatory bowel disease (IBD).
Matthews et al. [11] introduced OrganoID, a DL platform for real-time tracking and morphological classification of organoids. This versatile tool demonstrated high accuracy and broad applicability, facilitating automated monitoring of organoid dynamics across various experimental setups.
Deben et al. [26] presented OrBITS, a label-free platform for longitudinal and real-time analysis of organoids, particularly suited for drug screening applications. By enabling precise tracking of organoid responses, OrBITS bridges a critical gap in experimental reproducibility and scalability.
Abdul et al. [29] proposed D-CryptO, a DL-based tool tailored for analyzing colon organoid morphology. By evaluating structural features such as crypt formation and opacity in brightfield images, D-CryptO provides detailed insights into organoid development and maturity.
These studies collectively illustrate the rapid evolution of computational tools for organoid research, emphasizing their potential to enhance experimental throughput, reproducibility, and precision. However, challenges remain, particularly in generalizing across diverse experimental conditions and resolving morphologically similar structures.
In this study, we propose an innovative framework for automated segmentation and classification of intestinal organoids, combining the strengths of DL and ML approaches. Specifically:
  • We evaluate YOLOv10 as a standalone model for organoid segmentation and classification, demonstrating its superior accuracy and efficiency over earlier YOLO architectures.
  • We introduce a hybrid pipeline where features extracted from YOLO or ResNet50 are classified using state-of-the-art ML algorithms, including Logistic Regression, Random Forest, Naive Bayes, Multi-Layer Perceptrons (MLP), K-Nearest Neighbors (KNN), and eXtreme Gradient Boosting (XGBoost).
  • To further enhance performance, we implement an AUC-weighted ensemble method that integrates predictions across multiple classifiers, achieving robust and scalable morphological classification.
This framework overcomes the limitations of manual annotation and current computational tools, enabling precise, high-throughput morphological analysis of organoids. With significant implications for oncology, stem cell biology, and therapeutic screening, our approach paves the way for advancements in cancer research, offering a scalable and reliable solution for organoid-based studies.

2. Methods

2.1. Dataset

The dataset used in this study was adopted from Domenech-Moreno et al. [25] and downloaded from the following link: https://datadryad.org/stash/dataset/doi:10.5061/dryad.jdfn2z3d5 (accessed on 20 April 2024). It consists of 840 transmitted-light microscopy images of intestinal organoids derived from crypts isolated from mouse small intestines. The dataset captures organoids at different morphological stages, including cystic non-budding organoids (Org0), early budding organoids with 1–2 crypt-like structures (Org1), advanced organoids with three or more budding crypts (Org3), and spheroids (Sph), which are thin-walled, non-budding structures with a larger diameter.
The dataset contains a total of 23,066 annotated organoids, unevenly distributed across the four morphological classes. Org0 represents 52% of the total annotations, followed by Org1 with 24%, Org3 with 14%, and Sph comprising 10%. Each annotation was saved in the YOLO format, where bounding boxes are represented by a class label and four normalized coordinates corresponding to the center, width, and height of the region of interest.
To facilitate robust model training and evaluation, the dataset was split into two subsets: 756 images (90%) were assigned to the training set, while the remaining 84 images (10%) were reserved for the validation set. The annotations were manually reviewed for accuracy to ensure high-quality morphological classification and precise bounding box placement.
The dataset was used in its original form without any additional preprocessing (e.g., denoising, contrast enhancement, or normalization), as released by Domenech-Moreno et al. via the Dryad repository, to maintain full comparability with the original study conditions.

2.2. YOLO Standalone Model for Segmentation and Classification

You Only Look Once (YOLO) is a state-of-the-art, real-time object detection algorithm. YOLO frames the object detection problem as a single regression problem, directly predicting bounding boxes and class probabilities from full images in one evaluation, making it extremely fast and accurate [30]. YOLO version 10 (YOLOv10) was employed as a standalone model for the simultaneous segmentation and classification of intestinal organoids into the four morphological classes. Two YOLOv10 configurations were tested: YOLOv10-nano and YOLOv10-medium, with the latter yielding the best performance. The training process used the pre-defined dataset split (90:10) provided by the original dataset authors [25].
The YOLOv10-medium model was trained for 150 epochs with a batch size of 28 and a learning rate of 0.01, using the default optimization strategies provided by the YOLO framework. No additional modifications or fine-tuning were introduced to the training process.
Model performance was evaluated on the validation set using standard object detection metrics. Specifically, the mean Average Precision at 50% overlap (mAP50) was calculated. The mAP50 metric is a widely used benchmark in object detection tasks that evaluates the ability of the model to correctly predict bounding boxes for objects within an image. It is computed by calculating the Average Precision (AP) for each class and averaging these values across all classes. The AP is determined by measuring the area under the Precision-Recall (PR) curve, which is generated by varying the detection confidence threshold. To qualify as a correct detection, the predicted bounding box must overlap with the ground truth bounding box by at least 50% as measured by the Intersection over Union (IoU) metric. The IoU is defined as the ratio between the area of overlap and the area of union of the predicted and ground truth bounding boxes. The mAP50, therefore, summarizes the Precision and Recall of the model across all classes and thresholds when using an IoU threshold of 50%, providing a comprehensive evaluation of detection accuracy. Precision and Recall were computed for each class to evaluate class-specific performance. Precision measures the proportion of correctly predicted positive instances out of all positive predictions, while Recall evaluates the proportion of true positives identified out of all actual positives. The workflow is described in Figure 1.

2.3. Hybrid Pipeline: YOLO Segmentation and Feature Extraction

In addition to evaluating YOLOv10 as a standalone model, a hybrid pipeline was implemented to combine object detection with feature extraction and classification. The workflow is described in Figure 2. The already trained YOLOv10-medium was used to segment the regions of interest (ROIs) by detecting bounding boxes in both the training and validation sets. The resulting bounding boxes, corresponding to the four morphological classes, were cropped from the images and saved as individual .jpeg files along with their corresponding class labels to ensure uniform input for feature extraction and subsequent analysis. Features were extracted from these cropped regions using two distinct approaches. The first approach utilized a YOLO model while the second approach employed ResNet50. ResNet50, introduced by Kaiming He et al. in 2015, is a deep convolutional neural network (CNN) known for its residual learning framework, which allows for the training of very deep networks by mitigating the vanishing gradient problem [31]. Neither model was fine-tuned on the specific organoid dataset, ensuring the extracted features remained generalized. Feature extraction was performed using ResNet50, selected for its proven robustness in medical imaging and efficient residual architecture. YOLOv10 was adopted for detection due to its improved accuracy and real-time capability. Hyperparameters were optimized following standard YOLO practices (input size, learning rate, batch size).

2.4. Machine Learning Classifiers

Following the extraction of features from the segmented bounding boxes using YOLO and ResNet50, a set of ML classifiers was employed to predict the morphological class of each organoid. The classifiers included Logistic Regression, Random Forest, Naive Bayes, MLP, KNN, and XGBoost. These classifiers were chosen because they natively support multi-class classification, making them well-suited for distinguishing among the four morphological classes of organoids without requiring additional modifications or wrapping strategies. Logistic Regression was trained with the lbfgs solver and a maximum of 500 iterations to guarantee convergence; the Random Forest classifier was configured with 100 estimators; the Naive Bayes classifier was implemented using the Gaussian Naive Bayes algorithm, which is based on probabilistic modeling assuming feature independence. The MLP classifier was trained with a maximum of 300 iterations, while the KNN classifier was configured with five neighbors. Finally, XGBoost was set up with the “mlogloss” evaluation metric for multi-class classification. All classifiers were trained on the features extracted from the training set and validated on the features extracted from the held-out validation set.
The classifiers were evaluated on the validation set using standard performance metrics, including the Receiver Operating Characteristic (ROC) curve and its corresponding Area Under the Curve (AUC), and confusion matrix analysis. The ROC curve illustrates the true positive rate (sensitivity) against the false positive rate (1-specificity) across different classification thresholds, while the AUC quantifies the overall performance of the classifier as a single value. A higher AUC reflects greater discriminative ability to distinguish between the morphological classes. Confusion matrices were used to identify class-specific performance, highlighting potential misclassifications and imbalances across classes. The ROC curve was utilized to assess the classifier performance and to determine an “optimal” prediction threshold that maximizes accuracy.
To investigate the impact of feature dimensionality on classification performance, Principal Component Analysis (PCA) was applied to reduce the number of features while retaining 95% of the cumulative variance. The performance of each classifier was compared both before and after feature reduction to evaluate the effect of dimensionality on model accuracy and robustness. However, since PCA did not yield consistent performance gains, it was not retained in the final pipeline; all classifiers were ultimately trained on the full feature sets.

2.5. AUC-Based Ensemble Method

To enhance the overall robustness and accuracy of the hybrid pipeline, an ensemble method was implemented by combining the predictions of all ML classifiers. The ensemble approach utilized an AUC-weighted probability fusion, where the contribution of each classifier to the final prediction was proportional to its AUC score.
For each bounding box, the predicted class probabilities from all classifiers were aggregated using the weighted fusion strategy. This method assigned higher weights to classifiers with superior performance, as reflected by their AUC scores, while reducing the influence of less effective models. The ensemble output represented a fused probability distribution across all classes, leading to more reliable and accurate predictions.
This ensemble strategy leverages the strengths of individual classifiers while mitigating their weaknesses, ultimately optimizing the classification performance of the hybrid pipeline. The final ensemble predictions were evaluated on the validation set using the same metrics as the individual classifiers, including ROC and AUC analysis.

2.6. Computing Environment and Runtime

Experiments were executed on the CINECA Leonardo supercomputing cluster (NVIDIA A100-class GPUs; Linux environment). YOLOv10 training completed in about one day on a single GPU. Training of downstream ML classifiers (using ResNet50 features) required ~5–8 h. During inference, YOLOv10 achieved millisecond-level latency per image on GPU (throughput depending on batch size and input resolution). To assess portability beyond HPC infrastructure, we also validated the pipeline on a workstation-class PC equipped with an NVIDIA GeForce RTX 3090 GPU, observing consistent behavior and comparable relative trends in training/inference performance. These figures are indicative and may vary across hardware configurations.

3. Results

3.1. YOLOv10 Standalone Model Performance

The YOLOv10-medium model demonstrated strong performance in both segmentation and classification tasks when evaluated on the validation set. The model achieved a mAP50 of 0.845, with a precision of 0.787, a recall of 0.763, reflecting robust overall performance.
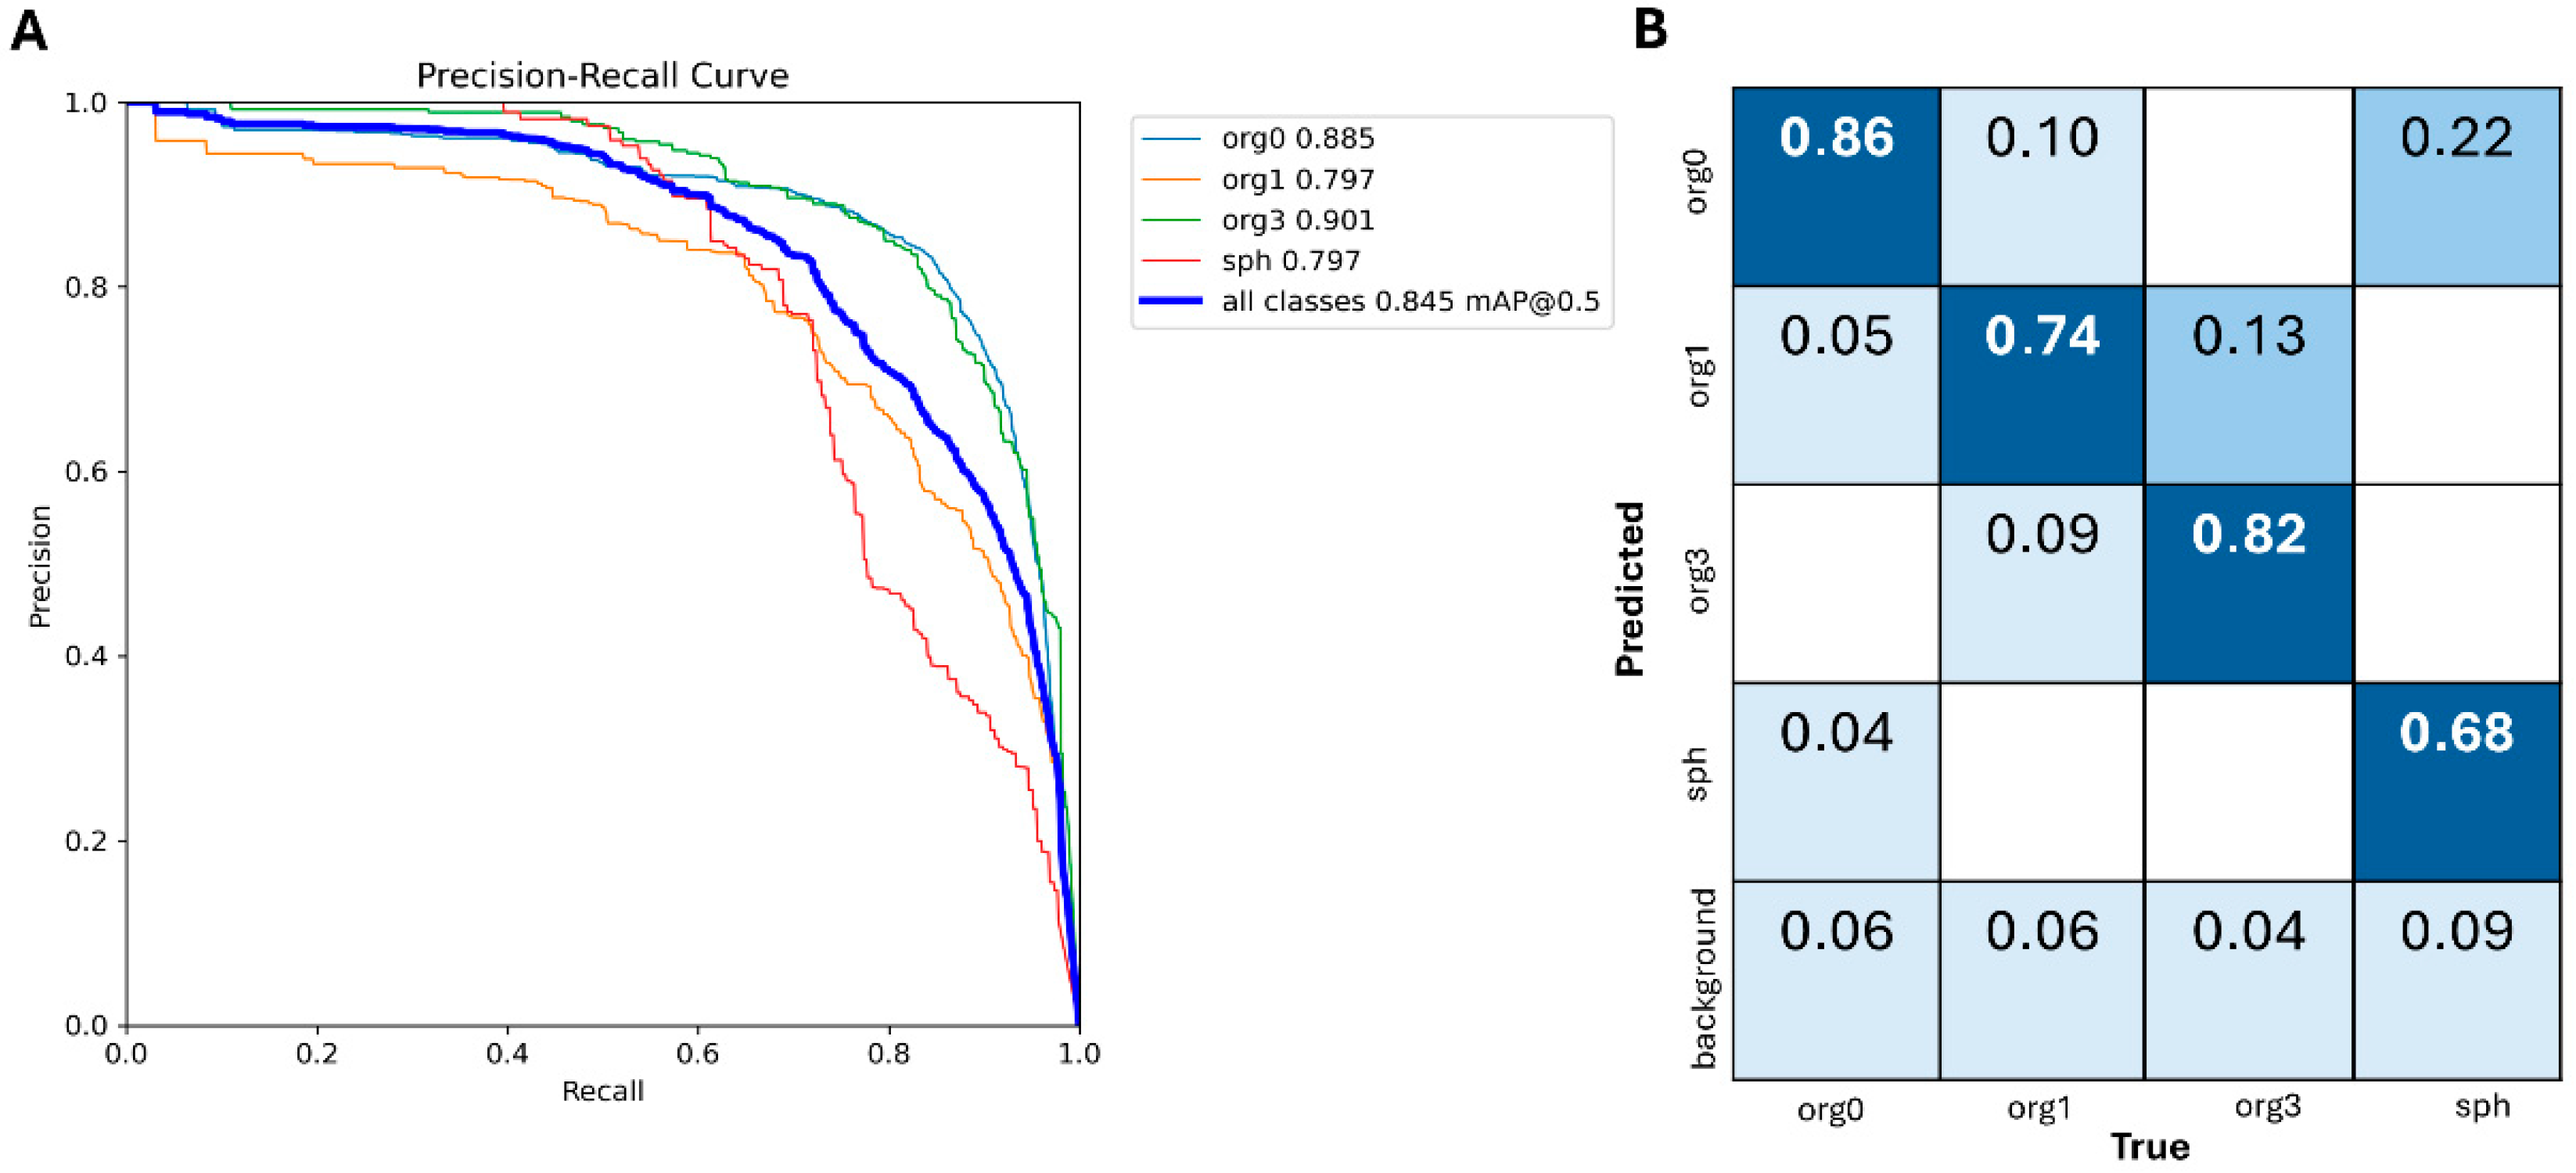
As shown in Figure 3A, the PR curves highlight class-specific performance, with Org0 achieving a PR score of 0.885, followed by Org3 with 0.901, while Org1 and Sph exhibited slightly lower values of 0.797. The overall performance is summarized by the thick blue PR curve, corresponding to the model’s mAP50 of 0.845.
The confusion matrix (Figure 3B) further illustrates the classification performance. High accuracy was observed for Org0 (86%) and Organoid3 (82%), while Organoid1 and Spheroids were correctly classified in 74% and 68% of cases, respectively. Misclassifications were more frequent between Org0 and Sph, likely due to their morphological similarity. Background detections contributed minimally to false positives, indicating reliable localization and classification.

3.2. Hybrid Pipeline Performance

The hybrid pipeline, combining YOLOv10 segmentation with feature extraction and ML classifiers, demonstrated robust and scalable performance across the four morphological classes. Features were extracted from the bounding boxes using either YOLOv10 or ResNet50, and subsequently classified using Logistic Regression, Random Forest, Naive Bayes, MLP, KNN, and XGBoost.
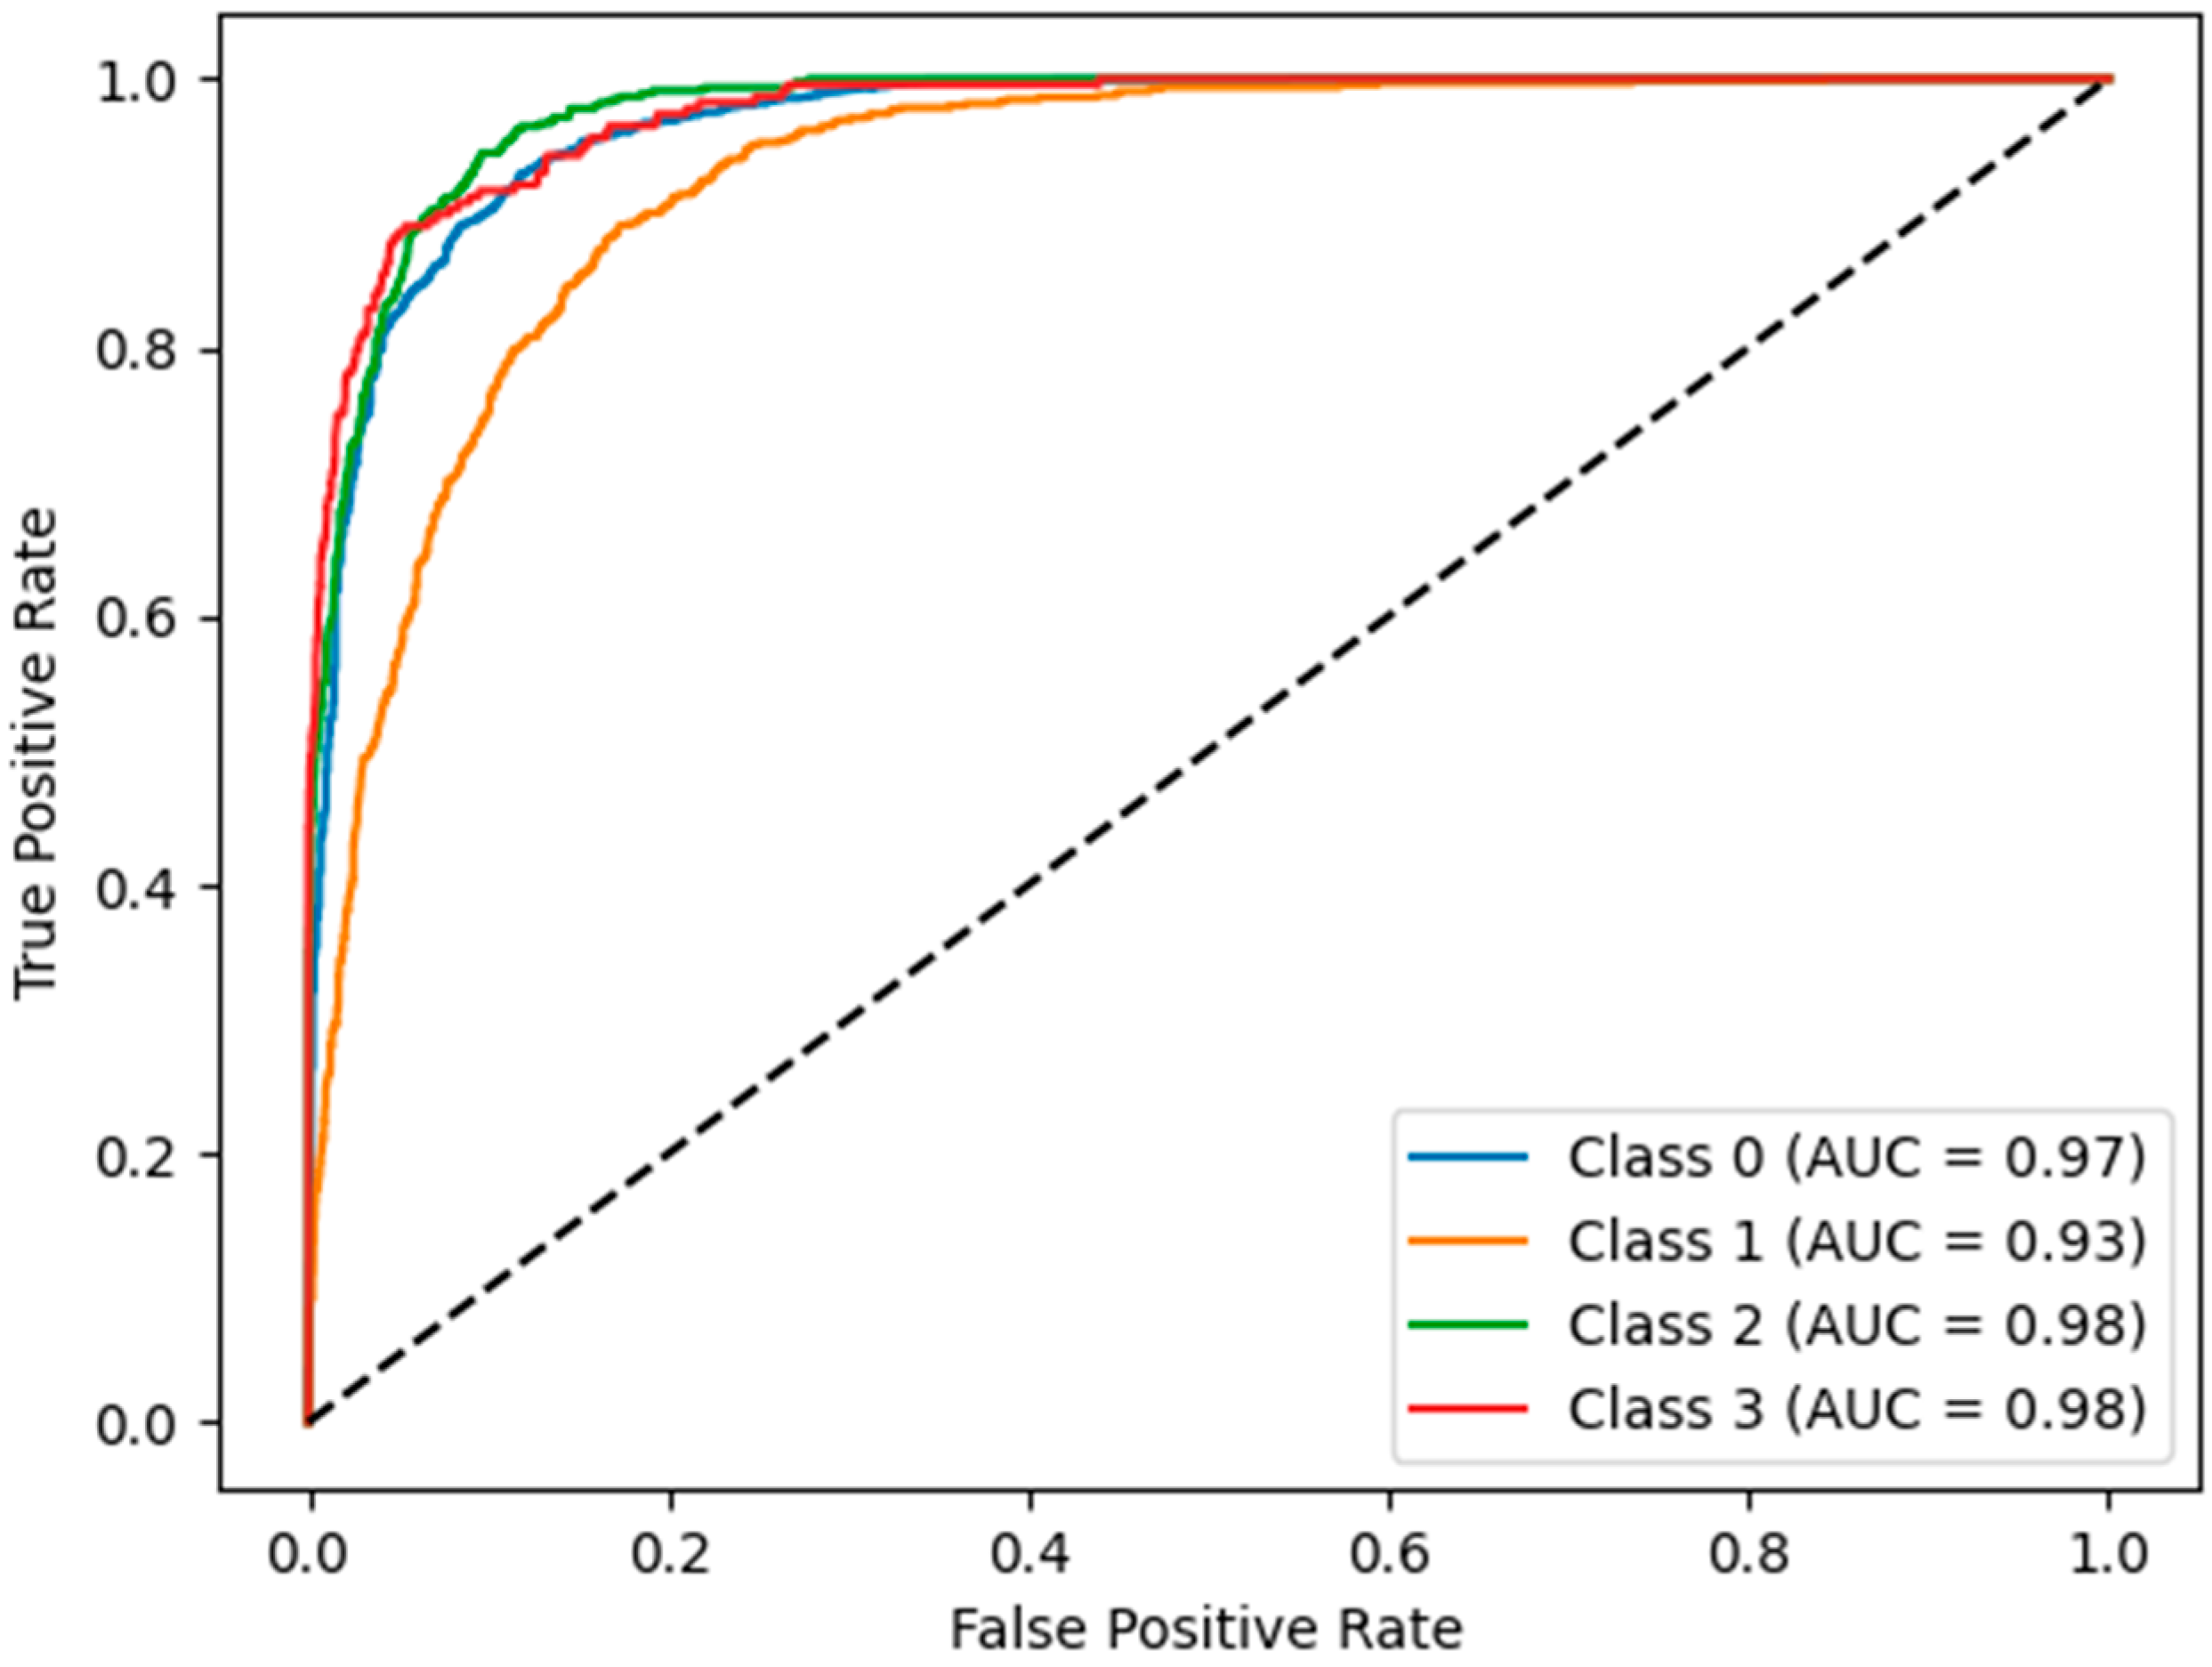
The results, summarized in Table 1, reveal that classifiers trained on features extracted with ResNet50 consistently outperformed those using YOLOv10 features. Among the individual classifiers, Logistic Regression achieved the highest AUC scores with ResNet50 features, reaching AUC scores of 0.97 for Org0, 0.93 for Organoid1, 0.98 for Organoid3 and 0.98 for Spheroid (Figure 4), showcasing its superior performance across the four morphological classes. In contrast, classifiers trained on YOLOv10 features showed lower but competitive performance, with XGBoost and MLP achieving the highest AUC scores of 0.94 for Organoid3.
To further evaluate the classification performance, additional metrics such as accuracy, precision, and F1-score were computed for each classifier (Table 2). Logistic Regression trained on ResNet50 features achieved the highest overall accuracy, precision, and F1-score (0.84) across the four morphological classes, confirming its superior performance as indicated by the AUC scores in Table 1. XGBoost followed closely, attaining an accuracy of 0.83 with balanced precision and F1-score values.
In contrast, classifiers trained on features extracted using YOLOv10 displayed lower, yet competitive performance. XGBoost and MLP achieved the best results within this group, with accuracy scores of 0.74 and F1-scores around 0.72–0.73. However, other classifiers, such as Naïve Bayes and KNN, struggled to generalize effectively on YOLOv10 features, reflecting lower accuracies (0.57–0.60) and F1-scores (0.54–0.60).
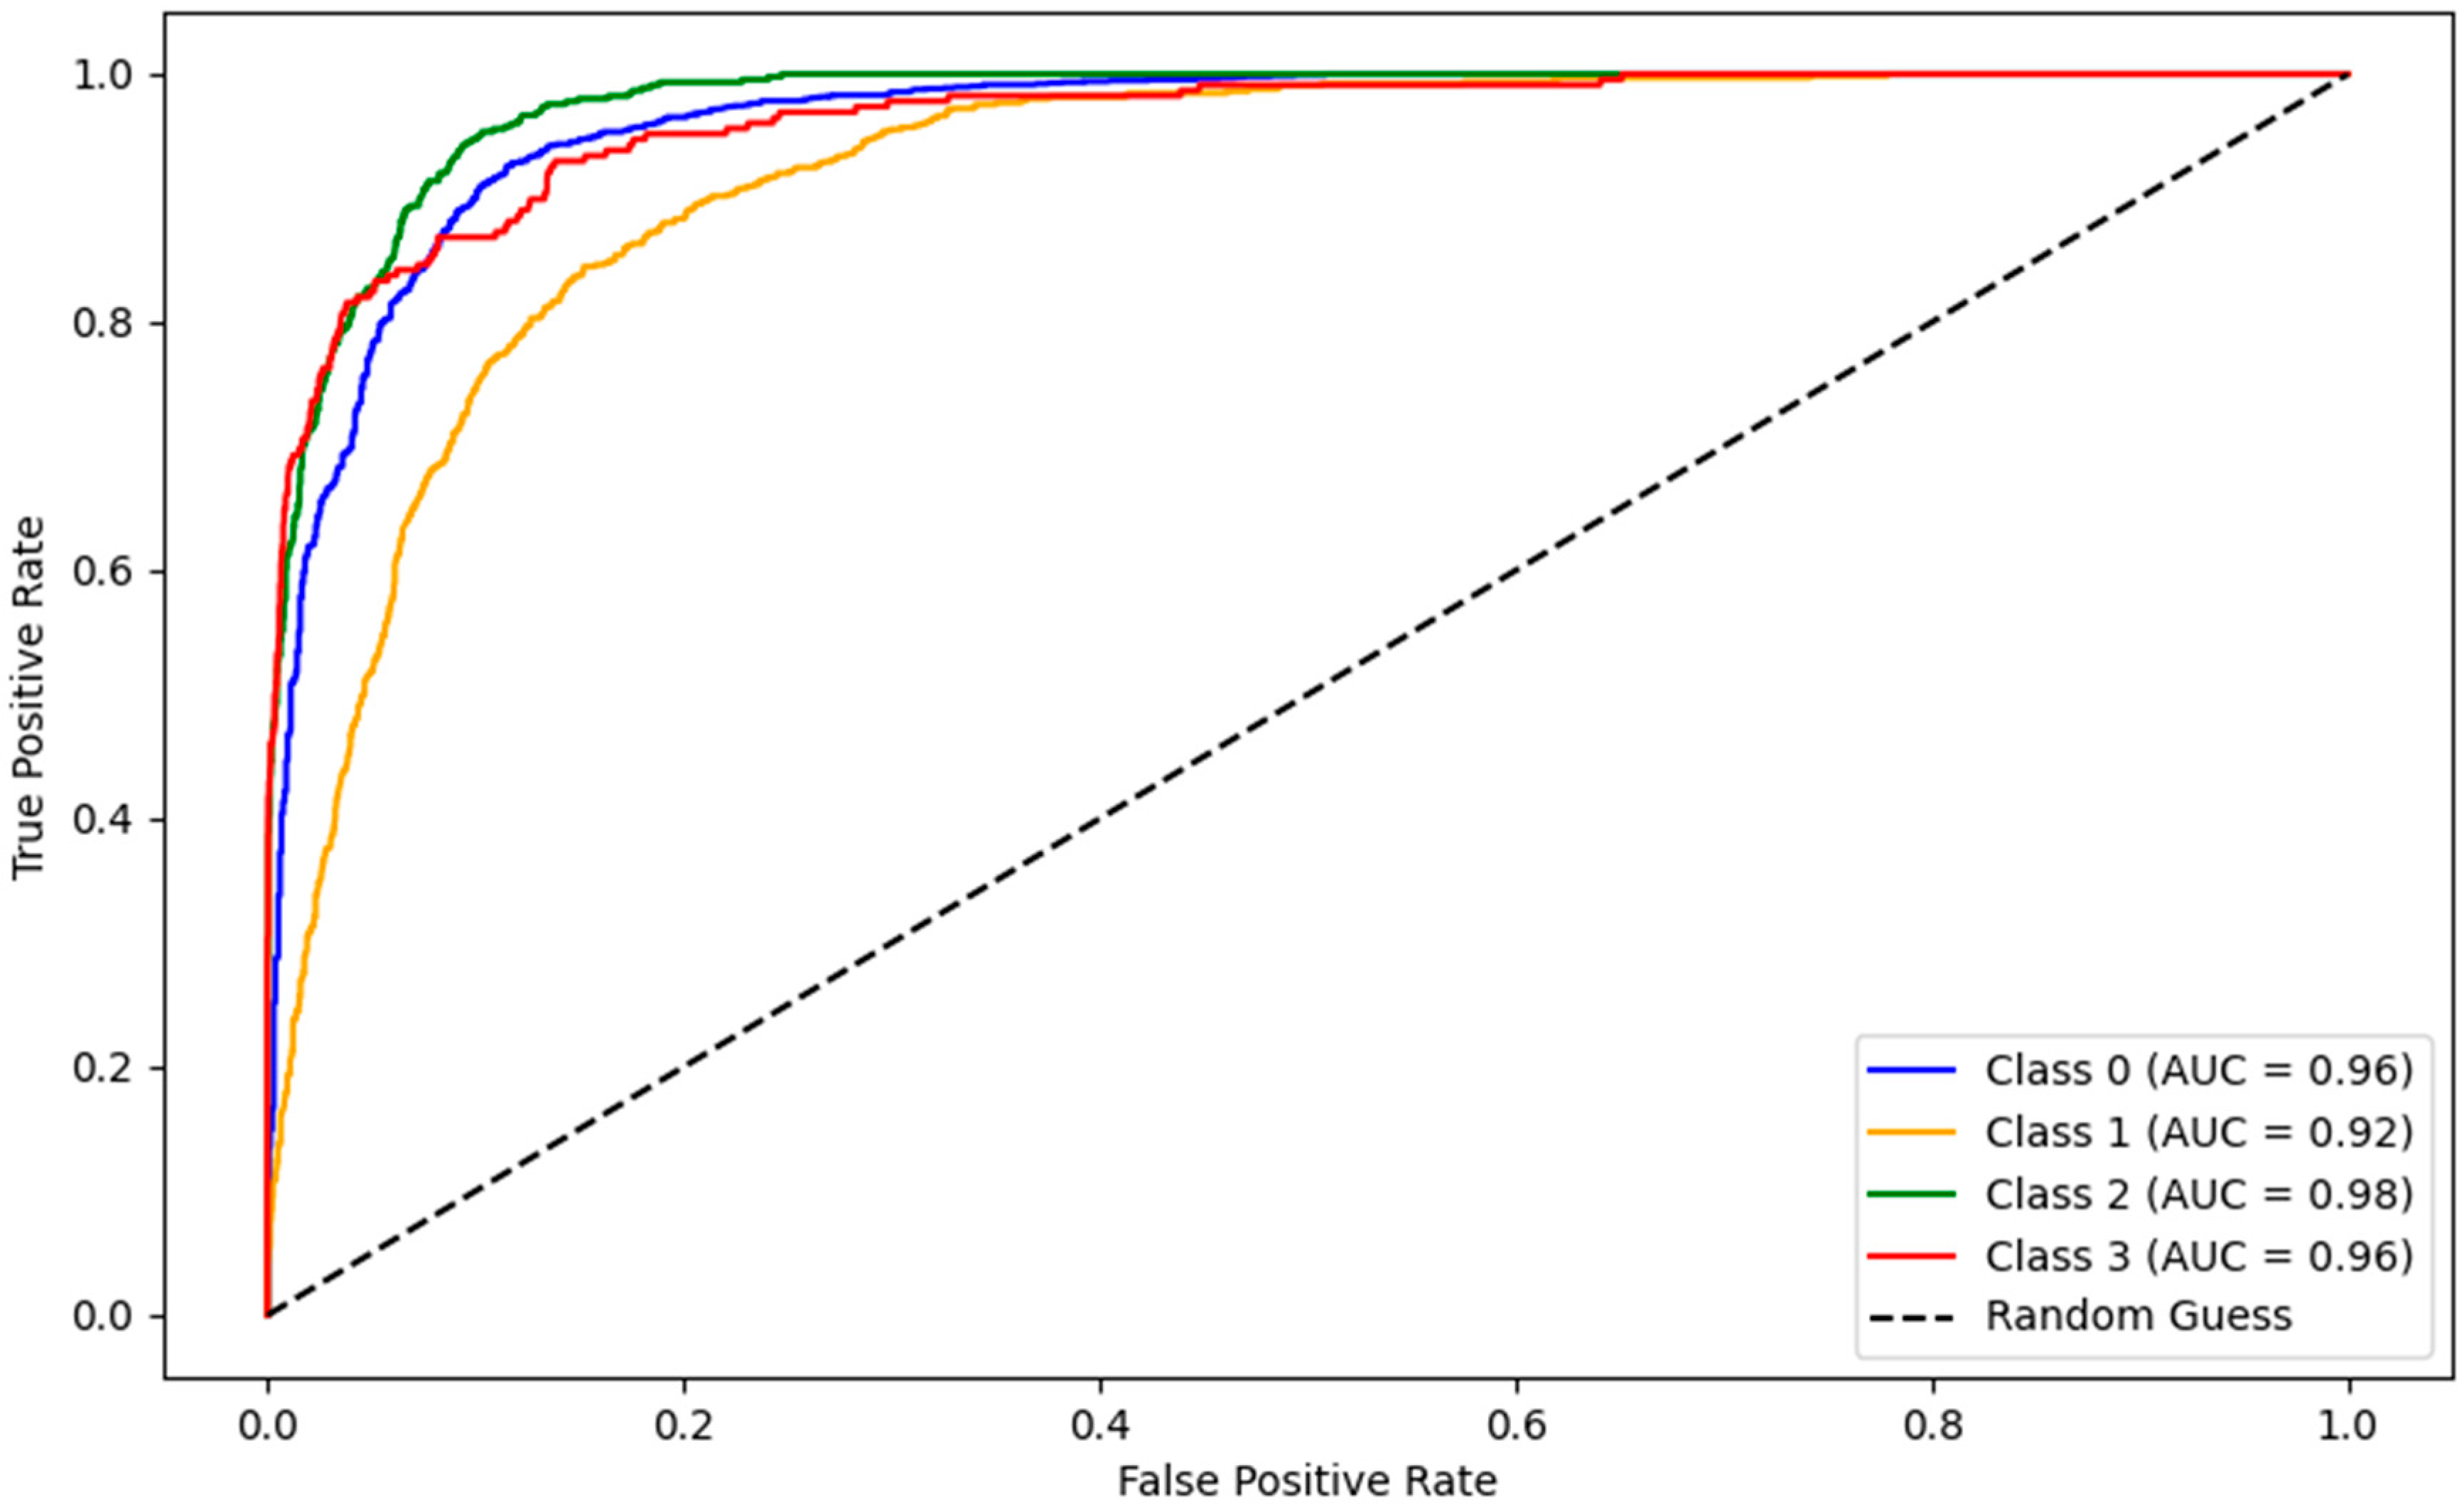
Given the superior performance of ResNet50 features, the ensemble method was structured exclusively around classifiers trained on these features, leveraging an AUC-weighted fusion of their predictions to further improve the overall performance. The ensemble achieved AUC scores of 0.96, 0.92, 0.98, and 0.96 for Org0, Org1, Org3, and Sph, respectively. Interestingly, the results of the ensemble method were similar to those achieved by Logistic Regression with ResNet50 features. Figure 5 shows the ROC curves for the ensemble method.

4. Discussion

This study explored the application of YOLOv10 as a standalone model and within a hybrid pipeline combining segmentation and feature extraction for the morphological analysis of intestinal organoids across four distinct classes: cystic non-budding organoids (Org0), early budding organoids (Org1), late budding organoids (Org3), and spheroids (Sph). YOLOv10 was trained to perform simultaneous segmentation and classification, while the hybrid pipeline leveraged features from YOLOv10 or ResNet50 for downstream ML classifiers.
YOLOv10 proved effective as a standalone model for simultaneous segmentation and classification of intestinal organoids. It efficiently detected and labeled the four morphological classes, supporting real-time applications where both speed and accuracy are required. Class-wise analysis showed stronger performance for phenotypes with clearer features (e.g., Org3 and Org0), while confusion mainly arose between morphologically similar classes (Org0 vs. Sph). These errors likely reflect subtle differences that are challenging for object-detection models to capture.
Despite these limitations, YOLOv10 remains a powerful tool for organoid segmentation and classification, enabling real-time processing and streamlined workflows. Its performance supports use in high-throughput studies, where rapid analysis is required for large datasets [25,30,32,33,34].
A significant comparison can be drawn with Tellu [25], a recent YOLOv5-based tool trained on the same microscopy dataset (YOLOv5-small). Tellu achieved real-time performance, its reported results highlight certain limitations, particularly when distinguishing morphologically similar classes.
Compared to Domènech-Moreno et al., who employed YOLOv5 for organoid classification, our study introduces several methodological innovations. First, we adopted YOLOv10, which provides architectural improvements for more accurate detection and segmentation. Second, we designed a hybrid pipeline that combines YOLO-based segmentation with ResNet50 feature extraction and multiple machine learning classifiers, significantly improving classification performance (AUC up to 0.98). Finally, we implemented an AUC-weighted ensemble strategy to enhance robustness across classes. These enhancements offer a scalable and reproducible framework for high-throughput organoid analysis, extending the capabilities of previous approaches.
The hybrid pipeline, combining YOLOv10 segmentation with feature extraction and ML classifiers, demonstrated enhanced performance in the morphological classification of intestinal organoids. It addressed limitations of the standalone YOLOv10, particularly when distinguishing between morphologically similar classes. Using features from the detected bounding boxes (ResNet50 or YOLOv10) provided a more nuanced representation of organoid morphology, which proved particularly effective for classification.
A key finding was the superior performance of ResNet50 features compared to YOLOv10 features as input for ML classifiers. ResNet50, as a deep residual network pre-trained on large-scale image datasets, was able to extract richer and more discriminative features, allowing classifiers such as Logistic Regression and XGBoost to achieve higher accuracy and AUC scores across all organoid classes. Our choice of ResNet50 was motivated by its strong performance in medical imaging and computational efficiency. YOLOv10 was adopted for detection because of its architectural improvements over previous YOLO versions. Future work will explore alternative CNNs such as EfficientNet and DenseNet for feature extraction in organoid analysis. This underscores the importance of feature quality for subtle morphological distinctions, particularly between closely related classes like Org0 and Sph.
The integration of YOLOv10 for segmentation with ResNet50-based feature extraction and ML classifiers aligns with recent advances in medical image analysis. This hybrid approach has been effectively applied in various studies to enhance classification performance. For instance, a study on breast cancer detection combined convolutional neural networks (CNNs) with a pruned ensemble extreme learning machine to improve detection, segmentation, feature extraction, and classification, resulting in enhanced diagnostic accuracy [35]. Similarly, research on brain tumor detection utilized a hybrid feature extraction technique alongside Support Vector Machine (SVM) classifiers, achieving improved accuracy in distinguishing between healthy and abnormal MRI scans [36]. These examples underscore the efficacy of DL-based feature extraction paired with traditional ML classifiers in medical imaging.
The AUC-weighted ensemble, which fused predictions from multiple ResNet50-based classifiers, added robustness and improved consistency across all four classes. While individual classifiers achieved strong performance, the ensemble approach effectively mitigated variability and leveraged the strengths of each model to produce optimized predictions. In medical image analysis, ensemble approaches have been employed to improve diagnostic accuracy. For instance, a study on lung cancer detection using CT scan images demonstrated that ensemble methods outperformed individual models, leading to improved diagnostic accuracy [37].
However, ensemble methods do not always outperform single models. In our study, for example, the ensemble method did not surpass the performance of Logistic Regression, which emerged as the best-performing classifier when trained on ResNet50 features. A comparative study between SVM and Logistic Regression highlighted scenarios where Logistic Regression performed favorably [38]. In another study [39], Logistic Regression and Random Forest across 243 datasets found that Random Forest outperformed Logistic Regression in 69% of the cases. However, in the remaining 31% of datasets, Logistic Regression performed comparably or better, indicating that simpler models can be effective depending on the dataset characteristics.
The hybrid pipeline offers a versatile and scalable framework for organoid analysis, combining the speed and accuracy of YOLOv10 segmentation with the power of ML classifiers for refined morphological classification. This approach improves accuracy and better resolves closely related classes, yielding more precise and reliable outcomes in organoid morphology.
Recent studies have applied DL to organoid image analysis with notable success in both segmentation and classification. For instance, Mask R-CNN–based models like OrgaSegment, precisely segment patient-derived intestinal organoids [13], while U-Net architectures such as OrgaExtractor [12] achieve high-accuracy boundary segmentation across organoids of various sizes.
On the classification side, one strategy is to leverage one-stage object detectors: Deep-Orga [40] built on YOLO to increase detection speed and accuracy, and a recent lightweight YOLOv8-based detector (Deliod) achieved high precision (mAP ≈ 87%) in intestinal organoid recognition with a minimal model size [33]. Alternatively, several groups have explored deep CNN classifiers (ResNet, DenseNet, etc.) for organoid phenotyping: e.g., Cicceri et al. evaluated multiple CNN and vision transformer models for intestinal organoid morphology classification, reporting more than 85% accuracy [41]. Deep models have likewise been used to identify phenotypic heterogeneity in tumor organoids, for example, in distinguished “cystic” vs. “solid” subtypes in colorectal cancer organoids using a CNN-based approach [42].
Beyond deep networks, organoid image analysis can be achieved with classical, low-compute pipelines that combine global or adaptive thresholding (e.g., Otsu) and morphological operations with object splitting via watershed or active contours [43,44,45]. These segmentations can be summarized into hand-crafted descriptors (area, circularity, solidity; texture features such as GLCM, LBP, HOG) and then classified with traditional ML models like SVM or Random Forest [46,47,48]. In summary, while non-DL pipelines are computationally lighter (CPU-friendly, easy to deploy) and appropriate for standardized readout, DL detectors/segmenters generally provide higher robustness in heterogeneous, multi-site scenarios; our YOLOv10 setup is intended to retain much of this robustness at modest inference cost.
Despite the promising results, this study has some limitations. The dataset used for training and validation, while substantial, was limited to brightfield microscopy images of intestinal organoids. This may restrict the generalizability of the model to other organoid types or imaging modalities, such as fluorescence microscopy or multi-channel images. Expanding the dataset to include diverse imaging techniques and additional organoid types would help validate the robustness and versatility of the proposed pipeline.
In addition, the segmentation accuracy of YOLOv10, though high, is not perfect, particularly in dense cultures where organoids overlap. Bounding-box errors can propagate to feature extraction and downstream classification. Future work could incorporate advanced segmentation strategies, such as instance segmentation models to address this limitation.
Another limitation is class imbalance: Org0 comprises over half of the annotations, whereas Sph is underrepresented. Although some classifiers used internal class-weighting that partially mitigated this issue, residual effects on performance cannot be ruled out. Despite these limitations, our approach is particularly well-suited for high-throughput studies, where the ability to automate segmentation and classification while maintaining high precision is essential. From a biological standpoint, improving the automated classification of intestinal organoid morphologies has concrete implications for biomedical research. Accurate and reproducible identification of developmental stages, such as cystic, budding, or spheroid organoids, can serve as a quantitative readout of growth dynamics, differentiation status, and treatment response. In drug screening or disease modeling studies, automated image-based classification could substantially accelerate data processing and reduce observer bias, allowing consistent and objective evaluation across large organoid libraries. Therefore, the performance improvements achieved by YOLOv10 and the hybrid pipeline are not only of technical value but also enhance the reliability and scalability of organoid-based experimental and preclinical research. Future adaptations could explore additional DL architectures for feature extraction or integrate attention mechanisms to further enhance the pipeline’s ability to capture subtle morphological variations.

5. Conclusions

This study demonstrates the effectiveness of YOLOv10 as a standalone model for the simultaneous segmentation and classification of intestinal organoids, as well as the robustness of a hybrid pipeline that integrates DL-based feature extraction with ML classifiers. YOLOv10 achieved strong performance in detecting and classifying four distinct morphological classes of intestinal organoids, showcasing its suitability for real-time and high-throughput applications.
Beyond detection accuracy, the proposed framework provides a scalable and reproducible strategy for automated organoid image analysis, with potential applications in drug screening, disease modeling, and stem-cell research. Although large-scale performance depends on hardware and data-handling optimization, inference was achieved within milliseconds per image, supporting the feasibility of high-throughput use.
In conclusion, the combination of YOLOv10 segmentation and ML-based classification offers a robust, automated, and scalable solution for organoid morphological analysis, paving the way for more precise, reproducible, and high-throughput studies in the field of organoid biology.

Author Contributions

Conceptualization, D.C. and L.C.; Methodology, L.C.; Software, L.C.; Validation, G.D.N., G.R. and D.C.; Formal analysis, L.C.; Investigation, L.C.; Resources, D.C.; Data curation, L.C.; Writing—original draft, L.C.; Writing—review & editing, G.D.N., G.R. and D.C.; Visualization, G.D.N., G.R. and D.C.; Supervision, G.D.N., G.R. and D.C. All authors have read and agreed to the published version of the manuscript.

Funding

The research leading to these results has received funding from the European Union—NextGenerationEU through the Italian Ministry of University and Research under PNRR—M4C2-I1.3 Project PE_00000019 “HEAL ITALIA”. The views and opinions expressed are those of the authors only and do not necessarily reflect those of the European Union or the European Commission. Neither the European Union nor the European Commission can be held responsible for them.

Data Availability Statement

The data that support the findings of this study are available from the corresponding author upon reasonable request.

Conflicts of Interest

The authors declare no conflicts of interest.

References

  1. Sato, T.; Vries, R.G.; Snippert, H.J.; van de Wetering, M.; Barker, N.; Stange, D.E.; van Es, J.H.; Abo, A.; Kujala, P.; Peters, P.J.; et al. Single Lgr5 Stem Cells Build Crypt-Villus Structures in Vitro Without a Mesenchymal Niche. Nature 2009, 459, 262–265. [Google Scholar] [CrossRef]
  2. Sato, T.; Stange, D.E.; Ferrante, M.; Vries, R.G.J.; Van Es, J.H.; Van den Brink, S.; Van Houdt, W.J.; Pronk, A.; Van Gorp, J.; Siersema, P.D.; et al. Long-Term Expansion of Epithelial Organoids from Human Colon, Adenoma, Adenocarcinoma, and Barrett’s Epithelium. Gastroenterology 2011, 141, 1762–1772. [Google Scholar] [CrossRef]
  3. Fordham, R.P.; Yui, S.; Hannan, N.R.F.; Soendergaard, C.; Madgwick, A.; Schweiger, P.J.; Nielsen, O.H.; Vallier, L.; Pedersen, R.A.; Nakamura, T.; et al. Transplantation of Expanded Fetal Intestinal Progenitors Contributes to Colon Regeneration after Injury. Cell Stem Cell 2013, 13, 734–744. [Google Scholar] [CrossRef]
  4. Farin, H.F.; Van Es, J.H.; Clevers, H. Redundant Sources of Wnt Regulate Intestinal Stem Cells and Promote Formation of Paneth Cells. Gastroenterology 2012, 143, 1518–1529.e7. [Google Scholar] [CrossRef]
  5. Almeqdadi, M.; Mana, M.D.; Roper, J.; Yilmaz, Ö.H. Gut Organoids: Mini-Tissues in Culture to Study Intestinal Physiology and Disease. Am. J. Physiol.-Cell Physiol. 2019, 317, C405–C419. [Google Scholar] [CrossRef] [PubMed]
  6. Guiu, J.; Hannezo, E.; Yui, S.; Demharter, S.; Ulyanchenko, S.; Maimets, M.; Jørgensen, A.; Perlman, S.; Lundvall, L.; Mamsen, L.S.; et al. Tracing the Origin of Adult Intestinal Stem Cells. Nature 2019, 570, 107–111. [Google Scholar] [CrossRef] [PubMed]
  7. Lupo, R.; Zaminga, M.; Carriero, M.C.; Santoro, P.; Artioli, G.; Calabrò, A.; Ilari, F.; Benedetto, A.; Caslini, M.; Clerici, M.; et al. Eating Disorders and Related Stigma: Analysis among a Population of Italian Nursing Students. Acta Biomed. 2020, 91, e2020011. [Google Scholar] [CrossRef]
  8. Ko, K.-P.; Zhang, S.; Huang, Y.; Kim, B.; Zou, G.; Jun, S.; Zhang, J.; Martin, C.; Dunbar, K.J.; Efe, G.; et al. Tumor Niche Network-Defined Subtypes Predict Immunotherapy Response of Esophageal Squamous Cell Cancer 2023. iScience 2023, 27, 109795. [Google Scholar] [CrossRef]
  9. Du, X.; Chen, Z.; Li, Q.; Yang, S.; Jiang, L.; Yang, Y.; Li, Y.; Gu, Z. Organoids Revealed: Morphological Analysis of the Profound next Generation in-Vitro Model with Artificial Intelligence. Bio-Des. Manuf. 2023, 6, 319–339. [Google Scholar] [CrossRef] [PubMed]
  10. Brémond Martin, C.; Simon Chane, C.; Clouchoux, C.; Histace, A. Recent Trends and Perspectives in Cerebral Organoids Imaging and Analysis. Front. Neurosci. 2021, 15, 629067. [Google Scholar] [CrossRef]
  11. Matthews, J.M.; Schuster, B.; Kashaf, S.S.; Liu, P.; Ben-Yishay, R.; Ishay-Ronen, D.; Izumchenko, E.; Shen, L.; Weber, C.R.; Bielski, M.; et al. OrganoID: A Versatile Deep Learning Platform for Tracking and Analysis of Single-Organoid Dynamics. PLoS Comput. Biol. 2022, 18, e1010584. [Google Scholar] [CrossRef]
  12. Park, T.; Kim, T.K.; Han, Y.D.; Kim, K.-A.; Kim, H.; Kim, H.S. Development of a Deep Learning Based Image Processing Tool for Enhanced Organoid Analysis. Sci. Rep. 2023, 13, 19841. [Google Scholar] [CrossRef]
  13. Lefferts, J.W.; Kroes, S.; Smith, M.B.; Niemöller, P.J.; Nieuwenhuijze, N.D.A.; Sonneveld van Kooten, H.N.; van der Ent, C.K.; Beekman, J.M.; van Beuningen, S.F.B. OrgaSegment: Deep-Learning Based Organoid Segmentation to Quantify CFTR Dependent Fluid Secretion. Commun. Biol. 2024, 7, 319. [Google Scholar] [CrossRef] [PubMed]
  14. Kok, R.N.U.; Hebert, L.; Huelsz-Prince, G.; Goos, Y.J.; Zheng, X.; Bozek, K.; Stephens, G.J.; Tans, S.J.; van Zon, J.S. OrganoidTracker: Efficient Cell Tracking Using Machine Learning and Manual Error Correction. PLoS ONE 2020, 15, e0240802. [Google Scholar] [CrossRef]
  15. Montes-Olivas, S.; Legge, D.; Lund, A.; Fletcher, A.G.; Williams, A.C.; Marucci, L.; Homer, M. In-Silico and in-Vitro Morphometric Analysis of Intestinal Organoids. PLoS Comput. Biol. 2023, 19, e1011386. [Google Scholar] [CrossRef] [PubMed]
  16. Powell, R.T.; Moussalli, M.J.; Guo, L.; Bae, G.; Singh, P.; Stephan, C.; Shureiqi, I.; Davies, P.J. DeepOrganoid: A Brightfield Cell Viability Model for Screening Matrix-Embedded Organoids. SLAS Discov. 2022, 27, 175–184. [Google Scholar] [CrossRef]
  17. Conte, L.; Lupo, R.; Lezzi, A.; Sciolti, S.; Rubbi, I.; Carvello, M.; Calabrò, A.; Botti, S.; Fanizzi, A.; Massafra, R.; et al. Breast Cancer Prevention Practices and Knowledge in Italian and Chinese Women in Italy: Clinical Checkups, Free NHS Screening Adherence, and Breast Self-Examination (BSE). J. Cancer Educ. 2024, 40, 30–43. [Google Scholar] [CrossRef] [PubMed]
  18. Lupo, R.; Zacchino, S.; Caldararo, C.; Calabrò, A.; Carriero, M.C.; Santoro, P.; Carvello, M.; Conte, L. The Use of Electronical Devices and Relative Levels of Nomophobia within a Group of Italian Nurses: An Observational Study. Epidemiol. Biostat. Public Health 2020, 17, e13272. [Google Scholar] [CrossRef]
  19. Vitale, E.; Lupo, R.; Artioli, G.; Mea, R.; Lezzi, P.; Conte, L.; De Nunzio, G. How Shift Work Influences Anxiety, Depression, Stress and Insomnia Conditions in Italian Nurses: An Exploratory Study. Acta Biomed. 2023, 94, e2023102. [Google Scholar] [CrossRef]
  20. Conte, L.; Rizzo, E.; Civino, E.; Tarantino, P.; De Nunzio, G.; De Matteis, E. Enhancing Breast Cancer Risk Prediction with Machine Learning: Integrating BMI, Smoking Habits, Hormonal Dynamics, and BRCA Gene Mutations—A Game-Changer Compared to Traditional Statistical Models? Appl. Sci. 2024, 14, 8474. [Google Scholar] [CrossRef]
  21. Caldo, D.; Bologna, S.; Conte, L.; Amin, M.S.; Anselma, L.; Basile, V.; Hossain, M.M.; Mazzei, A.; Heritier, P.; Ferracini, R.; et al. Machine Learning Algorithms Distinguish Discrete Digital Emotional Fingerprints for Web Pages Related to Back Pain. Sci. Rep. 2023, 13, 4654. [Google Scholar] [CrossRef]
  22. Vitale, E.; Lupo, R.; Calabrò, A.; Cornacchia, M.; Conte, L.; Marchisio, D.; Caldararo, C.; Carvello, M.; Carriero, M.C. Mapping Potential Risk Factors in Developing Burnout Syndrome Between Physicians and Registered Nurses Suffering from an Aggression in Italian Emergency Departments. J. Psychopathol. 2021, 27, 148–155. [Google Scholar] [CrossRef]
  23. Kassis, T.; Hernandez-Gordillo, V.; Langer, R.; Griffith, L.G. OrgaQuant: Human Intestinal Organoid Localization and Quantification Using Deep Convolutional Neural Networks. Sci. Rep. 2019, 9, 12479. [Google Scholar] [CrossRef]
  24. Ostrop, J.; Zwiggelaar, R.T.; Terndrup Pedersen, M.; Gerbe, F.; Bösl, K.; Lindholm, H.T.; Díez-Sánchez, A.; Parmar, N.; Radetzki, S.; von Kries, J.P.; et al. A Semi-Automated Organoid Screening Method Demonstrates Epigenetic Control of Intestinal Epithelial Differentiation. Front. Cell Dev. Biol. 2021, 8, 618552. [Google Scholar] [CrossRef]
  25. Domènech-Moreno, E.; Brandt, A.; Lemmetyinen, T.T.; Wartiovaara, L.; Mäkelä, T.P.; Ollila, S. Tell—An Object-Detector Algorithm for Automatic Classification of Intestinal Organoids. Dis. Model. Mech. 2023, 16, dmm049756. [Google Scholar] [CrossRef] [PubMed]
  26. Deben, C.; De La Hoz, E.C.; Compte, M.L.; Van Schil, P.; Hendriks, J.M.H.; Lauwers, P.; Yogeswaran, S.K.; Lardon, F.; Pauwels, P.; Van Laere, S.; et al. OrBITS: Label-Free and Time-Lapse Monitoring of Patient Derived Organoids for Advanced Drug Screening. Cell. Oncol. 2023, 46, 299–314. [Google Scholar] [CrossRef]
  27. Xiang, T.; Wang, J.; Li, H. Current Applications of Intestinal Organoids: A Review. Stem Cell Res. Ther. 2024, 15, 155. [Google Scholar] [CrossRef] [PubMed]
  28. Laudadio, I.; Carissimi, C.; Scafa, N.; Bastianelli, A.; Fulci, V.; Renzini, A.; Russo, G.; Oliva, S.; Vitali, R.; Palone, F.; et al. Characterization of Patient-Derived Intestinal Organoids for Modelling Fibrosis in Inflammatory Bowel Disease. Inflamm. Res. 2024, 73, 1359–1370. [Google Scholar] [CrossRef] [PubMed]
  29. Abdul, L.; Xu, J.; Sotra, A.; Chaudary, A.; Gao, J.; Rajasekar, S.; Anvari, N.; Mahyar, H.; Zhang, B. D-CryptO: Deep Learning-Based Analysis of Colon Organoid Morphology from Brightfield Images. Lab Chip 2022, 22, 4118–4128. [Google Scholar] [CrossRef] [PubMed]
  30. Redmon, J.; Divvala, S.; Girshick, R.; Farhadi, A. You Only Look Once: Unified, Real-Time Object Detection. In Proceedings of the IEEE Conference on Computer Vision and Pattern Recognition (CVPR), Las Vegas, NV, USA, 27–30 June 2016; pp. 779–788. [Google Scholar]
  31. He, K.; Zhang, X.; Ren, S.; Sun, J. Deep Residual Learning for Image Recognition. In Proceedings of the 2016 IEEE Conference on Computer Vision and Pattern Recognition (CVPR), Las Vegas, NV, USA, 27–30 June 2016; pp. 770–778. [Google Scholar]
  32. Wang, A.; Chen, H.; Liu, L.; Chen, K.; Lin, Z.; Han, J.; Ding, G. YOLOv10: Real-Time End-to-End Object Detection. In Proceedings of the 2024 Conference on Computer Vision and Pattern Recognition, Seattle, WA, USA, 17–21 June 2024. [Google Scholar]
  33. Sun, Y.; Zhang, H.; Huang, F.; Gao, Q.; Li, P.; Li, D.; Luo, G. Deliod a Lightweight Detection Model for Intestinal Organoids Based on Deep Learning. Sci. Rep. 2025, 15, 5040. [Google Scholar] [CrossRef]
  34. Bukas, C.; Subramanian, H.; See, F.; Steinchen, C.; Ezhov, I.; Boosarpu, G.; Asgharpour, S.; Burgstaller, G.; Lehmann, M.; Kofler, F.; et al. MultiOrg: A Multi-Rater Organoid-Detection Dataset. In Proceedings of the NeurIPS 2025, San Diego, CA, USA, 2–7 December 2024. [Google Scholar]
  35. Sureshkumar, V.; Prasad, R.S.N.; Balasubramaniam, S.; Jagannathan, D.; Daniel, J.; Dhanasekaran, S. Breast Cancer Detection and Analytics Using Hybrid CNN and Extreme Learning Machine. J. Pers. Med. 2024, 14, 792. [Google Scholar] [CrossRef] [PubMed]
  36. Singh, M.; Shrimali, V.; Kumar, M. Detection and Classification of Brain Tumor Using Hybrid Feature Extraction Technique. Multimed. Tools Appl. 2023, 82, 21483–21507. [Google Scholar] [CrossRef]
  37. Iqball, T.; Wani, M.A. Weighted Ensemble Model for Image Classification. Int. J. Inf. Technol. 2023, 15, 557–564. [Google Scholar] [CrossRef]
  38. Musa, A.B. Comparative Study on Classification Performance Between Support Vector Machine and Logistic Regression. Int. J. Mach. Learn. Cybern. 2013, 4, 13–24. [Google Scholar] [CrossRef]
  39. Couronné, R.; Probst, P.; Boulesteix, A.-L. Random Forest Versus Logistic Regression: A Large-Scale Benchmark Experiment. BMC Bioinform. 2018, 19, 270. [Google Scholar] [CrossRef]
  40. Leng, B.; Jiang, H.; Wang, B.; Wang, J.; Luo, G. Deep-Orga: An Improved Deep Learning-Based Lightweight Model for Intestinal Organoid Detection. Comput. Biol. Med. 2024, 169, 107847. [Google Scholar] [CrossRef]
  41. Cicceri, G.; Di Bella, S.; Di Franco, S.; Stassi, G.; Todaro, M.; Vitabile, S. Deep Learning Approaches for Morphological Classification of Intestinal Organoids. IEEE Access 2025, 13, 62267–62287. [Google Scholar] [CrossRef]
  42. Huang, K.; Li, M.; Li, Q.; Chen, Z.; Zhang, Y.; Gu, Z. Image-Based Profiling and Deep Learning Reveal Morphological Heterogeneity of Colorectal Cancer Organoids. Comput. Biol. Med. 2024, 173, 108322. [Google Scholar] [CrossRef]
  43. Otsu, N. A Threshold Selection Method from Gray-Level Histograms. IEEE Trans. Syst. Man. Cybern. 1979, 9, 62–66. [Google Scholar] [CrossRef]
  44. Vincent, L.; Soille, P. Watersheds in Digital Spaces: An Efficient Algorithm Based on Immersion Simulations. IEEE Trans. Pattern Anal. Mach. Intell. 1991, 13, 583–598. [Google Scholar] [CrossRef]
  45. Chan, T.F.; Vese, L.A. Active Contours Without Edges. IEEE Trans. Image Process. 2001, 10, 266–277. [Google Scholar] [CrossRef] [PubMed]
  46. Haralick, R.M.; Shanmugam, K.; Dinstein, I. Textural Features for Image Classification. IEEE Trans. Syst. Man. Cybern. 1973, SMC-3, 610–621. [Google Scholar] [CrossRef]
  47. Ojala, T.; Pietikainen, M.; Maenpaa, T. Multiresolution Gray-Scale and Rotation Invariant Texture Classification with Local Binary Patterns. IEEE Trans. Pattern Anal. Mach. Intell. 2002, 24, 971–987. [Google Scholar] [CrossRef]
  48. Dalal, N.; Triggs, B. Histograms of Oriented Gradients for Human Detection. In Proceedings of the 2005 IEEE Computer Society Conference on Computer Vision and Pattern Recognition (CVPR’05), San Diego, CA, USA, 20–25 June 2005; IEEE: New York, NY, USA, 2005; Volume 1, pp. 886–893. [Google Scholar]
Figure 1. Workflow of the YOLO standalone model for segmentation and classification. The validation set images are input into the trained YOLO version 10 model (YOLOv10), which performs the segmentation task by identifying and localizing the bounding boxes. The detected regions are then classified into the corresponding morphological classes, resulting in multi-class predictions.
Applsci 15 11311 g001
Figure 2. Workflow of the hybrid pipeline combining YOLOv10 segmentation and feature extraction with ML classifiers. The YOLOv10 model trained as standalone model segments the input images by detecting bounding boxes corresponding to the regions of interest (ROI). After pre-processing, bounding boxes are cropped and features are extracted using YOLO or ResNet50. These extracted features are then fed into ML classifiers, including Logistic Regression, Random Forest, Naive Bayes, Multi-Layer Perceptrons (MLP), K-Nearest Neighbors (KNN), and XGBoost, to predict the morphological class of each organoid.
Applsci 15 11311 g002
Figure 3. Performance evaluation of YOLOv10-medium on the validation set. The left panel (A) shows the Precision-Recall (PR) curves for the four morphological classes: cystic non-budding organoids (org0), early budding organoids (org1), late budding organoids (org3), and spheroids (sph). The AP highlights class-specific performance, with org3 achieving the highest PR score (0.901), followed by org0 (0.885), while org1 and sph achieved a PR score of 0.797. The thick blue curve represents the overall PR performance with a mean Average Precision at 50% overlap (mAP50) of 0.845. The right panel (B) displays the normalized confusion matrix, where the diagonal values represent the correct predictions for each class. YOLOv10-medium achieved high classification accuracy for org0 (86%) and org3 (82%). Misclassifications occurred primarily between org1 and org3, reflecting their morphological similarity, while org1 and spheroids (sph) were correctly identified in 74% and 68% of cases, respectively.
Applsci 15 11311 g003
Figure 4. Receiver Operating Characteristic (ROC) curves Logistic Regression on the validation set. The model achieved AUC values of 0.97 for Org0 (Class 0, blue), 0.93 for Org1 (Class 1, orange), 0.98 for Org3 (Class 2, green), and 0.98 for Sph (Class 3, red).
Applsci 15 11311 g004
Figure 5. Receiver Operating Characteristic (ROC) curves for the AUC-weighted ensemble method applied to the four organoid classes. The ensemble achieved AUC values of 0.96 for Org0 (Class 0, blue), 0.92 for Org1 (Class 1, orange), 0.98 for Org3 (Class 2, green), and 0.96 for Sph (Class 3, red).
Applsci 15 11311 g005
Table 1. Performance comparison of ML classifiers in the hybrid pipeline. The table presents the AUC scores for each classifier across the four morphological classes (Org0, Org1, Org3, and Sph) using features extracted from YOLOv10 and ResNet50. The final column shows the AUC scores for the ensemble method based on ResNet50 features.
ClassifierFeature ExtractionEnseble ResNet50
YOLOResNet50
AUCAUCAUC
Org0Org1Org3SphOrg0Org1Org3SphOrg0Org1Org3Sph
LR0.890.830.910.800.970.930.980.980.960.920.980.96
Random Forest0.890.820.920.710.960.900.970.94
Naïve Bayes0.850.770.890.740.910.840.960.87
KNN0.800.750.690.710.920.830.930.87
XGBoost0.920.870.940.820.960.920.980.97
MLP0.920.870.940.840.960.910.970.97
LR = Logistic Regresssion; KNN = K-Nearest Neighbors; XGBoost = eXtreme Gradient Boosting; MLP = Multi-Layer Perceptron.
Table 2. Comparative performance of Machine Learning classifiers trained on features extracted using YOLOv10 and ResNet50. The table presents accuracy, precision, recall, and F1-score for each classifier. The final column shows the metrics scores for the ensemble method based on ResNet50 features.
ClassifierFeature ExtractionEnsemble ResNet50
YOLOResNet50
AccPRF1AccPRF1AccPRF1
LR0.710690.700.690.840.840.840.840.840.830.840.83
Random Forest0.690.690.690.650.820.810.810.81
Naïve Bayes0.570.660.570.600.720.750.730.73
KNN0.600.600.600.540.790.770.780.77
XGBoost0.740.740.740.720.830.830.830.83
MLP0.740.740.740.730.820.810.820.82
LR = Logistic Regresssion; KNN = K-Nearest Neighbors; XGBoost = eXtreme Gradient Boosting; MLP = Multi-Layer Perceptron; Acc = Accuracy; P = Precision; R = Recall; F1 = F1 score.
Disclaimer/Publisher’s Note: The statements, opinions and data contained in all publications are solely those of the individual author(s) and contributor(s) and not of MDPI and/or the editor(s). MDPI and/or the editor(s) disclaim responsibility for any injury to people or property resulting from any ideas, methods, instructions or products referred to in the content.