In this section, for the simulation scene, based on the imaging link model of the TDI-CCD remote sensing imaging system, the parameter optimization method proposed in this article is used to optimize the wake imaging system.
4.3.1. Optimization Constraints Analysis
In the optimization model, the constraint conditions are designed to ensure the imaging performance of the system to ensure that the output results clearly show wake characteristics. To achieve this goal, we first analyze the relationship between the DSNR values, the PRR values, and the system parameters. Then, the influence of parameters and on the optimization model is analyzed, and the parameter selection scheme is given.
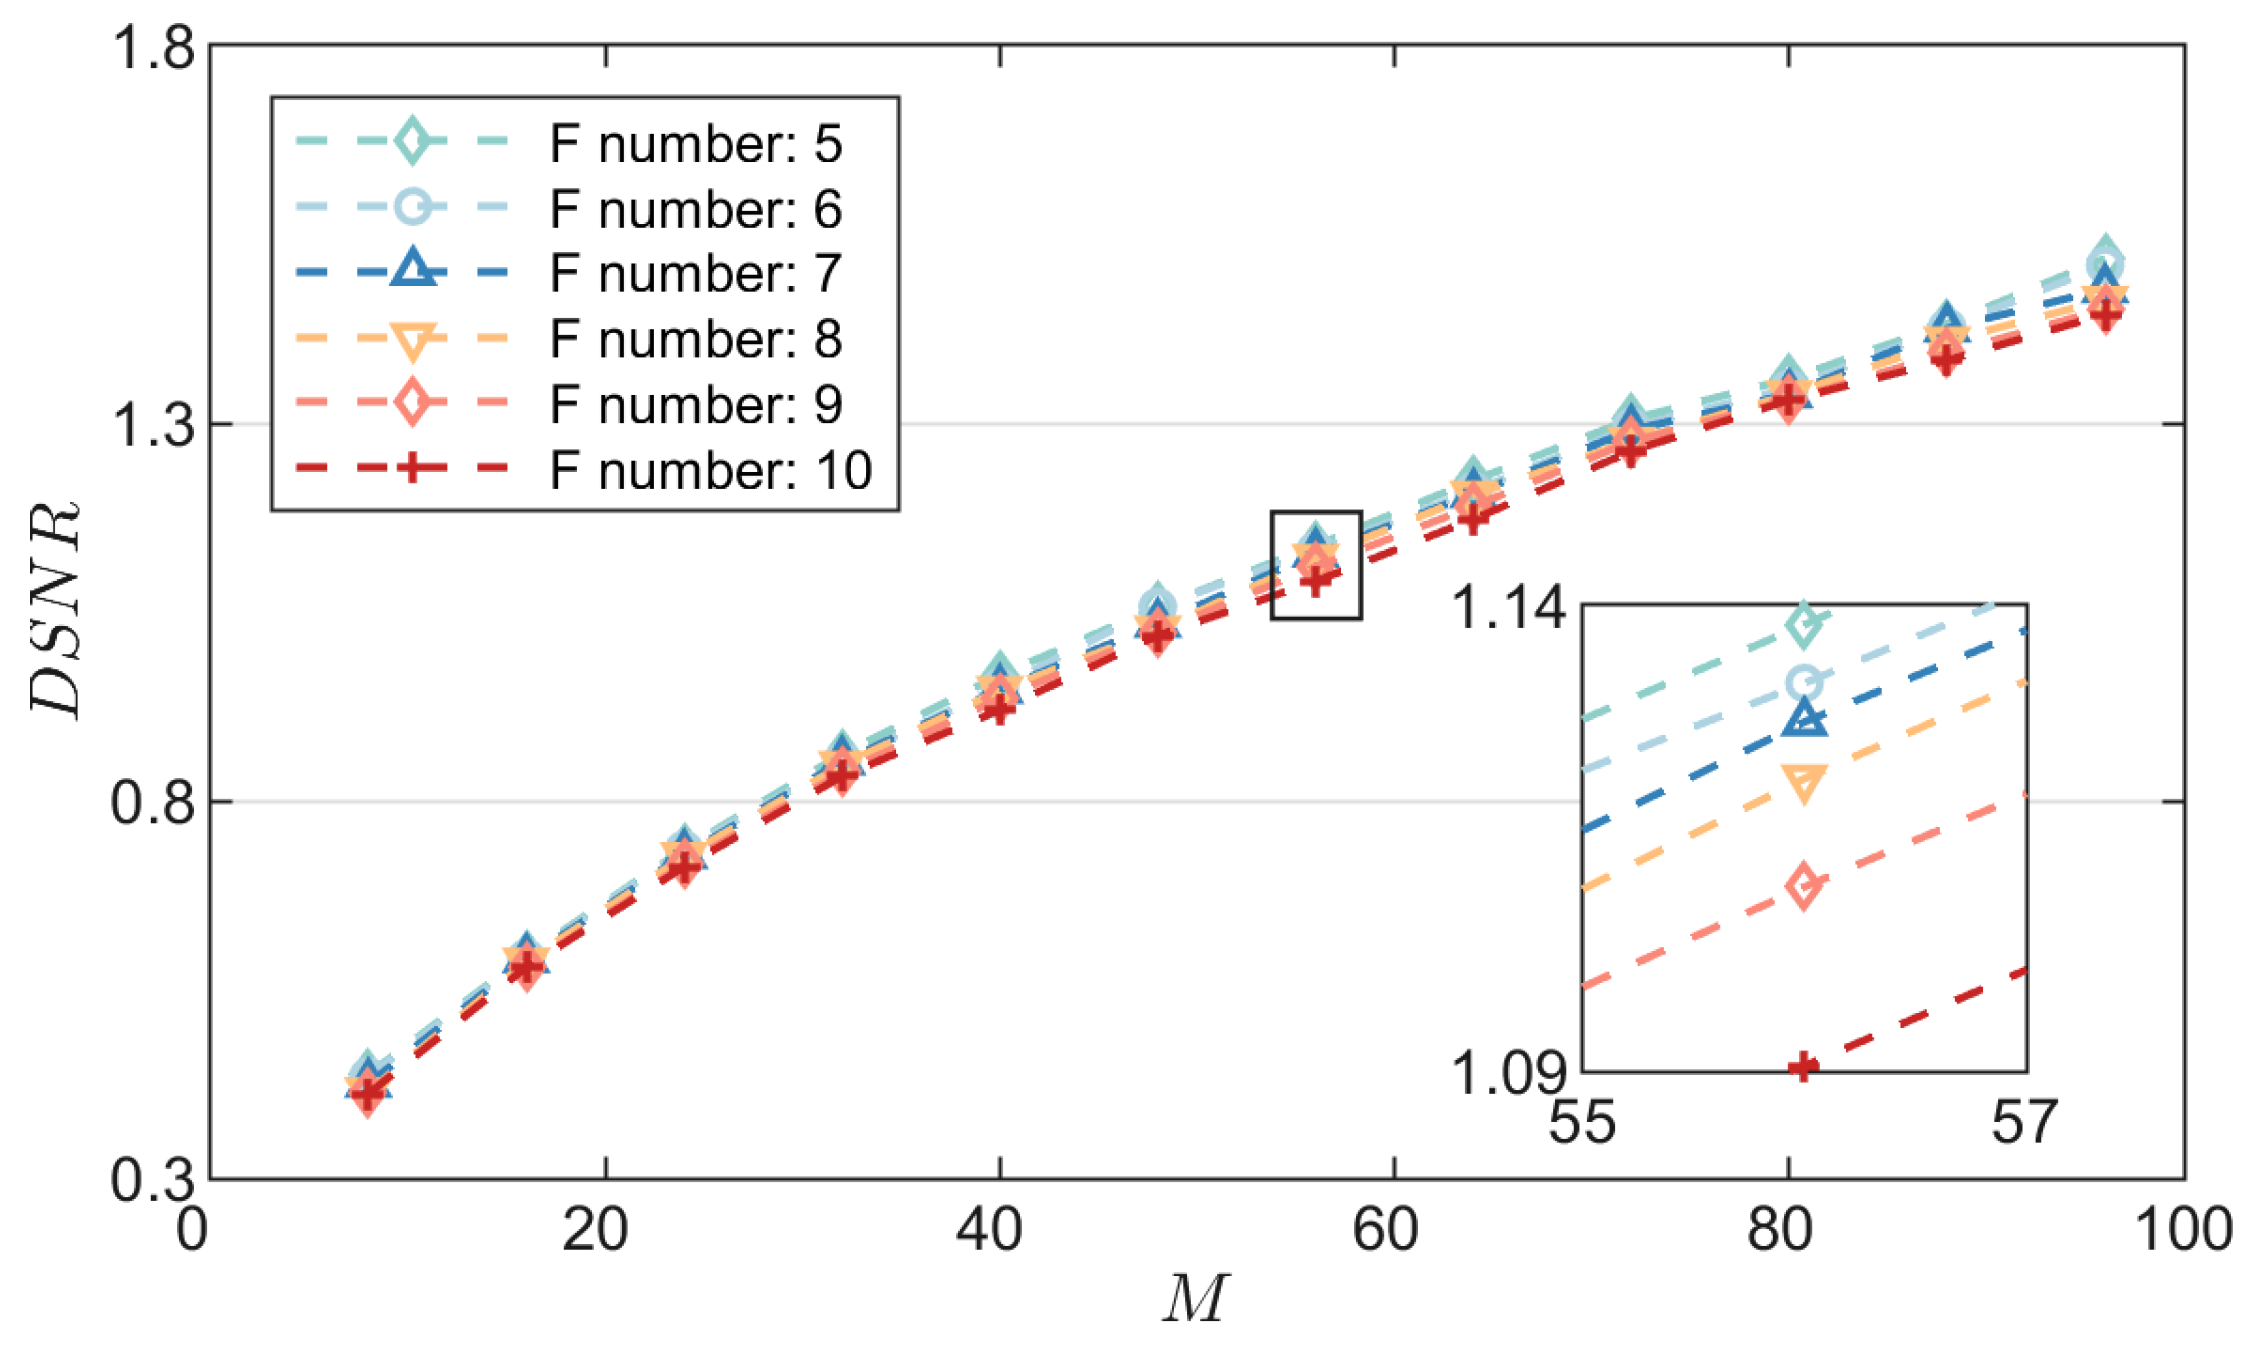
Based on the Function (21), the DSNR values under different system parameter configurations are calculated. The numerical simulation results are shown in
Figure 4.
Figure 4 shows the variation in DSNR values with integration stages under different F numbers.
Figure 4 shows the variation in DSNR with integration stages under different F numbers. When integration stages increase from 8 to 96, DSNR shows an overall upward trend. For example, at an F number of 5, the DSNR increases from 0.43 to 1.52, which shows that under the selected parameters and scene conditions in this article, increasing the integration stages can effectively enhance the detection ability of the imaging system for wake signals. The partial enlarged image in
Figure 4 shows that there are some differences in DSNR curves corresponding to different F numbers. With the decrease in the F number, DSNR values show a slight increasing trend. When the integration stages are 32, the F number decreases from 10 to 5, and the increase in DSNR value is less than 0.05. The results show that under the selected parameters and scene conditions in this article, the influence of the F number on the DSNR value is weaker than that of the integration stages within this parameter range. The above results show that under the selected parameters and scene conditions in this article, for the wake imaging system, integration stages are the dominant factor affecting the DSNR value, while the influence of the F number on the DSNR value is relatively weak.
To determine the value of parameter
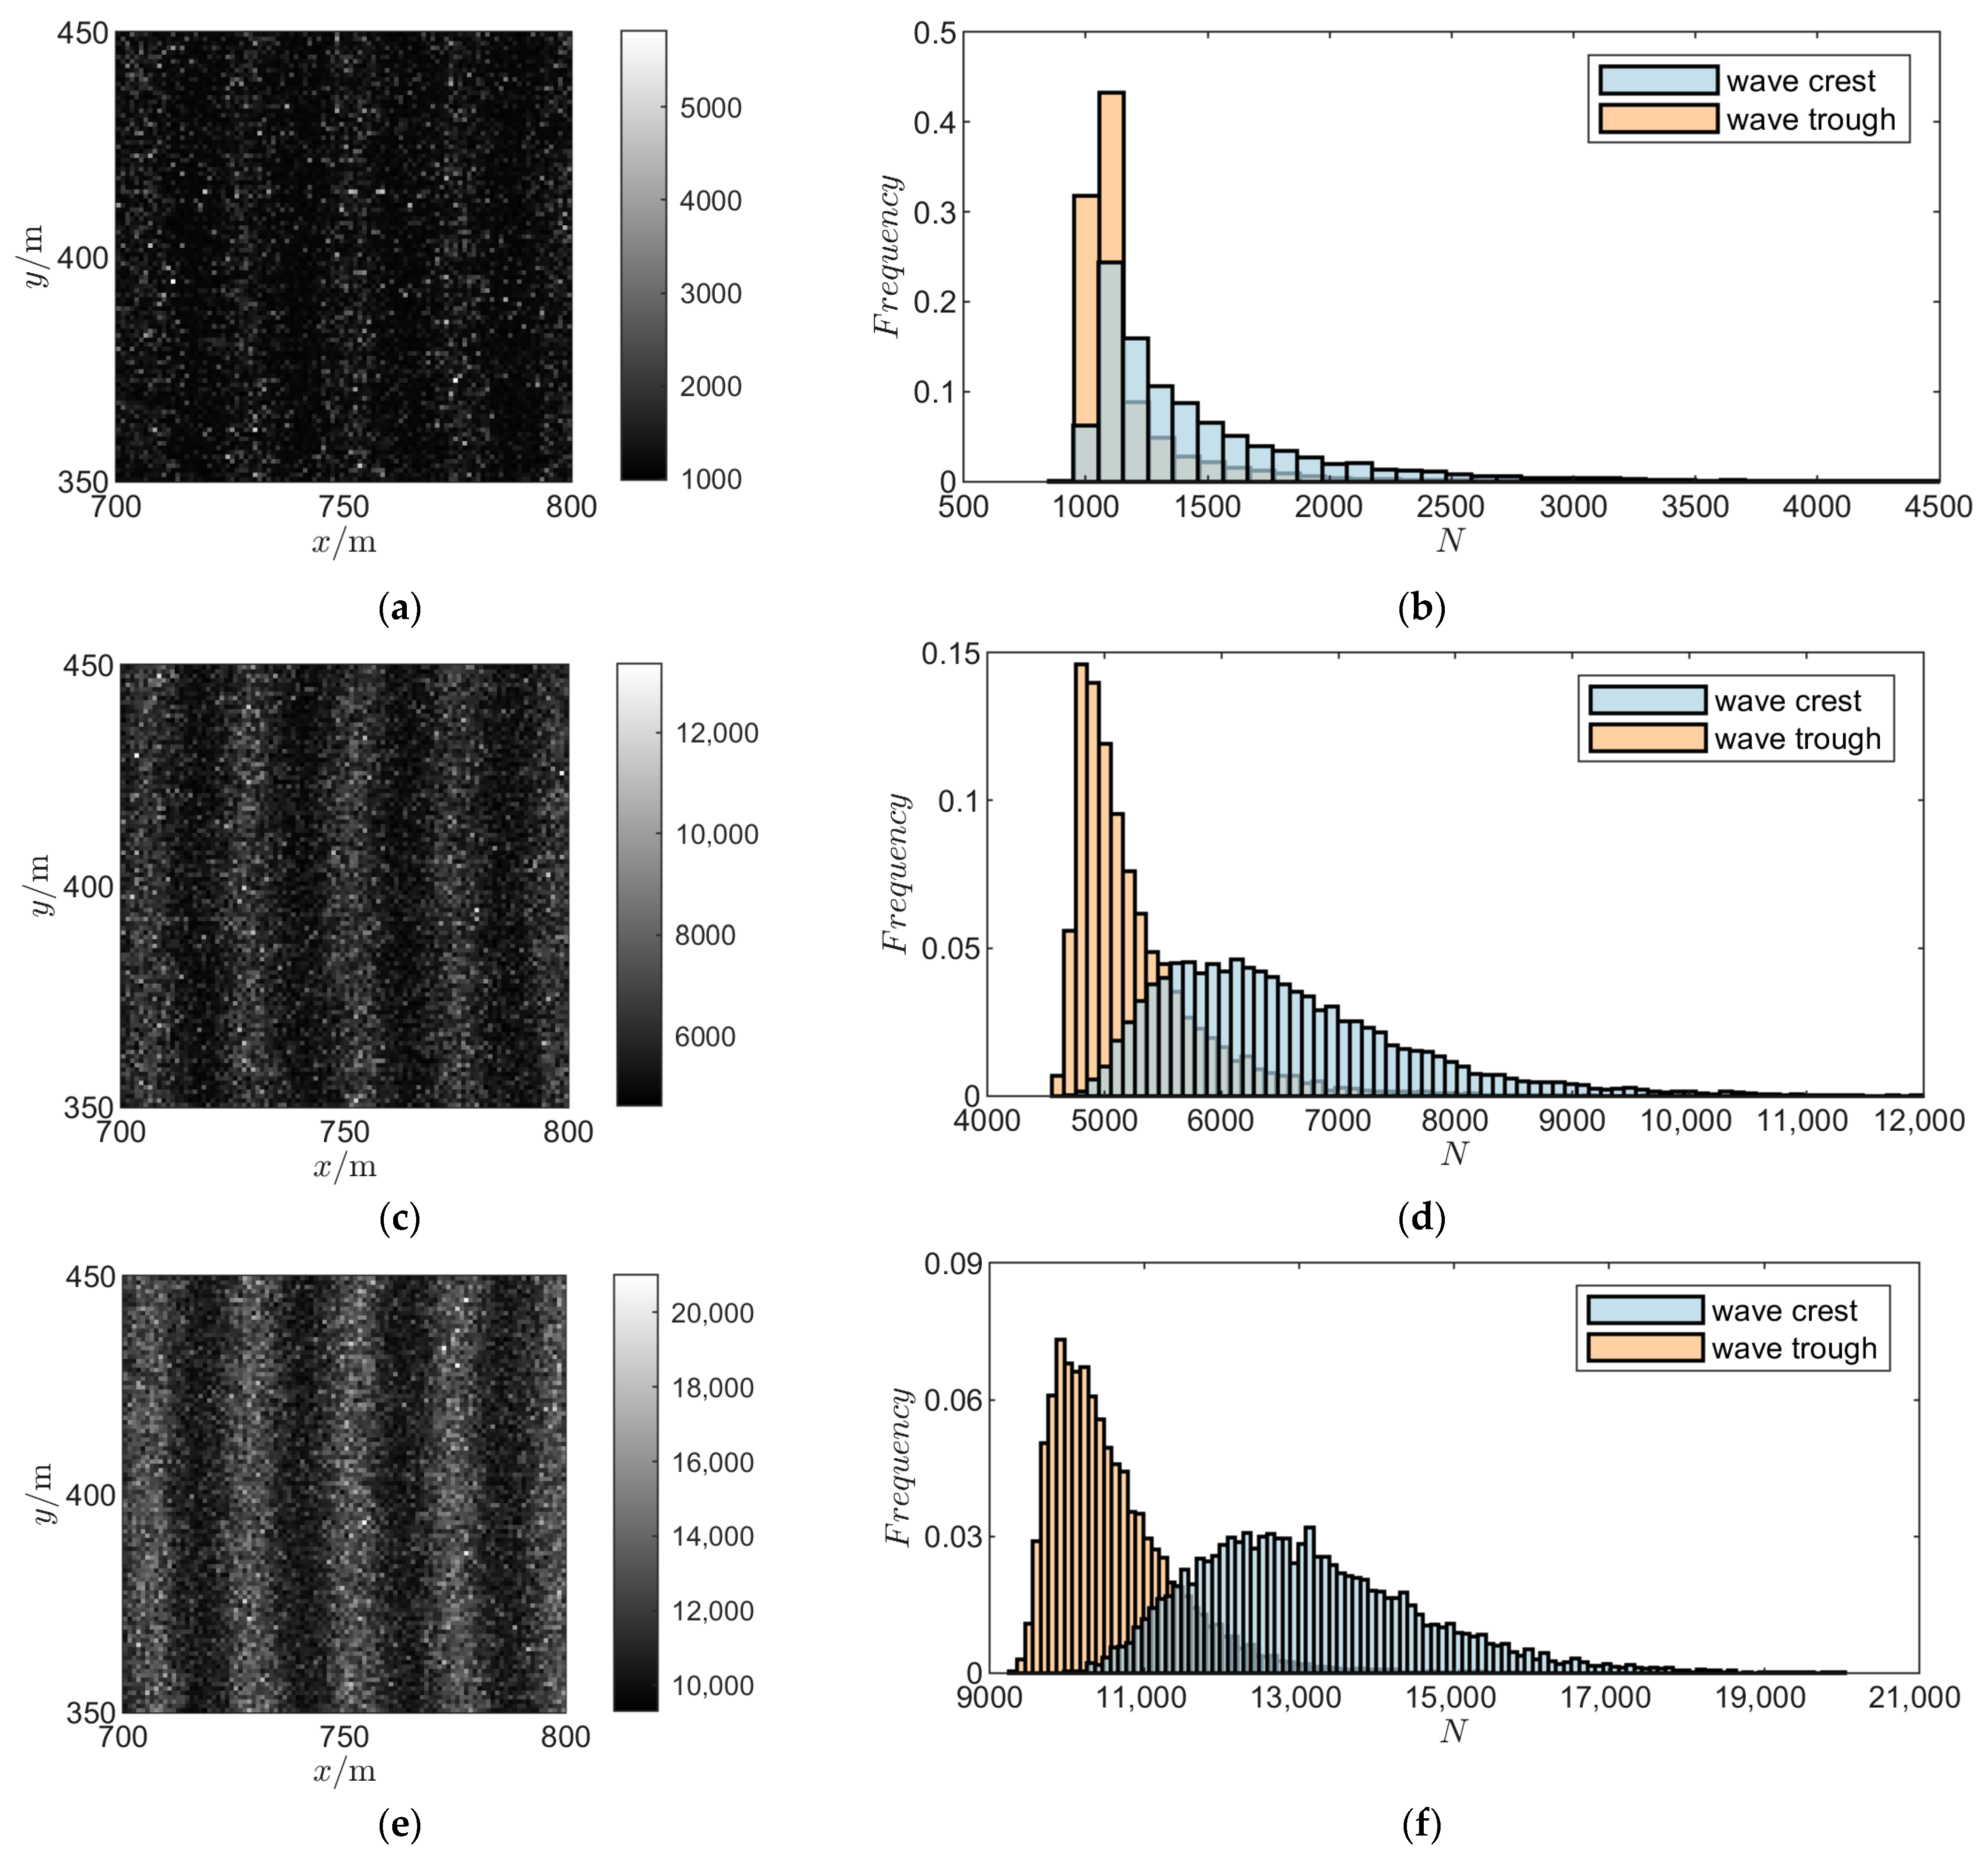
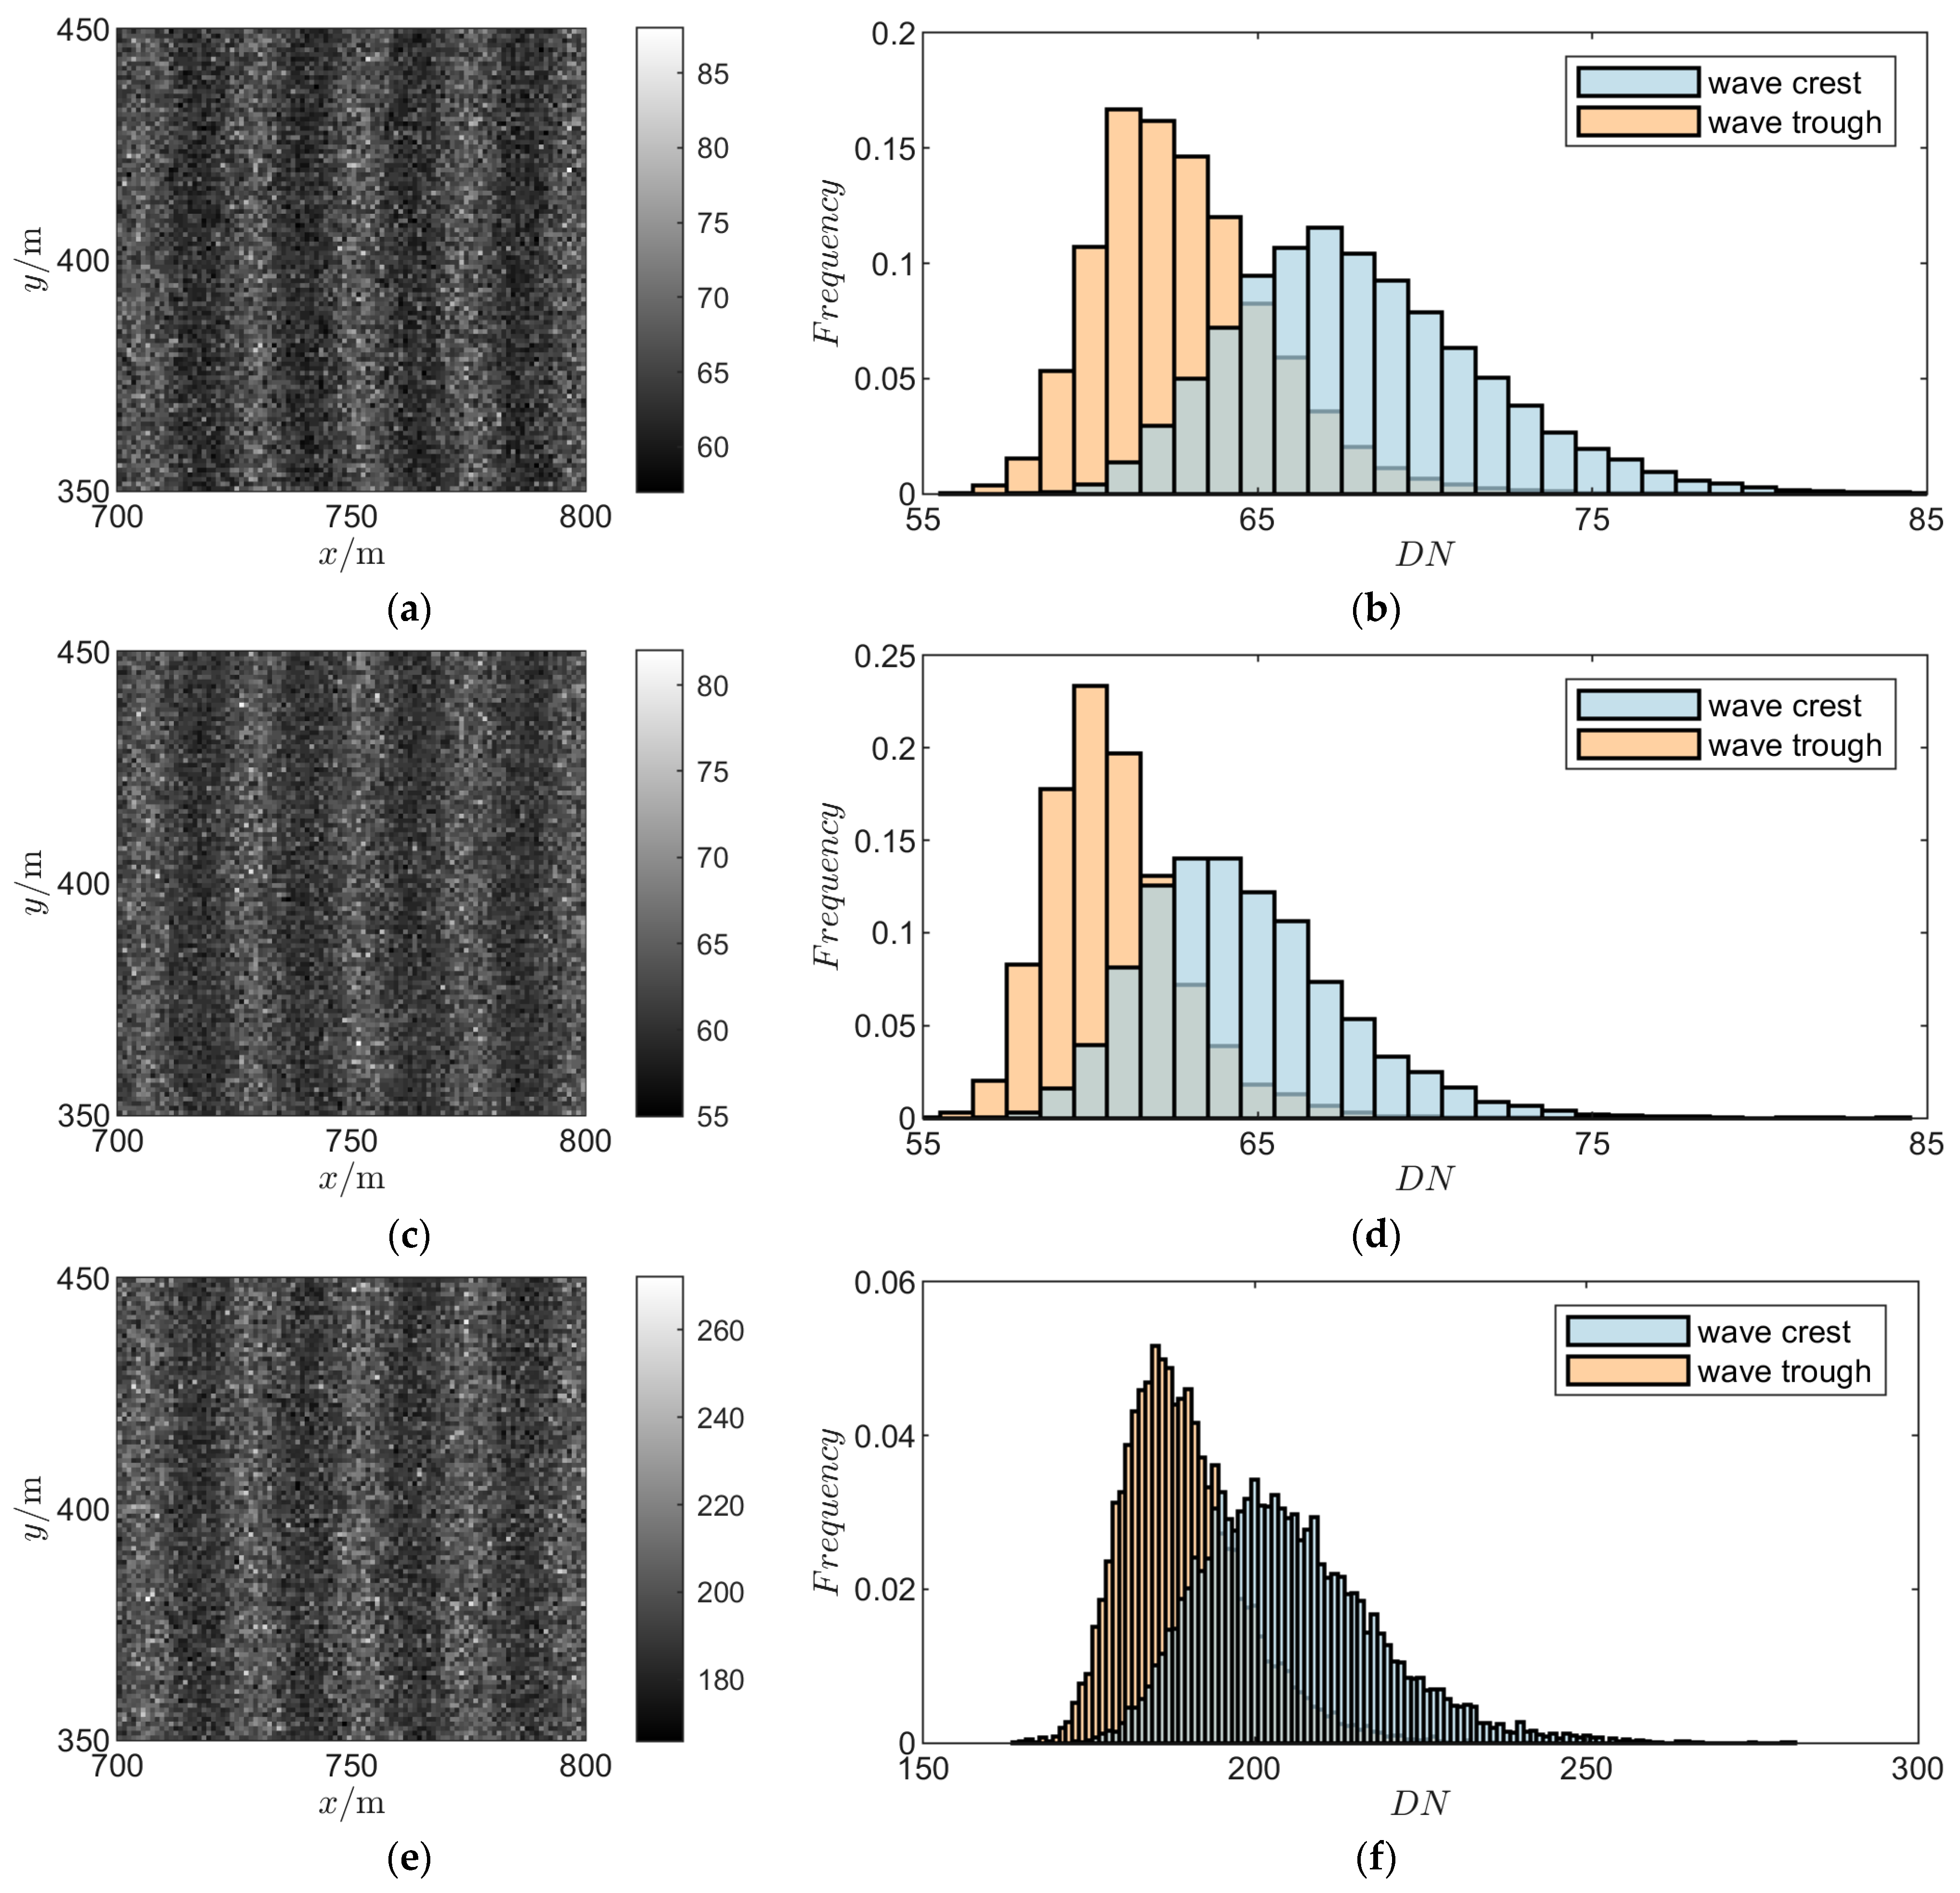
, the imaging results of the imaging system for wake targets at different DSNR values are calculated according to the Kelvin wake imaging mechanism model and Function (21). The simulation results are shown in
Figure 5.
Figure 5a,c,e show the digital signal values without final quantization and sampling under several typical DSNR values.
Figure 5b,d,f show the frequency histogram of digital signal values without final quantization and sampling at the wake radiance crest and trough.
Table 4 shows the relevant indicators of the simulation results under different DSNR values, including the mean (
) and standard deviation (
) of the digital signal values without final quantization and sampling, the min–max normalized contrast (
) between the crest and trough in the imaging results, and the overlap area (
) of the frequency histogram of the digital signal values at the crest and trough.
When
, the imaging results in
Figure 5a show that the
of the image is 0.34, and the identifiability of periodic wake characteristics is very low. The frequency histogram (
Figure 5b) shows that the
of the probability distribution of the digital signal value at the crest and trough is 0.62, and the probability distribution of the two is almost completely coincident, indicating that the signal strength of the target in the imaging result is weak, resulting in low imaging quality.
When
, the
of the imaging results in
Figure 5c is 0.43, and obvious wake characteristics can be observed. The frequency histogram (
Figure 5d) shows that, compared with
, the
of the probability distribution of the digital signal value at the crest and trough is reduced to 0.41, and the peaks are completely separated, indicating that the intensity of the wake signal in the imaging results is strong, and clear wake characteristics can be observed.
When
, the wake characteristics in the imaging results of
Figure 5e are clearer, and the
in the image is 0.50. The frequency histogram (
Figure 5f) shows that the
of the probability distribution of the digital signal value at the crest and trough is further reduced to 0.26, and the peak spacing is increased, indicating that the signal strength of the target in the imaging results is stronger, and the recognition degree of the wake feature is further enhanced.
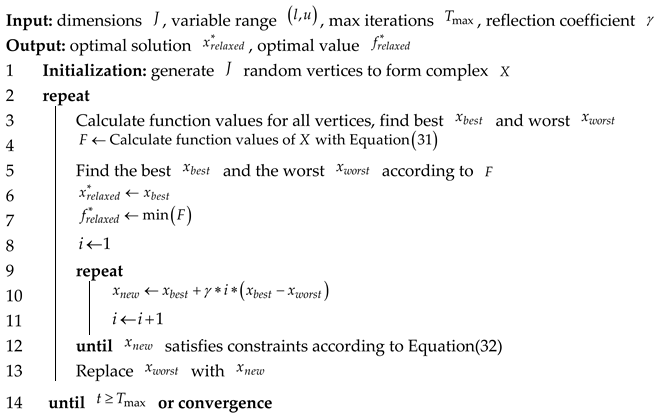
Based on the above analysis, in the subsequent optimization design of this article, we set the value of as 1 and use as the constraint condition of the optimization model.
- 2.
Probabilistic Radiometric Resolution
According to the calculation Function (25), the PRR values of different system parameters under the above imaging targets and imaging conditions are calculated. The numerical simulation results are shown in
Figure 6.
Figure 6 shows the variation in PRR values with integration stages at different F numbers under the conditions of different quantization bits of the system. The results show that under the selected parameters and scene conditions in this article, PRR values are positively correlated with integration stages and quantization bits, and negatively correlated with F numbers. In addition, comparing the simulation results of different parameter combinations, it can be seen that with the decrease in F number, the increase in integration stages, and the increase in quantization bits, the influence of integration stages, F number, and quantization bits on PRR values shows a weakening trend.
The above results show that under the selected parameters and scene conditions in this article, for the wake imaging system, PRR values are influenced by integration stages, F number, and quantization bits. This rule provides a reference for the optimization of imaging system parameters. In the process of system design, it is necessary to comprehensively consider the values of the three and their mutual influence.
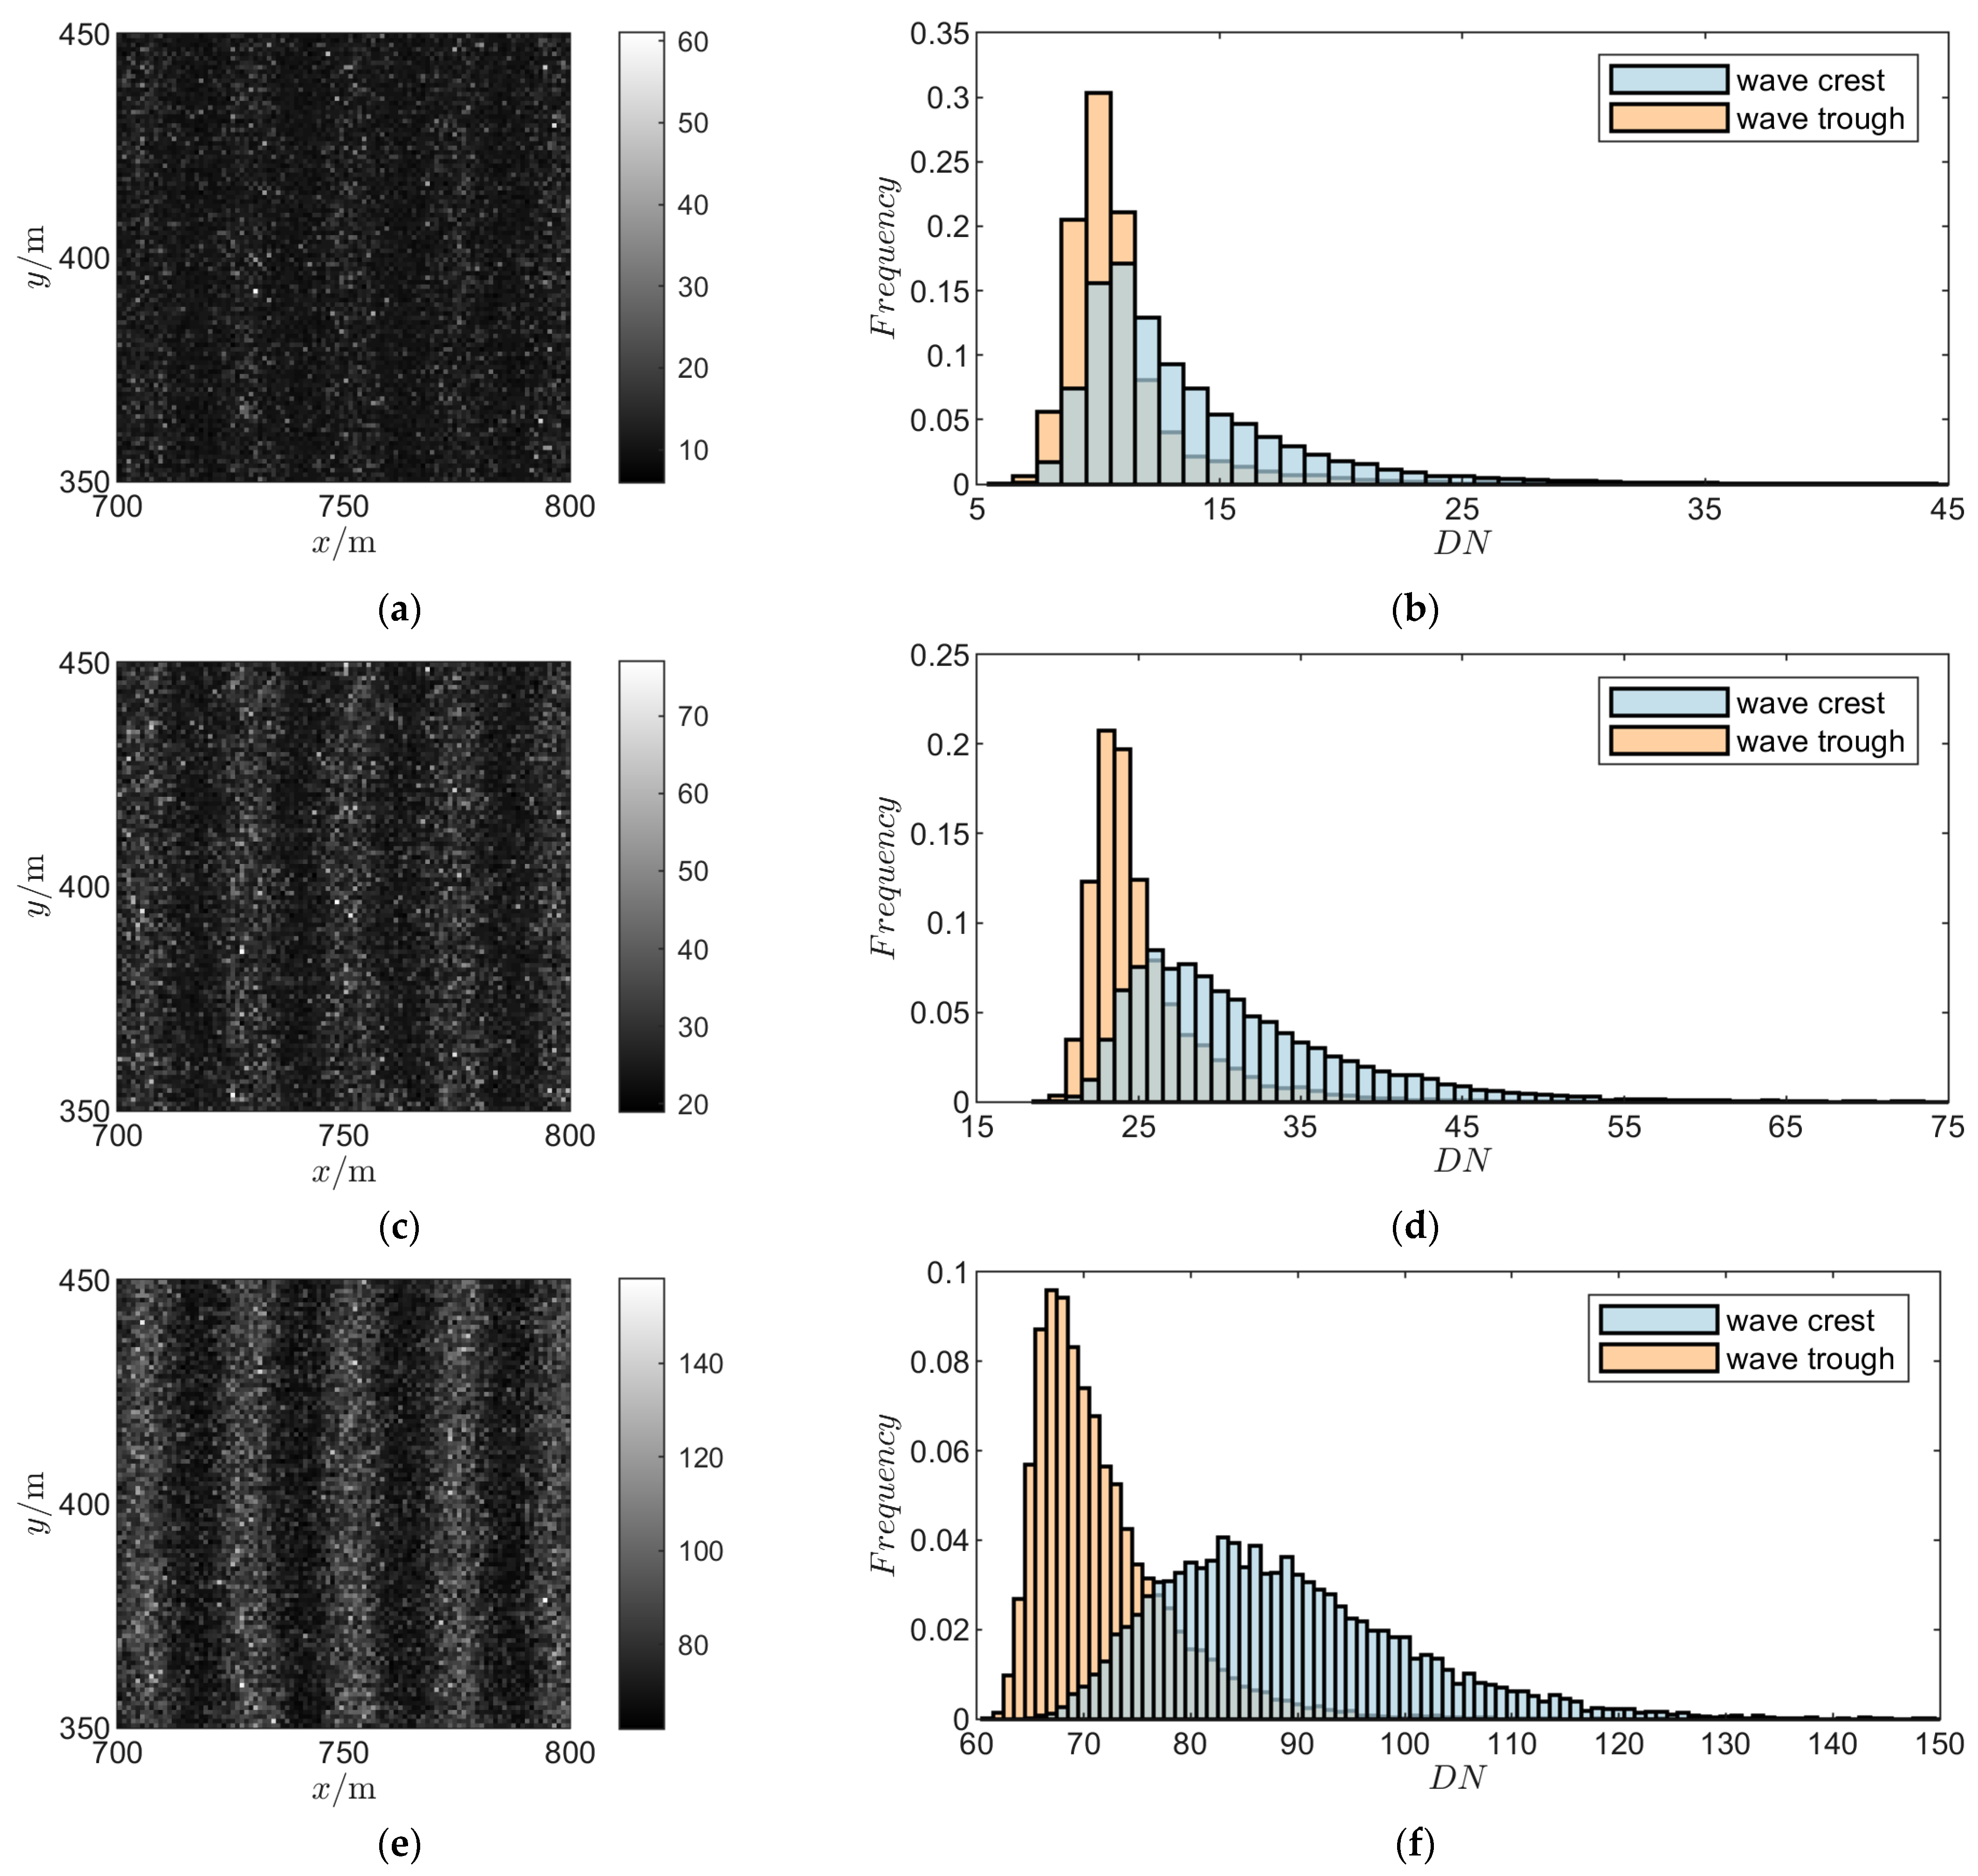
To determine the value of parameter a, the imaging results of the wake target when the imaging system is at different PRR values are calculated according to the Kelvin wake imaging mechanism model and Function (25). The simulation results are shown in
Figure 7.
Figure 7a,c,e show the digital signal values under several typical PRR values.
Figure 7b,d,f show the frequency histogram of digital signal values at the wake radiance crest and trough.
Table 5 shows the relevant indicators of the simulation results under different PRR values.
When
, the
of the imaging results in
Figure 7a is 0.24, and the identifiability of periodic wake characteristics in the image is low. The frequency histogram (
Figure 7b) shows that the
of the probability distribution of the digital signal value at the crest and trough is 0.64, and the probability distribution of the two is almost completely overlapped, indicating that it is difficult to effectively distinguish the two through the digital signal value, resulting in low imaging quality.
When
, the
of the imaging results in
Figure 7c is 0.31, and obvious wake characteristics can be observed from the image. The frequency histogram (
Figure 7d) shows that compared with
, the
of the probability distribution of digital signal value at the crest and trough is reduced to 0.51, and the peak is completely separated, indicating that the two can be distinguished by digital signal value.
When
, the
of the imaging results in
Figure 7e is 0.46, and a clearer periodic wake structure can be observed from the image. The frequency histogram (
Figure 7f) shows that the
of the probability distribution of the digital signal value at the crest and trough is reduced to 0.33, and the distance between the peaks increases, indicating that the digital signal values of the two are more distinguishable.
Based on the above analysis, in the subsequent optimization design of this article, we set the value of as 0.8 and use as the constraint condition of the optimization model.
4.3.2. Optimization Problem Solving
Based on engineering experience, six F numbers (5, 6, 7, 8, 9, 10), six integration stages (8, 16, 32, 48, 64, 96), and three quantization bits (8, 10, 12) were selected as the value range of optimization variables for numerical simulation. Based on the optimization model and algorithm proposed in this article, the optimization results of the optimization problem are shown in
Table 6.
Table 6 lists the values of the optimization parameters, objectives, and constraints of the optimization results in the first stage, where bold indicates the optimization results in the second stage.
The optimization results of the first stage represent the parameter boundary that can clearly image the wake target under the current imaging conditions. The optimization results of the second stage represent the parameter combination with the largest in the optimization results of the first stage.
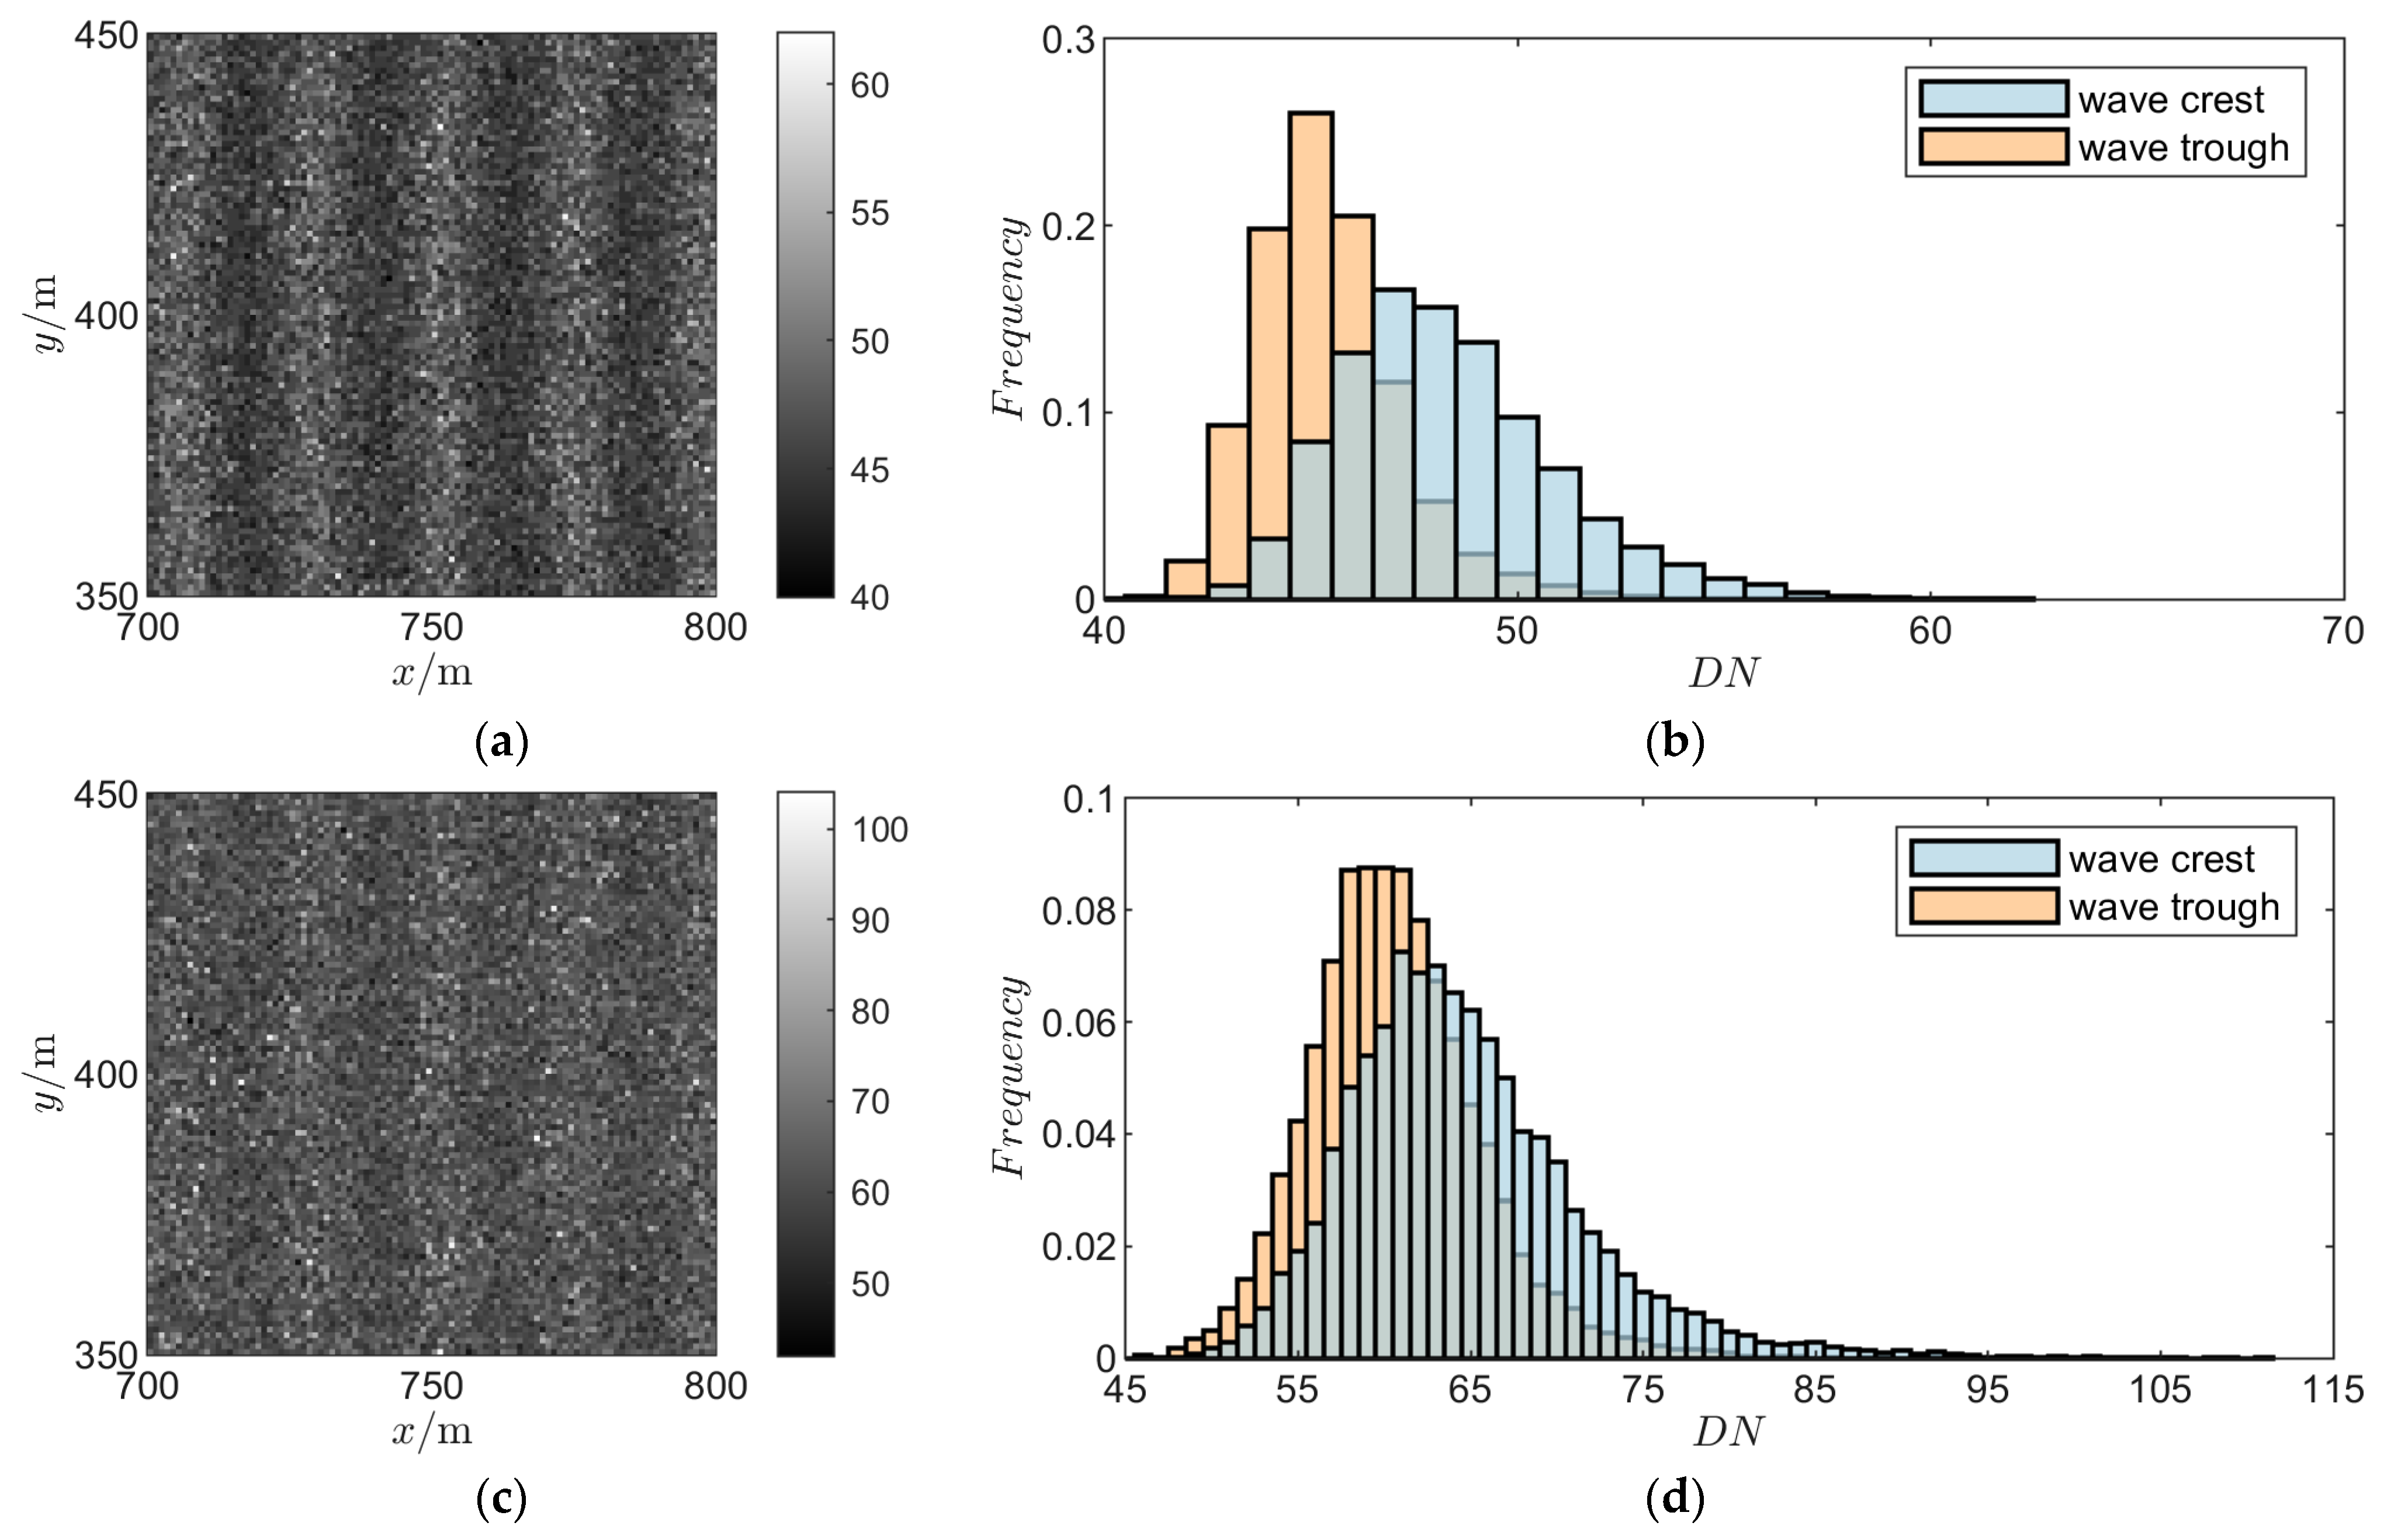
In order to verify the effectiveness of the parameter optimization scheme, the imaging performance of the optimal parameter combination and the non-optimized parameter combination was compared. The simulation results are shown in
Figure 8 and
Figure 9. The relevant indicators of simulation results are shown in
Table 7.
It can be seen from
Table 7 that the optimal solution
is better than all other non-optimized parameter combinations that meet the constraints. The
of the imaging results of
Figure 8a is 0.29, and obvious wake characteristics can be observed. The
of the probability histogram in
Figure 8b is 0.45, and the peak value of the digital signal at the crest and trough is completely separated.
In
Table 7, there are two sets of parameter combinations (
;
) whose performance is inferior to the optimal solution, and they fail to meet the constraints. In the imaging results in
Figure 8c,e, the
is lower than 0.29, and only relatively vague wake characteristics can be observed. The
of the probability distribution in
Figure 8d,f is greater than 0.45, and the peak value of the digital signal at the crest and trough is not completely separated.
In
Table 7, there are three parameter combinations (
;
; and
) with better performance than the optimal solution. In the imaging results in
Figure 9a,c,e, the
is greater than 0.29, and a clearer wake signal can be observed. In
Figure 9b,d,f, the
of probability distribution is less than 0.45, and the peak value of the digital signal at the crest and trough is completely separated. But in the first priority optimization objectives (maximize
F, minimize
M, and minimize
n), they are still dominated by the optimal solution.
Based on the above analysis, under the selected parameters and scene conditions in this article, the optimal parameter combination can achieve clear imaging of wake targets. The combination of parameters with imaging performance lower than the optimal solution cannot obtain recognizable wake characteristics. The combination of parameters with imaging performance higher than the optimal solution can obtain identifiable wake characteristics. This conclusion verifies the effectiveness of the proposed optimization design method.

