Abstract
To accurately assess the development potential of a high-speed rail (HSR) express in the logistics system, this study constructs a forecasting method for HSR express volume. Grey relational analysis is used to identify key influencing factors, and a multiple regression model is established to predict intercity express volume. A generalized cost model for road, HSR, and air express is developed, considering infrastructure availability and delivery timeliness. Cost differences between supply and demand sides are analyzed, and a Logit model is applied to quantify mode share, deriving HSR express volume. A gravity model allocates the volume between cities. The method is validated in Henan Province, China. Results show that: (1) Intercity express volume in China will continue growing over the next decade, with HSR forming a stable share, and Henan playing a significant role as a central hub; (2) Suppliers prefer HSR for medium-to-long distances with lower timeliness demands, while consumers prefer it for shorter, time-sensitive deliveries; (3) Lower consumer prices significantly increase HSR mode share, urging suppliers to balance cost and infrastructure investment. This method supports HSR express forecasting and promotes sustainable logistics.
1. Introduction
In recent years, the rapid development of e-commerce and evolving consumer habits have driven exponential growth in the express delivery industry, making it a vital component of the social logistics system. However, traditional express transport, dominated by road transportation, faces challenges such as capacity constraints, fluctuating transit times, and high carbon emissions, struggling to fully meet the growing demand for high-quality services [1]. Although air transport offers superior speed, its high cost, limited capacity, and vulnerability to disruptions like adverse weather limit its applicability [2]. Against this backdrop, high-speed rail (HSR) has emerged as a promising supplement to the express transport system [3]. It is well-known for its speed, punctuality, large capacity, and environmental friendliness.
Currently, several HSR lines in China have begun integrating express delivery services, preliminarily demonstrating their feasibility and efficiency for medium- to long-haul transport [4]. Beyond China, the utilization of HSR for freight and express delivery has also been explored in several countries, offering valuable international context. In Japan, the Shinkansen network has been used for mail and parcel services, demonstrating the feasibility of integrating express logistics with HSR operations [5]. Similarly, in Europe, countries like France and Germany have conducted trials and implemented services utilizing HSR for postal and express goods, focusing particularly on overnight transport to align with network capacity availability [6]. These international experiences underscore the global interest in leveraging HSR’s speed and reliability for freight. Nevertheless, HSR express operations are still in their infancy, lacking systematic operational models and robust planning mechanisms, particularly in aspects such as market positioning, capacity evaluation, and volume allocation. Thus, there is an urgent need to develop sound methodologies for forecasting and allocating HSR express volume, to clarify its potential role and share in the logistics network and provide theoretical support and decision-making guidance for advancing multimodal transport and building an efficient, low-carbon logistics system.
This study focuses on express delivery services and investigates the potential and application of HSR in express transport from a holistic perspective. Specifically, grey relational analysis is first employed to identify key factors influencing express volume, followed by a multiple regression model to predict intercity express volume nationwide. Subsequently, a generalized cost-based Logit model is constructed to estimate mode share among road, HSR, and air transport, determining the market proportion of HSR express. Finally, a gravity model incorporating urban consumption capacity, production levels, and geographical distance is applied to allocate HSR express volume among city pairs, estimating the demand and flow of HSR express services across cities.
In summary, this research establishes a comprehensive framework for analyzing HSR express volume from three dimensions—demand forecasting, modal competition, and spatial allocation—offering insights significant for both macro strategy and micro decision-making on a national scale. The findings can facilitate the integrated development of the express industry and HSR transport, enhance overall efficiency, and support strategic goals for green logistics and regional coordination. The remainder of this study is structured as follows. Section 2 provides a literature review. Section 3 introduces the key methodologies, including the intercity express volume forecasting model, the HSR express mode share model, and the urban HSR express allocation model. Section 4 presents a case study and discusses the results. Finally, Section 5 concludes the study and suggests future research directions.
2. Literature Review
Currently, with socio-economic development, the growth rate of express delivery volume has significantly accelerated. Accurate forecasting of express volume not only aids in optimizing capacity allocation and distribution routes but also enhances service quality and reduces operational costs. Therefore, research on express volume forecasting is of great importance for the sustainable development of the industry. To address this issue, Xu et al. [7] proposed an adaptive grey model for predicting future express volume. Results demonstrated its effectiveness for short-term forecasting. Kim et al. [8] introduced a weighted ensemble forecasting method based on a multi-layer perceptron to handle the sharp increase in express volume during holidays, showing its particular suitability for peak periods. Ren et al. [9] developed a deep learning-based prediction model that considers factors such as weather, events, and promotions to forecast daily express volume, effectively capturing the coupling relationships between volume and complex influencing factors. Xiong et al. [10] proposed an improved particle swarm optimization algorithm to enhance the accuracy of a grey model for quantitative predictions, indicating substantial future growth and potential in the express industry. Ma et al. [11] presented an improved BP neural network model optimized with a genetic algorithm for regional express volume forecasting, yielding more accurate results.
However, research specifically on forecasting HSR express volume is relatively scarce. Huang et al. [12] proposed an ensemble forecasting method using multiple models to predict HSR express volume and allocated the results to various cities using a gravity model. Their findings suggested a stable, non-explosive growth trend for HSR express. Directly forecasting HSR express volume remains challenging, primarily due to its late start, underdeveloped transport modes, route planning, scheduling systems, and a lack of long-term operational experience and historical data.
Therefore, this study draws on the four-step method: first forecasting total express volume, then quantifying the mode share of HSR express to derive its volume and finally allocating this volume among cities. A key challenge is determining the mode share of HSR express within a multi-modal context, an area lacking dedicated studies. Essentially, calculating this share is akin to transport mode choice. Zhao et al. [13] proposed an evolutionary dynamics model for travel mode choice, establishing a generalized travel cost model (including direct and comfort costs) to analyze choice probabilities, finding that travel distance influences mode selection and sensitivity to cost varies by distance. Xin et al. [14] studied commuters’ mode choice behavior under different scenarios, incorporating the value of commute time into a generalized cost function and building a choice model based on cumulative prospect theory, showing it better reflects real-world decisions. Zhou et al. [15] developed a dynamic travel mode choice model that breaks the total travel time into transfer, waiting, and in-vehicle times, calculating choice probability based on changes in generalized cost during the trip. Results indicated economic factors influence 78% of travelers’ choices, and the dynamic model accurately predicts pre-trip choices and mode shifts during travel. The core idea across these studies is computing the generalized cost for various transport modes and then applying a allocation model. This study adopts a similar approach, calculating the generalized cost for different express transport modes to derive HSR express mode share via an allocation model.
Duan et al. [16] argued that the supply side and demand side of HSR express consider cost factors differently. Furthermore, Bi et al. [17] defined HSR express transport capacity and proposed service level measurement indicators, conducting an empirical analysis in 27 Chinese cities. Their results showed that current HSR express capacity utilization is about 5.5% of the total HSR network capacity but warned that capacity limits could be reached soon if infrastructure development fails to keep pace with growing demand. Liang et al. [18] analyzed the cost–benefit of four HSR express transport modes, concluding that different modes have advantages in the short, medium, and long term, requiring comprehensive consideration for infrastructure planning. Therefore, when quantifying the mode share of HSR express, it is essential to consider the supply side and demand side separately. Besides monetary cost, infrastructure availability and delivery timeliness are equally critical factors.
3. Methodology
3.1. Problem Statements
This study establishes a comprehensive forecasting and allocation framework for HSR express by integrating established transportation demand modeling theories into a novel composite approach. The methodological design is grounded in the classic four-step transportation planning model, which structures the analysis into sequential stages of demand generation, modal split, and traffic assignment. The primary methodological innovation of this research lies not in the creation of a single new model, but in the systematic integration of these established models into a cohesive, multi-stage framework specifically tailored for the emerging HSR express sector. This approach addresses a critical gap in the existing literature, which often relies on isolated models, by providing a holistic tool for strategic-level planning of HSR express networks. The core research components include forecasting intercity express volume, calculating the mode share of HSR express, and allocating HSR express volume among cities. The specific research framework is illustrated in Figure 1, which primarily consists of the following three aspects:
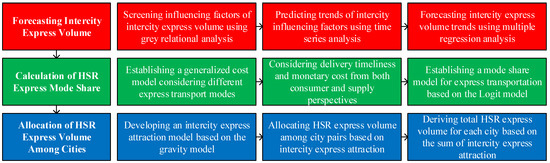
Figure 1.
Research framework.
- Based on historical express volume data and relevant socio-economic indicators, key influencing factors are screened using grey relational analysis. A multiple regression model is then constructed to forecast intercity express volume nationwide;
- Building on the generalized cost structures of the three primary express transport modes—road, HSR, and air—a Logit model is employed to calculate the mode share of each within the express market, thereby determining the proportion of HSR express in the overall market;
- Utilizing a gravity model that incorporates urban consumption capacity, production level, and geographical distance, the intercity express attraction is computed. The national HSR express volume is allocated among city pairs, and city-level HSR express volumes are statistically derived.
3.2. Intercity Express Volume Forecasting Model
Express delivery services are primarily categorized into domestic intra-city, domestic intercity, and international express. Among these, HSR express mainly handles domestic intercity express business (with a delivery distance exceeding 200 km). Therefore, a multiple regression model is adopted to forecast domestic intercity express volume based on historical data, incorporating reasonable analysis and screening of influencing factors.
The multiple regression model enables the fitting of domestic intercity express volume by selecting multiple influencing factors as explanatory variables. Let Y denote the domestic intercity express volume, b0 the constant term, Xi the i-th explanatory variable, and ai the correlation coefficient of the i-th explanatory variable. The multiple regression model is expressed as Equation (1) [19].
Here, ai can be calibrated through regression on historical data, reflecting the direction and extent of the influence of each factor on intercity express volume. Xi can be forecasted using time series methods and serves as a component for predicting future intercity express volume.
Grey relational analysis is employed to screen the influencing factors of intercity express volume, with those exhibiting substantial impact selected as explanatory variables in the multiple regression model. Each factor sequence is normalized using an intervalization method to eliminate units. Let ζi(k) represent the grey correlation coefficient between the k-th value of the i-th influencing factor and the k-th value of the intercity express volume, y(k) the k-th value of the intercity express volume, xi(k) the k-th value of the i-th influencing factor, ρ the grey resolution coefficient (with a value range of [0, 1]), ri the grey relational degree indicating the level of correlation between each influencing factor and the intercity express volume, and n the length of the data sequence of influencing factors. The calculation of the grey relational degree coefficient is given by Equations (2) and (3) [20].
The grey relational degree describes the relationship between each influencing factor and the explained variable. To further optimize the model performance and facilitate subsequent computation, a threshold for the grey relational degree can be established. Influencing factors with a grey relational degree above this threshold are retained as explanatory variables in the multiple regression model.
3.3. Calculation Model for HSR Express Mode Share
The primary modes of express transportation include road, HSR, and air transport. By establishing a generalized cost model for each transport mode and applying a Logit model, the mode share of road, HSR, and air transport within the domestic intercity express market can be determined. Combined with the forecasted intercity express volume from Section 3.2, the volume of HSR express can subsequently be derived.
Generalized cost refers to the total economic and social costs incurred when transporting goods from origin to destination. It encompasses not only direct monetary expenses (such as freight charges and fuel costs) but also time costs, reliability losses (e.g., delay risks), and transfer costs arising from infrastructure limitations. It provides a comprehensive measure of the integrated costs of the transportation process, aiming to more accurately reflect the trade-offs users consider when selecting and consuming transport services. Let Ui,j(k) denote the generalized cost of transporting a unit mass of goods over distance k via the i-th transport mode under the j-th timeliness condition, aj the timeliness sensitivity coefficient for the j-th timeliness condition, Vi the velocity of the i-th transport mode, Ci(k) the monetary cost of the i-th transport mode over distance k, Covi the infrastructure coverage rate of the i-th transport mode, and Puni the on-time rate of the i-th transport mode. The generalized cost model is expressed as Equation (4).
Here, ajk/Vi represents the time cost of transporting goods over distance k using transport mode i. A slower transport speed Vi leads to a higher time cost, and a higher timeliness sensitivity coefficient aj also increases the time cost. Ci(k) denotes the monetary cost for the consumer when selecting the express service and the operational cost for the provider. 1/Covi reflects the additional losses and time costs caused by transfers when the infrastructure coverage Covi of transport mode i is insufficient. 1/Puni represents the opportunity and time costs incurred due to the lack of punctuality Puni in transport mode i.
Due to the service characteristics of HSR express—large capacity, high punctuality, but high per-shipment cost—the cost acceptance levels differ between the supply side and the demand side. This study analyzes the competitiveness of HSR express from both perspectives.
For the demand side (consumers) of express services, the willingness to pay for improved timeliness can be considered as the timeliness sensitivity coefficient aj, which represents the additional cost consumers are willing to accept for each hour reduction in delivery time. For the supply side (service providers), higher timeliness requirements from customers necessitate faster transportation services. Thus, the same timeliness sensitivity coefficient aj can be applied to the supply side. Different values of aj are set corresponding to different service levels: same-day delivery, next-day delivery, and second-day delivery.
For the demand side, the monetary cost Ci(k) primarily refers to the express order placement fee charged to the consumer. For the supply side, the monetary cost Ci(k) comprises fixed costs and variable costs. Fixed costs are those that do not change with the volume of transport services, primarily including equipment costs and insurance fees in this study. Variable costs fluctuate with the volume of services and mainly consist of energy expenses and labor costs in this study. Additionally, maintenance rates and empty load rates are considered. Let FCi denote the fixed cost for transport mode i, VCi its variable cost, β1 the maintenance rate, and β2 the empty load rate. The monetary cost for different transport modes is expressed as Equation (5).
To mitigate the disproportionate differences in results caused by exponential growth, the generalized cost function is normalized. Let Pi,j(k) denote the selection probability of the i-th transport mode under the j-th timeliness condition for a distance k. The improved Logit choice model is given by Equation (6).
3.4. Allocation Model for HSR Express Volume Among Cities
The gravity model is employed to quantify the express attraction between city pairs. This allows for the allocation of the national HSR express volume, forecasted in Section 3.2, among specific city pairs, thereby enabling the calculation of city-level HSR express volumes. The gravity model employed here provides a robust and parsimonious framework for macroscopic spatial allocation. This formulation, focusing on core economic mass and geographical distance, effectively captures the fundamental drivers of express demand generation and attraction at a strategic planning level, while maintaining computational tractability for a nationwide application.
With reference to the gravity model [21], let Tij denote the express attraction from city i to city j, Ci the consumption level of city i, Pj the production level of city j, and dij the distance between the two cities. The express attraction between city i and city j is given by Equation (7).
Here, Ci is represented by the total retail sales of consumer goods in city i, reflecting its consumption level, while Pj is represented by the gross domestic product (GDP) of city j, indicating its production level. Based on the intercity express attraction Tij, combined with the national HSR express volume, the HSR express volume between city pairs can be allocated. Furthermore, by summing the express attraction for a specific city and determining its proportion relative to the total national express attraction, the total HSR express volume for that specific city can be derived in conjunction with the national HSR express volume.
4. Case Study
4.1. Research Area
This study selects Henan Province in China as the research area for the application and validation of the proposed methodology. It is important to note that while Henan Province serves as the empirical case in this study, the methodological framework is generic. The models utilize standardized variables (e.g., GDP, retail sales, distance) rather than parameters calibrated exclusively for Henan. Therefore, the approach demonstrated here can be directly applied to other regions by populating the models with corresponding local data. While the methodological framework is generic and transferable, its accurate application to regions beyond China requires attention to local context. Key parameters may be sensitive to regional characteristics. For instance, the timeliness sensitivity coefficients in the generalized cost model are likely to vary with local economic development levels and consumer preferences. Similarly, infrastructure parameters such as network coverage and on-time rates are directly tied to the development stage of the HSR and road networks in a specific country or region. The data used in this study, including historical express volumes, GDP, per capita disposable income, total retail sales of consumer goods, and other socio-economic indicators, were primarily obtained from the National Bureau of Statistics of China and the State Post Bureau of China. These sources are official and authoritative, providing reliable and comprehensive data for macroeconomic analysis. While any large-scale statistical data may have inherent limitations in granularity and reporting consistency, the use of nationally published data ensures a high degree of reliability and minimizes potential biases for the purpose of this macroscopic forecasting study. Over the past decade, China’s express delivery industry has experienced rapid growth alongside the development of the e-commerce sector. Coupled with shifts in consumer habits brought about by the COVID-19 pandemic, express delivery has become the primary source of revenue for the country’s postal industry. From 2007 to 2024, the demand for express delivery in China surged dramatically, reaching a volume of 175.08 billion parcels and generating revenue of 1.4 trillion yuan in 2024, accounting for 82.9% of the total postal industry revenue, as illustrated in Figure 2.
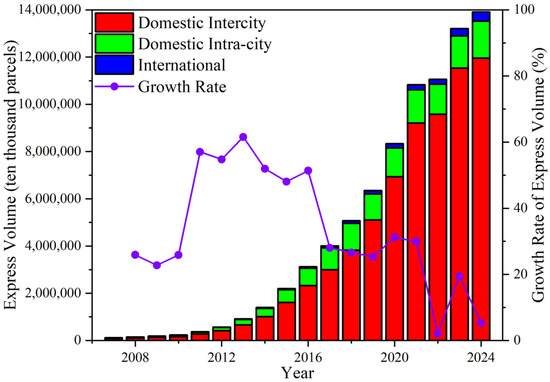
Figure 2.
Development of the express delivery industry in China.
Among these, domestic intercity express accounts for over 85% of the total express volume, with its proportion increasing annually. Since HSR express primarily handles domestic intercity business, this provides a solid data foundation for the present study.
Henan Province features a diverse range of industries, including agriculture, manufacturing, and services, all of which generate substantial transportation demand. HSR express is particularly suitable for goods with high timeliness requirements and moderate size, such as agricultural products, electronic components, and mechanical equipment. Consequently, Henan Province is a typical region in China with high demand for HSR express services.
In 2024, the express industry in Henan Province demonstrated significant growth, as shown in Figure 3. The total express volume reached 9.053 billion parcels, representing a year-on-year increase of 38.01%. This growth indicates continuously rising express demand in the province. Additionally, the revenue from express services rose markedly to 53.398 billion yuan, a year-on-year growth of 22.23%.
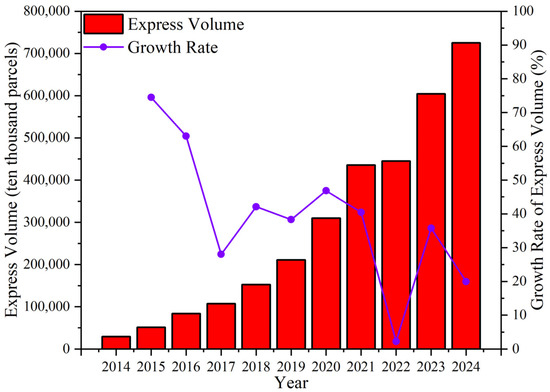
Figure 3.
Development of the express delivery industry in Henan.
Furthermore, Henan Province is located in central China and possesses a strategic geographical advantage, serving as a critical transportation hub connecting the eastern, southern, and western regions of the country. The express delivery system in Henan extensively serves the Central Plains Economic Zone and surrounding areas. Therefore, researching the HSR express freight volume in Henan is of considerable importance for both its own development and that of neighboring provinces.
4.2. Forecasting of Intercity Express Volume in China
According to official data from the National Bureau of Statistics, the total express volume in China from 2007 to 2024 is shown in Table 1. Based on this 18-year dataset, an analysis of influencing factors was conducted to project the intercity express volume in China up to the year 2035.

Table 1.
Historical data of express volume in China.
Based on the principles of urban economics, express delivery, as a transportation service, is primarily influenced by regional economic conditions, population, consumption habits, and transport capacity. GDP, per capita disposable income, total retail sales of consumer goods, the proportion of the tertiary industry, resident population, highway freight volume, and air freight volume were selected as influencing factors of express volume. These indicators represent regional production levels, income levels, consumption habits, industrial structure, total population, and express freight transportation capacity, respectively. Using grey relational analysis, the sequences of influencing factors were constructed as shown in Table 2, and the historical data of these factors are provided in Table 3.
Table 2.
Sequences of influencing factors for intercity express volume in China.
Table 3.
Historical data of influencing factors for intercity express volume in China.
Setting the grey resolution coefficient ρ = 0.5 to select the most influential factors. This value is a conventional and widely accepted benchmark in grey system theory for distinguishing factors with significant from moderate or weak correlations [22]. The grey relational degrees of each influencing factor relative to China’s intercity express volume were calculated using the data from Table 1 and Table 3. The results are presented in Table 4. Among the factors, per capita disposable income exhibited the strongest correlation with intercity express volume, while resident population showed the weakest. Influencing factors with a grey relational degree greater than 0.6 were selected as explanatory variables for the multiple regression model. Consequently, four indicators were chosen: per capita disposable income, GDP, total retail sales of consumer goods, and the proportion of the tertiary industry.
Table 4.
Grey relational degrees of influencing factors for intercity express volume in China.
A multiple regression analysis was conducted between China’s intercity express volume and its influencing factors using the data from Table 1 and Table 3. The results, presented in Table 5, indicate a goodness-of-fit (R2) of 0.97, which exceeds the 0.95 threshold. The multiple regression model exhibits a high goodness-of-fit on the historical data, demonstrating its strong explanatory power for intercity express volume. While the application of cross-validation or out-of-sample testing is constrained by the relatively limited length of the historical data series, the model’s consistent performance over the 18-year period provides confidence in its utility for strategic forecasting. To ensure the robustness of the regression model, variance inflation factors were calculated for all explanatory variables. All variance inflation factors were below 5, indicating that multicollinearity is not a significant concern that would destabilize the model or bias the coefficient estimates.
Table 5.
Results of the multiple regression analysis for intercity express volume in China.
Based on these influencing factors, time series methods were applied to forecast the explanatory variables, which were then substituted into the multiple regression model to project future intercity express volume and related influencing factors in China, as shown in Table 6.
Table 6.
Forecast results of intercity express volume and related influencing factors in China.
4.3. Calculation of HSR Express Mode Share in China
Based on the time-value differences in China’s express delivery services, the timeliness sensitivity coefficients were set as aj = 0.5, 5, 15 (Yuan/kg·h), representing the sensitivity levels for second-day delivery, next-day delivery, and same-day delivery services, respectively. The values of the timeliness sensitivity coefficients aj were set to reflect the substantial price differentials in the Chinese express market between different service tiers. These values ensure that the generalized cost model captures the high premium consumers and suppliers attach to faster delivery times, which is consistent with observed market pricing structures [23].
The monetary cost Ci(k) for the supply side of express delivery services was calculated. For road express, consider a heavy-duty truck with an initial value of 300,000 Yuan and a load capacity of 10 tons. The designed total travel distance is 1 million km, the insurance rate is 1%, the fuel consumption is 30 L/100 km, the diesel price is 7 Yuan/L, the daily wage for a driver covering 600 km/day is 1000 Yuan/day, the sum of other loading, unloading, management, and maintenance cost rates is 30%, and the empty load rate is 40%. Accordingly, the monetary cost for road express is given by Equation (8).
For HSR express, taking the Zhengzhou–Chongqing High-Speed Railway as an example, designated freight trains are used for bulk cargo transportation, with a single load capacity of 15 tons. Since existing train services are utilized, fixed costs FCi are not considered. It is assumed that the electricity consumption of freight trains is equivalent to that of passenger trains, with a consumption rate of 21.4 kWh/km. The industrial electricity price is 0.5 Yuan/kWh, the daily wage for a driver covering 2400 km/day is 1000 Yuan/day, the sum of other loading, unloading, management, and maintenance cost rates is 20%, and the empty load rate is 50%. Accordingly, the monetary cost for HSR express is given by Equation (9).
For air express, taking the Boeing 737 as an example, the aircraft procurement cost is assumed to be 550 million Yuan, with a designed service life of 25 years and an annual average flight time of 2500 h. The flight speed is 600 km/h, and the single load capacity is 16 tons. The insurance rate is 3.5%, the hourly fuel consumption is 2.5 tons, the unit price of aviation kerosene is 5000 Yuan/ton, and the pilot’s wage is 300 Yuan/hour. The sum of other loading, unloading, management, and maintenance cost rates is 30%, and the empty load rate is 40%. Accordingly, the monetary cost for air express is given by Equation (10).
Infrastructure construction constitutes the most substantial investment in transportation services. Thus, the prefecture-level city coverage rate of infrastructure effectively represents the service coverage level of a transport mode, and the on-time rates were set based on industry averages [24]. China has achieved complete road coverage at the prefecture level, allowing the coverage rate for road express to be considered 100%. In contrast, 32 cities in China still lack HSR access. HSR express delivery to these cities requires transshipment, resulting in an infrastructure coverage rate of 89.08%. By the end of 2024, the number of cities in China with air service had reached 258, corresponding to a coverage rate of 88.05%. Regarding service reliability, the current on-time rate for road express services in China is 90%. Owing to the high punctuality of dedicated HSR services, the on-time rate for HSR express is projected to align with that of HSR passenger transport, reaching 98%. The average on-time rate for Chinese airlines fluctuates between 60% and 90%; consequently, the on-time rate for air express is assumed to be 75%.
It is assumed that the transport speeds for road, rail, and air are 65 km/h, 300 km/h, and 600 km/h, respectively. The generalized costs from the supply side perspective for the three express modes under different timeliness sensitivity levels were calculated, as shown in Figure 4, and their corresponding mode shares are presented in Figure 5. It can be observed that on the supply side, in second-day delivery scenarios, HSR express possesses absolute competitiveness (with a mode share significantly exceeding 50%), offering economies of scale and high speed unattainable by road transport, alongside a definitive cost advantage over air express. In next-day and same-day delivery scenarios, the mode share of HSR express slightly declines as timeliness sensitivity increases; nevertheless, it remains a significant contributor in the market (with a mode share exceeding 30%).
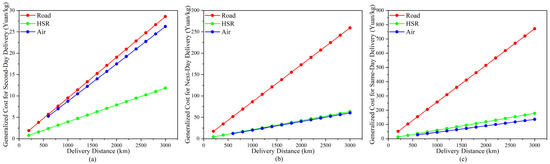
Figure 4.
Generalized costs of the three express modes from the supply side under different timeliness sensitivity levels: (a) Second-day delivery; (b) Next-day delivery; (c) Same-day delivery.
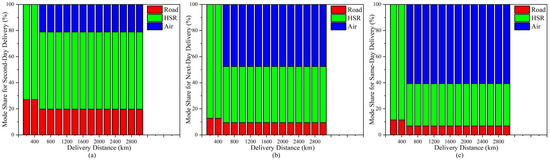
Figure 5.
Mode share of the three express modes from the supply side under different timeliness sensitivity levels: (a) Second-day delivery; (b) Next-day delivery; (c) Same-day delivery.
The monetary cost Ci(k) for the demand side of express delivery services was calculated. Taking a 5 kg parcel as an example, the consumer prices for road, HSR, and air express were determined based on the order placement prices in China’s express delivery market, as shown in Table 7.
Table 7.
Unit price per kilogram for the three express modes from the demand side.
Finally, the generalized costs from the demand side for the three express modes under different timeliness sensitivity levels were calculated, as shown in Figure 6, and their corresponding mode shares are presented in Figure 7. It can be observed that on the demand side, HSR express captures approximately 20% of the market share for distances exceeding 600 km. In second-day delivery scenarios, road express holds an absolute advantage. However, HSR express achieves a balance between transit time and cost at around 600 km, accounting for 18.4% of the market share. For distances beyond 1400 km, the mode share of HSR express gradually increases with distance, primarily due to its speed advantage over road transport for ultra-long-haul delivery. In next-day and same-day delivery scenarios on the demand side, HSR express compensates for the absence of air express services within 400 km, providing a more efficient and punctual solution for short-distance intercity delivery. For medium distances ranging from 400 km to 1000 km, HSR express stably occupies over 20% of the market share. Beyond 1000 km, HSR express does not exhibit disadvantages with increasing distance, maintaining a stable mode share of above 19%.
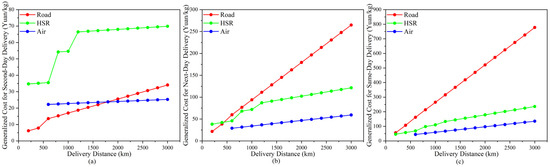
Figure 6.
Generalized costs of the three express modes from the demand side under different timeliness sensitivity levels: (a) Second-day delivery; (b) Next-day delivery; (c) Same-day delivery.
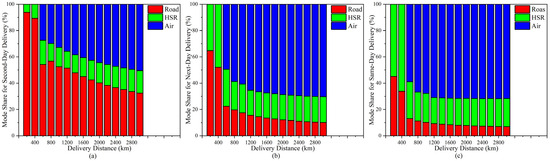
Figure 7.
Mode share of the three express modes from the demand side under different timeliness sensitivity levels: (a) Second-day delivery; (b) Next-day delivery; (c) Same-day delivery.
According to data from the State Post Bureau of China, the proportion of intercity express volume across different distance ranges is shown in Table 8, where “EC-EC” represents the volume share between East China and East China.
Table 8.
Share of Intercity Express Volume by Distance and Region.
Among these, second-day delivery accounts for 85%, next-day delivery for 10%, and same-day delivery for 5%. Assuming that timeliness requirements and delivery distance are independently distributed, the projected HSR express volume from both the supply side and demand side for the years 2025 to 2035 can be derived based on the forecasted intercity express volume in China, as shown in Figure 8.
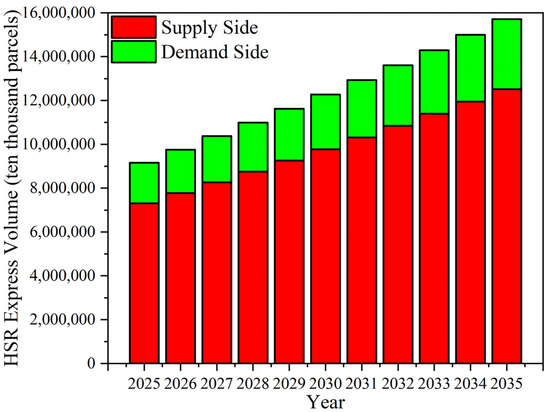
Figure 8.
Forecast results of HSR express volume in China.
A significant market disparity exists for HSR express between the supply side and the demand side, which is attributed to differences in their generalized costs. Sensitivity analysis was employed to investigate the underlying reasons:
- A 40% decrease in the unit price per kilogram for HSR express on the demand side;
In the long term, with the development of HSR express services, it is possible to reduce the order placement price for HSR express by optimizing routes, improving efficiency, and reducing costs. When the price reduction reaches 40%, the mode share of HSR express increases to varying degrees under second-day, next-day, and same-day delivery scenarios, as shown in Figure 9. This suggests that the order placement price is a major factor constraining consumer choice of HSR express.
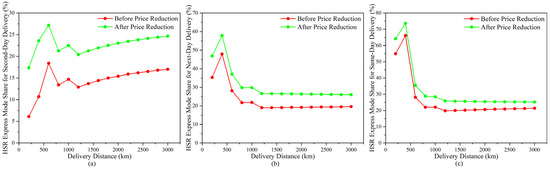
Figure 9.
Comparison of HSR express mode share after a 40% price reduction on the demand side: (a) Second-day delivery; (b) Next-day delivery; (c) Same-day delivery.
- 2.
- Increased dedicated infrastructure for HSR express on the supply side.
In the future, to facilitate larger-scale and more efficient HSR express services, more specialized and intensive equipment and infrastructure will be required to enhance loading capacity and handling efficiency. Two scenarios were considered: investing 300 million Yuan in purchasing dedicated HSR express trains and investing 3 billion Yuan in constructing HSR express logistics hubs. Under these scenarios, the mode share of HSR express decreased to varying degrees, as shown in Figure 10. This suggests that infrastructure cost is a major factor limiting the supply side’s choice of HSR express. Furthermore, by comparing the two scenarios—purchasing dedicated trains versus constructing logistics hubs—it was found that the cost of purchasing dedicated trains has a smaller impact on the mode share of HSR express on the supply side.
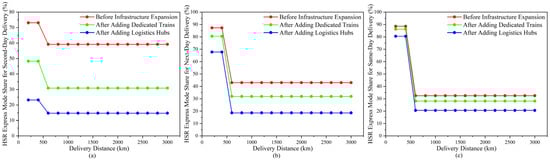
Figure 10.
Comparison of HSR express mode share after infrastructure expansion on the supply side: (a) Second-day delivery; (b) Next-day delivery; (c) Same-day delivery.
The significant cost disparity between the supply and demand sides of HSR express creates substantial profit potential for related enterprises. Professional operators can consolidate individual and small-batch express orders into large-scale, centralized transportation tasks through scaled and specialized warehousing and intermodal services. This integration enhances the operational efficiency and service level of HSR express, while simultaneously reducing order placement costs for consumers and increasing infrastructure utilization rates on the supply side.
4.4. Allocation of HSR Express Volume in Henan
Based on intercity express attraction, the forecasted national HSR express volume was allocated among city pairs to determine the HSR express volume for individual cities. The intercity express attraction was calculated using the total retail sales of consumer goods, GDP, and the distance between cities in China. The express attraction between selected Chinese cities is shown in Table 9.
Table 9.
Express attraction between selected Chinese cities.
The total express attraction among all Chinese cities was calculated to be 1,591,974.93. The total express attraction from Henan Province to other cities was 78,071.19, while the total express attraction from other cities to Henan Province was 67,075.62. The overall express attraction involving Henan Province accounts for approximately 9.12% of the national total. Based on the forecasted national HSR express volume, the HSR express volume for both the supply and demand sides in Henan Province from 2025 to 2035 was derived, as shown in Figure 11.
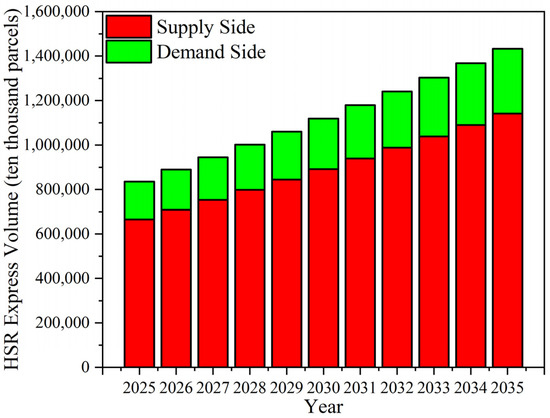
Figure 11.
Forecast results of HSR express volume in Henan.
Furthermore, based on the express attraction between Henan Province and other cities, the sending and receiving HSR express volumes between Henan and other cities from 2025 to 2035 were calculated, as shown in Figure 12.
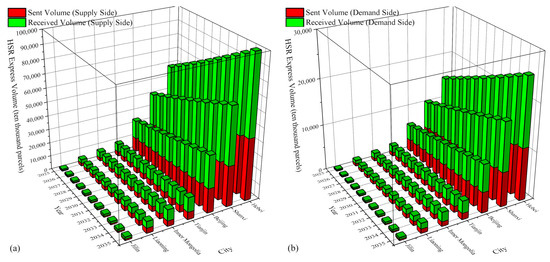
Figure 12.
Forecast results of sent and received HSR express volume between Henan and other cities: (a) Supply side; (b) Demand side.
5. Conclusions
This study addresses the potential and allocation of HSR express within domestic intercity delivery by developing and implementing an integrated methodology covering volume forecasting, mode competition, and intercity allocation. Using grey relational analysis and multiple regression, national intercity express demand was projected. A generalized cost-based Logit model evaluated the mode share among road, HSR, and air transport. A gravity model was then applied to allocate the national HSR express volume among city pairs. The method was applied and validated using Henan Province as a case study, accompanied by several sensitivity scenario analyses. The promotion of HSR express, as forecasted in this study, aligns with strategic goals for sustainable logistics. The modal shift from road and air transport to electrified HSR has the inherent potential to reduce the carbon footprint of the express delivery industry, a significant environmental co-benefit that underscores the importance of its development. It is important to note that our forecasts are based on a set of key assumptions. These include the continuation of historical socio-economic growth trends, the stable evolution of technology adoption in the logistics sector, and a competitive landscape where the fundamental characteristics of road, HSR, and air transport remain relatively unchanged. While these assumptions provide a reasonable baseline for strategic forecasting, deviations in any of these areas could affect the actual outcomes. Consequently, the point forecasts presented should be interpreted as the most likely trajectory under current conditions, rather than precise predictions.
The main conclusions are as follows:
- Forecasting results indicate that China’s intercity express volume will continue growing from 2025 to 2035, forming a stable and considerable demand base for HSR express in the medium to long term. Based on the constructed model, both the national intercity express volume and the share of HSR express in 2035 will be significantly higher than current levels. Henan Province, as a central hub, accounts for a notable share within China’s HSR express network;
- Logit analysis from a generalized cost perspective shows that HSR express has significant competitiveness on the supply side in second-day delivery scenarios and on the demand side in short-distance next-day and same-day delivery contexts. Overall, differing cost structures lead to divergent preferences: suppliers prefer HSR for medium-to-long distances with lower timeliness requirements, while consumers prefer it for shorter distances with higher timeliness demands;
- Sensitivity analysis reveals that reducing consumer order prices significantly increases the mode share of HSR express on the demand side. Regulators and operators should encourage business models that achieve economies of scale, as a reduction in end-user prices is the most effective lever to boost HSR express demand. This could be facilitated through subsidies for initial market cultivation or support for service consolidation. Expanding dedicated infrastructure, such as trains or terminals on the supply side, can improve capacity but involves high upfront investment; the impact on mode share depends on the scale of investment and utilization efficiency. Investors and railway operators must carefully evaluate the trade-offs involved in dedicated infrastructure. The construction of dedicated HSR express logistics hubs shows a more significant impact on costs than the procurement of dedicated trains. Therefore, priority should be given to investments that maximize network utilization and loading efficiency.
Based on the findings and limitations of this study, future research should focus on:
- A comparative analysis with actual operational outcomes or forecasts from alternative methods was not feasible in this study, as HSR express services in China are still in their infancy and lack a substantial historical dataset. As the industry matures, such comparisons will become a vital avenue for future model validation and refinement;
- The gravity model could be refined by incorporating additional determinants of freight flow, such as industrial structure complementarity between cities or the capacity of intermodal logistics facilities, to move beyond the core economic and geographic variables used in this study [25].
Author Contributions
Conceptualization, L.X., G.Y. and H.H.; methodology, L.X. and L.D.; software, L.X., G.Y. and L.D.; validation, H.H. and L.D.; formal analysis, L.X., G.Y. and L.D.; investigation, L.X., G.Y. and L.D.; resources, L.X. and G.Y.; data curation, H.H. and L.D.; writing—original draft preparation, L.X., G.Y. and L.D.; writing—review and editing, H.H. and L.D.; visualization, L.X., G.Y. and L.D.; supervision, L.D.; project administration, L.D.; funding acquisition, L.X., G.Y. and L.D. All authors have read and agreed to the published version of the manuscript.
Funding
This work was funded by Henan Railway Construction & Investment Logistics Group Co., Ltd. under Grant SZ0100412.
Institutional Review Board Statement
Not applicable.
Informed Consent Statement
Not applicable.
Data Availability Statement
The data for each variable are obtained from the National Bureau of Statistics of China (https://www.stats.gov.cn/) (Accessed on 1 August 2025).
Conflicts of Interest
Author Liwei Xie is employed by Henan Railway Construction & Investment Logistics Group Co., Ltd. The company had no role in the design of the study; in the collection, analyses, or interpretation of data; in the writing of the manuscript, and in the decision to publish the results. Author Guoyong Yue is employed by Henan Railway Construction & Investment Group Co., Ltd. The company had no role in the design of the study; in the collection, analyses, or interpretation of data; in the writing of the manuscript, and in the decision to publish the results. This work was funded by Henan Railway Construction & Investment Logistics Group Co., Ltd. The funder had no role in the design of the study; in the collection, analyses, or interpretation of data; in the writing of the manuscript, and in the decision to publish the results.
Abbreviations
The following abbreviations are used in this manuscript:
| HSR | High-speed rail |
| GDP | Gross domestic product |
References
- Krauth, M.; Ribesmeier, M.; Bešinović, N. Optimising mode choice in a bi-modal freight network considering sustainability and urban logistic stakeholder perspectives. Transp. Res. Interdiscip. Perspect. 2025, 31, 101442. [Google Scholar] [CrossRef]
- Yu, S.; Jiang, Y. Network design and delivery scheme optimisation under integrated air-rail freight transportation. Int. J. Logist. Res. Appl. 2024, 27, 411–427. [Google Scholar] [CrossRef]
- Cai, D.; Xiao, Y.; Jiang, C. Competition between high-speed rail and airlines: Considering both passenger and cargo. Transp. Policy 2021, 110, 379–393. [Google Scholar] [CrossRef]
- Lu, T.; Chen, J.; Zhao, C.; Xie, X. Optimization of high-speed rail express transportation plan considering products’ variable time requirements. Appl. Sci. 2023, 13, 6919. [Google Scholar] [CrossRef]
- Chen, D.; Peng, S.; Lian, F.; Yang, Z. Optimization of a Japan-Europe multimodal transportation corridor. Transp. Res. Part A Policy Pract. 2023, 175, 103782. [Google Scholar] [CrossRef]
- Gong, X.; Li, Z.C. Determination of subsidy and emission control coverage under competition and cooperation of China-Europe Railway Express and liner shipping. Transp. Policy 2022, 125, 323–335. [Google Scholar] [CrossRef]
- Xu, N.; Gong, Y.; Bai, J. Adaptive Grey Prediction Model with Application to Demand Forecasting of Chinese Logistics Industry. J. Grey Syst. 2019, 31, 128–139. [Google Scholar]
- Kim, E.; Amarbayasgalan, T.; Jung, H. Efficient Weighted Ensemble Method for Predicting Peak-Period Postal Logistics Volume: A South Korean Case Study. Appl. Sci. 2022, 12, 11962. [Google Scholar] [CrossRef]
- Ren, S.; Guo, B.; Cao, L.; Li, K.; Liu, J.; Yu, Z. DeepExpress: Heterogeneous and coupled sequence modeling for express delivery prediction. ACM Trans. Intell. Syst. Technol. 2022, 13, 1–22. [Google Scholar] [CrossRef]
- Xiong, C.; Wu, L. Prediction of China’s express business volume based on FGM (1, 1) model. J. Math. 2021, 2021, 8585238. [Google Scholar] [CrossRef]
- Ma, F.; Wang, S.; Xie, T.; Sun, C. Regional Logistics Express Demand Forecasting Based on Improved GA-BP Neural Network with Indicator Data Characteristics. Appl. Sci. 2024, 14, 6766. [Google Scholar] [CrossRef]
- Huang, W.; Yin, Y.; Li, H.; Xie, A.; Fan, Y. High-speed railway express delivery volume forecast based on data-driven ensemble forecast approaches: The China case. Expert Syst. Appl. 2024, 258, 125196. [Google Scholar] [CrossRef]
- Zhao, F.; Shang, H.; Li, T. Evolutionary dynamics of the travel mode choice behavior based on the replicator-mutator model. Chin. J. Phys. 2025, 93, 221–232. [Google Scholar] [CrossRef]
- Xin, D.; Ma, T. Commuter Travel Behavior Modeling in Metropolitan Areas Based on Cumulative Prospect Theory: A Case Study of Xi’an, China. Complexity 2024, 2024, 8867264. [Google Scholar] [CrossRef]
- Zhou, Y.; Wang, P.; Zheng, S.; Zhao, M.; Lam, W.H.; Chen, A.; Sze, N.; Chen, Y. Modeling dynamic travel mode choices using cumulative prospect theory. Transp. Res. Part A Policy Pract. 2024, 179, 103938. [Google Scholar] [CrossRef]
- Duan, H.; Ye, Y.; Lei, Z.; Wang, M. Express delivery logistics with high-speed railway: A perspective of payment scheme and forecast information sharing. Complex Intell. Syst. 2023, 9, 2379–2391. [Google Scholar] [CrossRef]
- Bi, M.; He, S. Express delivery with high-speed railway: Definitely feasible or just a publicity stunt. Transp. Res. Part A Policy Pract. 2019, 120, 165–187. [Google Scholar] [CrossRef]
- Liang, X.H.; Tan, K.H. Market potential and approaches of parcels and mail by high speed rail in China. Case Stud. Transp. Policy 2019, 7, 583–597. [Google Scholar] [CrossRef]
- Uyanık, T.; Karatuğ, Ç.; Arslanoğlu, Y. Machine learning approach to ship fuel consumption: A case of container vessel. Transp. Res. Part D Transp. Environ. 2020, 84, 102389. [Google Scholar] [CrossRef]
- James, A.T.; Asjad, M.; Panchal, R. Purchase decision making of garage equipment using an integrated fuzzy AHP and grey relation analysis method. Grey Syst. Theory Appl. 2023, 13, 238–260. [Google Scholar] [CrossRef]
- Rong, C.; Ding, J.; Li, Y. An interdisciplinary survey on origin-destination flows modeling: Theory and techniques. ACM Comput. Surv. 2024, 57, 1–49. [Google Scholar] [CrossRef]
- Chen, Z.; Liang, G.; Chen, Y.; Yang, X.; Liu, Y. Study on the risk assessment of Pedestrian-Vehicle conflicts in channelized Right-Turn lanes based on the Hierarchical-Grey Entropy-Cloud model. Accid. Anal. Prev. 2024, 205, 107664. [Google Scholar] [CrossRef]
- Liang, X.; Wang, Y. Business strategy for high-speed rail in the express delivery sector: A case study of China using a bilevel programming method. J. Rail Transp. Plan. Manag. 2021, 20, 100280. [Google Scholar] [CrossRef]
- Xu, K.; Wang, H.; Wang, Z.; Mei, K. Distribution justice and regional equity of urban public transport Services: Evidence from China. Transp. Res. Part D Transp. Environ. 2024, 126, 104033. [Google Scholar] [CrossRef]
- Bacher, P.; Klopp, J.M.; Ortbauer, M.; Lackner, M. The potential of combining passenger rail with freight: A New York City case study. J. Public Transp. 2024, 26, 100093. [Google Scholar] [CrossRef]
Disclaimer/Publisher’s Note: The statements, opinions and data contained in all publications are solely those of the individual author(s) and contributor(s) and not of MDPI and/or the editor(s). MDPI and/or the editor(s) disclaim responsibility for any injury to people or property resulting from any ideas, methods, instructions or products referred to in the content. |
© 2025 by the authors. Licensee MDPI, Basel, Switzerland. This article is an open access article distributed under the terms and conditions of the Creative Commons Attribution (CC BY) license (https://creativecommons.org/licenses/by/4.0/).