Article

Gamut Boundary Distortion Arises from Quantization Errors in Color Conversion

1
Changchun Institute of Optics, Fine Mechanics and Physics, Chinese Academy of Sciences, Changchun 130033, China
2
Daheng College, University of Chinese Academy of Sciences, Beijing 100049, China
3
Changchun Cedar Electronics Technology Co., Ltd., Changchun 130103, China
*
Author to whom correspondence should be addressed.
Appl. Sci. 2025, 15(20), 11278; https://doi.org/10.3390/app152011278
Submission received: 15 September 2025 / Revised: 11 October 2025 / Accepted: 13 October 2025 / Published: 21 October 2025

Abstract

This paper undertakes an in-depth exploration into the issue of quantization errors that occur during color gamut conversion within LED full-color display systems. To commence, a CIE-xyY colorimetric framework, which is customized to the unique characteristics of LED, is constructed. This framework serves as the bedrock for formulating the principles governing the operation of LED color gamuts. Subsequently, the conversions among diverse color spaces are scrutinized with great meticulousness. The core emphasis then shifts to dissecting how discrete control systems, in conjunction with quantization errors at low grayscale levels, precipitate the distortion of color gamut boundaries during the conversion process. The Laplacian operator is deployed to furnish a geometric comprehension of the distortion points, thereby delineating the topological discrepancies between the target and actual points. The quantitative analysis precisely delineates the correlation between quantization precision and the quantity of distortion points. The research endeavors to disclose the intricate relationships among quantization, color spaces, and colorimetric fidelity. This paper is conducive to the prospective calibration and rectification of LED display systems, furnishing a theoretical underpinning for the further enhancement of color reproduction in LED displays. Consequently, LED monitors can be rendered capable of satisfying the stringent accuracy requisites of advanced imaging and media.

1. Introduction

Color gamut, in the realm of display technology and color science, is defined as a collection that precisely demarcates the color range and boundaries of display devices or standards. It serves as a fundamental metric, akin to an exquisitely calibrated “ruler” which is extensively employed to quantitatively evaluate the efficacy of color presentation capabilities of display terminals. In the contemporary digital era, propelled by rapid technological advancements, LED terminal displays have garnered significant attention [1]. This is attributed not only to their inherent superior performance attributes, such as high luminance, enhanced contrast ratio, and energy-efficient characteristics, but also to their remarkable splicing flexibility. Particularly in diverse application scenarios involving spliced display screens, individual sub-display panels manifest a relatively discrete nature in terms of chromaticity distribution. In other words, each sub-display can be conceptualized as an independent “unit entity” possessing autonomous color representation capabilities and exhibiting a distinctive color presentation modality [2,3].
To ensure that the entire spliced display apparatus functions as an integrated and cohesive whole, capable of outputting coherent, accurate, and consistent color information to the external environment, it has become an essential and pivotal procedure to meticulously execute refined color gamut conversion operations on each sub-display panel in accordance with unified and universally recognized standard specifications [4].
With the meteoric development of display technology, color gamut standards have been in a state of perpetual evolution and renewal. In 1995, the International Telecommunication Union (ITU) promulgated the BT.709 color gamut standard [5]. Subsequently, in the following year, the sRGB standard emerged, finding extensive application in monitors, printers, and analogous devices. Despite the enduring dominance of the sRGB standard, the field is now being transformed by HDR (High Dynamic Range) technology, driven by relentless technological progress and escalating industry demands. This new standard stringently requires the BT.2020 color gamut and mandates the use of the PQ electro-optical transfer function curve from the Barton model, establishing itself as a formidable contender to sRGB [6,7]. This imposition has placed extremely stringent requirements on the control accuracy of display terminals during the color gamut conversion process.
As illustrated in the accompanying Figure 1, the fundamental process framework of color gamut conversion for display terminals is depicted. The color gamut conversion process is orchestrated by the control system of the display terminal. Essentially, it entails the mixing and reorganization of the original primary colors in precisely defined proportions to yield new primary colors. During this operation, the control system exhibits characteristics of discreteness and non-continuity, and the precision levels of different display terminal control systems vary considerably. Consequently, the quantization errors introduced during the conversion process also differ, potentially leading to issues such as inadequate or excessive color mixing when recombining colors, thereby resulting in a dispersed and suboptimal state of the final converted color gamut. Notably, such quantization errors are especially prominent in low grayscale displays, giving rise to significant color shifts that detrimentally impact the viewing experience.
In light of the above, this paper is centered on dissecting the color difference issues engendered by quantization errors associated with control system precision during the color space conversion process. Initially, a color gamut space model will be constructed for the display terminal, and the foundational principles of color gamut conversion will be elucidated. Subsequently, leveraging the Laplace operator, the color deviations induced by quantization errors will be computed. On this basis, an in-depth analysis will be conducted to explore the trends of quantization errors under varying control precisions and grayscale levels, as well as to elucidate the impact of distortion.

2. Establishment of Color Gamut Model and Conversion Model

2.1. Establishment of RGB–xyY Model

In the context of self-luminous displays, various colors are generated based on the colorimetric principle of additive mixture using three primary colors. Accordingly, display system design involves selecting appropriate proportions of these primary colors to reproduce target colors, with the reproducible color area—defined as the color gamut—being the internal region of the triangle formed by the primary colors. Colors within the color gamut can be reproduced, while those outside cannot be displayed. According to Grassmann’s laws of color mixing in colorimetry, selecting three primary colors and a specific white point as a standard allows us to calculate the relative luminance units of the primary colors [8]. Any light within the spectrum can then be synthesized by mixing different amounts of the three primary colors, where the amounts required are the tristimulus values of that color. To ensure that images or videos display consistent color effects across different devices, establishing color gamut models and performing color gamut conversion are crucial. Since different display devices have varying color gamut ranges, color gamut conversion is necessary to adapt content for different equipment. It is important to note that the red, green, and blue primary colors R , G , B used in display systems differ from the three primary colors X , Y , Z in the CIE colorimetric system [9]. To simplify calculations and avoid alternating positive and negative values, the CIE introduced the international standard colorimetric system in 1931 [10]. The CIE XYZ 1931 colorimetric system employs three imaginary primary colors. By matching equal-energy white light, the units of these primary colors are determined. When quantitatively expressing the luminance and chromaticity of a light source, the colorimetric equations can be expressed as [11,12]
C c = X x + Y y + Z z
Here, X , Y , Z are the tristimulus values, and the tristimulus values of a mixed color are the sum of its components. The luminance expression for a specific white point is
L w = c 1 L R + c 2 L G + c 3 L B
where L R , L G , L B are the luminance values of the three primary colors for a specific pixel, L w is the white balance luminance of that pixel, and c 1 , c 2 , c 3 represent the luminance ratios of the primary colors under a given white point. According to the principles of colorimetry and the definition of the CIE xyY color space, the Y component among the tristimulus values represents the luminance of the white point in the CIE xyY color space. To simplify the form of the transformation matrix and make it easier to solve, we let
h 1 j = C j × x j h 2 j = C j × y j h 3 j = C j × z j
Let h be the vector under different primary color coordinates, and H be the matrix comprising the set of three primary color vectors. Then
H = C 1 x 1 C 2 x 2 C 3 x 3 C 1 y 1 C 2 y 2 C 3 y 3 C 1 z 1 C 2 z 2 C 3 z 3
where x 1 , y 1 , z 1 are the chromaticity coordinates of the red primary color in the CIE xyY color space; x 2 , y 2 , z 2 correspond to green; and x 3 , y 3 , z 3 correspond to blue. The values vary depending on differences in the dominant wavelengths of the primary colors in different display standards. C 1 , C 2 , C 3 are coefficients to be determined. Substituting into the equations, we obtain
X Y Z = C 1 x 1 C 2 x 2 C 3 x 3 C 1 y 1 C 2 y 2 C 3 y 3 C 1 z 1 C 2 z 2 C 3 z 3 R G B
Here, X represents the color coordinates of the display measured for color performance, and Y is the display’s luminance. By transforming the tristimulus values into color space coordinates, we have
x = j = 1 3 C j x j I j 1 j = 1 3 ( C j x j + C j y j + C j z j ) I j 1 y = j = 1 3 C j y j I j 1 j = 1 3 ( C j x j + C j y j + C j z j ) I j 1 Y = j = 1 3 C j y j I j 1
In practical applications, to standardize the analysis of different displays’ color performance, the display’s chromaticity values are usually normalized.
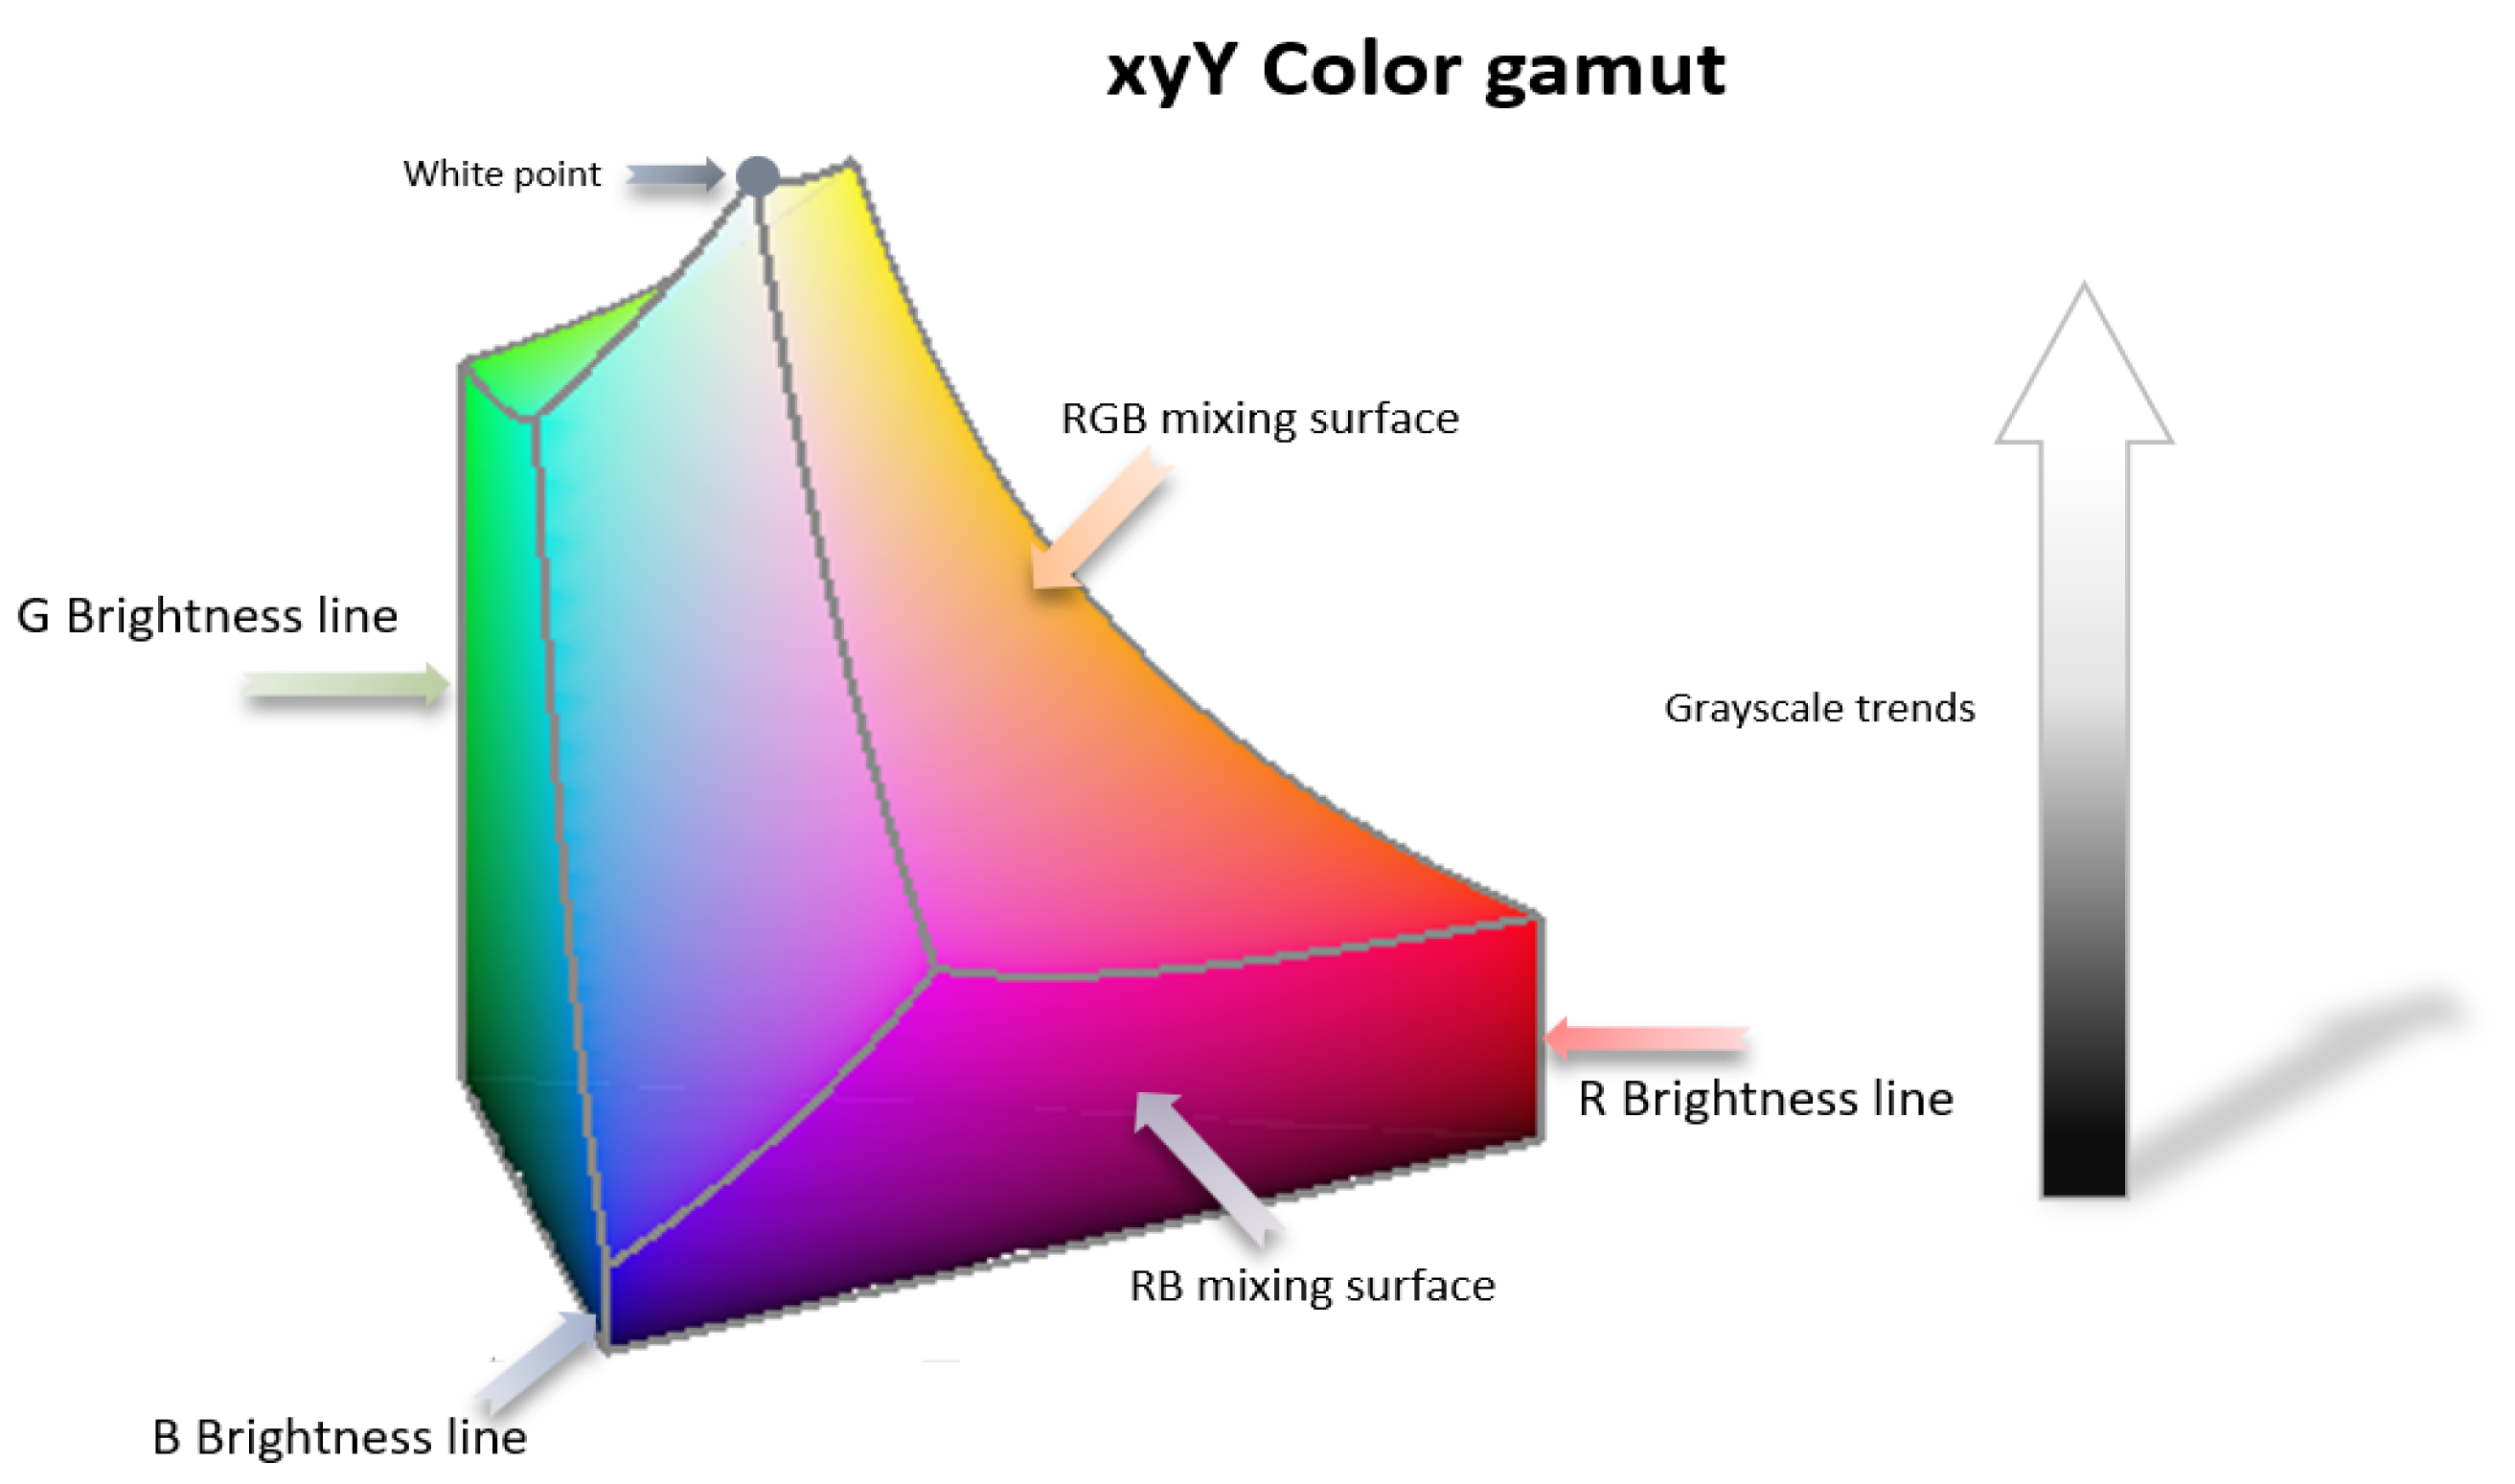
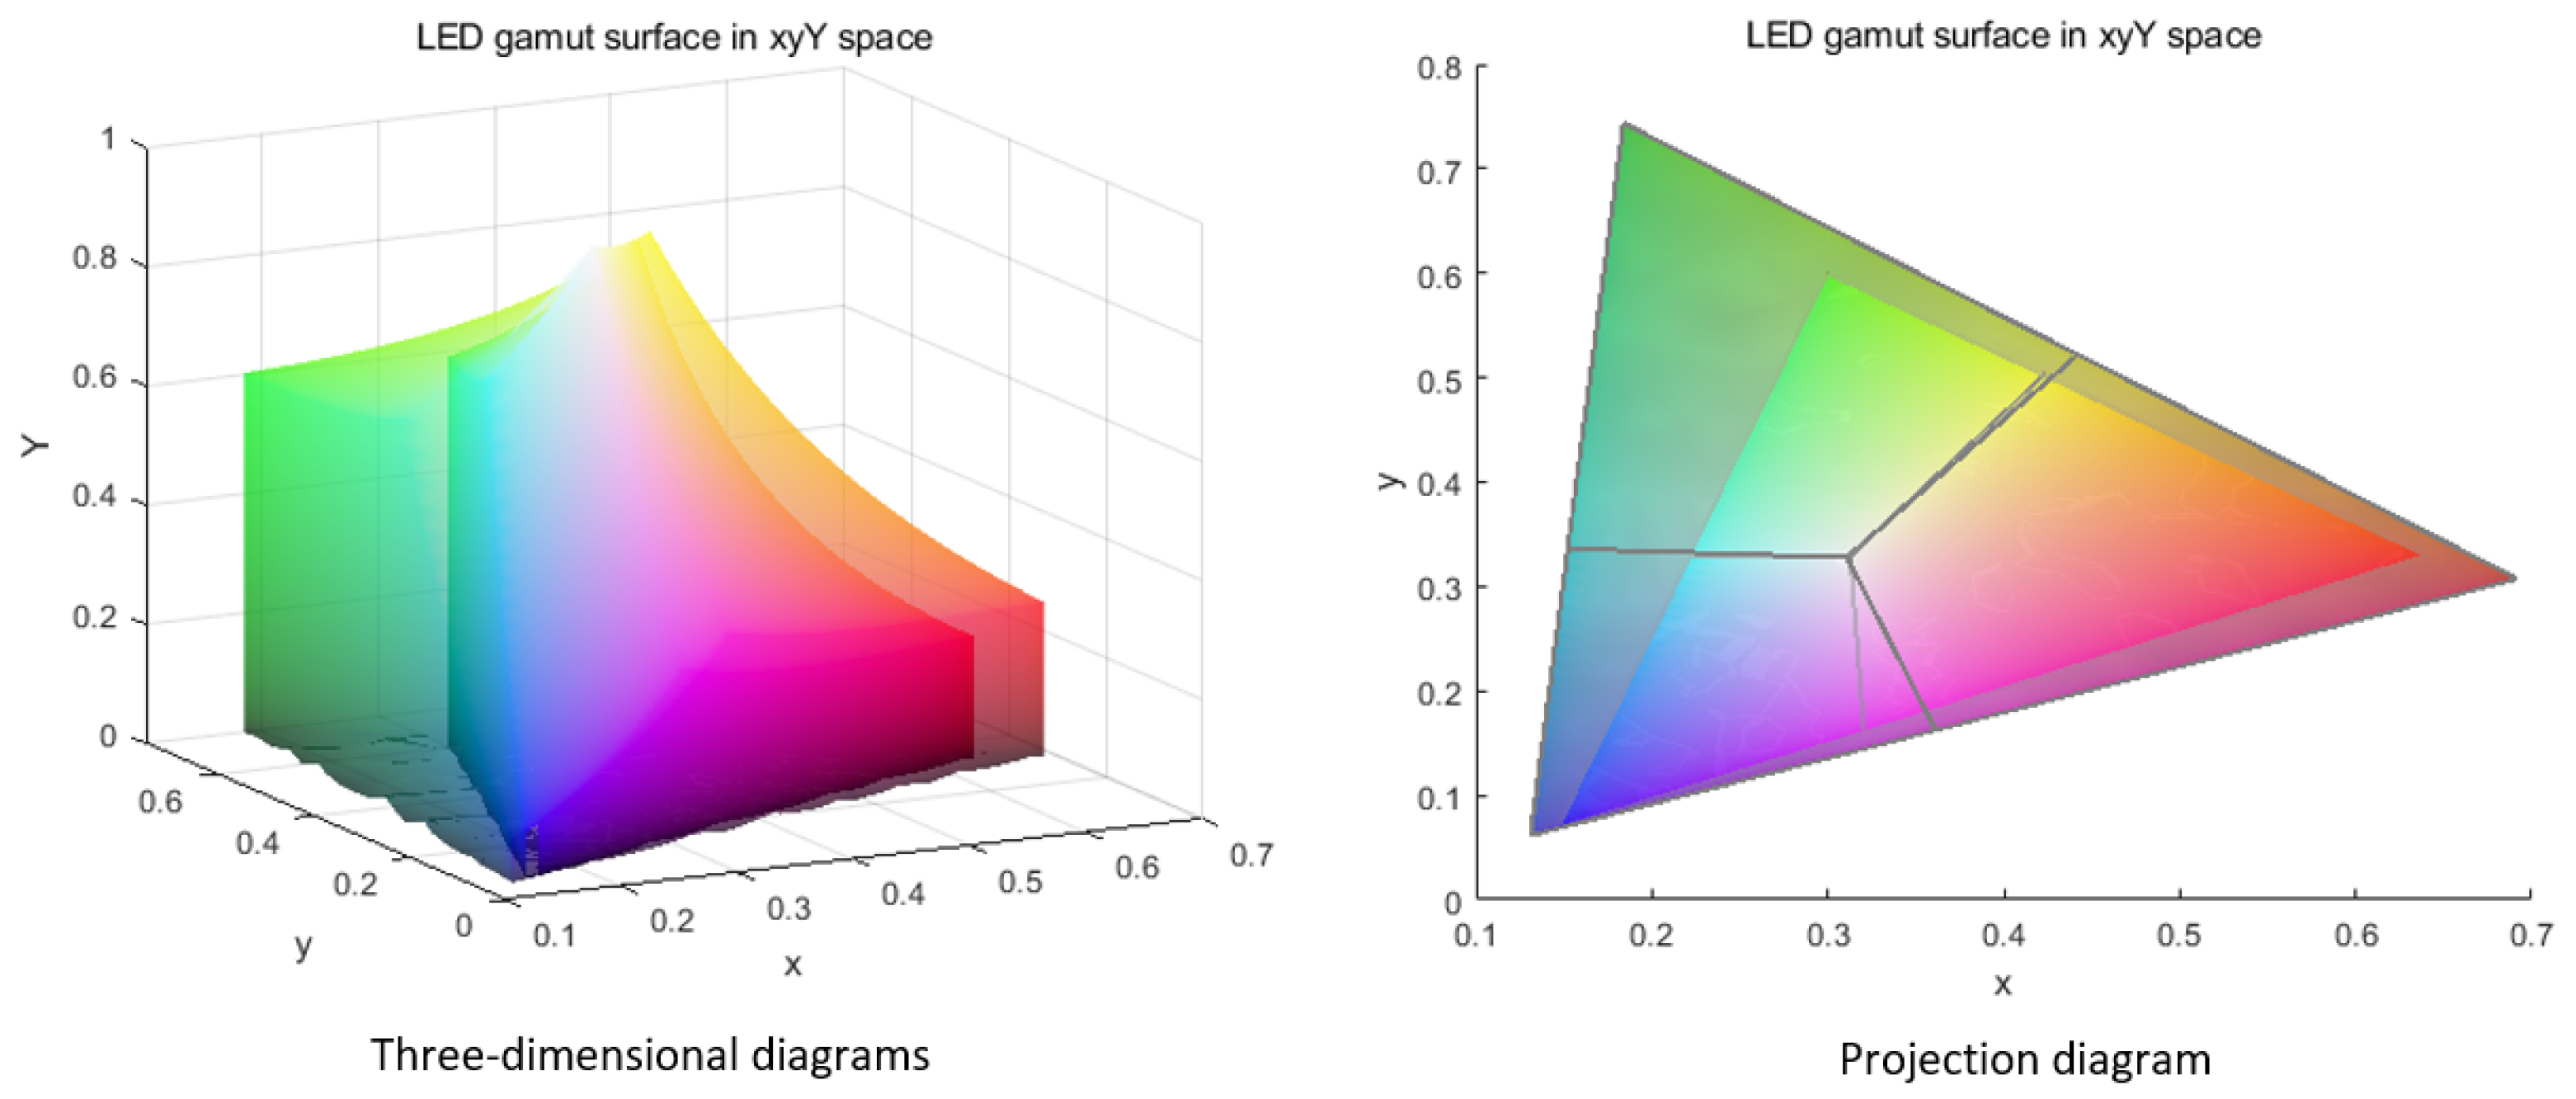
As shown in the Figure 2, the color gamut polyhedron projected on the xy plane yields the standard color triangle. The triangle’s vertices mark the most saturated red, green, and blue primaries, and its interior encompasses all achievable color mixtures. The central white point and the luminance sequence along the z-axis complete the system, with the sequence’s endpoints indicating the peak luminance. In the display control system, the system’s control precision determines the color depth, indicating the luminance levels the display can produce. By mixing primaries of different luminance levels, intermediate colors within the color gamut can be generated. All primary colors’ luminance levels are randomly combined to ultimately form a set of color points displayable on the screen—that is, the display terminal’s color gamut is essentially a geometric point set determined by the control system’s precision.

2.2. Establishment of XYZ–X’Y’Z’ Model for Color Gamut Conversion

Faithful color reproduction across displays with different primary color sets requires a cross-conversion of their respective color systems. This process transforms the tristimulus values of a color from one system into those of another, ensuring consistent visual representation. Currently, in the LED display industry, most input sources (images or videos) adopt the standard BT.709 or BT.2020 color gamut. However, due to physical limitations such as display mechanisms, luminous materials, and manufacturing processes, these standards usually cannot fully meet the target display’s color gamut requirements. Therefore, if the input source is played on a display terminal without specific mapping, it can lead to inaccurate or distorted display colors. Consequently, achieving consistent color gamut between the input signal and the display terminal has garnered significant attention from researchers [13].
For instance, when converting an image from a wide color gamut (like BT.2020) to a smaller gamut (like BT.709), colors in the wide gamut need to be mapped to the nearest colors in the smaller gamut to avoid distortion and overflow [14]. The specific conversion relationship between two color systems is
X = X r R + X g G + X b B Y = Y r R + Y g G + Y b B Z = Z r R + Z g G + Z b B
where X r , Y r , Z r are the amounts of X , Y , Z primaries needed to match one unit of the red primary, X g , Y g , Z g for green, and X b , Y b , Z b for blue.For the original color gamut, the standard color space mathematical equations using X , Y , Z are
X s t d = X r s t d R + X g s t d G + X b s t d B Y s t d = Y r s t d R + Y g s t d G + Y b s t d B Z s t d = Z r s t d R + Z g s t d G + Z b s t d B
Within the same color system, converting a non-standard color gamut space to the established standard color gamut space is the process of color gamut conversion. This process can be divided into two steps: chromaticity coordinate adjustment and luminance value adjustment. Chromaticity coordinate adjustment involves converting the discrete chromaticity coordinate values of the non-standard color gamut to the standard chromaticity coordinate values.
This involves mixing other primary colors into each non-standard primary color, for example, mixing green and blue into red, red and blue into green, and red and green into blue. The luminance direction is perpendicular to the chromaticity plane, and luminance adjustment modifies the luminance differences when displaying the same primary color.
Based on the above, when converting from a non-standard color gamut space to a standard space, the conversion equations for displaying the red primary are
X r = X r k 1 R + X g m 1 R + X b n 1 R Y r = Y r k 1 R + Y g m 1 R + Y b n 1 R Z r = Z r k 1 R + Z g m 1 R + Z b n 1 R
where X r , Y r , Z r are the tristimulus values after applying the color matching coefficients k 1 , m 1 , n 1 when displaying red. These coefficients adjust the non-standard red primary to the standard red primary. Similarly, the conversion equations for green are
X g = X r k 2 G + X g m 2 G + X b n 2 G Y g = Y r k 2 G + Y g m 2 G + Y b n 2 G Z g = Z r k 2 G + Z g m 2 G + Z b n 2 G
And for blue
X b = X r k 3 B + X g m 3 B + X b n 3 B Y b = Y r k 3 B + Y g m 3 B + Y b n 3 B Z b = Z r k 3 B + Z g m 3 B + Z b n 3 B
After converting the non-standard primaries, their tristimulus values should match those of the standard color space:
X r Y r Z r = X r s t d Y r s t d Z r s t d X g Y g Z g = X g s t d Y g s t d Z g s t d X b Y b Z b = X b s t d Y b s t d Z b s t d
The conversion parameters form a matrix:
T = k 1 k 2 k 3 m 1 m 2 m 3 n 1 n 2 n 3
By computing the values of k 1 , m 1 , n 1 , k 2 , m 2 , n 2 , k 3 , m 3 , n 3 , the matrix T can be expressed as
T = X r s t d X g X b Y r s t d Y g X b Z r s t d Z g X b X r X g X b Y r Y g X b Z r Z g X b X g s t d X g X b Y g s t d Y g X b Z g s t d Z g X b X r X g X b Y r Y g X b Z r Z g X b X b s t d X g X b Y b s t d Y g X b Z b s t d Z g X b X r X g X b Y r Y g X b Z r Z g X b X r X r s t d X b Y r Y r s t d X b Z r Z r s t d X b X r X g X b Y r Y g X b Z r Z g X b X r X g s t d X b Y r Y g s t d X b Z r Z g s t d X b X r X g X b Y r Y g X b Z r Z g X b X r X b s t d X b Y r Y b s t d X b Z r Z b s t d X b X r X g X b Y r Y g X b Z r Z g X b X r X g X r s t d Y r Y g Y r s t d Z r Z g Z r s t d X r X g X b Y r Y g X b Z r Z g X b X r X g X g s t d Y r Y g Y g s t d Z r Z g Z g s t d X r X g X b Y r Y g X b Z r Z g X b X r X g X b s t d Y r Y g Y b s t d Z r Z g Z b s t d X r X g X b Y r Y g X b Z r Z g X b
Thus, in the CIE xyY system, the conversion from the original color gamut to the target color gamut is
X Y Z s t d = T R G B X Y Z t a r g e t = X r X g X b Y r Y g Y b Z r Z g Z b X Y Z s t d
This paper investigates color gamut conversion where the target gamut is fully enclosed by the original as shown in the Figure 3. The study centers on a geometric analysis of the boundary distortion that arises in this process and introduces tailored solutions to address it.

3. Quantization Error Analysis

3.1. Quantization Color Difference Formula

The display terminals consist of pixels, and when performing color gamut conversion, each pixel’s color difference function model is fixed. As established in Section 2, each pixel’s color difference function model comprises a set of conversion matrix parameters. A set of color gamut conversion parameters includes nine parameters for each pixel. Taking the red conversion parameters of the i pixel as an example, they can be denoted as c o e f ( r r , i ) , c o e f ( g r , i ) , c o e f ( b r , i ) , c o e f ( r g , i ) , c o e f ( g g , i ) , c o e f ( b g , i ) , c o e f ( b r , i ) , c o e f ( b g , i ) , c o e f ( b b , i ) .
Each pixel’s color gamut conversion matrix depends on these nine discrete parameters, all within the range [0,1]. During color gamut conversion calculations, the control system’s discrete nature necessitates quantizing the computed data, with the specific quantization precision determined by the display device’s control precision as shown in the Figure 4. Suppose the correction parameters for the i pixel are
A i = c o e f ( r r , i ) c o e f ( g r , i ) c o e f ( b r , i ) c o e f ( r g , i ) c o e f ( g g , i ) c o e f ( b g , i ) c o e f ( r b , i ) c o e f ( g b , i ) c o e f ( b b , i )
Using colorimetric principles from Section 2, and mapping from the RGB to XYZ color space, we calculate the theoretical color gamut conversion parameters for each pixel. For instance, the transformed red primary color’s expression is
R t = c o e f ( r r , i ) R + c o e f ( g r , i ) G + c o e f ( b r , i ) B
Similarly, the expressions for the green and blue channels are
G t = c o e f ( r g , i ) R + c o e f ( g g , i ) G + c o e f ( b g , i ) B B t = c o e f ( r b , i ) R + c o e f ( g b , i ) G + c o e f ( b b , i ) B
Applying the mapping from the RGB to xyY color space and using the theoretical correction parameters, the actual color expressions after color gamut conversion for each pixel are
x i = c 1 x r y r ( i ) Q c o e f ( r r , i ) R + c 2 ( i ) x g y g Q c o e f ( g r , i ) G + c 3 ( i ) x b y b Q c o e f ( b r , i ) B z i = c 1 z r y r ( i ) Q c o e f ( r b , i ) R + c 2 ( i ) z g y g Q c o e f ( g b , i ) G + c 3 ( i ) z b y b Q c o e f ( b b , i ) B y i = 1 x i z i
Here, Q [ ] denotes the rounding function, which truncates fractional parts beyond the control precision, introducing quantization errors. c 1 ( i ) , c 2 ( i ) , c 3 ( i ) are constants from the RGB to XYZ color space transformation. Due to quantization errors, discrepancies arise between the actual and theoretical colors after color gamut conversion. The differences are
Δ x i = x i x i Δ y i = y i y i
Larger Δ x i , Δ y i values indicate more pronounced quantization errors, potentially causing the display’s color uniformity to fall below viewing standards. Thus, reducing these differences is essential to enhance the post-conversion display quality. Using the previous equations, we derive
Δ x i = c 1 x r y r ( i ) C r g , i 2 N R Q c o e f ( r r , i ) R + c 2 x g y g ( i ) C g r , i 2 N G Q c o e f ( g r , i ) G + c 3 x b y b ( i ) C b r , i 2 N B Q c o e f ( b r , i ) B
The calculation method for Δ y i is the same as that for Δ x i , so only the specific equation expression for Δ y i is given.
These equations simulate practical applications where the control system’s limited precision leads to truncating fractional parts during data processing, causing color differences. N represents the control system’s precision. Based on existing experimental equipment, we round off the fractional parts of the control system’s precision [15]. This paper employs a color difference formula [16,17]:
Δ E = Δ x i 2 + Δ y i 2 + Δ z i 2 .

3.2. Using the Laplace Operator to Describe Quantization Errors in Color Gamut Conversion

The Laplace operator is frequently employed by scholars to describe the objective laws revealed by experimental results due to its geometric significance. It is not merely a collection of symbolic formulas but offers geometric insights into experimental outcomes. The Laplace operator is a vital mathematical tool in various physical phenomena, including acoustics, optics, quantum mechanics, classical mechanics, thermodynamics, and electrostatics.The concept of the gradient is integral to understanding the Laplace operator [18]. In three-dimensional space, the gradient is
g r a d x , y , z = f = f x i + f y j + f z k
Under normal circumstances, Δ x 0 = Δ y 0 = Δ z 0 = σ . Therefore, the above formula can be expressed as
f x f ( x + σ , y , z ) f ( x , y , z )
Then, for the Y and Z axes, the formulas are as follows:
f y f ( x , y + σ , z ) f ( x , y , z ) f z f ( x , y , z + σ ) f ( x , y , z )
Thus, the gradient operator represents the slope at a point along the coordinate axes. Extending from the gradient, the Laplace operator measures the rate of change in the gradient, analogous to acceleration in classical mechanics. In three-dimensional space, the Laplace operator for a scalar function f ( x , y , z ) , x , y , z is defined as
2 f ( i , j , k ) f ( i + σ , j , k ) + f ( i σ , j , k ) + f ( i , j + σ , k ) + f ( i , j σ , k ) + f ( i , j , k + σ ) + f ( i , j , k σ ) 6 f ( i , j , k ) ) h 2
Here, h represents the step size in each coordinate direction of the three-dimensional coordinate system. From the above formulas and Equation (21), the Laplacian operator for the color difference function can be determined. The Laplacian operator offers an intuitive description of how adjacent color differences vary. By examining the distribution of Laplacian operator values during the conversion process—particularly the occurrences of abnormally large values—one can assess corresponding degrees of error. Based on the statistical results obtained from simulated conversions, and taking into account the human visual system’s tolerance for color differences, an appropriate threshold can be established. This threshold effectively distinguishes between normal conversion conditions and situations in which singularities arise.

4. Conclusion Analysis

4.1. Results Description

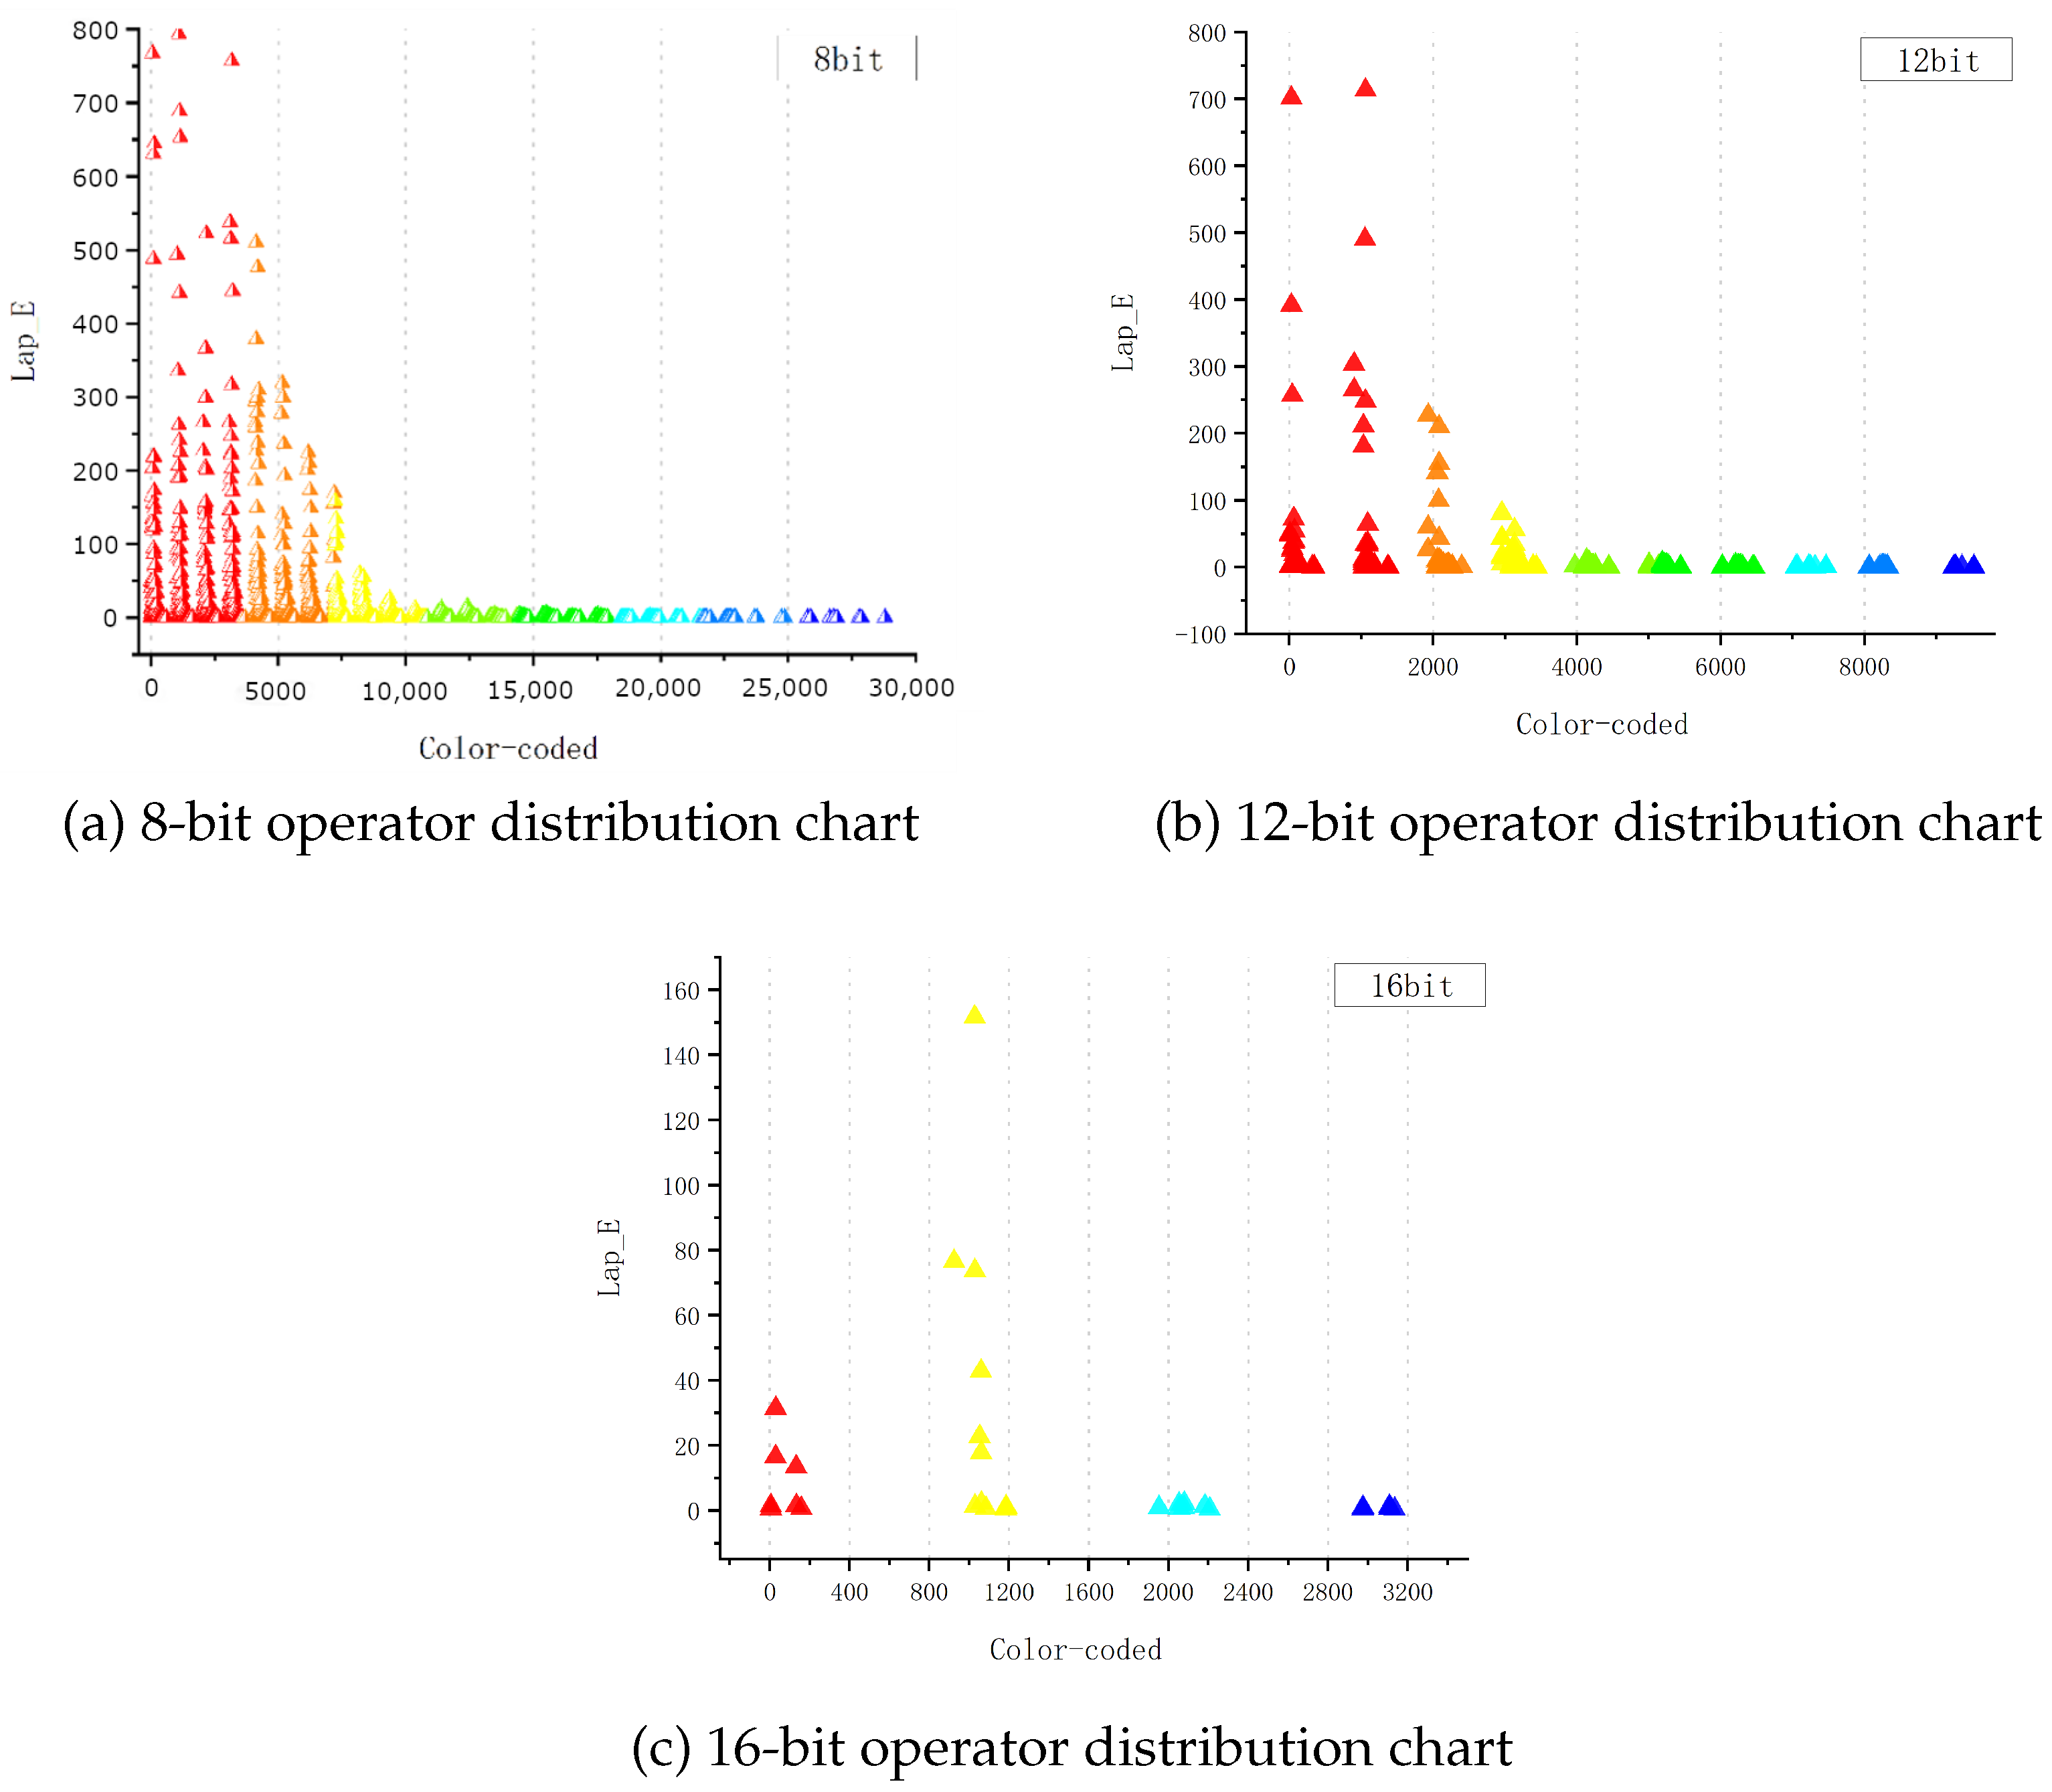
The experiment gradually enhanced the control system’s precision, beginning at a minimum of 8-bit precision and incrementally increasing to 12-bit, and ultimately reaching 16-bit. The effects of this precision enhancement on the color gamut conversion relative to the RGB gamut triangle are illustrated in experimental Figure 5. The primary color coordinates obtained after conversion at various control precisions are listed in the following Table 1.
It is evident from the primary color coordinates that the control system’s precision significantly influences the discrepancy between the post-conversion primary color coordinates and their target values. Higher precision leads to results closer to the ideal values. Since both the original and target gamuts are closed volumes, this study focuses solely on distortion issues at the boundaries during the conversion process. Three sets of experiments were conducted under 8-bit, 12-bit, and 16-bit control precision conditions, respectively.
For each set, the color points at the gamut boundaries were calculated and analyzed to determine how the boundary failed to converge under different control precisions. Following the methods described in Section 3, sets of singular points exceeding the tolerance range for color differences were identified. According to human visual characteristics, the Laplacian operator’s threshold was experimentally determined to be 0.4 [17,19,20]; points exceeding this threshold were classified as distortion points. The distributions of singular points in the target gamut, corresponding to the original gamut boundary under different control precisions, are shown in Figure 5.
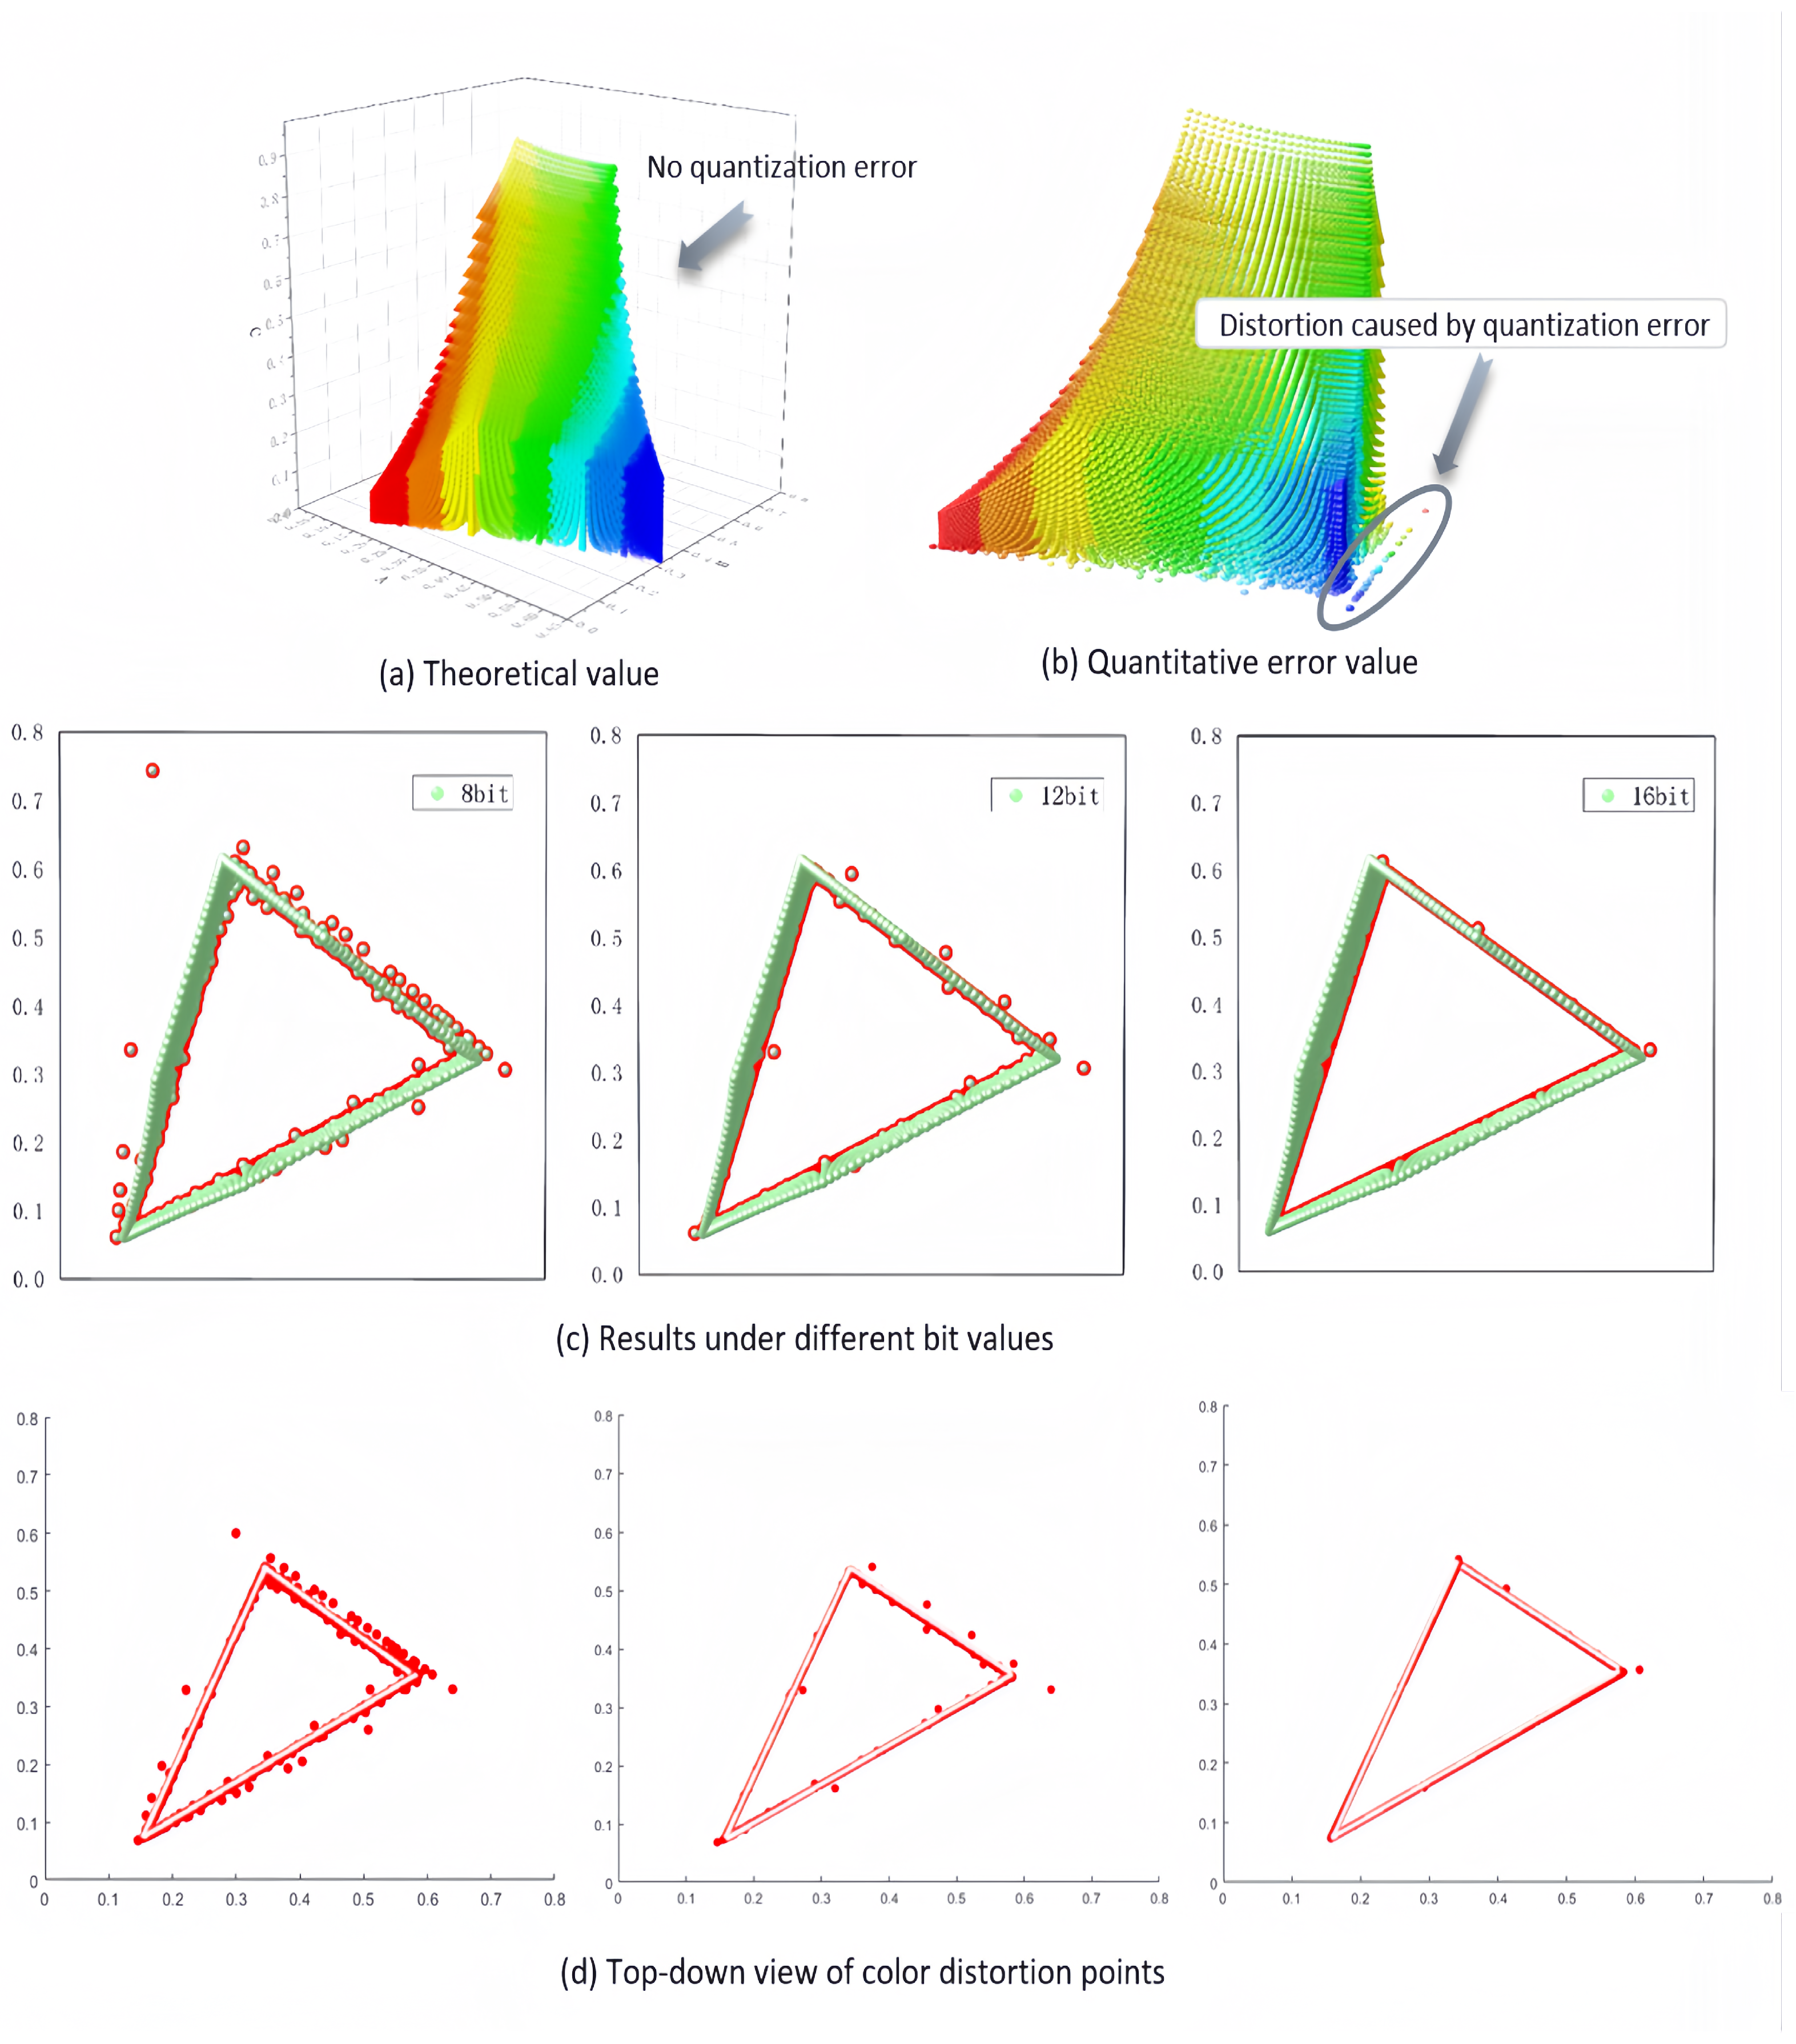
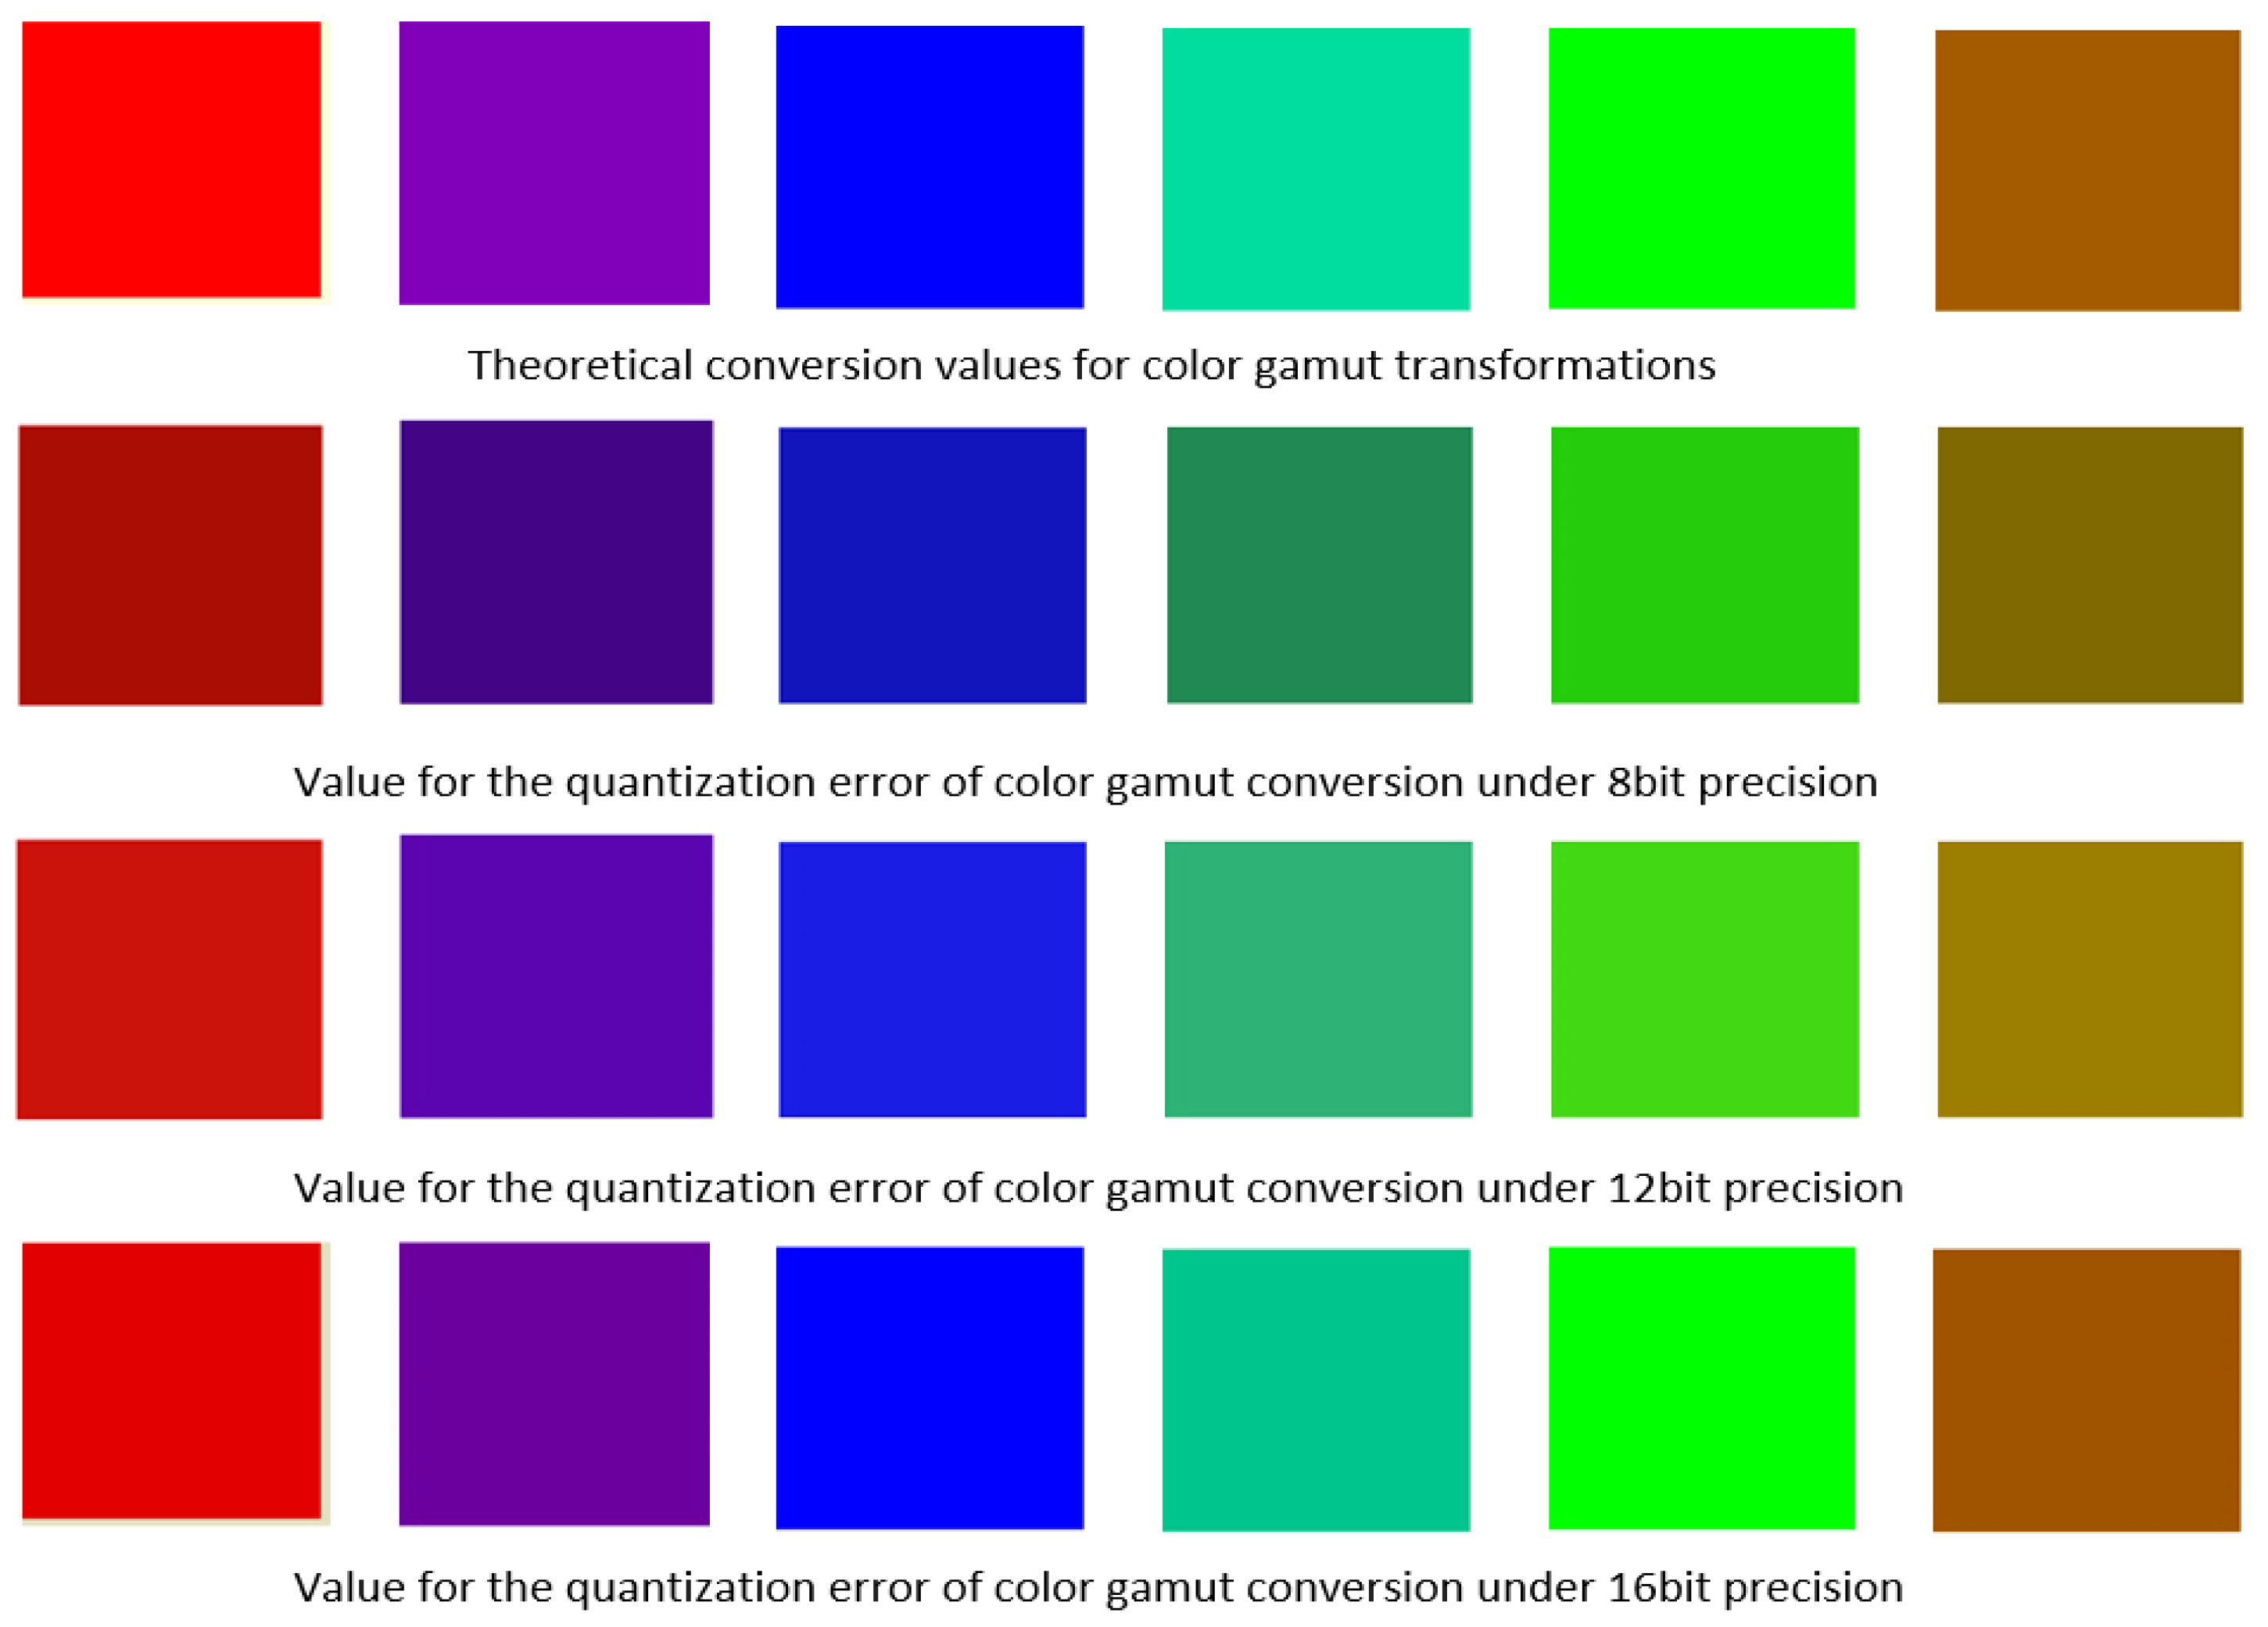
In Figure 6, pure green points indicate color points that can be normally converted within the acceptable error tolerance range. Points marked in red indicate those exceeding the permissible tolerance range and thus failing to converge accurately to the target gamut. From Figure 6, it is clear that as control precision improves, the number of singular points gradually decreases during the BT.2020-to-sRGB conversion. Under 8-bit precision, the proportion of the number of singular points is 10.14% of the entire gamut; under 12-bit precision, is 1.08%; under 16-bit precision, is 0.09%. Thus, it can be clearly observed that improved control precision markedly enhances conversion accuracy. A three-dimensional representation further illustrates that virtually all singular points are concentrated in the low-luminance (low gray-level) region, indicating that control precision has negligible influence on gamut conversion in high-luminance areas.
As shown, although the BT.2020 gamut fully encompasses the sRGB target gamut, many color points appear within the overlapping region of the two gamuts during actual conversions. Moreover, based on the distribution of singular points, the maximum number of singular points arise because they cannot be blended with the other two primary colors and thus revert to the original BT.2020 boundary. Consequently, they cannot converge properly, resulting in the largest observed errors. It is also evident in Figure 5 that as gray levels increase, the impact of quantization error on the conversion diminishes.

4.2. Solutions to the Distortion Problem

As illustrated in Figure 6, within the context of color gamut conversion, situations may arise where individual points cannot reach the target point using conventional color mixing techniques. This leads to trajectories that extend beyond the limits of the target color gamut. Consequently, this phenomenon results in boundary distortion after conversion, where certain colors exceed the display system’s representational capacity. Figure 7 depicts the primary colors—red, green, and blue—along with the mixed colors produced from each pair of primary colors in a 1:2 ratio. These colors serve as examples to highlight the actual effects of color discrepancies for common colors located at the boundary. By deriving the relevant formulas in Section 3 and analyzing the occurrence of boundary distortion during color gamut conversion, we establish a theoretical foundation for proposing solutions to this distortion issue. We then outline two viable solutions that will be the focus of our upcoming experimental investigations, which will be documented in future research and publications.
Chiefly, our focus is on enhancing the accuracy of the control system. By augmenting the precision of the control system, a more copious amount of data can be retained during the conversion operation. This, reciprocally, considerably meliorates the conversion outcomes, engendering a more sophisticated conversion process. Thereby, the theoretical efficacies during color mixing can be actualized, permitting the originally non-convergent color points to approach the projected values, as can be visually perceived through Figure 5. Secondly, an alternative stratagem entails augmenting the quantization precision whilst upholding the extant precision level of the control system. In consonance with the antecedent analytical deductions (21), it is manifest that the color difference instigated by quantization demonstrates an inverse proportionality to the quantization precision N. A higher magnitude of N functions to attenuate quantization errors. Ergo, amplifying the quantization precision constitutes a viable tactic for minimizing distortion and optimizing the application of correction parameters. In the preceding subsection, the Laplace operator was deployed to quantitatively delineate the geometric correlation between the distortion points and the target points, computing the distortion magnitudes and the aggregative loci of these distortion points. Through the apt adjustment of these distortion points, they can be compelled to converge towards the earmarked area. In the prospective research pursuits, further experimental scrutinies and profound deliberations regarding the adjustment of these distortion points will be instigated. In the current article, the emphasis is preponderantly circumscribed to the discourse of this distortion manifestation.

5. Conclusions

This paper analyzed the color gamut conversion of display terminals and the associated boundary distortion issues post-conversion. Initially, we established a geometric model of the display terminal’s color gamut based on colorimetric theory and display characteristics, analyzing and calculating the main parameters in color gamut conversion. Subsequently, we simulated the control system’s actual process during color gamut conversion using the geometric model, calculating the color differences introduced by system quantization errors. By introducing the Laplace operator, we analyzed color difference trends at different grayscale levels, providing a geometric description of color gamut boundary distortion. This offers valuable insights into improving quality during color gamut conversion.
However, this work analyzed only gamut conversions under identical white points and full containment of the target within the original gamut. It did not address partial overlaps, where conversion of non-overlapping regions depends primarily on the closest primary colors between the gamuts. From discussions in Section 3, we understand that quantization precision relates to the control system’s conversion accuracy, which directly impacts the complexity of the display system’s driver circuitry. Enhancing quantization precision increases circuit complexity and manufacturing costs while potentially reducing reliability. Therefore, indiscriminately increasing control system precision to improve quantization is inadvisable.
Additionally, quantization precision during color gamut conversion is influenced by the parameters of the conversion matrix, especially the ratio between diagonal and off-diagonal elements in the 3 × 3 matrix. Detailed analysis of these aspects requires further research. Given the complexity of color point distributions at the gamut boundary, accurately analyzing the impact of these parameters on boundary color points remains challenging. Identifying an optimal solution to address boundary distortion due to quantization errors is still elusive. Future research should delve deeper into these issues.

Author Contributions

J.L.: Conceptualization, Methodology, Validation, Investigation, Writing—original draft. X.Z.: Term, Conceptualization, Writing—review and editing, Supervision, Funding. Y.C. (Yu Chen): Term, Conceptualization, Methodology, Writing—review and editing, Supervision. F.L.: Writing—review and editing, Supervision. D.H.: Investigation, Visualization. H.C.: Funding acquisition, Supervision. J.C.: Software. Y.C. (Yufeng Chen): Validation. All authors have read and agreed to the published version of the manuscript.

Funding

This work was supported by the Changchun Science and Technology Talent SpeProject—Research on Key Technologies of Full-size Inverted COB LED Dome Display System. Task No. 23YQ15.

Data Availability Statement

Data underlying the results presented in this paper are not publicly available at this time but may be obtained from the authors upon reasonable request.

Acknowledgments

The authors would like to thank Hui Cao from Changchun Cedar Electronics Technology for his helpful comments on the manuscript.

Conflicts of Interest

Authors Xifeng Zheng, Yufeng Chen, Hui Cao and Yu Chen were employed by the company Changchun Cedar Electronics Technology Co., Ltd. The remaining authors declare that the research was conducted in the absence of any commercial or financial relationships that could be construed as a potential conflict of interest.

References

  1. Tsai, T.H.; Lin, S.W. FPGA-based control system for real-time driving of UHD Micro-LED display with color calibration. Integration 2024, 98, 102237. [Google Scholar] [CrossRef]
  2. Wen, Z.; Zhou, Z.; Liu, H.; Wang, Z.; Li, X.; Fang, F.; Wang, K.; Teo, K.L.; Sun, X.W. Color revolution: Toward ultra-wide color gamut displays. J. Phys. D Appl. Phys. 2021, 54, 213002. [Google Scholar] [CrossRef]
  3. Mantiuk, R.; Daly, S.; Kerofsky, L. Display adaptive tone mapping. ACM Trans. Graph. 2008, 27, 1–10. [Google Scholar] [CrossRef]
  4. Subramani, B.; Veluchamy, M. Bilateral tone mapping scheme for color correction and contrast adjustment in nearly invisible medical images. Color Res. Appl. 2023, 48, 748–760. [Google Scholar] [CrossRef]
  5. International Commission on Illumination (CIE). Recommendations on Uniform Color Spaces, Color-Difference Equations, Psychometric Color Terms; Bureau Central de la CIE: Vienna, Austria, 1978. [Google Scholar]
  6. Sugawara, M.; Choi, S.Y.; Wood, D. Ultra-High-Definition Television (Rec. ITU-R BT.2020): A Generational Leap in the Evolution of Television [Standards in a Nutshell]. IEEE Signal Process. Mag. 2014, 31, 170–174. [Google Scholar] [CrossRef]
  7. Chen, H.W.; Lee, J.H.; Lin, B.Y.; Chen, S.; Wu, S.T. Liquid crystal display and organic light-emitting diode display: Present status and future perspectives. Light-Sci. Appl. 2018, 7, 17168. [Google Scholar] [CrossRef] [PubMed]
  8. Ajito, T.; Ohsawa, K.; Obi, T.; Yamaguchi, M.; Ohyama, N. Color conversion method for multiprimary display using matrix switching. Opt. Rev. 2001, 8, 191–197. [Google Scholar] [CrossRef]
  9. Sharma, G.; Rodriguez-Pardo, C.E. Geometry of Multiprimary Display Colors I: Gamut and Color Control. IEEE Access 2021, 9, 96573–96597. [Google Scholar] [CrossRef]
  10. Takeuchi, M.; Sakamoto, Y.; Yokoyama, R.; Sun, H.; Matsuo, Y.; Katto, J. Gamut-Extension Methods Considering Color Information Restoration. IEEE Access 2019, 7, 80146–80158. [Google Scholar] [CrossRef]
  11. Stiles, W.; Burch, J.M. Interim Report to the Commission Internationale de l’Eclairage, Zurich, 1955, on the National Physical Laboratory’s Investigation of Colour-matching (1955). Opt. Acta Int. J. Opt. 1955, 2, 168–181. [Google Scholar] [CrossRef]
  12. Li, T.; Yao, B.; Zhu, L.; Deng, L.; Yang, Y.; Chen, Y.; Xu, L.; Gu, C. Color gamut extension algorithm for various images based on laser display. Opt. Express 2024, 32, 3891–3911. [Google Scholar] [CrossRef] [PubMed]
  13. Rodriguez-Pardo, C.E.; Sharma, G.; Speigle, J.; Feng, X.F.; Sezan, I. Efficient Computation of Display Gamut Volumes in Perceptual Spaces. In Proceedings of the 19th Color and Imaging Conference—Color Science and Engineering Systems, Technologies, and Applications, San Jose, CA, USA, 7–11 November 2011; pp. 132–138. [Google Scholar]
  14. Wyszecki, G.; Stiles, W.S. Color Science: Concepts and Methods, Quantitative Data and Formulae; John Wiley & Sons: Hoboken, NJ, USA, 2000. [Google Scholar]
  15. He, G.; Zheng, L. A model for LED spectra at different drive currents. Chin. Opt. Lett. 2010, 8, 1090–1094. [Google Scholar] [CrossRef]
  16. Brainard, D.H. Color Appearance and Color Difference Specification. In The Science of Color, 2nd ed.; Elsevier: Amsterdam, The Netherlands, 2003; pp. 191–216. [Google Scholar] [CrossRef]
  17. Luo, M.R.; Xu, Q.; Pointer, M.; Melgosa, M.; Cui, G.; Li, C.; Xiao, K.; Huang, M. A comprehensive test of colour-difference formulae and uniform colour spaces using available visual datasets. Color Res. Appl. 2023, 48, 267–282. [Google Scholar] [CrossRef]
  18. Liu, D.; Xu, G.; Zhang, Q. A discrete scheme of Laplace–Beltrami operator and its convergence over quadrilateral meshes. Comput. Math. Appl. 2008, 55, 1081–1093. [Google Scholar] [CrossRef]
  19. Kaiser, P.K.; Boynton, R.M. Human Color Vision; Optical Society of America: Washington, DC, USA, 1996. [Google Scholar]
  20. Xiaoyu, S.; Min, H.; Gong, X.; Wang, D.; Li, X.; Liu, Y. Optimization and Calculation of Acceptable Color Difference for Printed Samples. Acta Opt. Sin. 2025, 45, 0133001. [Google Scholar] [CrossRef]
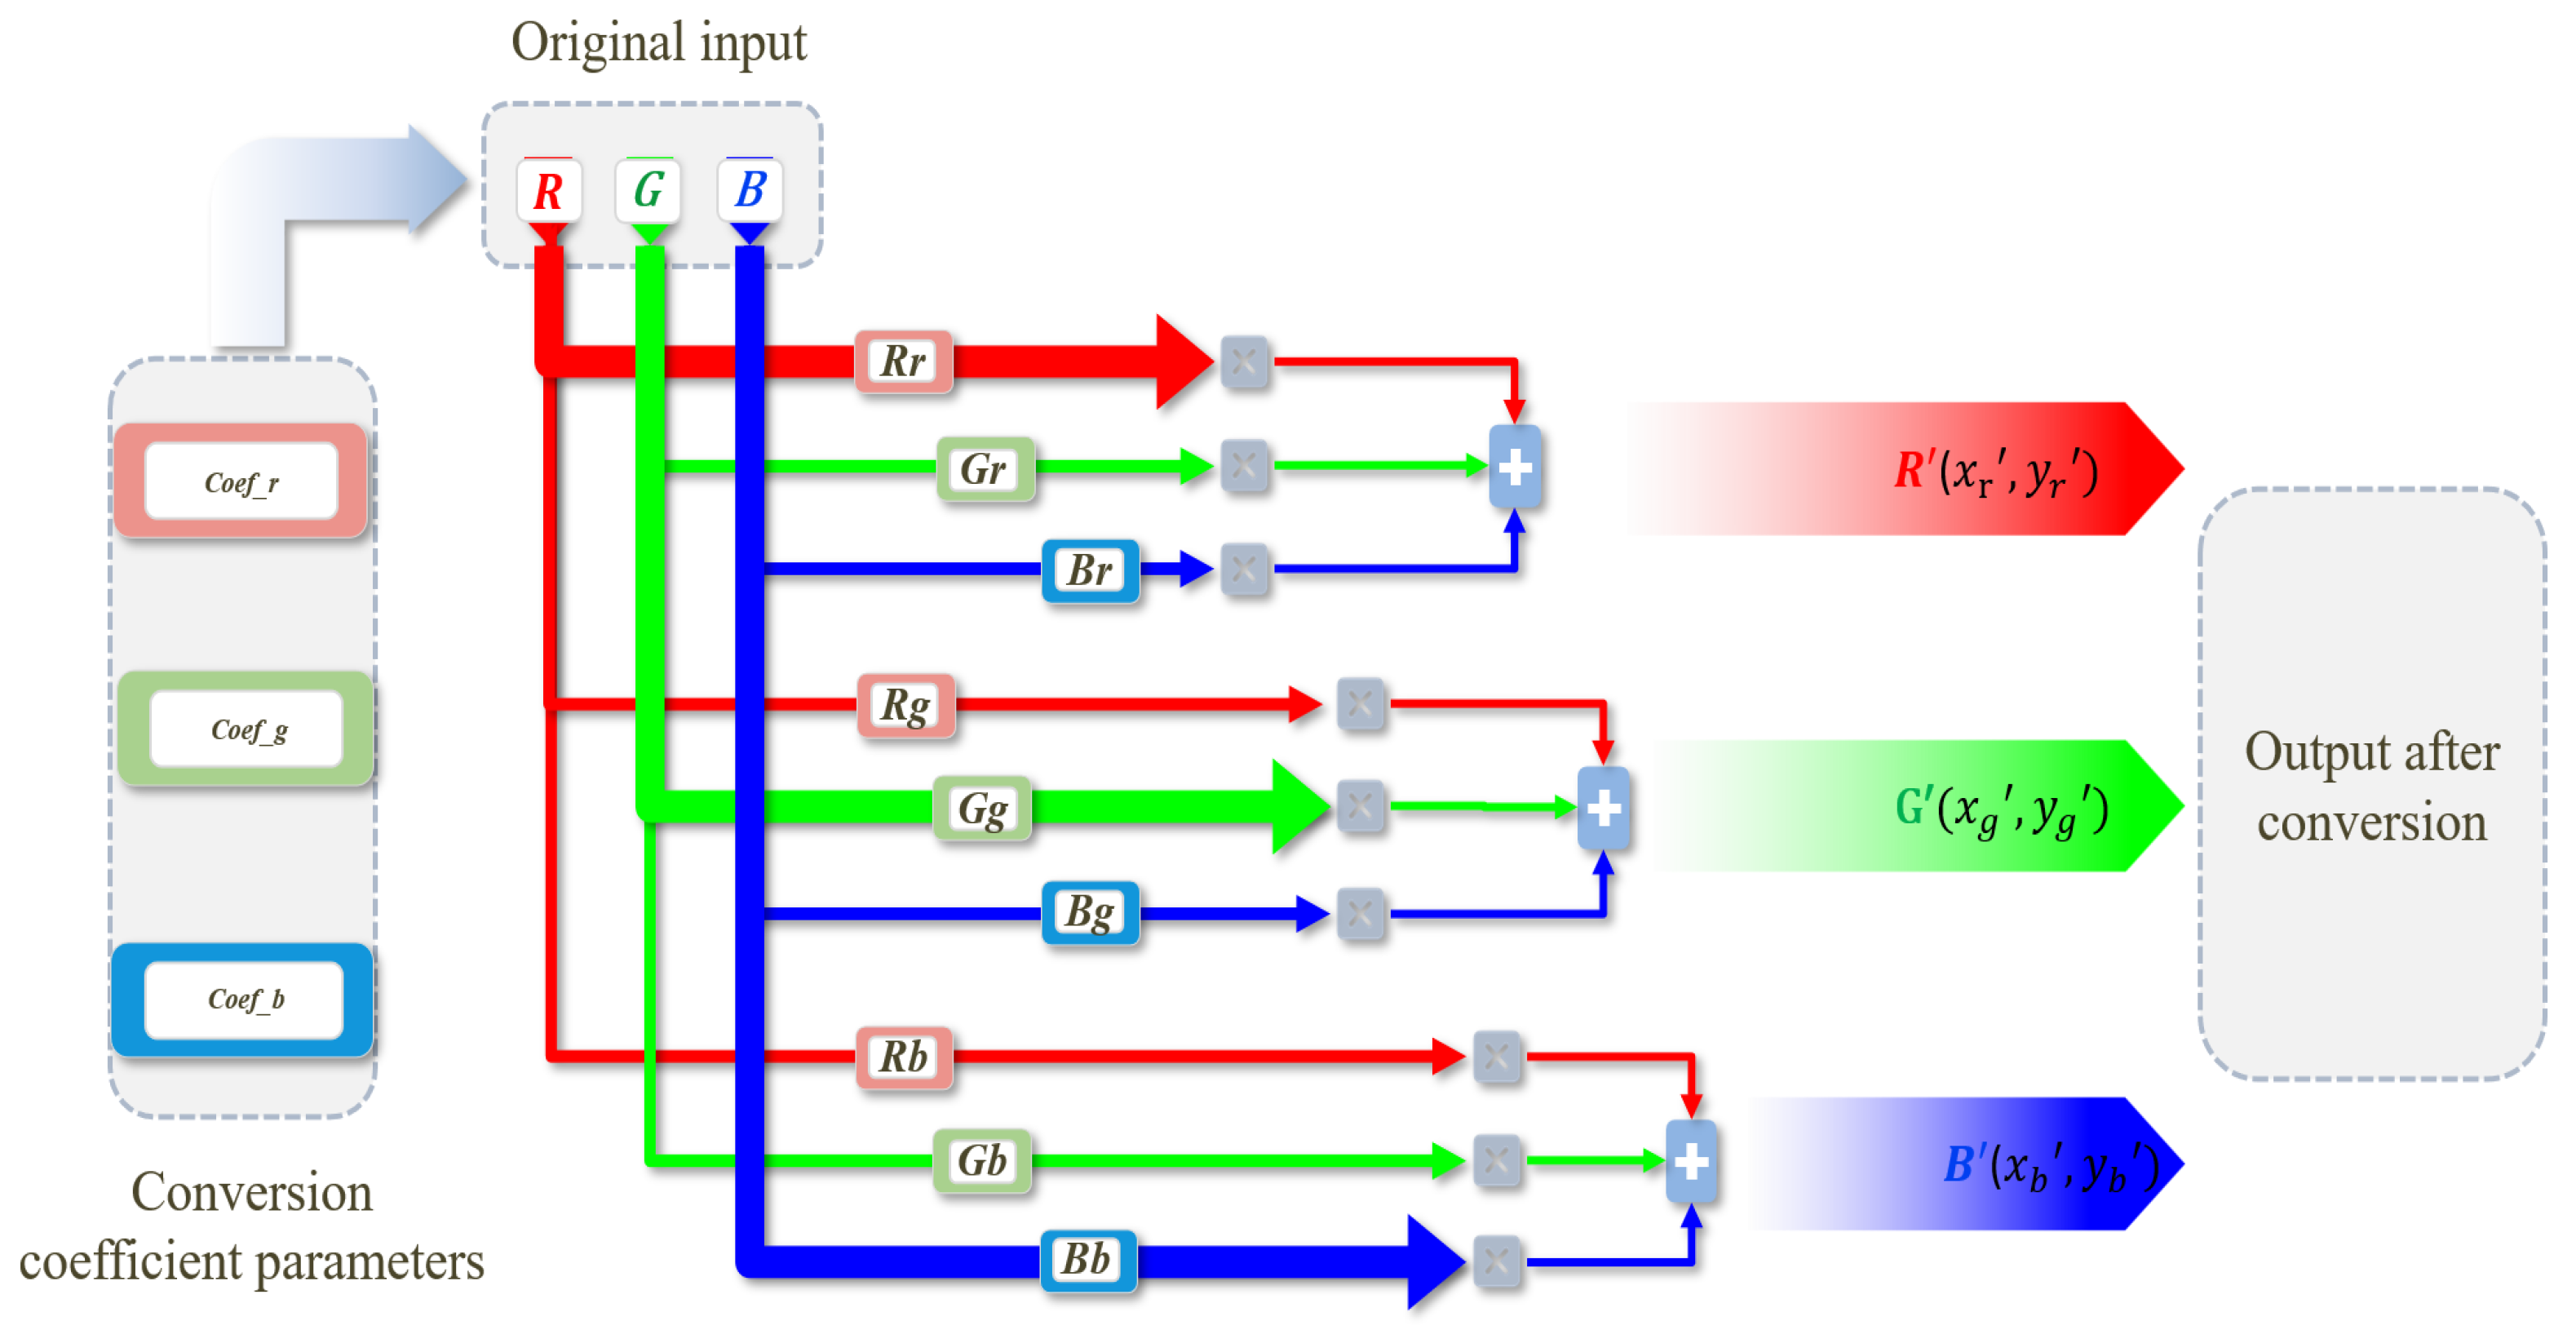
Figure 1. Color gamut conversion flowchart.
Applsci 15 11278 g001
Figure 2. Color gamut 3D stereogram.
Applsci 15 11278 g002
Figure 3. Original and target gamut in XYZ gamut.
Applsci 15 11278 g003
Figure 4. Quantization error diagram.
Applsci 15 11278 g004
Figure 5. Distribution of Laplacian outliers under different bit numbers.
Applsci 15 11278 g005
Figure 6. Comparison of outliers with different bits.
Applsci 15 11278 g006
Figure 7. The actual contrast diagram between the target color and the color with error.
Applsci 15 11278 g007
Table 1. The color gamut converts the base color coordinates at different precisions.
Quantization AccuracyR Primary ColorG Primary ColorB Primary Color
x y x y x y
8-bit0.6400.3300.3000.6000.1460.068
12-bit0.6400.3300.3440.5330.1460.068
16-bit0.6060.3570.3430.5420.1570.074
Disclaimer/Publisher’s Note: The statements, opinions and data contained in all publications are solely those of the individual author(s) and contributor(s) and not of MDPI and/or the editor(s). MDPI and/or the editor(s) disclaim responsibility for any injury to people or property resulting from any ideas, methods, instructions or products referred to in the content.