Abstract
As wind power penetration continues to increase, the sub-synchronous control interaction (SSCI) problem caused by the interaction between doubly fed induction generators (DFIGs) and series-compensated transmission lines has become increasingly prominent, posing a serious threat to power system stability. To address this problem, this research proposes a centralized sub-synchronous oscillation damping controller (CSODC) for wind farms. First, a DFIG impedance model was constructed based on multi-operating-point impedance scanning and a Taylor series expansion, achieving impedance prediction with an error of less than 2% under various power conditions. Subsequently, a CSODC comprising a sub-synchronous damping calculator (SSDC) and a power electronic converter is designed. By optimizing feedback signals, phase shift angles, gain parameters, and filter parameters, dynamic adjustment of controllable impedance in the sub-synchronous frequency band is achieved. Frequency-domain impedance analysis demonstrates that the CSODC significantly enhances the system’s equivalent resistance, reversing it from negative to positive at the resonance frequency point. Time-domain simulations validated the CSODC’s effectiveness in scenarios involving series capacitor switching and wind speed disturbances, demonstrating rapid sub-synchronous current decay. The results confirm that the proposed strategy effectively suppresses sub-synchronous oscillations across multiple scenarios, offering an economical and efficient solution to stability challenges in high-penetration renewable energy grids.
1. Introduction
Currently, the global capacity of installed wind power continues to grow at a rapid rate. By the end of 2024, the global cumulative installed capacity exceeded 1133 GW [1]. Driven by the advancement of the “Dual Carbon” goals, the penetration of wind generators in power systems has increased significantly; however, the sub-synchronous oscillation (SSO, see Table A1) problems triggered by their grid integration have become increasingly prominent [2,3,4,5]. Research indicates that interactions between doubly fed induction generators (DFIGs, see Table A1) and series-compensated transmission lines are prone to inducing sub-synchronous control interaction (SSCI, see Table A1), thereby causing damping degradation or even instability in power systems [6,7]. The International Energy Agency (IEA, see Table A1) predicted that, by 2030, grids with renewable energy penetration exceeding 50% will encounter more complex oscillation risks, necessitating urgent systematic solutions [8,9,10].
Impedance models, which quantify system dynamic characteristics using frequency-domain analysis, have become a cornerstone tool for assessing SSO stability [11,12,13,14]. Existing studies, leveraging impedance scanning techniques across multiple operating conditions, have developed equivalent impedance models for DFIGs, energy storage devices, and transmission lines, revealing negative damping phenomena in the sub-synchronous frequency band (10–50 Hz) [15,16,17,18,19,20,21]. Recently, data-driven approaches (e.g., deep neural networks) have been introduced into impedance modeling, significantly enhancing prediction accuracy under complex operating conditions [22,23,24].
At the SSO mitigation strategy level, energy storage systems (e.g., Superconducting Magnetic Energy Storage System [SMES, see Table A1] and Battery Energy Storage System [BESS, see Table A1]) utilize four-quadrant power regulation to provide dynamic damping, although their implementation requires careful consideration of energy storage capacity and economic viability [25]. Optimizing series-compensated line parameters can adjust compensation capacitance to avoid resonant frequency bands—a relatively straightforward approach. However, this potentially occurs at the expense of reduced energy transmission efficiency [26]. Active/passive filter schemes (series or parallel-connected) offer structurally simple solutions. However, large-capacity filters occupy substantial physical space, and grid frequency fluctuations or improper filter switching may induce commutation failures [27,28,29,30].
The contributions of this study can be summarized as follows:
- (1)
- The centralized sub-synchronous oscillation damping controller (CSODC, see Table A1) is proposed for the first time. This controller can increase the equivalent resistance of the system at the sub-synchronous frequency and damp the SSO successfully.
- (2)
- The multi-operating point impedance of the DFIG is obtained through scanning and derived using a Taylor series expansion for the “black-box” controller.
- (3)
- An adaptive tuning strategy has been developed for optimizing the phase angle, gain coefficient, and filter parameters of the controller to suppress oscillations across diverse operational scenarios. This adaptive tuning framework ensures effective performance under varying grid conditions. Simulations demonstrate that the proposed centralized damping controller effectively mitigates sub-synchronous resonance and enhances system stability.
Both frequency- and time-domain simulations demonstrate that the optimized centralized damping controller effectively mitigates sub-synchronous resonance and enhances system stability.
This study is structured into five sections: Section 1 delineates the research background; Section 2 details the impedance modeling and predictive validation for DFIGs; Section 3 elaborates on the CSODC framework design and its parameter optimization strategy; Section 4 verifies the resonance suppression efficacy of the CSODC implementation; and Section 5 concludes the research.
2. DFIG Impedance Modeling
Figure 1 illustrates the configuration of a typical doubly fed induction generator (DFIG, see Table A1) system, comprising a wind generator, mechanical shaft system, induction generator, rotor-side converter (RSC, see Table A1), and grid-side converter (GSC, see Table A1).
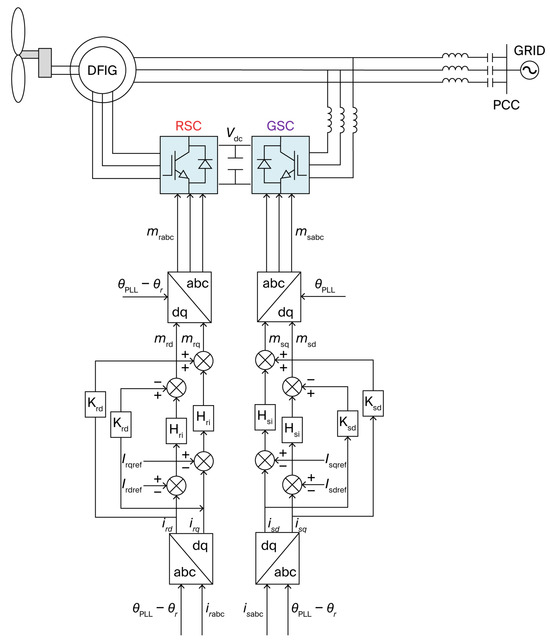
Figure 1.
Topology and control diagram of the DFIG.
In this research, the doubly fed induction generator (DFIG, see Table A1) utilizes an induction machine. In this setup, the stator is directly connected to the grid, and the rotor interfaces with the grid through power converters. The grid-side inverter and rotor-side converter are interconnected via a DC-link capacitor. Given a typically high capacitance value, the DC-link voltage can be regarded as constant. This section establishes the impedance modeling foundation for double-fed induction generator (DFIG, see Table A1) systems, describing their typical configuration comprising a wind generator, transmission system, induction motor, and back-to-back rotor-side and grid-side converters. The converters are coupled via a DC bus with a voltage that can be considered constant. The control system adopts a dual-loop architecture based on vector control. The rotor-side converter implements maximum power point tracking (MPPT, see Table A1) and reactive power coordination control via the outer loop, while current regulation occurs in the inner loop. The grid-side converter’s outer loop manages DC voltage stability and grid voltage support, with current tracking performed in the inner loop. Figure 1 further integrates the system topology with detailed control loops, establishing the structural and control-level theoretical foundation for subsequent impedance characteristic analysis.
Figure 1 presents the topology and control diagram of a doubly fed wind generator. The physical meanings of the symbols in the figure are as follows:
- : Electrical angle;
- : Output phase angle of the phase-locked loop (PLL) with transfer function ;
- /: Rotor-side dq-axis current references;
- /: Grid-side dq-axis current references;
- /: Measured rotor-side dq-axis currents;
- /: Measured grid-side dq-axis currents;
- : Rotor three-phase currents;
- : Rotor-side converter voltage modulation indices;
- : Grid-side converter voltage modulation indices;
- : DC-link voltage;
- : Stator three-phase output voltages;
- /: d/q-axis components of generator-side converter output voltages in synchronous rotating frame;
- : Generator-side converter three-phase output currents;
- /: d/q-axis components of generator-side modulation indices in synchronous rotating frame;
- : Rotor-side current PI controller;
- : Grid-side converter three-phase output currents;
- /: d/q-axis components of grid-side modulation indices in synchronous rotating frame;
- : Grid-side current PI controller.
Power systems may be classified as “white-box” systems when the parameters of their components, structural configuration, and control mechanisms are fully comprehended.
Conversely, power systems with partially or completely unknown parameters or structural configuration may be classified as “black-box” systems. In such black-box impedance models, the internal parameters of wind generator systems are unobservable, thereby precluding direct derivation of their internal impedance model. Assuming that the wind generator’s control strategy and topological architecture align with this research, the impedance spectrum can be obtained with impedance scanning of the generator set [1]. Frequency-scanning simulations yield impedance characteristics under specific operating conditions, thereby enabling extrapolation of impedance models for other operating regimes based on curve-fitting methodologies.
This methodology constructs a precise functional mapping between input operating conditions and impedance spectra, thereby providing a robust framework for developing impedance models of black-box systems.
Figure 2 illustrates the impedance prediction workflow for wind generator models, in which impedance curve forecasting employs Taylor series expansion. Impedance scanning plays a pivotal role in SSO research. Three-phase perturbation signals with coupled frequencies and are injected at the PCC of wind generators, as defined by Equation (1) [31].
where uc, us, fc, fs, φc, and φs denote the amplitude, frequency, and phase of the perturbation signals, respectively. The frequencies fc and fs are constrained within the 1 to 100 Hz range, satisfying the relationship fc + fs = 100 Hz. A frequency sweep is administered across the wind generator system over the 1 to 100 Hz bandwidth. The frequency resolution is set to 1 Hz. Owing to spectral symmetry for the fundamental frequency (50 Hz), only results within the 1 to 50 Hz range are presented. The sampling frequency for the DFIG system is Fs = 4 × 10³ Hz.
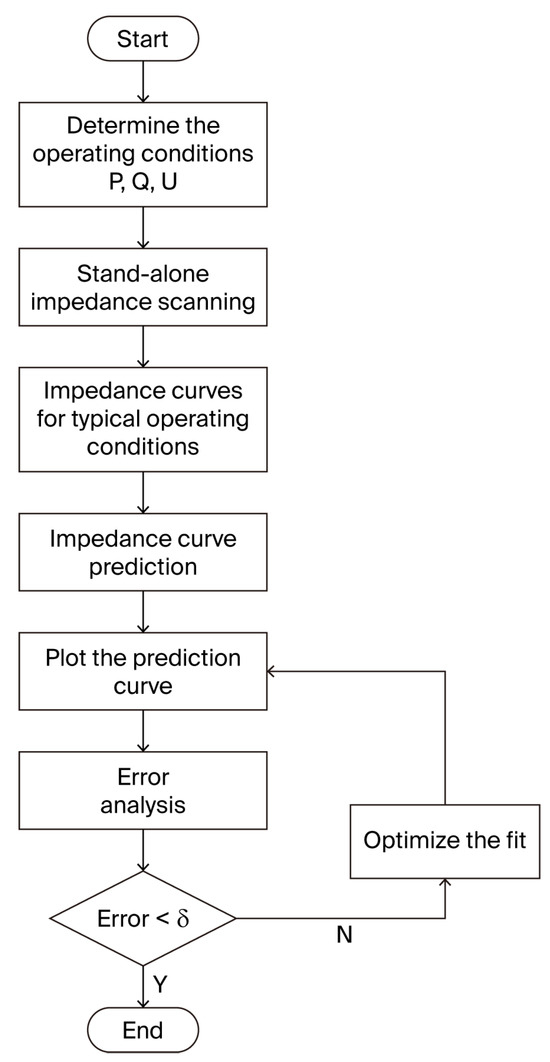
Figure 2.
Flowchart of fan impedance model prediction.
Voltage U and current I values at the PCC of the wind generator are collected, and the amplitude components UFFT,f, f and IFFT,f, f synchronized with the perturbation frequency f are extracted using FFT. The wind generator impedance, denoted as Z(f), constitutes a coupling impedance matrix derived from the voltage–current coupling equations:
where Z11 and Z22 denote the self-impedances at the sub-synchronous frequency and its complementary frequency, respectively, and Z12 and Z21 represent the mutual impedances between these two coupled frequencies. In particular, Z11 and Z22 are defined as the ratios of positive- and negative-sequence voltages to currents, respectively. Conversely, Z12 and Z21 quantify the coupling from negative-sequence current to positive-sequence voltage and from positive-sequence current to negative-sequence voltage, respectively. Impedance scanning is performed on the ten operating conditions detailed in Table 1.

Table 1.
Wind generator operating conditions.
Based on the impedance spectra obtained from Operating Conditions 1–10, single-frequency prediction is performed at a specific frequency f Hz. In particular, the impedances at fk Hz and the target frequency f0 Hz are expanded using a Taylor series and Equation (4), respectively.
where denotes a frequency in proximity to . and represent the resistance R and reactance X to be predicted, respectively. and correspond to the values of R and X at frequency . and are the first-order derivatives of R and X for operating point P at , whereas and are the second-order derivatives. Higher-order terms are neglected. Discrete differentiation methods are employed to compute these derivatives, utilizing values from multiple operating conditions at identical frequencies.
Figure 3 and Figure 4 present comparative analyses of predicted versus measured impedance curves under two distinct operating conditions: P = 0.85 pu, Q = 0 pu, U = 1 pu and P = 0.55 pu, Q = 0 pu, U = 1 pu, respectively. The results demonstrate strong concordance between the predicted impedance profiles and those empirically derived from sweep-frequency measurements, thereby substantiating the accuracy and robustness of the proposed extrapolation methodology.
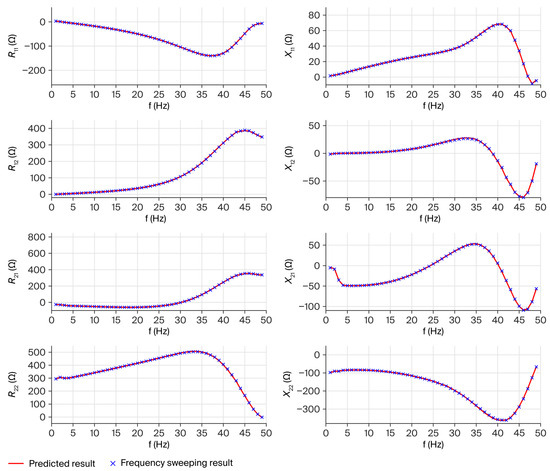
Figure 3.
Prediction and verification of P = 0.85 pu.
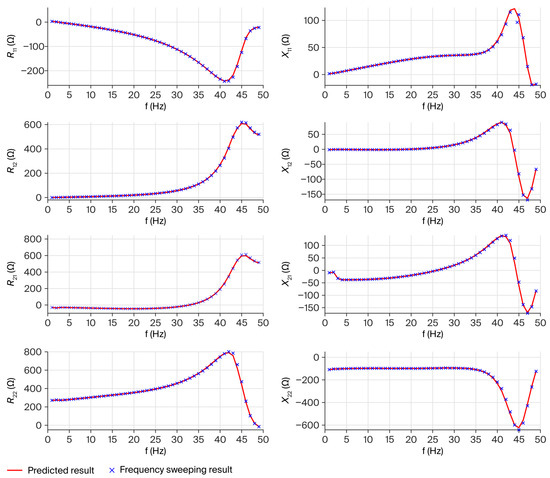
Figure 4.
Prediction and verification of P = 0.55 pu.
The maximum observed deviation is consistently below 2%, confirming compliance with the permissible error threshold. As demonstrated by the aforementioned model predictions and validation using simulation, a Taylor series expansion can be effectively employed for impedance model prediction, yielding significantly small errors. Given that the voltage is generally stable and the variation range is relatively small, further discussion is not provided in this paper.
3. Centralized Sub-Synchronous Damping Control Device for Wind Farms
3.1. CSODC Principle and Structure
The CSODC structure is shown in Figure 5.
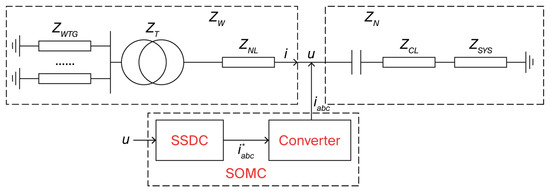
Figure 5.
Composition and principle of the CSODC.
In the above figure, ZW and ZN represent the total impedance of the wind generator and grid sides, respectively; ZDFIG, ZT, ZNL, ZCL, and ZSYS represent the equivalent impedances of the doubly fed wind generator, transformer, wind farm line, series compensation line, and receiving-end system, respectively. L11 is the inductance of X11. The established impedance model is shown in Equations (5) and (6).
Originally, the CSODC was not connected, and the overall system impedance was equivalent to . When the CSODC was connected, the overall system impedance is expressed as follows:
where is the transfer function for the feedback signal of u. According to the stability criterion of the impedance model, the frequency characteristic curve of the overall system’s impedance model can be used to evaluate system stability [5]. is set at the point where the imaginary part is equal to zero and then fit at this frequency to obtain the real part of the zero point. CSODC affects the impedance characteristics of the overall system at the SSR frequency, causing the real part of the zero point to change from positive to negative, and the overall system to change from unstable to stable, thereby suppressing sub-synchronous oscillations.
The CSODC includes a sub-synchronous damping calculator (SSDC) that converts feedback signals or injected signals through a series of modulation steps into reference signals that can suppress sub-synchronous oscillations. These signals are then converted into currents using a specially designed power electronic converter and injected into the system to suppress sub-synchronous oscillations. The functional structure of the CSODC is shown in Figure 6.

Figure 6.
Functional structure of the CSODC.
3.1.1. Mode Filter Design
The primary objective of a mode filter is to selectively isolate specific resonant modes, extract the corresponding signal components from the feedback signal employing signal processing techniques (e.g., filtering), and enhance the signal-to-noise ratio (SNR) to establish a robust foundation for subsequent proportional amplification and phase-shifting stages. Such filters are essential to suppress extraneous background signals, particularly interference from power-frequency components. Consequently, a typical implementation adopts a two-stage cascade configuration: the initial stage incorporates a band-pass filter precisely tuned to the target resonant mode, while the subsequent stage employs a narrowband band-reject (notch) filter centered at the power frequency.
A typical example is a second-order filter, as shown in Equations (8) and (9), with center frequencies set to the SSO and system operating frequencies, respectively. The bandwidth of the two filters primarily depends on their damping ratio. The band-reject filter has a narrower bandwidth because the range of power frequency variations is very small. The band-pass filter’s bandwidth is set to cover the frequency variation range when SSR occurs in the actual system, ensuring that the band-pass filter’s bandwidth can adequately cover the resonant frequencies of interest.
The transfer function of a typical second-order band-pass filter is expressed as follows:
where and are the damping ratio and center frequency of the band-pass filter, respectively.
The transfer function of a typical second-order band-reject filter is expressed as follows:
where and are the damping ratio and center frequency of the band-stop filter, respectively.
Therefore, the transfer function of the entire mode filter is expressed as follows:
However, filters cause amplitude and phase shifts, so subsequent proportional-phase shift stages should consider these changes and compensate for them in their parameters.
3.1.2. Proportional-Phase Shift Section
The function of the proportional-phase shift stage is to amplify the signal components corresponding to specific resonant modes and apply precise phase adjustments, thereby enabling the targeted modal current components in the final output to efficiently dissipate vibrational energy. This process significantly enhances the overall damping performance of the system.
The lag–lead link enhances the role of the open-loop gain coefficient, improving the relative stability of the control system and the rapid response to input signals. Therefore, in the voltage feedback control channel of the CSODC, the following second-order transfer function is employed:
where Ku is the gain of the voltage feedback control channels, and Tu is the time constant for achieving phase shift regulation.
The design of gain and time constant affects the performance of the entire control system and requires a comprehensive analysis of the overall open- and closed-loop characteristics of the system and the impact of multiple operating modes. Its advantage is that each transfer function includes only two parameters: gain and time constant. The former determines the control gain, whereas the latter determines the phase shift. The adjustment of gain and phase is decoupled, allowing for separate modification in further research and enhanced suppression capabilities.
For transfer functions of the form shown in Equation (12), let ; then, Equation (13) holds.
According to the method of calculating the phase angle of a plurality, the phase angle of can be obtained as follows:
Therefore, if the phase shift angle of a phase shift element is , its time parameter is calculated using the following formula:
where is the modal frequency that needs to be improved, with units of rad/s, and (−90° < < 90°) is the lag phase angle corresponding to that needs to be compensated.
The gain parameter K is directly related to the amount of damping that the CSODC can provide. Once the phase correction of the CSODC is determined, K can be adjusted to better meet the oscillation suppression requirements.
3.1.3. Converter Controller
The converter controller uses a DC-AC dual-loop control. Figure 7 shows its block diagram. PI1 and PI2 are the proportional integrals of the outer- and inner-loop controllers, respectively, ensuring that the DC-side capacitor voltage udc remains constant. The reference values and udc are input into PI1, which then outputs the inner-loop reference value . PI2 causes the measurement value to track its reference value . PI4 is the proportional integral of the inner-loop controller, which controls the reactive power component of the converter to ensure its output provides a constant reactive power, thereby maintaining a constant voltage at the grid connection point. PI4 ensures that the I-axis measurement value tracks its reference value . The transfer functions of the outer and inner loops of the converter control structure are shown in Equation (16).
where and are the proportional and integral coefficients of each controller, respectively, and and are the reference values of the U- and Q-axis outputs of the converter, respectively.
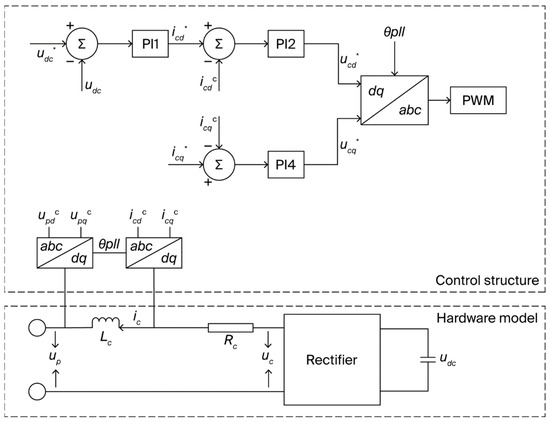
Figure 7.
Converter control structure.
3.1.4. The CSODC with RTLAB
- (1)
- Converter control module
Figure 8 shows the model of the converter control structure module.
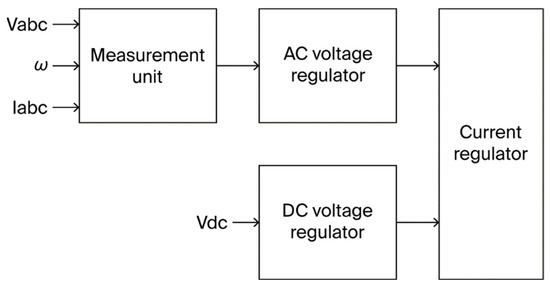
Figure 8.
Simulink model of the converter controller.
- (2)
- Converter main circuit module and its connection system
Figure 9 and Figure 10 show the models of the converter main circuit module and its connection system, respectively.
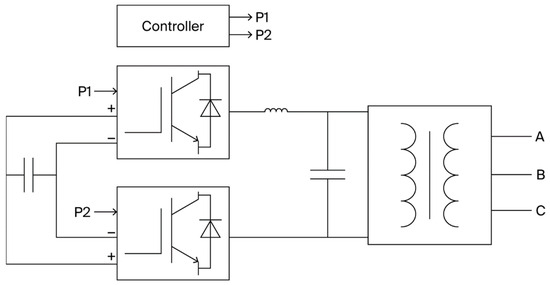
Figure 9.
Converter main circuit.
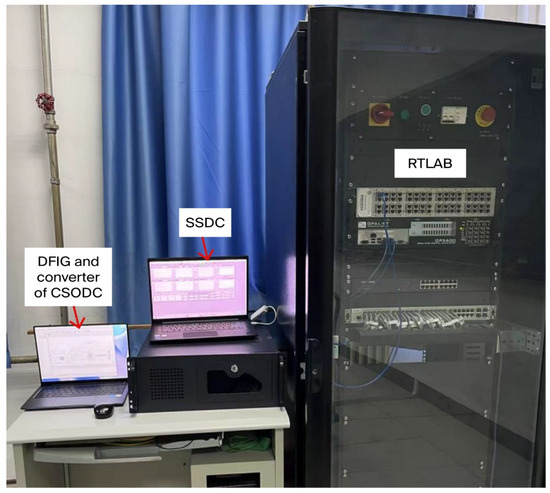
Figure 10.
The CSODC with RTLAB.
The CSODC is verified using RTLAB, as shown in Figure 10. The SSDC is implemented with the NI (National Instrument, Austin, TX, USA) Crio-9064. The converter, DFIG, and series compensation transmission line are modeled within RTLAB.
3.2. CSODC Input Signal and Parameter Design
- (1)
- Optimal gain parameter Tu
Frequency scans are performed on the operating states at a different time constant Tu to obtain the impedance model of the DFIGs and CSODC in parallel. This model is then aggregated with the system impedance and series compensation to obtain the overall impedance network model. The waveform of the equivalent resistance RΣ and equivalent reactance XΣ within a certain range near the oscillation frequency is shown in Figure 11.
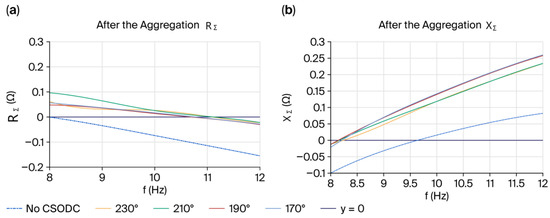
Figure 11.
Impedance waveform in the frequency domain under different time constants.
Figure 11 shows that the equivalent reactance XΣ of the four phase angle conditions is all less than 10 Hz based on the stability criterion of the impedance model. At this point, the equivalent resistance RΣ of the four conditions is greater than 0. Thus, there is no risk of oscillation when the DFIG system is connected to series compensation in these four conditions, and CSODC can play a suppressing role.
By progressively narrowing down the range, the optimal phase shift angle of 174° and ϕ of 87° were determined. The time constant Tu was calculated as −0.0155 using Equation (11).
Figure 12 shows that the CSODC increased the equivalent resistance and reactance of the overall system when comparing the impedance waveform before and after its connection. When the equivalent reactance XΣ crosses zero, the equivalent resistance RΣ is less than 0, eliminating the risk of secondary synchronous oscillations in the wind generator. The suppression effect of the CSODC is validated from the frequency-domain perspective.
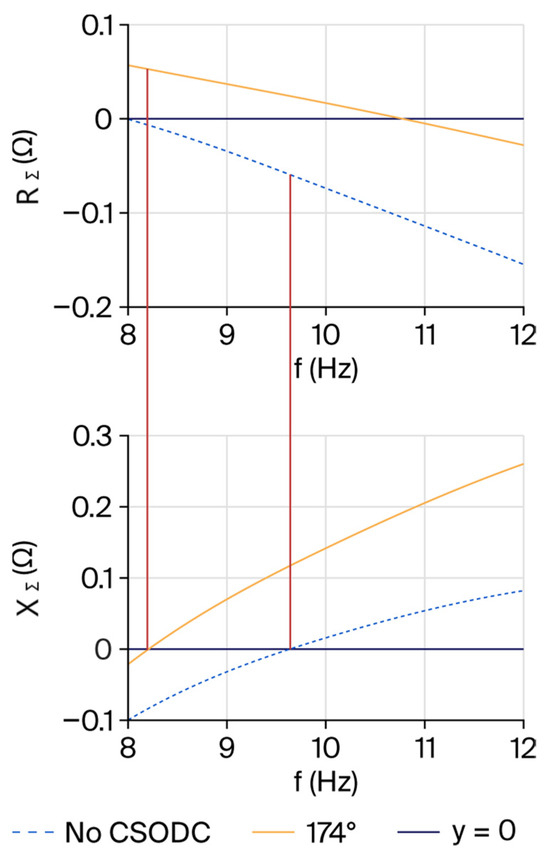
Figure 12.
System impedance aggregate waveform. (Red line: Zero crossing point).
- (2)
- Optimal gain parameter Ku
After obtaining the optimal phase shift angle of 174°, a time-domain simulation must be performed with gain as the sole variable to determine the optimal gain that provides the best suppression effect. The gain parameters Ku are set to 0.5, 1, 2, and 3, separately. After performing impedance scanning and aggregation on the four models, the impedance waveforms are obtained, as shown in Figure 13, where y = 0 is the horizontal axis.
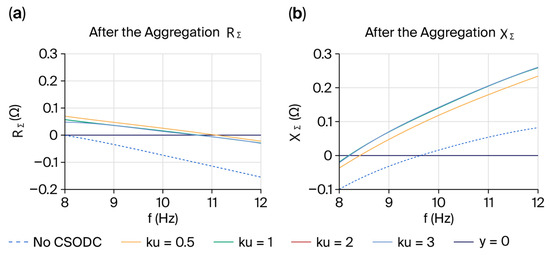
Figure 13.
Impedance waveform in the frequency domain with different gain parameters.
The optimal gain parameter is 1. Figure 14 shows a comparison of the scanned impedance. Figure 14 shows that after connecting the CSODC, both the equivalent resistance and reactance of the entire system increase compared with their values before the connection. When the equivalent reactance XΣ crosses zero, the equivalent resistance RΣ becomes negative, eliminating the risk of synchronous oscillations occurring in the wind turbine. The suppression effect of the CSODC has been verified from a frequency domain perspective.
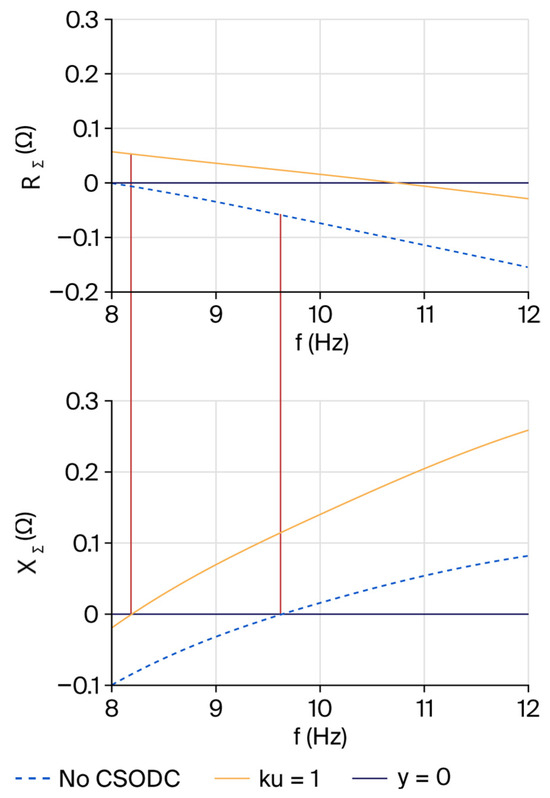
Figure 14.
The impedance aggregate waveform of the system at a gain of 1. (Red line: Zero crossing point).
4. Verification of the CSODC Resonance Suppression Effect
Using the optimal parameters obtained, the phase shift angle is 174°, the time constants Tu = −0.0155, and the gain parameters Ku = 1. Under disturbance conditions involving series compensation and reduced wind speed, the decay of the synchronous current in the series compensation line is compared between the open- and closed-loop modes of the CSODC.
4.1. Series Capacitor
Figure 15 compares two operating conditions: with and without the CSODC connected to the system. The series capacitor is switched into operation at 2 s. The group that is not connected to CSODC experiences unstable SSO, resulting in significant fluctuations in wind power and current. The group connected to CSODC quickly suppresses the fluctuations caused by series compensation switching and does not experience SSR, demonstrating that CSODC can effectively suppress resonance in series compensation switching that is sufficient to cause resonance.
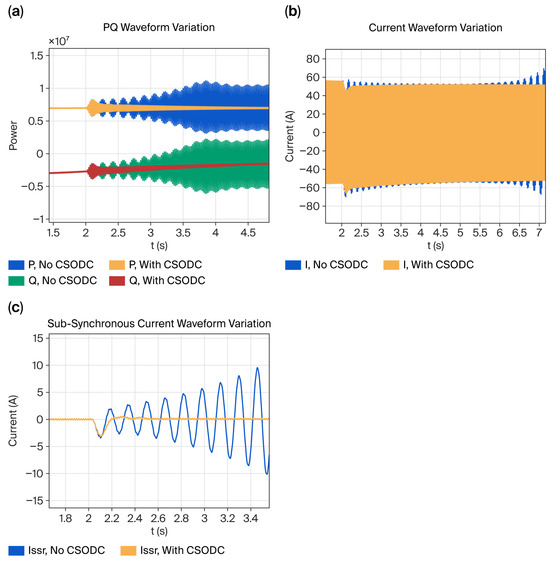
Figure 15.
Influence of serial compensation.
Figure 16 and Figure 17 compare two different operating conditions: with and without the CSODC connected to the system. The series capacitor is switched into operation at 4 s. The active power is 0.9 pu.
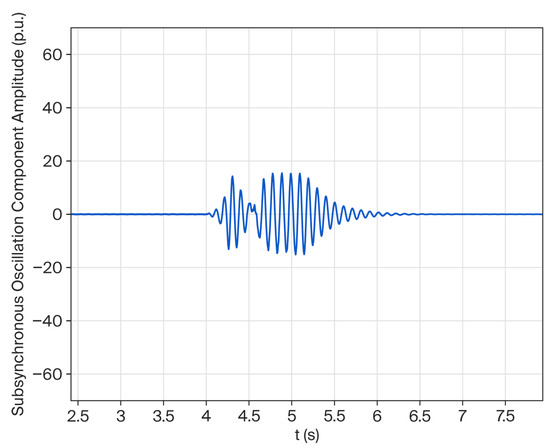
Figure 16.
Influence of serial compensation when the active power is 0.9 pu with CSODC.
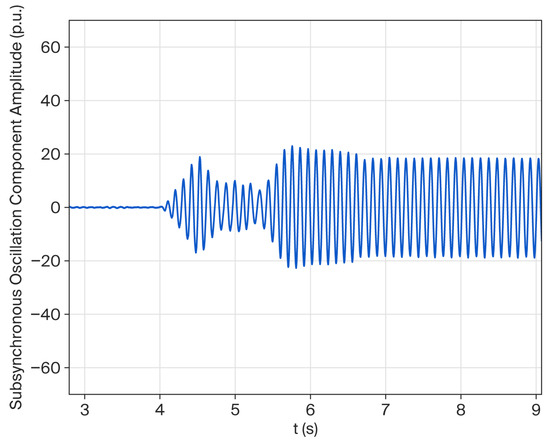
Figure 17.
Influence of serial compensation when the active power is 0.9 pu with optimized GSC.
Figure 16 shows the simulation results of the proposed scheme under RT-LAB validation, demonstrating its notable suppression performance.
Figure 17 demonstrates the damping performance of the optimized control parameters of the GSC on the targeted oscillatory modes. Although a noticeable attenuation in amplitude is observed, residual oscillations persist with appreciable magnitude, indicating limited efficacy in complete oscillation suppression under the given operational conditions.
4.2. Wind Speed
As shown in Figure 18, when the system is connected to the CSODC, the wind speed decreases from 12 m/s to 4 m/s in 8 s. Two different operating conditions are compared. The first condition is without the CSODC connection, where unstable SSO occurs, leading to significant fluctuations in wind power and current. The second condition is with the CSODC connection, in which the fluctuations caused by the sudden drop in wind speed were quickly suppressed, and no unstable SSO phenomenon occurred, demonstrating that the CSODC can effectively suppress resonance even in cases of sudden wind speed drops sufficient to cause resonance.
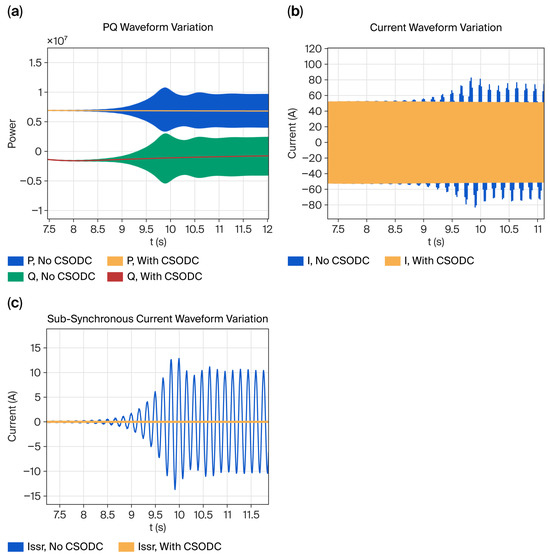
Figure 18.
Influence of wind speed.
Figure 19 illustrates the validation results of this solution on RT-LAB, demonstrating its effective oscillation suppression capability.
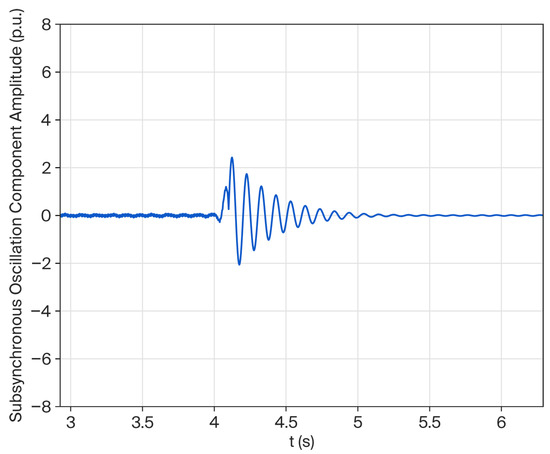
Figure 19.
Influence of wind speed when the active power is 0.9 pu with CSODC.
Figure 20 demonstrates the comparative damping performance achieved with modified control parameters. The results indicate that although mitigation of the oscillatory mode is ultimately attained, the transient settling time is significantly prolonged relative to the methodology proposed in this research.
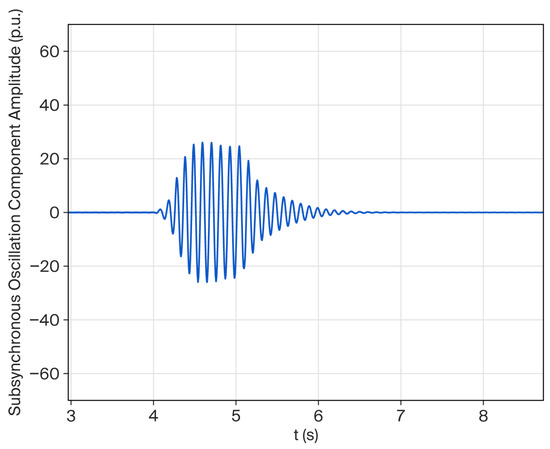
Figure 20.
Influence of wind speed when the active power is 0.9 pu with optimized GSC.
5. Summary
This research addresses the sub-synchronous oscillation issues caused by wind power grid connection and proposes a centralized sub-synchronous oscillation damping controller (CSODC) device based on impedance model prediction and parameter optimization. By establishing a multi-condition impedance model for DFIG and combining it with the Taylor series expansion method, high-precision prediction of black-box system impedance characteristics is achieved (average error <2%), providing theoretical support for stability analysis. The designed CSODC device dynamically adjusts the equivalent impedance in the sub-synchronous frequency band, combined with signal filtering, phase shifting (174°), and gain optimization (Ku = 1), effectively enhancing the system’s damping characteristics. Frequency-domain impedance analysis shows that, after the device is connected, the equivalent resistances at the resonance frequency points are all positive, significantly improving system stability. Time-domain simulations validated its robustness under conditions such as series compensation switching and sudden changes in wind speed, with sub-synchronous currents rapidly decaying within a short time. Compared with traditional solutions, the CSODC device combines economic efficiency with adaptability. This requires no modifications to the wind generator itself or sacrifices in terms of transmission efficiency, offering a new approach for oscillation suppression in large-scale wind power grid integration.
However, this research still has certain limitations. The current control strategy relies on accurate system impedance models, and its adaptability in complex real-world grid environments may be affected by model mismatch and time-varying operating conditions. Furthermore, the collaborative control capability of the CSODC in addressing wide-area coordinated oscillations across multiple wind farms has not been completely explored. Future work will focus on developing adaptive impedance models based on online identification to enhance system robustness. We will also explore distributed control architectures that coordinate with wideband oscillation suppression in multi-wind-farm clusters, thereby further improving the engineering applicability and scalability of this approach.
Author Contributions
Conceptualization, X.W. and X.Z.; Methodology, X.W., Y.R., and L.W.; Validation, Q.W., Y.R., and Q.W.; Formal analysis, L.W.; Investigation, X.W.; data curation, X.D.; Writing—original draft, X.W., Q.W., and X.D.; writing—review and editing, X.Z. All authors have read and agreed to the published version of the manuscript.
Funding
This research was funded by “Research on Field Testing Technology for Wide-band Frequency Impedance Characteristics of New Energy Generating Units” (KJZ2023087), a scientific and technological project of North China Electric Power Research Institute Co., Ltd.
Data Availability Statement
The original contributions presented in this study are included in the article. Further inquiries can be directed to the corresponding author.
Conflicts of Interest
Authors Xiao Wang, Yina Ren, Linlin Wu, Xiaoyang Deng were employed by North China Electric Power Research Institution Co., Ltd. (State Grid Jibei Electric Co., Ltd. Research Institution). The remaining authors declare that the research was conducted in the absence of any commercial or financial relationships that could be construed as a potential conflict of interest.
Appendix A

Table A1.
List of abbreviations.
Table A1.
List of abbreviations.
| Serial Number | Full Name | Abbreviation |
|---|---|---|
| 1 | Sub-synchronous control interaction | SSCI |
| 2 | Doubly fed induction generator | DFIG |
| 3 | Centralized sub-synchronous oscillation damping controller | CSODC |
| 4 | Sub-synchronous oscillation | SSO |
| 5 | Sub-synchronous damping calculator | SSDC |
| 6 | International Energy Agency | IEA |
| 7 | Superconducting magnetic energy storage system | SMES |
| 8 | Battery energy storage system | BESS |
| 9 | Rotor-side converter | RSC |
| 10 | Grid-side converter | GSC |
| 11 | Maximum power point tracking | MPPT |
References
- Wang, W.; Li, G.; Chen, Y.; He, G.; Wu, W.; Xiao, Y.; Guo, Z.; Zhou, D. Review of Wideband Impedance Measurement Technology and Equipment for New Energy Power Generation. J. Electr. Eng. China 2025, 1–18. Available online: http://kns.cnki.net/kcms/detail/11.2107.TM.20250411.1501.011.html (accessed on 19 June 2025).
- Li, D.; Sun, T.; Yi, C.; Gao, W.; Li, S.; Lyu, B.; Li, H.; Zhang, Y.; Bai, Z.; Wang, J.; et al. Research on the Development of Deep-Sea Floating Wind Power Technology. Chin. J. Eng. Sci. 2025, 27, 108–122. [Google Scholar] [CrossRef]
- Li, M.; Yu, Z.; Xu, T.; He, J.; Wang, C.; Xie, X. Research on Complex Oscillation Problems Caused by New Energy Grid-Connected Systems and Countermeasures. Power Syst. Technol. 2017, 41, 1035–1042. [Google Scholar] [CrossRef]
- Wang, W.; Zhang, C.; He, G.; Li, G.; Zhang, J.; Wang, H. Review of Subsynchronous Oscillations in Grid-Connected Systems of Large-Scale Wind Farms. Power Syst. Technol. 2017, 41, 1050–1060. [Google Scholar] [CrossRef]
- Xie, X.; Liu, H.; He, J.; Liu, H.; Liu, W. A Brief Analysis of New Oscillation Problems in Power Systems. J. Electr. Eng. China 2018, 38, 2821–2828+3133. [Google Scholar] [CrossRef]
- Irwin, G.D.; Jindal, A.K.; Isaacs, A.L. Sub-synchronous control interactions between type 3 wind turbines and series compensated AC transmission systems. In Proceedings of the 2011 IEEE Power and Energy Society General Meeting, Detroit, MI, USA, 24–28 July 2011; pp. 1–6. [Google Scholar] [CrossRef]
- Leon, A.E.; Solsona, J.A. Sub-Synchronous Interaction Damping Control for DFIG Wind Turbines. IEEE Trans. Power Syst. 2015, 30, 419–428. [Google Scholar] [CrossRef]
- Ma, X.; Wen, J.; Yan, W.; Lu, Y.; Wang, N.; Zhou, Q.; Lv, R.; Wang, C. Application Analysis of Voltage Single-Loop Control Strategy in Zhangbei Flexible DC Project. Autom. Electr. Power Syst. 2025, 49, 198–207. [Google Scholar]
- Zhao, L. China’s green energy development becomes the engine of global energy transition. Ecol. Econ. 2024, 40, 9–12. [Google Scholar]
- Zhang, J.; Teng, J.; Li, X.; Tan, Z. Short-term prediction of photovoltaic power based on meteorological characteristics and improved Transformer. Therm. Power Eng. 2024, 39, 146–154. [Google Scholar]
- Roinila, T.; Vilkko, M.; Sun, J. Online Grid Impedance Measurement Using Discrete-Interval Binary Sequence Injection. IEEE J. Emerg. Sel. Top. Power Electron. 2014, 2, 985–993. [Google Scholar] [CrossRef]
- Chen, X.; Zhang, Y.; Wang, S.; Chen, J.; Gong, C. Impedance-Phased Dynamic Control Method for Grid-Connected Inverters in a Weak Grid. IEEE Trans. Power Electron. 2016, 32, 274–283. [Google Scholar] [CrossRef]
- Wen, B.; Boroyevich, D.; Burgos, R.; Mattavelli, P.; Shen, Z. Analysis of D-Q Small-Signal Impedance of Grid-Tied Inverters. IEEE Trans. Power Electron. 2015, 31, 675–687. [Google Scholar] [CrossRef]
- Liu, P.; Cui, Y.; Liu, Z.; Liang, Y. Research on a unified analysis method for the stability of grid-connected converters based on impedance analysis. Power Syst. Prot. Control. 2023, 51, 114–125. [Google Scholar] [CrossRef]
- Wang, Q.; Zhao, Y.; Feng, L.; Yi, L.; Li, Z.; Ma, J.; Shen, Y. Study on Sub/Supersynchronous Oscillation Suppression Strategies for Direct-Drive Wind Farms via Multi-Terminal Flexible DC Grid-Connection Systems Under Sender-Side Fault Scenarios. J. Electr. Eng. China 2025, 1–11. Available online: http://kns.cnki.net/kcms/detail/11.2107.TM.20250312.1758.005.html (accessed on 19 June 2025).
- Xu, Y.; Nian, H.; Wang, T.; Chen, L.; Zheng, T. Frequency Coupling Characteristic Modeling and Stability Analysis of Doubly Fed Induction Generator. IEEE Trans. Energy Convers. 2018, 33, 1475–1486. [Google Scholar] [CrossRef]
- Zhang, F.; Chen, W.; Li, K.; Guo, X.; Xue, A. The Impact of Active Power Restoration Control in a Double-Fed Wind Farm on the Initial Stability of a Wind-Fired Bundled System and Its Improved Control Strategy. Power Syst. Prot. Control. 2025, 53, 136–150. [Google Scholar] [CrossRef]
- Wang, N.; Ke, W.; Yao, R.; Chen, T.; Li, Y. Wideband Oscillation Suppression Strategy for Grid-connected Double-fed Wind Turbines Based on Impedance Reshaping. J. Electr. Power Syst. Autom. 2025, 37, 29–37. [Google Scholar] [CrossRef]
- Chen, J.; Hu, Y.; Wang, Y.; Li, J.; Wang, X.; Jiang, Q.; Zheng, X. Study on harmonic interaction between paralleled STATCOMs with cascaded H-bridge topology in wind farm clusters. IET Renew. Power Gener. 2021, 15, 2515–2525. [Google Scholar] [CrossRef]
- Chen, J.; Zhao, B.; Zhao, B. Modeling and Stability Analysis of VSG-type Grid-connected Energy Storage dq Impedance Considering the Influence of Multiple Control Loops. Energy Storage Sci. Technol. 2025, 14, 222–239. [Google Scholar] [CrossRef]
- Liu, C.; Liu, Z.; Han, J. Adaptive Suppression of Sub/Supersynchronous Oscillations in AC Transmission Systems for Black/Gray Box New Energy Power Stations. J. Electr. Eng. China 2025, 45, 1–13. Available online: https://doi.org/10.13334/j.0258-8013.pcsee.232766 (accessed on 19 June 2025).
- Lyu, J.; Rao, Y.; Wang, Z.; Dai, J.; Cai, X. Data-Driven Impedance Identification and Stability Online Assessment of Wind Farm Connected With MMC-HVDC. IEEE Trans. Ind. Appl. 2023, 60, 2567–2576. [Google Scholar] [CrossRef]
- Meng, F.; Guo, C.; Zhang, J.; Hu, C. Online Identification of Vulnerable Points in Multi-Level Oscillations of Wind Farm Grid-Connected Systems Using Gray Box Modeling of Unit Parameters. Power Syst. Autom. 2024, 1–15. Available online: http://kns.cnki.net/kcms/detail/32.1180.tp.20241023.0959.002.html (accessed on 19 June 2025).
- Zhao, C.; Jiang, Q. Black-box identification method for the impedance model of grid-connected converters under all operating conditions. Power Syst. Prot. Control. 2024, 52, 48–55. [Google Scholar] [CrossRef]
- Zhang, X.; Huang, H.; Xie, Q.; Gao, L.; Ye, J.; Ma, S. Research on the Suppression Strategy With SMES of SSO for the Black-Box DFIG System. IEEE Access 2025, 13, 45715–45732. [Google Scholar] [CrossRef]
- Abdeen, M.; Li, H.; Jing, L. Improved subsynchronous oscillation detection method in a DFIG-based wind farm interfaced with a series-compensated network. Int. J. Electr. Power Energy Syst. 2020, 119, 105930. [Google Scholar] [CrossRef]
- He, Z.; Gao, C.; Ding, X.; Wang, C.; Li, T.; Wu, C. A Review of Fault Defense Technologies for Phase-Switching Failures in Multi-Feed High-Voltage Direct Current Transmission Systems. High Volt. Technol. 2024, 50, 2735–2746. [Google Scholar] [CrossRef]
- Wu, W. Research on the Wideband Oscillation Mechanism and Suppression Methods of New Energy Power Generation Connected to Weak Grids. Ph.D. Thesis, Hunan University, Changsha, China, 2019. [Google Scholar] [CrossRef]
- Gao, Y. Impedance Modeling of Double-Feedback Wind Power Grid-Connected Systems and Analysis of Sub/Super-Synchronous Oscillation Mechanisms. Master’s Thesis, North China Electric Power University, Beijing, China, 2020. [Google Scholar] [CrossRef]
- Xu, Y. Modeling of Impedance and Analysis of Grid Stability of Wind Turbines Under Oscillation Frequency Coupling. Ph.D. Thesis, Zhejiang University, Hangzhou, China, 2021. [Google Scholar] [CrossRef]
- Zhang, X.; Xu, S.; Huang, H.; Zheng, P.; Wang, L.; Wang, X.; Wang, Y. Risk prediction of sub-synchronous oscillation based on the black-box impedance model of DFIG for multiple operating conditions. In Proceedings of the 12th International Conference on Renewable Power Generation (RPG 2023), Shanghai, China, 14–15 October 2023; pp. 686–693. [Google Scholar] [CrossRef]
Disclaimer/Publisher’s Note: The statements, opinions and data contained in all publications are solely those of the individual author(s) and contributor(s) and not of MDPI and/or the editor(s). MDPI and/or the editor(s) disclaim responsibility for any injury to people or property resulting from any ideas, methods, instructions or products referred to in the content. |
© 2025 by the authors. Licensee MDPI, Basel, Switzerland. This article is an open access article distributed under the terms and conditions of the Creative Commons Attribution (CC BY) license (https://creativecommons.org/licenses/by/4.0/).