1. Introduction
Groundwater management in volcanic islands represents a permanent challenge due to the scarcity of surface resources and the almost exclusive dependence on groundwater aquifers [
1]. In territories such as Tenerife (Canary Islands, Spain), more than 90% of the supply comes from wells and galleries [
2]. This situation is further aggravated by the increasing pressure of tourism, which in the archipelago exceeds 12 million visitors annually, demanding a robust and sustainable water infrastructure [
3].
Unlike other continental regions, where groundwater resources can be managed through artificial recharge or the exploitation of freshwater, in the Canary Islands regulations stipulate that only saline or brackish waters may be extracted (mainly for desalination purposes), with the aim of preserving freshwater reserves for subsequent desalination through reverse osmosis plants [
2]. In this way, freshwater resources are protected from overexploitation, while brackish or saline water becomes the main input to meet both tourist and agricultural demand. This regulatory framework assigns a central role to the determination of hydrochemical water quality during the exploration phase, particularly salinity and electrical conductivity [
4].
Within this context, geophysical methods have been consolidated as key tools for the indirect characterization of the subsurface. Among them, electromagnetic (EM) methods—such as Time-Domain Electromagnetics (TDEM) or Frequency-Domain Electromagnetics (FDEM)—have shown strong potential in sedimentary environments and alluvial basins, enabling the identification of aquifers and the delineation of marine intrusion fronts [
5,
6,
7]. However, in volcanic islands such as Tenerife, these methods face significant limitations. The presence of overlapping basaltic flows, the high magnetization of certain layers, ambient electromagnetic noise, the high resistivity of some materials, and the strong lateral heterogeneity of volcanic terrains generate complex electromagnetic responses that are often difficult to interpret [
8]. In addition, the pronounced topography and marked anisotropy of the medium constrain the reliability of 1D or 2D inversions in these contexts [
9].
In contrast to these difficulties, direct current electrical methods, and in particular Electrical Resistivity Tomography (ERT), offer substantial advantages. ERT is based on the controlled injection of electric current into the subsurface and the measurement of potential differences at the surface, allowing the construction of two-dimensional resistivity sections. Its strength lies in the ability to detect, with high resolution (typically between 1 and 10 m, depending on electrode spacing and array configuration), lithological changes, particularly resistivity contrasts between basaltic flows, pyroclastic deposits, weathered materials, and sedimentary infill, and most importantly, the transition between freshwater and saltwater-saturated materials [
10,
11]. This feature makes ERT especially suitable for volcanic islands characterized by complex “layer-cake” stratigraphy with multiple lava flow units, where alternating high and low resistivity layers enhance subsurface discrimination. Recent studies have demonstrated the effectiveness of ERT in identifying marine intrusion in coastal aquifers of diverse geological nature, ranging from carbonate systems to alluvial formations [
12,
13,
14].
The multi-scale and multidimensional nature of ERT also allows its integration into three-dimensional models using specialized software such as Oasis Montaj [
15]. These 3D models represent a substantial advancement in geomatic representation, as they provide volumetric resistivity data that reduce the uncertainty associated with two-dimensional inversions. The spatial interpolation of ERT profiles enables visualization of the geometry of conductive bodies in a 3D framework, facilitating decision-making regarding borehole siting [
16,
17].
The importance of characterizing saline intrusion in the Canary Islands is not only hydrogeological but also economic and strategic. For the hotel sector, the availability of saline water is even desirable, since its treatment by reverse osmosis ensures the required quality for supply while minimizing the impact on freshwater aquifers [
18]. In this regard, the application of ERT combined with 3D modeling is not only a scientific advancement but also a practical tool for water resource planning and management.
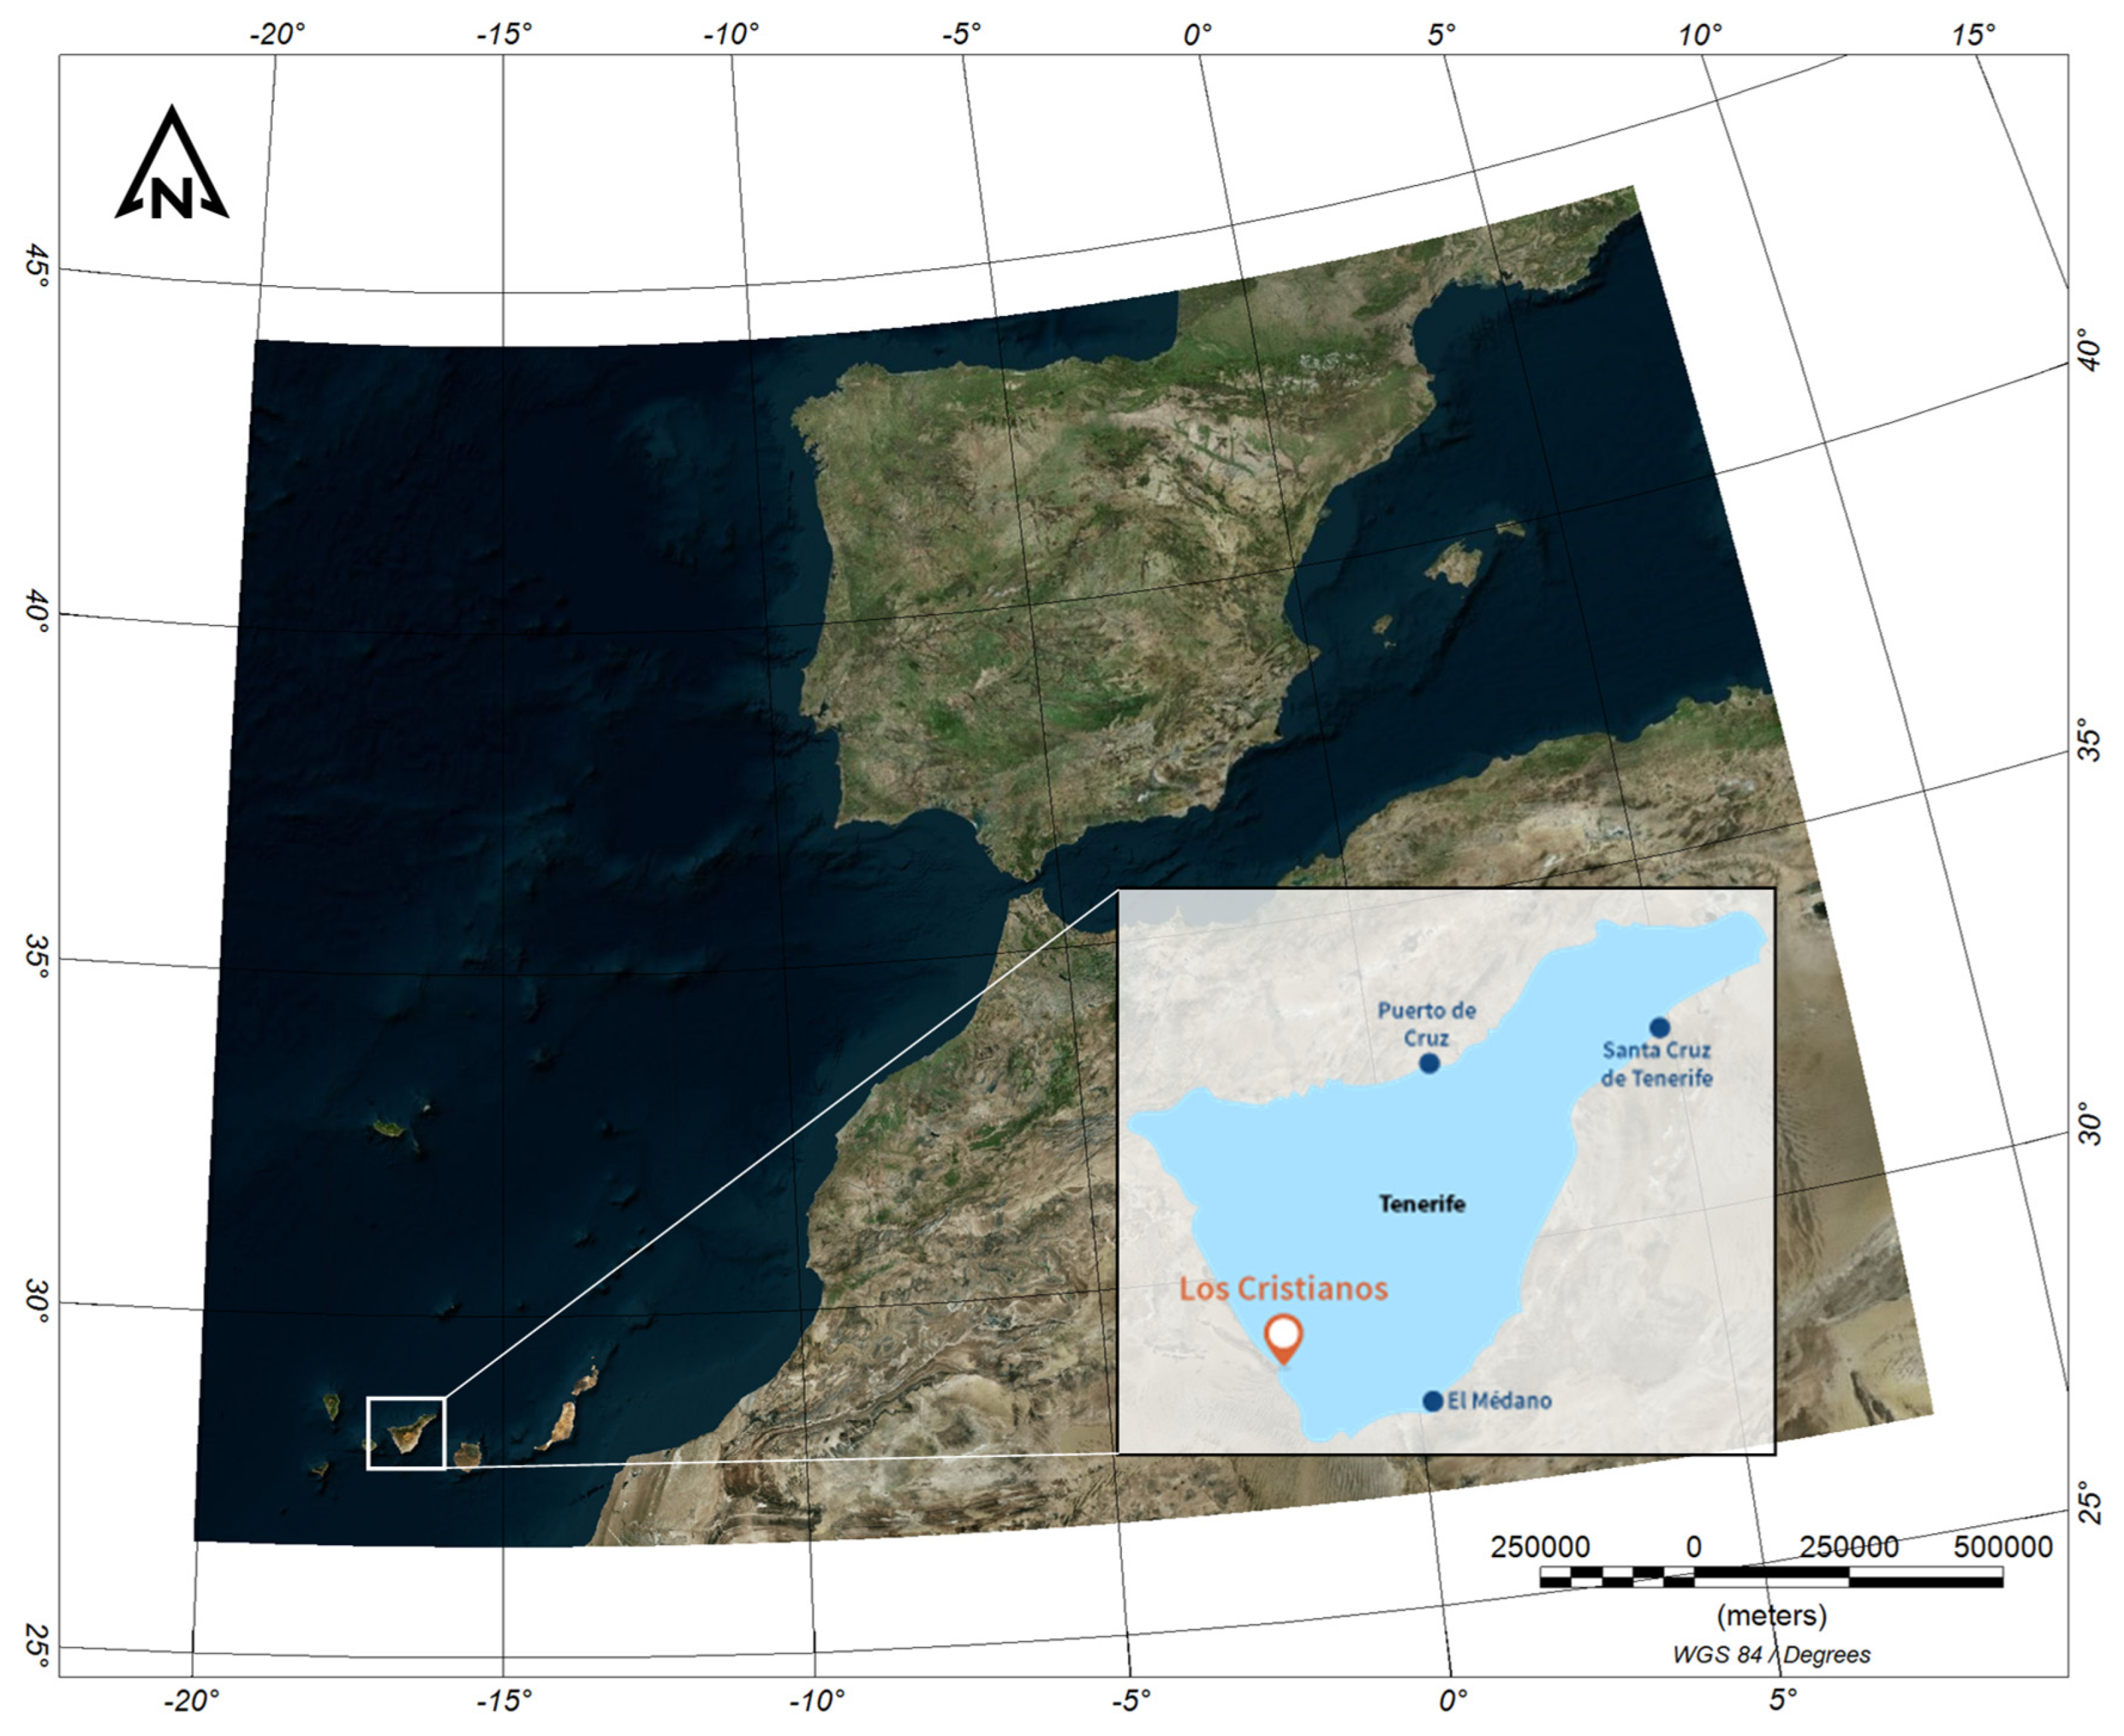
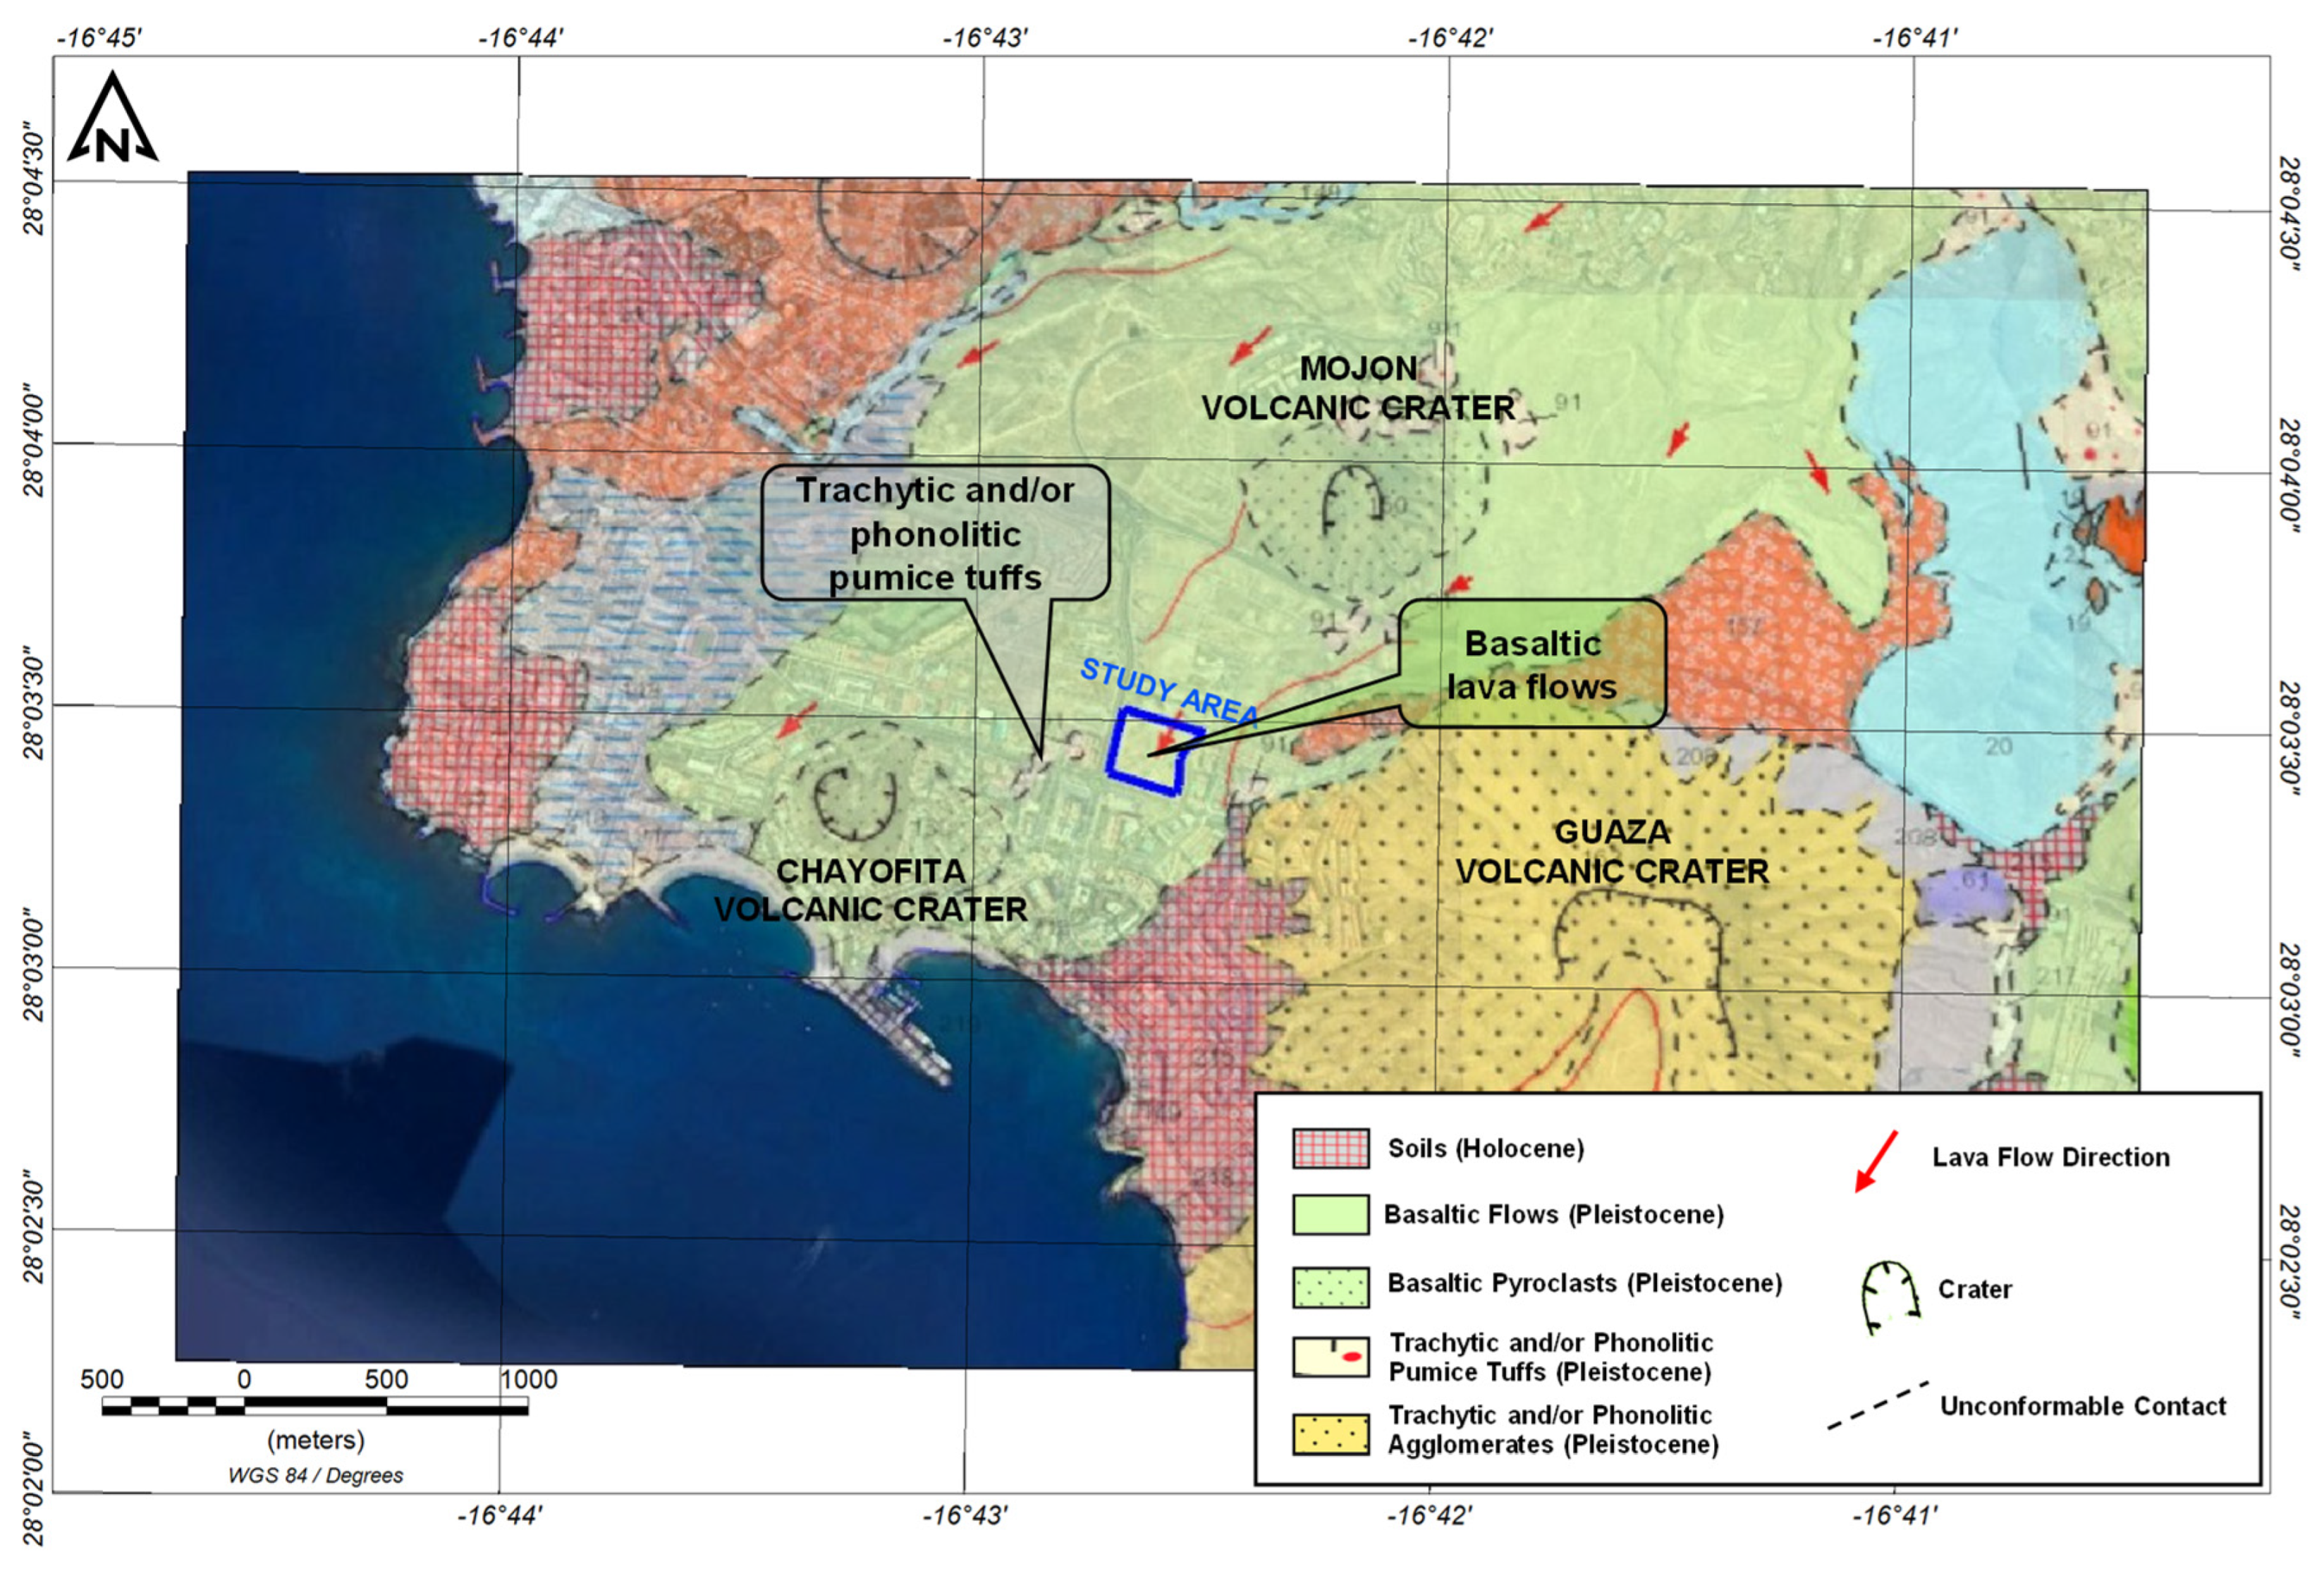
The present study focuses on the area of Los Cristianos (Arona, Tenerife), one of the island’s main tourist zones, where the pressure on groundwater resources is especially intense. Through the application of Electrical Resistivity Tomography profiles integrated into a 3D model, the objectives are to (i) assess the distribution of geoelectrical domains at depth, (ii) identify conductive horizons associated with saline waters, and (iii) establish objective criteria for borehole siting in a complex regulatory and geological framework. In doing so, this study not only contributes to the hydrogeophysical knowledge of Tenerife but also establishes the basis for a replicable methodology in other volcanic island environments. Previous studies have primarily focused on 2D electrical soundings or hydrochemical characterizations, often neglecting the three-dimensional variability of volcanic formations and the influence of salinity gradients. This work aims to fill this gap by developing a 3D resistivity model from 2D ERT profiles, providing a novel framework for assessing saline intrusion and supporting borehole placement in volcanic-island settings.
3. Results
3.1. Electrical Resistivity Tomography Profiles
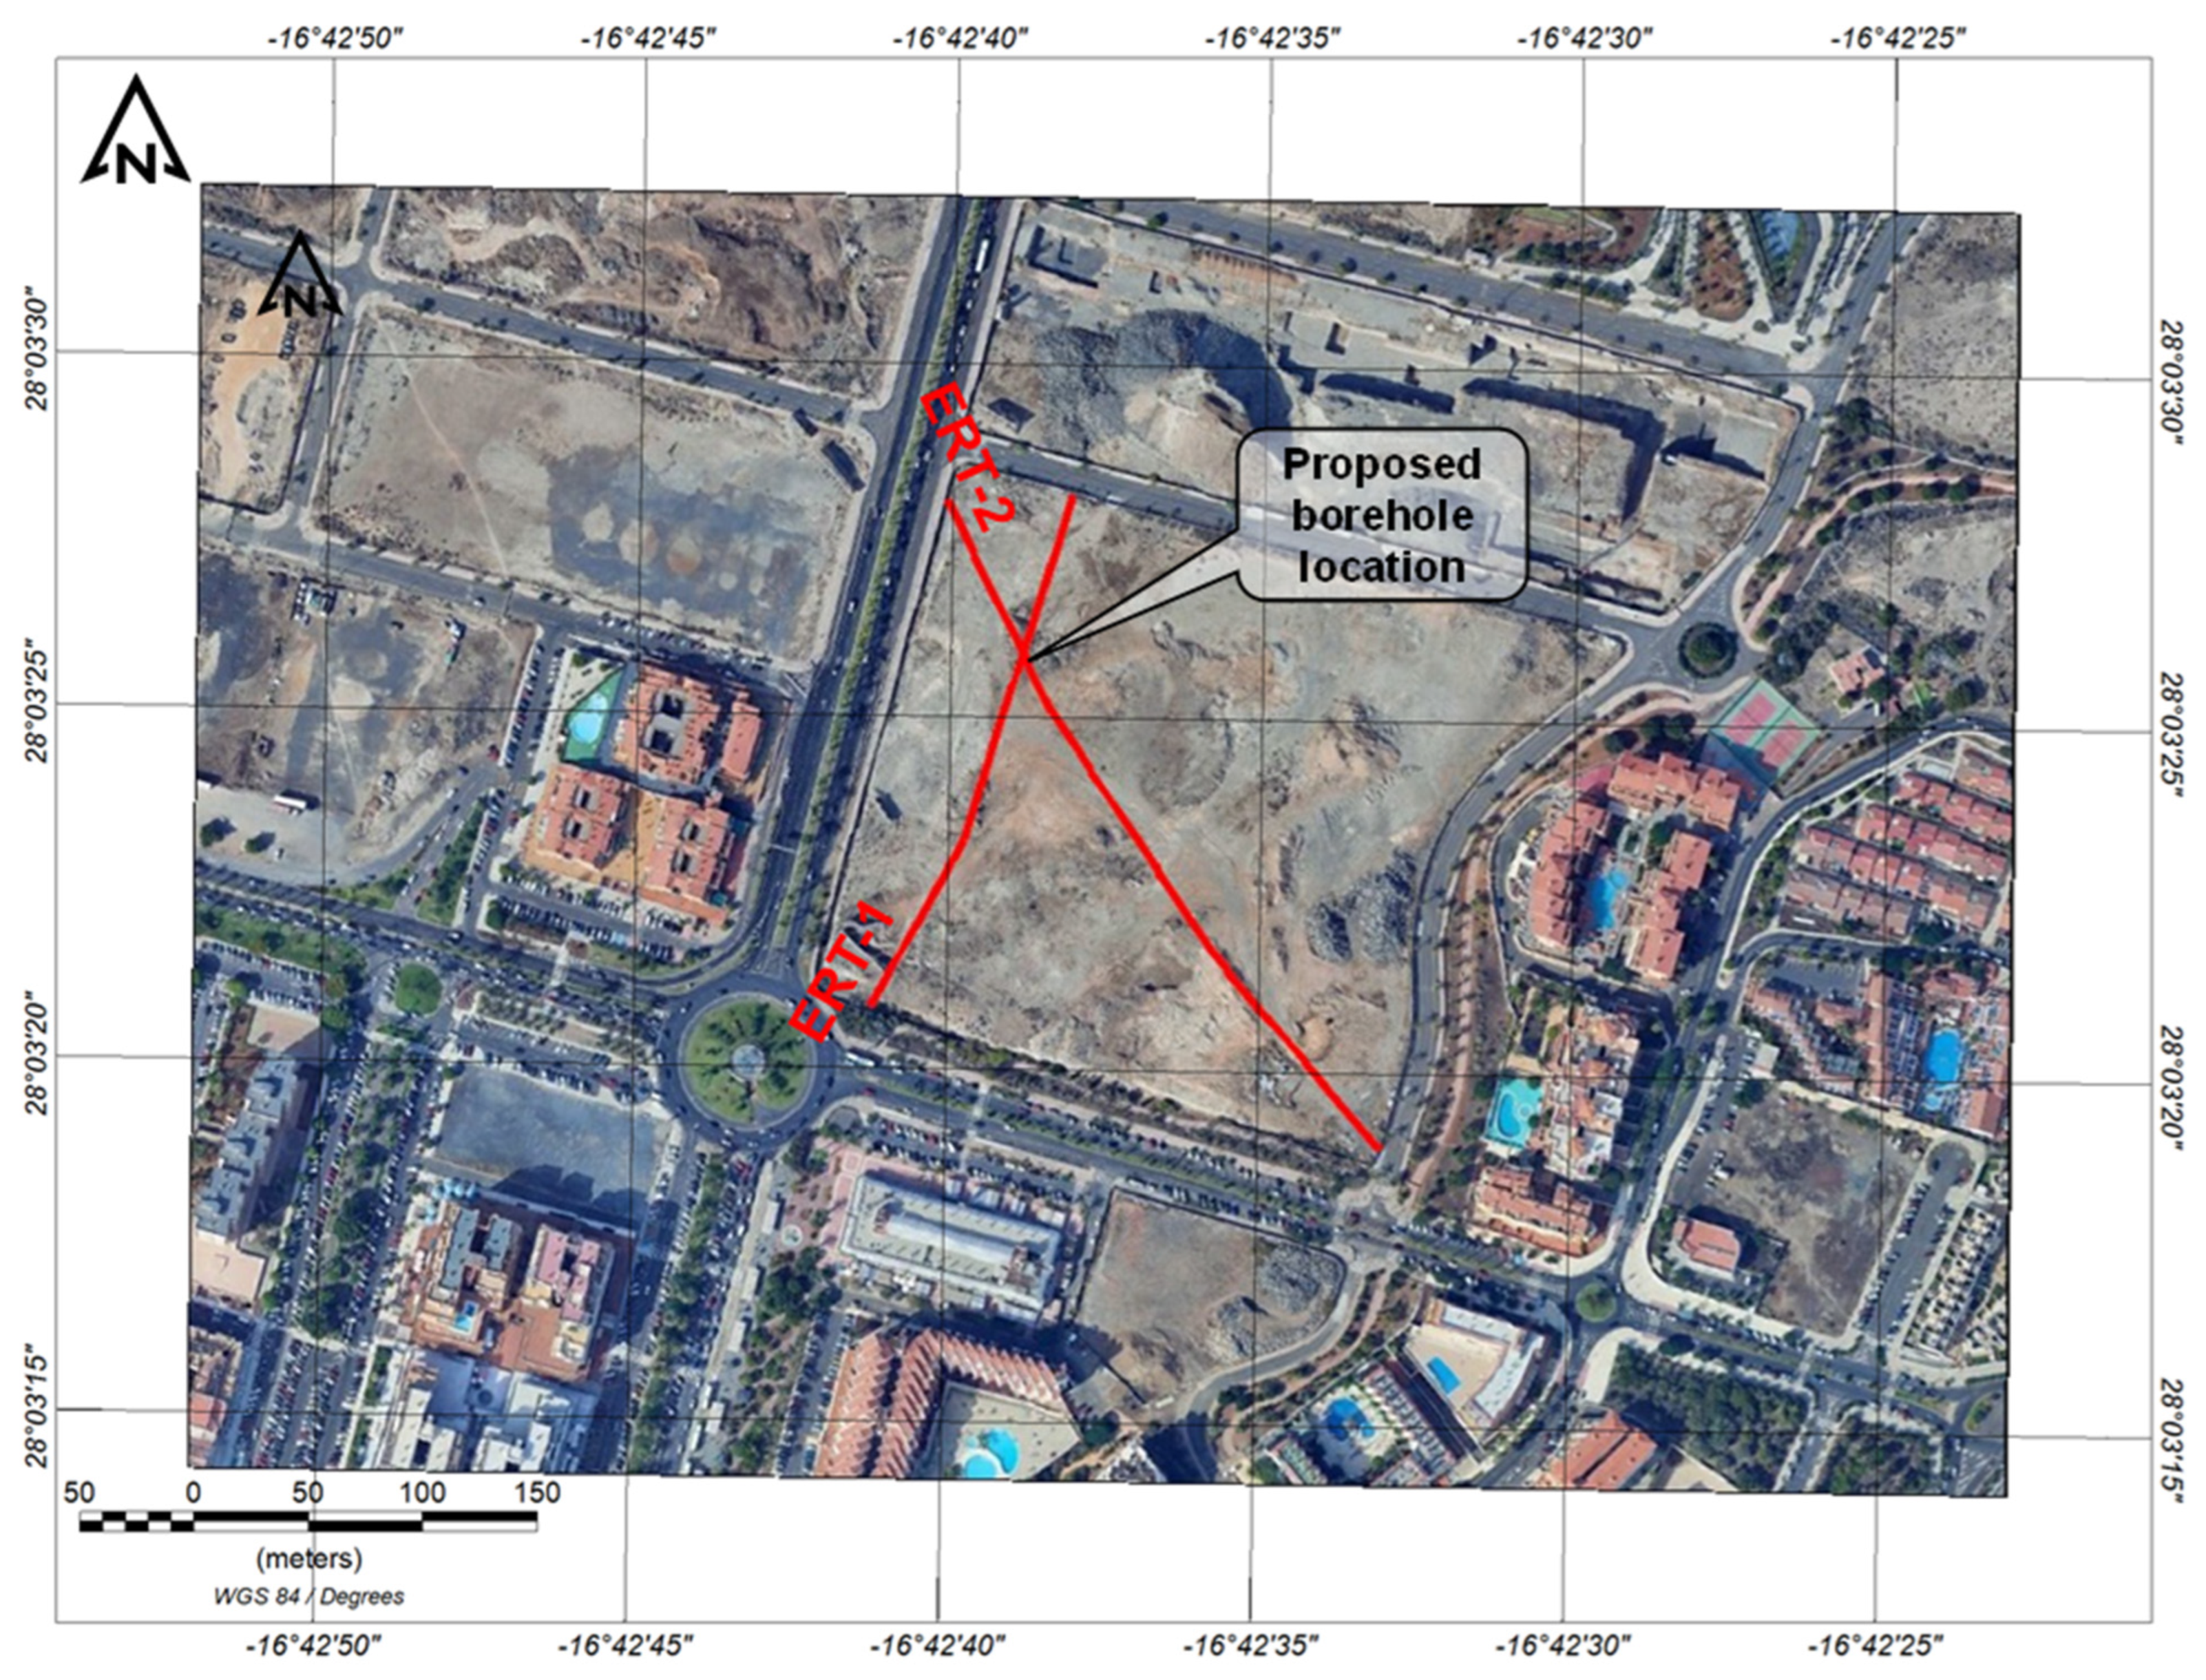
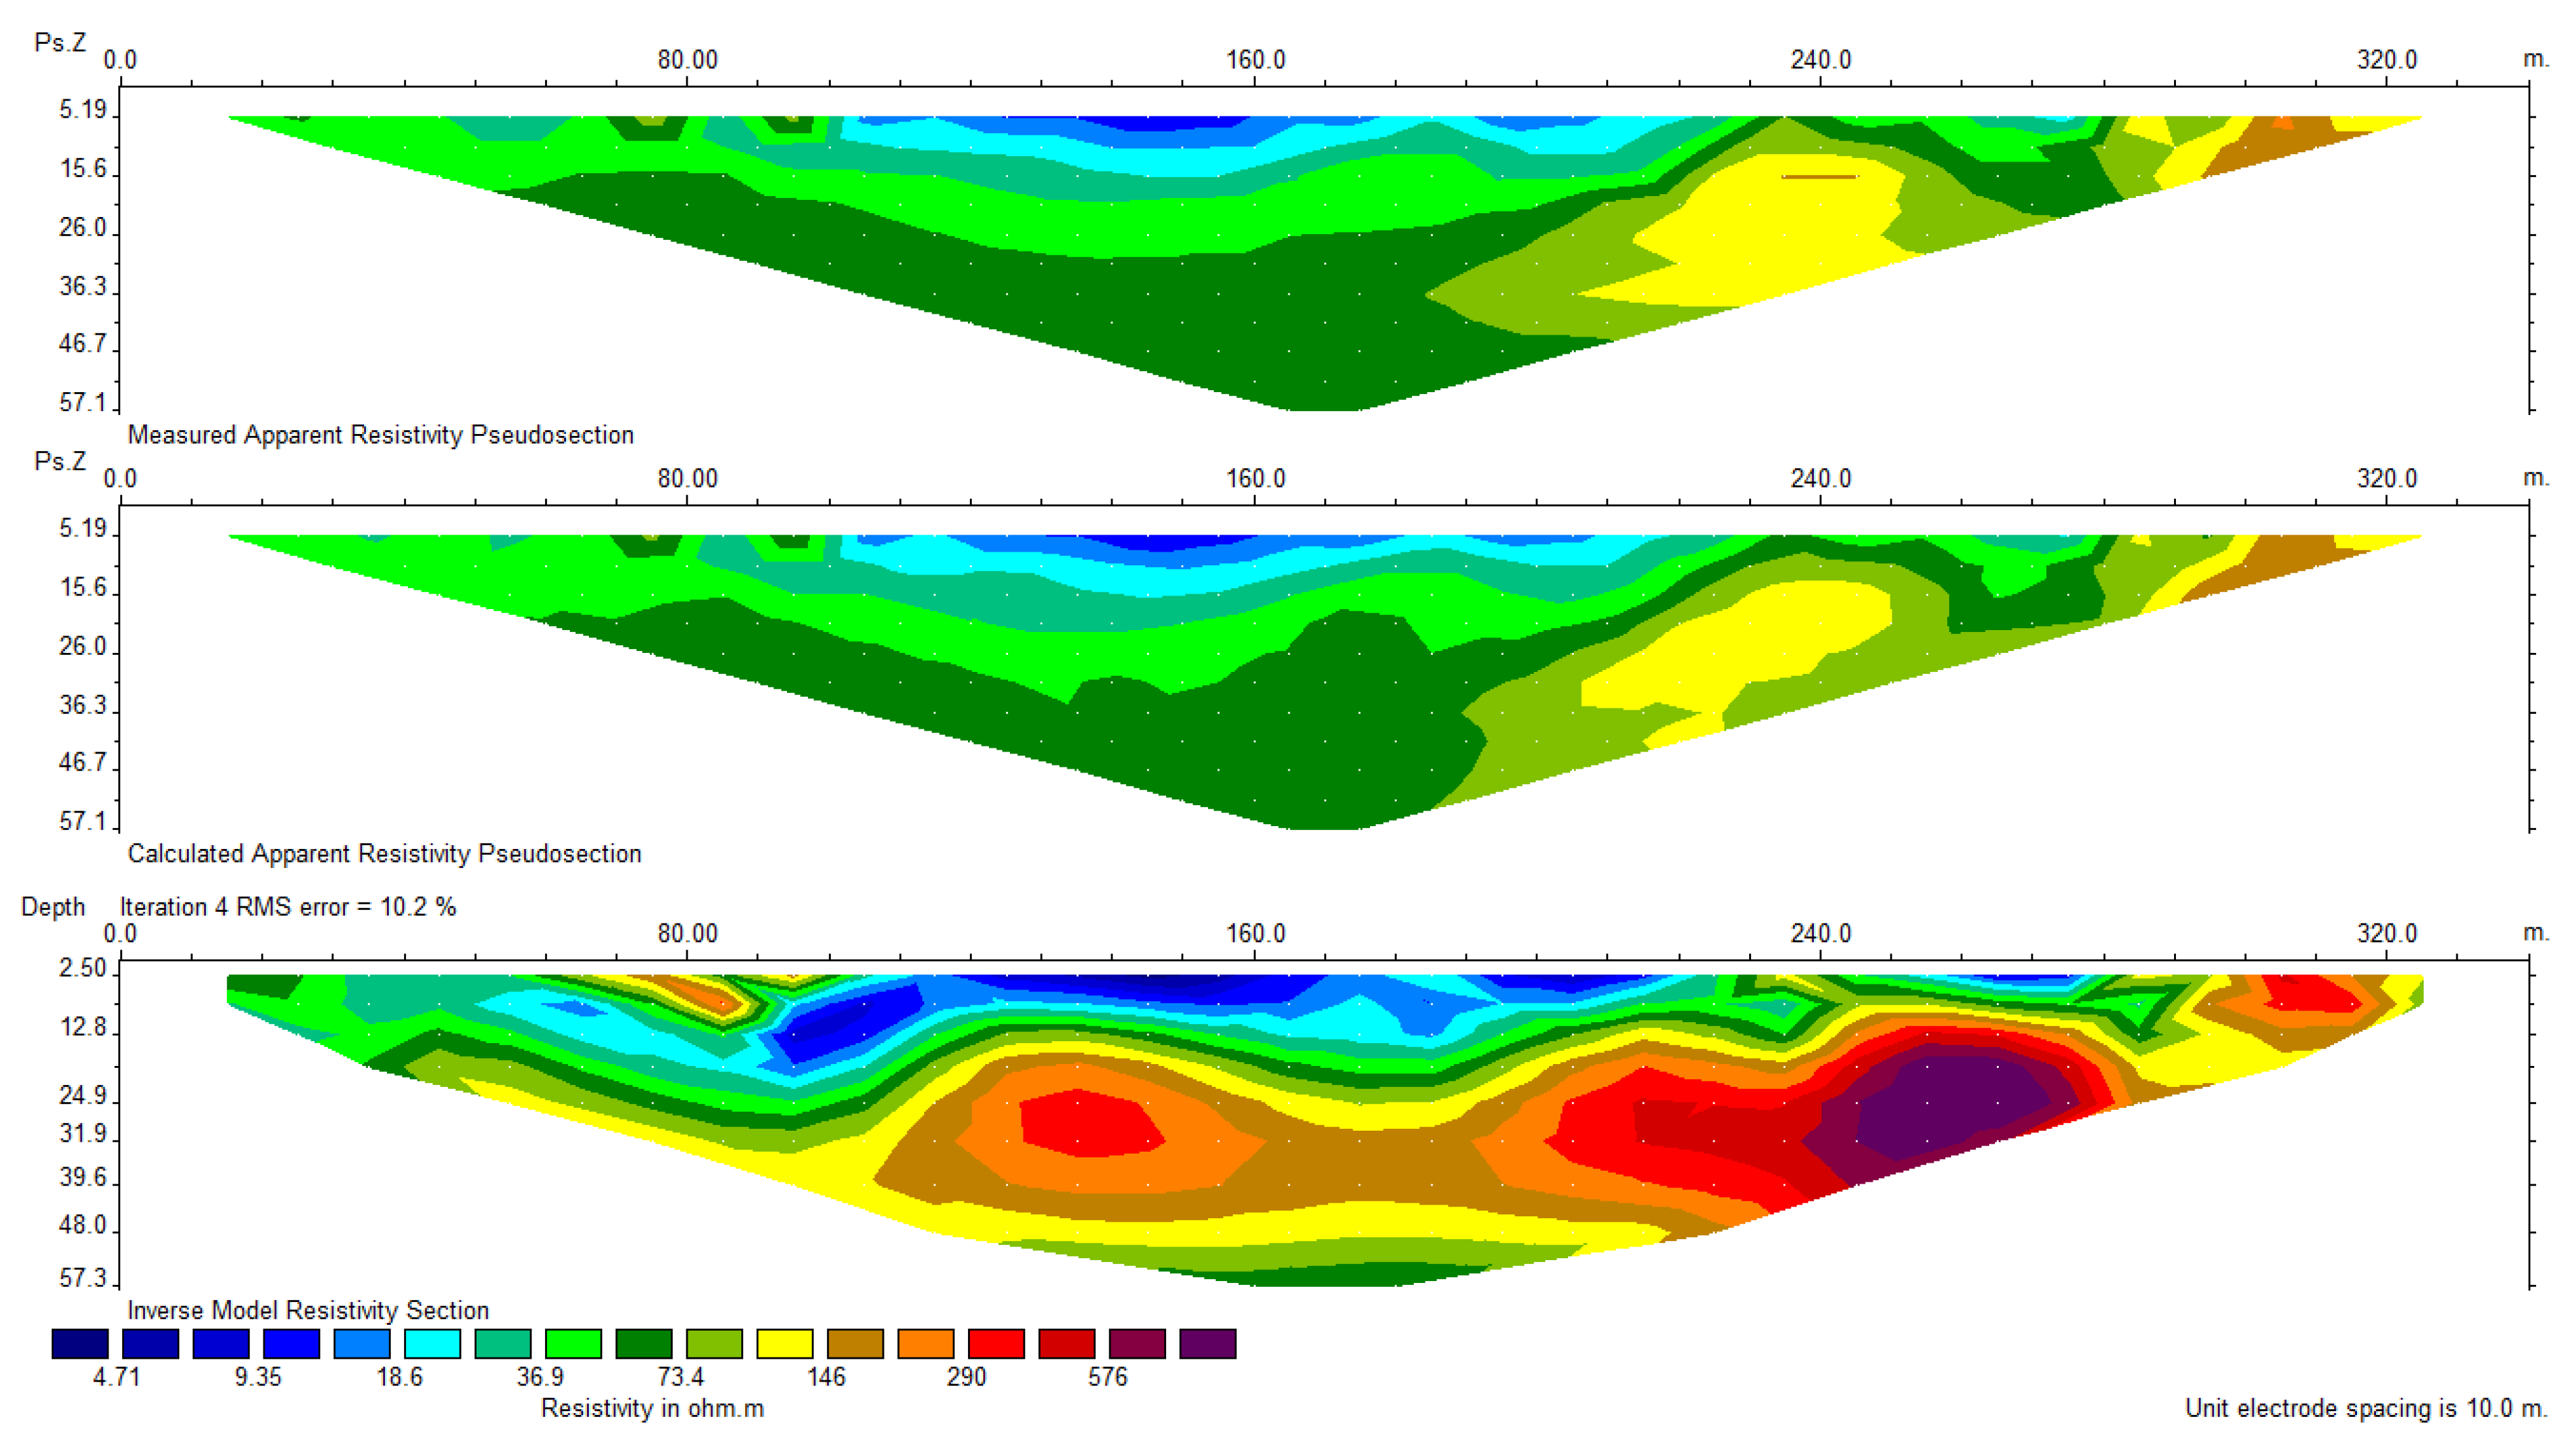
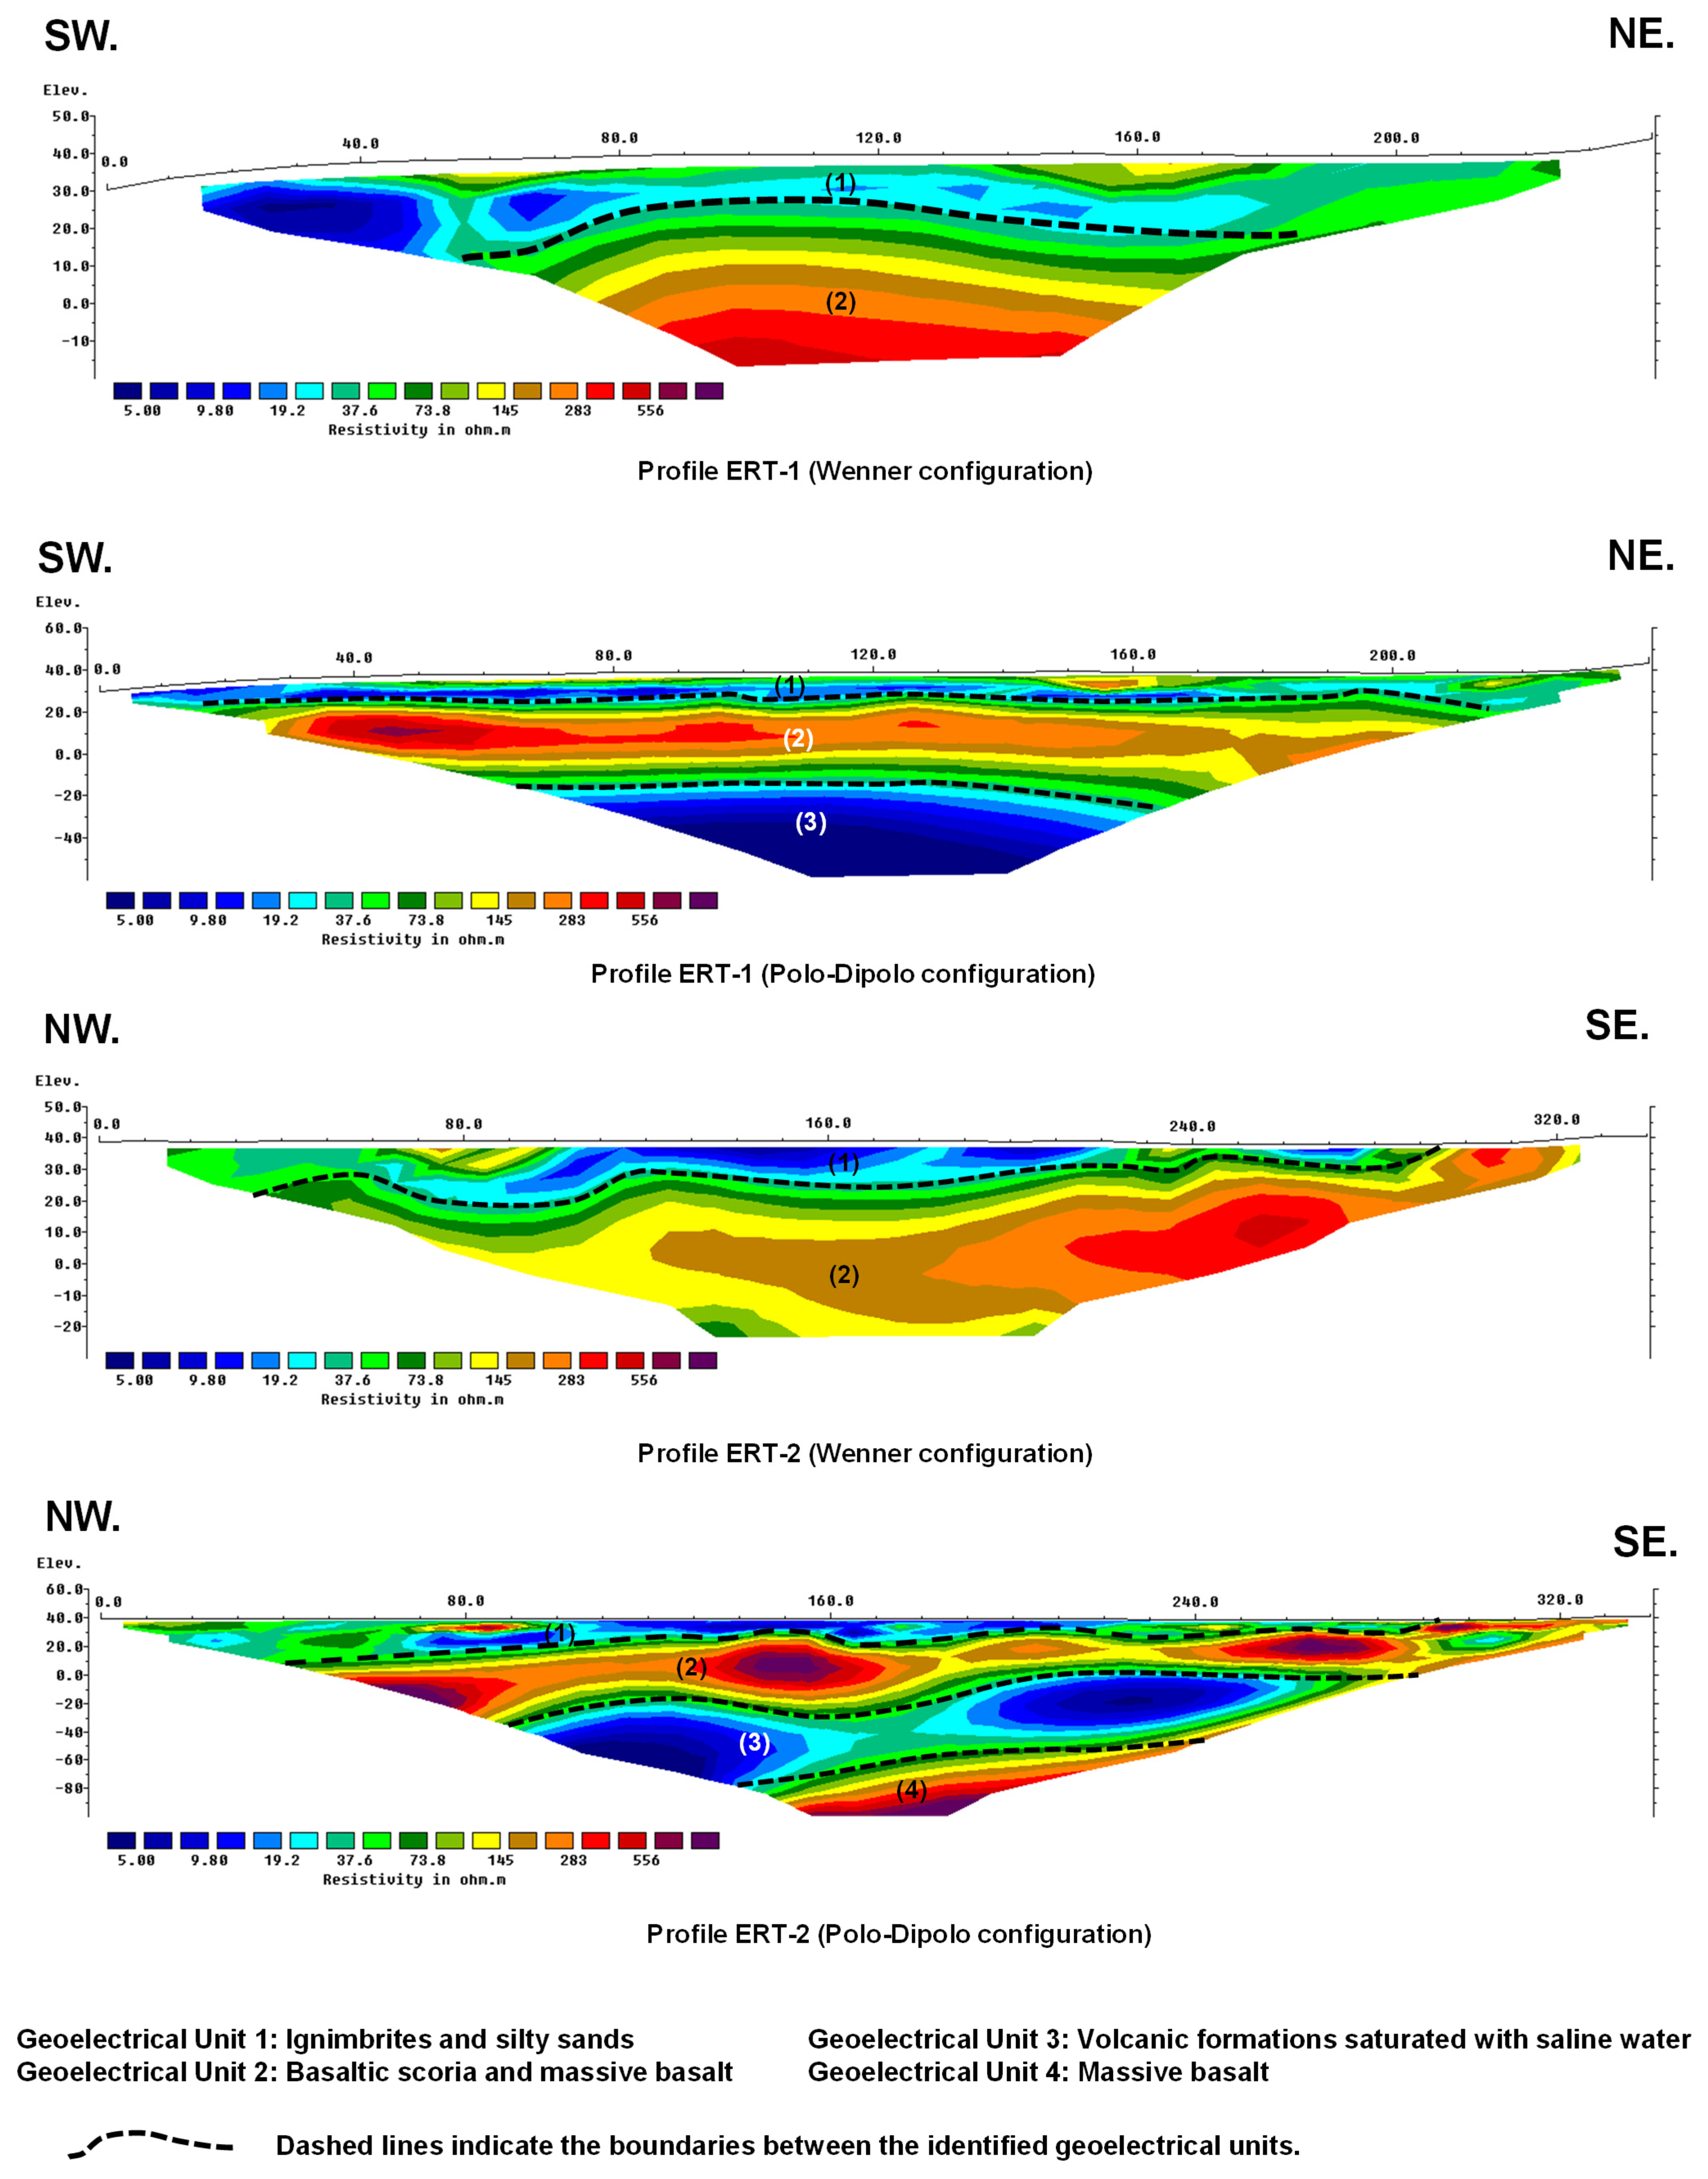
The Electrical Resistivity Tomography (ERT) surveys carried out in the Los Cristianos site provided two-dimensional resistivity sections (
Figure 6) with an investigation depth of nearly 100 m, sufficient to intercept the horizons of greatest hydrogeological interest.
In profile TE-1, oriented south–north, three main units can be distinguished. The shallow zone is dominated by ignimbrites (pumiceous pyroclastic flow deposits) and silty sands (<75 Ω·m) mainly composed of reworked volcanic materials. At depths between 10 and 15 m, a layer of basaltic scoria and massive basalts with intermediate resistivities (75–500 Ω·m) appears, corresponding to slightly altered materials with a low degree of saturation. In the basal part of the profile, at around 60 m depth, a horizon of volcanic formations saturated with saline water develops, characterized by resistivities below 20 Ω·m, which constitutes the main marker of marine intrusion in this sector. Although no direct physicochemical soil analyses were carried out, the interpretation of saline horizons is supported by resistivity values below 20 Ω·m, which are consistent with those reported for saline and brackish groundwater in volcanic coastal aquifer.
Profile TE-2, oriented northwest–southeast, reveals a similar configuration, though with the presence of four units. At the surface, ignimbrites and silty sands of moderate resistivity outcrop again, followed by basaltic scoria and massive basalts with higher resistivity. In this case, however, the conductive domain, corresponding to volcanic formations saturated with saline water, dips towards the northwest. Additionally, in the deepest part of the section, an extra package of high-resistivity massive basalt is identified, acting as the electrical basement of the system.
The comparison between both profiles indicates that saline intrusion is shallower towards the coast, consistent with the hydrogeological gradient expected in coastal volcanic systems, where the freshwater–saltwater interface advances inland under the influence of marine pressure [
12,
14].
3.2. Identification of Geoelectrical Domains
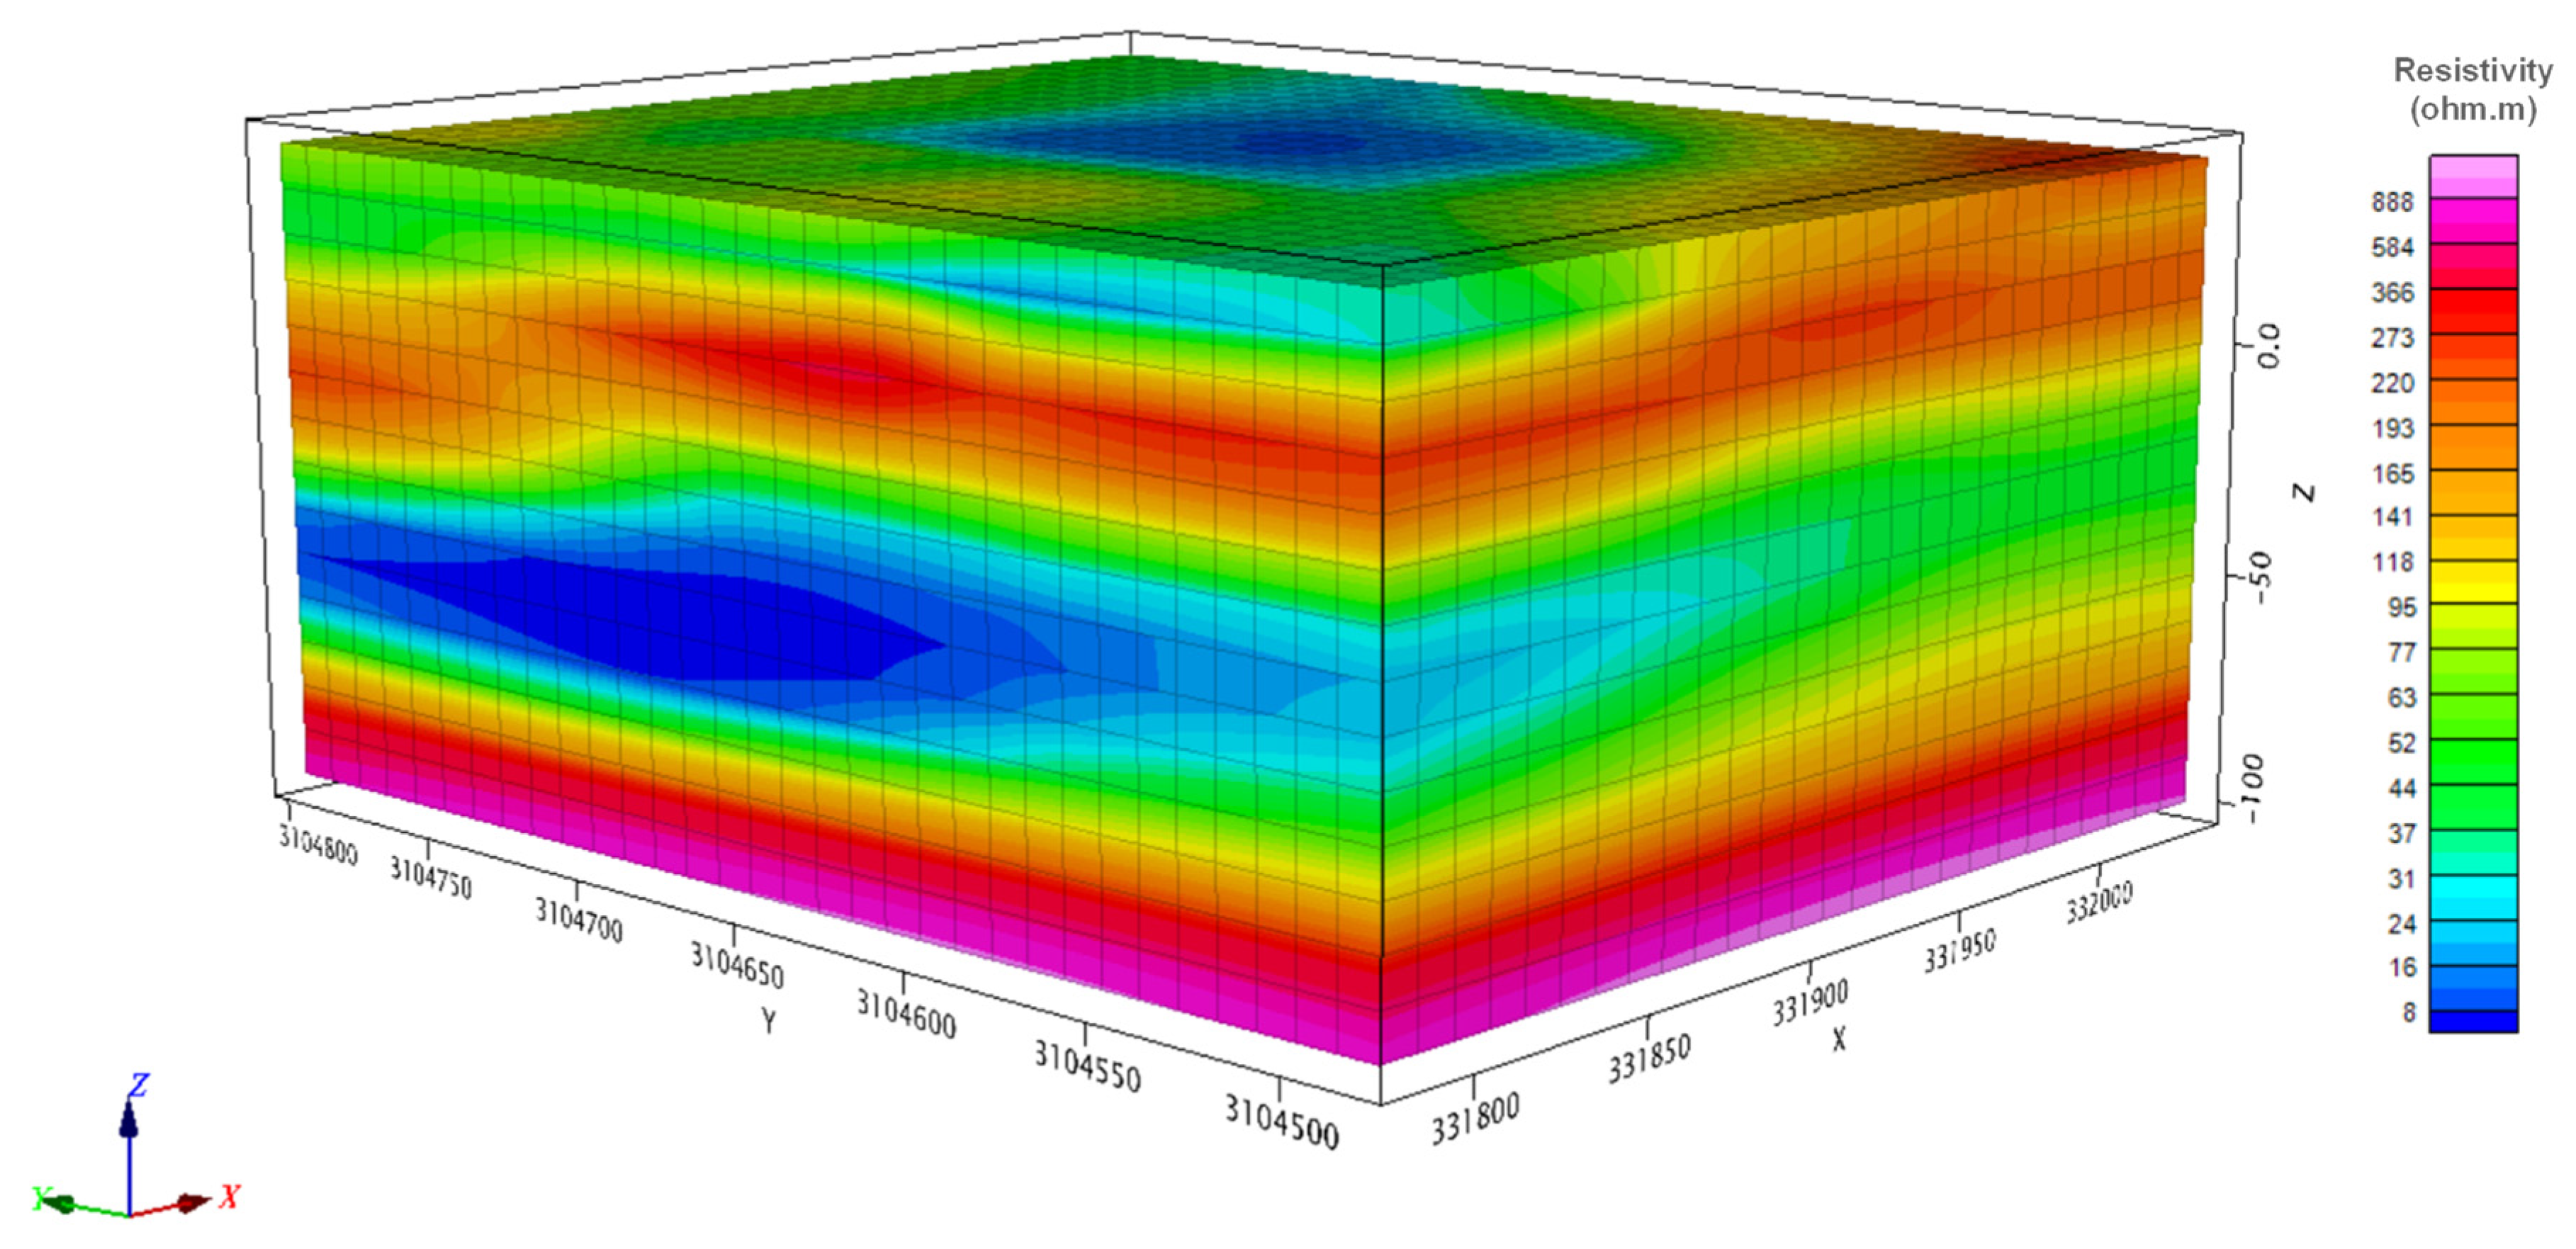
The three-dimensional interpolation of the profiles using Oasis Montaj allowed the construction of a volumetric resistivity model that provides a continuous spatial view of the distribution of geoelectrical domains (
Figure 7).
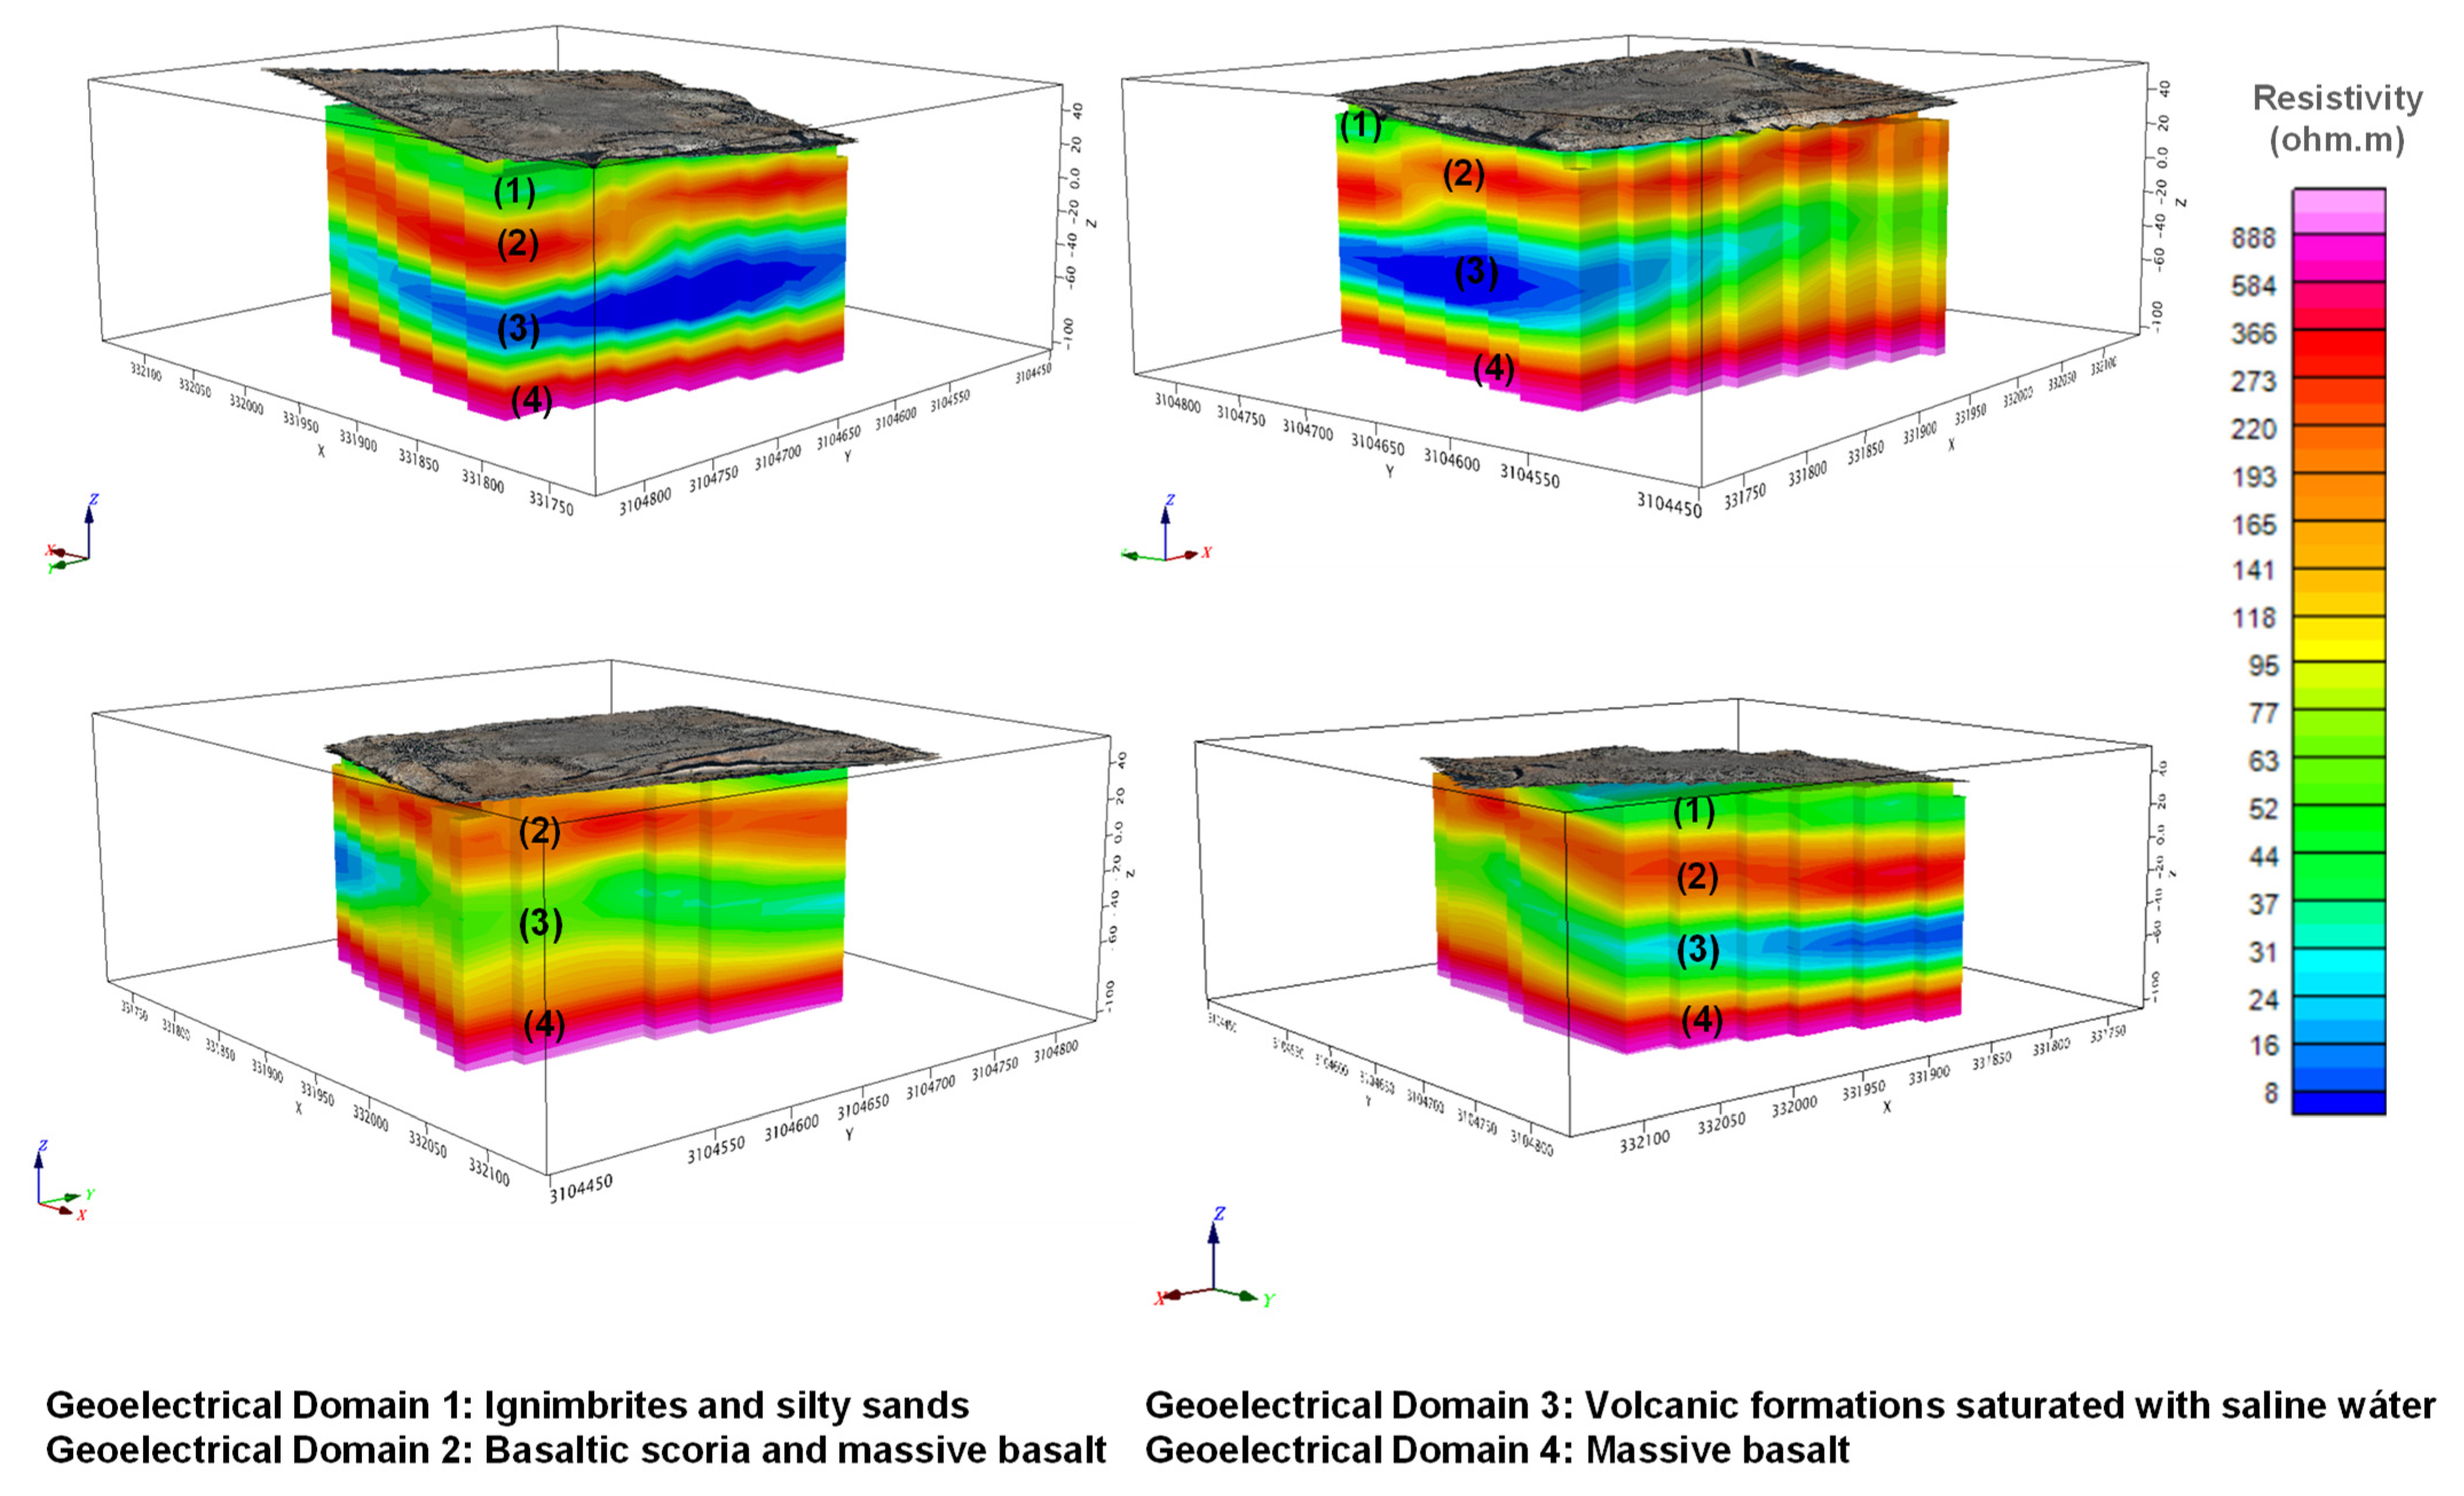
The joint analysis makes it possible to identify four geoelectrical domains consistent with the units interpreted in the sections. At the surface, there is a shallow domain of low to moderate resistivity (<75 Ω·m), attributable to ignimbrites and silty sands. Beneath this, an intermediate–resistive domain (75–500 Ω·m) develops, composed of basaltic scoria and massive basalts, corresponding to slightly altered materials with a low degree of saturation. At the base of both profiles, a deep conductive domain (<20 Ω·m) is identified, corresponding to volcanic formations saturated with saline water, which constitutes the main marker of marine intrusion [
26]. In ERT-1, it is located at around 60 m depth, while in ERT-2 it appears at shallower levels and dips northwestward, indicating a landward progression of the freshwater–saltwater interface consistent with the coastal hydrogeological gradient [
12,
14].
Locally, ERT-2 also reveals a deep package of very high-resistivity massive basalt (>500 Ω·m), which acts as the electrical basement of the system and controls the geometry of the saline wedge.
3.3. Geometry of the Saline Intrusion
The conductive horizon (<20 Ω·m) appears continuously in both profiles, although it shows notable differences in depth. In ERT-1, the level associated with marine intrusion is located at around 60 m throughout the section. In ERT-2, by contrast, the same horizon dips north-westward, reflecting greater inland penetration of salinity.
This lateral variation is highlighted in the three-dimensional model, where the marine intrusion advances at shallower depths in the southern sector of the plot (
Figure 8), closer to the coastline, consistent with previously developed hydrogeological models in Tenerife [
11]. Comparative studies in other volcanic archipelagos, such as Hawaii [
27] and Cape Verde [
28], have documented a similar behaviour: the marine intrusion develops as a saline wedge that progresses inland beneath volcanic materials, with a slope controlled by the natural hydraulic gradient, the permeability of the materials, and the intensity of groundwater exploitation.
3.4. Selection of Optimal Hydrogeological Drilling Zones
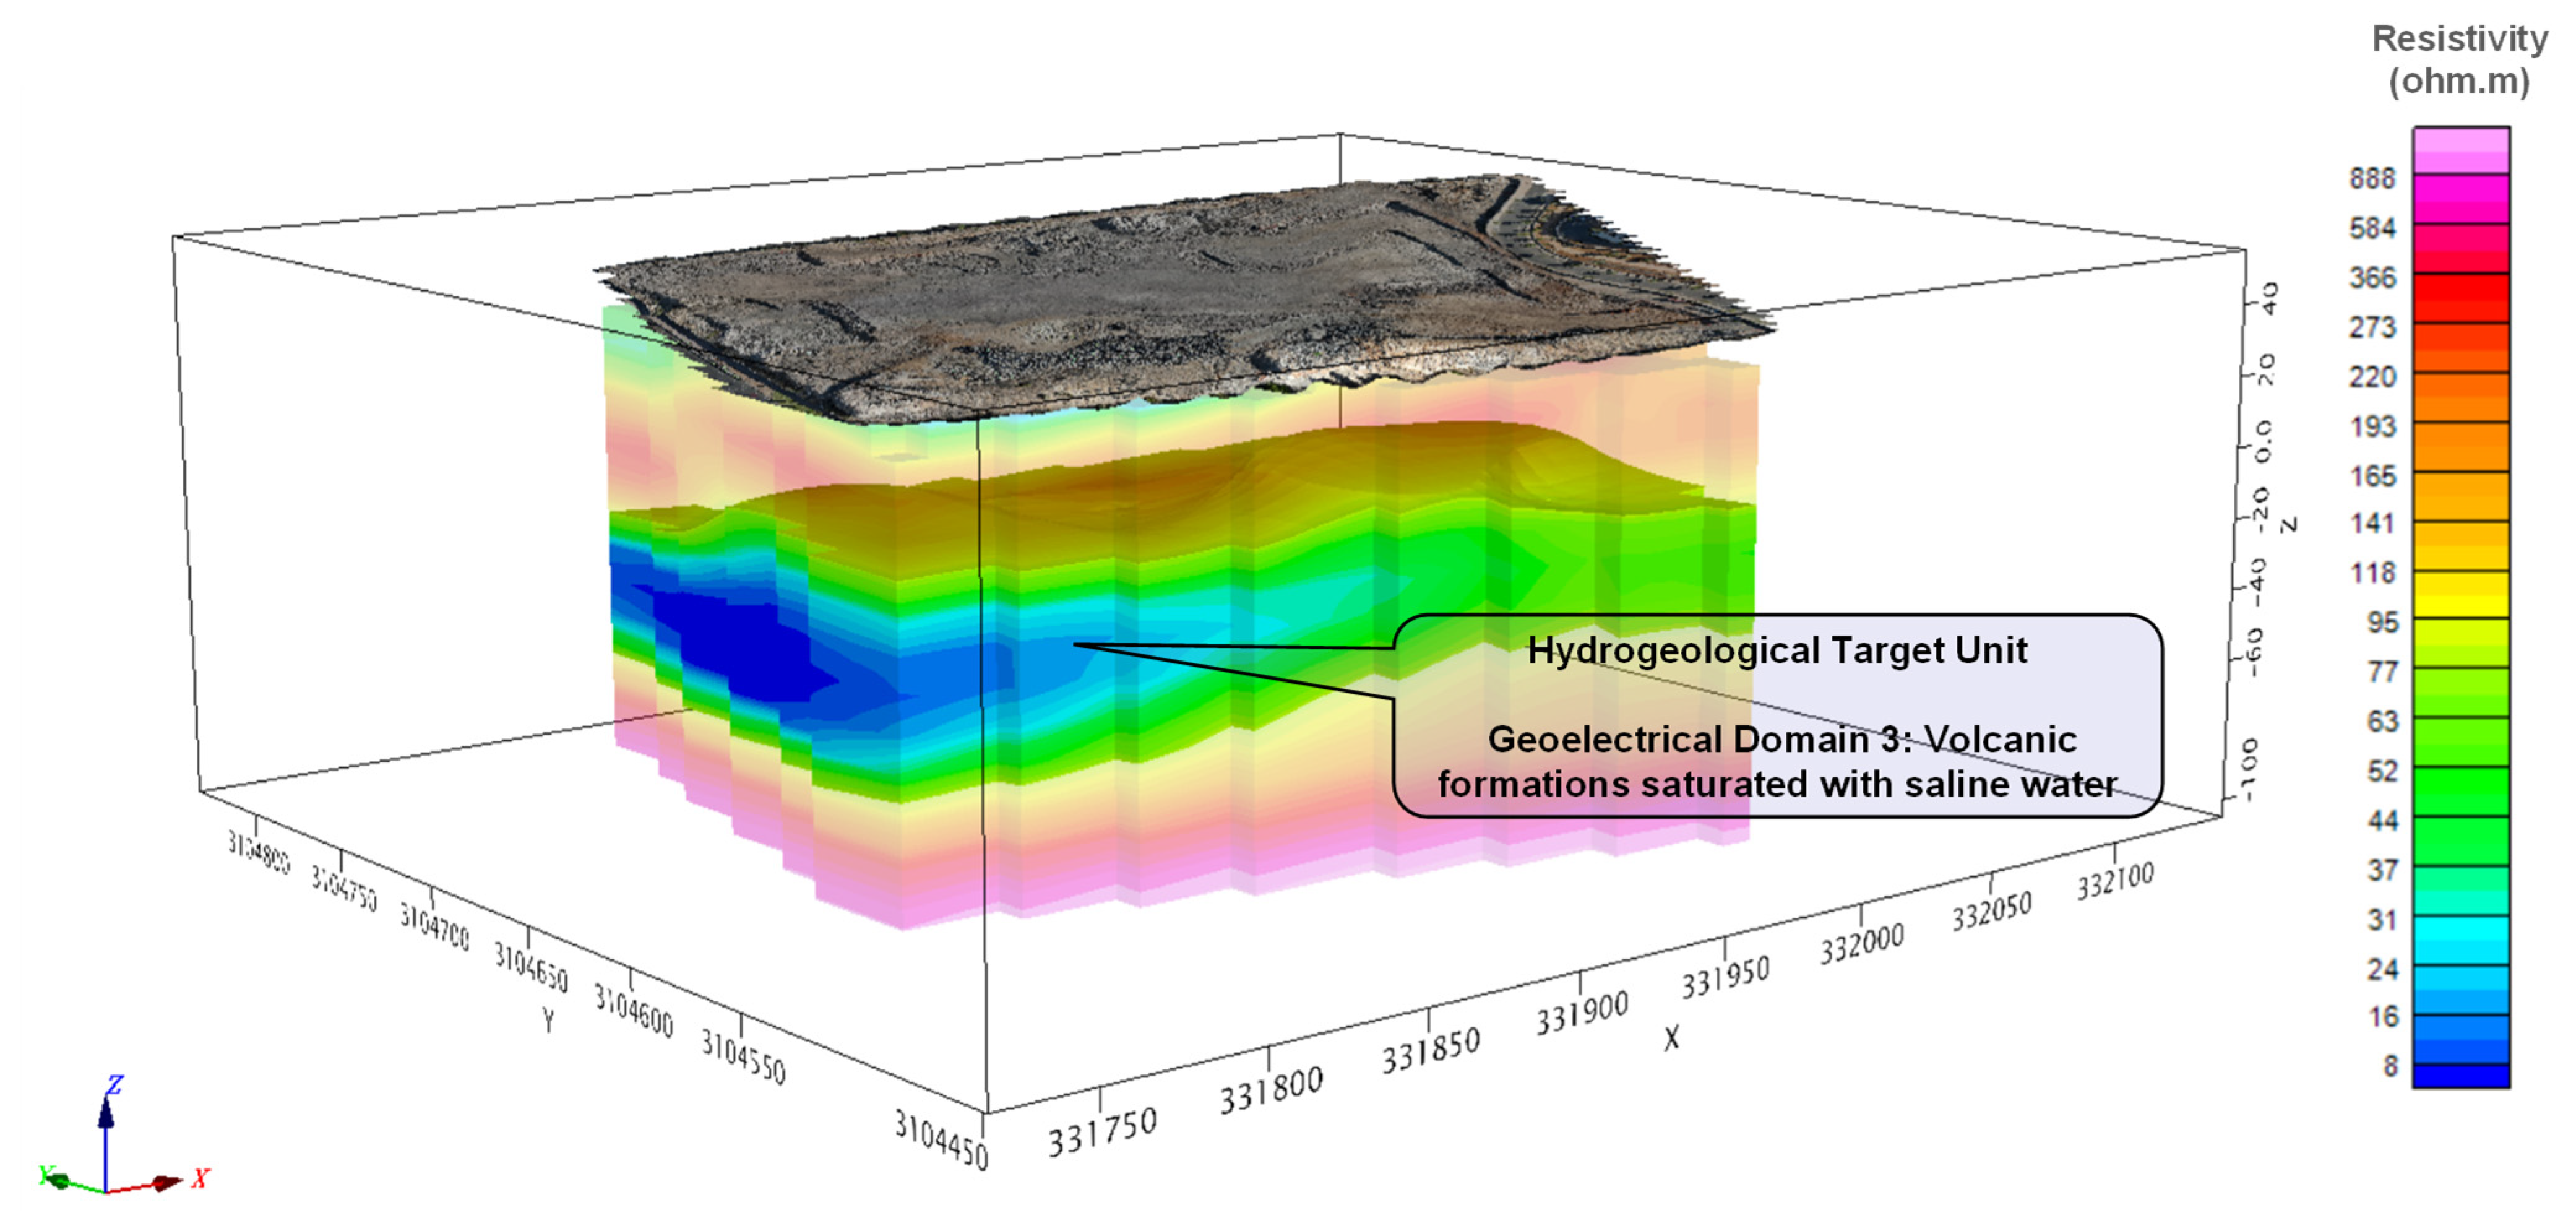
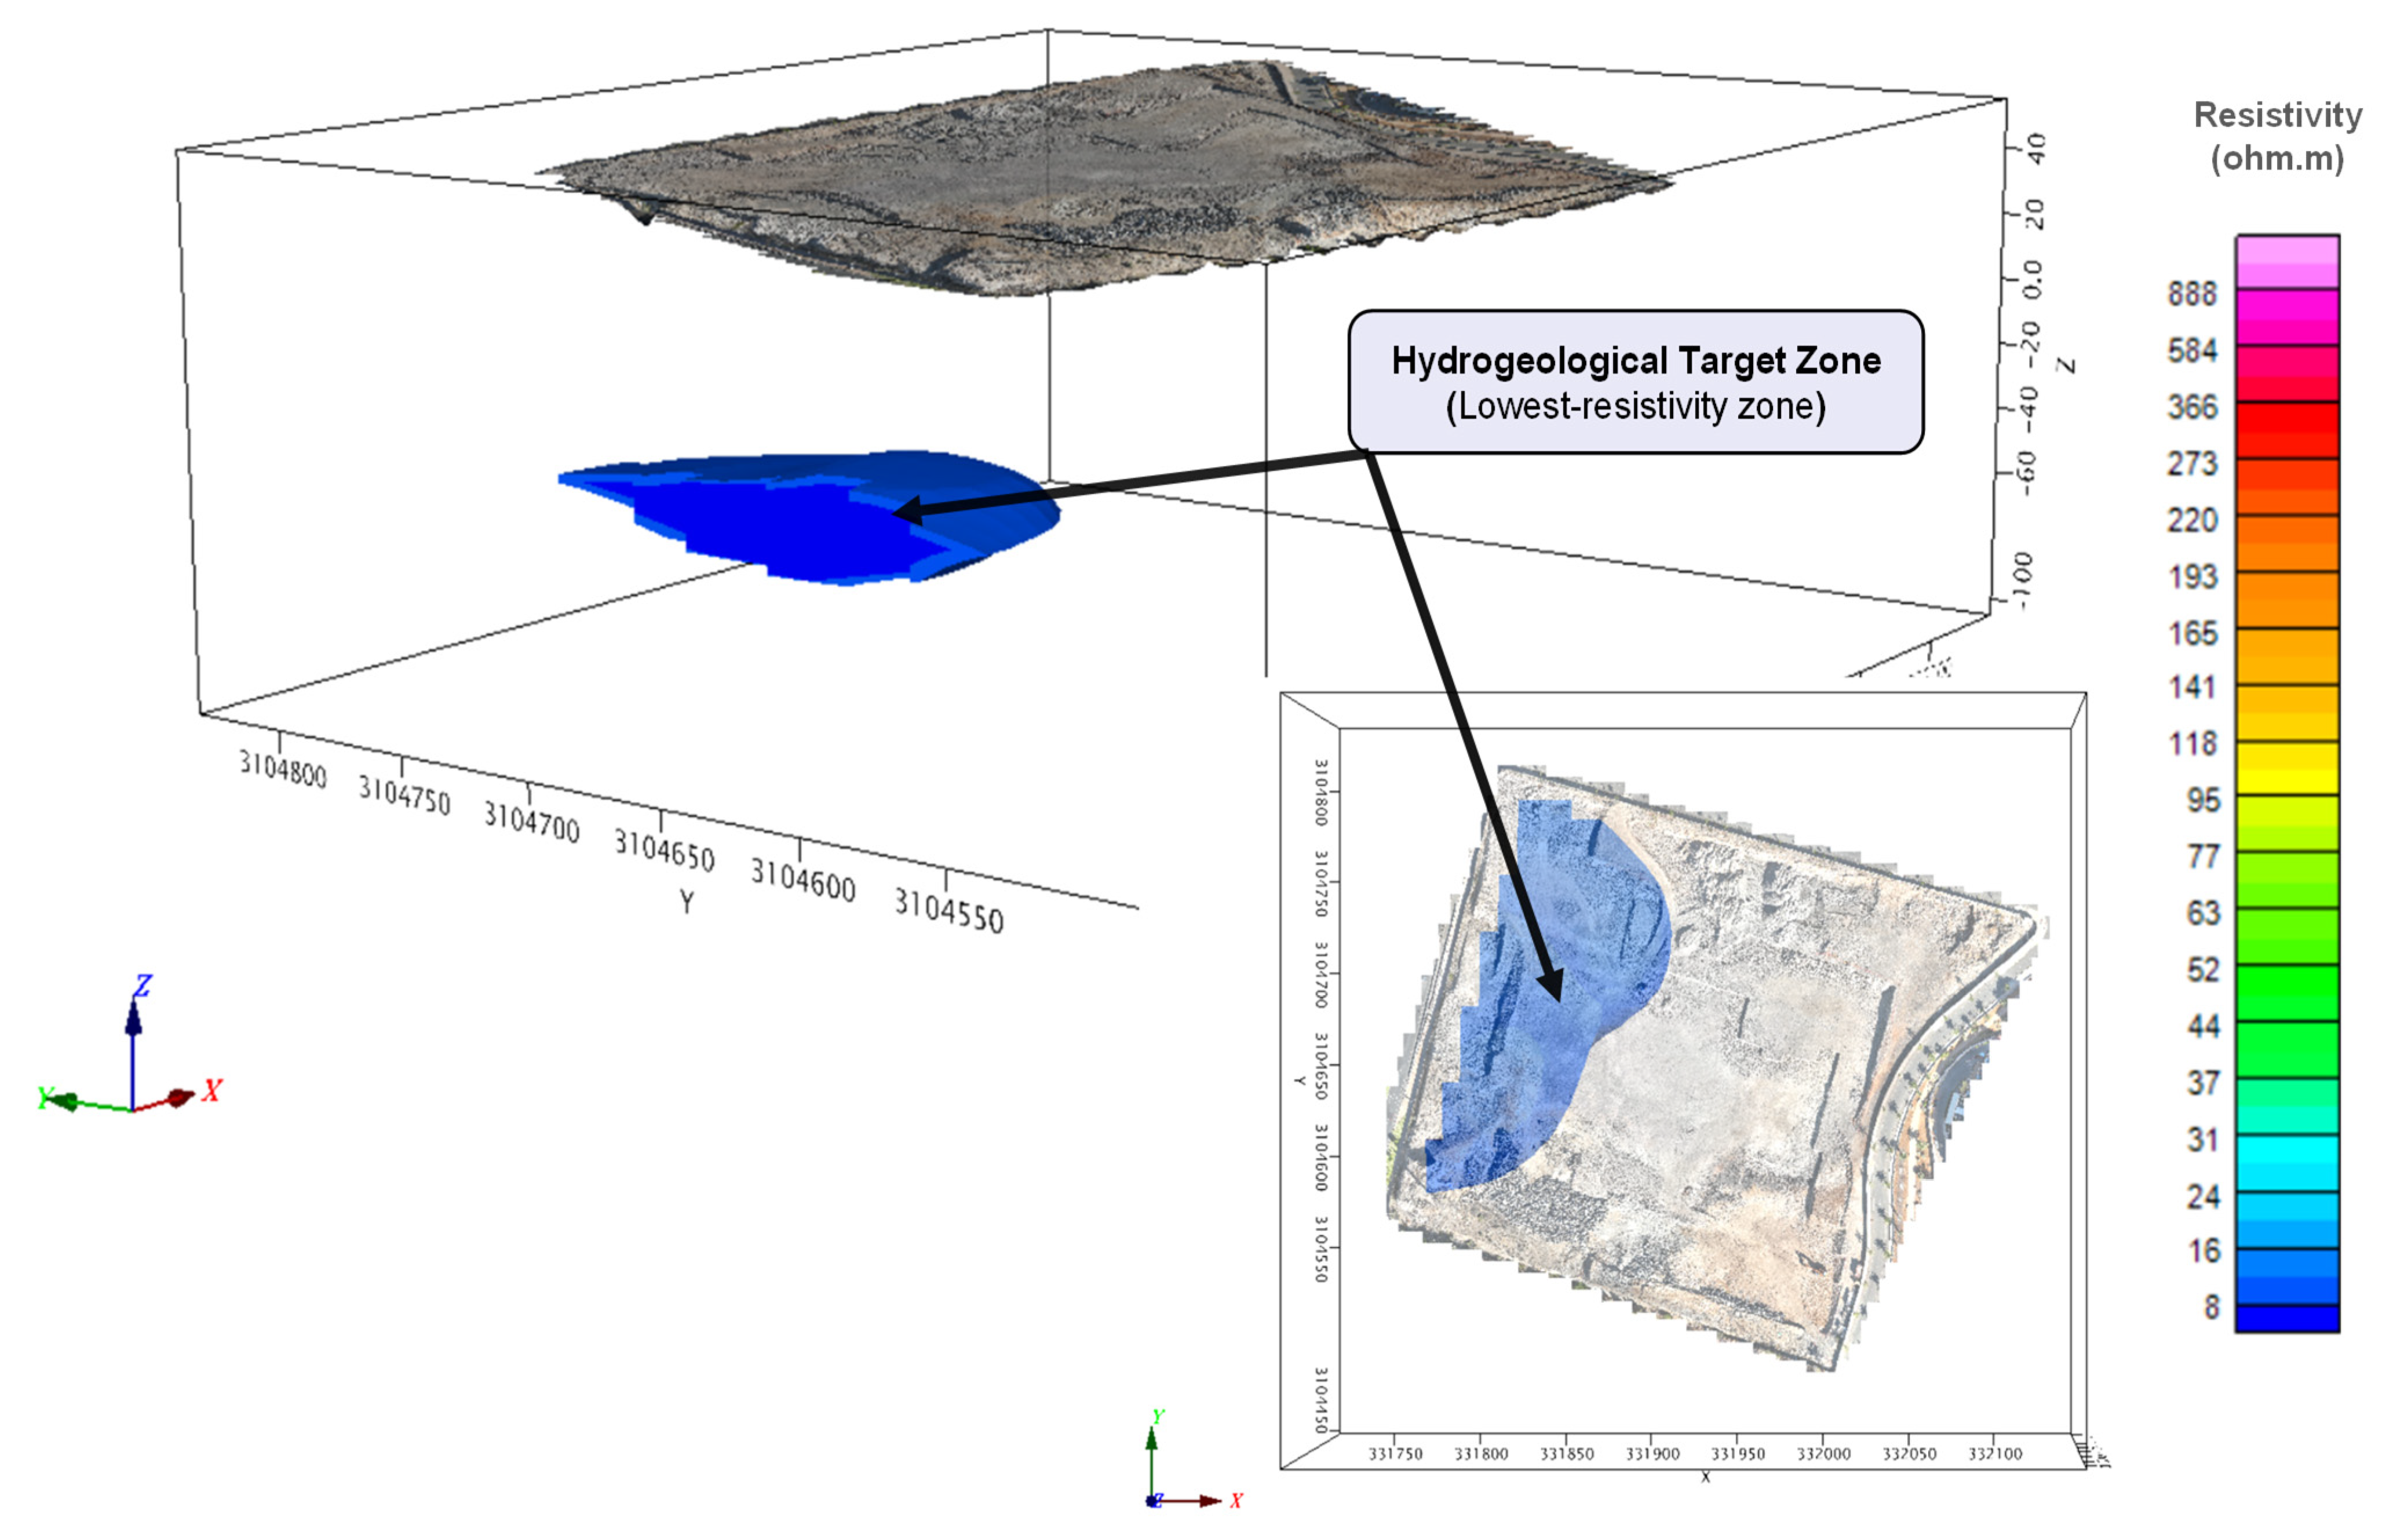
The integration of results into the three-dimensional model made it possible to identify optimal sectors for the drilling of new wells (
Figure 9). These are located within the conductive domain (<20 Ω·m), where permeability increases as resistivity decreases, and where saline water ensures regulatory viability for subsequent exploitation and desalination.
These results are consistent with experiences in other volcanic islands, where drilling in transitional or conductive zones has proven to be more profitable and effective than in exclusively resistive horizons [
29]. In particular, studies in the Azores and Cape Verde indicate that intermediate or conductive levels often act as preferential reservoirs for significant yields [
26,
28].
In the specific case of the Los Cristianos site, the preselected drilling area has proven suitable, although it is estimated that reaching a slightly greater depth than in other parts of the plot will be necessary to intercept the most representative thickness of the conductive domain. This adjustment in the projected drilling depth will increase the likelihood of success, ensuring sufficient yield and water quality suitable for desalination, thereby reinforcing the practical utility of the methodology applied in this study.
4. Discussion
4.1. Limitations of Electromagnetic Methods in Volcanic Environments
The results obtained in Los Cristianos confirm that direct current electrical methods (ERT) offer significant advantages over electromagnetic methods (TDEM, AEM) in volcanic settings. In sedimentary environments, EM methods have been widely and successfully applied for the detection of aquifers and saline intrusion fronts [
5,
6]. However, in volcanic contexts, the presence of strongly magnetized basalts, electromagnetic noise, high resistivity, overlapping lava flows, and lateral heterogeneity of the materials generate complex and often ambiguous EM responses [
7,
19].
Studies conducted in the Azores [
26], Cape Verde [
28], and Hawaii [
27] highlight the difficulties of EM methods in accurately resolving the geometry of saline intrusions in volcanic systems. In such environments, Electrical Resistivity Tomography has become established as a more reliable alternative, being less sensitive to magnetic susceptibility and electromagnetic noise, while providing more stable resistivity images.
4.2. Effectiveness of ERT for Characterizing Saline Intrusion
ERT demonstrated a high capacity to differentiate geoelectrical domains in Los Cristianos. These results are consistent with international studies where resistivity values below 20 Ω·m have been systematically associated with marine intrusion [
13,
22].
In Tenerife, this finding is of particular importance, since regulations only allow the exploitation of saline waters intended for desalination [
2]. Precisely identifying the position of conductive horizons is therefore not only a hydrogeological issue, but also a legal and economic requirement.
Comparisons with studies in Villafáfila (Spain) [
30] and in the saline–evaporitic formation of Barbastro [
21] confirm the usefulness of electrical resistivity as an indirect indicator of salinity, reinforcing the validity of the methodology applied in Los Cristianos.
4.3. 3D Modelling as a Decision-Support Tool
The three-dimensional interpolation performed with Oasis Montaj helped reduce the uncertainty associated with 2D inversions, providing a continuous volumetric resistivity model. This geomatic approach represents a key step toward the integration of geophysics into water resource management and planning processes. While the 3D model was internally validated through the consistency of both ERT profiles, additional validation using borehole or hydrochemical data is recommended. Such information would allow quantitative testing of the model and further reduce interpretive uncertainty.
In the literature, the importance of 3D models to overcome the limitations of one-dimensional or two-dimensional inversions has been repeatedly emphasized [
9,
16]. In Hawaii, for example, three-dimensional models derived from ERT have been used to establish recharge zones and to precisely delineate the saline wedge [
27]. In Cape Verde, 3D interpolation has been fundamental in guiding drilling in touristic sectors with high demand [
28].
The experience in Los Cristianos reinforces this notion: the identification of the geometry and resistivity of the conductive domain would not have been evident by analyzing individual profiles. Therefore, a 3D model enables a clearer visualization of the lateral continuity of conductive horizons and allows for more solid criteria when siting boreholes, which becomes increasingly relevant as subsurface models grow more complex or when more datasets must be integrated.
The resistivity–salinity correlation can support decision-making for groundwater management, particularly in desalination planning. Identifying zones of moderate salinity helps optimize reverse osmosis (RO) feedwater extraction, minimizing pre-treatment requirements and antiscalant dosing, which reduces operational costs and environmental impact. Furthermore, this approach allows optimizing the siting of boreholes, reducing the total number of wells required to ensure water supply and consequently lowering drilling and maintenance costs. In this volcanic island context, where the exploitation of freshwater lenses is restricted to prevent overextraction, targeting brackish rather than fully saline or fresh groundwater offers a sustainable and technically feasible alternative for desalination. Additionally, this information aligns with the regional regulatory framework that prioritizes sustainable freshwater abstraction in coastal aquifers of the Canary Islands.
4.4. Optimization of Drilling in Touristic Contexts
One of the main practical contributions of this study is the identification of optimal drilling zones within conductive domains. These zones ensure the presence of aquifers with sufficient permeability and, at the same time, connection to saline water as required by regulations.
From an economic perspective, this result is particularly relevant in touristic areas such as Los Cristianos, where the hotel sector demands large volumes of water and already has reverse osmosis infrastructure for treatment [
3,
18]. The ability to precisely locate boreholes and to reach the appropriate depth reduces exploration costs and increases the viability of projects.
4.5. Transferability of the Methodology
The approach applied in Los Cristianos is replicable in other volcanic environments with similar challenges. In the Azores, ERT has been employed to delimit marine intrusion in coastal aquifers, providing key information for the management of water abstraction [
26]. In Cape Verde, the combination of ERT and 3D modelling has made it possible to identify exploitable saline aquifers in islands where EM methods had failed [
28].
Likewise, in the Canary archipelago, the methodology can be applied in other coastal sectors where tourist pressure is high (e.g., Playa de las Américas, Puerto de la Cruz, Costa Teguise). Thus, ERT integrated into 3D models consolidates itself as a robust, efficient, and transferable tool, with the potential to become a standard for hydrogeological management in volcanic islands.
5. Conclusions
The case study developed in Los Cristianos (Arona, Tenerife) demonstrates that Electrical Resistivity Tomography (ERT), complemented by three-dimensional modeling, represents a highly valuable tool to address one of the most significant challenges in groundwater management in volcanic islands: the detection and characterization of marine intrusion. Throughout the investigation, it has been shown that in contexts where electromagnetic methods present inherent limitations due to basalt magnetization, electromagnetic noise, high resistivity, and the structural heterogeneity of the terrain [
7,
19], electrical methods provide a more robust and consistent alternative, capable of clearly discriminating between resistive and conductive domains.
The results obtained not only make it possible to establish the geometry of saline intrusion, but also, when integrated into a three-dimensional geomatic framework, provide a continuous spatial representation that reduces interpretive uncertainty and facilitates strategic decision-making [
16,
25]. In this sense, the applied methodology does not merely provide geophysical information but constitutes a genuine bridge between scientific knowledge and water management practice in volcanic territories.
The relevance of this approach is particularly significant in the Canarian regulatory context, where the exploitation of groundwater is only viable if it presents high salinity levels, a prerequisite for subsequent desalination through reverse osmosis [
2]. The ability to accurately locate saline horizons thus becomes a decisive factor in ensuring the technical and legal feasibility of new abstractions, especially in regions under strong touristic pressure such as southern Tenerife [
3,
18].
This study also highlights that the selection of drilling points should not be approached solely from a hydraulic perspective, but also from the integration of geophysical criteria that allow the identification of transitions between resistive and conductive domains. The experience developed in Los Cristianos provides a replicable example for other volcanic island environments where water constitutes both a strategic and a vulnerable resource.
Ultimately, the research carried out allows us to affirm that the combination of ERT and 3D modeling not only responds to a local need, but also opens the door to a methodological framework applicable at a global scale. Its versatility and relatively low cost make this approach a competitive option compared to more sophisticated techniques that are difficult to implement in volcanic environments. In the future, integration with hydrochemical data, control boreholes, and temporal monitoring techniques will allow the methodology to be further refined, contributing to a dynamic monitoring of marine intrusion and to an adaptive management of water resources.
In conclusion, the Los Cristianos case study illustrates how applied geophysics, supported by geomatic tools, can become a central pillar of water sustainability in volcanic islands. The combination of science, regulation, and social demand reinforces the idea that electrical methods are not merely a technical resource, but a fundamental component in building a more balanced and resilient future in territories where water is both the greatest challenge and the key to development.
