Article

Establishment and Parameter Calibration of a DEM-Based Contact Model for Leymus chinensis Seed–Straw Mixtures

1
Institute of Grassland Research, Chinese Academy of Agricultural Sciences, Hohhot 010013, China
2
College of Mechanical and Electrical Engineering, Inner Mongolia Agricultural University, Hohhot 010018, China
*
Author to whom correspondence should be addressed.
These authors contributed equally to this work.
Appl. Sci. 2025, 15(20), 11163; https://doi.org/10.3390/app152011163
Submission received: 4 August 2025 / Revised: 9 October 2025 / Accepted: 15 October 2025 / Published: 17 October 2025
(This article belongs to the Section Agricultural Science and Technology)

Abstract

The study of Leymus chinensis seed cleaning has been hindered by the lack of accurate discrete-element contact parameters for seed–straw interactions, thereby limiting, to some extent, the optimization of cleaning equipment. To address this issue, the present study analyzed a mixture of L. chinensis seeds and straw, and determined their fundamental physical and contact parameters via laboratory experiments. The Hertz–Mindlin (no slip) discrete element simulation model was employed to calibrate the parameters of the seed–straw mixture. A Plackett–Burman test was used to identify key factors significantly affecting the repose angle, including the seed–seed static friction coefficient and the seed–straw static and dynamic friction coefficients. These factors’ optimal ranges were further refined using steepest ascent experiments. A Box–Behnken design was used to optimize contact parameters, resulting in the following values: a seed–seed static friction coefficient of 0.709, a seed–straw static friction coefficient of 0.281, and a seed–straw dynamic friction coefficient of 0.085. Validation experiments demonstrated an error of less than 2.14%, confirming the reliability of the calibrated parameters. This study offers a theoretical foundation for discrete element simulations in L. chinensis seed cleaning applications.

1. Introduction

Leymus chinensis (Trin.) Tzvel. is a perennial gramineous forage species extensively distributed in the northern grasslands and agro-pastoral ecotones of China. It serves as a dominant and constructive species in the steppe ecosystems of eastern Eurasia [1,2]. This species demonstrates strong resistance to environmental stressors such as drought, salinity, and low temperatures, making it both a key species for restoring degraded grasslands and a high-quality forage resource [3,4]. With the rapid advancement of grassland agricultural mechanization in recent years, the lack of efficient seed cleaning technology for L. chinensis has become a major bottleneck hindering large-scale cultivation. Traditional cleaning methods are characterized by low separation precision and considerable mechanical damage to seeds, which fail to meet the quality and efficiency demands of mechanized seeding [5].
Due to the similar physical properties of L. chinensis seeds and straw, mechanical cleaning processes often experience clogging, low separation efficiency, and seed damage caused by material intermixing. These issues directly affect the quality of seed cleaning and reduce overall economic efficiency [6,7,8]. In the development of L. chinensis seed cleaning equipment, traditional approaches depend heavily on empirical, trial-and-error methods, leading to prolonged development cycles and elevated costs [9,10]. There is an urgent need for simulation-based design optimization. Purely experimental methods fail to capture the micro-mechanical interactions between seeds and straw, thus restricting theoretical advancements in L. chinensis cleaning technology.
Recently, the discrete element method (DEM) has found wide application in agricultural machinery research [11,12,13]. In the field of discrete element method (DEM) research related to crop seeds, numerous scholars have conducted calibration of DEM simulation parameters for mainstream crop seeds such as maize [14,15,16], rice [17], wheat [18,19], and Panax notoginseng [20]. Zhao Xuan et al. [21,22] combined response surface methodology (RSM) with feedforward neural networks (FNN) to optimize key variables in DEM parameter calibration for sunflower seeds. Hou Zhanfeng et al. [23] calibrated parameters for Elymus sibiricus seeds to ensure that simulated repose angles closely matched empirical values during coating simulations. In crop straw studies, Zhang Xirui et al. [24] developed a bonding discrete element model for banana straw using the Hertz–Mindlin with bonding contact model and conducted parameter calibration. Xia Junfang [25] constructed a flexible DEM model of rice straw via particle replacement, followed by parameter calibration and multi-condition validation. Du Zhe [26] proposed a three-layer DEM model for tea stems based on an enhanced bonding approach and conducted relevant simulations and experiments.
These studies suggest that most existing DEM research has concentrated on either crop seeds or straw as single materials. However, no DEM model has yet been developed for mixtures of L. chinensis seeds and straw. This study systematically determines the physical properties, calibrates the contact parameters, and develops a DEM model for this mixed-material system. The results aim to support the simulation-based design of L. chinensis cleaning equipment, offer insights into contact–collision behaviors in mixed materials, reduce field testing costs, and enhance research and development efficiency.

2. Materials and Methods

2.1. Determination of Physical Properties

The materials used in the experiment included Leymus chinensis seeds, straw, and their mixtures, all sourced from Xiwuzhumuqin Banner in Inner Mongolia, China. L. chinensis is classified as bulk particulate matter. Its fundamental physical properties include triaxial dimensions (length L × width K × thickness H) of seeds and straw, thousand-kernel weight, bulk density, moisture content, material density, Poisson’s ratio, elastic modulus, and shear modulus. Contact mechanical parameters include the coefficient of restitution, static friction coefficient, and dynamic friction coefficient.

2.1.1. Basic Physical Property Measurement

The basic physical properties of L. chinensis seeds are summarized in Table 1. Triaxial dimensions were measured using a digital vernier caliper with a precision of 0.02 mm. One hundred seeds were randomly selected, and their measurements averaged.
The thousand-kernel weight was measured using an electronic balance with a precision of 0.001 g. Two thousand seeds were randomly divided into ten groups of 200 seeds each, and the average was calculated.
Material density was measured using a DH-300X dual-phase (solid–liquid) densitometer, with the mean calculated from 12 replicates.
Moisture content was determined using a 101-1 electric thermostatic drying oven and a balance with 0.001 g precision. Following the GB/T 3543.6-1995 national standard for seed moisture determination, the high-temperature drying method was applied, with the oven set at 132 °C for 1 h. Samples were repeatedly weighed until a constant mass was achieved. Six replicates were used, and the mean value was calculated.
The fundamental physical properties of L. chinensis straw are presented in Table 2. Owing to the significant variation in straw length and diameter, as well as its natural tapering from base to tip, triaxial measurements were subject to considerable error. To mitigate this issue, 20 g of the sample was randomly selected and the straw was manually separated and classified into three length-based groups: 3–13 mm (Group A), 13–18 mm (Group B), and 18–30 mm (Group C). Triaxial dimensions were measured within each group, and the average values were recorded. A total of six replicates were conducted. Density and moisture content were determined using the same procedures applied for seed measurement.

2.1.2. Measurement of Poisson’s Ratio, Elastic Modulus, and Shear Modulus

Determination of Elastic Modulus
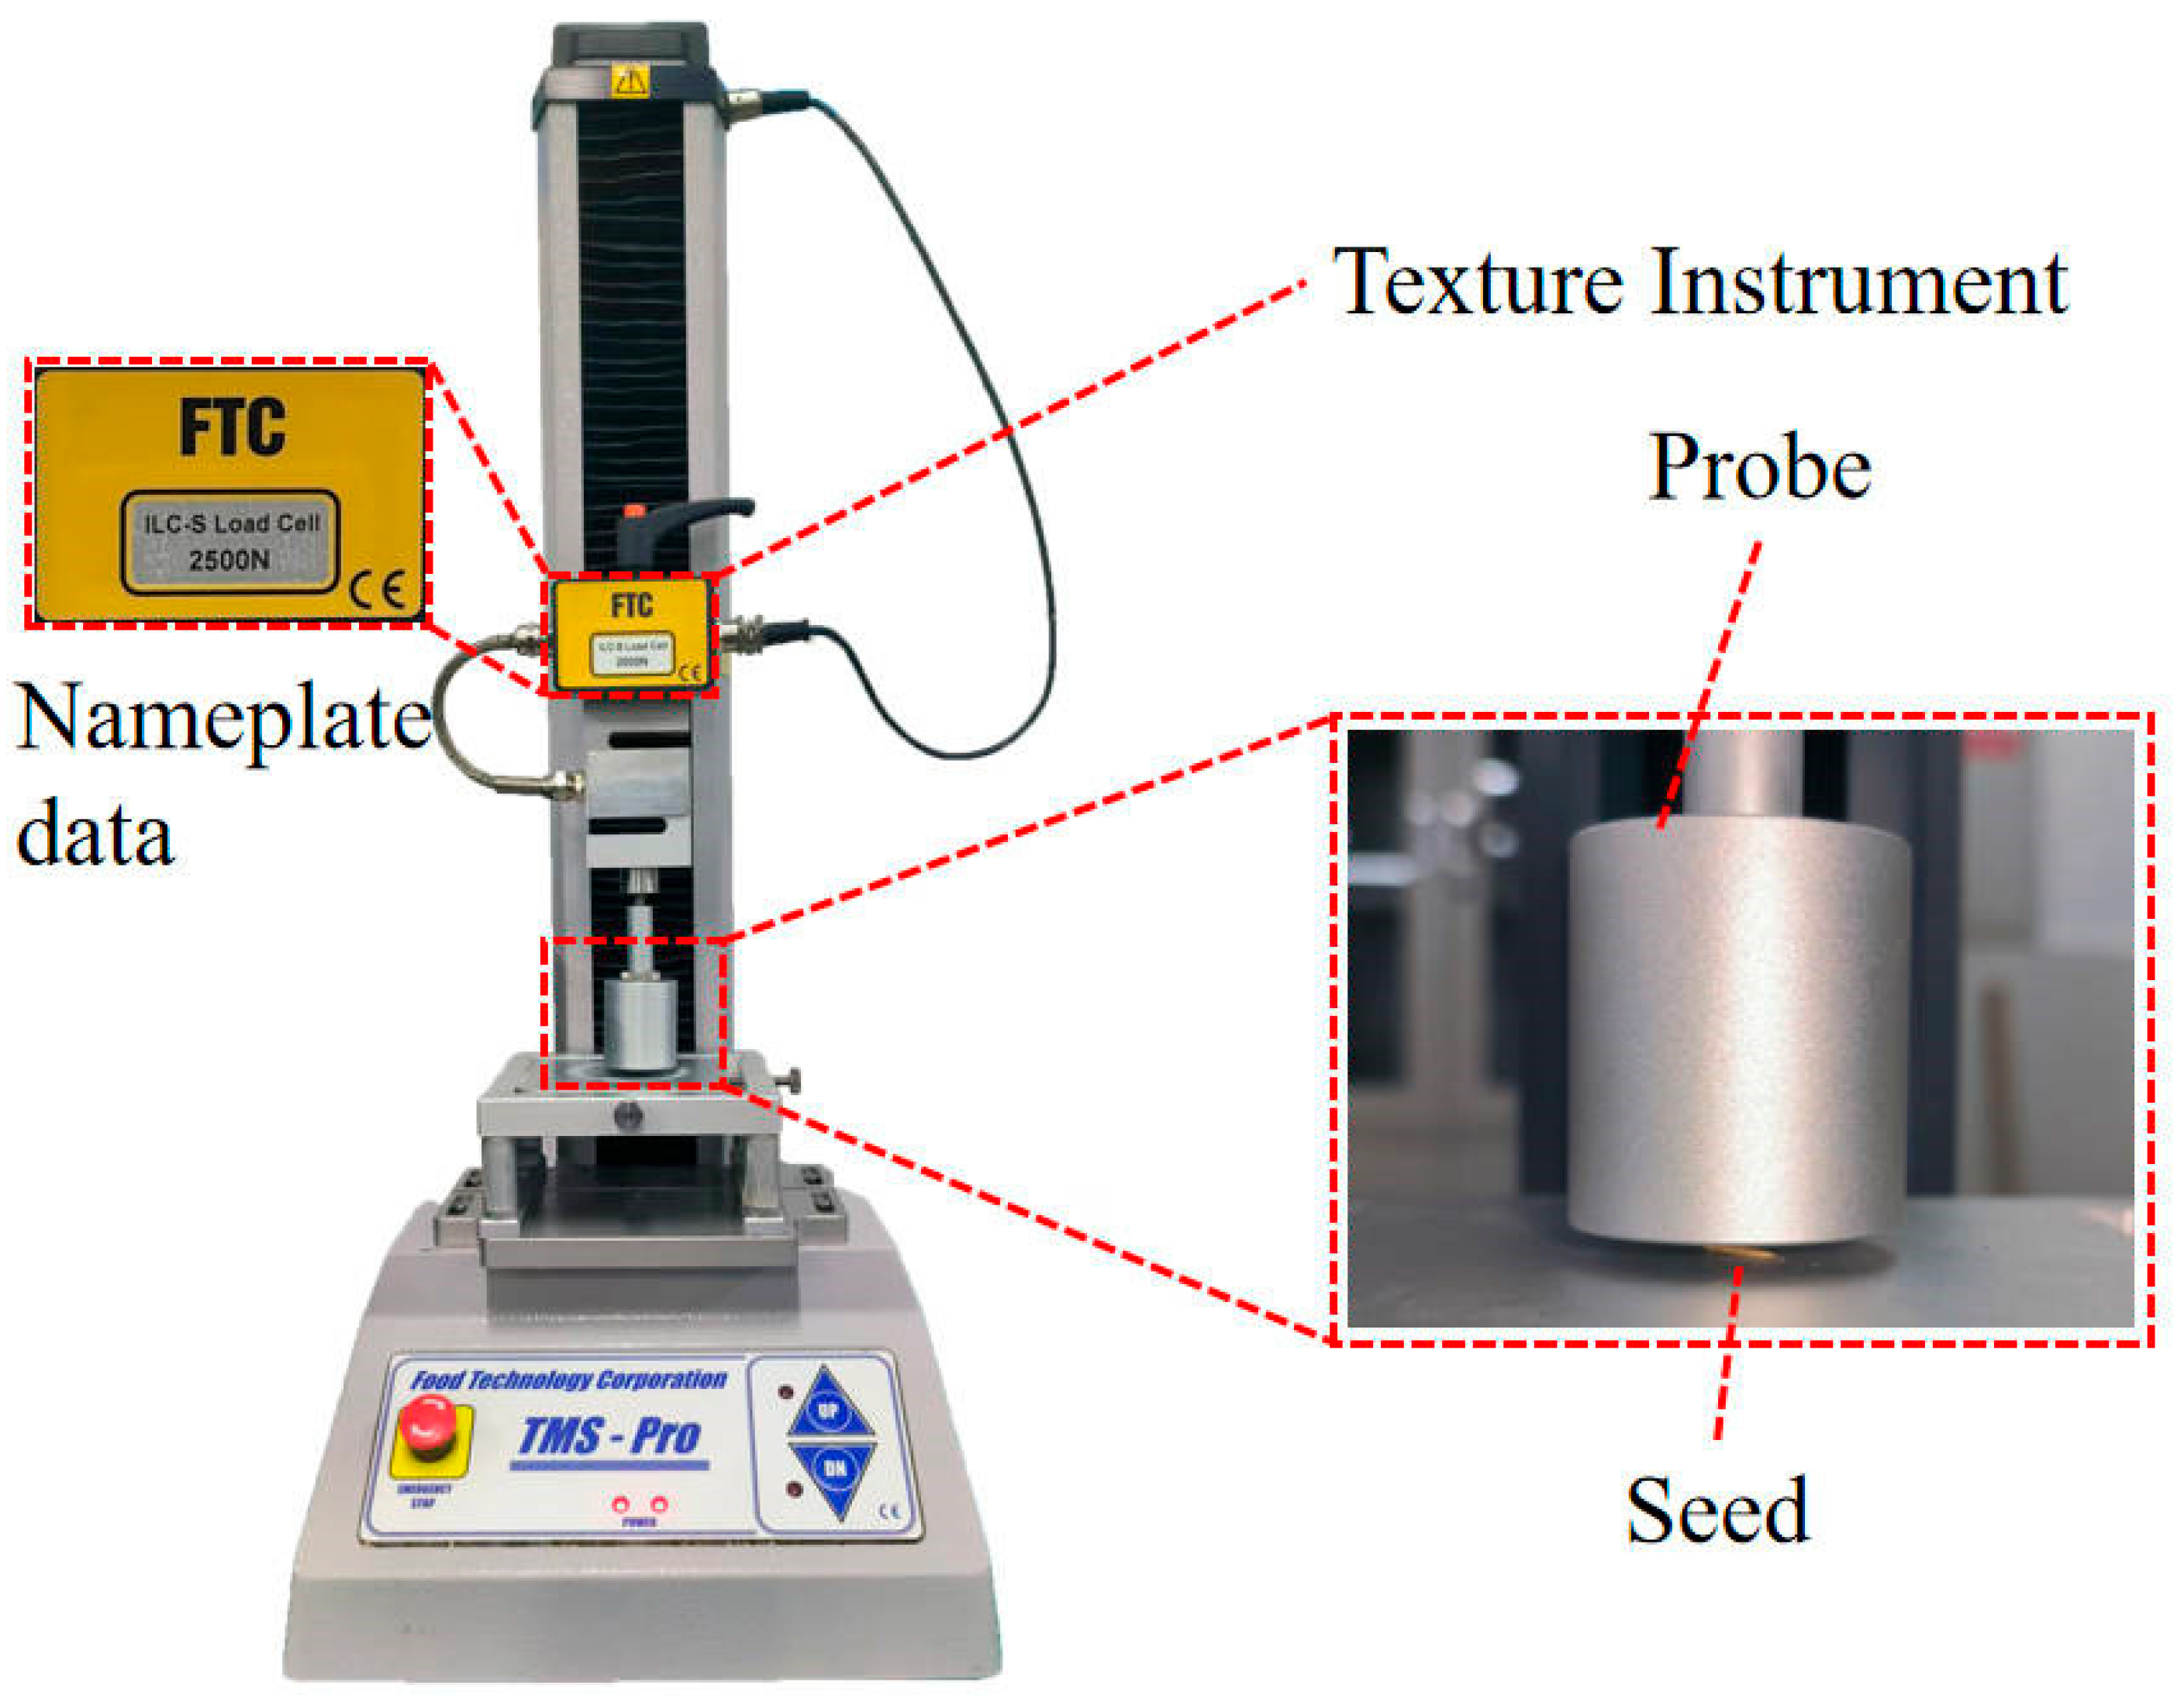
Because L. chinensis seeds are small and exhibit considerable variation in their length, width, and thickness, conventional methods are not suitable for determining Poisson’s ratio. Compression tests were conducted using a texture analyzer (TMS-Pro). Static measurement methods were applied to determine the elastic modulus and Poisson’s ratio, as illustrated in Figure 1 [27,28].
The seeds were positioned horizontally on the testing platform, and a probe with a diameter of 20 mm was selected. The sensor range was configured to 0–250 N using TextureLabPro (Version 2016, Stable Micro Systems, Godalming, UK) software. The probe descended at a speed of 15 mm/min under a deformation ratio of 90%. During the test, the probe slowly descended while the time–force curve was recorded. Each test was repeated six times, and the average value was calculated. The elastic modulus was calculated using Equation (1), resulting in E = 1.43 × 10⁷ Pa.
E = σ ε
where E is the elastic modulus, Pa; σ is the maximum compressive stress, Pa; ε is the linear strain, dimensionless.
Determination of Poisson’s Ratio and Shear Modulus
The Poisson’s ratio of L. chinensis seeds was measured using a definition-based method.
μ = ε x ε y = Δ L / L Δ H / H
where μ is Poisson’s ratio; εx is the lateral strain, dimensionless; εγ is the longitudinal strain, dimensionless; ΔL is the lateral absolute deformation, mm; L is the original lateral length, mm; ΔH is the absolute deformation in thickness direction, mm; H is the original thickness, mm.
Compression tests on L. chinensis seeds were performed using a texture analyzer (TMS-Pro). Poisson’s ratio was determined using a static measurement method. Prior to testing, the initial dimensions of each seed in both the longitudinal and thickness directions were measured. During compression, the loading speed was set to 20 mm/min with a duration of 3 s. As the analyzer probe gradually descended, a compressive load was applied until the seed was fully compressed. Subsequently, a digital caliper was used to measure the longitudinal deformation of the seed. The test was repeated six times, and the mean value was calculated. Poisson’s ratio was calculated as 0.398 using Equation (2), and the shear modulus was determined to be 5.11 × 10⁶ Pa using Equation (3).
G = E 2 ( 1 + μ )
where G is the shear modulus, Pa; E is the elastic modulus, Pa; μ is Poisson’s ratio.

2.1.3. Measurement of Repose Angle

The repose angle of granular materials is a key parameter used to characterize their flowability. It is influenced by static and dynamic friction coefficients, particle shape, and cohesive forces, and is closely associated with the tribological behavior of the particle system. In this study, the measured repose angle of the L. chinensis seed–straw mixture served as the validation benchmark. The accuracy of this measurement directly impacts the reliability of parameter calibration in discrete element modeling.
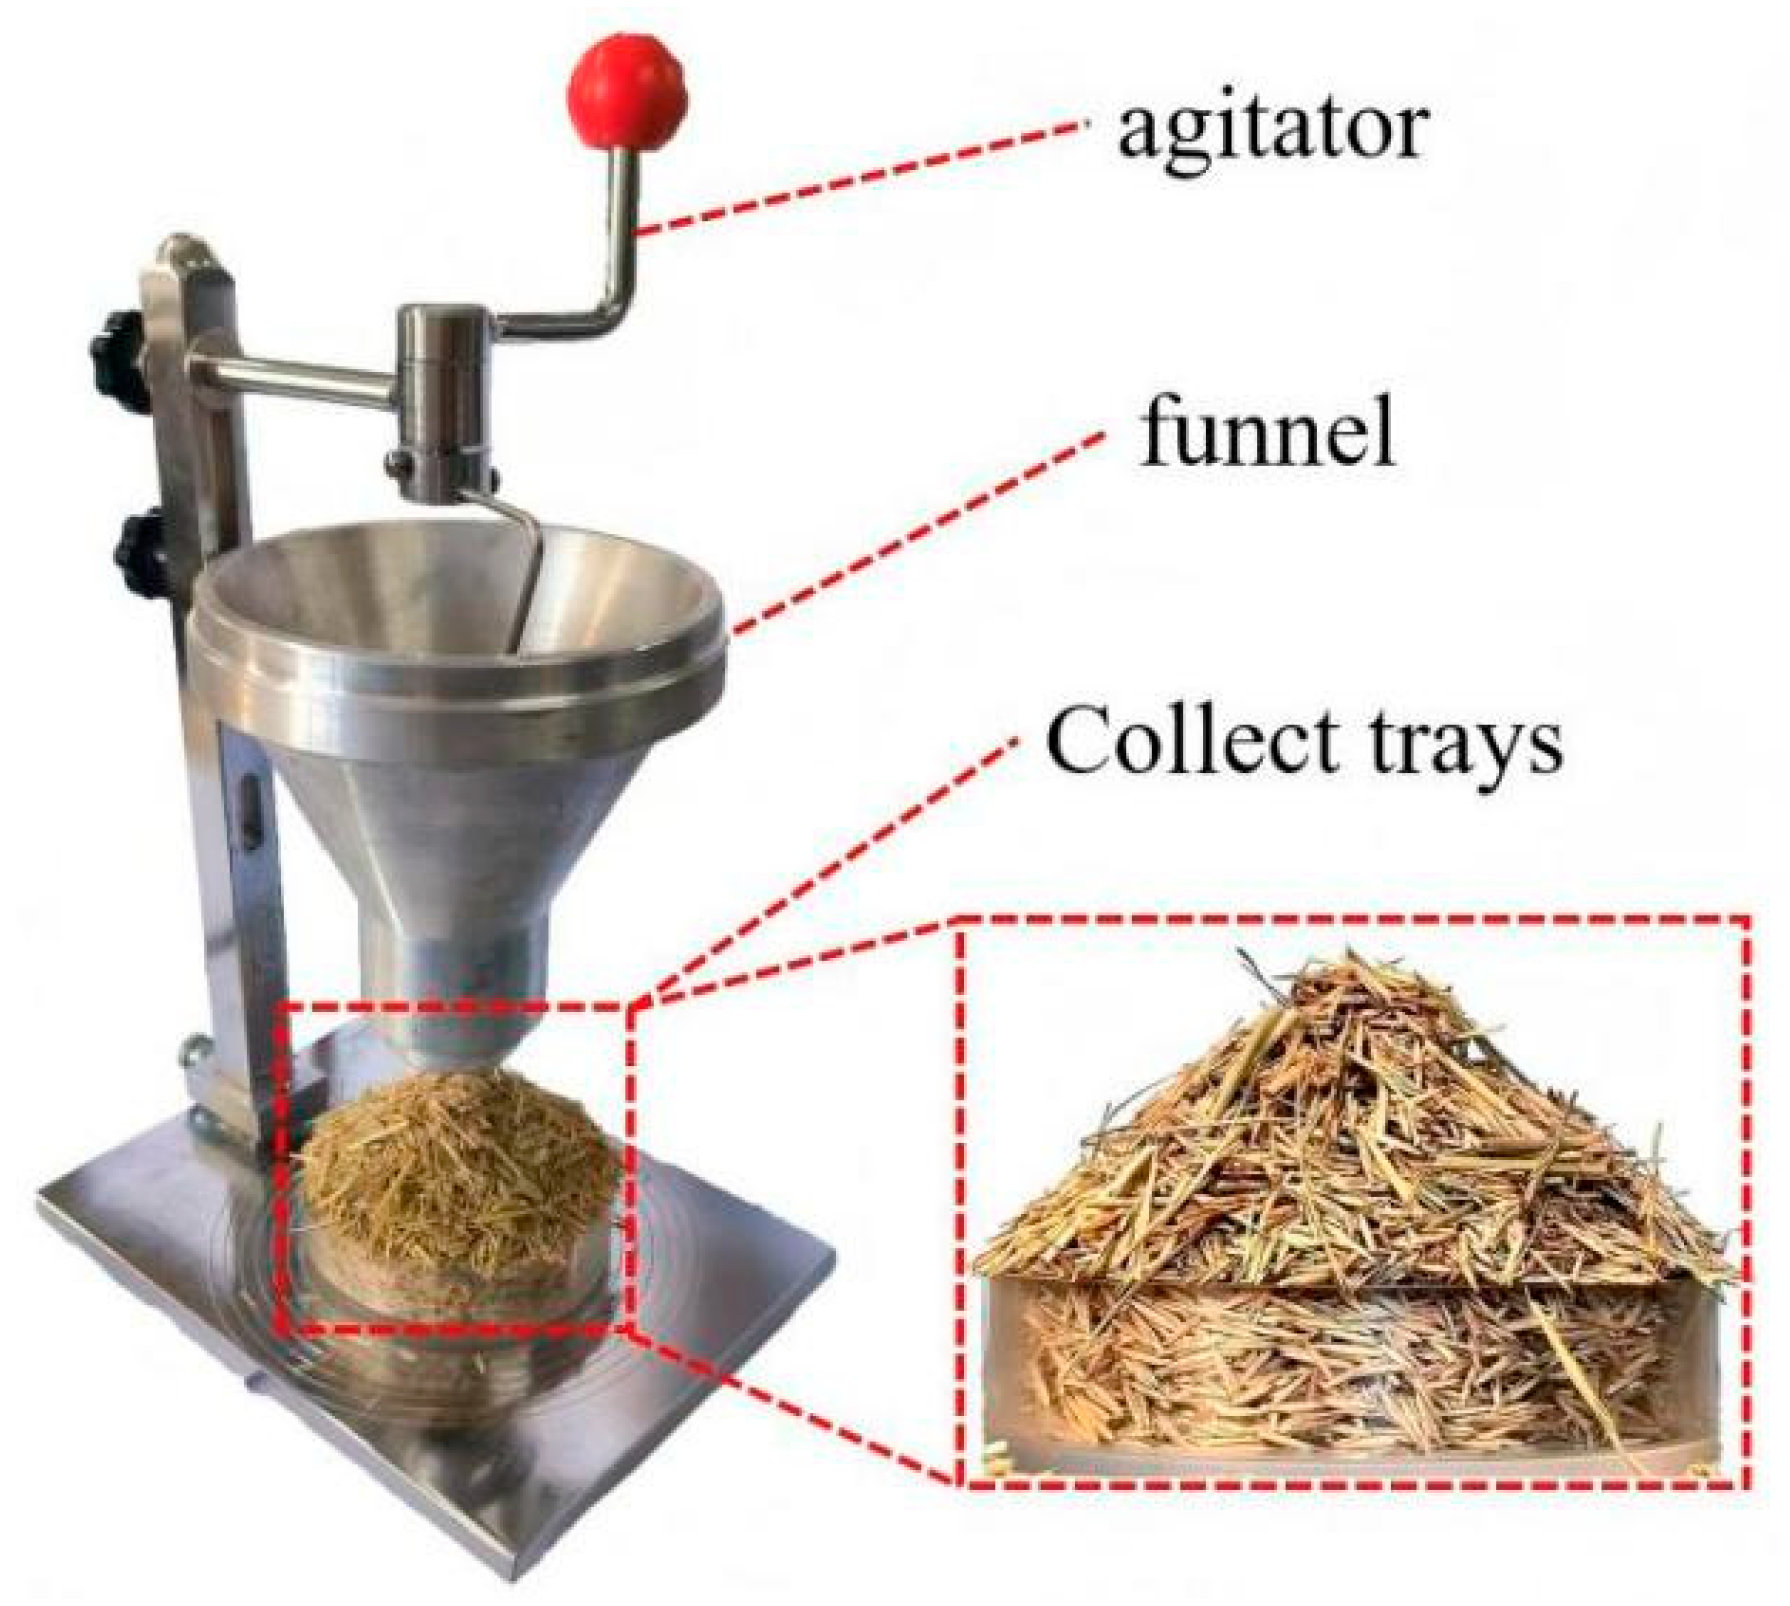
The repose angle of the L. chinensis seed–straw mixture was determined using a SC-104B repose angle tester, as shown in Figure 2. The conventional method involves measuring the height and base diameter of the conical pile formed by naturally deposited material, followed by calculating the angle of inclination using geometric relationships. However, due to the irregular shape and low flowability of the seed–straw mixture, frequent clogging and uneven discharge occurred in the funnel, thereby reducing measurement accuracy.
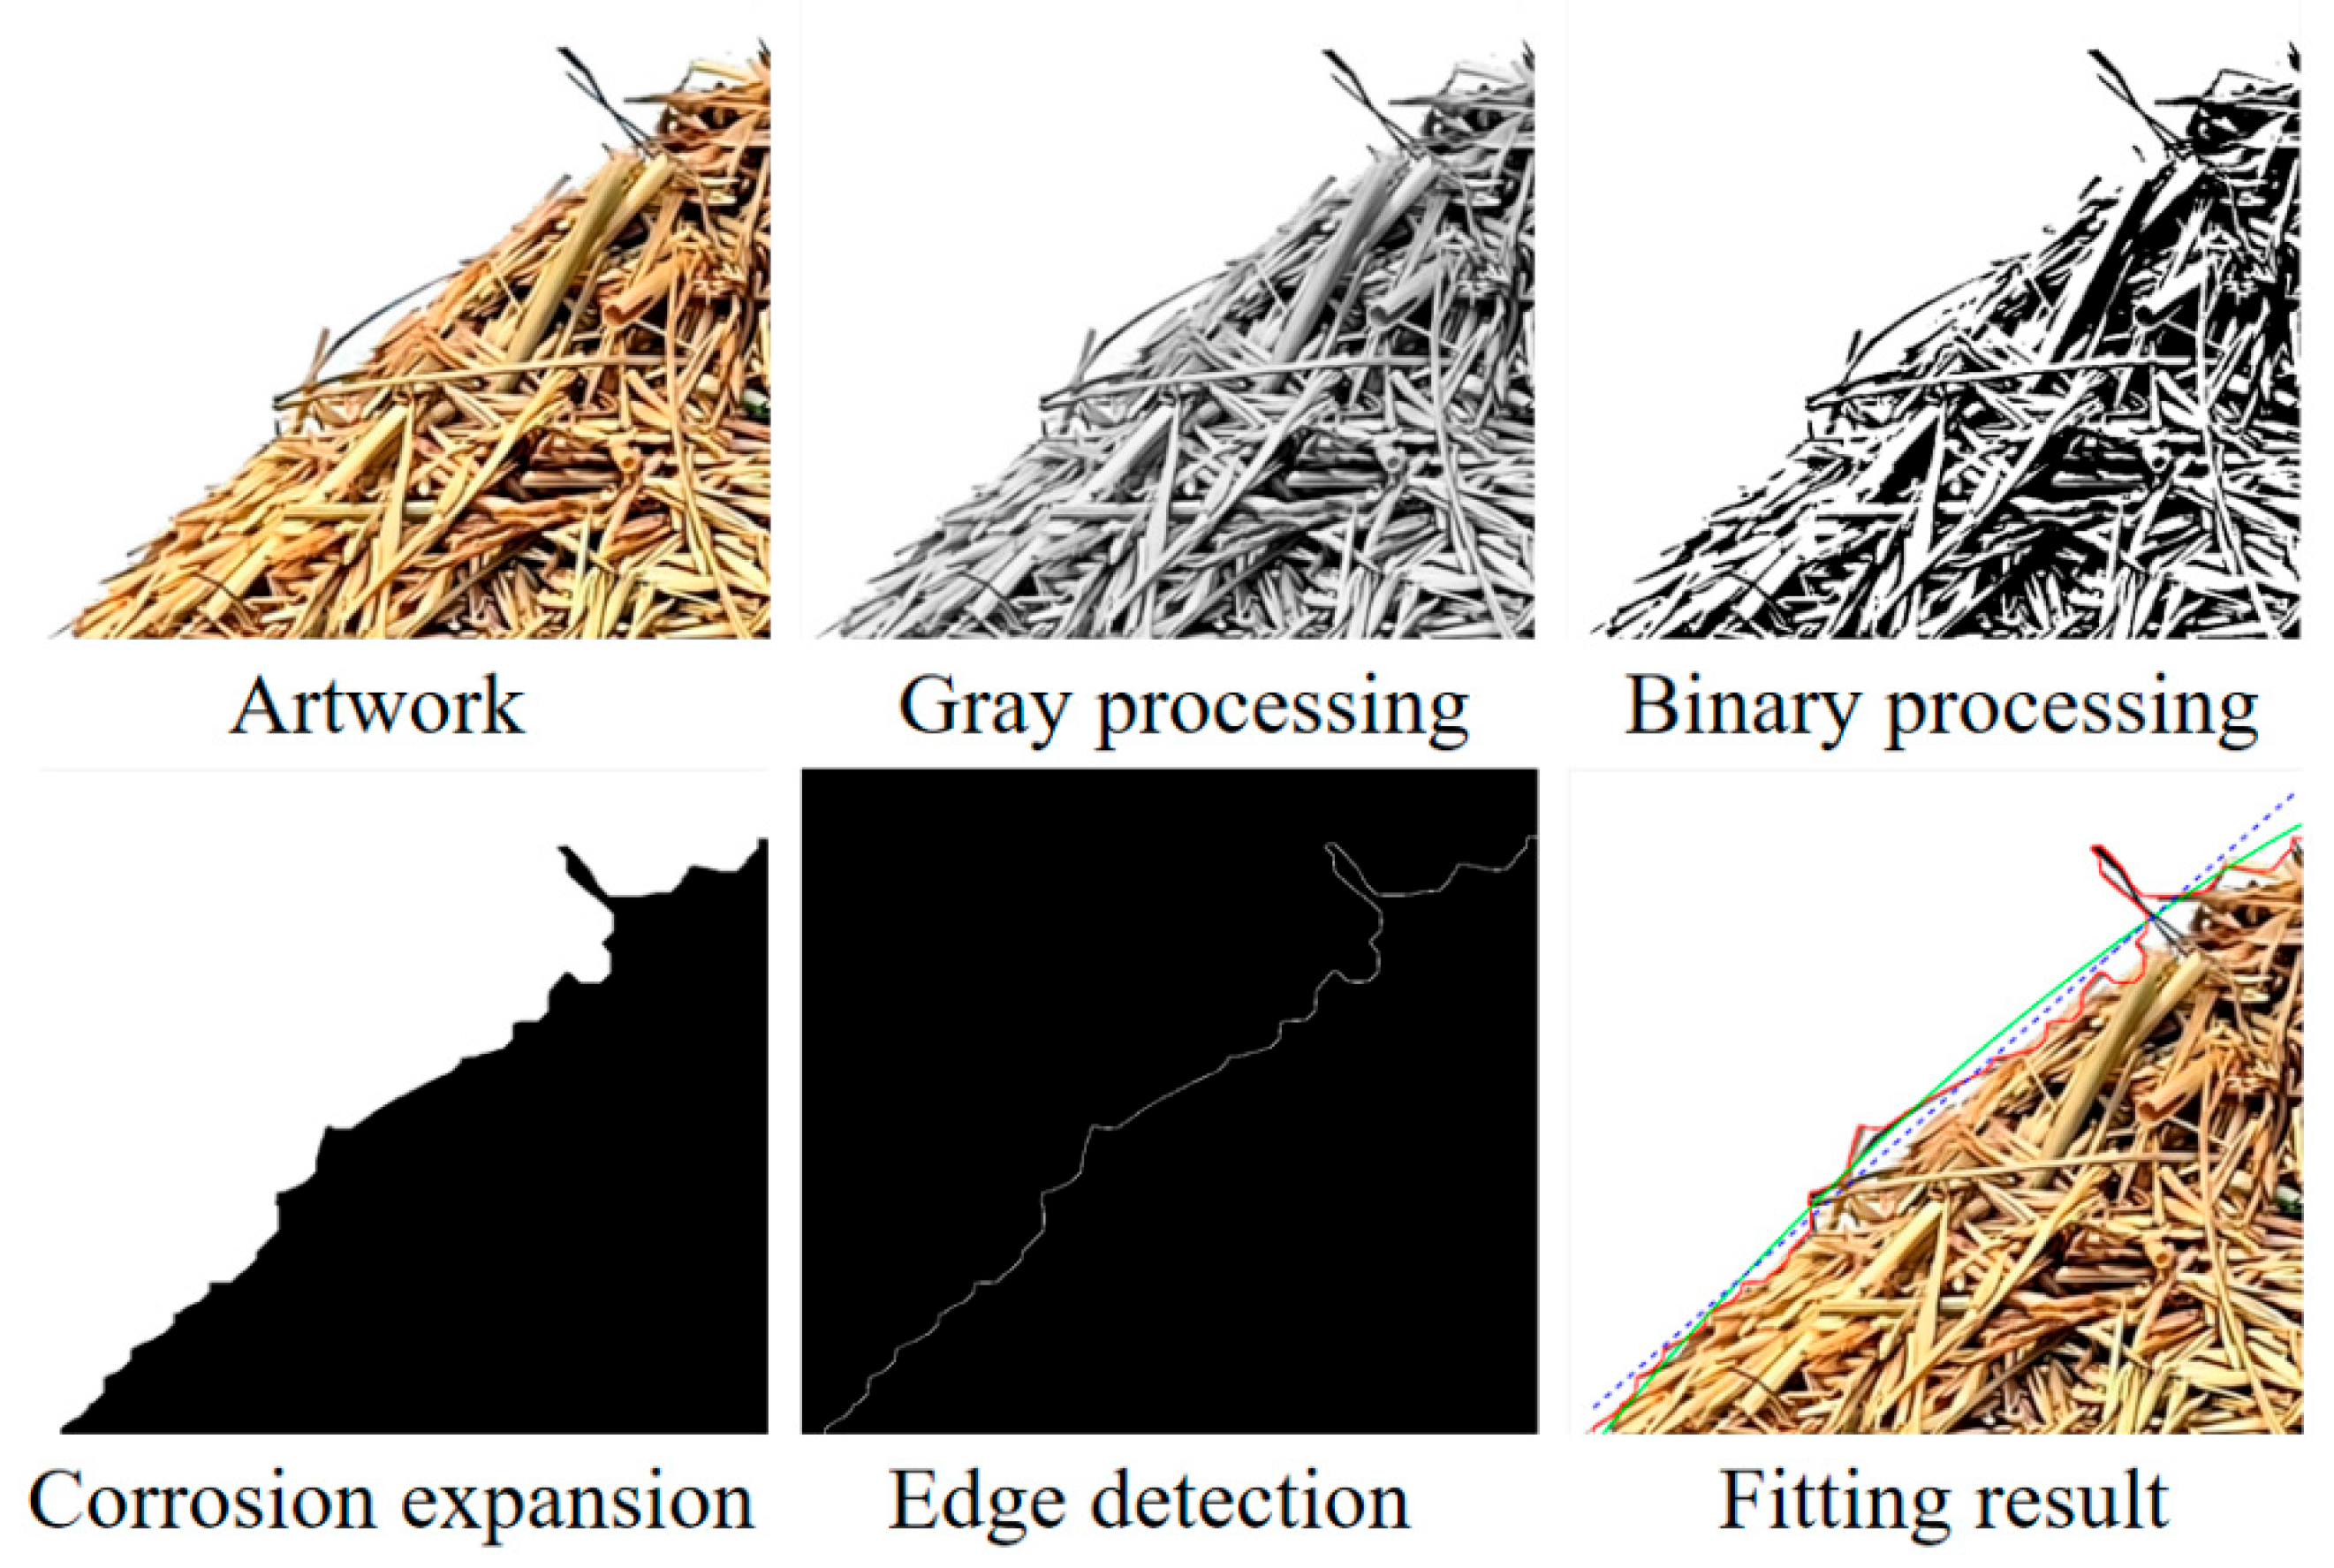
To improve the accuracy of repose angle measurement, material was allowed to fall freely from the apparatus onto a collection tray, forming a naturally deposited conical heap. Photographs of the heap were captured from a fixed horizontal position. A custom MATLAB R2021b script was developed to process the images, including grayscale conversion, binarization, morphological operations (erosion and dilation), and edge detection. The contour of the heap was then extracted and fitted to determine the repose angle of the L. chinensis seed–straw mixture, as illustrated in Figure 3. The left and right slope angles were fitted independently, and the final repose angle was calculated as their average.

2.2. Contact Parameter Determination

2.2.1. Coefficient of Restitution

The coefficient of restitution used in this study corresponds to the Newtonian definition. It is defined as the ratio of the normal velocity after collision (separation) to that before collision (approach), under the assumption that material properties remain unchanged. This parameter reflects the macroscopic change in particle velocity before and after impact [29].
According to Newtonian kinematics, velocity variation can be translated into a comparison of falling and rebound heights. Assuming that the initial velocity before free fall and the final velocity after rebound are both zero [30], the coefficient can be calculated using the following simplified equation:
e = V 1 V 0 = H 1 H 0
where e is the coefficient of restitution; V1 is the pre-collision approach velocity, m/s; V0 is the post-collision separation velocity, m/s; H1 is the rebound height after collision, mm; H0 is the fixed release height, mm.
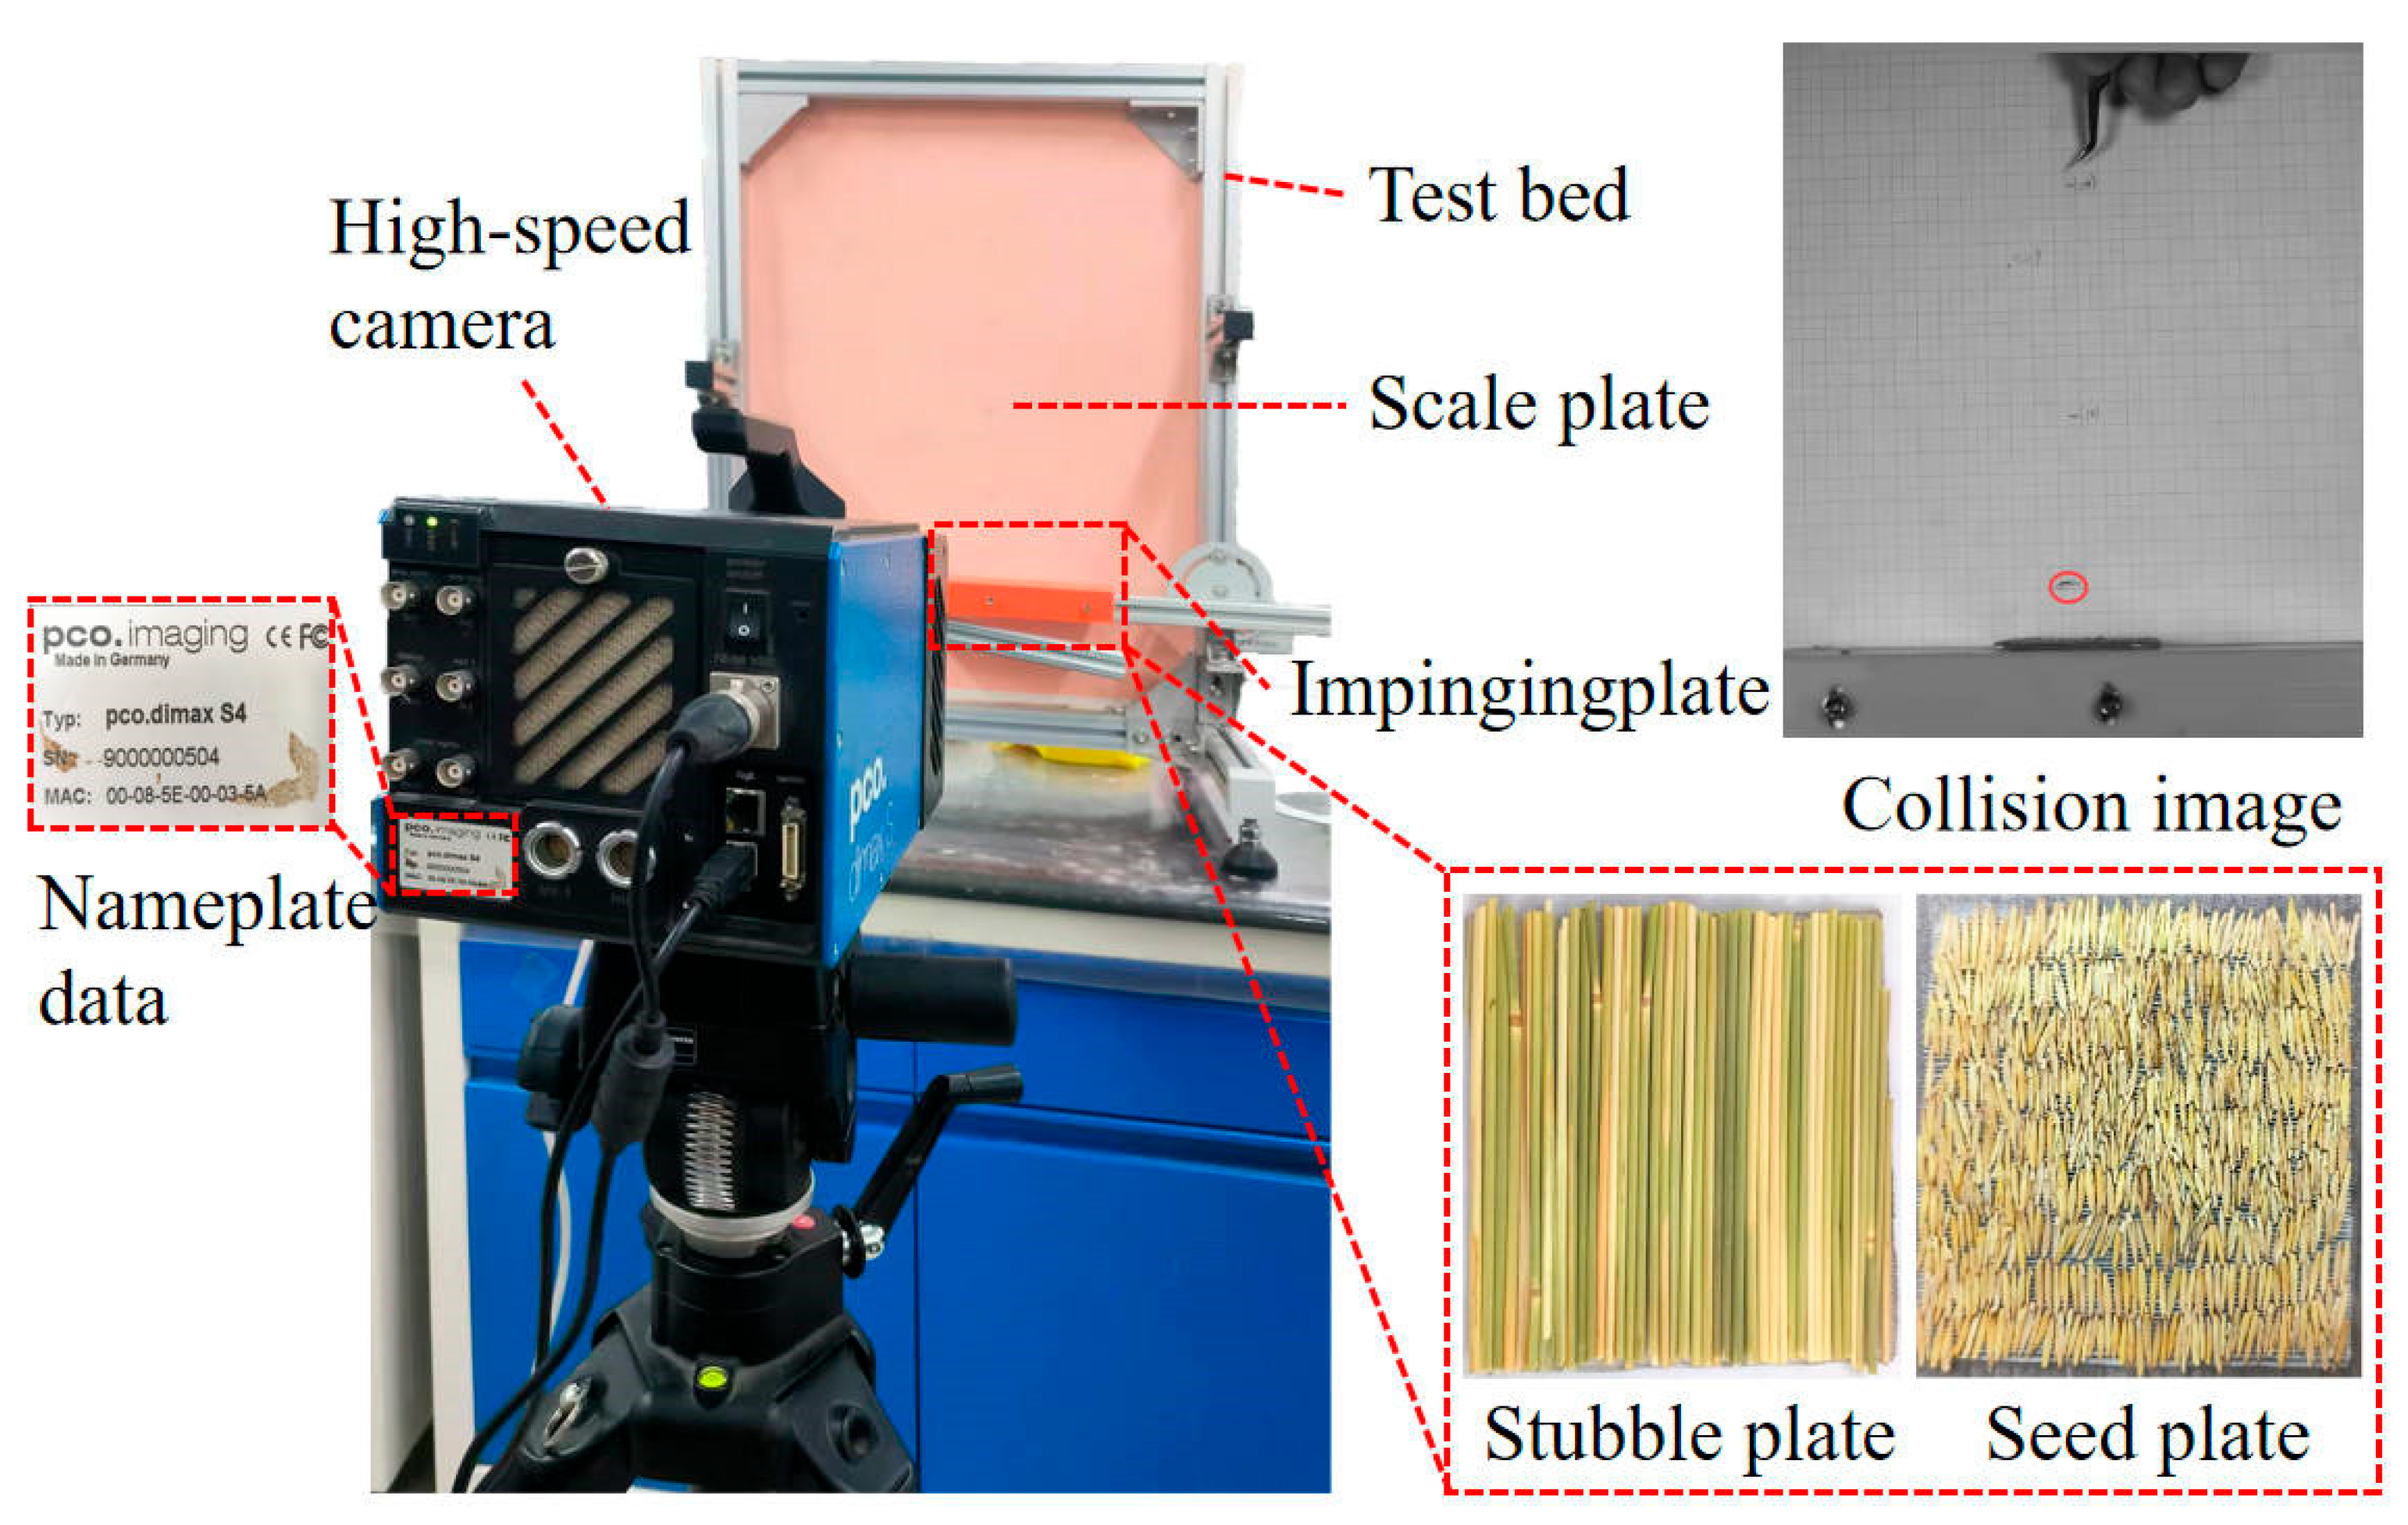
To determine the coefficients of restitution for L. chinensis seed–seed, seed–straw, and straw–straw interactions, a custom-designed test platform was employed. The setup included a POC.dimax S high-speed camera and a calibrated scale plate. The high-speed camera was set to a frame rate of 450 fps (image resolution: 1280 × 1024 pixels). Contact plates for seeds and straw were fabricated using acrylic sheets and double-sided adhesive, as illustrated in Figure 4.
Taking the seed–seed interaction as an example, individual L. chinensis seeds were lifted to a fixed release height (H0). To minimize the influence of air resistance on small particles and ensure accurate rebound height measurement, the release height was set to 20 cm. Due to the irregular shape of L. chinensis seeds and their pronounced dimensional disparity in length, width, and thickness, the seeds were horizontally oriented along the longitudinal axis to standardize drop posture. Upon release, the seeds followed a free-fall trajectory and rebounded after impacting the contact surface.
The entire motion sequence was recorded using the high-speed camera, and rebound heights were measured with the calibrated scale plate. Coefficients of restitution were determined for seed–seed, seed–straw, and straw–straw interactions. The final results are summarized in Table 3.

2.2.2. Static and Dynamic Friction Coefficients

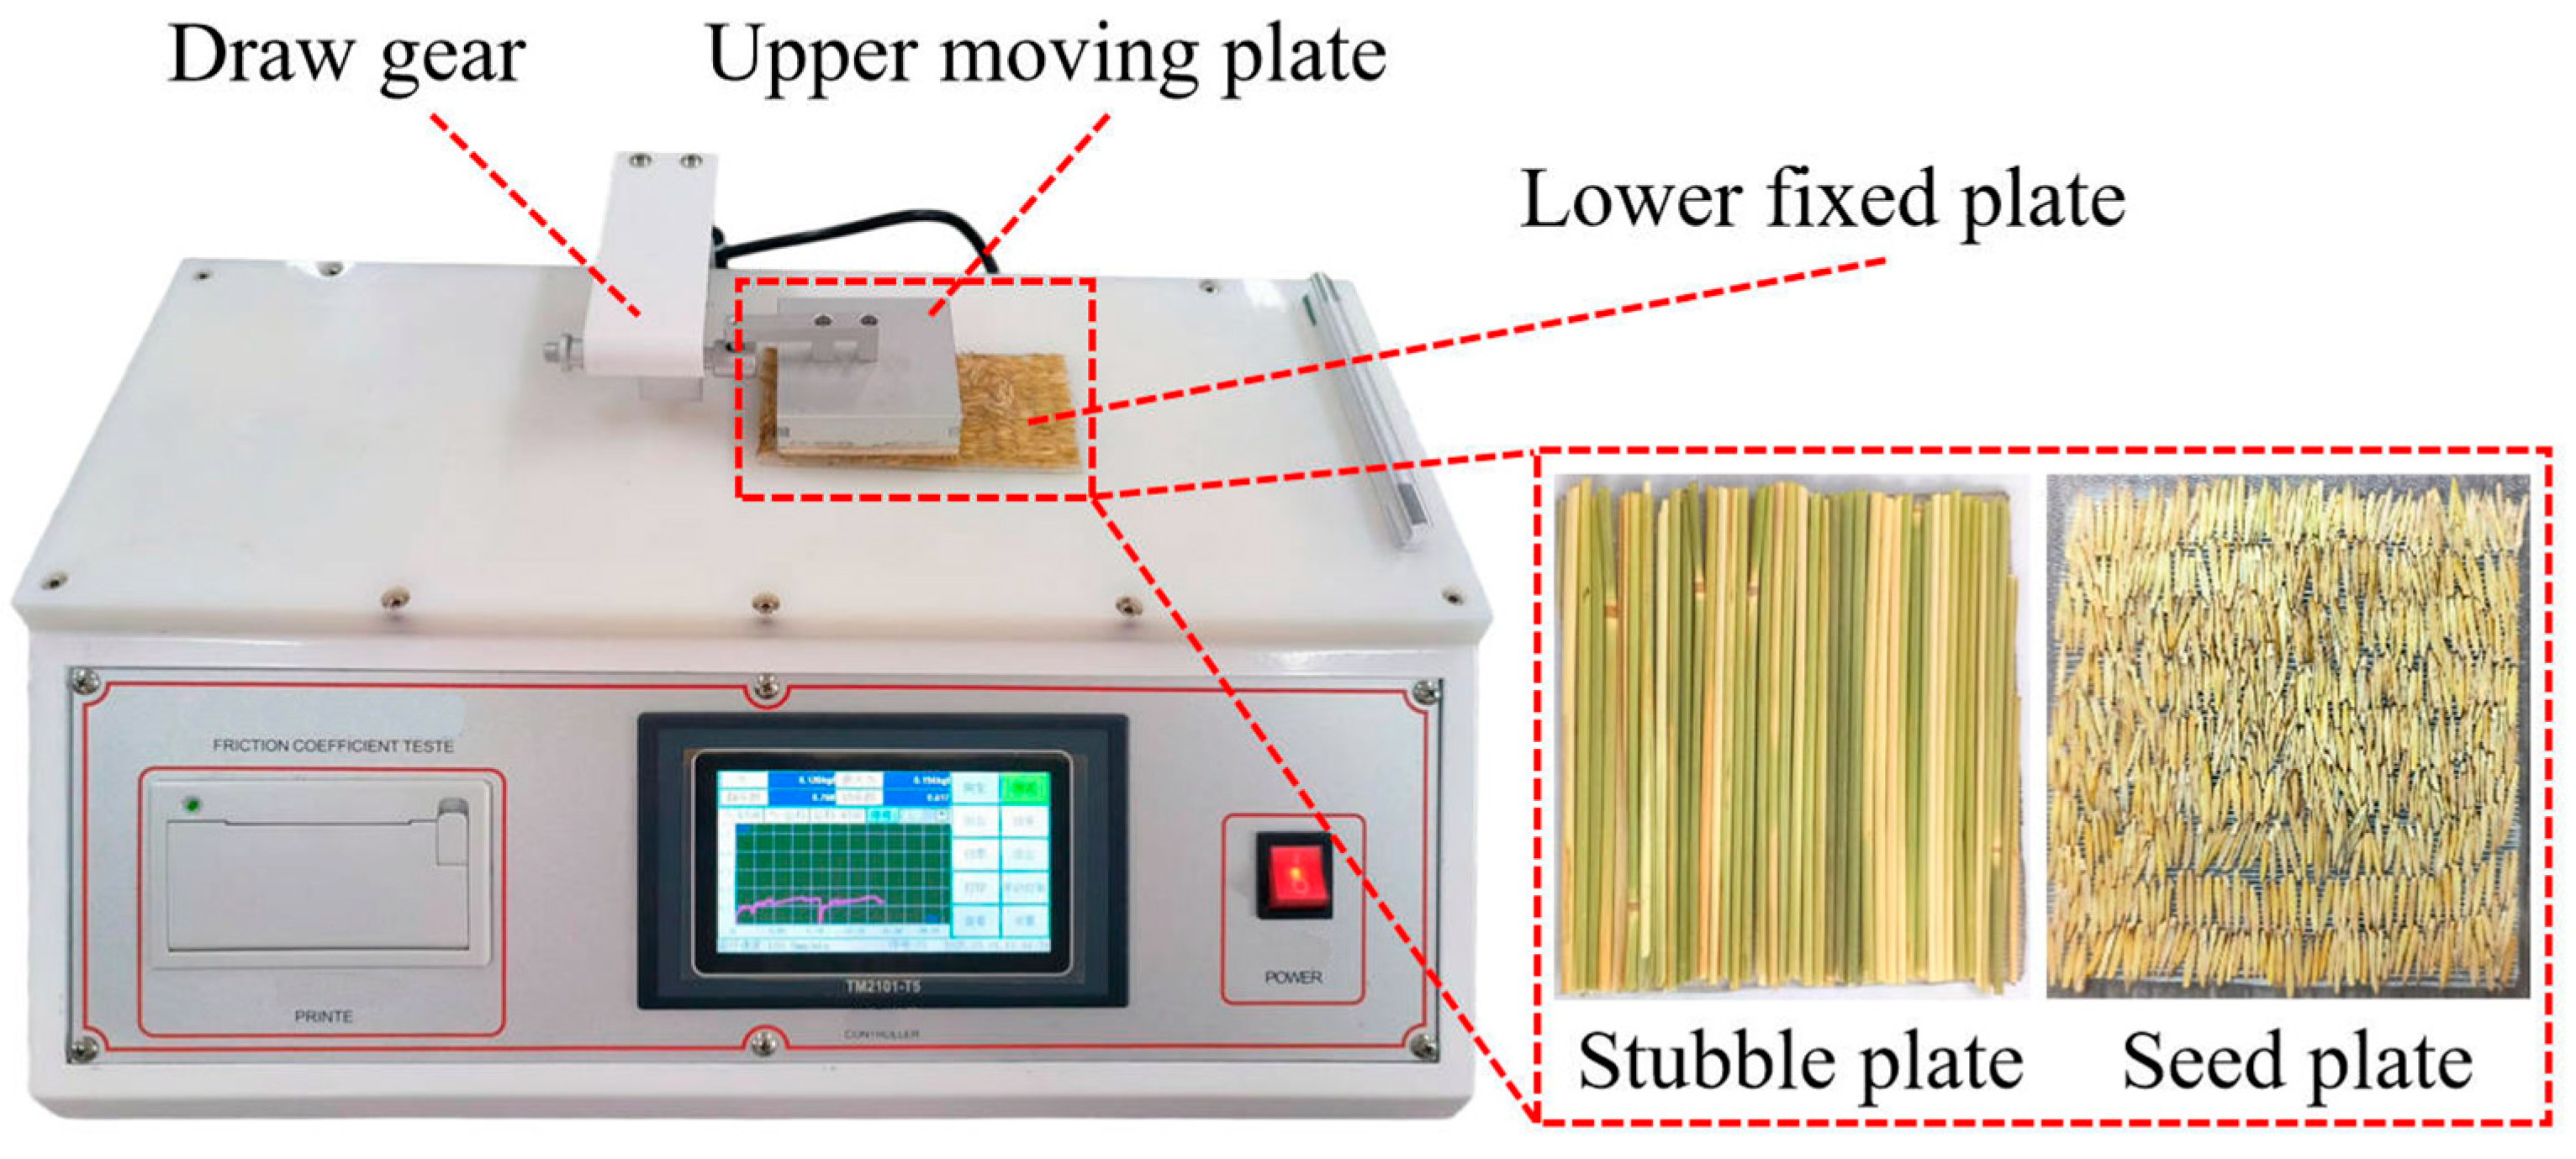
The static and dynamic friction coefficients for L. chinensis seed–seed, seed–straw, and straw–straw interfaces were measured using an SM-XS-001 friction coefficient tester (LICE, Dongguan, China). The same seed and straw contact plates used in the restitution coefficient test were employed for this measurement.
For instance, when measuring the seed–straw friction coefficient, the upper surface of the fixture was covered with the L. chinensis seed plate, and the lower surface was covered with the straw plate. The traction speed was set to 100 mm/min, and the sliding distance was set to 60 mm. Once the test began, sliding friction occurred between the seed and straw surfaces, as illustrated in Figure 5.
The static and dynamic friction coefficients for seed–seed, seed–straw, and straw–straw interfaces were measured separately. Each test was repeated 12 times, and the mean values were calculated. The resulting friction coefficients are summarized in Table 4.

2.3. DEM Model Construction of L. chinensis Seeds and Straw

2.3.1. Selection of Contact Model and Material Modeling

Discrete element simulation parameters for Leymus chinensis seeds and straw were calibrated using EDEM 2022.3 software. L. chinensis seeds and straw are regarded as non-cohesive particulate materials. As the adhesive forces among seed–seed, seed–straw, and straw–straw contacts are negligible, the Hertz–Mindlin (no slip) contact model was selected to simulate their mechanical interactions.
To determine the mass ratio of seeds and straw in the mixture, 20 g of the sample was randomly selected and manually separated into seed and straw components, which were then weighed separately. The experiment was repeated five times, and the mean values were calculated. The resulting proportions were 73.2% seeds and 26.8% straw.
Due to the natural tapering of L. chinensis straw and the impact of harvesting equipment, the mixture contained fragments of straw with varying lengths and diameters. To enhance simulation accuracy, the straw portion of the 20 g sample was categorized into three groups based on length. The weight proportion of each group was measured, and the average length and diameter were determined using a vernier caliper. The results are summarized in Table 5.
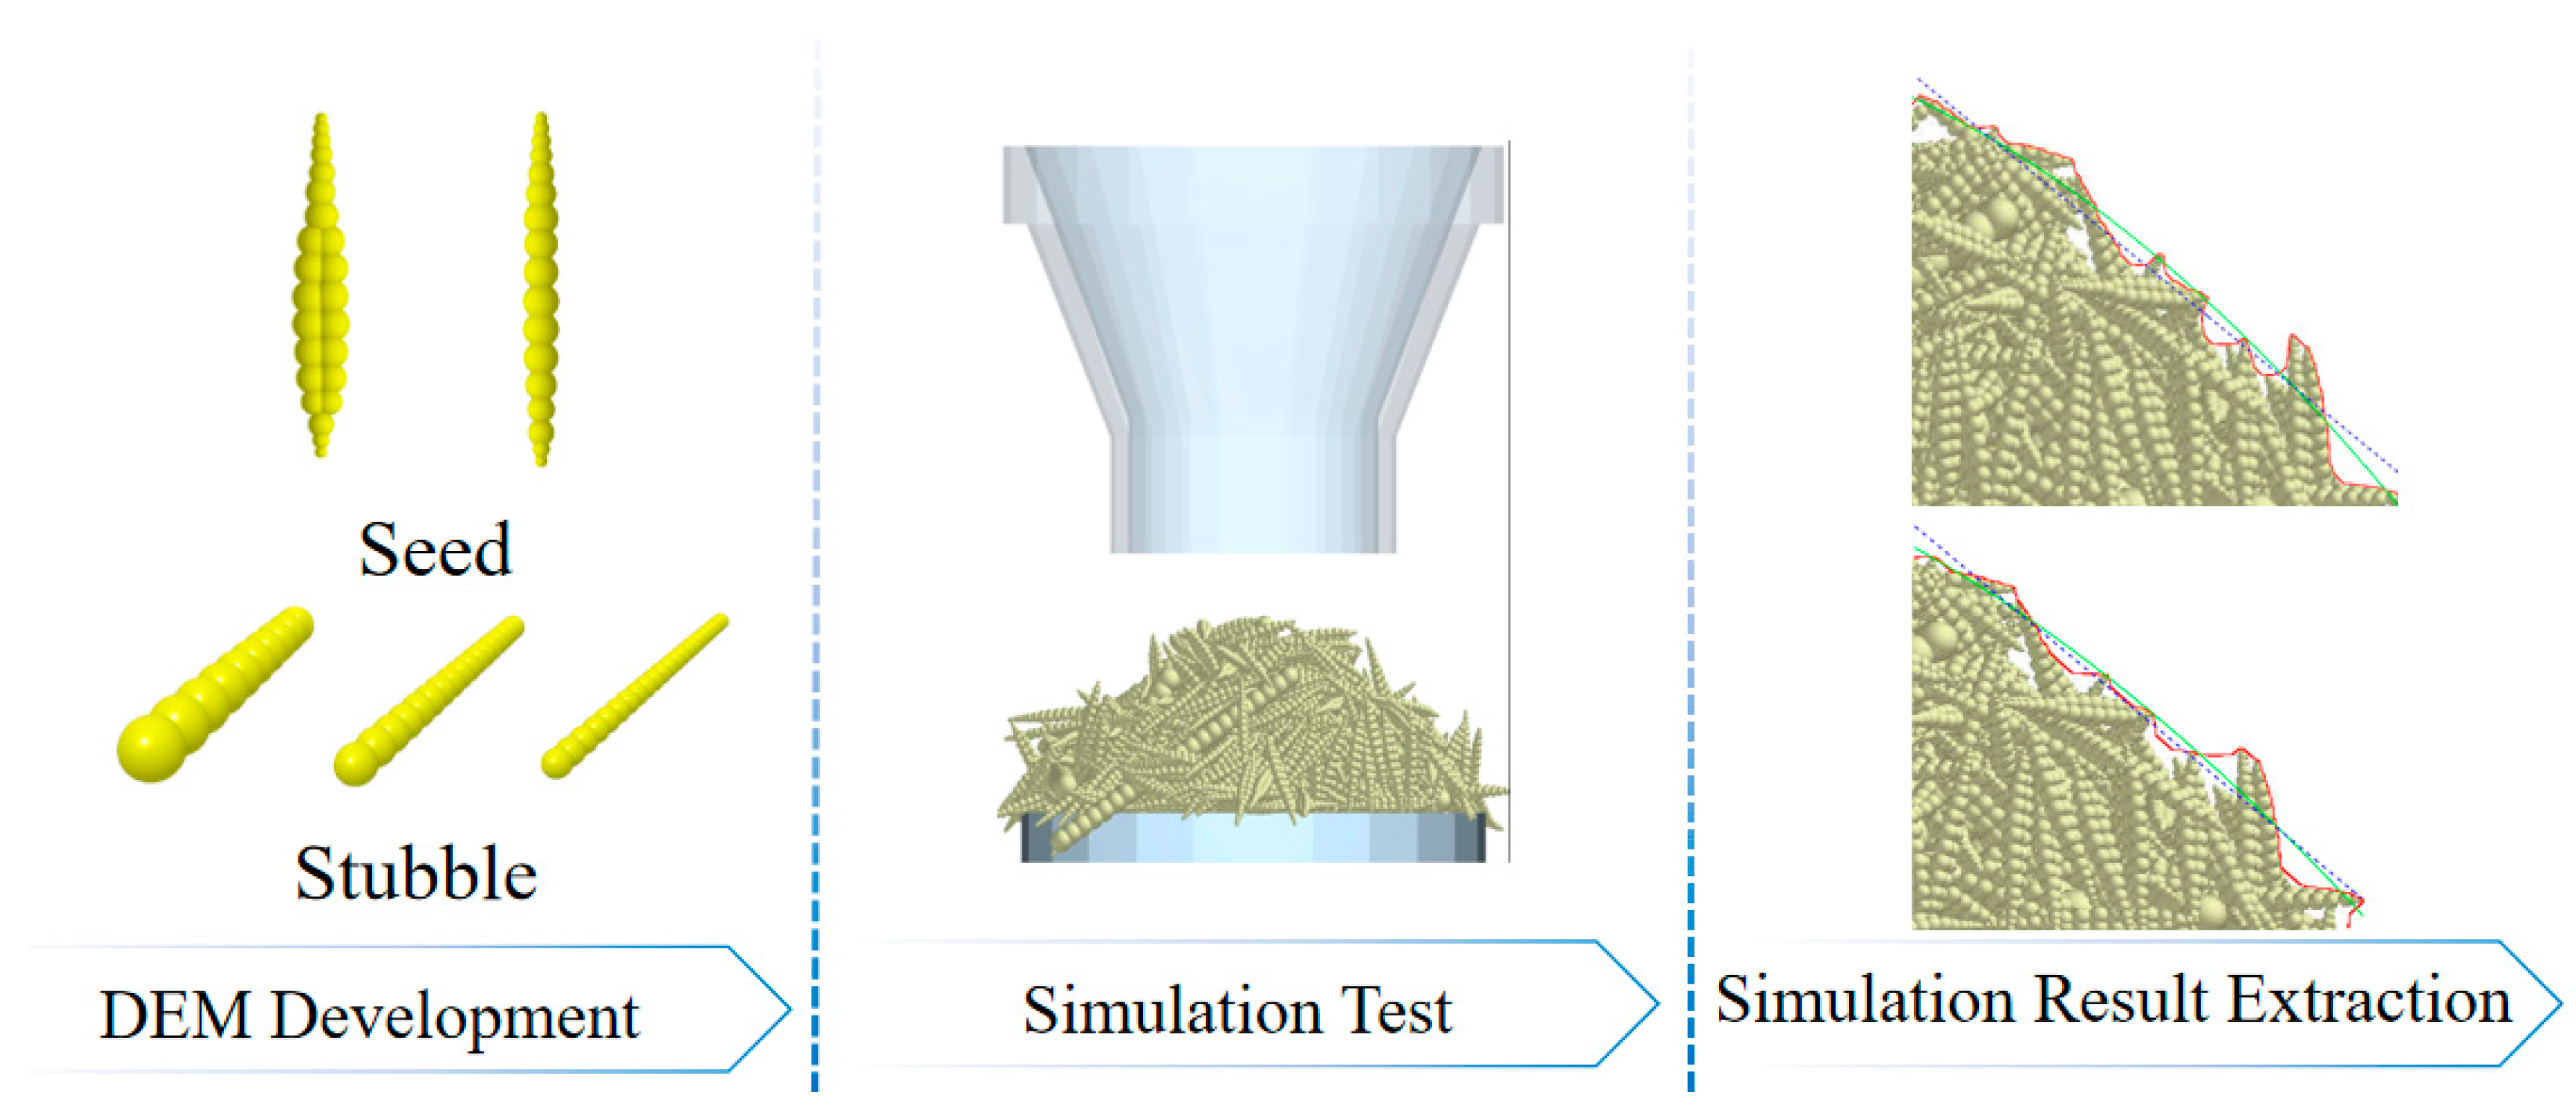
L. chinensis seeds are small in size and exhibit minimal variability among individual particles. They are slender in shape, and their geometric model was constructed based on measured triaxial dimensions and overall morphology. To simplify the discrete element model, each seed was modeled as a cluster of 24 spherical particles with a flattened central region. A 3D model of the repose angle apparatus was constructed using modeling software, appropriately simplified, and imported into the EDEM simulation environment.

2.3.2. Simulation Parameter Setup and Model Construction

A particle factory was defined at the top section of the funnel. Given the low bulk density of the L. chinensis seed–straw mixture, a total of 10 g of material was considered sufficient for the simulation. Based on the previously determined mass ratio, 7.32 g of seed particles and 2.68 g of straw particles were generated. Particle generation was completed within 3 s. To enhance simulation accuracy, the total simulation duration was set to 50 s. Considering the moderate complexity of the simulation, the data logging interval was set to 1 s. The model construction and simulation of Leymus chinensis seeds and straw are shown in Figure 6.

2.4. Response Surface Methodology (RSM) Experimental Design

The repose angle of the L. chinensis seed–straw mixture was selected as the primary evaluation index. MATLAB R2021b software was used to process images and fit the contour curves of the material pile to determine the repose angle. Design-Expert 13 software was used to design the Plackett–Burman experiment for identifying key factors significantly influencing the repose angle. Based on the results of the Plackett–Burman screening, a steepest ascent experiment was conducted for the most influential parameters to determine the optimal parameter region. Subsequently, parameter calibration and optimization were performed using the Box–Behnken experimental design.

2.4.1. Plackett–Burman Screening Experimental Design

To identify key parameters influencing the contact behavior of the L. chinensis seed–straw mixture, a screening experiment was conducted using the static friction coefficient, dynamic friction coefficient, and coefficient of restitution of seed–straw interactions as test factors. The high and low levels of each factor were set according to the maximum and minimum values obtained from physical measurements. A Plackett–Burman experimental design was employed for screening analysis, and the test scheme is summarized in Table 6.

2.4.2. Steepest Ascent Experimental Design

Based on the analysis of the Plackett–Burman results, a steepest ascent experiment was conducted for the three parameters identified as significantly influencing the repose angle, as shown in Table 7. The relative error between the measured and simulated repose angles was used to evaluate the optimal parameter region. During the simulation, parameters found to be insignificant were fixed at their average values obtained from physical experiments.

2.4.3. Box–Behnken Experimental Design

A three-factor, three-level response surface experimental design was conducted based on the steepest ascent experiment to determine the optimal combination of three factors: the seed–straw dynamic friction coefficient, the seed–seed static friction coefficient, and the seed–straw static friction coefficient, as shown in Table 8.

3. Results

3.1. Results of the Plackett–Burman Screening Experiment

The experimental design and results of the Plackett–Burman screening test are summarized in Table 9. The data were analyzed using Design-Expert 13 software to evaluate the significance of each parameter on the repose angle. The significance analysis results are presented in Table 10.
As shown in Table 10, the influence of contact parameters on the repose angle, ranked in descending order of significance, was as follows: seed–straw dynamic friction coefficient, seed–seed static friction coefficient, seed–straw static friction coefficient, seed–seed coefficient of restitution, seed–seed dynamic friction coefficient, seed–straw coefficient of restitution, straw–straw static friction coefficient, straw–straw coefficient of restitution, and straw–straw dynamic friction coefficient.
Among these, three parameters—the seed–straw dynamic friction coefficient, seed–seed static friction coefficient, and seed–straw static friction coefficient—exhibited statistically significant effects, with p-values less than 0.01. The remaining six parameters did not exhibit statistically significant effects. Therefore, these three significant parameters were selected for further investigation using the steepest ascent experimental design.

3.2. Results of the Steepest Ascent Experiment

The design and results of the steepest ascent experiment are summarized in Table 11. The minimum relative error of the repose angle occurred in Run 3, indicating that the optimal parameter region lies near the values used in that run. Accordingly, the parameter set from Run 3 was chosen as the center point, while those from Runs 2 and 4 were used as the low and high levels, respectively, in the subsequent Box–Behnken design.

3.3. Results of the Box–Behnken Experimental Design

A three-factor, three-level response surface experiment was conducted based on the results of the steepest ascent test to optimize the seed–straw dynamic friction coefficient, seed–seed static friction coefficient, and seed–straw static friction coefficient in the simulation. The repose angle was selected as the evaluation index. The experimental design and results are summarized in Table 12.
A regression analysis of the experimental results was conducted using Design-Expert 13 software to evaluate the significance of each factor, as summarized in Table 13. The resulting regression equation for the repose angle response variable (Y) is as follows:
Y = 41.63 + 2.91   L + 2.29   M + 2.65   N 0.5275   L M 0.4925   L N 0.8025   M N 0.3023   L 2 + 0.4777   M 2 0.8022   N 2
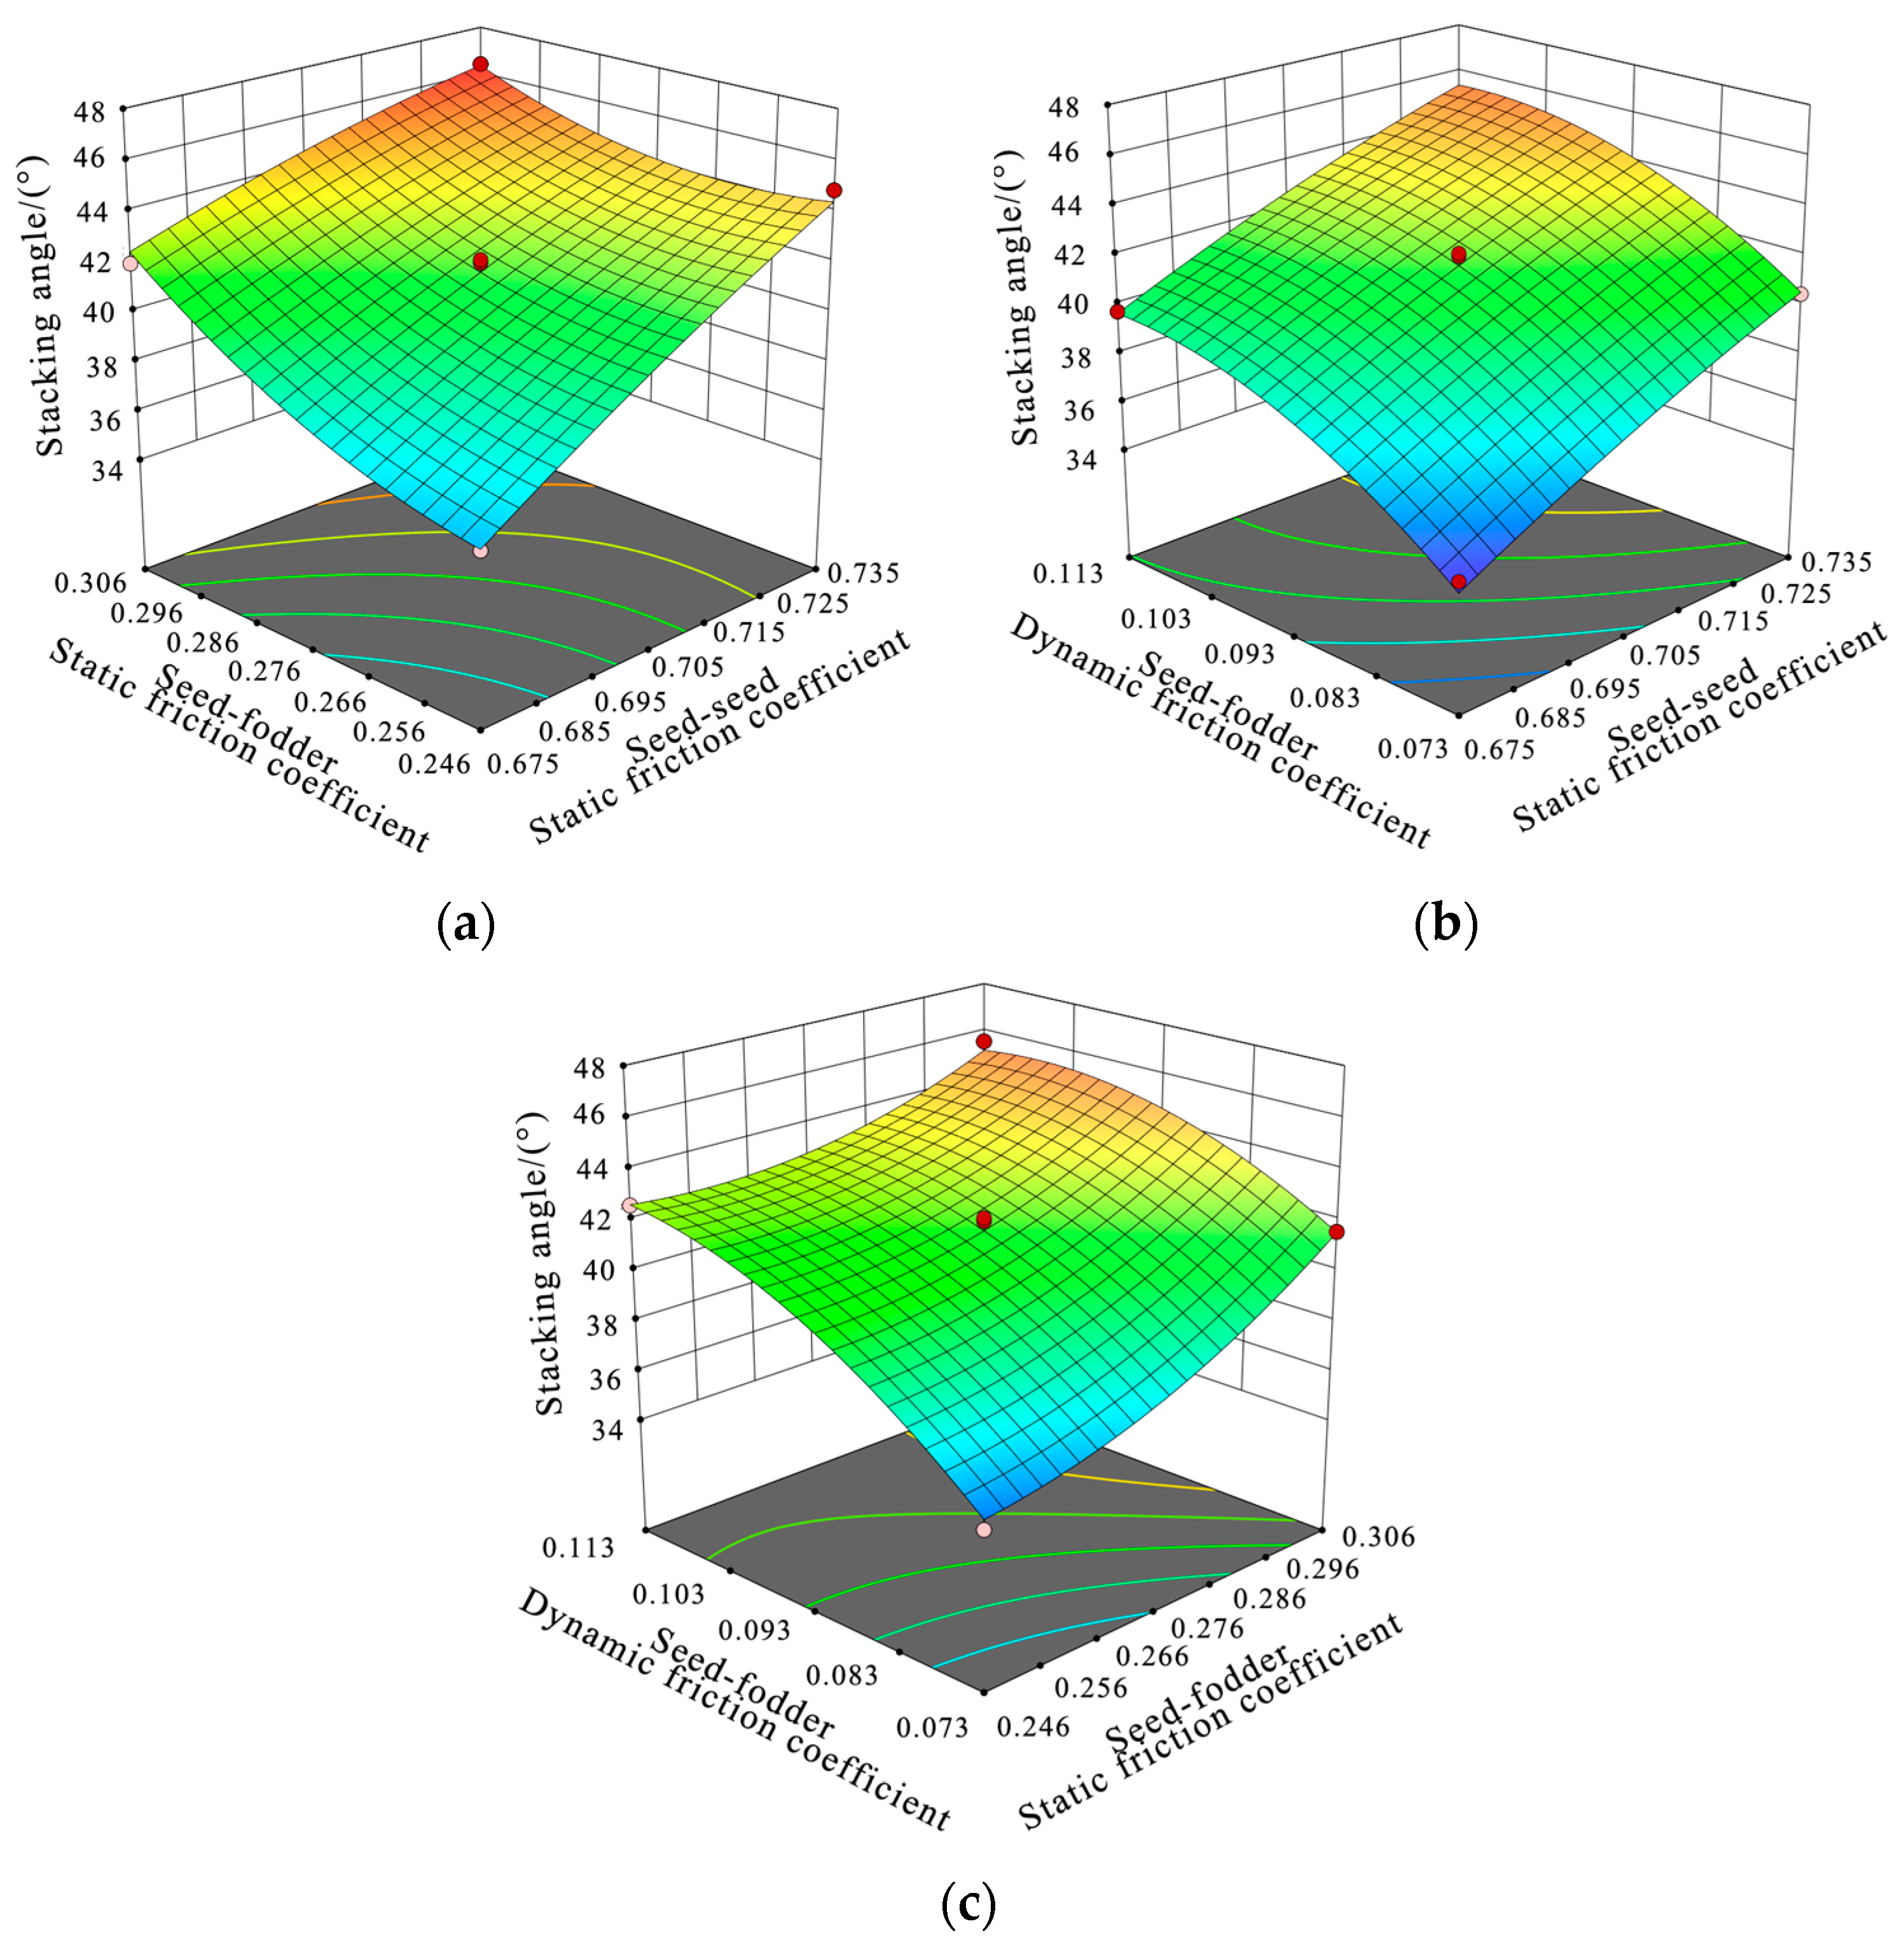
The significance analysis results indicate that the seed–seed static friction coefficient L, seed–straw static friction coefficient M, and seed–straw dynamic friction coefficient N all have highly significant effects on the repose angle. Moreover, significant pairwise interactions were observed among certain factors. In particular, the interaction between L and M was highly significant, whereas the interaction between L and N was not statistically significant.
The regression model for the response variable (repose angle) demonstrated a highly significant overall fit. A p-value greater than 0.05 from the lack-of-fit test suggests that no significant terms were omitted from the model. The results of this study indicate that the seed-seed static friction coefficient and the seed-straw static friction coefficient are the two key factors influencing the seed cleaning performance of Leymus chinensis. Therefore, in constructing the discrete element model for Leymus chinensis straw and seeds, it is crucial to accurately calibrate the interactions between the two to accurately predict the actual cleaning performance.
Based on the regression equation given in Equation (5), response surface plots were generated to visualize the effects of significant factor interactions on the repose angle, as shown in Figure 7. As shown in Figure 7a, the response surface is steeper along the seed–seed static friction coefficient L axis than along the seed–straw static friction coefficient M axis, indicating that L has a stronger effect on the repose angle. Figure 7b and Table 11 confirm that the interaction between L and seed–straw dynamic friction coefficient N is not significant. As shown in Figure 7c, the response surface is steeper along the M axis than the N axis, further confirming that M has a greater effect on the repose angle than N.

3.4. Parameter Optimization and Simulation Validation

A repose angle test was conducted using the L. chinensis seed–straw mixture, and the measured repose angle was 41.14°. Taking the experimentally measured repose angle as the target response, multi-objective parameter optimization was performed with Design-Expert 13 software using the established quadratic regression model. The optimal values of the seed–seed static friction coefficient L, seed–straw static friction coefficient M, and seed–straw dynamic friction coefficient N were determined to be 0.709, 0.281, and 0.085, respectively.
The repose angle was simulated three times using the discrete element method (DEM), yielding values of 42.534°, 41.921°, and 41.669°. The average simulated repose angle was 42.041°, with a relative error of 2.14% compared to the measured value.
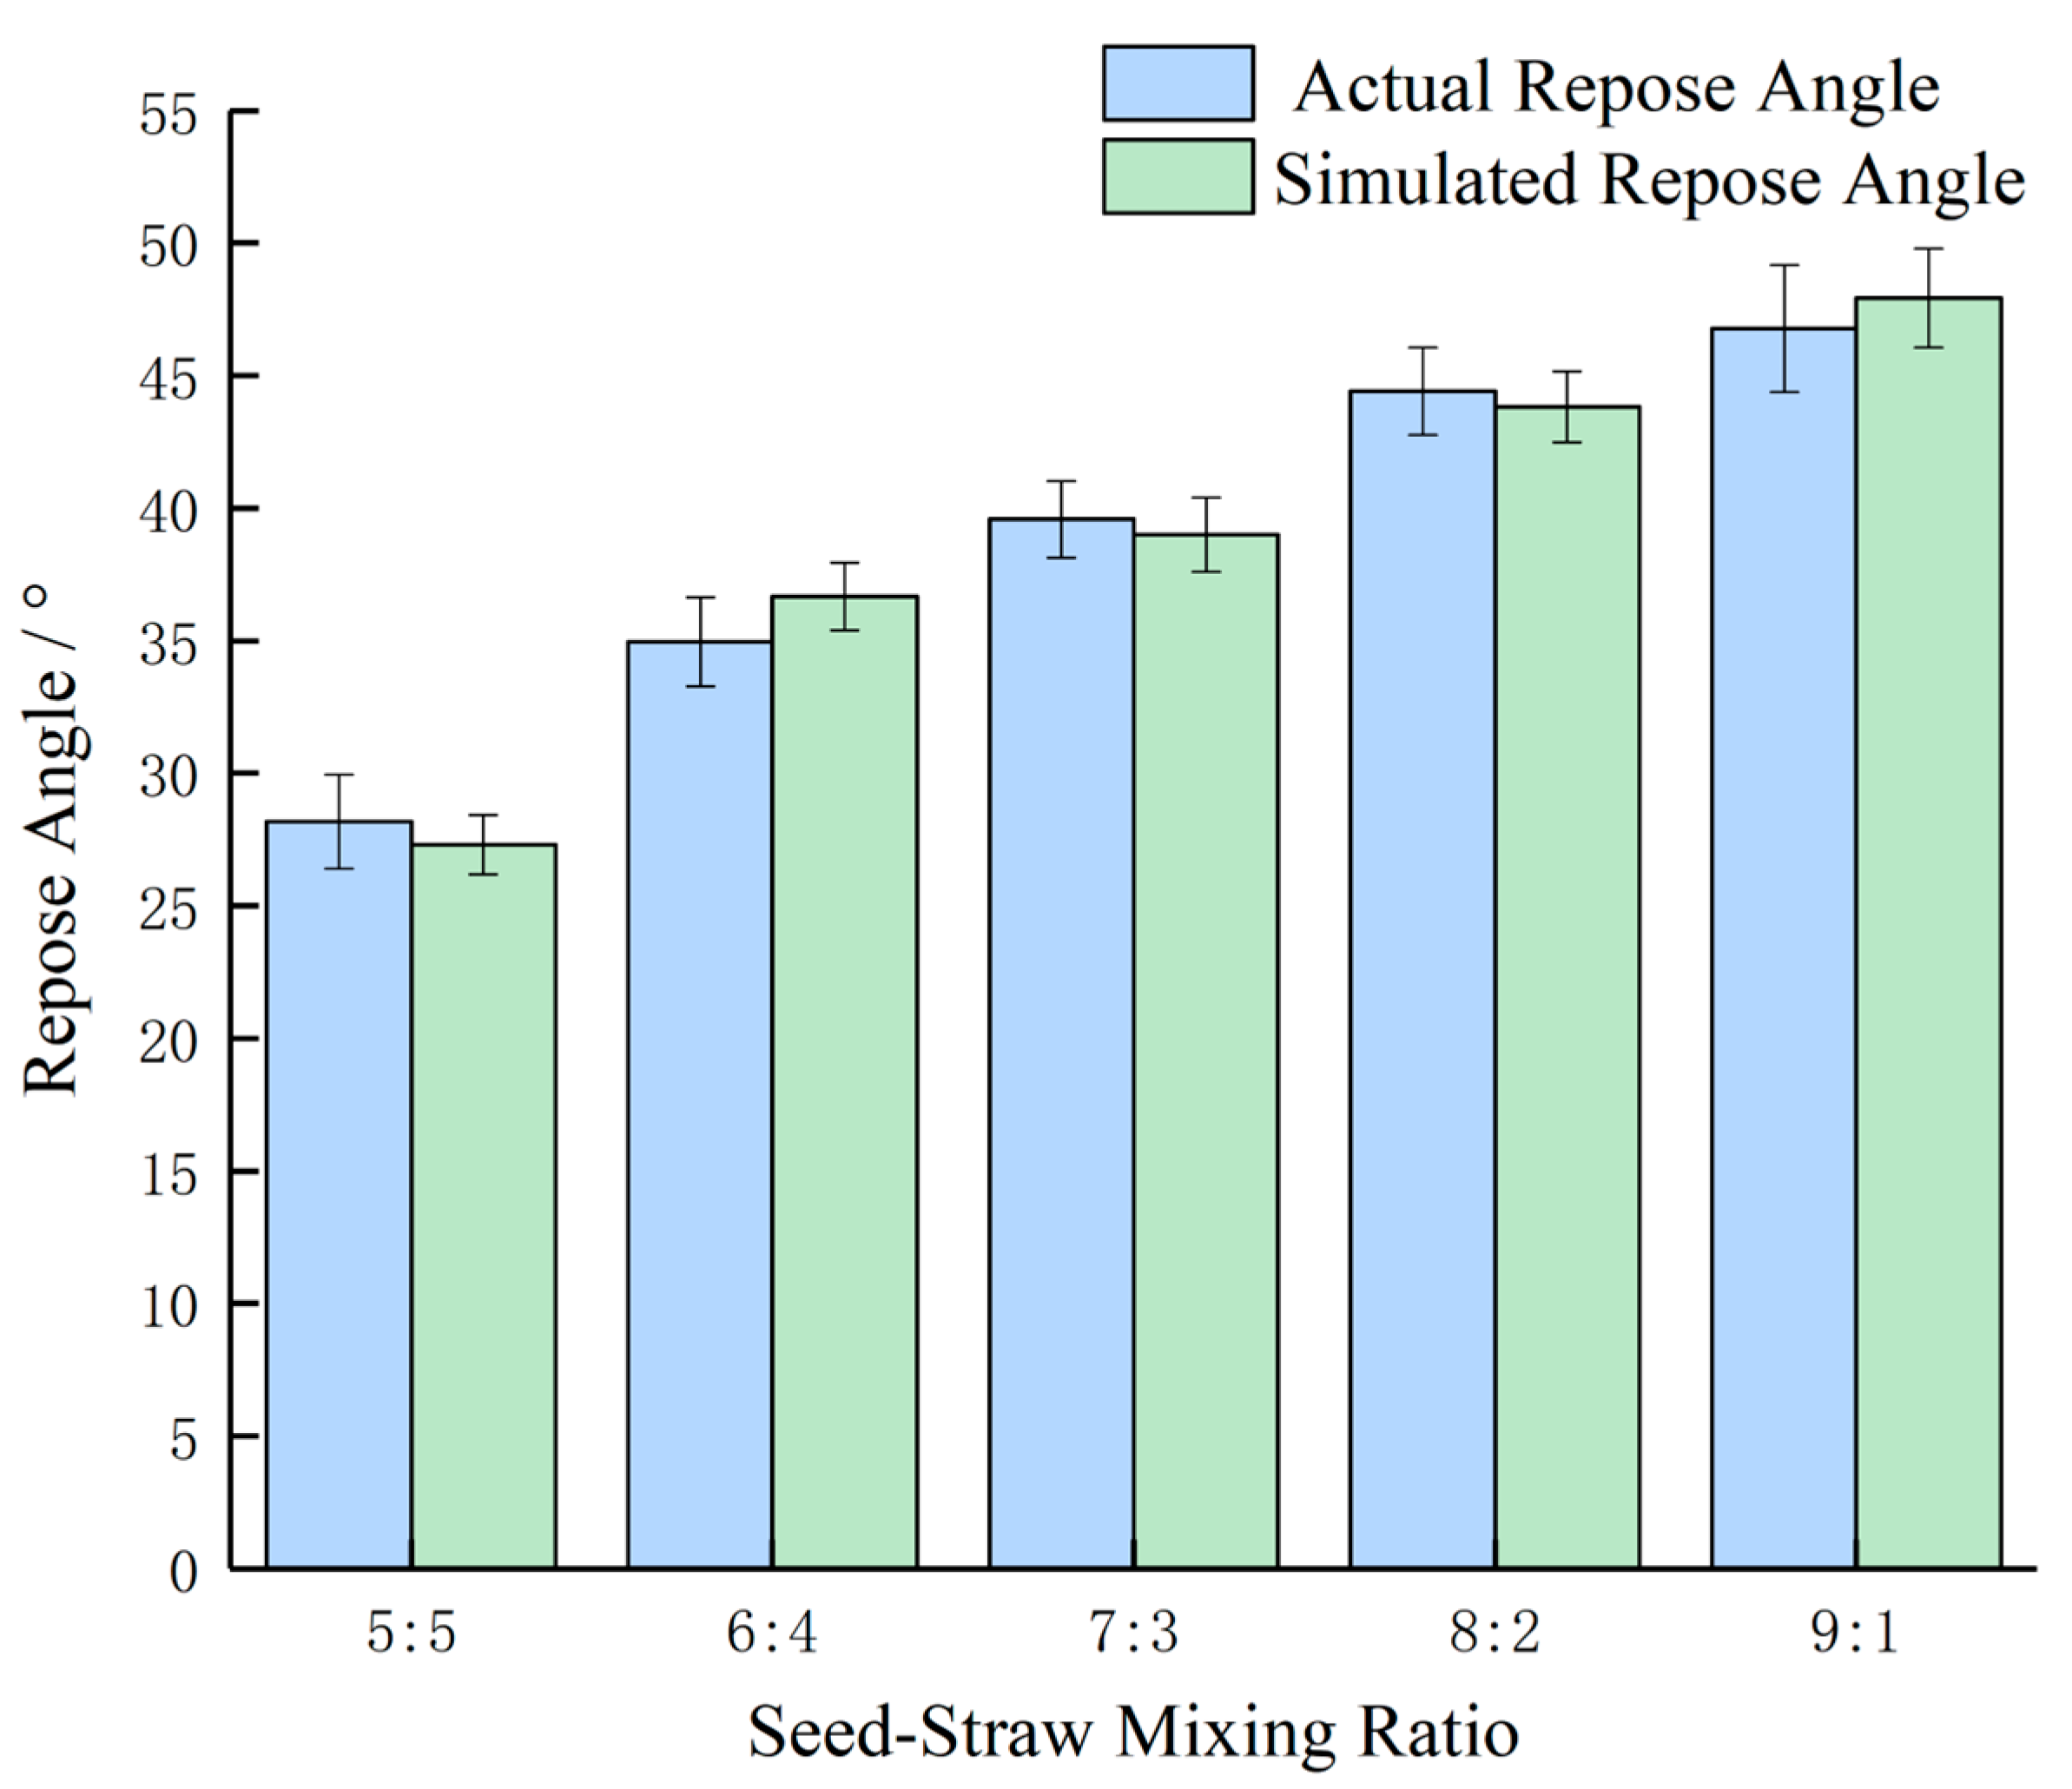
To verify the accuracy of the parameters, the seed-straw mixing ratio of L. chinensis seeds and straw was divided by weight into 5:5, 6:4, 7:3, 8:2, and 9:1, as shown in Figure 8. Five groups of physical- and simulation-combined validation experiments were then conducted, with experimental errors of 3.05%, 4.86%, 1.44%, 1.31%, and 2.46%, respectively. The small errors demonstrate the accuracy of the calibrated parameters.

4. Conclusions

This study conducted a comprehensive investigation into the mechanical characteristics and interaction mechanisms of L. chinensis seed–straw mixtures by measuring physical properties, calibrating contact parameters, and constructing a discrete element model. The findings provide key parameters and theoretical support for the simulation-based optimization of seed cleaning equipment, with the main conclusions outlined below:
1. The basic physical properties of L. chinensis seeds and straw—including triaxial dimensions, thousand-seed weight, density, moisture content, Poisson’s ratio, elastic modulus, and shear modulus—were obtained through physical experiments. The average repose angle was measured to be 41.14° using a SC-104B repose angle tester in combination with MATLAB-based image processing. The restitution coefficients for seed–seed, seed–straw, and straw–straw contacts were 0.349, 0.378, and 0.241, respectively, based on high-speed camera analysis. The static and dynamic friction coefficients were measured to be 0.72 and 0.46 (seed–seed), 0.30 and 0.10 (seed–straw), and 0.26 and 0.09 (straw–straw), respectively.
Through the determination of physical properties, the density and moisture content of L. chinensis seeds and straw are nearly identical, which is a significant challenge in the cleaning of L. chinensis materials. However, in the contact parameters, the friction coefficient and restitution coefficient of L. chinensis straw relative to the seeds are smaller, indicating that the straw has better sliding properties and poorer elasticity. This aspect can be considered for optimizing the structure in subsequent cleaning processes.
2. A discrete element simulation model of the L. chinensis seed–straw mixture was developed using the Hertz–Mindlin (no slip) contact model. The seed mass proportion was 73.2%, and each seed was represented by a cluster of 24 particles to capture its elongated, flattened geometry. Straw particles were categorized into three length-based groups—long, medium, and short—with mass proportions of 21%, 36%, and 43%, respectively. This modeling strategy greatly improved the realism of the simulation. However, potential issues may arise when applied to more complex or industrial-scale flows, and further optimization will be conducted thereafter.
3. Key parameters affecting the repose angle of the mixture were identified and optimized. The Plackett–Burman experiment revealed that the seed–straw dynamic friction coefficient, seed–seed static friction coefficient, and seed–straw static friction coefficient had significant effects (p < 0.01). These parameters were further optimized using steepest ascent and Box–Behnken experimental designs. The optimized values for the seed–seed static friction coefficient, seed–straw static friction coefficient, and seed–straw dynamic friction coefficient were 0.709, 0.281, and 0.085, respectively. Validation tests using the parameter set derived from the experimental results yielded a relative error of 2.14% compared to the measured repose angle. Additionally, five sets of validation tests combining physical and simulation results were conducted, with experimental errors of 3.05%, 4.86%, 1.44%, 1.31%, and 2.46%, respectively. The small errors indicate the reliability of the model.
This study presents the first discrete element model for L. chinensis seed–straw mixtures. The findings offer essential parameters and theoretical insights for the simulation-based design of seed cleaning equipment and provide a valuable reference for discrete element modeling of other forage seed–straw systems.
Author Contributions

Conceptualization, A.Z. and W.D.; methodology, A.Z.; software, A.Z. and W.D.; validation, A.Z.; formal analysis, A.Z.; investigation, A.Z. and Y.Q.; resources, F.L. and Q.W.; data curation, W.D. and Y.R.; writing—original draft preparation, A.Z. and W.D.; writing—review and editing, Q.W.; visualization, W.D. and Y.W.; funding acquisition, Q.W. All authors have read and agreed to the published version of the manuscript.

Funding

This research was funded by the Inner Mongolia Natural Science Foundation (2023MS03013) Inner Mongolia Autonomous Region Science and Technology Plan Project (2023YFDZ0024), and Inner Mongolia Autonomous Region Science and Technology Plan Project (2025YFHH0133).

Data Availability Statement

The original contributions presented in this study are included in the article. Further inquiries can be directed to the corresponding author.

Conflicts of Interest

The authors declare no conflict of interest.

References

  1. Liu, G.S.; Wang, D.L.; Shi, F.L.; Wu, Z.N.; Shen, Z.B.; Li, X.X. Review of Study on Germplasm Resources of Leymus chinensis and Its Inspirations. Chin. J. Grassl. 2022, 44, 1–9. [Google Scholar] [CrossRef]
  2. Bai, Y.F.; Zhao, Y.J.; Wang, Y.; Zhou, K.L. Assessment of Ecosystem Services and Ecological Regionalization of Grasslands Support Establishment of Ecological Security Barriers in Northern China. Bull. Chin. Acad. Sci. 2020, 35, 675–689. [Google Scholar] [CrossRef]
  3. Liang, X.; Hou, X.Y.; Wang, Y.R.; Ren, W.B.; Zhao, Q.S.; Wang, Z.L.; Li, Y.; Wu, Z.N. Comprehensive Evaluation on Saline-Alkali Tolerance of Leymus chinensis Germplasm Resources. Chin. J. Grassl. 2019, 41, 1–9. [Google Scholar] [CrossRef]
  4. Li, Y.; Hou, X.Y.; Wu, Z.N.; Ren, W.B.; Zhao, Q.S.; Liang, X. Comprehensive Evaluation on Drought-Resistance of Leymus chinensis Germplasm Resources. Chin. J. Grassl. 2019, 41, 75–82. [Google Scholar] [CrossRef]
  5. Liu, G.B.; Jiao, D.Z.; Zhou, C. Advances in Studies on Biological and Ecological Characteristics of Leymus chinensis. Ecol. Sci. 2024, 43, 193–199. [Google Scholar] [CrossRef]
  6. Ma, Z.Y.; Wan, Q.H.; Chen, W.X.; Bu, K.; Yang, J.Z.; Du, W.L. Design and Testing of Air-and-Screen Cleaning Device for Leymus chinensis Seed Threshing Material. J. Chin. Agric. Mech. 2022, 43, 96–105+127. [Google Scholar] [CrossRef]
  7. Wang, Q.X.; Ma, W.M.; Wang, Z.H.; Liu, Z.G.; Yang, L. Design and Experiment on Gramineous Herbage Seed Harvester. Trans. Chin. Soc. Agric. Mach. 2013, 44 (Suppl. 2), 96–101. [Google Scholar]
  8. Li, F.M.; Li, W.; Wang, Q.; Liu, W.; Gao, X.H.; Su, J.J. Design and Experiment of Pick Device for Gramineous Grass Seed. Agric. Eng. 2022, 12, 83–87. [Google Scholar] [CrossRef]
  9. Narayanan, R.; Tram, V.H.; Trotter, T.; Rixon, C.; Raveendran, G.; Umansky, F.; Bhattarai, S.P. Adaptation of Grain Cleaning Equipment for Kalonji and Sesame Seeds. Agric. Eng. 2025, 7, 179. [Google Scholar] [CrossRef]
  10. Yang, X.; Sun, X.; Li, B.; Liu, Y.; Wang, S.; Gao, X.; Dong, Y. Design and Experimental Study of a Cleaning Device for Edible Sunflower Harvesting. Agriculture 2024, 14, 1344. [Google Scholar] [CrossRef]
  11. Xu, T.; Gou, Y.; Huang, D.; Yu, J.; Li, C.; Wang, J. Modeling and Parameter Selection of the Corn Straw–Soil Composite Model Based on the DEM. Agriculture 2024, 14, 2075. [Google Scholar] [CrossRef]
  12. Li, M.; He, X.; Wang, X.; Zhu, G.; Pan, X.; Gou, K.; Liu, J. Design and Experiment of Seeding Device for Morchella Planter in Southern Xinjiang Desert. Agriculture 2025, 15, 1140. [Google Scholar] [CrossRef]
  13. Qian, C.; Fan, Z.; Yan, D.; Qin, W.; Jiang, Y.; Huang, Z.; Xing, H.; Wang, Z.; Zang, Y. Numerical Simulation of Dry and Wet Rice Seeds in an Air-Suction Seed Metering Device. Agronomy 2025, 15, 1145. [Google Scholar] [CrossRef]
  14. Liu, R.; Li, Y.J.; Liu, Z.J.; Liu, L.J.; Lv, H.T. Analysis and Calibration of Discrete Element Parameters of Coated Maize Seed. Trans. Chin. Soc. Agric. Mach. 2021, 52 (Suppl. 1), 1–8+18. [Google Scholar]
  15. Wang, Y.X.; Liang, Z.J.; Zhang, D.X.; Cui, T.; Shi, S.; Li, K.H.; Yang, L. Calibration Method of Contact Characteristic Parameters for Corn Seeds Based on EDEM. Trans. Chin. Soc. Agric. Eng. 2016, 32, 36–42. [Google Scholar] [CrossRef]
  16. Shi, L.; Zhao, W.; Rao, G.; Guo, J.; Wang, Z. Modeling of Typically Shaped Corn Seeds and Calibration of the Coefficient of Rolling Friction. Agronomy 2023, 13, 1573. [Google Scholar] [CrossRef]
  17. Zhang, R.F.; Jiao, W.; Zhou, J.L.; Qi, B.; Liu, H.; Xia, Q.Q. Parameter Calibration and Experiment of Rice Seeds Discrete Element Model with Different Filling Particle Radius. Trans. Chin. Soc. Agric. Mach. 2020, 51 (Suppl. 1), 227–235. [Google Scholar] [CrossRef]
  18. Horabik, J.; Wiacek, J.; Parafiniuk, P.; Banda, M.; Kobylka, R.; Stasiak, M.; Molenda, M. Calibration of Discrete-Element-Method Model Parameters of Bulk Wheat for Storage. Biosyst. Eng. 2020, 200, 298–314. [Google Scholar] [CrossRef]
  19. Sun, K.; Yu, J.Q.; Liang, L.S.; Wang, Y.; Yan, D.X.; Zhou, L.; Yu, Y.J. A DEM-Based General Modelling Method and Experimental Verification for Wheat Seeds. Powder Technol. 2022, 401, 117353. [Google Scholar] [CrossRef]
  20. Yu, Q.X.; Liu, Y.; Chen, X.B.; Sun, K.; Lai, Q.H. Simulation Parameter Calibration and Experiment of Panax notoginseng Seeds Based on Discrete Element. Trans. Chin. Soc. Agric. Mach. 2020, 51, 123–132. [Google Scholar] [CrossRef]
  21. Zhao, X.; Bai, H.; Liu, F.; Dong, W. DEM Modelling Methods and Trait Analysis of Sunflower Seed. Biosyst. Eng. 2025, 250, 39–48. [Google Scholar] [CrossRef]
  22. Zhao, X.; Bai, H.; Liu, F.; Dong, W. Validation and Calibration of Parameters Sunflower Seeds–Soil. Granul. Matter 2025, 27, 71. [Google Scholar] [CrossRef]
  23. Hou, Z.F.; Dai, N.Z.; Chen, Z.; Qiu, Y.; Zhang, X.W. Measurement and Calibration of Physical Property Parameters for Agropyron Seeds in a Discrete Element Simulation. Trans. Chin. Soc. Agric. Eng. 2020, 36, 46–54. [Google Scholar]
  24. Zhang, X.R.; Hu, X.H.; Liu, J.X.; Yang, Y.M.; Li, Y. Calibration and Verification of Bonding Parameters of Banana Straw Simulation Model Based on Discrete Element Method. Trans. Chin. Soc. Agric. Mach. 2023, 54, 121–130. [Google Scholar]
  25. Xia, J.F.; Zhang, P.; Yuan, H.W.; Du, J.; Zheng, K.; Li, Y.F. Calibration and Verification of Flexible Rice Straw Model by Discrete Element Method. Trans. Chin. Soc. Agric. Mach. 2024, 55, 174–184. [Google Scholar]
  26. Du, Z.; Li, D.H.; Li, X.P.; Jin, X.; Wu, Y.B.; Yu, F. Calibration and Experiment of Discrete Element Model Parameters for Tea Stem. Trans. Chin. Soc. Agric. Mach. 2025, 56, 311–320. [Google Scholar]
  27. Xu, Z.W.; Wang, S.L.; Yi, Z.Y.; Pan, J.; Lü, X.L. Parameter Calibration of Chili Seed Discrete Element Based on JKR Model. J. Chin. Agric. Mech. 2023, 44, 85–95. [Google Scholar] [CrossRef]
  28. Ma, Y.H. Agricultural Material Science; Chemical Industry Press: Beijing, China, 2015. (In Chinese) [Google Scholar]
  29. Wang, L.J.; Liu, T.H.; Feng, X.; Gao, Y.P.; Wang, B.; Zhang, S. Research Progress of the Restitution Coefficients of Collision of Particles in Agricultural and Food Fields. Trans. Chin. Soc. Agric. Eng. 2021, 37, 313–322. [Google Scholar]
  30. Liu, Y.; Zong, W.Y.; Ma, L.N.; Huang, X.M.; Li, M.; Tang, C. Determination of Three-Dimensional Collision Restitution Coefficient of Oil Sunflower Grain by High-Speed Photography. Trans. Chin. Soc. Agric. Eng. 2020, 36, 44–53. (In Chinese) [Google Scholar]
Figure 1. Compression test.
Applsci 15 11163 g001
Figure 2. Repose Angle Measurement.
Applsci 15 11163 g002
Figure 3. MATLAB-Based Determination of the Repose Angle, where Fitting result shows that the red solid line represents the edge detection line, the green solid line represents the fitted curve, and the blue dashed line represents the final fitted line of the repose angle.
Applsci 15 11163 g003
Figure 4. Measurement of the Coefficient of Restitution.
Applsci 15 11163 g004
Figure 5. Measurement of Static and Dynamic Friction Coefficients.
Applsci 15 11163 g005
Figure 6. Calibration of the Discrete Element Simulation, where Fitting result shows that the red solid line represents the edge detection line, the green solid line represents the fitted curve, and the blue dashed line represents the final fitted line of the repose angle.
Applsci 15 11163 g006
Figure 7. Effects of Factor Interactions on the Repose Angle: (a). Interaction between seed–seed static friction coefficient A and seed–straw static friction coefficient B. (b). Interaction between seed–seed static friction coefficient A and seed–straw dynamic friction coefficient C. (c). Interaction between seed–straw static friction coefficient B and seed–straw dynamic friction coefficient C.
Applsci 15 11163 g007
Figure 8. Comparison of physical and simulation validation experiments.
Applsci 15 11163 g008
Table 1. Basic Physical Properties of L. chinensis Seeds.
ParameterMean ± SD
triaxial dimensions (length × width × thickness)/(mm × mm × mm)7.17 ± 0.49 × 1.10 ± 0.08 × 0.80 ± 0.05
thousand-seed weight/g2.16 ± 0.12
density/(kg/m3)502 ± 29
moisture content/%6.91 ± 0.04
Table 2. Basic Physical Properties of L. chinensis Straw.
ParameterMean ± SD
triaxial dimensions A (length × width × thickness)/(mm × mm × mm)10.95 ± 1.48 × 1.73 ± 0.09 × 1.68 ± 0.08
triaxial dimensions B (length × width × thickness)/(mm × mm × mm)16.10 ± 1.19 × 1.56 ± 0.09 × 1.51 ± 0.07
triaxial dimensions C (length × width × thickness)/(mm × mm × mm)21.34 ± 1.28 × 1.47 ± 0.07 × 1.42 ± 0.07
density/(kg/m3470 ± 27
moisture content/%6.24 ± 0.03
Table 3. Coefficients of Restitution Between L. chinensis Seeds and Straw.
Collision TypeMean ± SD
Seed–seed0.349 ± 0.084
Seed–straw0.378 ± 0.091
Straw–straw0.241 ± 0.095
Table 4. Static and Dynamic Friction Coefficients Between L. chinensis Seeds and Straw.
Collision TypeStatic Friction Coefficient (Mean ± SD)Dynamic Friction Coefficient (Mean ± SD)
Seed–seed0.72 ± 0.0170.46 ± 0.013
Seed–straw0.30 ± 0.0070.10 ± 0.002
Straw–straw0.26 ± 0.0070.09 ± 0.002
Table 5. Simulation Parameters and Mass Proportions of L. chinensis Straw at Different Length Ranges.
Length Range (mm)Simulated Straw Length (mm)Simulated Straw Diameter (mm)Mass Proportion (%)
5–1310.950.86543
13–1816.10.78036
18–3021.340.73521
Table 6. Test Factors and Levels in the Plackett–Burman Screening Design.
SymbolicParameter DescriptionLow Level (−1)High Level (+1)
ASeed–seed coefficient of restitution0.2110.399
BSeed–seed static friction coefficient0.6450.826
CSeed–seed dynamic friction coefficient0.3260.511
DSeed–straw coefficient of restitution0.2250.392
ESeed–straw static friction coefficient0.2060.396
FSeed–straw dynamic friction coefficient0.0530.183
GStraw–straw coefficient of restitution0.2020.419
HStraw–straw static friction coefficient0.1980.366
JStraw–straw dynamic friction coefficient0.0540.183
Table 7. Steepest Ascent Experimental Design.
RunSeed–Seed Static Friction CoefficientSeed–Straw Static Friction CoefficientSeed–Straw Dynamic Friction Coefficient
10.6450.2160.053
20.6750.2460.073
30.7050.2760.093
40.7350.3060.113
50.7650.3360.133
60.7950.3660.153
70.8250.3960.173
Table 8. Box–Behnken Experimental Design.
Seed–Seed Static Friction CoefficientSeed–Straw Static Friction CoefficientSeed–Straw Dynamic Friction Coefficient
0.6750.2460.073
0.7050.2760.093
0.7350.3060.113
Table 9. Experimental Design and Results of the Plackett–Burman Screening Test.
RunNumerical Value
Parameters
Numerical Value
ABCDEFGHIJ
10.3990.8260.3260.3920.3960.1830.2020.1980.0540.39952.1254
20.3990.8260.3260.2250.2060.1830.2020.3660.1830.39945.1258
30.3990.8260.5110.2250.2060.0530.4190.1980.1830.39935.6542
40.3990.6450.3260.2250.3960.0530.4190.3660.0540.39933.2548
50.2110.8260.5110.3920.2060.0530.2020.3660.0540.21137.7243
60.2110.6450.3260.3920.2060.1830.4190.1980.1830.21138.0557
70.2110.6450.5110.2250.3960.1830.2020.3660.1830.21148.6535
80.3990.6450.5110.3920.3960.0530.2020.1980.1830.39932.9551
90.2110.8260.5110.2250.3960.1830.4190.1980.0540.21154.5938
100.2110.6450.3260.2250.2060.0530.2020.1980.0540.21128.9551
110.3990.6450.5110.3920.2060.1830.4190.3660.0540.39938.6535
120.2110.8260.3260.3920.3960.0530.4190.3660.1830.21142.6428
Table 10. Significance Analysis of the Plackett–Burman Screening Test Results.
Source of VarianceSum of SquaresMean SquareFreedomF-Valuep-ValueSignificance
Model706.45978.4960.360.0164*
A-A13.77113.7710.590.0829
B-B186.751186.75143.60.0069**
C-C5.4315.434.180.1776
D-D1.3911.391.070.4102
E-E133.711133.71102.820.0096**
F-F363.241363.24279.310.0036**
G-G0.600510.60050.46180.5669
H-H1.1511.150.88460.4462
J-J0.410610.41060.31580.6307
Residual2.621.3
Cor Total709.0511
Note: * and ** denote significance at the p < 0.05 and p < 0.01 levels, respectively.
Table 11. Design and Results of the Steepest Ascent Experiment.
RunSeed–Seed Static Friction CoefficientSeed–Straw Static Friction CoefficientSeed–Straw Dynamic Friction CoefficientAngle of Repose (°)Relative Error (%)
10.6450.2160.05330.5625.72%
20.6750.2460.07335.8612.83%
30.7050.2760.09339.154.84%
40.7350.3060.11345.5110.62%
50.7650.3360.13348.8218.67%
60.7950.3660.15352.3127.15%
70.8250.3960.17355.2334.25%
Table 12. Experimental Design and Results of the Box–Behnken Test.
RunSeed–Seed Static Friction Coefficient (L)Seed–Straw Static Friction Coefficient (M)Seed–Straw Dynamic Friction Coefficient (N)Angle of Repose
10.7050.2760.09341.44
20.6750.3060.09341.98
30.6750.2760.11339.76
40.7050.3060.07341.59
50.7050.3060.11345.55
60.7050.2460.11342.63
70.7050.2760.09342.01
80.6750.2760.07334.53
90.7350.2760.11344.94
100.7350.2460.09344.86
110.7350.3060.09346.43
120.7350.2760.07340.48
130.7050.2460.07335.46
140.7050.2760.09341.56
150.7050.2760.09342.13
160.6750.2460.09336.13
170.7050.2760.09341.02
Table 13. Significance Analysis of Box–Behnken Experimental Results.
SourceSum of SquaresDfMean SquareF-Valuep-ValueSignificance
Model181.75920.1973.47<0.0001**
L73.87173.87268.75<0.0001**
M33.91133.91123.36<0.0001**
N54.18154.18197.12<0.0001**
LM4.5814.5816.660.0047**
LN0.148210.14820.53930.4866
MN2.5812.589.370.0183*
L20.461310.46131.680.2362
M24.6314.6316.860.0045**
N27.9417.9428.90.001**
Residual1.9270.2749
Lack of Fit1.1230.37221.840.2796
Pure Error0.807540.2019
Cor Total183.6816
Note: * and ** denote significance at the p < 0.05 and p < 0.01 levels, respectively.
Disclaimer/Publisher’s Note: The statements, opinions and data contained in all publications are solely those of the individual author(s) and contributor(s) and not of MDPI and/or the editor(s). MDPI and/or the editor(s) disclaim responsibility for any injury to people or property resulting from any ideas, methods, instructions or products referred to in the content.