1. Introduction
Wood-based products such as particle board or fiber board are widely used in structural members in buildings and furniture [
1]. These boards are made of plant fiber components bound with adhesive agents that are solidified by hot pressing. After use, most of these wood materials are currently processed through industrial waste treatments such as mechanical crushing and incineration [
2]. The recycling technologies involved in these processes could benefit from improvement, and it would be preferable for such technologies to maintain the original flexibility of the wood fibers and minimize environmental load. Typically wood-based products are pretreated by hydrolyzing the adhesive agents under steaming at 100 to 180 °C [
3], with the aim of defibrating wood materials by isolating the bonds between components. There have been few reports on the pretreatment of wood-based materials at temperatures lower than 100 °C. Solutions containing thermoplastic resins as modifiers have been developed for the chemical modification of wood-based materials [
4]. Furthermore, there is another method involving the addition of modifiers to defibrated matter, or specifically fibers in wood-based materials, to perform esterification or etherification. Few advancements have been made in developing effective methods of modifying wood-based materials without adding chemical additives.
One possible alternative to chemical methods is ultrasound. The physical effects of ultrasound may prove useful for modifying wood-based materials with a reduced environmental load. When they collapse, cavitation bubbles produced by ultrasound can generate spherical pressure waves (shock waves) with a pressure of 200 atm in the vicinity of bubbles [
5,
6]. Cavitation bubbles can also provide a liquid jet with a pressure of more than 1000 atm near solid walls. It is expected that the impingement of shock waves and liquid jets on wood-based materials can contribute to the separation and removal of adhesive layers [
7,
8,
9,
10,
11,
12].
Karnjanakom et al. [
13] have demonstrated that cedar samples pretreated by chemical-free irradiation with ultrasound in water yielded a greater amount of bio-oil than did untreated cedar.
Karimi et al. [
14,
15] studied the shear stresses of shock waves and microjets from cavitation bubbles as a function of the distance between the cavitation bubbles and starch granules or lignocellulosic particles. They determined that the stresses in heterogeneous systems produce cavitation effects several hundred times greater than those in homogeneous systems.
Ultrasound-assisted pretreatment of biomass would provide the benefit of lower processing temperatures, even room temperature [
16].
These physical effects of ultrasound are also applicable to the separation and removal of wood extractives from cells in components of wood-based materials [
17,
18,
19]. The separation and removal of adhesive layers or wood extractives in this way can weaken the bonds between the different components. This promotes water absorption and expansion, which softens the material and reduces its mechanical strength. Softened materials are then more easily processed for recycling.
Amemiya and Siriban [
18] showed that the amount of water absorbed by veneer during sonication is larger than that during either of hot- or cold-water dipping. However, they did not perform compression tests for their samples. According to Shiroma et al. [
20], wood-particle composites of gypsum plaster processed by hot-water dipping showed lower compressive strength than those processed by cold-water dipping at room temperature. However, they did not compare these methods with sonication. There is also a commonly used patented method of dividing wood-based boards into individual components by steaming [
3]. However, the expansion ratio for wood materials using this method was not examined.
Cherpozat et al. [
21] investigated the effect of water temperature on bio-oil yield using sonication. They separated the effect of sonication from that of water temperature and demonstrated that sonication alone may be more effective than hot water for extraction.
The present study investigates whether sonication is effective for softening wood-based materials by comparing its effects with those of hot-water dipping or silent immersion. The expansion ratios for wood-based materials were measured and compression tests were performed to determine the maximum compressive stress. Based on the results, the suitability of sonication for the modification of wood materials was evaluated.
2. Materials and Methods
2.1. Sample Preparation
Samples were prepared using four different treatment methods: sonication, hot-water dipping, silent immersion at room temperature, and oven drying. This section describes the methods used to prepare these samples and how their material properties were compared.
Figure 1 shows a schematic of ultrasonic irradiation using a horn-type transducer. Samples cut from particle board (Japan Novopan Industrial Co., Ltd., Osaka, Japan) intended for use in furniture and woodworking applications were attached to the inner bottom of a beaker using double-sided tape. The original density of the particle board ranged from 0.40 to 0.90 g/cm
3. Its flexural strength exceeded 13.0 N/mm
2, and its moisture content at equilibrium was 5–13%. Internally, the panel was composed of layers, and the number of layers varied from sample to sample. Although the wood species was not reported by the supplier, Japanese cedar (
Cryptomeria japonica) is likely a primary species comprising these panels, because house demolition and leftover construction materials are commonly used for their production.
The beaker has an outer diameter of 55 mm, an inner diameter of 51 mm, and a height of 71 mm. The average dimensions and mass of the samples after oven drying and before immersion were 19.853 mm (width) × 19.827 mm (depth) × 14.655 mm (thickness) and 3.659 g, respectively. The particle board used in this experiment was composed of stacked components, and the sample thickness was defined as the thickness in the stacking direction, along which the sample most readily expands.
Pure water was air-saturated by bubbling at 22–23 °C. A sample was placed inside a beaker and 100 mL of the air-saturated pure water was added to the beaker. Silent immersion of the sample was performed from t = 0 to 5 min, where t denotes the elapsed immersion time. A horn-type transducer with a diameter of 22 mm and a length of 70 mm was used for ultrasonic irradiation in the present experiment. The horn tip was set 5.5 mm above the sample in the beaker. A thermocouple was used to measure the liquid temperature.
2.2. Sonication Treatment
A continuous sinusoidal signal from a signal generator (NF WF1965; NF Corporation, Yokohama, Japan) was amplified with an amplifier (ENI 2100L; Electronics & Innovation, Ltd., Rochester, NY, USA) and used to drive the transducer, which irradiated the water in the beaker with ultrasound. The electric power input to the transducer was monitored with a power meter (TOWA TAW-60A; Towa Electronic Co., Ltd., Tokyo, Japan). The influence of the increase in the temperature of the water on the driving efficiency of the transducer was taken into account to permit changes in the driving frequency and limit the sonication time. The driving frequency was 20 kHz from
t = 5 to 15 min, and 19.96 kHz from
t = 17 to 27 min and from
t = 29 to 39 min. The transducer was paused from
t = 15 to 17 min and from
t = 27 to 29 min for safety. The total sonication time for
t = 0 to 39 min was thus 30 min. This sonication time was selected to avoid temperature-induced reductions in sonoluminescence, which have been shown to occur above approximately 60 °C [
22]. The water temperature from the thermocouple and the input electric power to the transducer from the power meter were read with a multimeter (TEXIO DL-1060; TEXIO Technology Corporation, Yokohama, Japan), and data from these measurements were acquired at a sampling rate of 1 sample/4s by a computer (Dell GX260; Dell, Round Rock, TX, USA). The water temperature was 22.1 °C at the start of sonication (
t = 5 min) and 62.0 °C at the end (
t = 39 min). The average input electric power was 30.7 W, and the average calorimetric power based on the increase in temperature by sonication was 23.4 W [
23].
After immersion experiments, samples were sealed in plastic bags, which were placed in a closed container and stored in a refrigerator.
The sonication duration of 30 min was selected based on the known temperature effects of sonication. According to the literature [
22], the intensity of sonoluminescence decreases to one-third of its initial value when the liquid temperature is increased from 20 to 58 °C by sonication. In the present experimental setup, after sonication for 30 min, the liquid temperature rose to approximately 60 °C, which is close to the upper temperature stated above. Further sonication would lead to higher liquid temperatures and thereby reduce the cavitation activity needed for the desired physical effects. Thus, a sonication time of 30 min ensures the effective performance of sonication for our purposes.
A sonication frequency of approximately 20 kHz was chosen here to focus on the physical effects of lower-frequency sonication on biomass. According to the literature [
16], many studies have considered 20 kHz sonication of biomass, which is similar to the sample material used in the present experiment. The effects of sonication at less than 50 kHz are mainly attributed to physical phenomena, such as shock waves, increases in mass transfer, and turbulence [
16]. Then, in the present experiment, a frequency of around 20 kHz was chosen.
2.3. Hot-Water Dipping
The procedure for hot-water dipping was as follows. The vessel of an incubator (Fine FR-100; Tokyo Garasu Kikai Co., Ltd., Tokyo, Japan) was filled with tap water. A sample was placed inside a sealed glass bottle with an inner plug, with an aperture size of 42 mm, an outer diameter of 55 mm, a height of 95 mm, and a volume of 140 mL. The bottle was filled with water, removing the air layer. The bottle was submerged in the water inside the vessel. Silent immersion of a sample was performed from
t = 0 to 5 min. Hot-water dipping of the sample in the submerged bottle was performed under the control of the incubator from
t = 5 to 39 min, with pauses from
t = 15 to 17 min and
t = 27 to 29 min, when the operation of the incubator was stopped for safety. The total hot-water dipping time was thus 30 min, as for sonication. During hot-water dipping, the water temperature was controlled with the incubator to obtain an increase in temperature similar to that during sonication. The temperature in the incubator vessel was monitored with a thermocouple. The water temperature was 23.0 °C at the start of hot-water dipping (
t = 5 min) and 62.8 °C at the end (
t = 39 min).
Table 1 shows the immersion timeline for the three sample treatment conditions compared in this study: sonication, hot-water dipping, and silent immersion at room temperature.
2.4. Oven Drying
Samples treated by oven drying were left to stand in a constant-temperature oven (Yamato DKM400; Yamato Scientific Co., Ltd., Tokyo, Japan) set at 105 °C for 24 h. Compression testing was performed to compare the mechanical strength of samples treated by sonication, hot-water dipping, silent immersion at room temperature, and oven drying.
2.5. Compression Testing
An automated universal testing machine (Shimadzu AG-X plus 20 kN; Shimadzu Corporation, Kyoto, Japan) was used for the compression tests. Samples were left in a room-temperature environment for one hour before compression testing. Compression tests were performed with the crosshead moving at a compression speed of 2 mm/min.
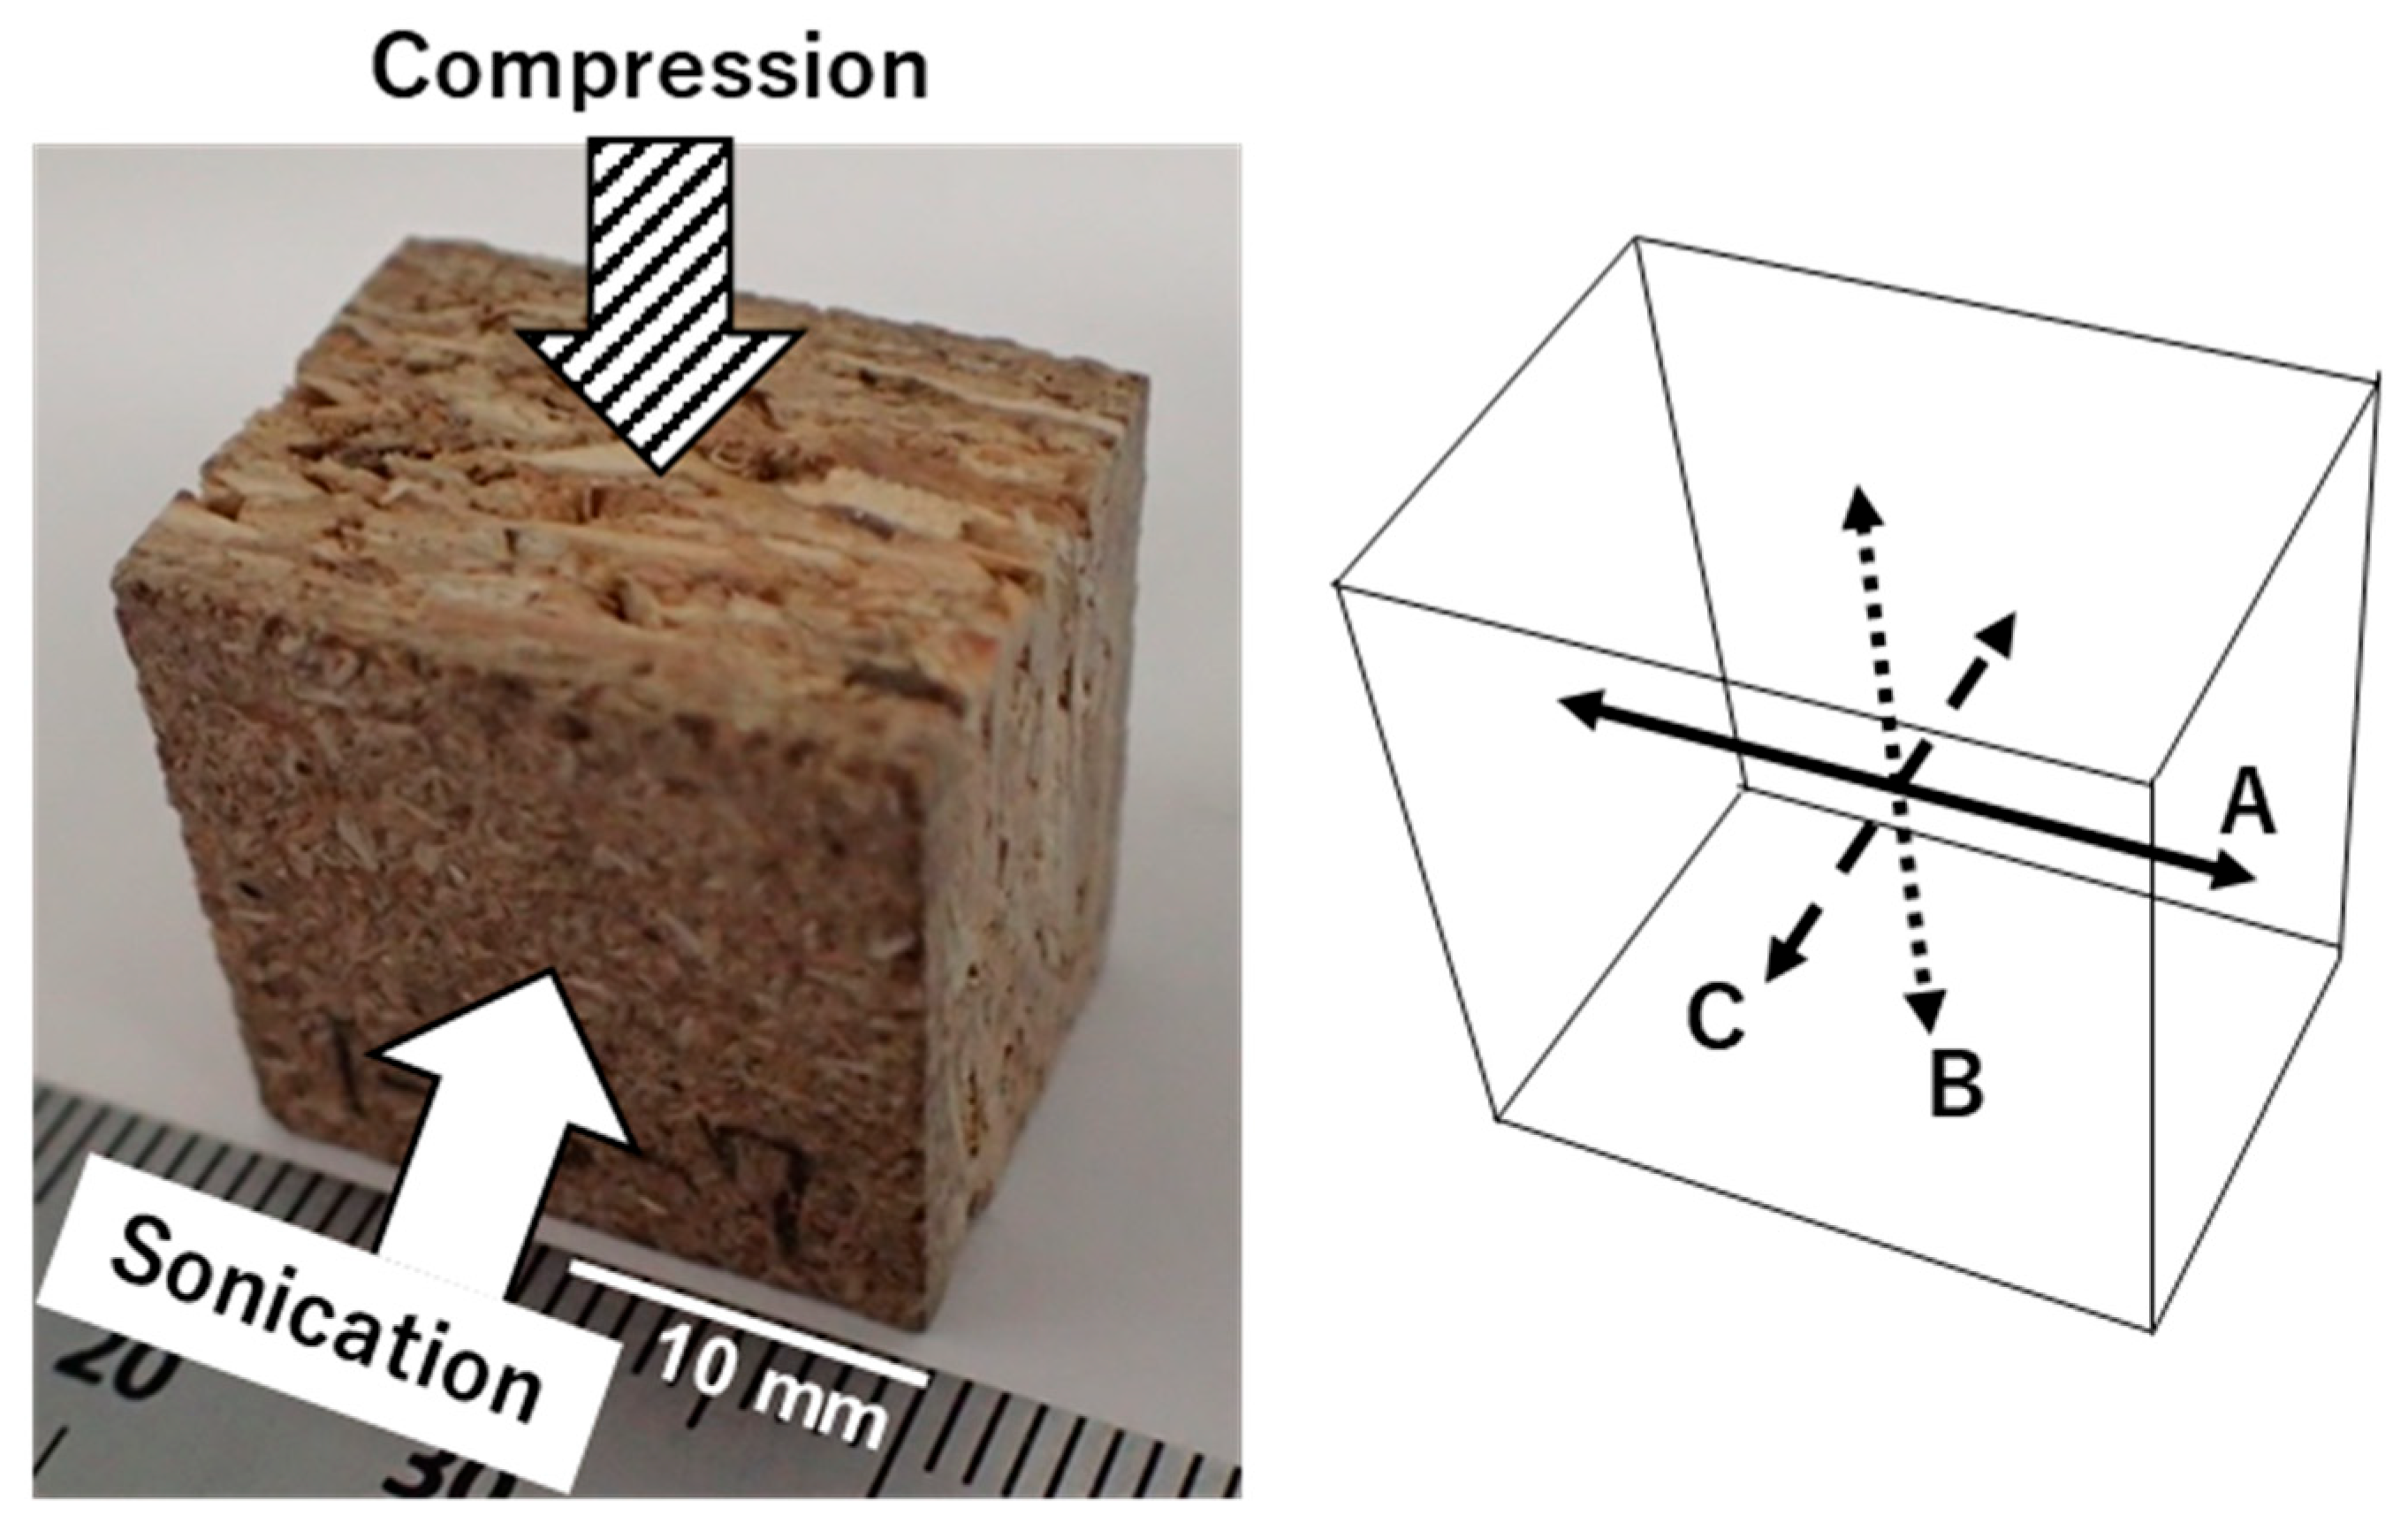
Figure 2 shows a photograph of a sample. The white and striped arrows in the figure indicate the directions of sonication and compression loading, respectively. These operations were conducted independently of each other. The sonication direction is along the stacking direction of the sample, and the compression direction is perpendicular to the direction of sonication.
2.6. IR Analysis
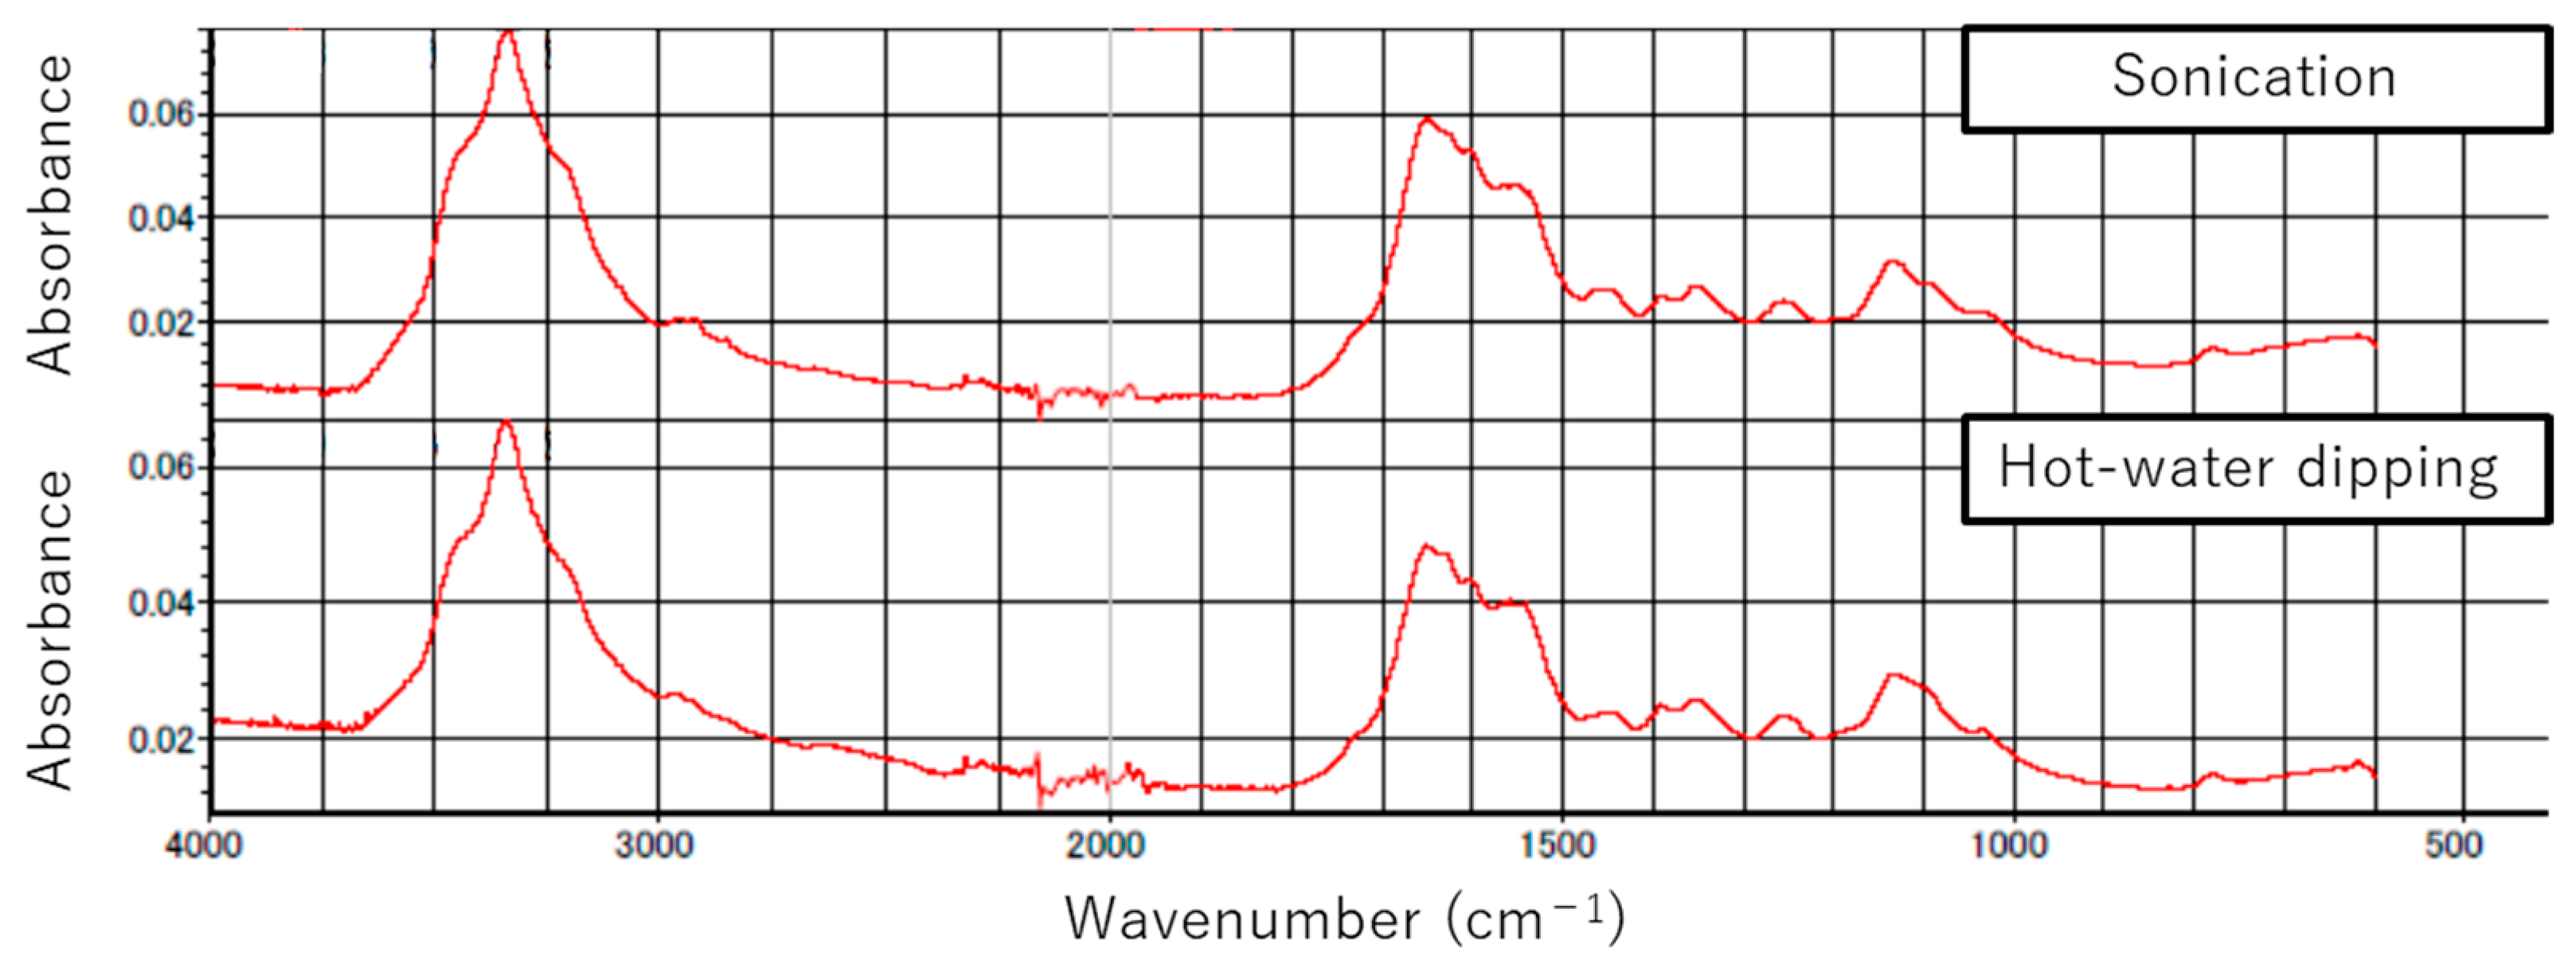
Residual liquid in samples that had been immersed for sonication or hot-water dipping was collected after that operation and analyzed by infrared spectroscopy (IR) with a spectrophotometer (Thermo Fisher Scientific Nicolet iS20, Waltham, MA, USA). The spectrophotometer operated in attenuated total reflection (ATR) measurement mode, had a resolution of 4 cm−1, and 64 accumulated measurements were performed. The residual liquids were collected from the beaker or bottle used during sonication or hot-water dipping and transferred to a glass plate. The liquid on the plate was then dried in a desiccator overnight to obtain residual dried material, which was analyzed using the IR spectrophotometer.
2.7. Calculation of Expansion and Mass-Loss Ratios
2.7.1. Calculation of Expansion Ratio
The sample expansion ratio
r1 for the samples treated by sonication, hot-water dipping, and silent immersion at room temperature was obtained as
where
tb and
ta1 are the sample thicknesses before and after treatment, respectively. Note that
tb represents the thickness of samples that were prepared by oven drying before immersion.
The expansion ratio
r2 for each of the samples after oven drying following sonication or hot-water dipping was also calculated as
where
ta2 is the thickness of samples after oven drying following sonication or hot-water dipping.
2.7.2. Calculation of Mass-Loss Ratio
The mass-loss ratio
r3 for each of the samples after oven drying following sonication or hot-water dipping was calculated as
where
ma2 is the sample mass after oven drying following sonication or hot-water dipping. Note that
mb represents the mass of samples that were prepared by oven drying before immersion.
2.8. Statistical Treatment
For each type of treatment, five replicates were prepared. Results are shown as averages over these replicates with error bars showing the average relative error. A t-test was performed using a commercial software (Excel Microsoft 365) to compare the results for the different treatment groups. Treatments were considered to yield significantly different results if p < 0.05.
3. Results
Table 2 gives the sample dimensions and moisture content measured before compression testing. It was found that both the dimensions and moisture content were highest for sonication (f), followed by hot-water dipping (e) and silent immersion at room temperature (c). There are some negative moisture content values. This is likely the result of damage to the samples during oven drying, hot-water dipping, and sonication.
Figure 3 shows the expansion ratio
r1 for the samples treated by sonication, hot-water dipping, and silent immersion at room temperature. The plotted values are averages over five measurements with error bars showing the average relative error.
The difference between the expansion ratios after sonication and hot-water dipping was statistically significant (p = 1.4 × 10⁻⁴), as were those between sonication and silent immersion (p = 4.8 × 10⁻⁶) and between hot-water dipping and silent immersion (p = 3.3 × 10⁻³), respectively. If a statistical significance level of 5% is chosen, each of the p-values is less than 5% and should be sufficient.
The expansion ratio for samples processed by sonication was the highest among the considered treatments. Sonicated samples exhibited an 8.81% higher expansion ratio than samples treated by hot-water dipping.
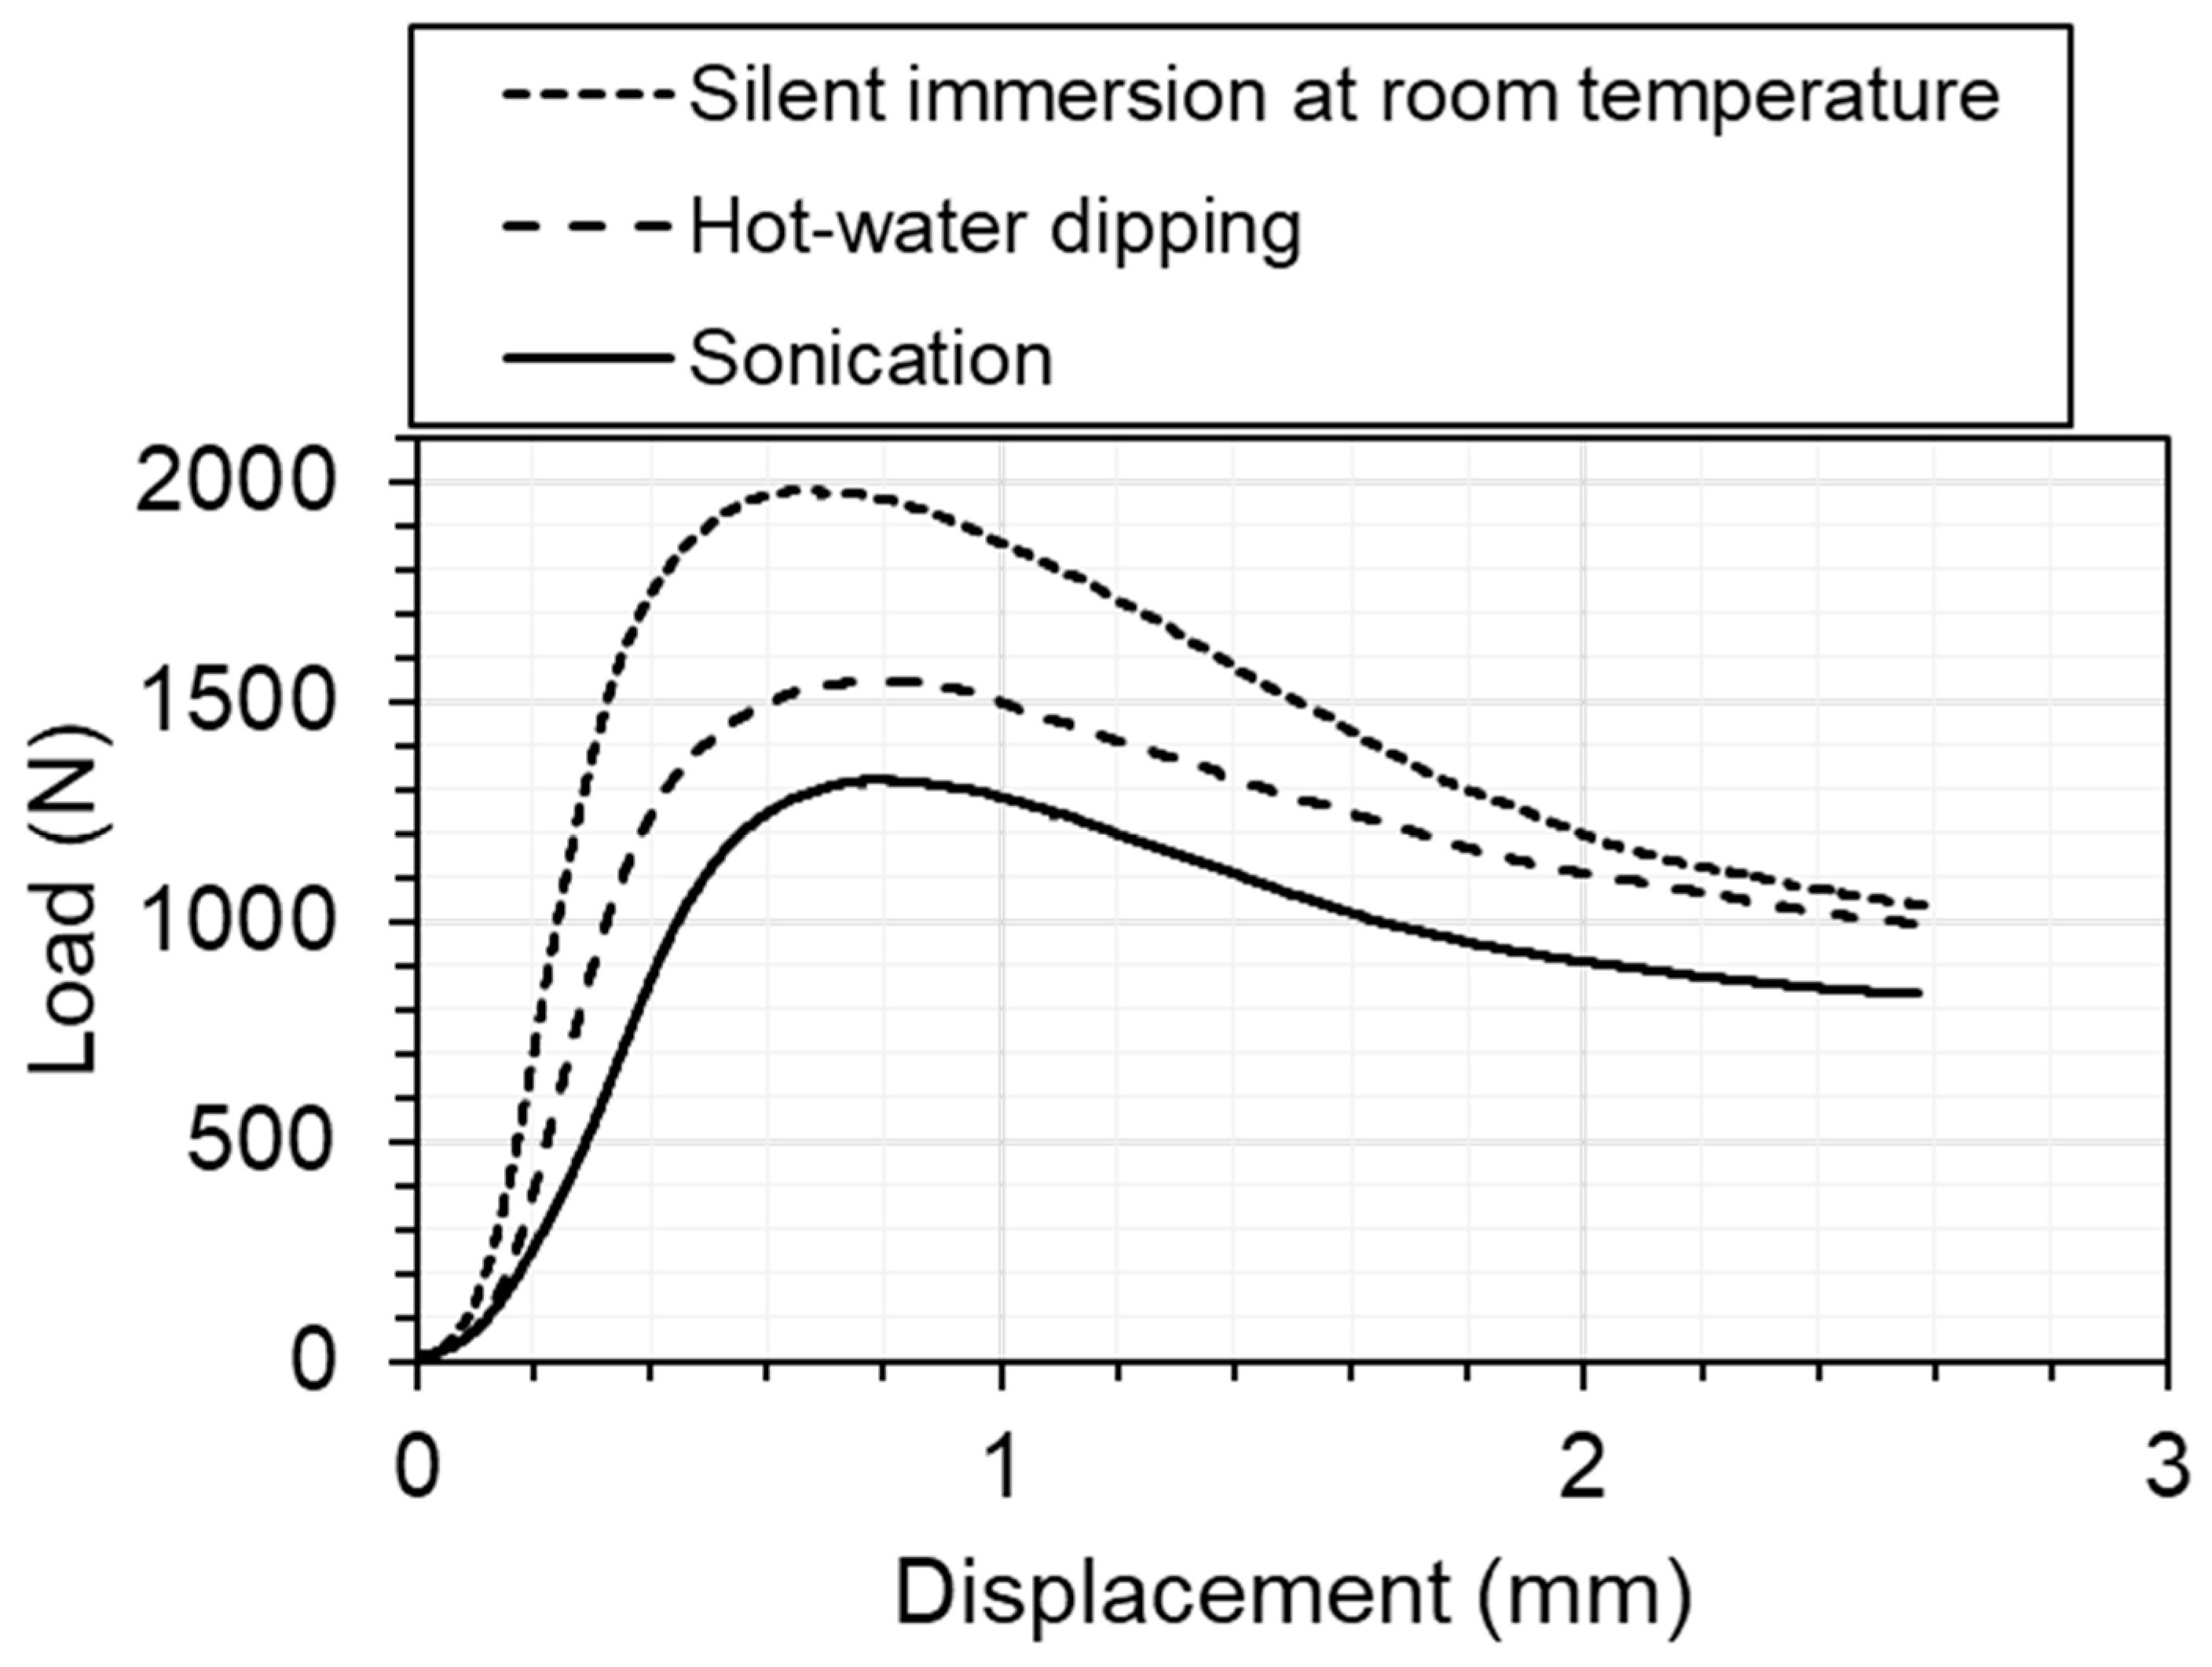
Figure 4 shows examples of measured load–displacement curves for sonication, hot-water dipping, and silent immersion at room temperature. The three curves exhibit common tendencies: the load initially increased with displacement and later gradually decreased after reaching the maximum compressive stress. The load within the measurement range was lowest for sonication and highest for silent immersion.
Figure 5 shows the maximum compressive stress for samples treated with sonication, hot-water dipping, and silent immersion at room temperature. The maximum compressive stress was lowest for sonication and highest for silent immersion. Sonicated samples exhibited a maximum compressive stress 0.890 MPa, lower than that of samples treated by hot-water dipping.
The difference between the maximum compressive stress for samples treated by sonication and hot-water dipping was found to be statistically significant (p = 1.9 × 10⁻³), as were those between sonication and silent immersion (p = 1.9 × 10⁻⁴) and between hot-water dipping and silent immersion (p = 3.9 × 10⁻³).
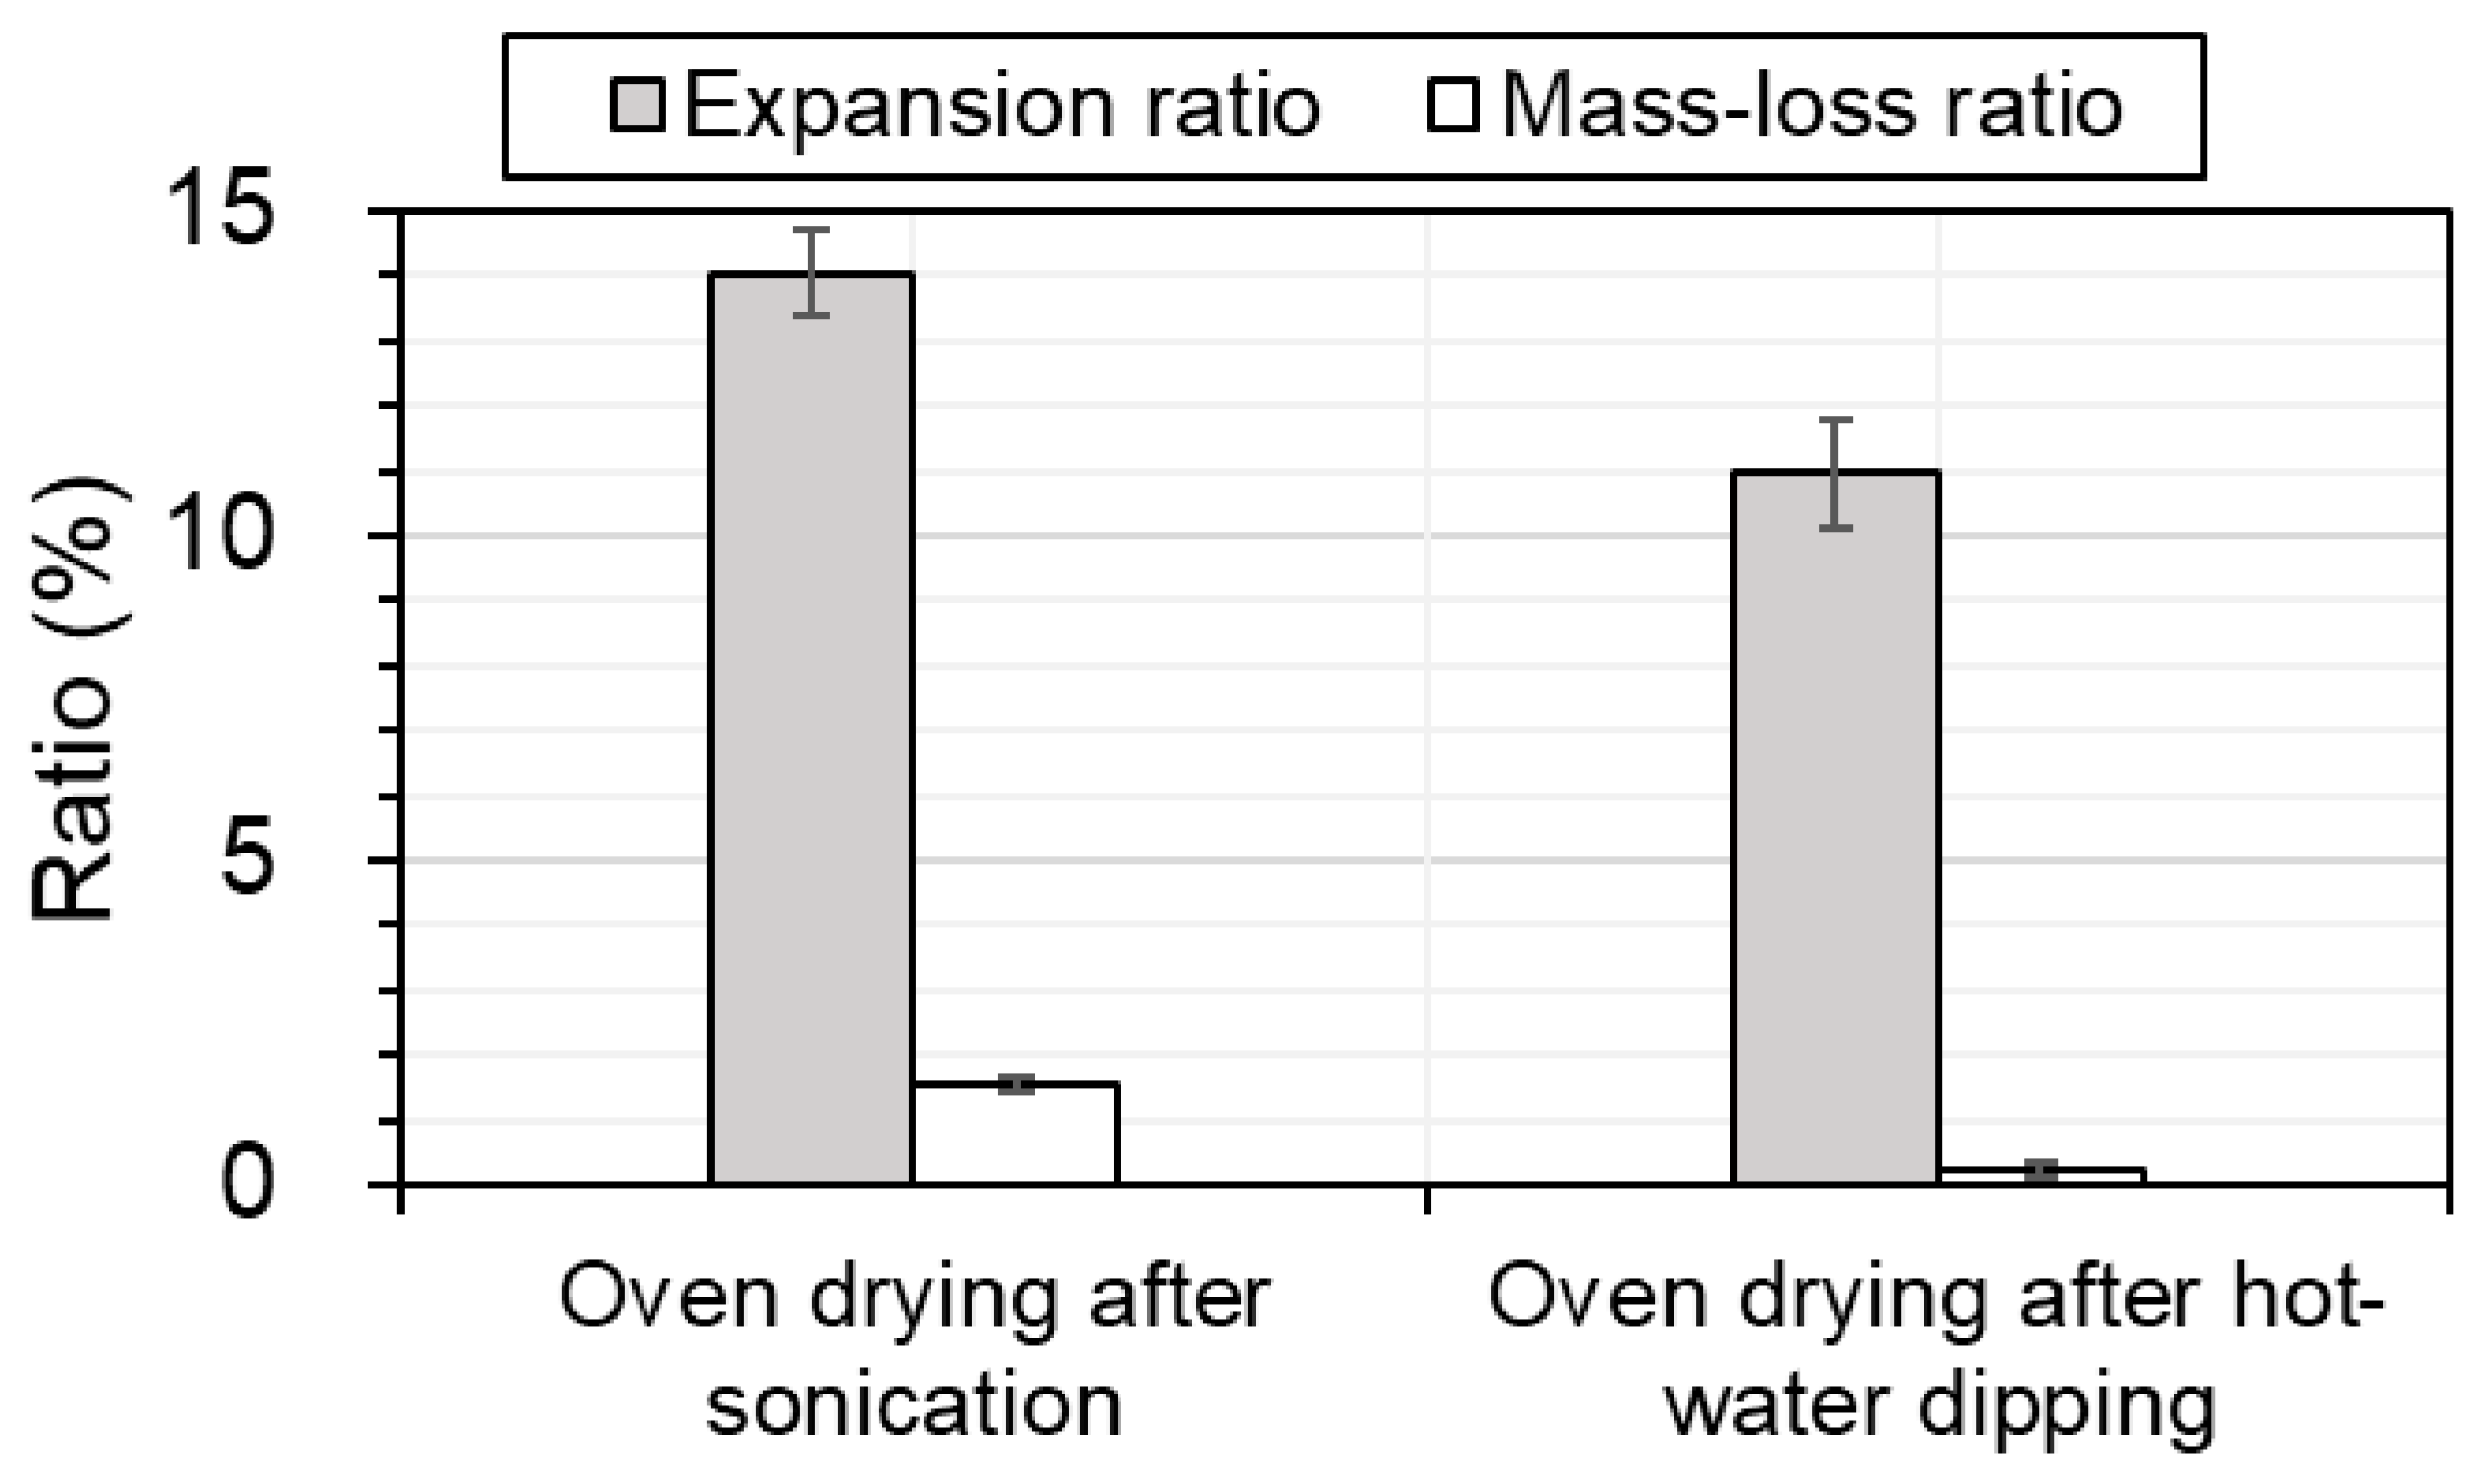
Figure 6 shows the expansion ratio
r2 and the mass-loss ratio
r3 for samples after oven drying following sonication or hot-water dipping. The expansion ratio
r2 and mass-loss ratio
r3 after oven drying following sonication were, respectively, 1.3 and 6.3 times higher than those following hot-water dipping.
The difference between the expansion ratio r2 and mass-loss ratio r3 after oven drying following sonication and hot-water dipping were found to be statistically significant (p = 2.9 × 10⁻⁴ and 2.1 × 10⁻⁴), respectively.
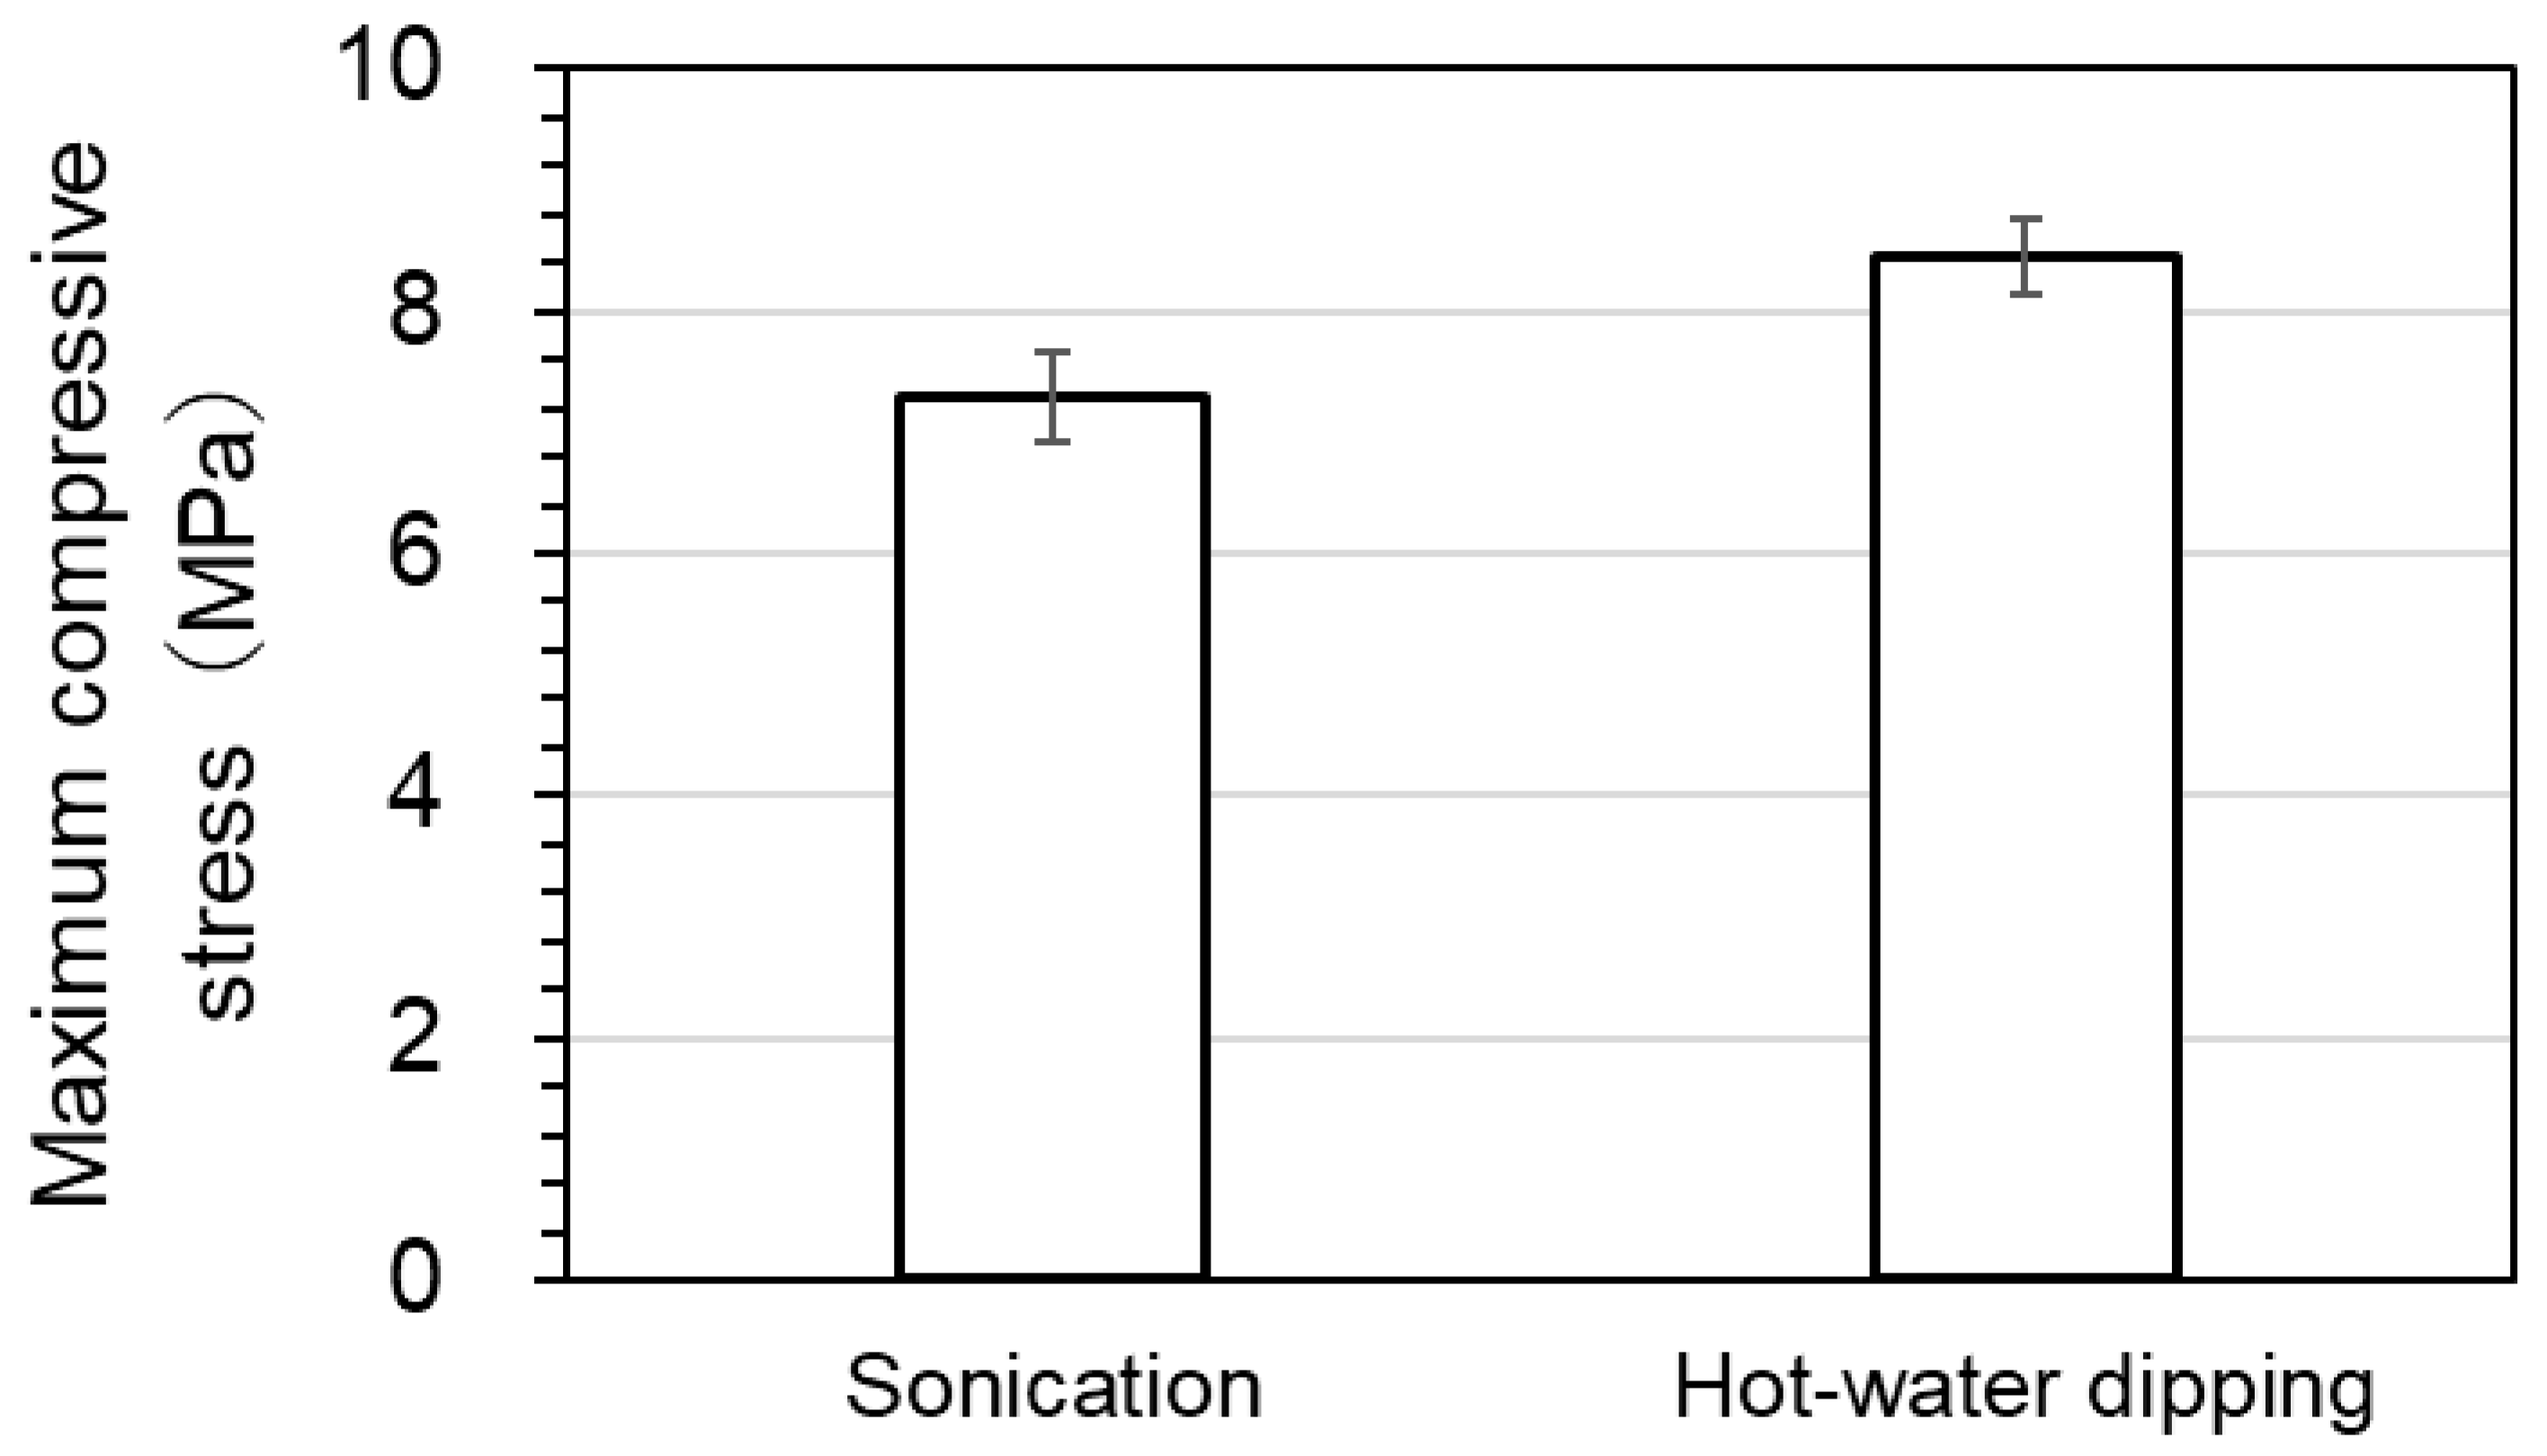
Figure 7 shows the maximum compressive stress after oven drying following sonication or hot-water dipping. The maximum compressive stress after oven drying following sonication was 14% lower than that following hot-water dipping.
The difference between the maximum compressive stress after oven drying following sonication and hot-water dipping were found to be statistically significant (p = 5.6 × 10⁻³).
Figure 8 shows the maximum compressive stress plotted against the sample expansion ratio. The experimental conditions (a)–(f) in
Table 2 correspond with those in
Figure 8. In the figure, the data points labeled (a)–(f), respectively, show the results for samples with the following preparations: oven drying before immersion, oven drying following hot-water dipping, silent immersion in water at room temperature, oven drying following sonication, hot-water dipping, and sonication. With the exception of (a), all the results plotted in this figure correspond to those in
Figure 5 and
Figure 7. As shown in this figure, the maximum compressive stress decreased with increasing expansion ratio.
Figure 9 shows the measured IR absorption spectra of water from samples treated with sonication and hot-water dipping. The spectra for the two samples are similar to each other.
4. Discussion
Table 2 gives the sample dimensions and moisture content measured before compression testing. The dimensions and moisture content were largest for the samples treated by sonication (f), followed by those treated by hot-water dipping (e) and silent immersion in water at room temperature (c). This same relative order is repeated in
Figure 8, with sonication exhibiting the highest expansion ratio and lowest maximum compression stress, followed in turn by hot-water dipping and silent immersion.
According to the Japanese Industrial Standards [
24], wood-based particle boards should have an expansion ratio of less than 12%. Modification methods that yield expansion ratios of more than 12% are thus a target of the present study and will be considered useful for recycling wood-based materials. As shown in
Figure 3, the expansion ratios for each of the considered methods met this criterion (12%), and the expansion ratio was highest for sonication and lowest for silent immersion at room temperature. Sonication is thus the most suitable of these treatments for the modification of wood-based materials. The expansion ratio under even silent immersion at room temperature exceeded 12%. This likely comes from the influence of oven drying on samples before immersion, as oven drying typically lowers the moisture content of samples more than natural air drying. This promotes the penetration of water into wood samples [
25], thereby producing greater sample expansion.
The results in
Figure 6 indicate that sonication was more effective for sample modification than hot-water dipping.
According to the literature [
26,
27], it was observed that ultrasonic waves interact with the cellulose fraction to weaken hydrogen intermolecular bonding. This also contributes to an increased hydrophilicity of the wood samples sonicated in the present experiment. In this situation, the greater hydrophilicity leads to a greater expansion of the samples and an increase in softness, relative to those samples treated by hot-water dipping. This increase in softness due to sonication appears to have assisted the removal of agents from the samples because these samples exhibited a greater mass loss after sonication than after other treatments, which was responsible for the reduced maximum compression stress.
These results in
Figure 7 are consistent with those shown in
Figure 6. Samples were effectively modified by sonication, expanded more, and were softer than those modified using hot-water dipping. The lower compressive stress for sonicated samples is a result of the effective modification.
Sonicated samples treated afterward by oven drying exhibited a reduced expansion ratio and an increased maximum compressive stress, relative to sonicated samples without oven drying, as demonstrated in
Figure 8f,d. As shown in
Figure 8e,b, a similar change occurred for samples treated by hot-water dipping with and without subsequent oven drying. The main reason for this change is the release of water contained in the samples. It was inferred that the combination between the organization inside samples was not completely damaged. Even after oven drying, samples treated with sonication (
Figure 8d) still showed similar tendencies to those in
Figure 3 and
Figure 5. Sonication resulted in more cleaved bonds inside the samples than did hot-water dipping.
Absorption peaks around 1650 to 1550 cm
−1 (
Figure 9) suggest the existence of an amide compound [
28]. The peaks around 3400 to 3200 cm
−1 correspond to OH and NH groups, those at 1600 and 1860 cm
−1 to organic acid metal salt, and that at 1150 cm
−1 to sulfate. According to the literature [
28], urea formaldehyde resin has characteristic absorption peaks at 1640 and 1560 cm
−1 for the (C=O) and (N—C—N) bonds in the NH—CO—NH group. This resin also has an absorption peak at 3330 cm
−1, corresponding to (NH). These results suggest that sonication or hot-water dipping could partially remove adhesive agents such as urea formaldehyde resin from samples and transfer the removed agents to the water in which the sample is immersed.
Our study revealed that sonication and hot-water dipping result in samples with different expansion ratios and the maximum compressive stress. As indicated by the IR spectra results, adhesive agents may be discharged from the samples during both treatments. This means that the bonds between components in the samples was weakened. Furthermore, there are merits to sonication in that it both increases the temperature [
29] and produces physical effects, enabling the simultaneous influence of different properties of samples. This is different from hot-water dipping, which only increases the temperature. According to the literature [
29], the temperature rise resulting from sonication is due to the heat conducted from hot spots inside the collapsing bubbles to the bulk liquid, together with friction generated between the liquid and the cavitation bubbles in volumetric oscillation. Sonication can cause physical effects in samples together with self-produced “hot-water dipping.”
It is considered that these simultaneous effects promote the separation and removal of adhesive agents to permit large sample expansion, leading to effective liquid penetration. There is also a possibility that removal of wood-derived extracts from the cell walls of the constituent components can result in such expansion [
19]. The higher degree of softening caused by sonication led to a lower maximum compressive stress than that for hot-water dipping.
Zhu and Yadama [
30] described the roles of sonication and hot-water extraction when isolating micro/nanofibrils from Douglas Fir. They determined that hot-water extraction can partially dissolve hemicellulose to initiate cell wall fractionation. Mild sonication disintegrates fibrils/fibril bundles, whereas high-power sonication diminishes the cellulose structure. They found that hot-water extraction as a pretreatment followed by mild sonication can yield cellulose micro- or nanofibrils. Such optimization will also be necessary in the combination of sonication and hot-water dipping treatment to effectively modify wood-based materials.
García et al. [
31] irradiated lignocellulosic materials with ultrasound to investigate the influence of sonication on the fractionation of the materials. They found that little cellulose in solid samples was decomposed and suggested that this made it suitable for industrial applications. They also showed that high concentrations of hemicellulose and lignin were detected in liquid samples. In the present study, a characterization of lignin would provide insights into the influence of sonication on the modification of samples.
Time saving is also one of the main features of ultrasound-assisted pretreatments of biomass [
16]. It would be beneficial to investigate whether higher-power sonication would reduce the required treatment time for the modification of wood-based materials.
During sonication using a horn-type transducer with high power, the active cavitation region is limited to around the transducer tip [
32]. For the purposes of scaling up the pretreatment of biomass using ultrasound, using multiple transducers would enable the superposition of ultrasonic waves and thereby create a broader region for treatment [
33].
5. Conclusions
Sonication at around 20 kHz was applied to samples of particle boards to compare this method of wood-derived material recycling with hot-water dipping or silent immersion at room temperature. Compression tests were performed on samples treated with each modification method. It was found that sonicated samples exhibited both a higher expansion ratio and a lower maximum compressive stress than samples treated by hot-water dipping or silent immersion. The expansion ratio for samples after sonication could be over 25% and was much higher than the lower bound (12%) considered here to represent sufficient modification, based on the mechanical properties laid out in the standards for particle board. Samples were also oven-dried after sonication or hot-water dipping. Compression tests were performed on samples after each method of preparation. Sonicated samples exhibited an 8.81% higher expansion ratio and 0.890 MPa lower maximum compressive stress compared with samples treated by hot-water dipping in a similar temperature range. It was found that the maximum compressive stress decreased with increasing expansion ratio. IR analysis was performed on the residual water in which the samples were immersed during sonication or hot-water dipping. Absorption peaks indicating components of adhesive agents were observed for water from both types of samples. This indicates that the adhesive agents were partially separated from the samples and released into the water. Sonication could thus produce not only the effects of hot-water dipping based on the high-amplitude motion of cavitation bubbles but also the physical effects of cavitation bubbles. Samples were effectively expanded by sonication. Samples modified by sonication should thus be soft and easily processed further. Sonication is expected to contribute to advanced recycling processes for wood-based materials both at low temperature and in the absence of chemical additives.
In future work, characterization of lignin is expected to provide insights into the influence of sonication on the modification of samples. Additionally, it may be possible to reduce the treatment time with higher-power sonication, and an investigation into the influence of sonication power on the time required for the modification of wood-based materials would be beneficial. To scale up this method of biomass pretreatment using ultrasound, using multiple transducers may create a broader treatment region by the superposition of ultrasonic waves, and this effect could be studied in future work.

