Article

Open-Source Smart Wireless IoT Solar Sensor

by
Victor-Valentin Stoica
1,
Alexandru-Viorel Pălăcean
2,
Dumitru-Cristian Trancă
2,* and
Florin-Alexandru Stancu
2
1
Electronics and Telecommunications Department, Faculty of Transports, National University of Science and Technology POLITEHNICA Bucharest, Splaiul Independenței 313, 060042 Bucharest, Romania
2
Computer Science and Engineering Department, Faculty of Automatic Control and Computers, National University of Science and Technology POLITEHNICA Bucharest, Splaiul Independenței 313, 060042 Bucharest, Romania
*
Author to whom correspondence should be addressed.
Appl. Sci. 2025, 15(20), 11059; https://doi.org/10.3390/app152011059
Submission received: 26 September 2025 / Revised: 9 October 2025 / Accepted: 10 October 2025 / Published: 15 October 2025

Abstract

Featured Application

The proposed open-source device provides energy-autonomous irradiance monitoring for remote or off-grid assets (e.g., telecom sites, micro-PV, temporary installations). Its multi-protocol IoT interface simplifies integration with existing dashboards to inform control, scheduling, and diagnostics.

Abstract

IoT (Internet of Things)-enabled solar irradiance sensors are evolving toward energy harvesting, interoperability, and open-source availability, yet current solutions remain either costly, closed, or limited in robustness. Based on a thorough literature review and identification of future trends, we propose an open-source smart wireless sensor that employs a small photovoltaic module simultaneously as sensing element and energy harvester. The device integrates an ESP32 microcontroller, precision ADC (Analog-to-Digital converter), and programmable load to sweep the PV (photovoltaic) I–V (Current–Voltage) curve and compute irradiance from electrical power and solar-cell temperature via a calibrated third-order polynomial. Supporting Modbus RTU (Remote Terminal Unit)/TCP (Transmission Control Protocol), MQTT (Message Queuing Telemetry Transport), and ZigBee, the sensor operates from batteries or supercapacitors through sleep–wake cycles. Validation against industrial irradiance meters across 0–1200 W/m2 showed average errors below 5%, with deviations correlated to irradiance volatility and sampling cadence. All hardware, firmware, and data-processing tools are released as open source to enable reproducibility and distributed PV monitoring applications.

1. Introduction

Solar photovoltaic (PV) energy has emerged as one of the most rapidly expanding renewable energy sources globally, propelled by declining module prices, supportive policy environments, and a growing demand for decarbonized energy systems. As of 2022, the cumulative installed PV capacity surpassed 1 terawatt (TW), a notable milestone that underscores not only technological progress but also significant reductions in system costs [1]. This growth has been driven by continuous improvements in module efficiency, decreased balance-of-system expenditures, and economies of scale in both manufacturing and deployment [2]. Utility-scale PV facilities, which were previously regarded as experimental, now provide competitively priced electricity in various regions around the world, often outpacing fossil fuel generation in levelized cost of electricity (LCOE) evaluations [3].

1.1. Problem Description

As the integration of PV plants into electrical grids increases, the precise monitoring of environmental conditions becomes ever more crucial for both performance evaluation and operational dependability. Among the various environmental factors, solar irradiance stands out as the most vital parameter, as it directly influences the energy conversion process of PV systems.
In the absence of accurate irradiance measurements, it is impossible to effectively assess plant performance, compute the performance ratio (PR), or implement successful operations and maintenance (O&M) strategies ([4,5]). International standards like IEC 61724-1:2017 [4] outline the criteria for monitoring the performance of PV systems and underscore the importance of irradiance measurement as a key factor in classifying monitoring systems into categories A, B, and C. These standards stress that irradiance data is crucial for benchmarking, identifying underperformance, and measuring degradation or soiling losses. Numerous studies have further validated that the precision of irradiance measurements significantly affects the dependability of PV yield predictions and performance evaluations [6]. For example, even a slight uncertainty of a few percent in plane-of-array (POA) irradiance can result in considerable discrepancies in performance ratio calculations, which may hinder the identification of faults or energy losses at the plant level.
In accordance with ISO 9060:2018 [7] and IEC 61724-1:2021 [8], pyranometers are established as the standard instruments for measuring broadband plane-of-array (POA) irradiance in photovoltaic (PV) monitoring. Class A pyranometers are commonly utilized for calculating performance ratios (PR), assessing resources, and detecting faults. Guidelines from NREL (National Renewable Energy Laboratory) and the IEA (International Energy Agency) PVPS (Photovoltaic Power Systems Programme) program highlight their importance in precise monitoring and calibration practices [9].
Nonetheless, pyranometers are expensive and necessitate regular maintenance. In addition to routine upkeep, they also require periodic recalibration over the years to ensure sustained measurement accuracy and compliance with reference standards. Furthermore, long-term exposure to ultraviolet radiation can degrade the optical dome and filter materials, leading to spectral response drift. The external cabling is also prone to mechanical wear or damage caused by rodents or environmental factors, which may introduce intermittent signal losses. These aspects, combined with the recurring maintenance and calibration costs, significantly increase the total ownership cost and limit their suitability for large-scale or remote deployments.
Consequently, PV reference devices equipped with temperature sensors are being increasingly used as more affordable irradiance substitutes. Recent research indicates that, when adjusted for temperature influences and spectral discrepancies, these devices can effectively replicate pyranometer readings ([10,11,12]). These developments render them appealing for autonomous, distributed, and IoT-enabled monitoring systems.

1.2. Proposed Solution

This paper presents the design, implementation, and experimental validation of an open-source smart wireless IoT sensor that measures solar irradiance using a small photovoltaic module serving simultaneously as the power source and sensing element, integrating temperature compensation, multiple communication protocols, and autonomous operation for reliable distributed PV monitoring.
Our device was validated against industrial-grade irradiance meters across a broad measurement range and across multiple test conditions. We demonstrate average measurement errors below 5%, where variations in accuracy were primarily linked to rapid changes in irradiance and the timing of sample acquisition. These results confirm the device’s suitability for reliable solar monitoring in dynamic outdoor environments, supporting its use in practical photovoltaic energy applications.
The paper is structured as follows: Section 2 reviews the current state of solar monitoring technologies, highlighting limitations in cost, integration flexibility, and energy autonomy. Section 4 details the design and implementation of the proposed device, including hardware challenges (powering, signal sampling), communication protocols and software architecture. Section 5 describes the experimental testbed and validation procedure against reference instruments. We analyze the results in Section 6, finally concluding with a summary of our findings and future work in Section 7.

2. Related Work and Literature Review

The literature review presented in this chapter follows a twofold perspective: first, we examine the evolution of solar irradiance measurement technologies towards their integration within industrial IoT frameworks, enabling autonomous, real-time monitoring at scale; second, we highlight interdisciplinary trends that combine IoT with machine learning, where cloud-connected devices provide high-resolution data streams that can be exploited for advanced forecasting and analytics. Furthermore, recent studies have increasingly emphasized the role of key IoT components—such as distributed sensor nodes, data visualization platforms like Grafana, and lightweight communication protocols (e.g., MQTT, Modbus RTU, and LoRaWAN)—in enhancing the efficiency, scalability, and transparency of energy monitoring applications [13,14,15,16,17,18].
Recent studies further highlight end-to-end IoT pipelines for PV monitoring, from sensing to visualization and control. Rouibah et al. present an IoT-based prototype for smart monitoring of photovoltaic systems with field validation in Scientific African, underscoring low-cost instrumentation and cloud integration [19]. Complementarily, Calderón et al. demonstrate an IIoT architecture layered from sensing to application, explicitly adopting Grafana in the top layer for web-based dashboards and discussing protocol choices suitable for energy systems [20].

2.1. Integrating Solar Irradiance Meters in the Industrial IoT Context

The rise of the Internet of Things (IoT) and Industrial Internet of Things (IIoT) has revolutionized solar resource monitoring by facilitating the use of distributed, autonomous, and cost-effective devices that can transmit irradiance and performance data in real time. While traditional pyranometers and industrial data loggers are still the standard in utility-scale PV plants, their high costs and maintenance needs restrict their deployment density. IoT-enabled systems provide scalable alternatives by integrating embedded microcontrollers, low-power wireless connections, and cloud-based analytics, enabling irradiance-aware monitoring from small off-grid systems to extensive distributed PV fleets [21].
A prevalent method involves the integration of affordable irradiance sensors with wireless microcontrollers (such as ESP32, STM32) and lightweight IoT protocols like MQTT or LoRaWAN. BE. Demir presented in [22] an IIoT monitoring platform that features real-time solar data acquisition and cloud dashboards, while in [23] Hamied et al. demonstrated that comprehensive PV monitoring can be achieved with a bill of materials costing less than EUR 80, highlighting the practicality of cost-effective IoT loggers for smaller plants. Botero-Valencia JS. et al. developed a low-cost, open-hardware irradiance sensor that was benchmarked against a professional pyranometer, further validating the dependability of IoT-based devices when proper calibration is applied [24].
Recent studies have also investigated alternative sensing methods suitable for IoT applications. JA. Nava-Pintor et al. suggested in [25] utilizing standard ambient-light sensors enhanced with machine learning models to estimate global horizontal irradiance, thereby lowering hardware expenses while ensuring acceptable accuracy. Likewise, in two publications, CF Abe et al. and Laudani, Lozito, and Fulginei showed that PV modules functioning in short-circuit or maximum-power modes can act as proxy irradiance sensors when adjusted for temperature and spectral influences, a strategy particularly pertinent for energy-autonomous IoT meters [26,27].

2.2. Machine Learning in Corroboration with IoT

Recent studies underscore the significant synergy between Internet of Things (IoT) architectures and machine learning methodologies, particularly in the realm of solar irradiance forecasting. In [28] A. Martin et al. have illustrated how deep learning models, such as Long Short-Term Memory (LSTM) and Bidirectional LSTM (Bi-LSTM), can effectively utilize the multivariate data emanating from IoT and IIoT networks to yield highly precise short-term irradiance predictions. Concurrently, in [29] JK. Rogier and N. Mohamudally introduced one of the pioneering frameworks that leverage IoT for forecasting, wherein distributed wireless sensor nodes are integrated with nonlinear autoregressive neural networks. This innovative approach has enabled real-time predictions of photovoltaic (PV) generation, thereby affirming the feasibility of embedding machine learning directly within IoT monitoring systems.
From a systems perspective, the integration of IIoT communication technologies with machine learning analytics is becoming increasingly prevalent. Hameed et al. [30] implemented a monitoring system based on LoRaWAN technology, wherein artificial intelligence-driven models not only enhance the accuracy of irradiance predictions but also assist in fault detection, all while ensuring low energy consumption and secure data transfer. In a complementary study, Bueso et al. [31] demonstrated how the design topology of LoRa-based IoT sensor networks can markedly affect the predictability of irradiance, thereby underscoring the crucial role of network architecture in machine-learning enhanced forecasting. Beyond communication aspects, innovative low-cost imaging and sensing devices have also been integrated into this research domain. Ansong et al. [32] developed a hybrid machine learning model that incorporates an open-source sky imager as an IoT device, yielding significant improvements in very short-term forecasting accuracy. Similarly, Nava-Pintor et al. [25] showed that ambient light sensors, when paired with machine learning techniques, can act as cost-effective proxies for irradiance in distributed IoT deployments. Recent literature also emphasizes the growing adoption of lightweight machine learning models, designed to fit the constraints of IoT nodes. Alzahrani [33], for example, demonstrated that adaptive extreme learning machines enable robust short-term irradiance predictions while maintaining modest computational demands, making them suitable for edge deployment. In parallel, Zurita Macias et al. [34] highlighted how machine learning-based predictions of energy availability in solar-powered IoT nodes can optimize sampling and transmission schedules, thereby closely linking irradiance forecasting with the autonomy and reliability of IoT systems.

3. Methodology and Research Questions

3.1. Research Questions

Based on our prior technical experience in the design of autonomous sensing systems, together with insights gained from the literature review, we formulated the following research questions to guide this study.
The present study is guided by the following research questions:
  • How can solar irradiance be reliably measured using a PV device that simultaneously serves as an energy harvester while maintaining accuracy comparable to industrial pyranometers?
  • What architectural principles enable the design of an autonomous, energy-independent IoT irradiance meter that balances low power consumption, scalability, and reliable cloud connectivity?
  • To what extent does the proposed temperature-compensation polynomial improve the accuracy of PV-based irradiance measurements under varying environmental conditions?
  • How does the error profile of the developed device compare against that of reference industrial irradiance meters across different irradiance and temperature ranges?
  • What are the advantages and limitations of integrating sensing and energy harvesting into the same PV panel, compared with conventional sensor-based IoT monitoring solutions?
  • How can IoT-enabled irradiance meters contribute to data-driven applications such as short-term solar forecasting, anomaly detection, and predictive maintenance when coupled with machine learning methods?
  • What implications does the proposed system have for large-scale deployment in distributed PV monitoring, particularly regarding cost reduction, calibration requirements, and long-term reliability?
To address these research questions in a structured manner, we propose the following hypotheses, which establish measurable expectations regarding the performance and applicability of the developed system.

3.2. Research Hypotheses

To address the previously defined research questions, we propose the following hypotheses:
H1: 
A PV device can serve as both an energy harvester and a sensing element for solar irradiance, achieving measurement accuracy comparable to that of industrial pyranometers after calibration.
H2: 
A modular, energy-independent IoT architecture enables reliable autonomous operation, while ensuring scalability and efficient cloud connectivity under low-power constraints.
H3: 
The proposed temperature-compensation polynomial significantly reduces the deviation between PV-based irradiance measurements and reference data across a wide range of environmental conditions.
H4: 
The error profile of the developed device remains within acceptable limits (e.g., below 5%) when validated against industrial irradiance meters under diverse irradiance and temperature scenarios.
H5: 
Integrating sensing and harvesting functions into the same PV panel provides a cost-effective and compact alternative to conventional IoT monitoring solutions without compromising accuracy.
H6: 
Datasets generated by IoT-enabled irradiance meters can enhance machine-learning applications such as short-term forecasting, anomaly detection, and predictive maintenance.
H7: 
The proposed system supports large-scale deployment for distributed PV monitoring, reducing costs and calibration complexity while maintaining long-term reliability.

3.3. Methodology

The methodology adopted in this study followed a structured sequence of steps that combined theoretical analysis, simulation, prototyping, and experimental validation. The methodology led us to tackle the research questions previously mentioned. The main stages are summarized below:
  • Literature Review and State-of-the-Art Analysis
    • Conducted a comprehensive survey of research publications and commercial solutions.
    • Identified gaps in solar irradiance measurement and IoT integration.
    • Defined the motivation for a low-cost, autonomous, IoT-enabled irradiance sensor.
  • System Architecture Definition
    • Proposed a modular architecture with three key components:
      -
      Energy harvesting from a PV panel.
      -
      Irradiance measurement using the same PV panel.
      -
      IoT-based data transmission to the cloud.
    • Designed for scalability, low energy consumption, and interoperability.
  • Circuit Simulation
    • Simulated the energy harvesting subsystem for efficiency under variable irradiance.
    • Simulated the irradiance measurement circuitry for linearity and stability.
    • Established baselines for prototype development.
  • Prototyping and Validation of Simulations
    • Built laboratory prototypes of the simulated circuits.
    • Performed measurements to validate simulation results.
    • Refined design based on component tolerances and real-world noise.
  • Final Product Design and Implementation
    • Integrated validated subsystems into a compact prototype.
    • Developed firmware for data acquisition, wireless communication, and power management.
    • Ensured robustness and low-power operation for autonomous deployment.
  • Functional Validation
    • Verified energy harvesting, irradiance measurement, and IoT connectivity.
    • Confirmed reliable operation under outdoor conditions.
  • Data Collection and Temperature Compensation
    • Deployed the device for continuous data acquisition.
    • Collected reference data using an industrial irradiance meter.
    • Developed a temperature-compensation polynomial to correct PV sensor deviations.
  • Implementation of Temperature Compensation
    • Embedded the polynomial correction model in the device firmware.
    • Enabled real-time compensation of irradiance measurements.
  • Calibration and Error Characterization
    • Calibrated the device against the reference industrial irradiance meter.
    • Analyzed residual errors to evaluate accuracy.
    • Confirmed the suitability of the device for monitoring and research use.

4. Solution Architecture

Our proposed solution relies on a dedicated strategy that combines low-power hardware and energy-efficient software control to transform a small photovoltaic module into both an energy harvester and a solar irradiance sensor. The methodological core is the estimation of irradiance through electrical measurements at the panel terminals, enhanced with real-time temperature sensing and polynomial modeling. Specifically, a ESP32 microcontroller (manufactured by Espressif Systems Co. Ltd., Shanghai, China, sourced from Mouser Electronics, Brno, Czech Republic) manages acquisition, control, and communications, while a high-precision ADC samples panel voltage and current under a programmable load. By disabling charging during measurements and sweeping the I–V curve through incremental load steps, the system identifies the Maximum Power Point (MPPT). The MPPT value, together with the solar cell temperature, is then processed through a third-order polynomial model, calibrated in MATLAB 2023a, to provide a corrected irradiance estimate. The device further integrates multiple communication protocols (ZigBee, Modbus RTU/TCP, MQTT), enabling flexible integration in IoT and industrial monitoring environments, while adopting sleep–wake cycles to minimize consumption.
From a methodological perspective, validation was carried out in both laboratory and field conditions, ensuring accuracy under controlled and real-world scenarios. In the laboratory, linearity and precision of the measurement chain were benchmarked against Keithley 2000 multimeters (Keithley Instruments, Solon, OH, USA) and NI USB-6009 (National Instruments Corporation, Austin, TX, USA) acquisition modules, while in the field the wireless sensor was compared to two industrial-grade irradiance references: Si-420TC-T (Krannich Solar S.R.L, Bucharest, Romania) and Solar MET (NRG Systems, Hinesburg, VT, USA). Data was synchronized and stored in a SQL database through an aggregator device (Raspberry Pi) equipped with an ZigBee module, which also supported visualization in Grafana. Accuracy evaluation employed mean percentage error and daily mean squared error (MSE), correlated with irradiance variability. Over extended testing, the proposed methodology consistently achieved errors below 5%, with deviations mainly observed during highly variable sky conditions due to differences in sampling cadence and sensor response. These results validate the methodological approach as both cost-effective and reliable for distributed PV monitoring.

4.1. Hardware Architecture

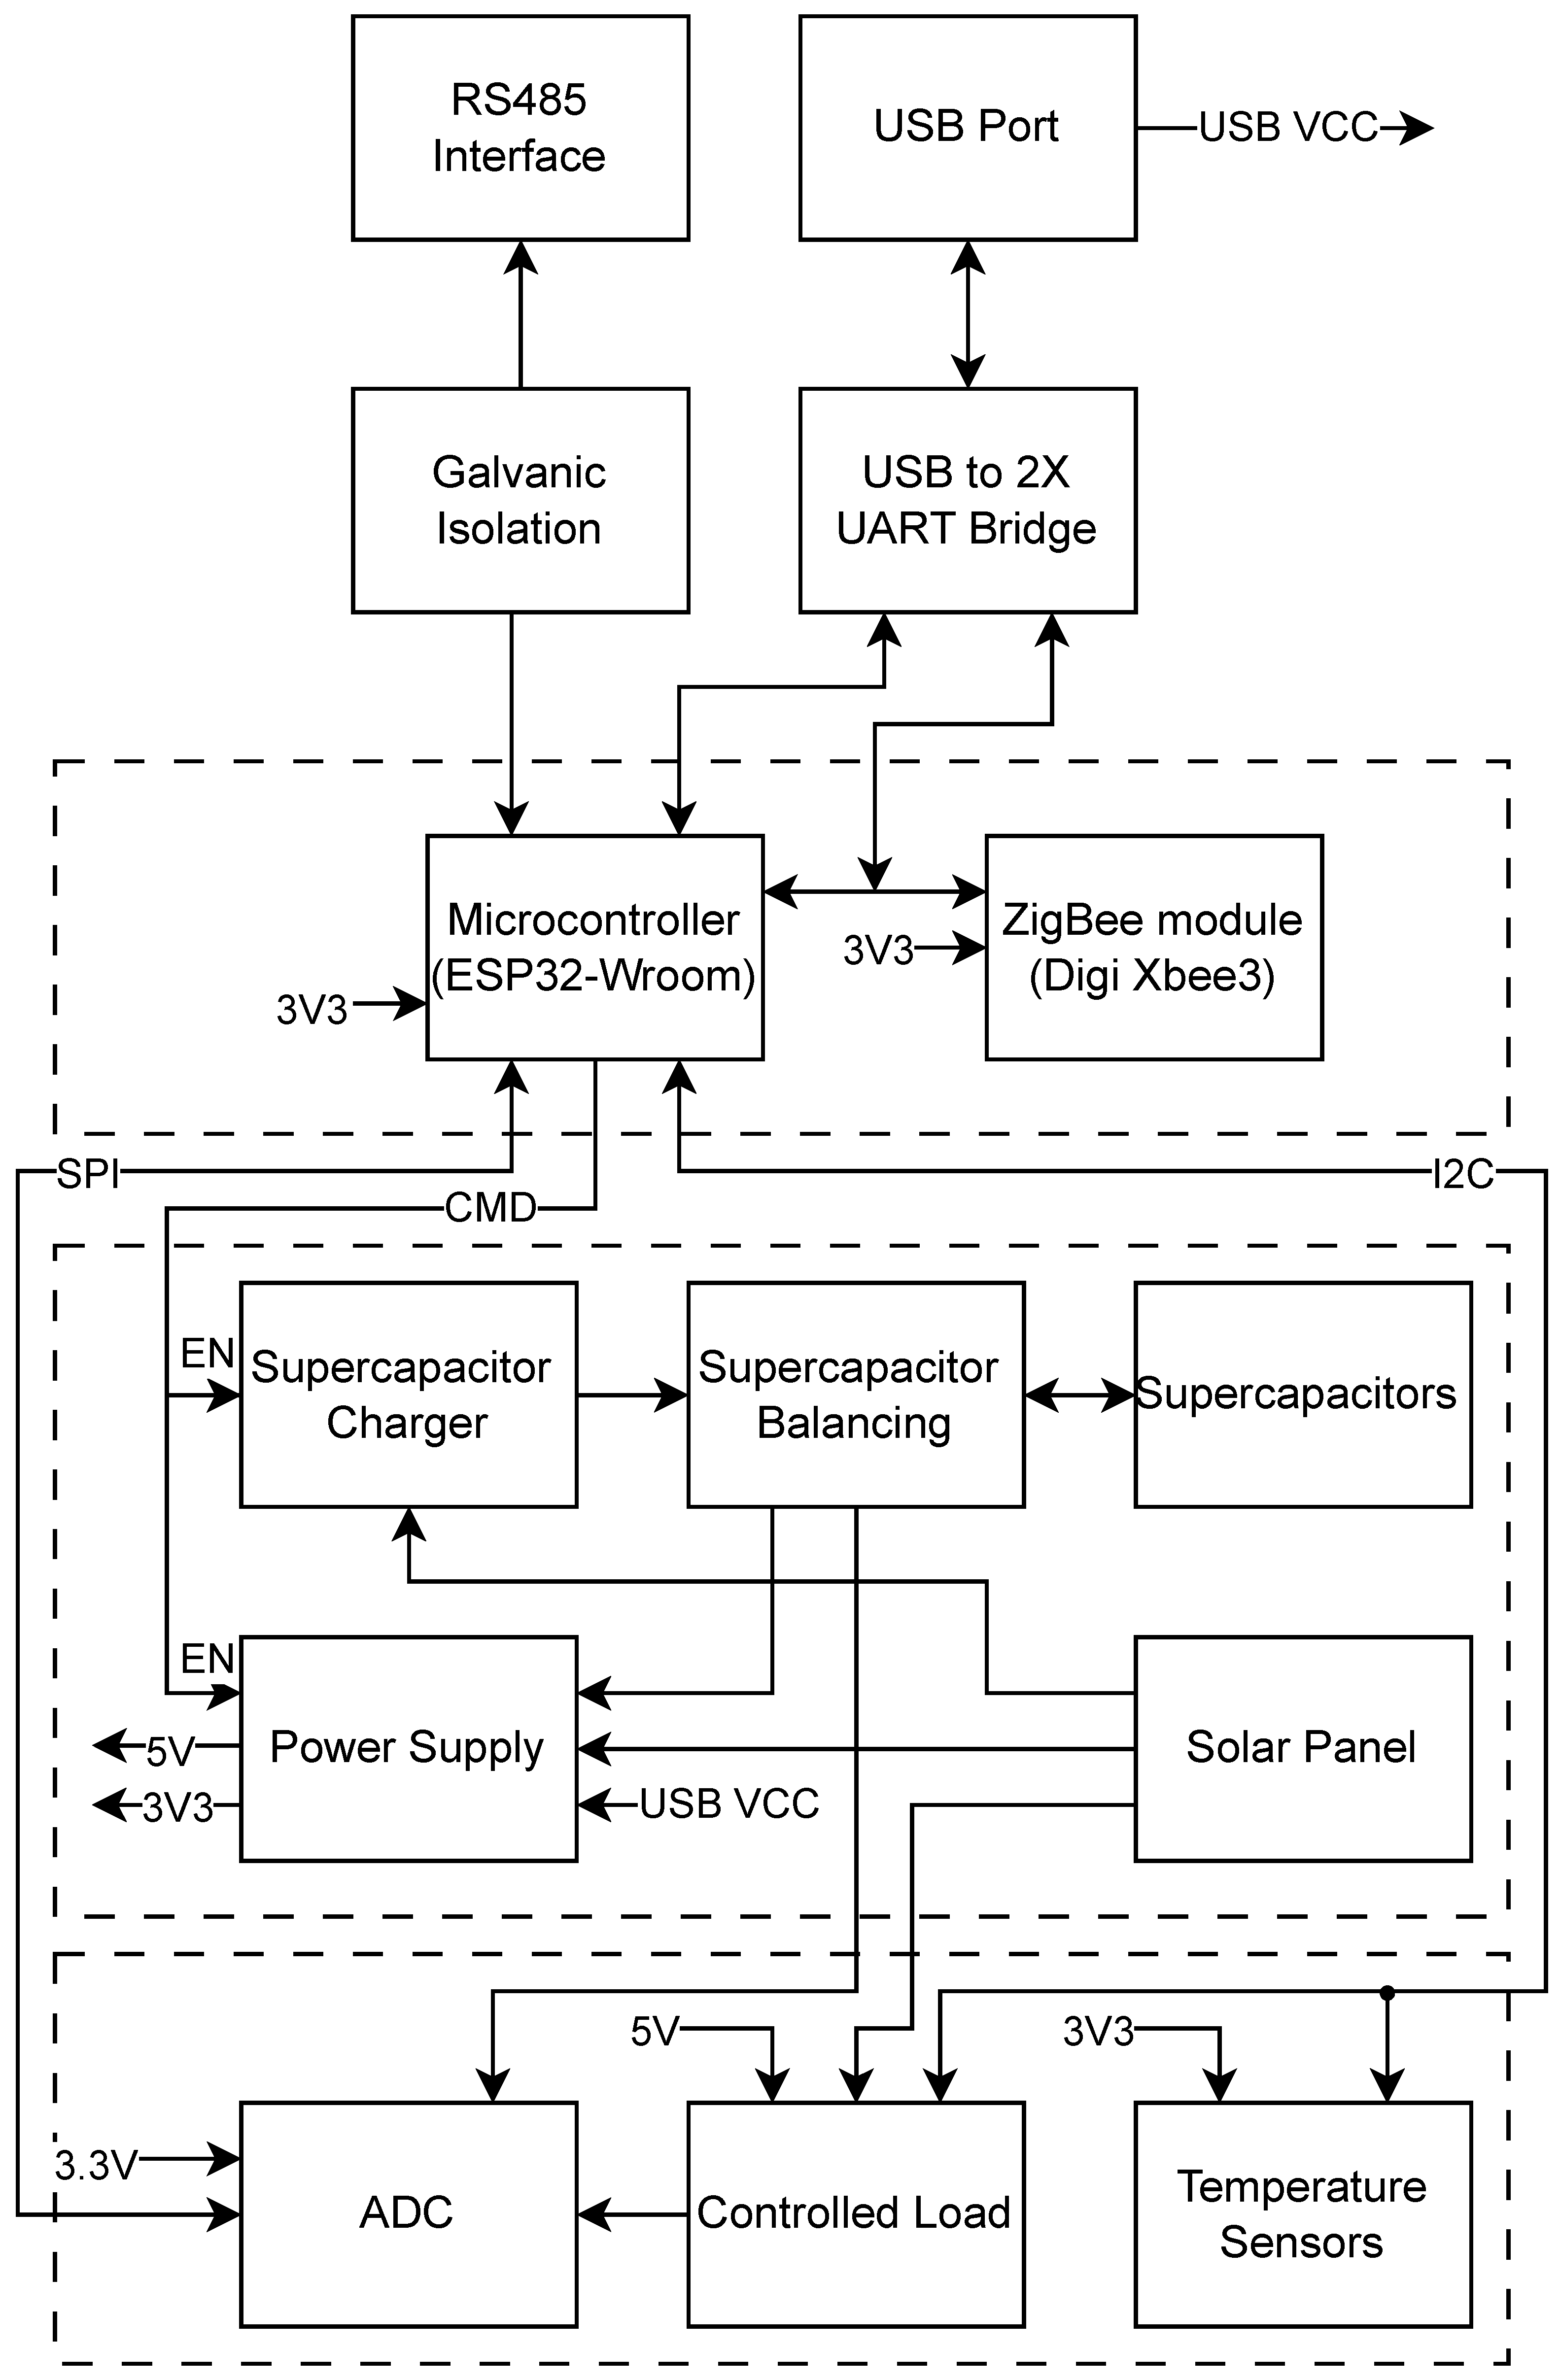
The hardware architecture, which can be seen in Figure 1, is divided into four main blocks:
  • Communication interfaces;
  • Processing;
  • Power management;
  • Solar irradiance measurement block.
The communication block integrates several interfaces. Among them, as the preferred wired communication interface in industrial settings, we provide an RS-485 serial bus for implementing the Modbus RTU protocol. Additionally, we also have a USB (Universal Serial Bus) interface, which is especially useful for firmware upgrades and debugging during the software development process. On the wireless side, we added an external ZigBee module (an XBee 3 [35]) for long-range operation, while the ESP32 microcontrollerreadily integrates Wi-Fi and Bluetooth interfaces [36].
Figure 1. Hardware architecture of the proposed smart wireless IoT solar irradiance sensor.
Applsci 15 11059 g001
The ESP32 microcontroller is the central processing unit, communicating with all other components via specific chip-to-chip interfaces (e.g., SPI, I2C, GPIOs), performing sensor data acquisition and doing the solar irradiance computations.
The power management block integrates (and prioritizes) the solar panel as the primary energy source for the sensor; in the absence of sufficient solar power, it seamlessly transitions to battery operation. Here, we also included the circuits for charging and balancing the cells, when necessary. The power supply generates the two voltages, 5 V and 3.3 V, to power all electronic components.
Finally, the solar irradiance measurement block incorporates a programmable load to load the solar panel, while an ADC is used to measure the maximum current and voltage that the solar panel can deliver.

4.1.1. Microcontroller

As the main processor, we chose an ESP32 [36] microcontroller due to its low power consumption in deep sleep mode and high performance in active state. During development and testing, its Wi-Fi feature was also useful to transmit logs and debug messages without the need for a wired connection. Three different UART (Universal Asynchronous Receiver–Transmitter) instances were used: one for integrating the XBee module, another to connect with a UART-to-USB bridge (for programming/debugging using a PC) and a final one to expose an isolated RS-485 interface.
All other elements such as battery charging and 5 V supply are controlled through GIPIOs. The temperature sensors connect to the microcontroller using the I2C interface, while the ADC module (Analog-to-Digital Converter) is wired using SPI (Serial Peripheral Interface), since a high data transfer rate is required.

4.1.2. Power Supply

The main 3.3 V power supply is implemented using the MCP16311 buck converter (Microchip Technology Inc., Gresham, OR, USA), which features a hysteretic on/off. It starts when the input voltage exceeds approximately 7 V and stops when dropping below 4 V. Additionally, a dedicated 5 V supply is incorporated here to power the programmable load, programmatically activated or deactivated by the microcontroller.
The battery is charged using solar energy taken from the photovoltaic panel, except during solar irradiance level measurement. The charging circuit is composed of two LM317, one configured as a current supply, and the another as a voltage supply in order to be able to change the nominal voltage of the battery easily to allow the use of different battery cell types.

4.1.3. Analog-to-Digital Converter (ADC)

To measure the solar panel voltage and current, we employed a 4-channel ADS131A04 [37], featuring 24-bit resolution and a sample rate of 128 ksps. When doing PV load current measurement, battery charging is stopped and all modules become powered from the energy stored in the battery. As there is no other consumer, all current delivered by the solar panel will pass through a controllable electronic load. The same ADC is also used for measuring the voltage and current flowing through the battery. This is useful to estimate the battery level, and to meter the energy consumption.
Note that the ADS131A04 ADC module has an integrated negative voltage supply (Negative Charge Pump) to measure the difference of potential in any direction. This is useful, for instance, when alternating between charging and discharging modes of the battery.
In order to to provide the 3.3 V analog power for the ADC, we selected the TPS73230 [38], a Low-Dropout Regulator from Texas Instruments. Two Π -type filters were placed in chain configuration on its output. The digital part is powered from the same voltage source that powers the ESP32 microcontroller.
The ADC’s reference voltage is generated with an external precision reference, REF5020AQ [39], also from Texas Instruments, which provides 2.048 V and has an initial accuracy of 0.05% and a temperature coefficient of 8 PPM/°C.

4.1.4. Communication Interfaces

On the communication side, both wired and wireless interfaces were designed into our prototype. For wired communication, a galvanically isolated RS-485 interface is provided for running the Modbus protocol. As for the wireless communication, an XBee 3 [35] module was chosen, allowing the creation of WPAN (Wireless Personal Area Network) ad hoc networks. The configuration of the XBee module can be done through Digi’s proprietary application but may be, if required, also done through the ESP32 microcontroller. XBee has a SMA (SubMiniature version A) connector for external antenna, though it may be swapped with other versions, e.g., integrating a PCB antenna (Printed Circuit Board) or UFL (Ultra Miniature Coaxial) connector. The advantage of SMA connector is that they generally have a lower attenuation compared to the others.

4.1.5. Device Assembly and PCBs

Our device was designed to be mounted directly under the solar panel, making it a compact assembly. Three temperature sensors TMP117MAIDRVR [40] on I2C are installed on the device to measure the temperatures on the back of the solar panel, the ambient temperature, and the temperature on the load electronic heat sink to avoid overheating. Based on the temperature difference between the sensor on the panel and the ambient temperature sensor, a comparison of the solar irradiance level will be made and will be described in Section 4.2.
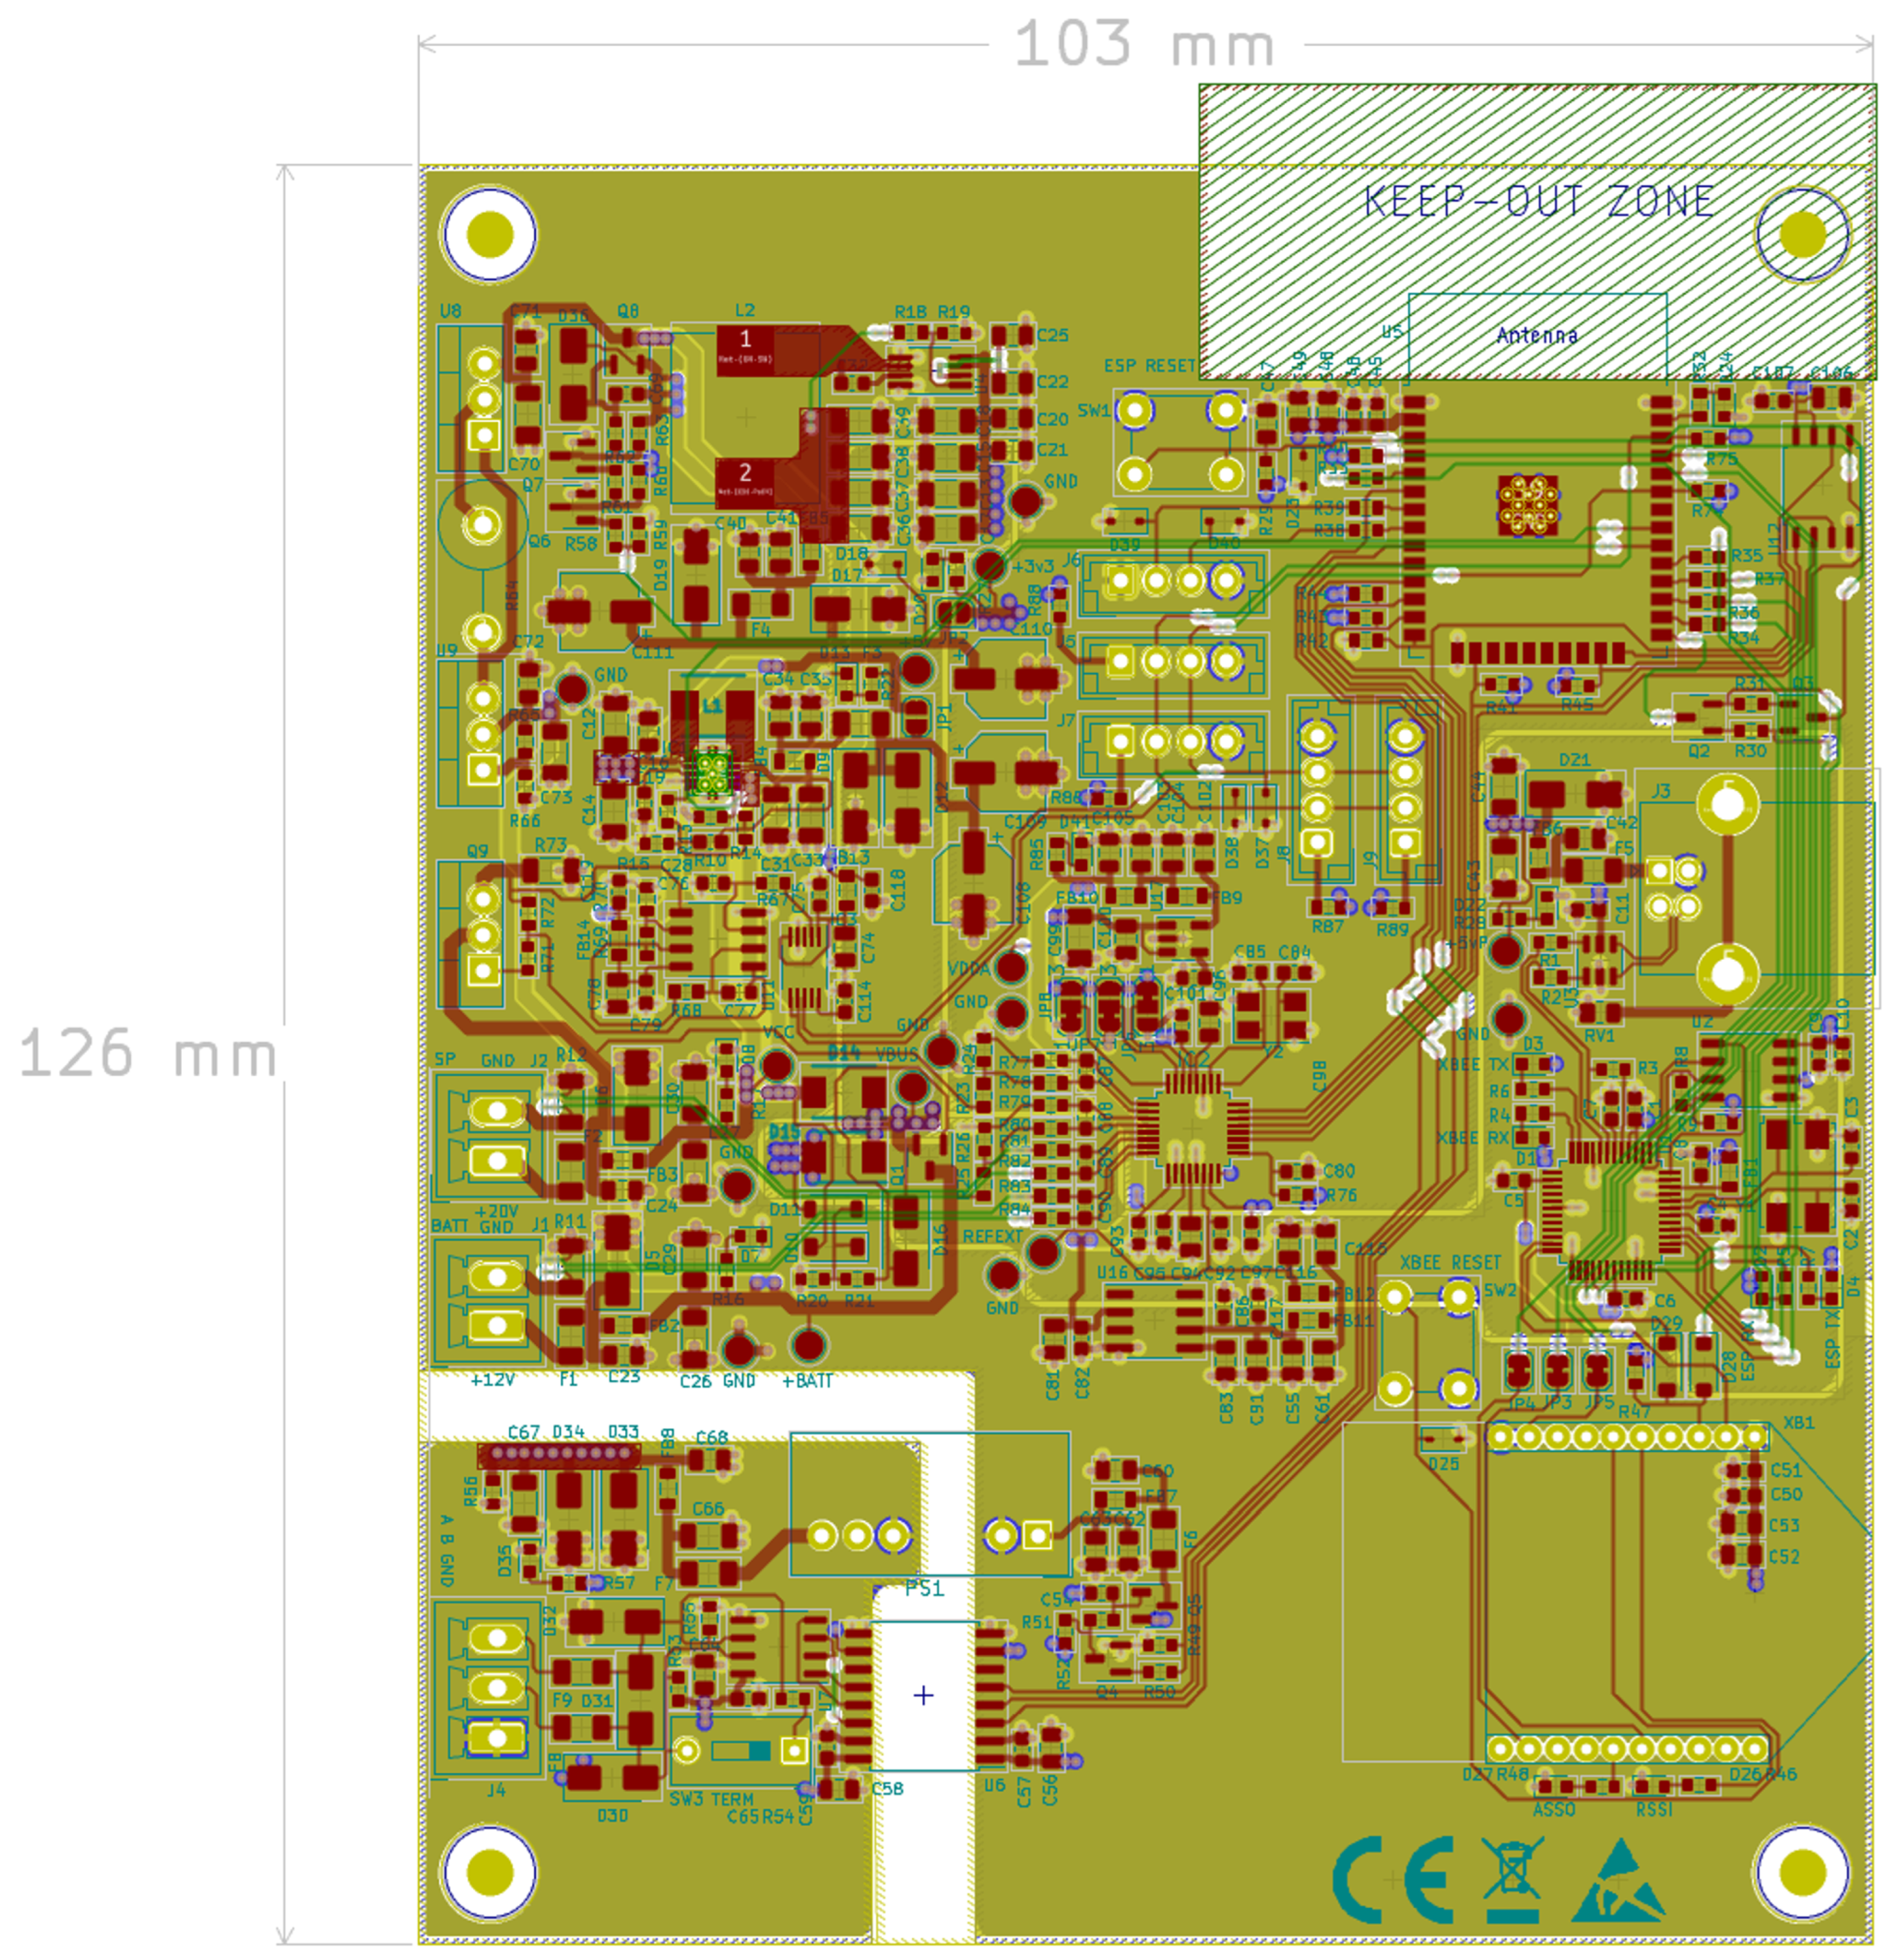
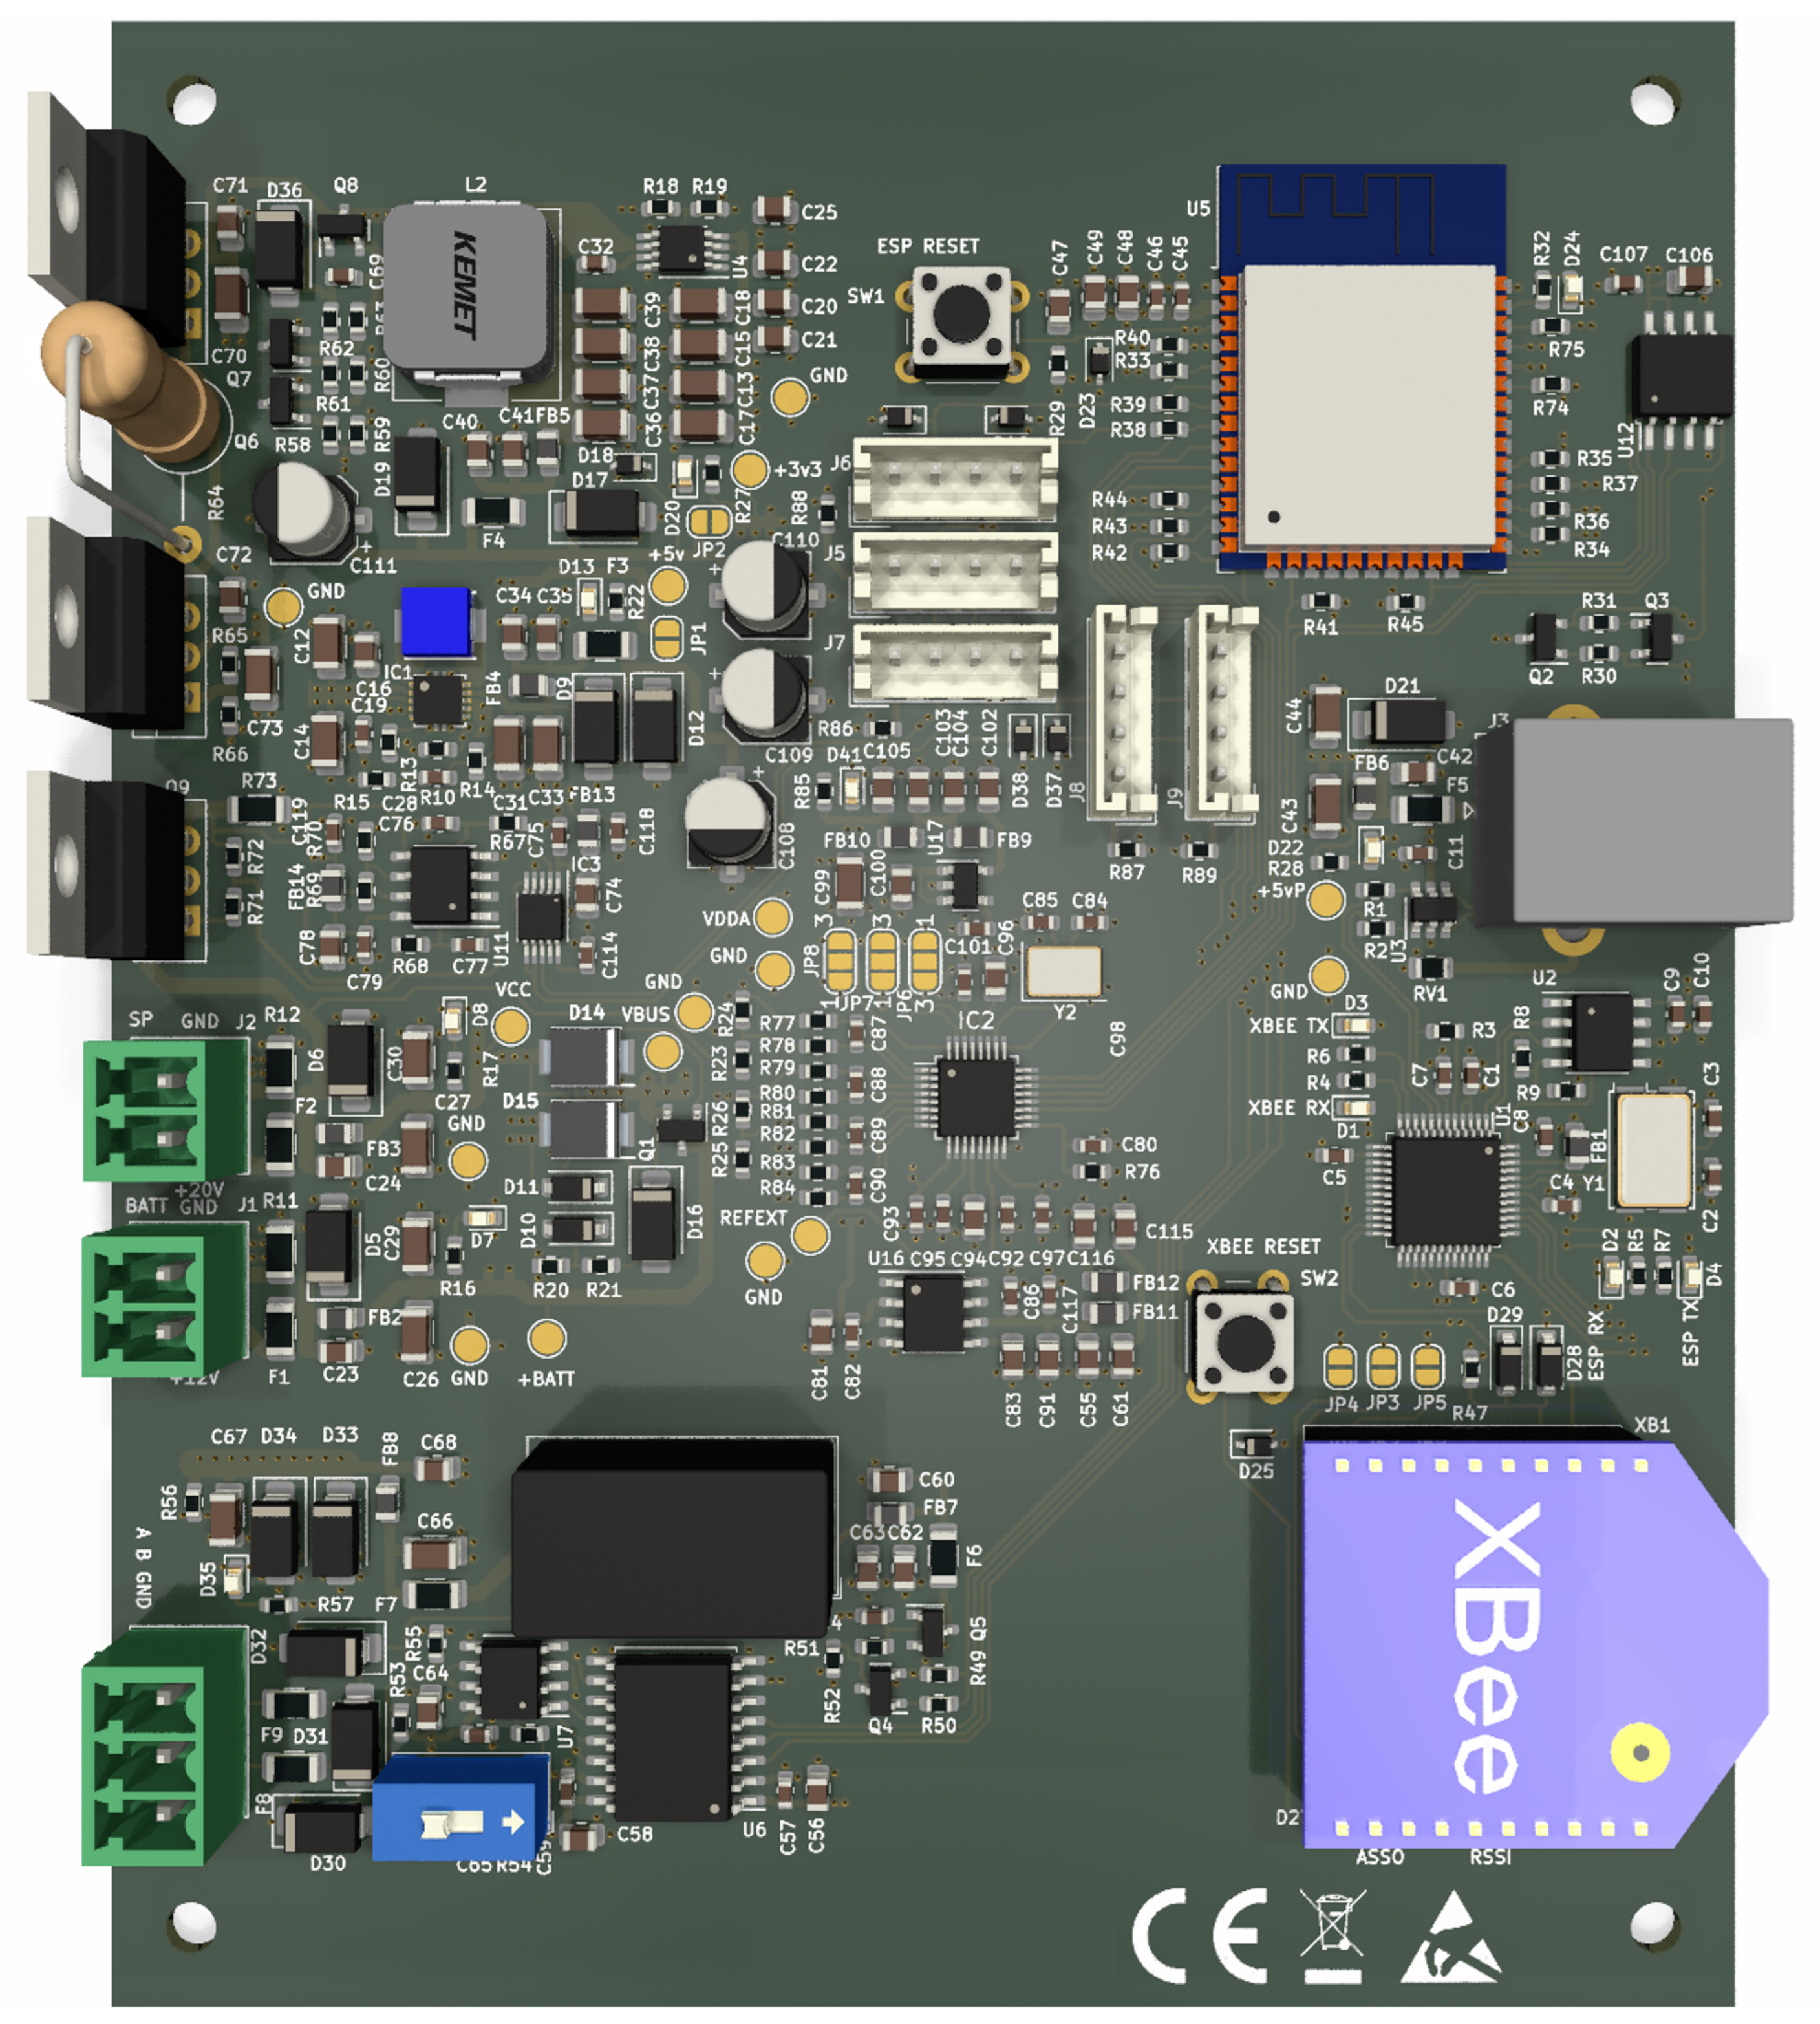
The PCB was designed using four layers: two signal layers (green and red), a ground plane, and a power plane layer. The PCB can be seen in Figure 2, while Figure 3 shows a 3D model simulation.

4.2. Software Architecture

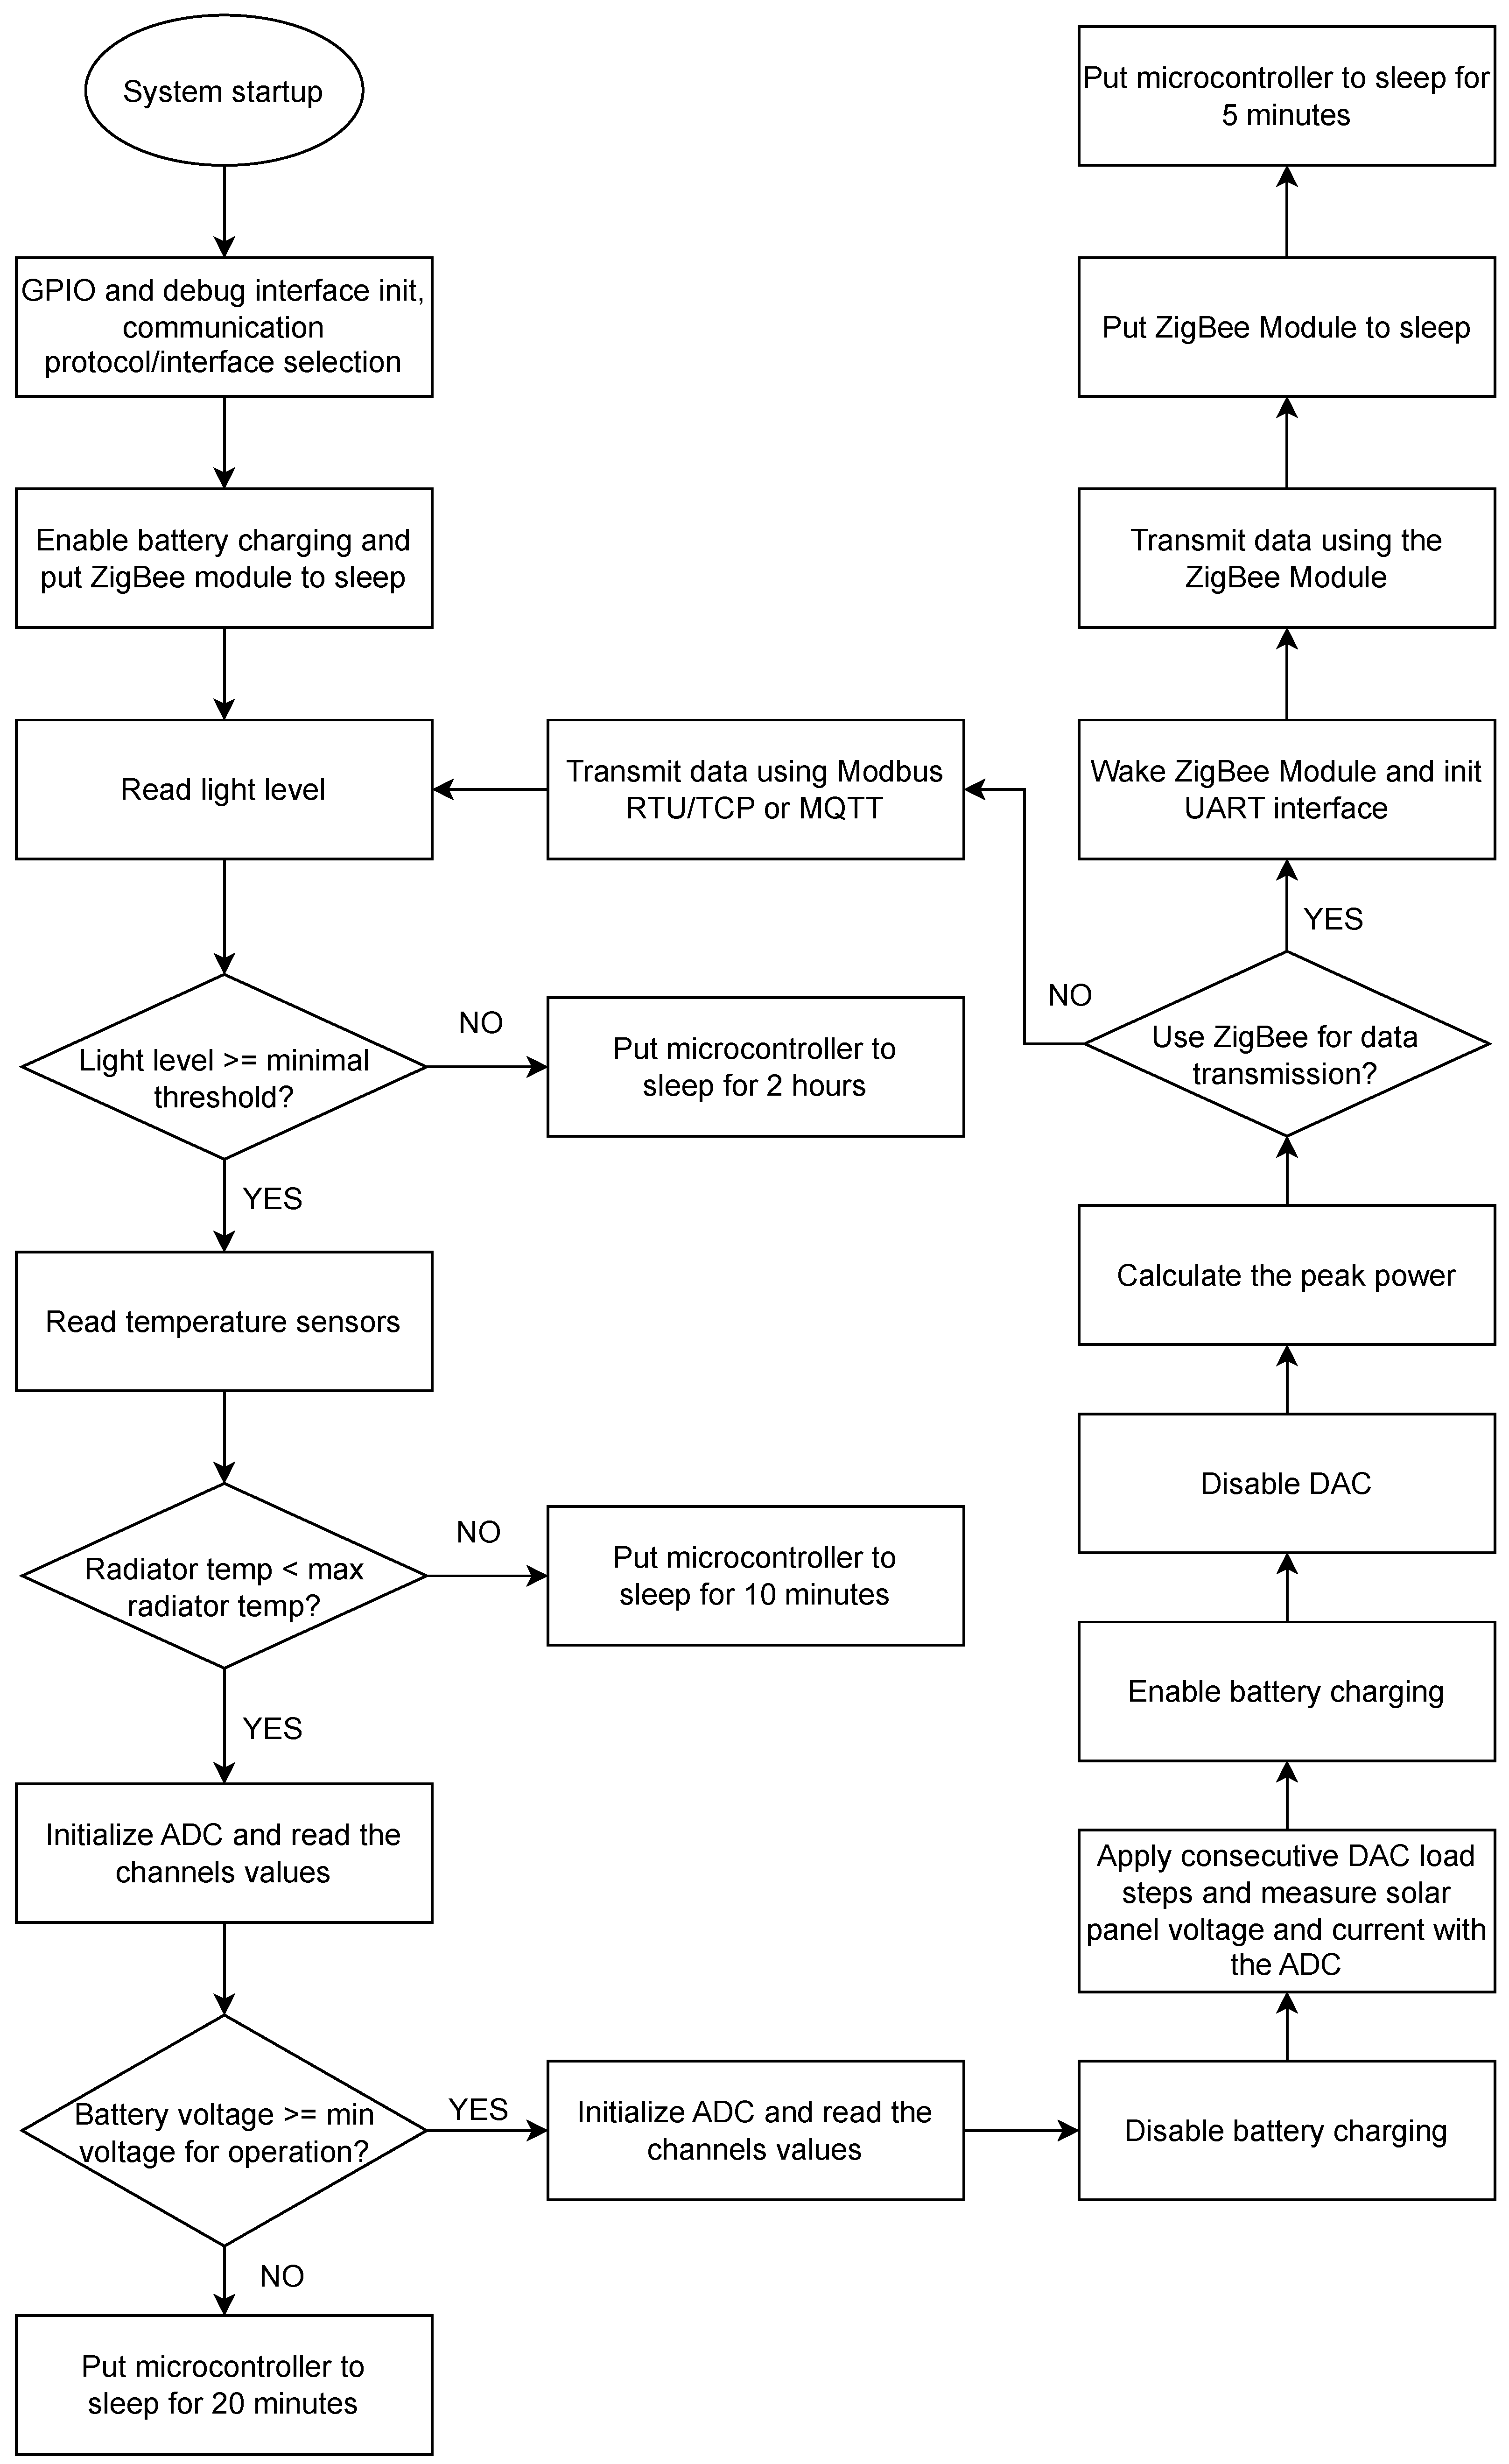
The software workflow diagram of the device is presented in Figure 4, which outlines the sequence of operational states of the microcontroller, starting from the power-on phase and extending to the transition into sleep mode. This architecture has been designed to ensure an efficient management of device operations, guiding the microcontroller through the required functional states to accomplish its tasks, while simultaneously optimizing both power consumption and overall system performance during inactive periods.
To optimize energy consumption, the system operates in periodic wake-up cycles. During each cycle, irradiance values are acquired and transmitted via the designated protocol and communication interface, after which the system returns to sleep mode for a predefined interval.
This operating mode (based on repeated wake-ups and sleep transitions) is used when the ZigBee communication interface is enabled. For the other communication protocols supported by the device, such as Modbus RTU, Modbus TCP and MQTT, the device is no longer placed into sleep. Instead, it continuously iterates over the processes of data acquisition and transmission. This approach was selected because, in the case of Modbus protocols, it is often recommended to maintain an active connection between devices, which is also similar for MQTT. In any case, we implemented and tested both functionalities under continuous measurement and transmission, as well as having it sleep then wake-up after a predefined interval for saving energy. These scenarios are better described in Section 6.4.
Figure 2. Device PCB layout.
Applsci 15 11059 g002
Once the microcontroller exits sleep mode, the first task is the initialization of the GPIO (General-Purpose Input/Output) pins and the debug UART interface, which is used for displaying diagnostic messages during device operation. Subsequently, depending on the selected communication protocol, configured at compile-time using dedicated variables, the system proceeds to activate the battery charging circuit and transition the XBee module into sleep mode, if it is not already in that state.
In the next stage, the system acquires ambient light data from the dedicated sensor. Based on the measured intensity, it determines whether the system has resumed operation at night, in the morning, or during the day. If the light level falls below the minimum threshold defined in the firmware, the microcontroller re-enters sleep mode for a two-hour interval to allow for sunrise, after which solar irradiance measurements become meaningful. If the ambient light exceeds the threshold, solar irradiance measurements are initiated. At this point, the temperature sensors are also initialized and sampled. Particular attention is given to the internal heatsink temperature, which must remain below a predefined maximum limit to prevent potential hardware damage. If this threshold is exceeded, the microcontroller enters a 10 min sleep cycle to allow the heatsink to cool. Conversely, if the temperature is within the permissible range, the ADC is initialized and used to sample various channels, including the battery voltage.
Figure 3. Device 3D model.
Applsci 15 11059 g003
The next step is verifying the battery voltage, ensuring that it is above a minimum threshold required for performing solar irradiance measurements. If the measured voltage is greater than this minimum value configurable in the code, the system proceeds with the solar panel measurements. At this point, the battery charging circuit is disabled to prevent current draw from the PV panel during the power measurement process. The (Digital-to-Analog Converter) is then activated, and incremental load steps are applied using a dedicated circuit. For each step, both the panel voltage and the corresponding current are measured via the ADC. By calculating the product of voltage and current at each load step, the instantaneous power values are obtained, and the highest of these values corresponds to the peak power generated by the solar panel. After the load sequence is completed, the DAC is disabled again to save energy.
Once the Maximum Power Point has been determined, the solar irradiance is calculated using the dedicated algorithm (described in Section 4.2.1), providing the system’s measurement at that moment in time that furthermore will be transmitted. Depending on the chosen protocol and communication interface, the device either transmits the data and returns to sleep, or continues measurements without delay.
Figure 4. System software diagram.
Applsci 15 11059 g004
If ZigBee was selected as communication channel, the system activates the XBee module (by waking it from sleep) and initializes its associated UART. Using the communication protocol implemented in the software, the measured data are transmitted to the aggregator, after which the XBee module is placed back into sleep for energy saving. Following data transmission, the microcontroller is placed in sleep for five minutes, allowing sufficient time for the solar-powered supply system to recharge the battery.
If Modbus RTU, Modbus TCP, or MQTT protocols are selected, the XBee module is not initialized, and the data are transmitted via the chosen protocol. In this case, the microcontroller is not placed into sleep, but instead resumes the data acquisition cycle, starting again from the ambient light evaluation stage.

4.2.1. Calibration Procedure and Measured Values Calculation

To calculate the solar radiation power, we relied on the voltage and current values measured at the terminals of the wireless sensor’s photovoltaic panel. Since the output power of a solar panel is strongly influenced by cell temperature, an additional temperature sensor was placed at the solar cell level. This enabled the computation of a temperature-corrected solar radiation power value.
The first stage of the estimation algorithm involves determining the maximum power that the solar panel can deliver at a given time. For this purpose, a Maximum Power Point Tracking (MPPT) method was implemented. In the initial step, the charging circuit of the supercapacitors or battery is disabled to prevent energy diversion and ensure that the measurement remains unaffected. During this phase, the system is powered exclusively from the battery. Next, the DAC applies a sequence of incremental load steps, each corresponding to a specific current draw from the photovoltaic panel. For every load step, the panel terminal voltage is measured. The product of the applied current and the corresponding voltage yields the power delivered at that step. After completing all load steps, the maximum power value is extracted, representing the MPPT operating point of the system at that moment.
In parallel, the solar panel temperature is recorded so that both the maximum power and the corresponding cell temperature can be used in the solar radiation power estimation process. To establish the relationship between these parameters, industrial-grade solar irradiance sensors were employed alongside laboratory grade data acquisition equipment, as detailed in Section 5. These instruments simultaneously measured solar radiation power and solar cell temperature, while the wireless sensor provided its own maximum panel power and cell temperature values. Based on the extended dataset obtained, a comparative analysis was carried out.
From this analysis, a third-order polynomial model was derived to estimate solar radiation power as a function of the wireless sensor’s maximum panel power and its cell temperature. The dataset used for model generation included measurements of irradiance, solar panel output power, and cell temperature acquired during controlled laboratory and outdoor experiments. Using MATLAB, polynomial regression was applied to determine the optimal fitting function that minimizes the mean squared error between the estimated and reference irradiance values. Several polynomial orders were tested, and the final model (third order) was selected based on the best trade-off between fitting accuracy and model complexity. The resulting polynomial coefficients were then implemented in the embedded firmware of the wireless IoT sensor to enable real-time irradiance estimation directly from electrical and thermal measurements. The polynomial for estimating the solar radiation power as a function of the power generated by the wireless sensor’s solar panel and the temperature at the level of its solar cell is given as follows:
P Solar   =   0.0024 · T Cell 3 0.3392 · P MPPT 3 + 0.0085 · P MPPT · T Cell 2 + 1.2227 · P MPPT 2 · T Cell + 0.218 · T Cell 2 42.2376 · P MPPT 2 3.4057 · P MPPT · T Cell 4.6531 · T Cell + 321.674 · P MPPT + 28.7679
where:
P Solar represents the solar irradiance value in W/m2,
P MPPT is the maximum power generated by wireless sensor cell in W,
T Cell is the temperature of the wireless sensor cell in °C.

4.2.2. Measurement Data Acquisition Architecture

The polynomial model for estimating solar radiation power has been integrated into the microcontroller’s algorithm. Thus, the computed value will be transmitted, alongside other relevant parameters, through the available communication interfaces and supported communication protocols to the designated gateway device.
As previously outlined in the preceding section, our wireless irradiance sensor platform supports multiple communication protocols and interfaces:
  • Modbus RTU, via the RS-485 serial interface, is implemented with the device operating as a slave within the Modbus communication topology, allowing it to be interrogated by a master device. All measured values are continuously updated in the internal memory of the device and made available in the form of holding registers or input registers;
  • Modbus TCP, through the Wi-Fi interface of the ESP32 microcontroller, is also supported, with the device operating as a slave within the Modbus communication topology and being interrogated by a Modbus TCP master device. The same memory map containing the measured values available for Modbus RTU is employed for the Modbus TCP protocol as well;
  • MQTT, via the Wi-Fi interface of the microcontroller, is implemented with the device operating as a client that can connect to an MQTT broker, subscribe to a topic, and publish the measured values. Another client subscribing to the same MQTT topic can then receive the values transmitted by the sensor;
  • A custom binary serial protocol, implemented within the microcontroller’s algorithm, utilizing the ZigBee interface to send data to an aggregator (further described below).
A data aggregator was integrated into the system to enable the acquisition of measurements from the wireless irradiance sensor through the ZigBee interface. Our aggregator choice was a Raspberry Pi 5 single-board computer (SBC) equipped with an XBee3 module connected via a USB–UART adapter. A Python-based server running on the aggregator continuously receives sensor data over ZigBee, processes the incoming frames, and sends the results to a structured SQL database server (we used the open-source MySQL solution for this purpose due to its popularity, availability of libraries and administrative tools). To ensure robust transmission over the error-prone UART channel, binary structure-based encoding was adopted together with a lightweight byte-stuffing protocol. Each sensor packet was represented as a sequence of primitive data types, with a reserved magic byte used to delimit frames and an escape mechanism employed to avoid ambiguity. This protocol was deliberately designed to be compact and easily implementable through a simple state-machine approach.
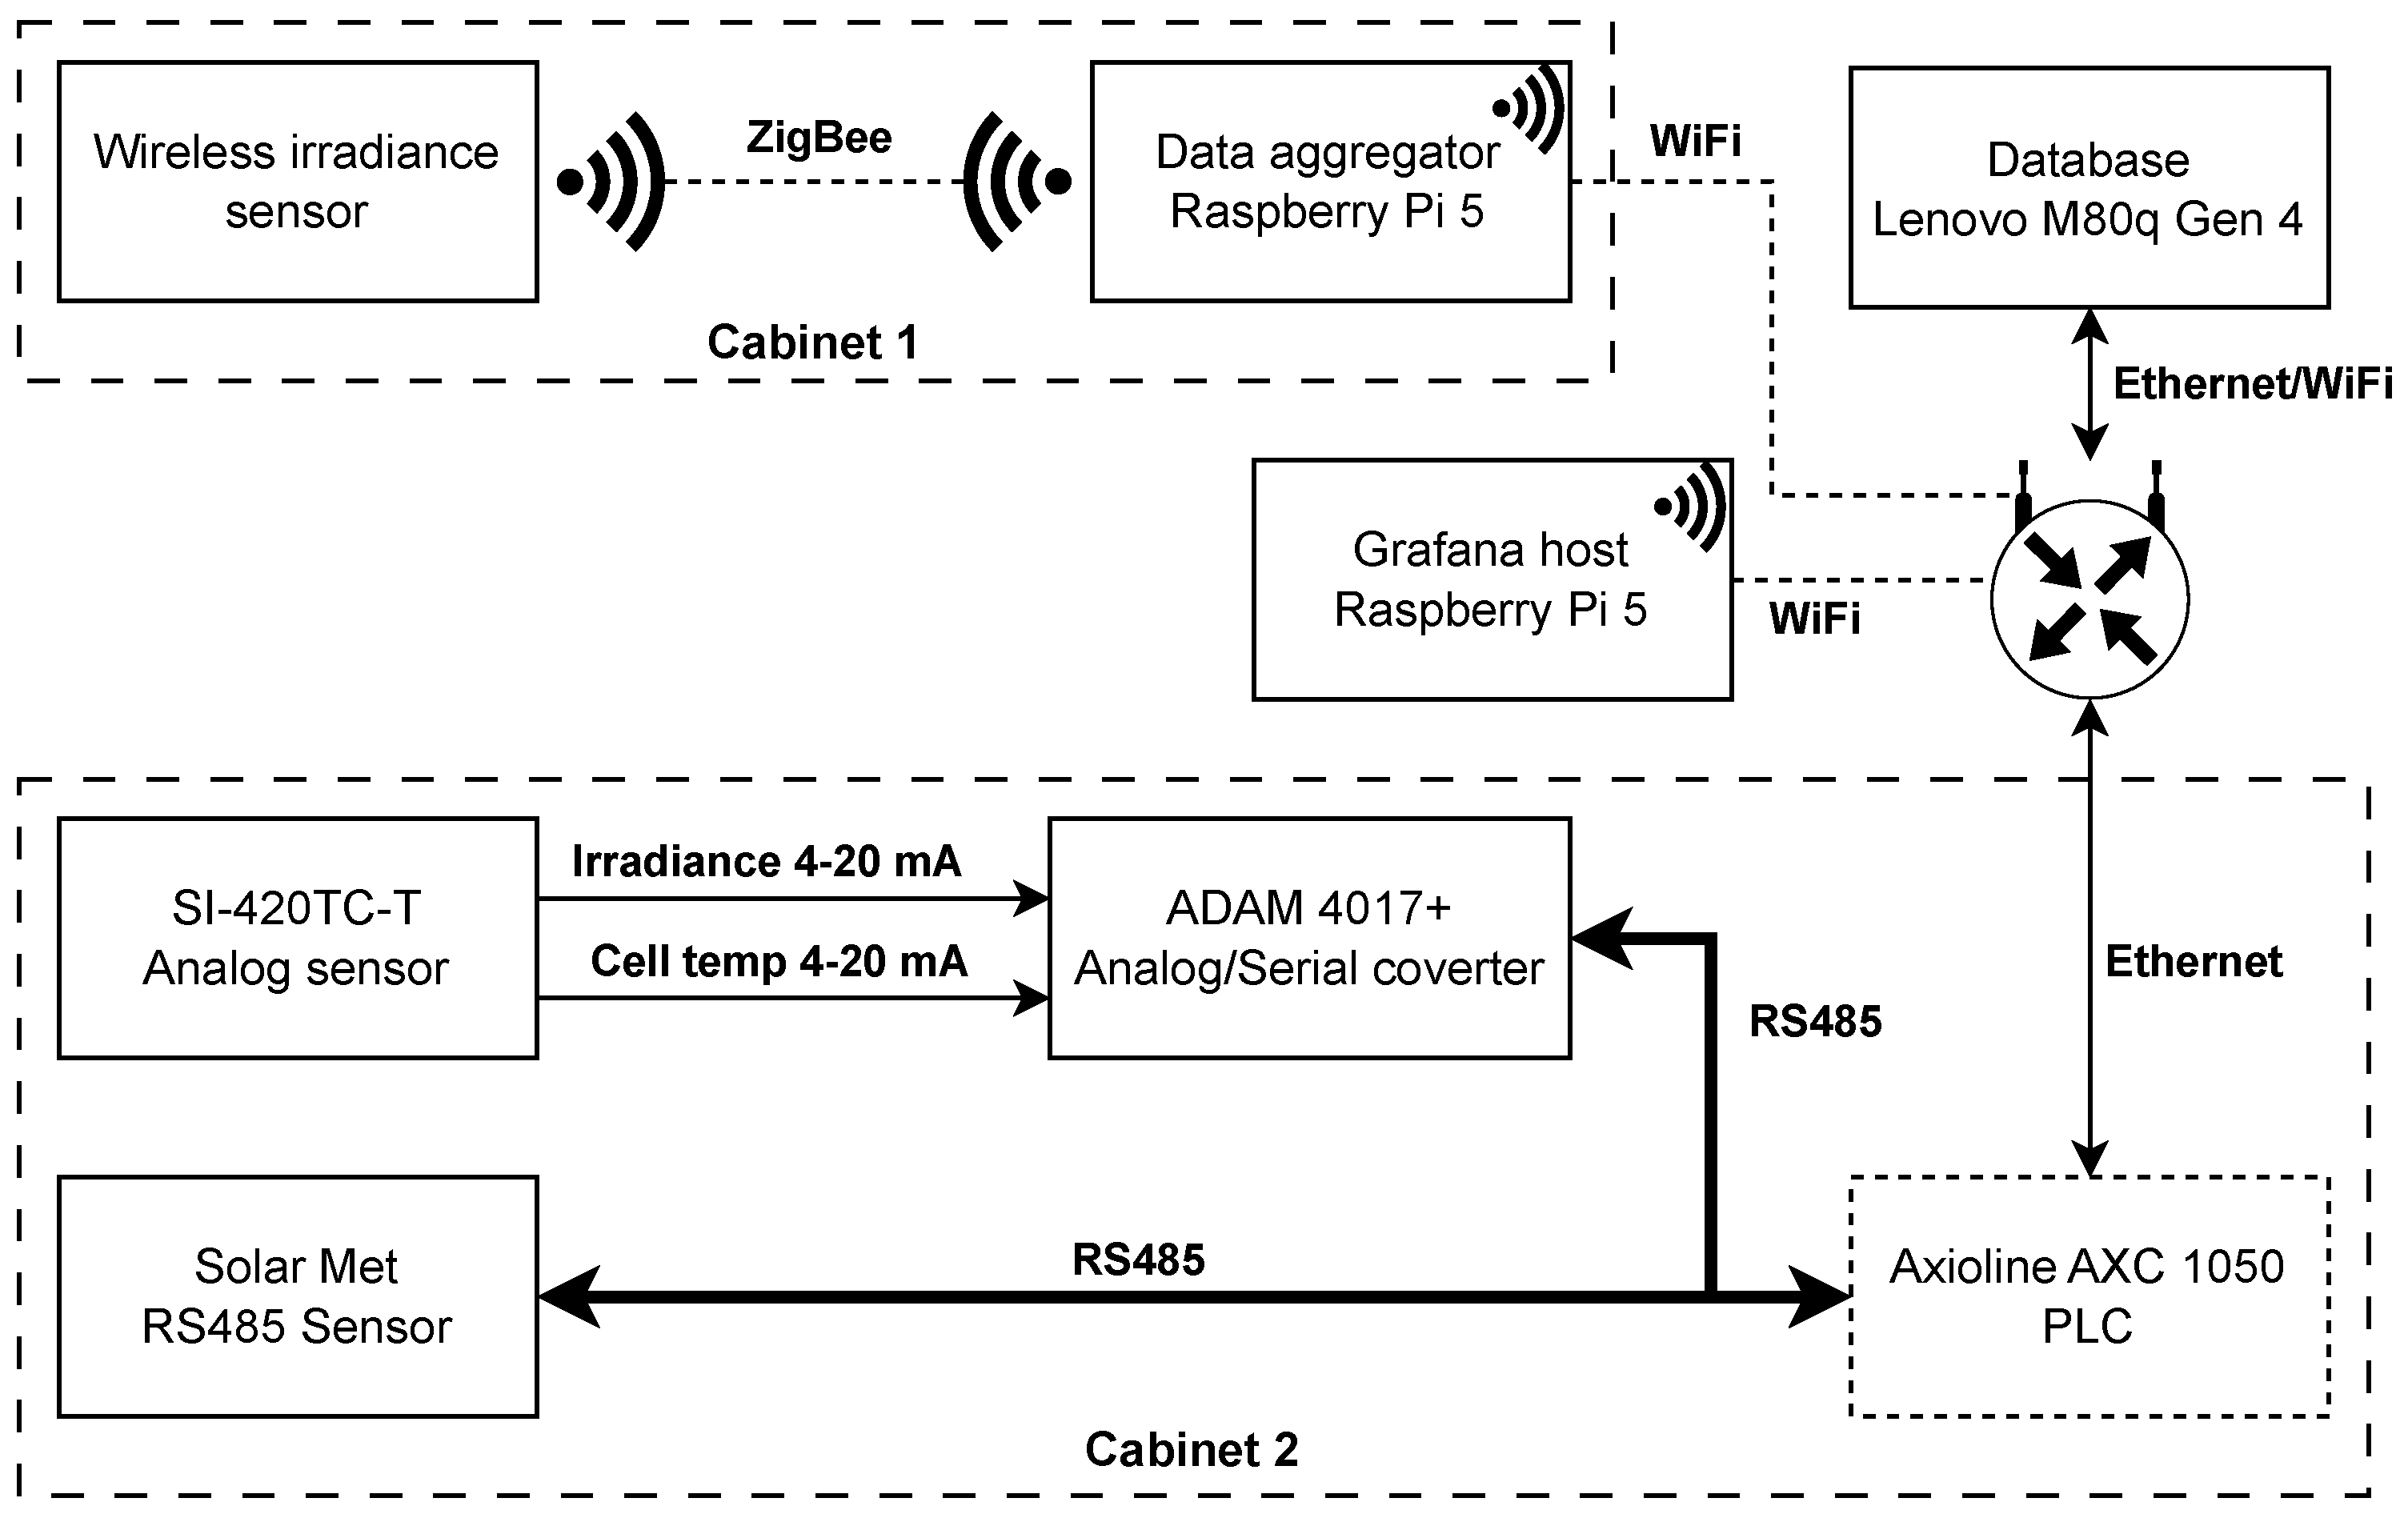
The architecture was developed in analogy to industrial Supervisory Control and Data Acquisition (SCADA) systems, with each subsystem fulfilling a distinct role. As a database server (i.e., “SCADA historian” functionality), we used a small form factor computer, a Lenovo ThinkCentre M80q Gen 4 equipped with a 13th Gen Intel Core i5 processor, 16 GB of RAM, and a 512 GB SSD and running Microsoft Windows 11 for simplicity of administration (though primarily employed as SQL database, we also used it for doing functionality validation and data analysis during the experiments). To maintain a separation of concerns, the data visualization was carried out on a separate device, another Raspberry Pi 5 SBC running Grafana under the latest Raspbian Linux OS (13 May 2025), providing a lightweight yet efficient operator interface. Communication between the components was established through a local network router supporting both Ethernet and Wi-Fi connections. This modular design facilitates efficient data acquisition, storage, and visualization, while ensuring scalability and adherence to the principles of industrial monitoring systems. Figure 5 illustrates the communication architecture of our proposed system.
As for the software integration of the Modbus protocols (for both RTU and TCP variants) on the ESP32 microcontroller, we imported the Modbus-ESP8266 library [41]. For validating the Modbus functionality of the device, we used the Modbus Poll [42] utility (ver. 10.9.4). For the integration of the MQTT protocol, we integrated the PubSubClient [43]. Testing was conducted by installing Mosquitto [44] on the Raspberry Pi 5 aggregator used during the experiments, where Mosquitto acted as the MQTT broker. On the MySQL database server, we employed the MQTT Explorer [45] application, a MQTT client developed for Windows operating systems, to verify and monitor the transmitted data.

5. Experimental Setup and Testing Procedure

Testing of our solution was performed in the electronics laboratory of the Faculty of Automatic Control and Computers, National University of Science and Technology POLITEHNICA, Bucharest. The power supplies, functional blocks, and communication blocks were first checked independently. Once the hardware design was validated, we integrated and tested them together to confirm the correct operation of the entire equipment as a whole. Finally, the field tests were conducted near Bucharest (Cornetu village, Ilfov county), on an open site with a total area of approximately 500 m2. The irradiance sensors used during the tests were installed at the center of the field, ensuring minimal shading effects from the surrounding buildings.
The ADC circuit was verified using a Keithley 2000 bench multimeter connected to the ADC inputs. Currents and voltages were generated using laboratory equipment in the full measurement range, and the results obtained from the bench multimeter was compared with the results measured by the ADC. A National Instruments USB-6009 [46] data acquisition module was also employed during the initial phase of testing. However, for improved accuracy, all subsequent tests were conducted using Keithley 2000 multimeters, which allow connection to a computer via a serial communication interface and support automated data acquisition through the LabVIEW (ver. 2024 Q1) based data acqusition software.
The device’s autonomy was evaluated using several power supply configurations: four Vishay MAL222591008E3 supercapacitors connected in series, providing an effective capacity of 97 mA/h; a 12 V, 7 Ah lead–acid battery SLA (sealed); and an 11.1 V, 2.7 Ah Li-Po battery. All power sources were integrated with the wireless irradiance sensor board inside a waterproof distribution enclosure. The photovoltaic panel of the wireless irradiance sensor was connected to this enclosure via a 3-m cable. For solar cell temperature measurement, the dedicated temperature sensor was mounted on the rear side of the panel using thermal paste to ensure efficient thermal coupling, and fixed in place with high-temperature-resistant adhesive.
Our sensor was calibrated and benchmarked against two commercially available industrial irradiance sensors, namely INGENIEURBÜRO Si-420TC-T [47], and Atersa Solar MET Rad-Tcell-Tamb [48]. The Si-420TC-T sensor provides measurements of solar radiation power and the temperature of its solar cell, both delivered as analog signals in the 4–20 mA range. In addition to these parameters, the Solar MET sensor also reports ambient temperature and is equipped with an RS-485 communication interface, employing the Modbus RTU protocol.
For the initial tests and calibration of the sensor, experiments were conducted both in the laboratory and on the faculty rooftop. A LabVIEW application was developed to acquire data from the industrial irradiance sensors as well as from the wireless irradiance sensor, and to log all measurements into a MySQL database hosted on a Lenovo computer. To evaluate the output of the Si-420TC-T sensor, which provides an analog 4–20 mA signal, the sensor was interfaced with two Keithley 2000 multimeters. The LabVIEW program sequentially sampled each multimeter and recorded both irradiance and solar cell temperature values obtained from the industrial sensor. The relationship between the measured current values and the corresponding irradiance and temperature was determined using the calibration formulas specified in the manufacturer’s datasheet. The LabVIEW application was configured for continuous acquisition, with each measurement logged into the database immediately after sampling, resulting in a temporal resolution of approximately one second between successive records.
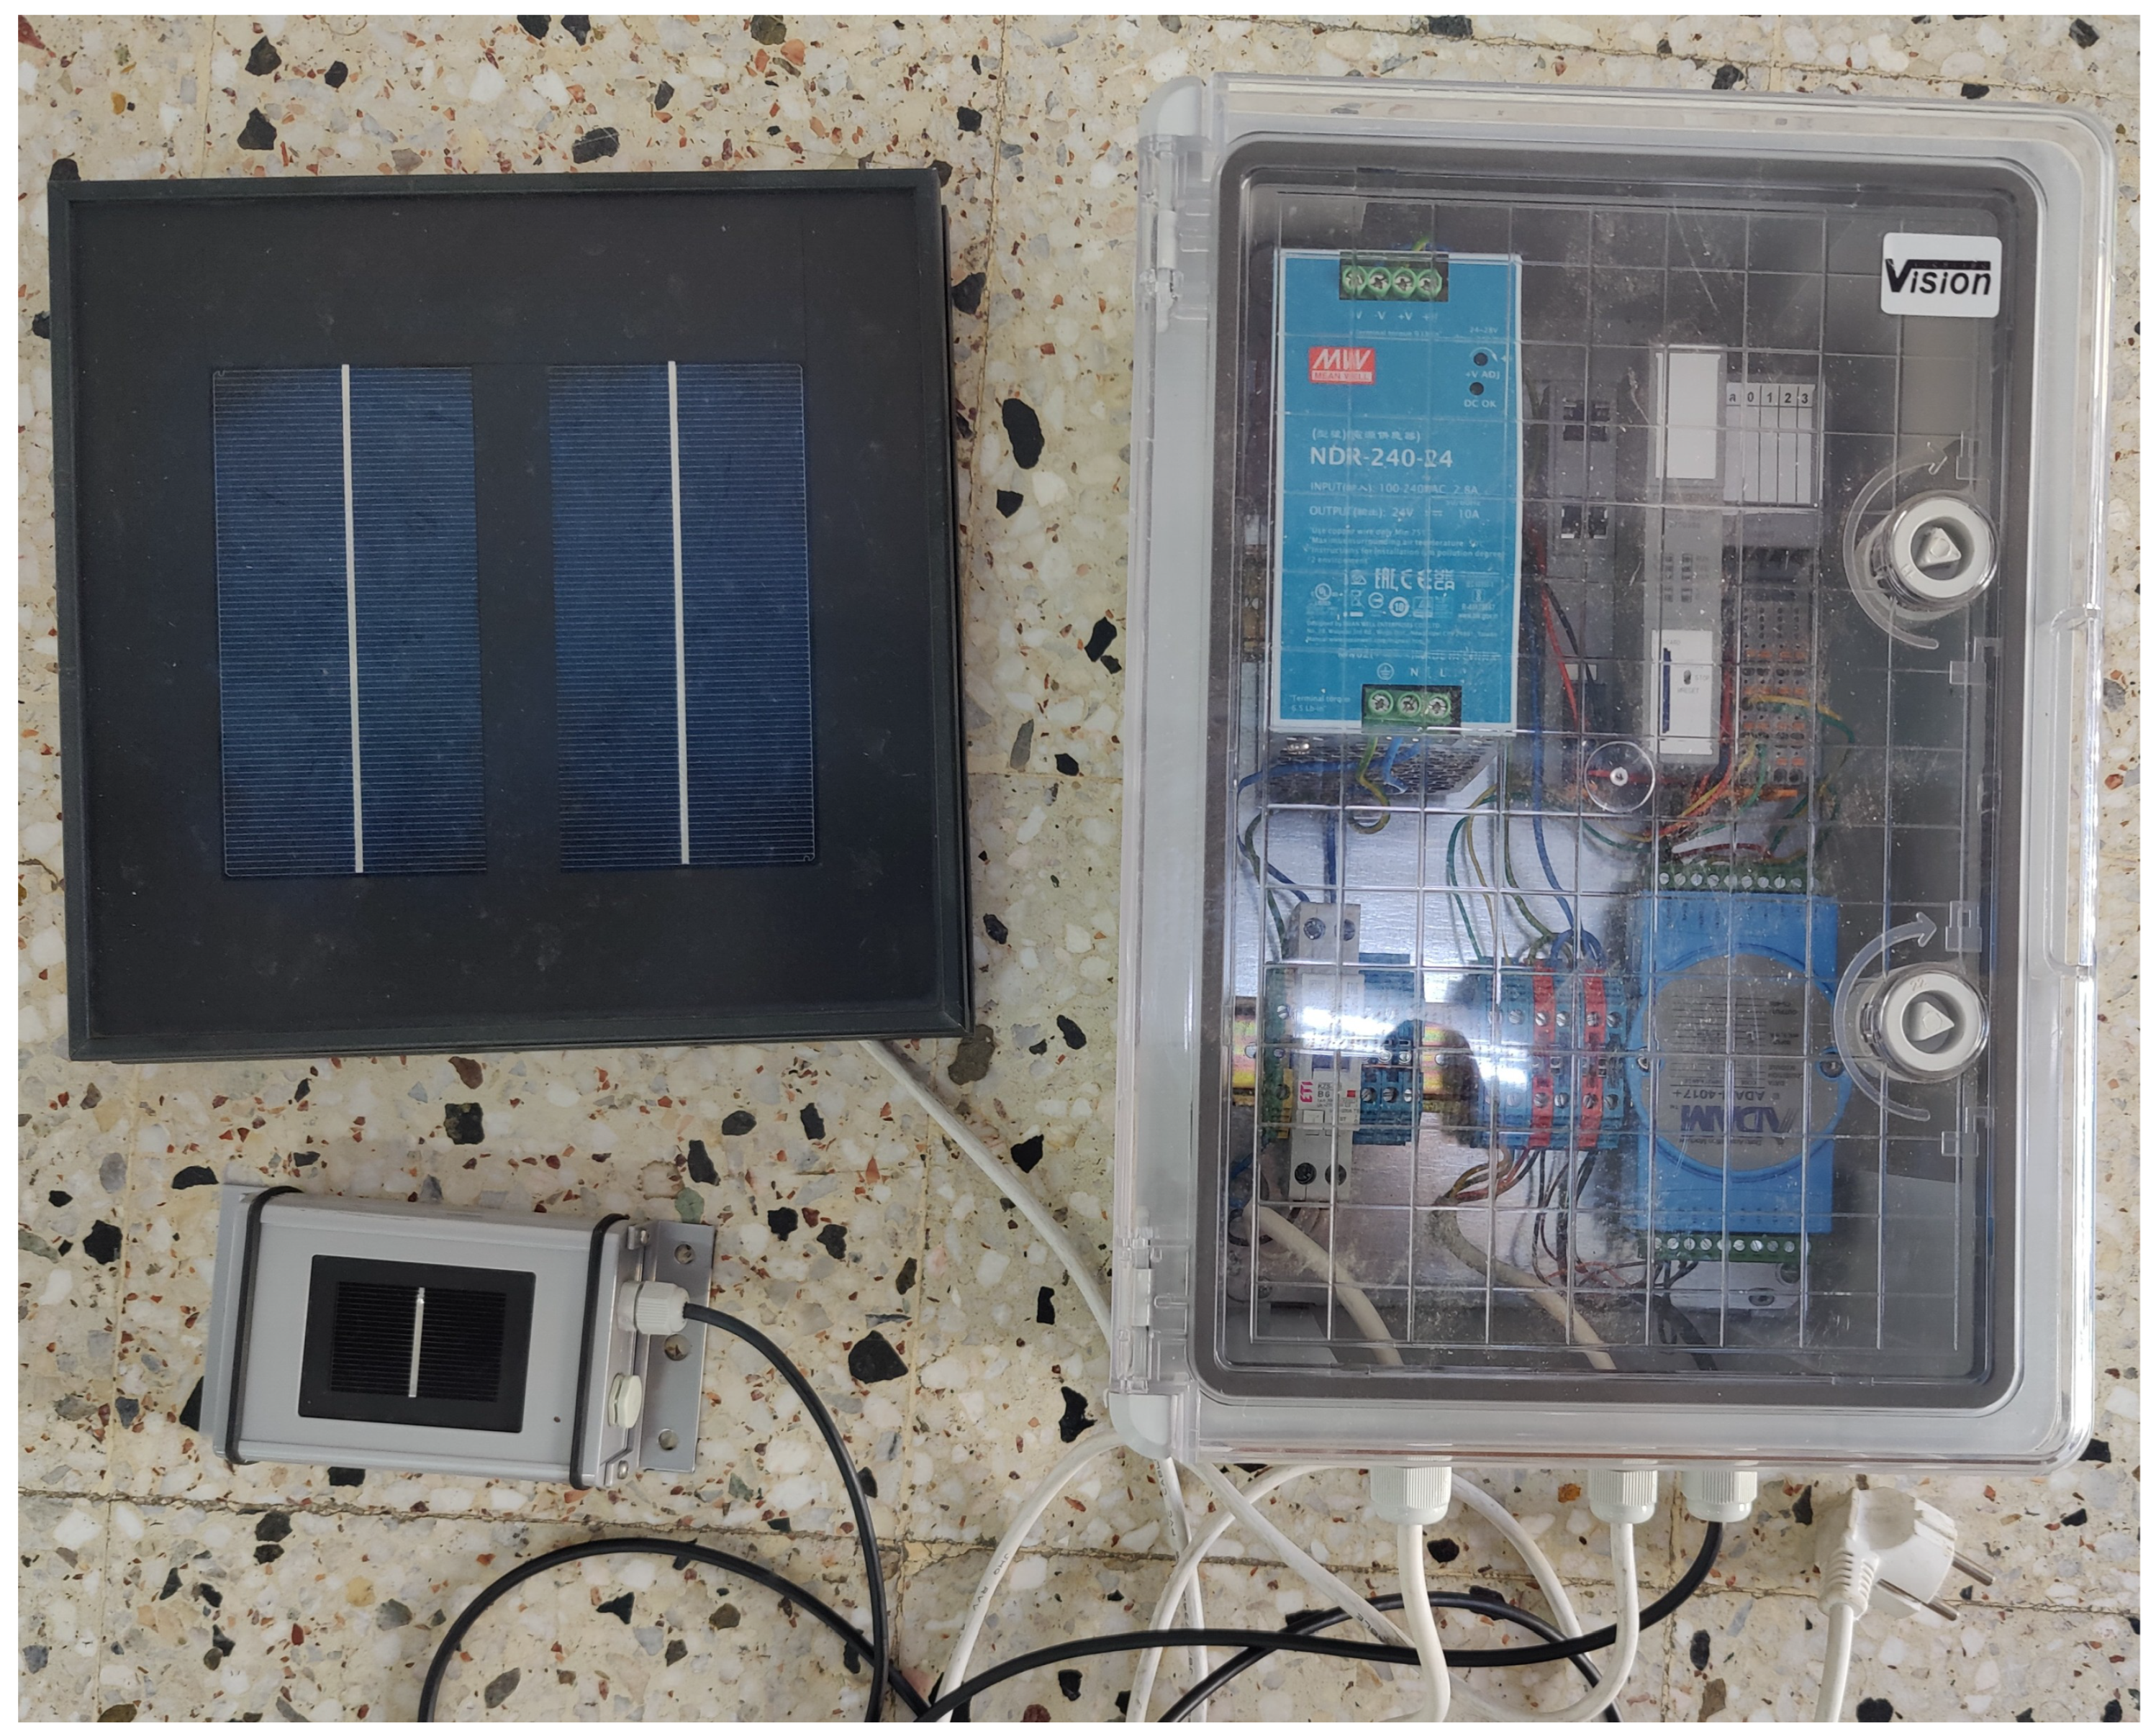
For the field testing, a Phoenix Contact Axioline AXC 1050 PLC (Programmable Logic Controller) [49] and an Advantech ADAM 4017+ analog signal (for the analog solar irradiance sensor) to Modbus RS-485 converter [50] were mounted in another waterproof distribution panel. This enclosure was installed alongside the cabinet housing the wireless irradiance sensor beneath a support structure approximately 1 m in height. The structure serves a dual purpose: it provides mechanical support for the industrial irradiance sensor and the solar panel of the wireless sensor, while also shading both electrical enclosures to prevent overheating of the internal equipment due to direct solar radiation. Figure 6 illustrates the setup for the data acquisition box. In Figure 7 we have represented the high-level architecture for the testbench.
The AXC 1050 PLC was programmed using the Phoenix Contact PC WORX software (ver. 6.30.3146) to acquire the measurements provided by the Solar MET sensor and the ADAM 4017+ converter via an AXL F RS UNI 1H RS-485/RS422/RS232 module. All three devices were interconnected on a common RS-485 bus. The PLC algorithm was developed using Function Block Diagram (FBD) programming and dedicated libraries for data acquisition from the RS-485 module and for database connectivity. Its role is to continuously read the data supplied by the Advantech converter and from the Solar MET sensor, convert and process these data, and insert them into the database hosted on the computer functioning as the Historian. Data acquisition runs sequentially in a continuous loop, with logging into the database at a predefined 5 s period during tests.
The equipment was deployed in the field for several weeks, during which continuous data acquisition was carried out. The batteries of the wireless sensor were alternately replaced to evaluate the system’s performance with each power source. Following the calibration stage and laboratory tests, the sensors were installed under real operating conditions, as described in the previous sections.

6. Results

After several weeks of operation, during which solar radiation power was continuously measured, the acquired data were analyzed and a comparative assessment was performed between the wireless sensor and the industrial reference sensors.

6.1. Irradiance and Cell Temperature Measurement

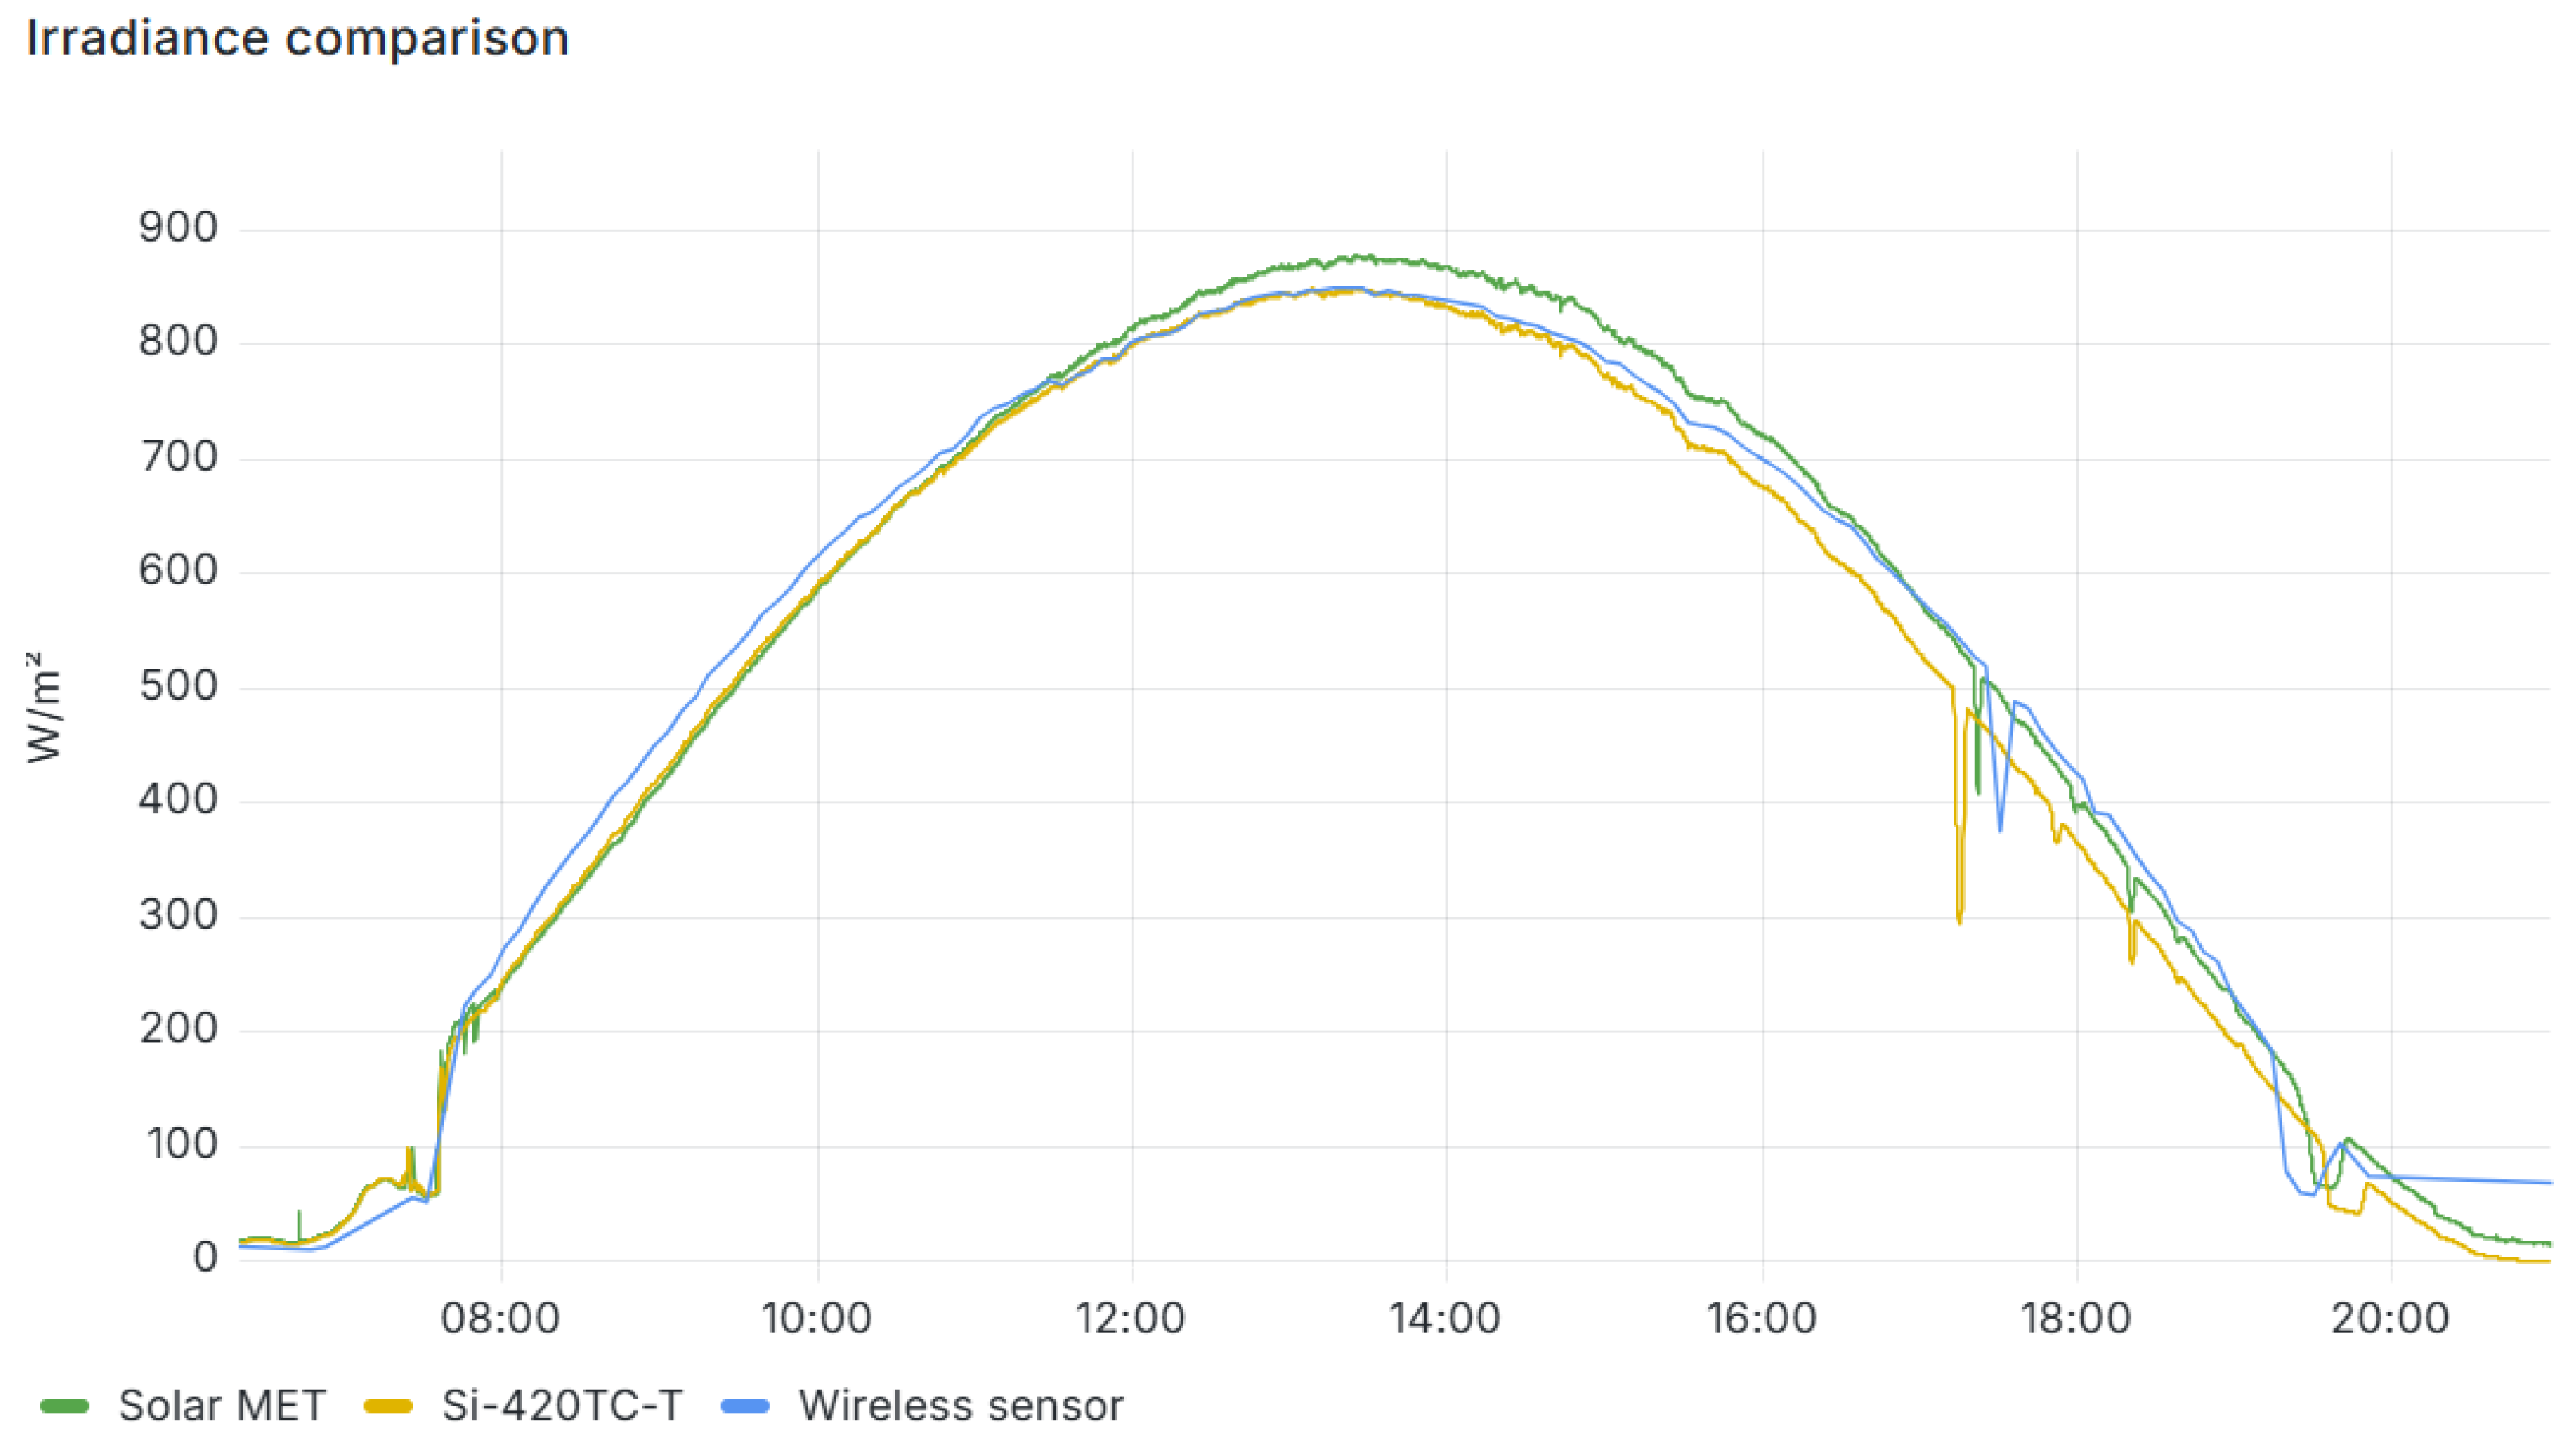
Figure 8 illustrates the solar radiation values recorded by three sensors: the proposed wireless sensor and the two industrial reference sensors, Solar MET and Si-420TC-T. A strong correlation can be observed among the three irradiance curves, with smooth variations over time. We specifically selected this day 24 July 2025, because it was predominantly sunny, with minimal cloud cover, ensuring that all three sensors were consistently exposed to solar radiation.
On this day, the wireless irradiance sensor operated using a supercapacitor-based energy supply. This explains its behavior: initiating in the morning, transmitting data, and then switching to a low-power sleep mode.
The first data transmission occurred at 6:52 a.m. Because irradiance was still weak and the supercapacitor voltage remained low, the sensor restarted one minute later but, detecting insufficient energy for reliable measurement and data transmission, reverted to sleep for 20 min. The system, specifically the microcontroller, reactivated at approximately 7:13, performed a new set of measurements, and successfully transmitted the results, as the supercapacitor voltage had risen to a functional level.
As irradiance increased, the wireless sensor maintained sufficient energy to perform measurements every 5 min throughout the day, until sunset. Once solar input ceased, the supercapacitor bank discharged, and the microcontroller switched to a two-hour nighttime sleep cycle.
The comparison of irradiance measurements across the three sensors revealed strong overall correlation. To better characterize this behavior, the day was divided into several intervals:
  • Until 8:00, the wireless sensor alternated between waking for short measurements and re-entering sleep, due to low energy availability. Values recorded around 6:20 closely matched the industrial sensors, but gaps appeared when the wireless unit slept. Once energy stabilized, alignment improved;
  • Between 8:00 and 11:30, the wireless sensor reported slightly higher values than the industrial references, though within a narrow margin;
  • From 11:30 to 15:00, correlation was strongest with the Si-420TC-T, the sensor used for calibration;
  • Between 15:00 and 19:30, the wireless unit tracked Solar MET more closely;
  • From 17:30 until 20:00, all three sensors detected transient drops and rises in irradiance, likely due to passing clouds. These fluctuations appeared phase-shifted between sensors, suggesting localized partial shading as the sun descended. Around 20:00, the wireless sensor made its final transmission before nightfall, when it entered 2 h night sleep mode due to supercapacitor discharge.
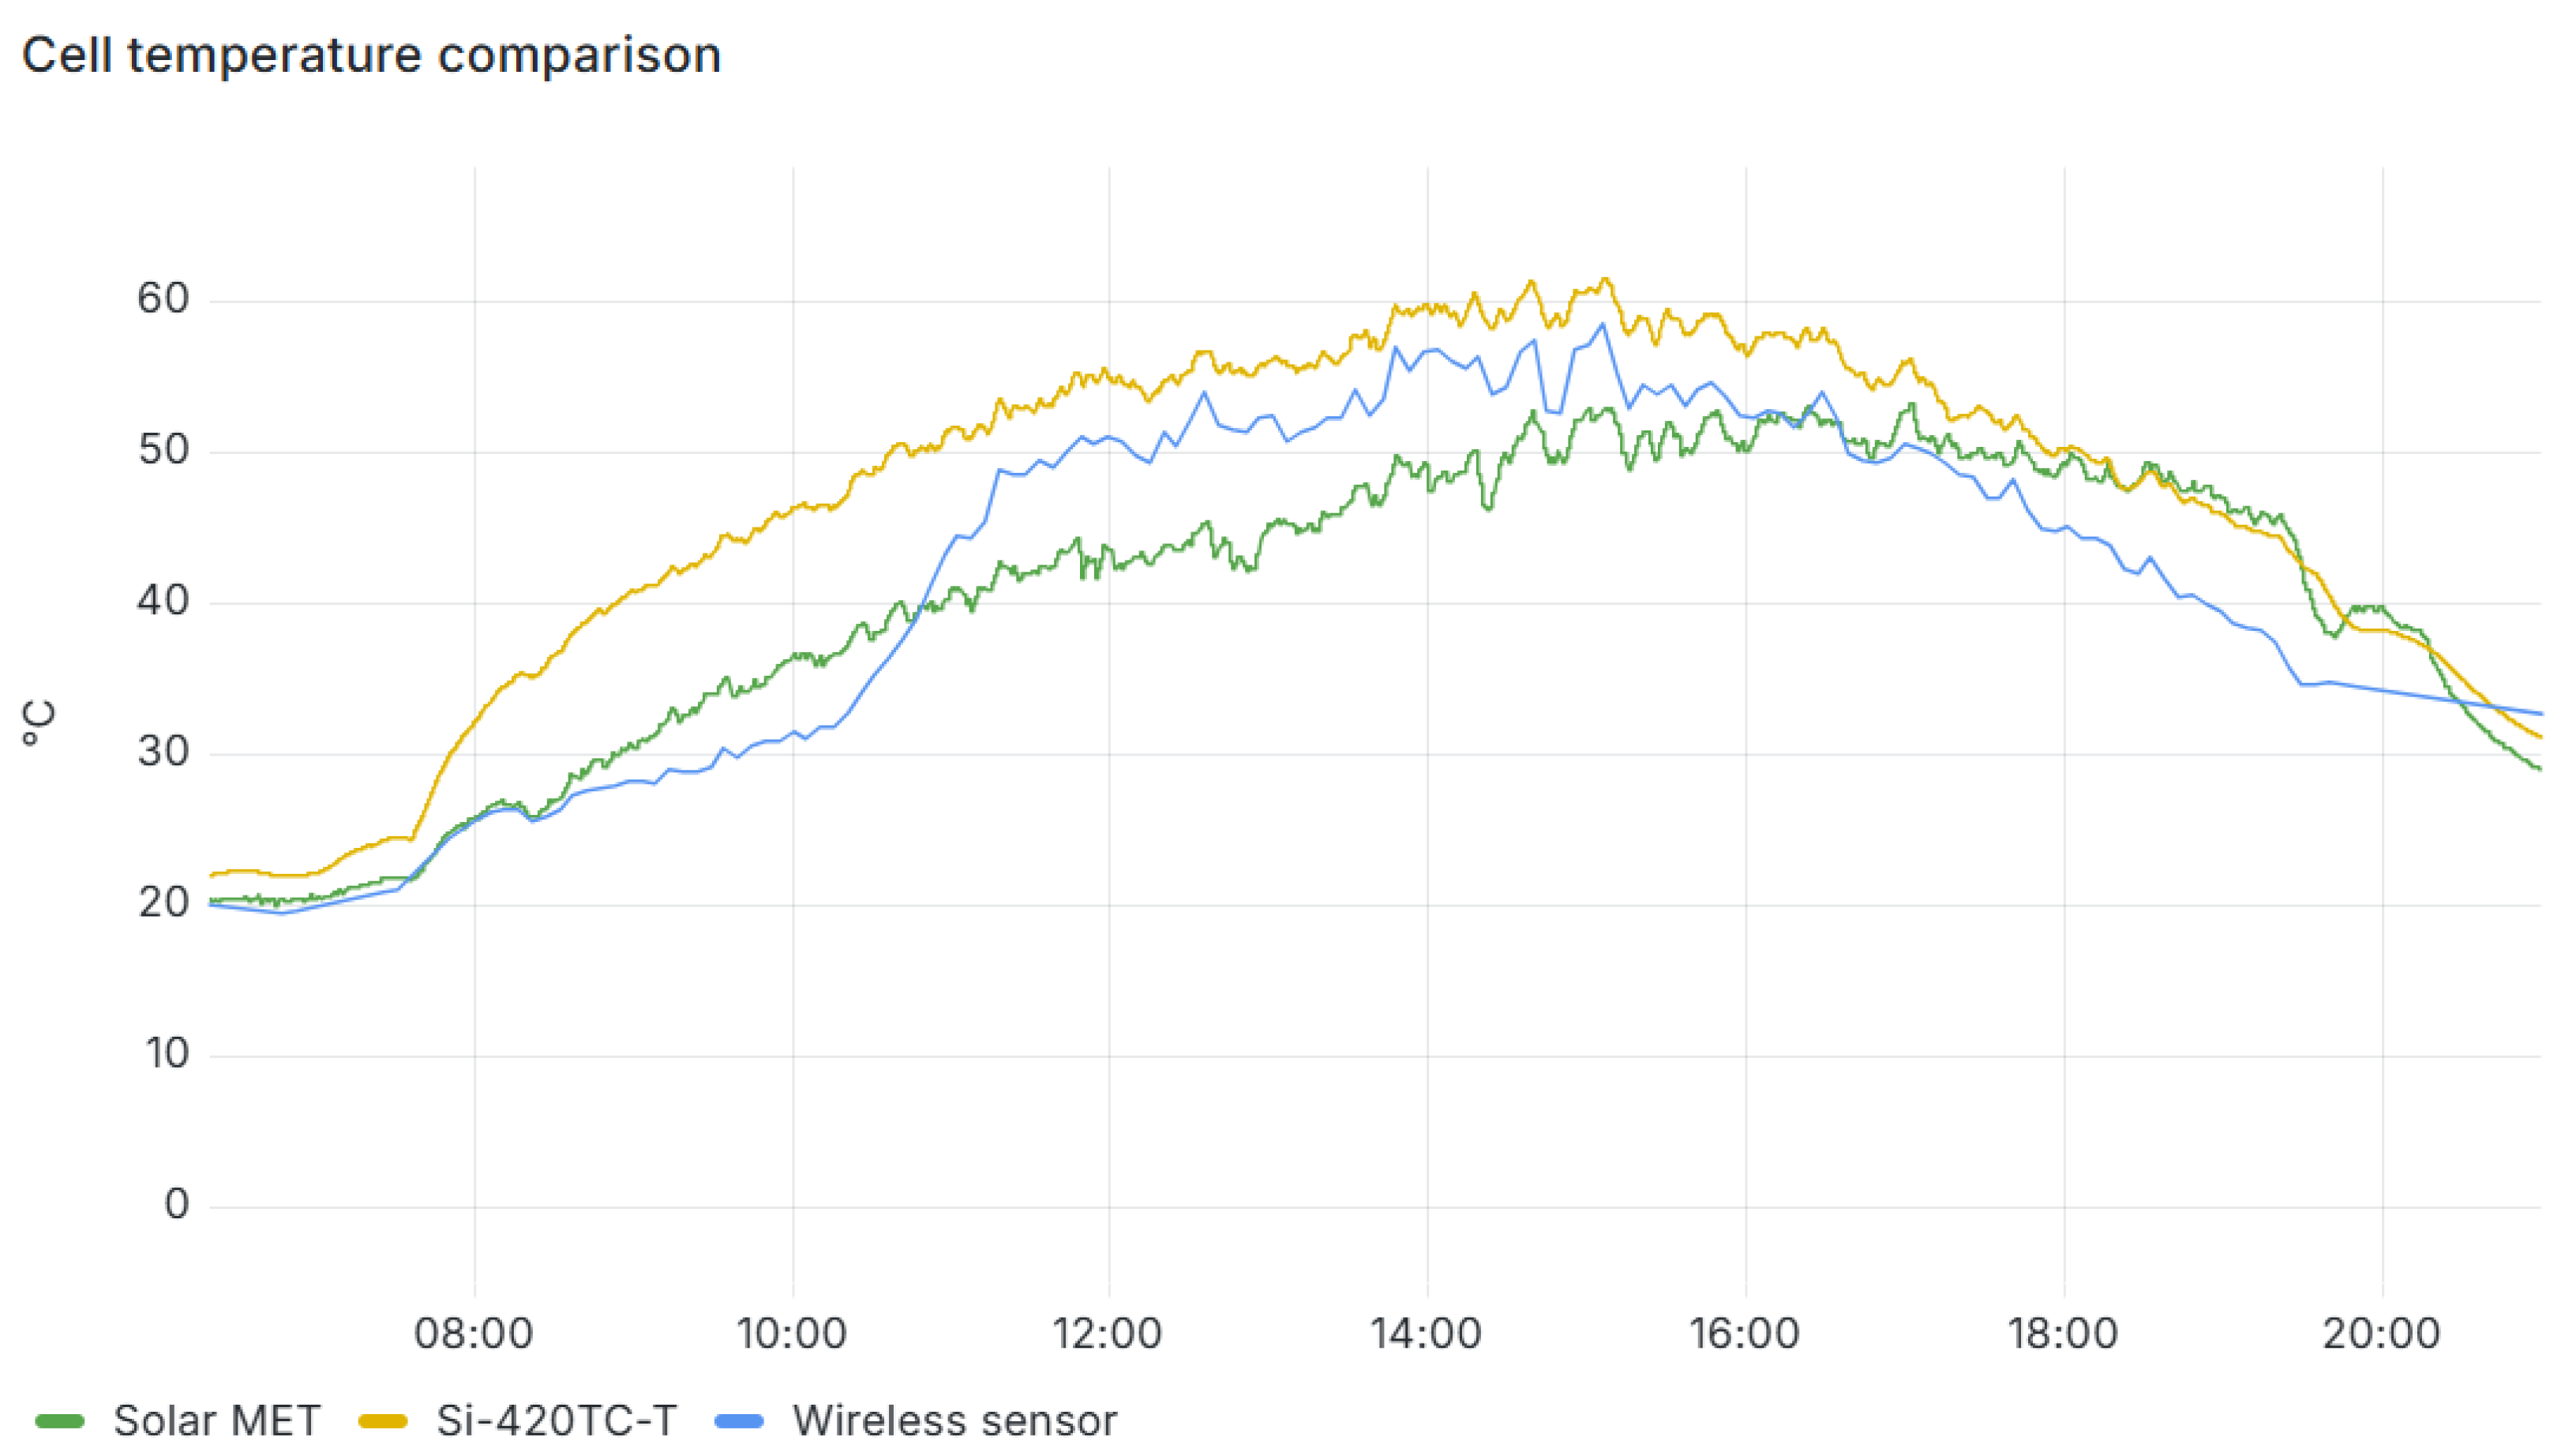
To analyze the cause of differences among the three sensors’ measurements, we also extracted the measured cell temperature values, to see how they correlate. We did this because, as described earlier, the cell temperature value of the wireless sensor is used as a parameter in the polynomial that determines the solar irradiance value based on the power generated by the solar panel. Figure 9 shows the variation of the solar cell temperature measured by the three sensors. A good correlation exists, particularly in the second part of the day. In the morning, however, a significant difference of about 10 °C is observed between the industrial sensors, while between 8:00 and 11:00, the wireless sensor reports lower cell temperatures than the others. Between 11:00 and 16:00, the wireless sensor’s cell temperature falls between the values of the other two sensors. After 16:30, the wireless sensor’s temperature drops more quickly than the others. This can be explained by construction differences:
  • In the wireless sensor, the temperature sensor is mounted on the back of the solar panel, with thermal paste ensuring direct thermal contact. The back of the panel is open, exposed to the ambient environment;
  • In the Solar MET sensor, the temperature sensor is integrated into the electronic circuit board on the back of the solar cell. Heating of nearby circuits may influence the measured temperature;
  • In the Si-420TC-T sensor, the cell temperature sensor is enclosed in a small aluminum case. Exposure to solar radiation heats the case significantly, which in turn raises the measured cell temperature. This explains why the Si-420TC-T reports the highest values.
From the temperature graph, and its correlation with the irradiance graph, it can be concluded that the polynomial estimation model of solar radiation based on electrical power and cell temperature performs accurately and consistently. Even though temperature readings differ among sensors, the irradiance values remain well correlated. Unfortunately, we cannot guarantee the correctness of the industrial sensors’ cell temperature measurements, since we do not know exactly how their temperature are thermally coupled to the solar cell. For our wireless sensor, however, we know with certainty that the cell temperature value is accurate, as the sensor was in direct contact with the cell through a high-performance thermal paste (Arctic MX-6), ensuring proper heat transfer.
To further validate the irradiance measurements of the wireless sensor, we extracted more samples from the database and calculated measurement errors relative to the industrial sensors. We calculated both the average percentage error over the sensor’s full measurement range (0–1200 W/m2) and the mean squared error (MSE), for each day, to assess daily variability.
First, the average percentage error was computed for a sunny day without clouds (24 July 2025), a cloudy day with strong and weak irradiance periods (19 July 2025), the two-week interval (13–25 July), and the full month of July. The formula used for each sample is given in (2), and the results are shown in Table 1. On the sunny day, the maximum error of the wireless sensor was 2% versus Si-420TC-T, and even lower versus Solar MET. On the cloudy day, errors rose slightly to 2.26%. Over two weeks, the average error was smaller than either single-day case. Over the full month, the average error was slightly larger than the cloudy day. These results show that sky conditions strongly influence measurement error: sunny days yield smaller errors, cloudy days slightly higher errors.
E r r o r [ % ] = I r r I S I r r W S I r r r a n g e × 100 %
where:
I r r I S represents one irradiance measurement (sample) from an industrial irradiance sensor, used as reference,
I r r W S represents one irradiance measurement (sample) from our wireless sensor,
I r r r a n g e represents the irradiance total measurement range of the wireless sensor (1200 W/m2).
Table 1. Irradiance measurement error over different time intervals and conditions.
Time PeriodIrradiance Measurement Error [%]
Error vs. Solar METError vs. Si-420TC-TAverage
Sunny day1.892.001.95
Cloudy day1.972.262.11
Two weeks1.211.331.27
One month2.222.282.25
We also analyzed the percentage errors across four daily intervals: sunrise–9:59, 10:00–15:59, 16:00–18:59, and 19:00–sunset. Results are presented in Table 2 (sunny day) and Table 3 (cloudy day). On the sunny day, the smallest errors occurred between 10:00 and 15:59, where wireless sensor values were closest to the Si-420TC-T. Between 16:00 and 18:59, average errors were higher (2.39%), with the smallest versus the Solar MET sensor. The largest errors occurred between 19:00 and sunset, when partial shading produced delayed variations among sensors. Larger morning errors also appeared, caused by the wireless sensor’s sleep intervals affecting sampling. On the cloudy day (19 July), the smallest average error occurred in the morning (sunrise–9:59). Midday (10:00–15:59) and evening (19:00–sunset) errors were similar, while afternoon (16:00–18:59) errors were higher. This reflects relatively stable irradiance early and late, but variability midday due to cloud movement.
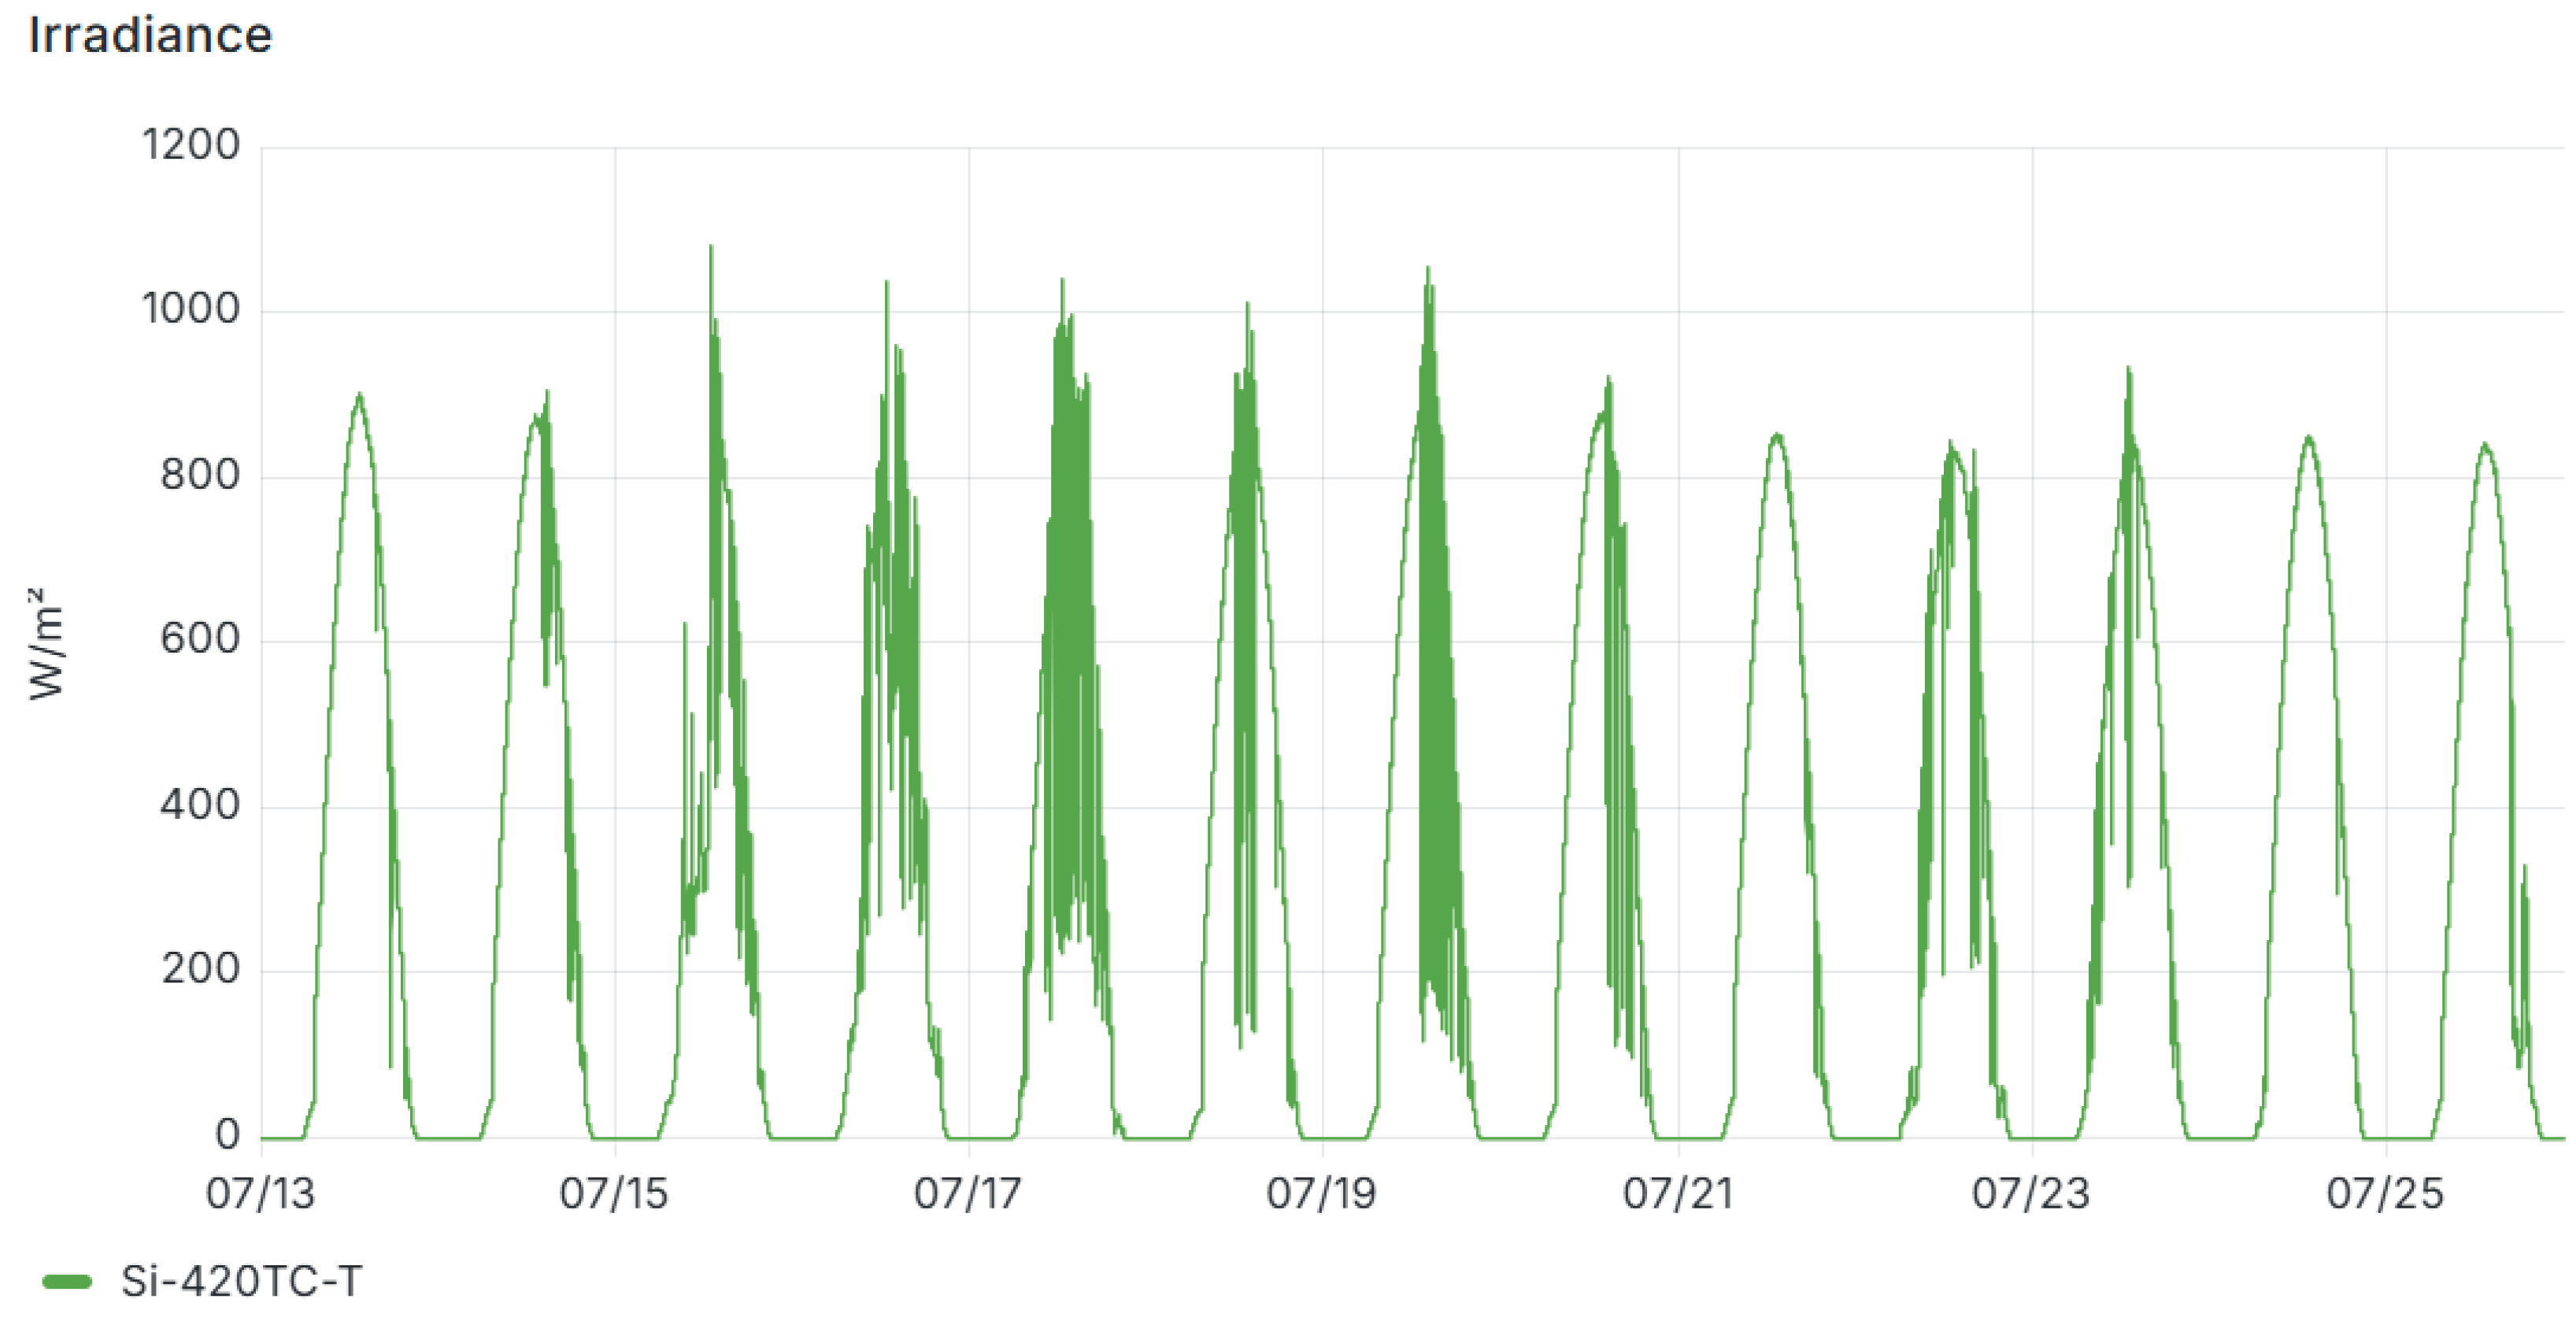
Figure 10 shows solar irradiance variation recorded by an industrial sensor between 13 and 25 July, illustrating the strong variability on 19 July compared to the stable irradiance on 24 July. From the error analysis, we found average percentage errors below 5% for the wireless sensor.
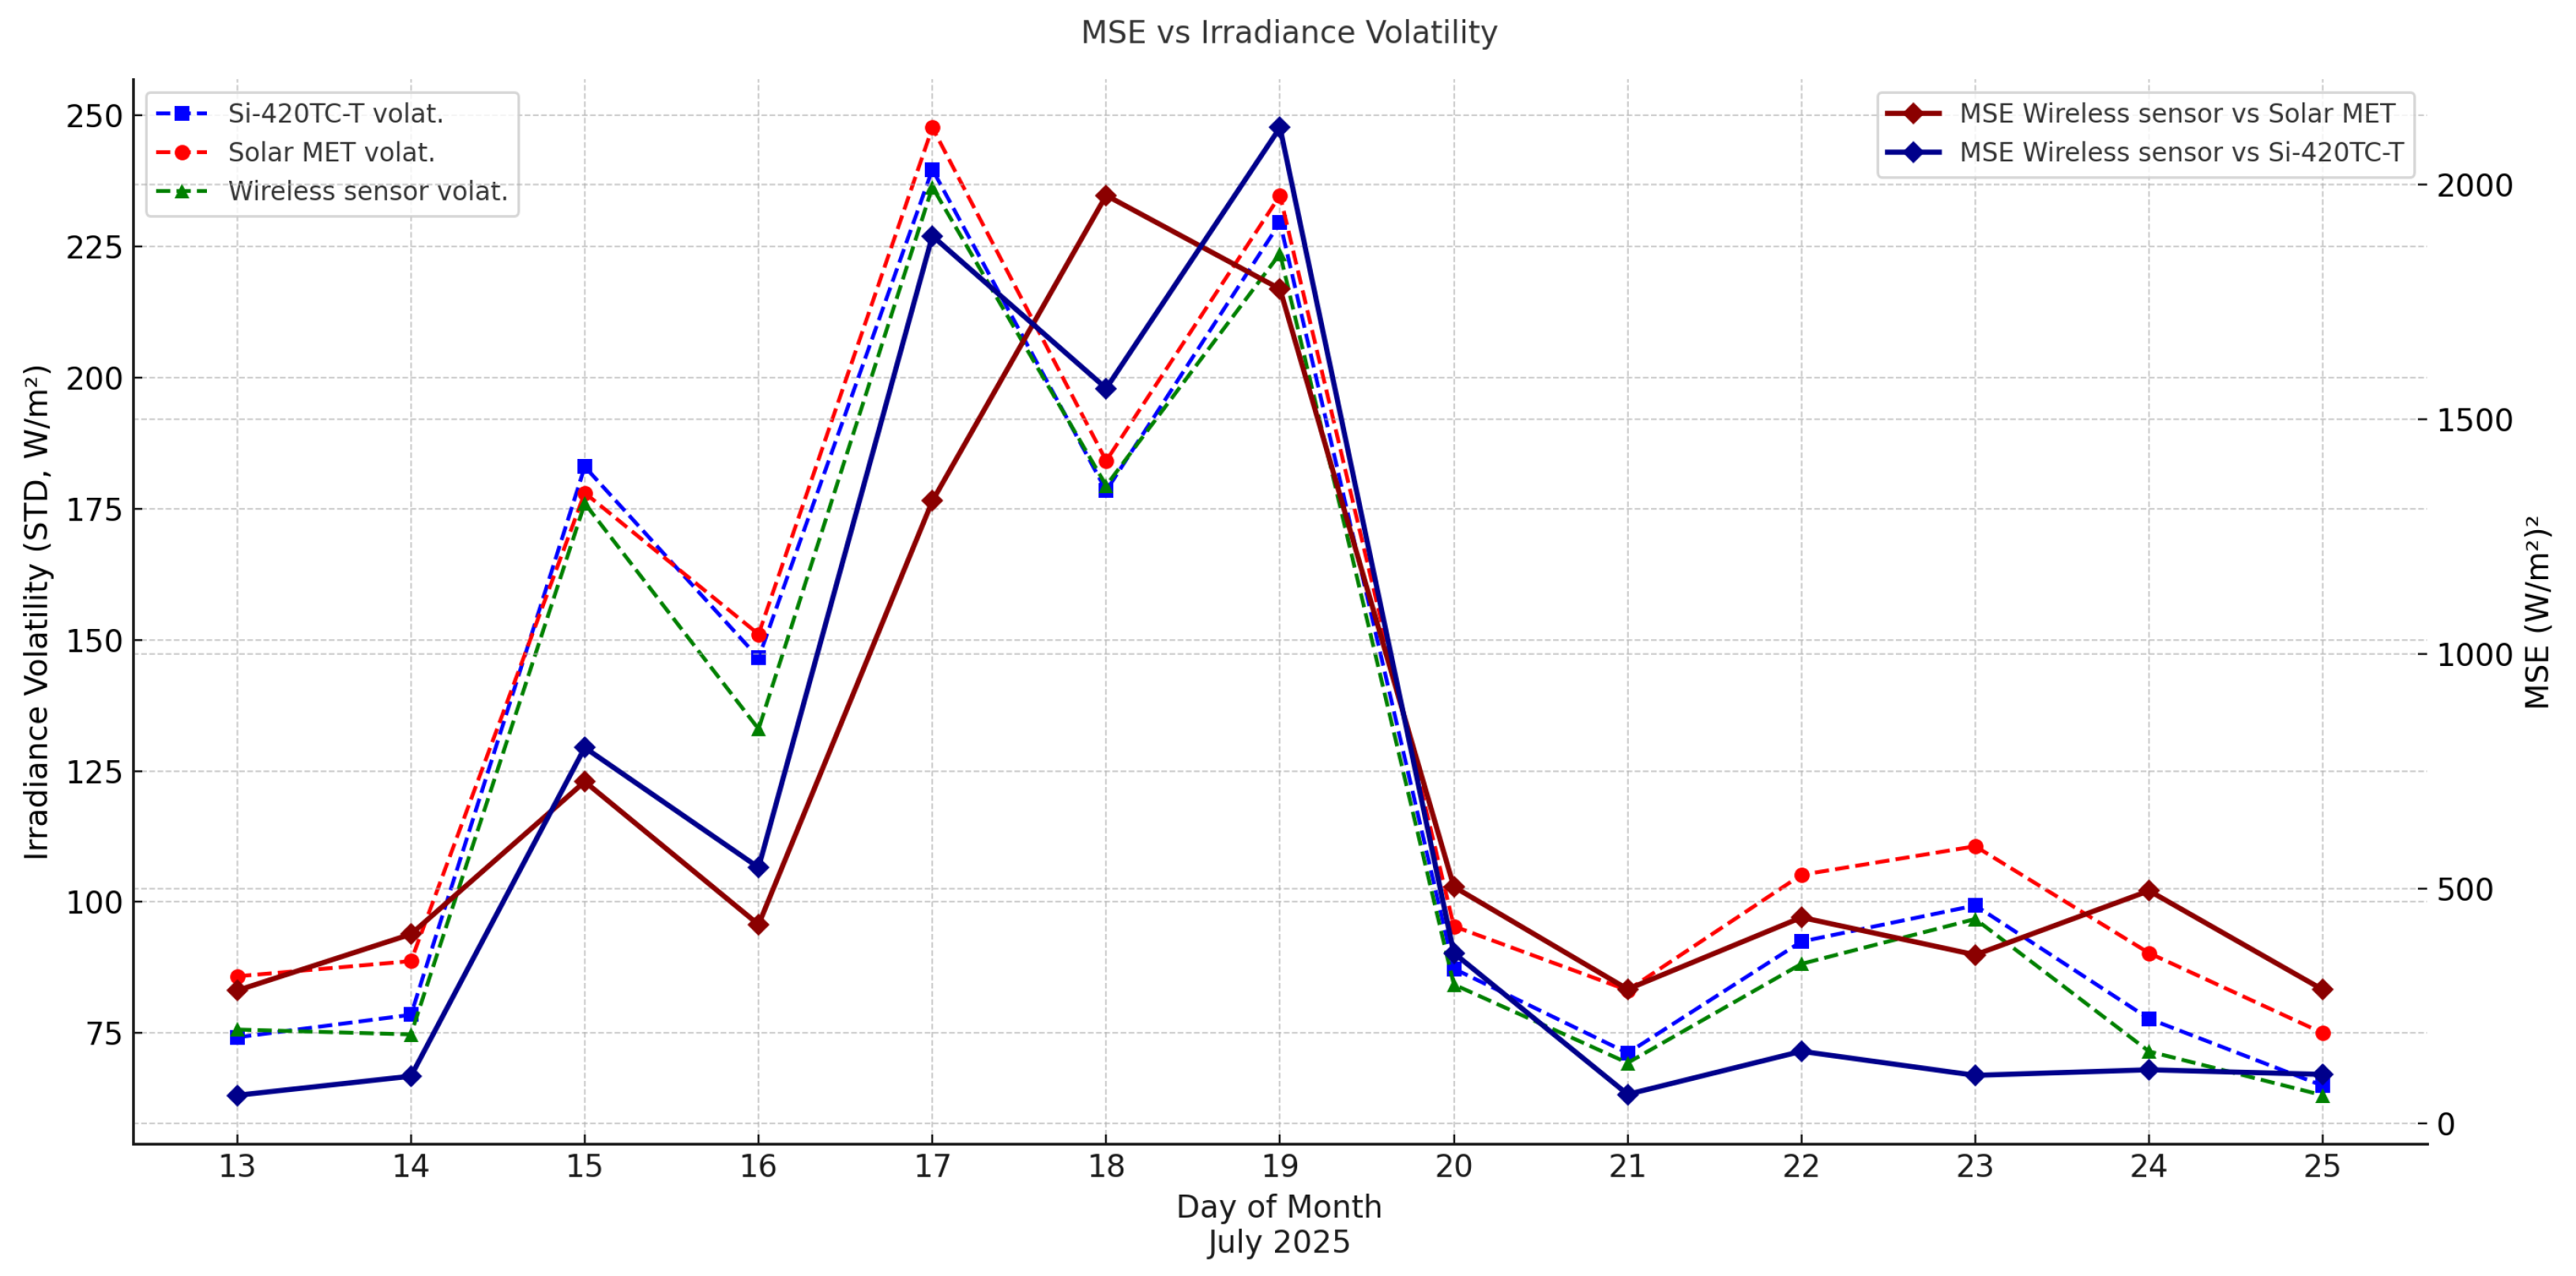
We also calculated the daily MSE (mean squared error) values using (3), plotted in Figure 11 against daily irradiance volatility, derived from standard deviation using (4) and (5). MSE was low on 13, 14, 20–25 July, but higher on 15–19 July, correlating with irradiance volatility. Thus, cloudy days with oscillating irradiance yielded higher errors.
Figure 11. MSE vs. irradiance volatility 13–25 July 2025.
Applsci 15 11059 g011
M S E WS   vs .   IS ( day )   =   1 N d i = 1 N d ( I r r W S ( i ) I r r I S ( i ) ) 2
where:
N d is the total number of irradiance samples for one day,
I r r W S ( i ) represents one irradiance measurement (sample) from our wireless sensor,
I r r I S ( i ) represents one irradiance measurement (sample) from one of the industrial sensors.
I r r ¯ S ( d a y ) = 1 N d i = 1 N d I r r S ( i )
where:
N d is the total number of irradiance samples for one day,
I r r S ( i ) represents one irradiance measurement (sample) from the analyzed sensor.
S T D S ( d a y ) = 1 N d 1 i = 1 N d I r r S ( i ) I r r ¯ S ( d a y ) 2
where:
N d is the total number of irradiance samples for one day,
I r r S ( i ) represents one irradiance measurement (sample) from the analyzed sensor,
S T D S ( d a y ) is the daily irradiance standard deviation for the analyzed sensor.
These results confirm the earlier percentage error analysis: cloudy days lead to higher errors, due to irradiance variability. We consider the main source of higher errors on cloudy days to be the different sampling rates: 5 min for the wireless sensor, 1 min for the industrial sensors, which are mains-powered and not energy-limited. Moreover, we do not know whether the industrial sensors report instantaneous irradiance or averaged values. Their irradiance data often showed hysteretic behavior, not responding instantly to irradiance fluctuations. This may also explain the discrepancies between their readings and the wireless sensor’s values.

6.2. Ambient and Internal Temperature Measurement

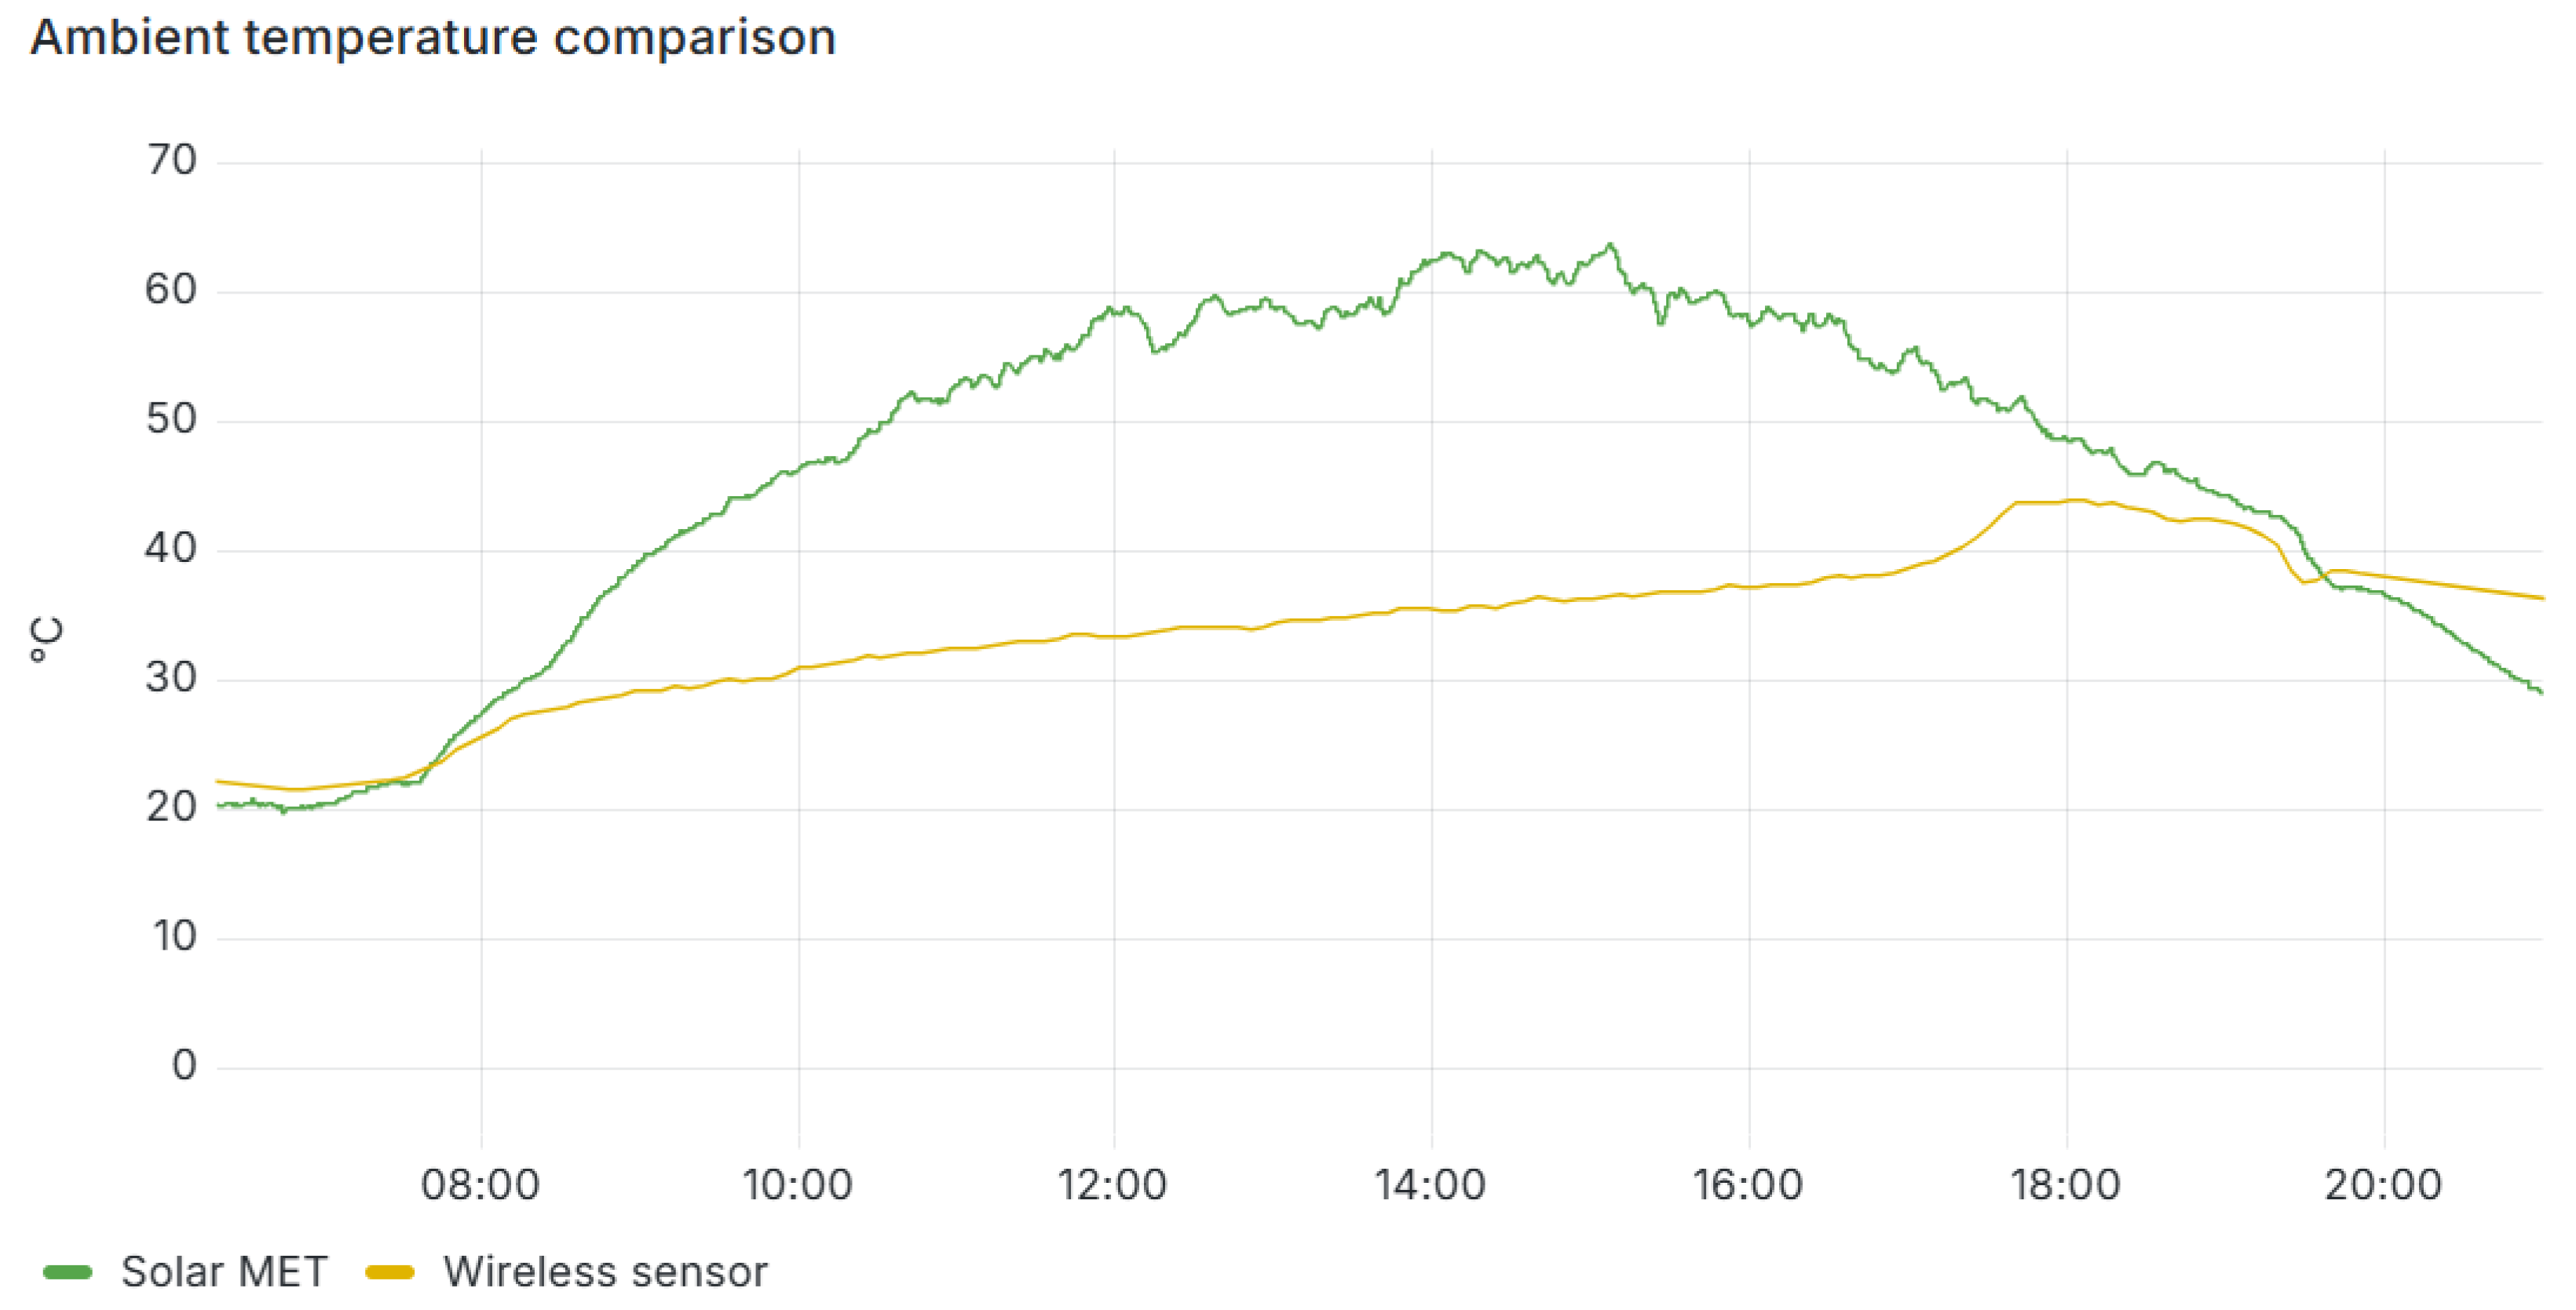
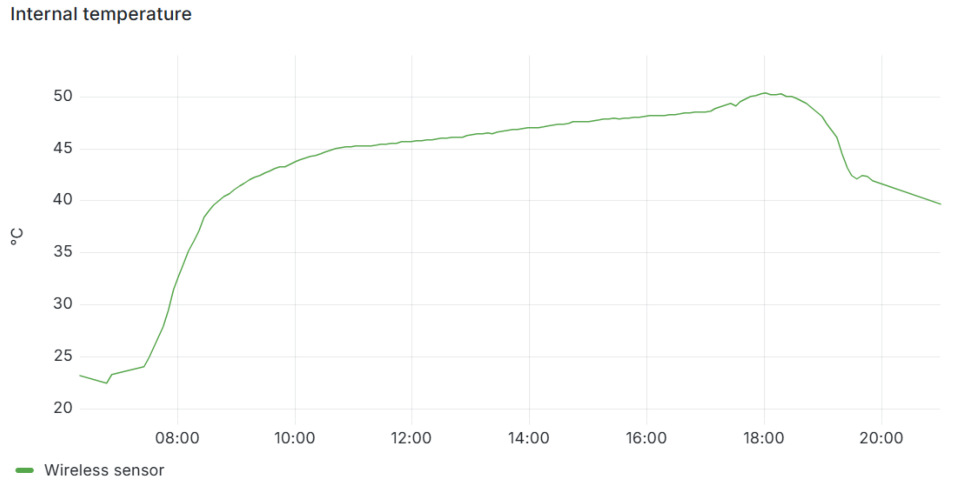
The measurements of ambient temperature and the internal temperature of the wireless sensor are presented in Figure 12 and Figure 13, respectively. For ambient temperature, a comparison was made between the values measured by the wireless sensor and the Solar MET sensor, as the Si-420TC-T sensor is not equipped with an ambient temperature monitoring capability.
The ambient temperature values reported by the two sensors are similar in the early morning and in the evening near sunset. However, during the rest of the day, the wireless sensor consistently records lower temperatures than the Solar MET. This discrepancy arises from differences in sensor placement. The ambient temperature sensor of the wireless device is mounted on the exterior of the enclosure housing the system, which during testing was positioned beneath the support holding the industrial sensors and the wireless sensor’s photovoltaic panel. As a result, it remained shaded and protected from direct solar radiation. In contrast, the Solar MET’s ambient temperature sensor is connected via a short cable (approximately 15 cm) to its electronic board, positioning it directly beneath the instrument housing. Consequently, its readings are strongly influenced by the casing temperature when exposed to sunlight.
After 19:00, the wireless sensor reports slightly higher temperatures, attributable to the low-angle solar radiation at sunset directly irradiating the enclosure. A comparison between the ambient temperature curve of the Solar MET in Figure 12 and its solar cell temperature in Figure 9 further demonstrates their close alignment, underscoring the significance of sensor placement. Accordingly, the values reported by the wireless sensor are considered more representative, as they are obtained under shaded conditions.
From the perspective of internal temperature (Figure 13), it can be observed that it reaches a maximum value of approximately 50 °C. This temperature is measured at the level of the internal heat sink of the wireless sensor circuit, where the components responsible for generating the variable load applied to the solar panel are mounted, used for measuring the power generated by the panel. This maximum temperature value is perfectly acceptable for a sunny summer day, considering that the cabinet housing the sensor’s circuit is sealed and does not include a ventilation system. Unfortunately, the two industrial sensors do not report internal temperature, and therefore we had no reference for comparison with the value indicated by the wireless sensor. Although this measurement does not play a role in the calculation of solar irradiance, it represents useful information in the context of remotely monitoring the operational status of the sensor.

6.3. Battery and Solar Panel Voltage Measurement

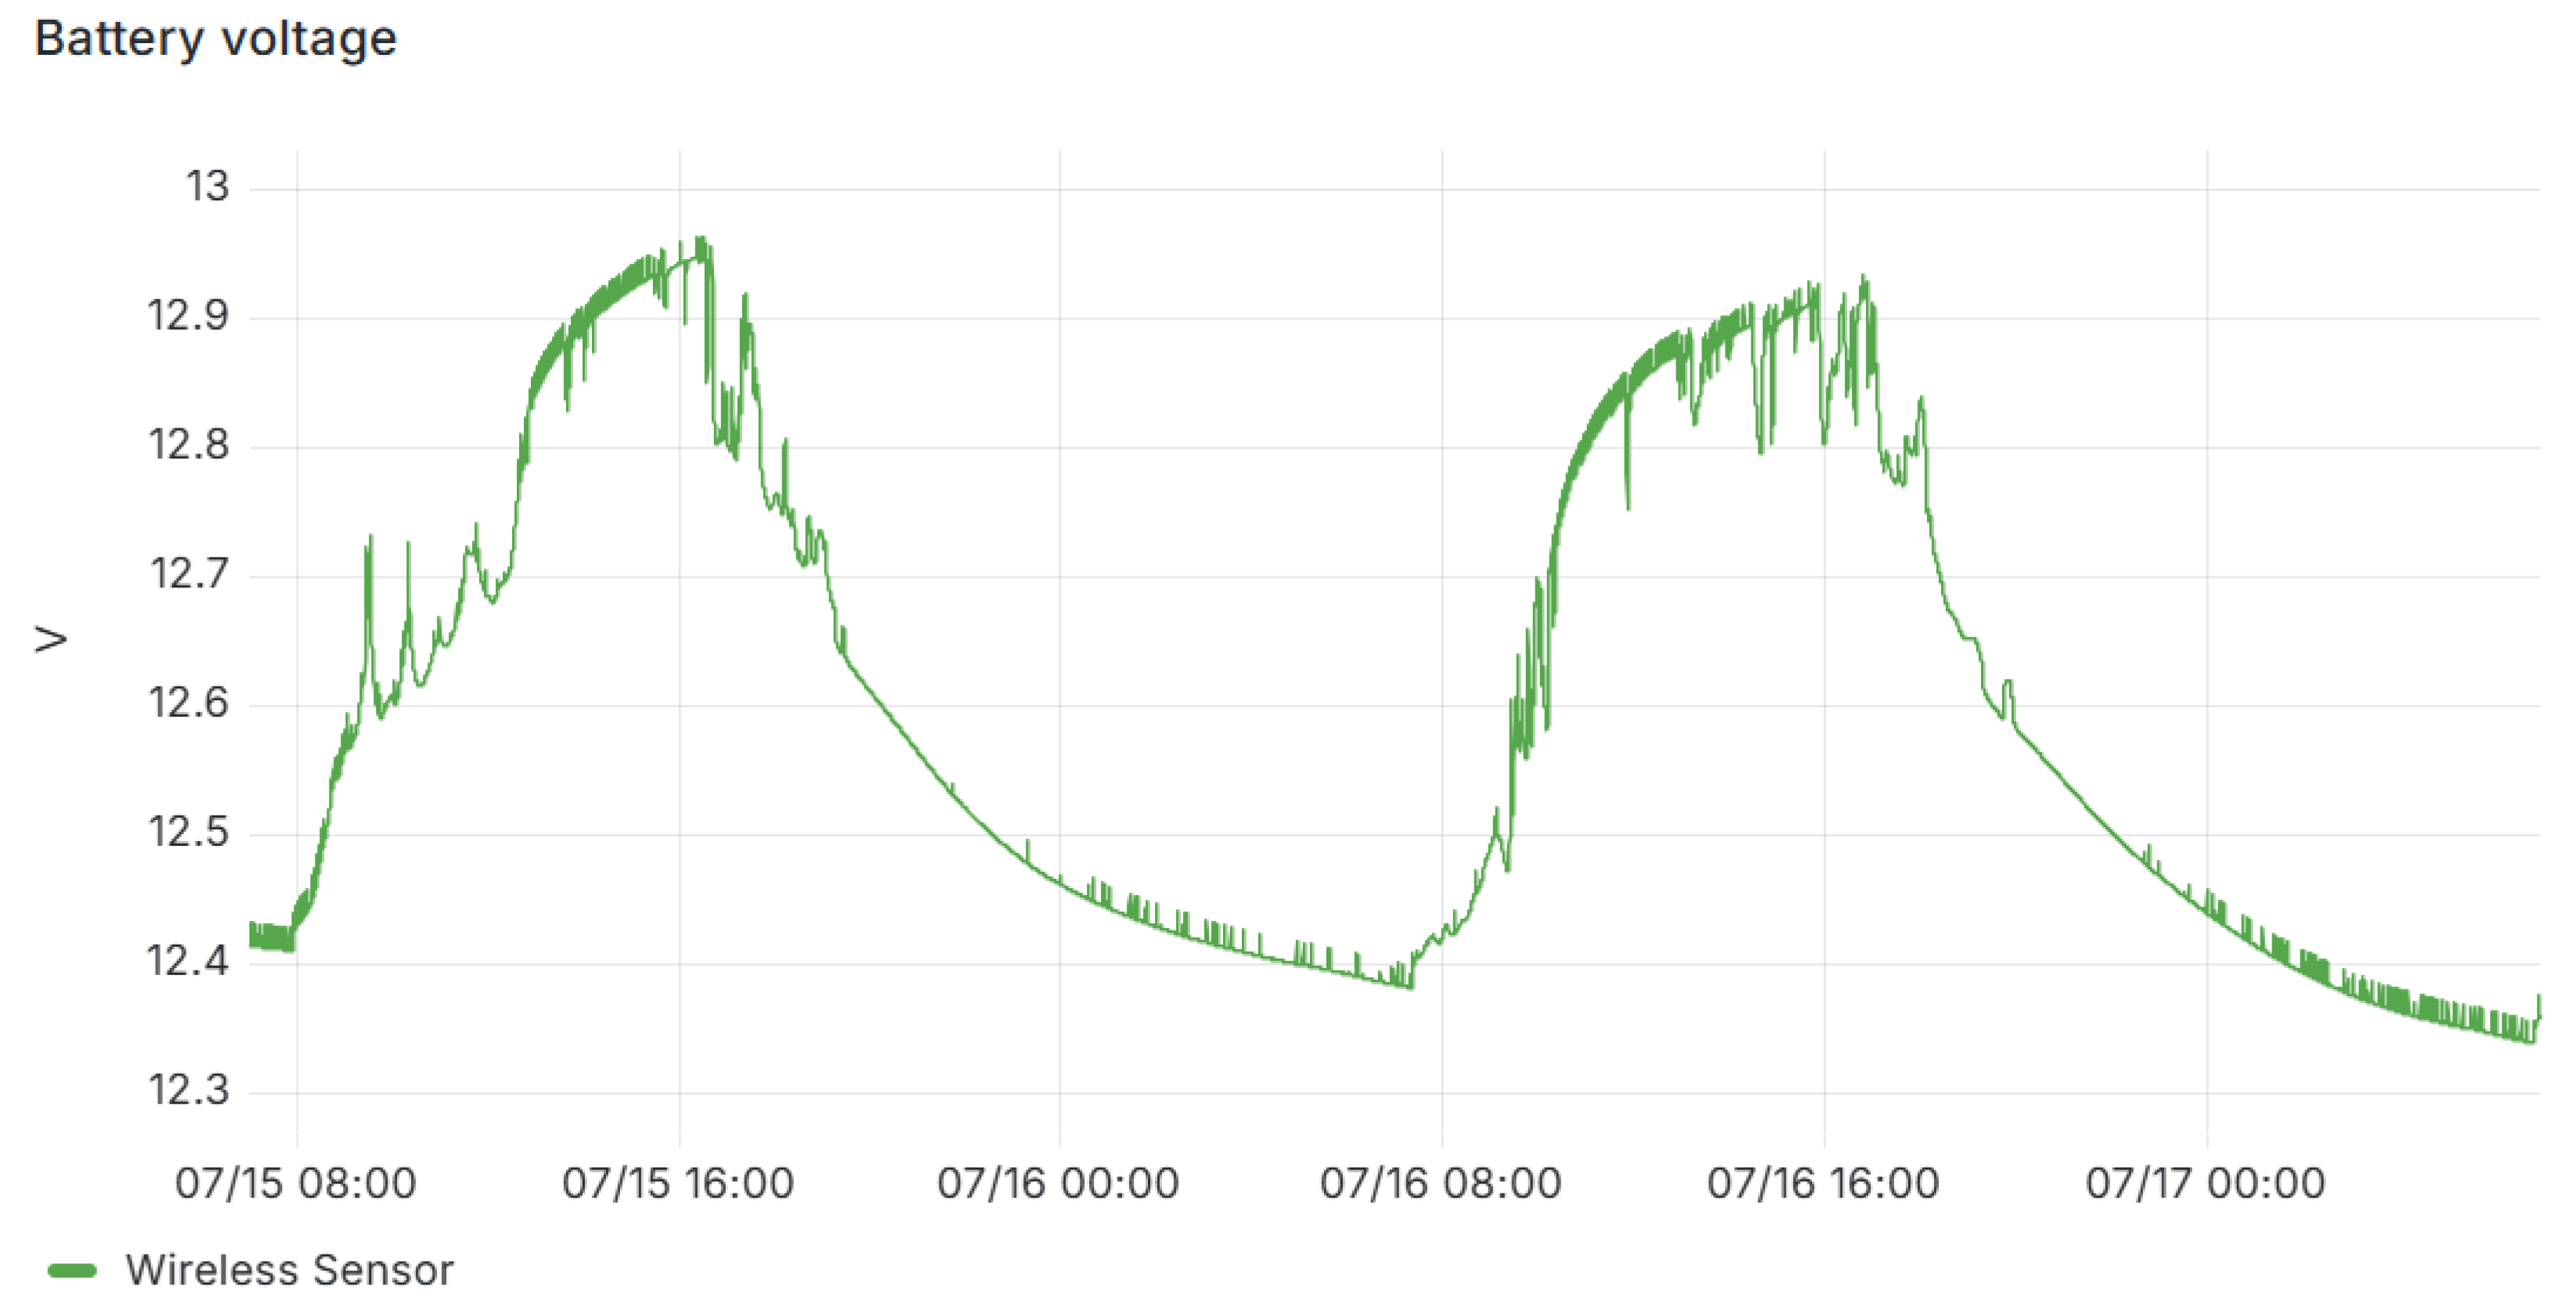
As illustrated in Figure 14, the sensor operates when powered by a 12 V lead–acid battery with a capacity of 9 Ah. In this mode, the sensor operates continuously, even during nighttime hours, due to the battery capacity. The voltage began to increase on 16 July 2025, from approximately 7:20. It increased from 12.3 V to 12.45 V at 8:30, to 12.6 V at 9:30, to 12.7 V at 10:30, to 12.8 V at 11:30, and finally to 12.9 V at 12:30, at which point it reached its maximum value. The voltage drop was first measured at 17:00 on and was recorded continuously until it reached its minimum of 12.3 V at 17:07 on 17 July 2025. This mode of operation provides the highest availability of solar irradiance values from sunrise to sunset. The data obtained during the night are considered irrelevant, and the measurements were performed by the equipment to evaluate system performance. The energy consumed during nighttime hours is recovered during the daytime, thereby ensuring perpetual autonomy.
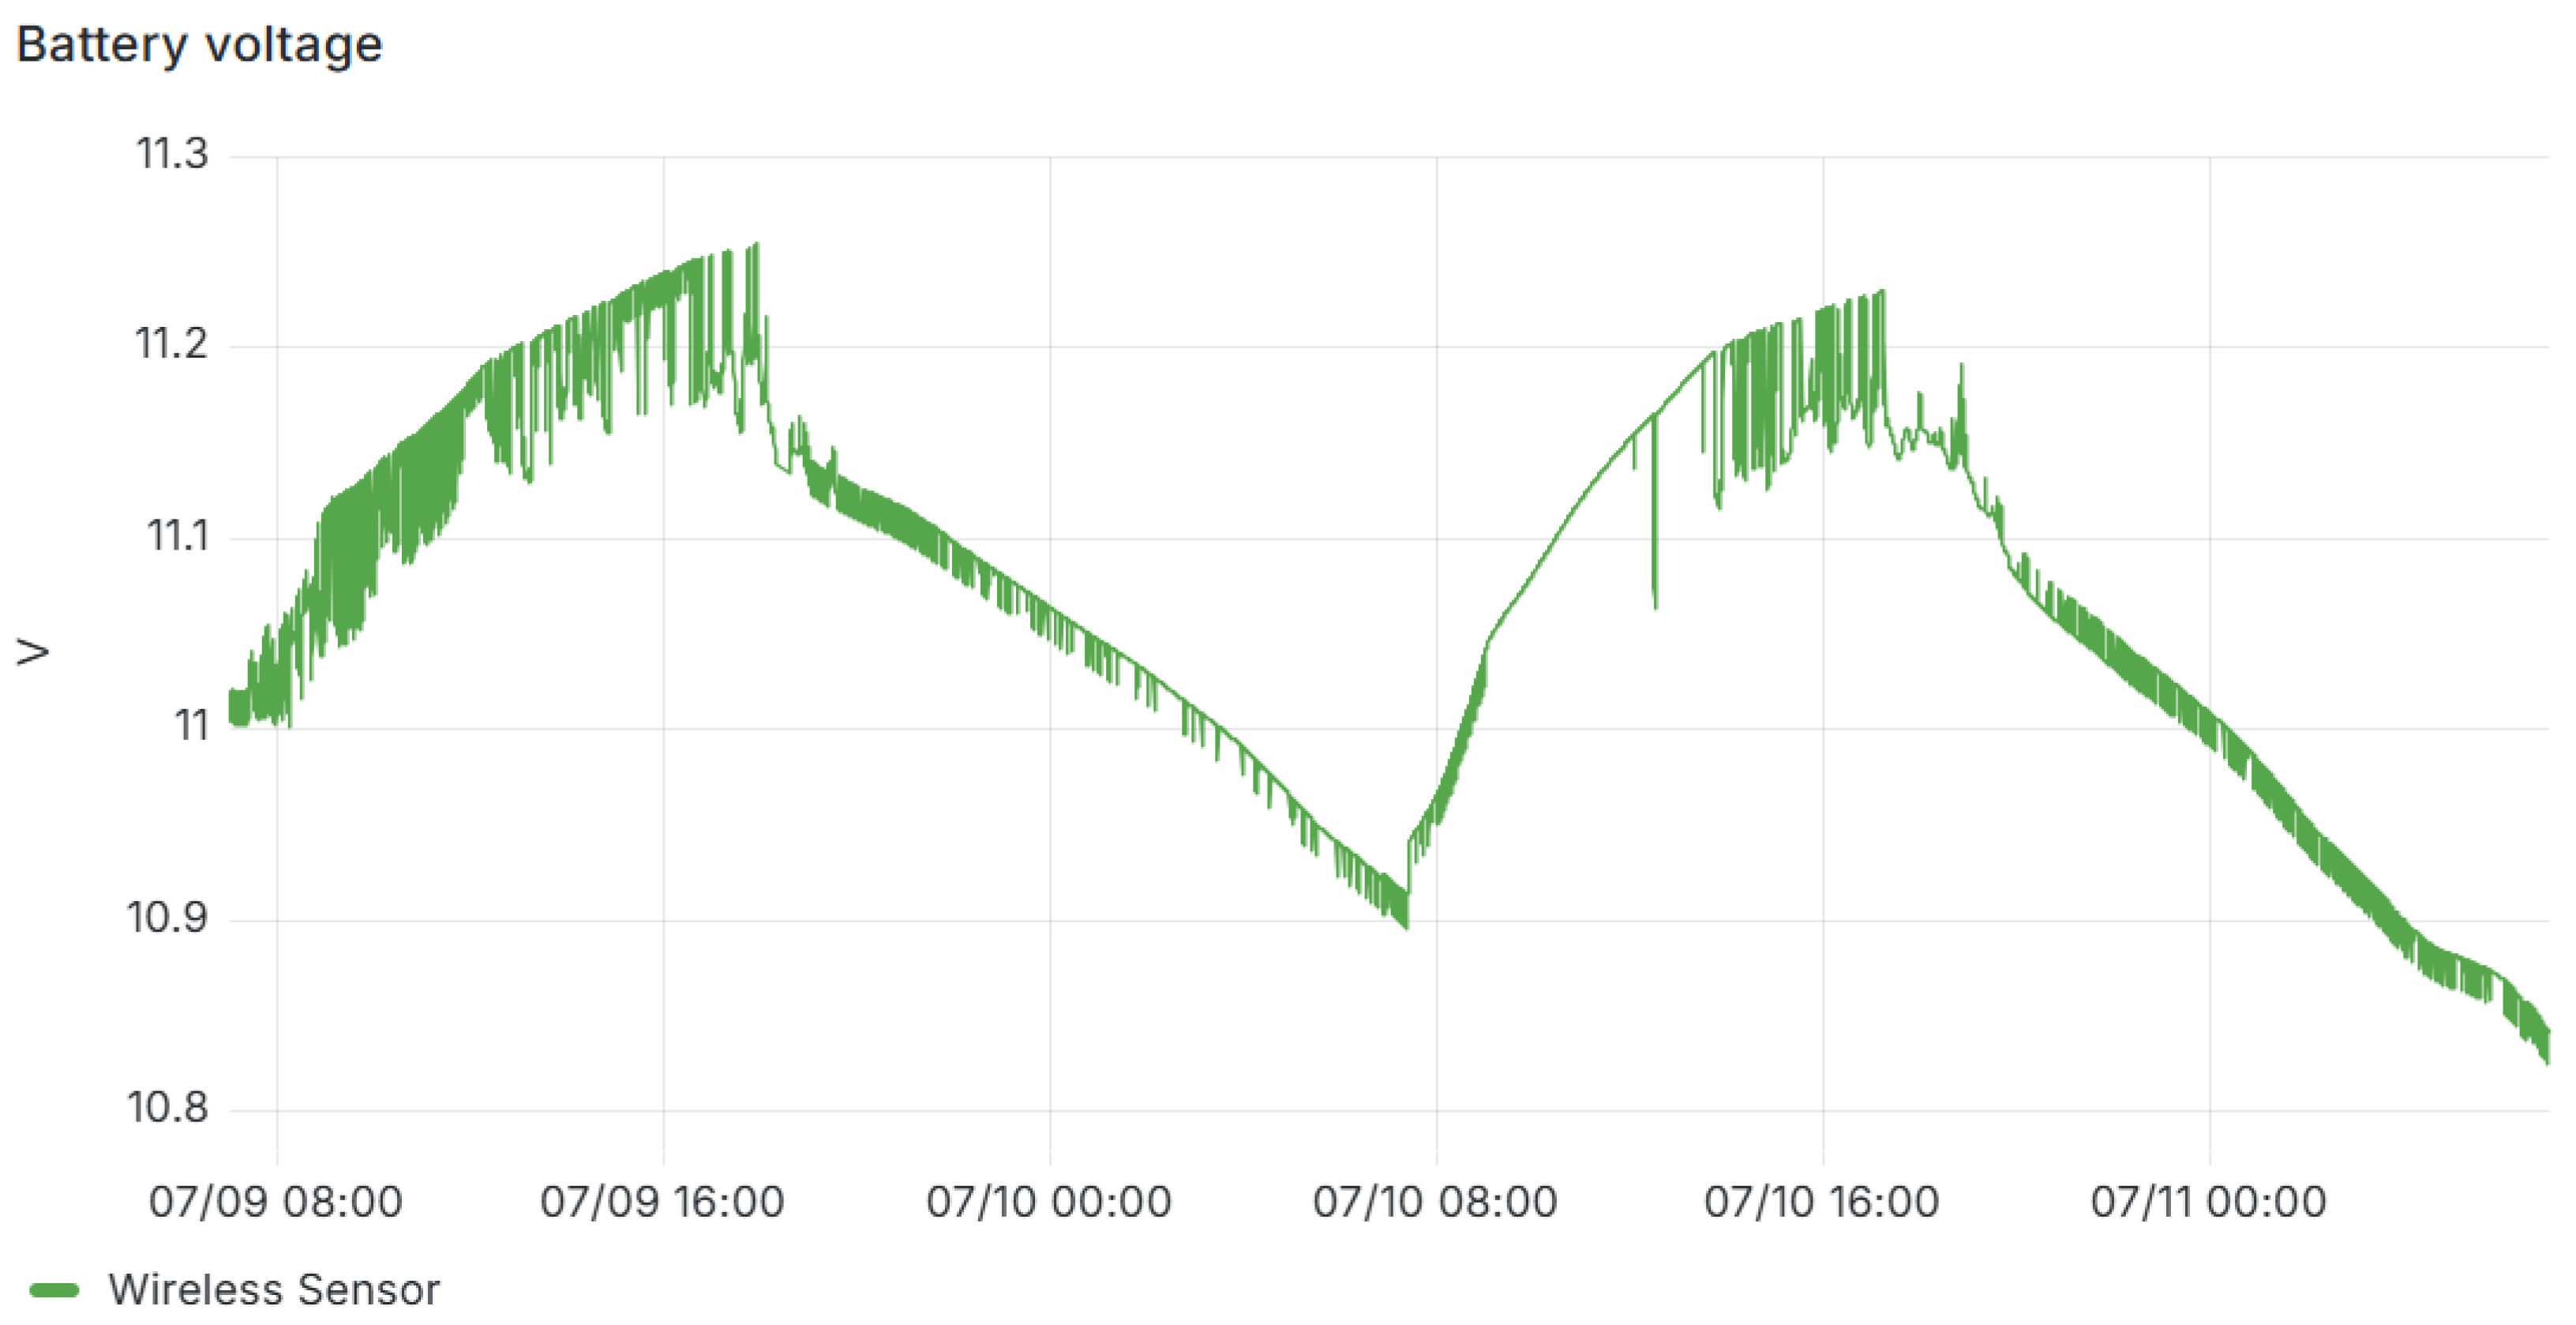
As shown in Figure 15, the sensor’s operation when powered by an 11.1 V Li-Po battery is presented. Similar to the case with the lead–acid battery, the sensor remains fully operational, including during nighttime periods. The battery voltage increased from 10.9 V on 10 July 2025, at 07:05 to 11.2 V at 13:35, reaching a maximum of 11.225 V. Thereafter, the voltage decreased, reaching 10.8 V on 11 July 2025, at 08:02. The average discharge rate of the Li-Po battery was approximately 26 mV/h.
It is important to note that on 9 July 2025, the solar irradiance level was lower compared to the previous day. Consequently, the battery voltage experienced a slight decrease on 11 July 2025, as compared to 9 July 2025. However, the power supply method ensures uninterrupted autonomy during the night.
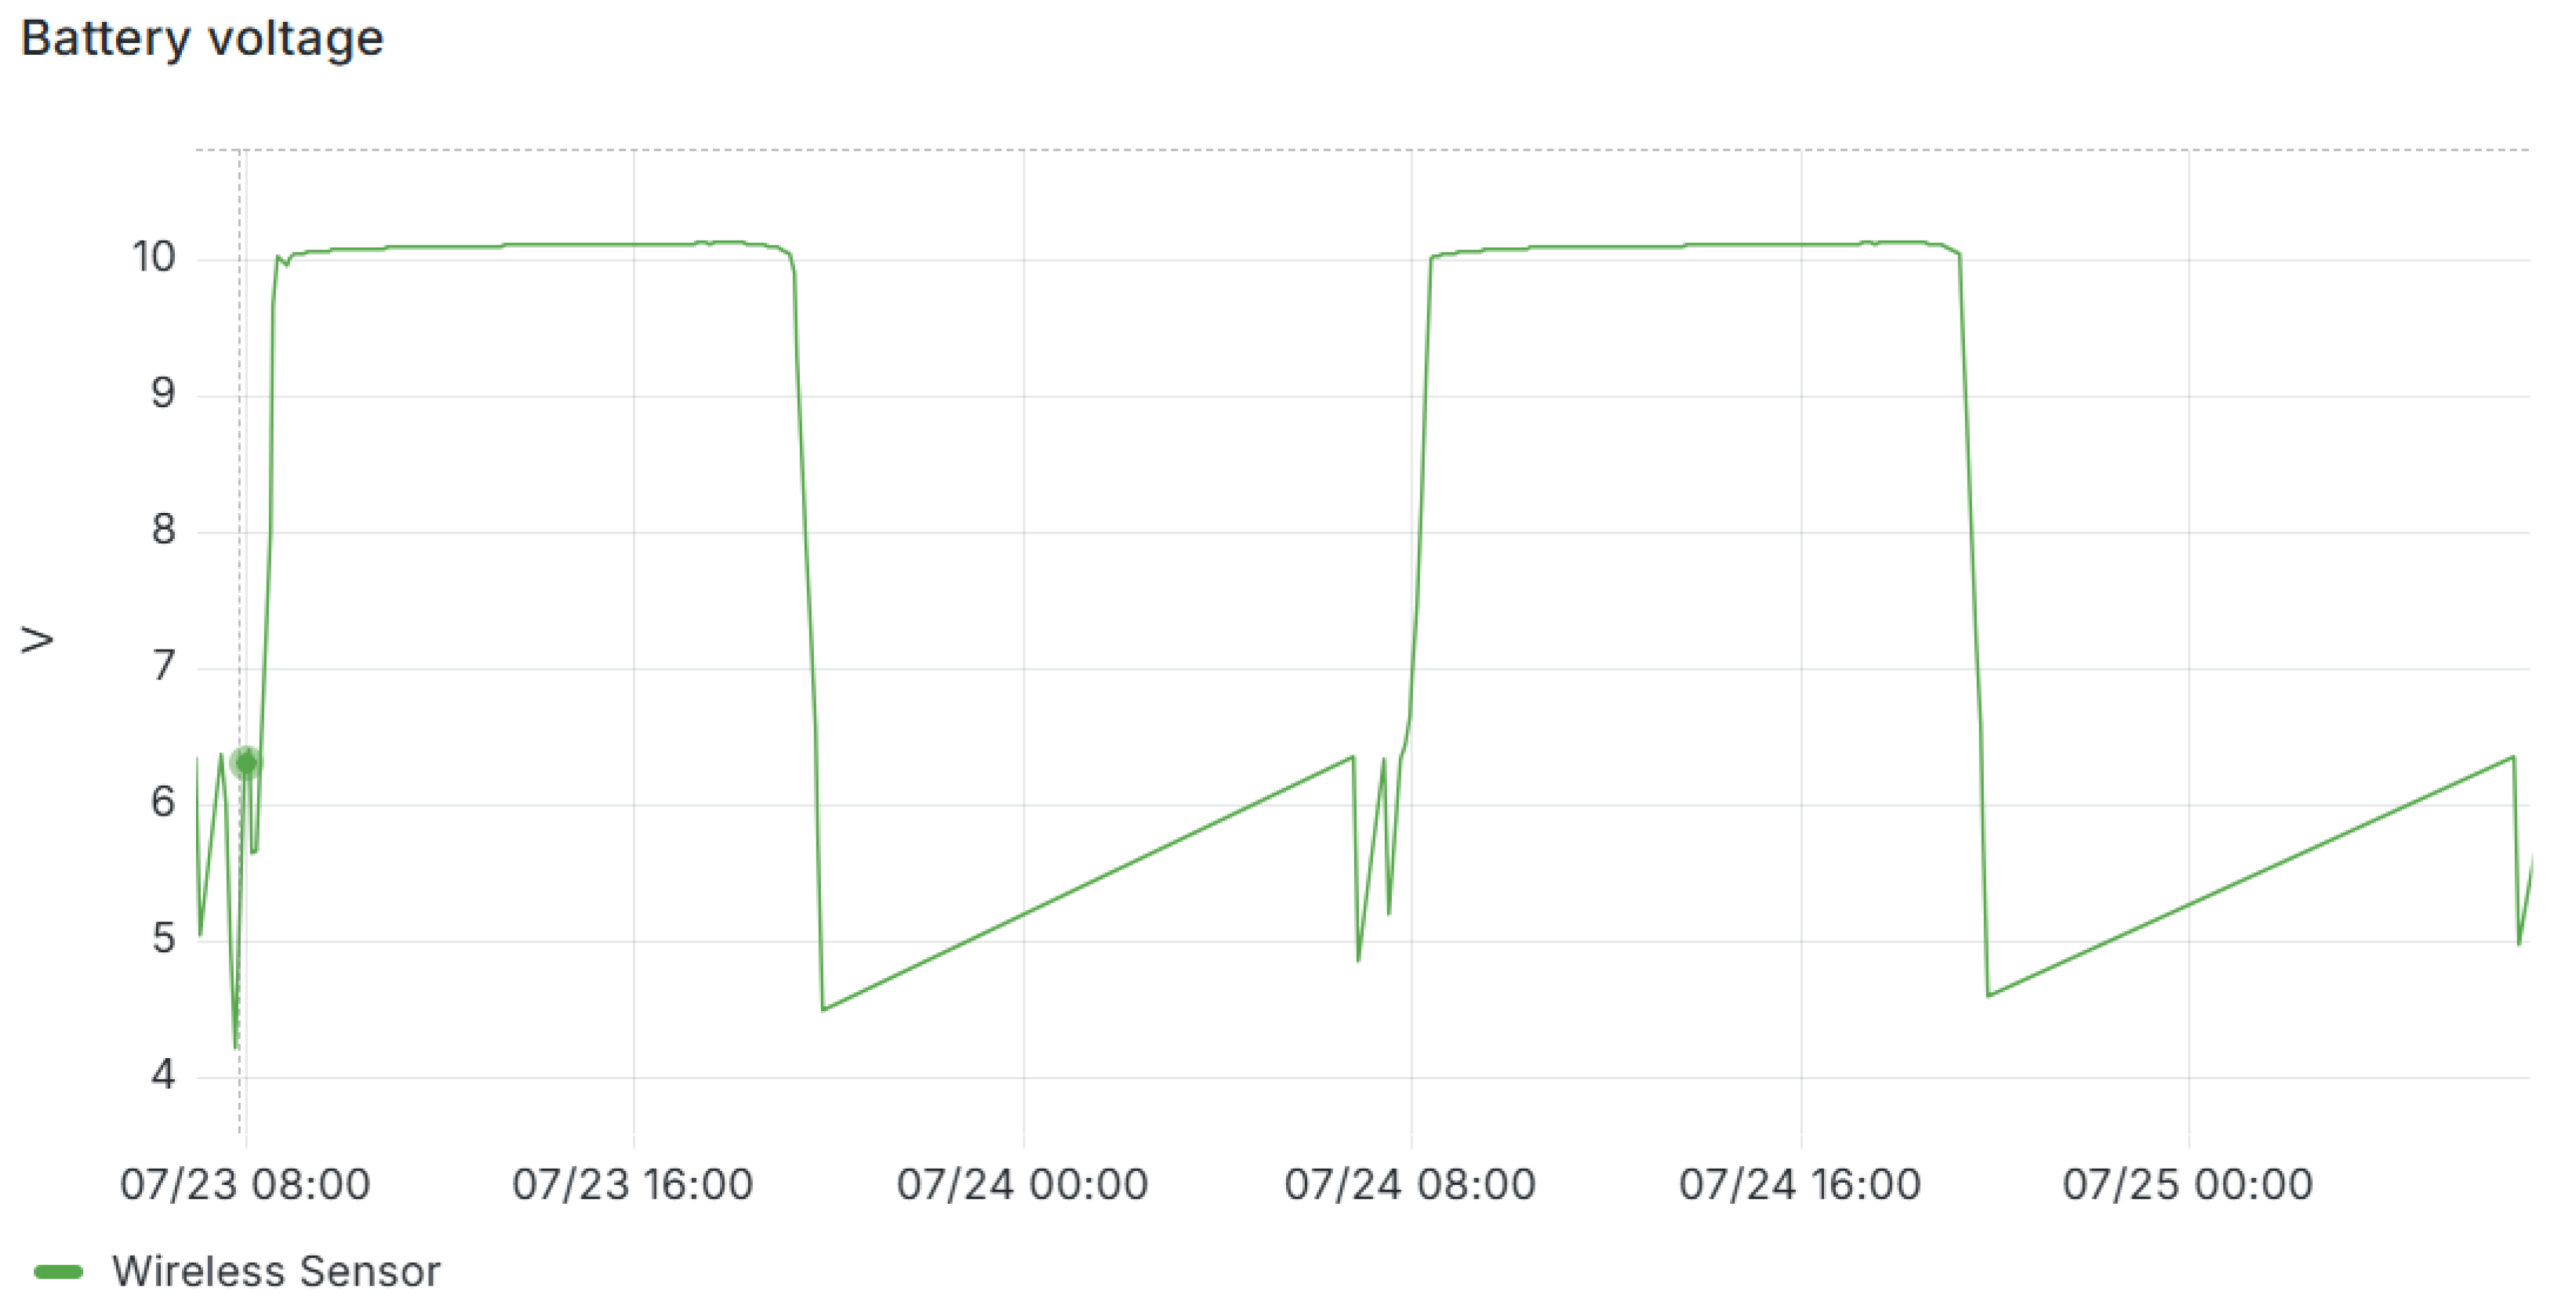
As illustrated in Figure 16, the sensor’s operational mode is dependent on the energy supply from the supercapacitors. At 6:39, the voltage on the supercapacitors increases due to the energy received from street lighting or reflected sunlight from the moon’s surface. The initial reading, obtained at 7:26, indicates the presence of energy that derived directly from the sun. The initial voltage of the battery is measured at 6.36 V; however, following this initial reading, the voltage decreases to 5.59 V. The next reading is obtained at an interval of 5 min. The voltage continues to decrease for the next seven readings (35 min) to 4.65 V, and from this point continues to increase to 10 V for the next eight readings (40 min). The voltage measured at these eight points is listed below: {6.36; 5.95; 5.61; 5.33; 5.08; 4.87; 4.72; 4.65}. The extended measurements at which the voltage begins to increase are as follows: {4.7; 4.91; 5.35; 6.05; 6.98; 8.06; 9.32; 10; 10.1}. These results can be obtained from a time window of a few hours.
As illustrated in Figure 16, a number of brief variations can be seen, due to the wide time window of two days. The results previously described refer to 24 July 2025. Over the course of the day, the voltage stabilizes at approximately 10 V, with a maximum recorded value of 10.1 V.
In terms of correlation with solar radiation levels, the sensor turns on at approximately 200 W/m2 and turns off when solar radiation levels drop below 100 W/m2.
During the evening hours, the voltage undergoes gradual decrease from 10 V over an interval of eight readings (40 min) to 4.60 V. The voltage values for each reading are as follows: {10; 9.59; 8.84; 8.03; 6.22; 6.58; 5.77; 4.60}. The results presented here have been obtained during the time interval between 19:15 and 19:50 on 24 July 2025. The sensor remained basically inactive throughout the entire night, until the sun’s rise, at which point the energy obtained by the solar panel was able to charge the supercapacitors. It is important to note that any light source capable to charging the battery can activate the sensor, which will take a measurement. However, once the voltage has decreased to a certain threshold, the sensor will no longer be activated. Therefore, the sensor is only activated when the solar irradiance is strong enough to provide a significant increase to the energy stored in the battery.
From the standpoint of dust influence on measurement accuracy, the following observations can be made. During the initial phase of the experiments, in which the power and temperature of the wireless sensor’s photovoltaic panel were sampled together with the reference values measured by industrial irradiance sensors, both the solar panel and the reference sensors were cleaned each morning to eliminate any potential dust-related interference during the calibration process. In the subsequent comparative field tests, the cleaning procedure was performed every three to four days, as daily access to the installation site was not feasible. Nevertheless, no significant increase in measurement error was observed with dust accumulation, nor a sharp decrease immediately after cleaning. This suggests that all sensors—both the industrial reference devices and the wireless sensor’s PV panel—were similarly exposed to dust deposition, which affected them in a comparable manner, thus minimizing the relative impact of dust on the calibration and measurement accuracy.
The analysis of the wireless solar irradiance sensor versus industrial references shows that it achieves high accuracy, with average percentage errors under 5% over extended periods. The polynomial model based on electrical power and cell temperature proved valid.
Strong correlation was observed in sunny conditions, with slight increases in error under cloudy ones, and variable irradiance. Cell temperature analysis highlighted construction differences among sensors, but the wireless sensor’s direct thermal contact ensured accurate readings.
Both percentage error and MSE analyses confirmed that error correlates with irradiance volatility, mainly due to different sampling intervals and possible hysteresis in industrial sensors.

6.4. Power Considerations for the Communication Interfaces

Some final thoughts regarding the communication interfaces and protocols: the Modbus protocol was not originally designed for devices operating in duty-cycled modes (sporadic wake-up, data transmission, and sleep) or for persistent connections that facilitate rapid detection of communication loss, which is typically interpreted as a fault condition.
From the perspective of the Wi-Fi interface, whether using MQTT or Modbus TCP, a notable limitation arises: the device must be installed in proximity to the access point or gateway. Given that such networking equipment is almost always mains-powered and typically located indoors (e.g., in technical rooms within photovoltaic plants), we consider that when Wi-Fi communication is selected, powering the device from a dedicated DC supply is more appropriate than relying on the internal battery.
Similarly, when Modbus RTU communication is required, an RS-485 cable must be installed; in such a configuration, it is practical to provide the power supply to the wireless sensor through the same wiring. For these reasons, we did not perform comparative power consumption measurements among the various communication interfaces and protocols.
Overall, the wireless sensor is a reliable, practical solution for solar irradiance monitoring in various applications.

7. Conclusions, Contributions and Future Work

7.1. Conclusions and Contributions

In this paper, we presented a system architecture for measuring solar irradiance that employs a single small-scale, low-power photovoltaic panel, used both for energy harvesting and for irradiance measurement. A key advantage of this approach is the elimination of power supply and data transmission cabling. The design also provides high flexibility in terms of energy storage, supporting supercapacitors, lead–acid, or Li-Po batteries. When supercapacitors are used, long-term operational costs are reduced, as they are less affected by extreme temperatures (very high in summer or very low in winter) compared to conventional lead–acid batteries, and do not require annual replacement to ensure reliable operation. Furthermore, supercapacitors offer a significantly lower weight than other storage technologies.
The resulting device is capable of transmitting measurement data to a remote data aggregator or a communication partner via ZigBee or Wi-Fi wireless interfaces, or by integration into existing RS-485 serial communication networks (if a cable connection is mandatory). The proposed architecture supports the use of multiple industrial and IoT communication protocols, including Modbus TCP, Modbus RTU, MQTT, and ZigBee, while also allowing the integration of additional protocols. Furthermore, the device can be programmed using a conventional programming language (C), ensuring flexibility and ease of customization.
Experimental validation conducted under real-world operating conditions, through comparison with two industrial-grade reference sensors (INGENIEURBÜRO Si-420TC-T and Atersa Solar MET Rad-Tcell-Tamb), demonstrated low measurement deviations. The wireless sensor achieved an average error of under 5% for solar irradiance, thereby confirming its accuracy and reliability for practical deployment.
The validation campaign extended over several weeks in July, providing representative data for performance assessment. Further long-term testing will be undertaken to analyze continuous operation, particularly regarding power autonomy, data transmission reliability, and the consistency of the temperature-compensation algorithm over prolonged periods.
Table 4 presents a comparison between the specifications and cost of several commercially available industrial sensors and the proposed solution. The results highlight the flexibility of our architecture, which integrates multiple interfaces and communication protocols. Furthermore, the measurement range of solar irradiance can be easily extended by employing a higher-power photovoltaic panel and calibrating the device against an industrial-grade reference sensor with a broader irradiance range.
From a cost perspective, the total production cost of the wireless sensor was estimated based on component prices listed at the first-quantity tier on well-established distributors such as Mouser, Farnell, Digi-Key, and TME. The calculation was performed for a single manufactured unit, without considering bulk purchase discounts applicable in large-scale production.
We argue that the proposed solution provides a favorable cost-to-performance ratio, while its flexibility—stemming from support for multiple communication protocols and interfaces, compatibility with different energy storage options, the elimination of cabling, and the ability to be programmed in a conventional language (C) for further development—represents a considerable advantage over existing commercial alternatives.
It should be noted that the acquisition of components required for the fabrication of the device, as well as those necessary for real-world testing (including the PLC, industrial data acquisition modules, and reference irradiance sensors such as the Si-420TC-T and Solar MET), was financed exclusively from the authors’ personal funds. The Faculty of Automatic Control and Computers, National University of Science and Technology POLITEHNICA Bucharest, provided access to the Keithley 2000 multimeters employed during the initial calibration phase, and granted the use of its electronics laboratory for device assembly and debug, laboratory calibration, and subsequent rooftop testing.
We anticipate that the development of this wireless, energy-harvesting sensor architecture, which eliminates the need for cabling, will support other researchers in designing new types of sensors with similar capabilities. To this end, we have decided to release the electrical schematics, PCB layout, source code, and Bill Of Materials (BOM) as open-source resources, making them accessible to anyone interested in this field [54].

7.2. Future Work

Future research and development activities will focus on improving the overall energy efficiency, calibration accuracy, and field deployment capabilities of the proposed wireless irradiance sensor. Several technical directions are foreseen:
  • Power optimization and circuit refinement: The electronic design, particularly the voltage regulation and power distribution stages, will be revisited to minimize quiescent and leakage currents during deep-sleep operation. Reducing the standby consumption will enable prolonged autonomous functioning when powered exclusively by supercapacitors, further reinforcing the device’s suitability for maintenance-free deployments in remote environments.
  • Controlled calibration facility: A dedicated calibration chamber will be developed to allow the independent control of irradiance and temperature levels. Such an environment will facilitate systematic calibration and characterization campaigns, ensuring higher accuracy of the irradiance–temperature compensation models and enabling the study of sensor behavior under reproducible laboratory conditions.
  • Outdoor tracking and test platform: For extended field evaluation, a mobile, sun-tracking frame will be designed to maintain optimal panel orientation throughout the day. This setup will maximize the received irradiance during outdoor experiments, allowing consistent exposure conditions for comparative testing between multiple devices and reference sensors.
These developments will contribute to enhancing the precision, robustness, and energy autonomy of the proposed architecture, paving the way for its large-scale validation and integration within distributed IoT-based solar monitoring systems.

Author Contributions

Conceptualization, A.-V.P. and D.-C.T.; methodology, A.-V.P. and V.-V.S.; software, A.-V.P.; validation, A.-V.P., F.-A.S. and D.-C.T.; formal analysis, A.-V.P. and V.-V.S.; investigation, D.-C.T.; resources, F.-A.S.; data curation, F.-A.S.; writing—original draft preparation, A.-V.P.; writing— review and editing, D.-C.T.; visualization, A.-V.P.; supervision, D.-C.T.; project administration, F.-A.S. and V.-V.S.; funding acquisition, V.-V.S. All authors have read and agreed to the published version of the manuscript.

Funding

This work was supported by a grant from the National Program for Research of the National Association of Technical Universities—GNAC ARUT 2023.

Institutional Review Board Statement

Not applicable.

Informed Consent Statement

Not applicable.

Data Availability Statement

The original contributions presented in the study are included in the article; further inquiries can be directed to the corresponding author.

Acknowledgments

We all that took part in this complex project gratefully acknowledge the support of the Faculty of Automatic Control and Computers, National University of Science and Technology POLITEHNICA Bucharest, for providing access to laboratory facilities and measurement equipment, including the Keithley 2000 multimeters used during the calibration stage. The publication of this work was supported by a grant from the National Program for Research of the National Association of Technical Universities—GNAC ARUT 2023. All hardware components, reference irradiance sensors, and auxiliary devices required for prototyping and field validation were financed exclusively from our personal funds, driven purely by passion. We also wish to sincerely thank Cristina Stefanoiu for carefully reviewing the article and for the constant moral support provided to the authors.

Conflicts of Interest

The authors declare no conflicts of interest.

Abbreviations

The following abbreviations are used in this manuscript:
ADCAnalog-to-Digital Converter
APIApplication Programming Interface
BOMBill of Materials
DACDigital-to-Analog Converter
ESP32Espressif Systems 32-bit Microcontroller
FBDFunction Block Diagram
GPIOGeneral-Purpose Input/Output
GUIGraphical User Interface
IIoTIndustrial Internet of Things
IoTInternet of Things
I–VCurrent–Voltage
ISOInternational Organization for Standardization
kWhKilowatt-hour
LCOELevelized Cost of Electricity
Li-PoLithium-Polymer
LoRaWANLong Range Wide Area Network
LPWANLow-Power Wide Area Network
LSTMLong Short-Term Memory
MSEMean Squared Error
MPPTMaximum Power Point Tracking
MQTTMessage Queuing Telemetry Transport
NRELNational Renewable Energy Laboratory
O&MOperations and Maintenance
OSOperating System
PANPersonal Area Network
PCBPrinted Circuit Board
PCPersonal Computer
PLCProgrammable Logic Controller
POAPlane of Array
PRPerformance Ratio
PVPhotovoltaic
PVPSPhotovoltaic Power Systems Programme
RS-485Recommended Standard 485 (serial communication)
SCADASupervisory Control and Data Acquisition
SMASubMiniature version A (connector)
SPISerial Peripheral Interface
SSDSolid State Drive
TCPTransmission Control Protocol
UARTUniversal Asynchronous Receiver–Transmitter
UFLUltra Miniature Coaxial Connector
USBUniversal Serial Bus
Wi-FiWireless Fidelity

References

  1. International Renewable Energy Agency (IRENA). World Energy Transitions Outlook 2023: 1.5 °C Pathway; Technical Report; International Renewable Energy Agency: Abu Dhabi, United Arab Emirates, 2023. [Google Scholar]
  2. Fraunhofer Institute for Solar Energy Systems ISE. Photovoltaics Report; Technical Report; Fraunhofer Institute for Solar Energy Systems ISE: Freiburg, Germany, 2023. [Google Scholar]
  3. International Energy Agency (IEA). World Energy Outlook 2022; Technical Report; International Energy Agency: Paris, France, 2022.
  4. IEC 61724-1:2017; Photovoltaic System Performance—Part 1: Monitoring. International Electrotechnical Commission: Geneva, Switzerland, 2017; Technical Report.
  5. Huld, T.; Gracia Amillo, A. Estimating PV Module Performance over Large Geographical Regions: The Role of Irradiance, Air Temperature, Wind Speed and Solar Spectrum. Energies 2015, 8, 5159–5181. [Google Scholar] [CrossRef]
  6. Kratochvil, J.A.; Boyson, W.E.; King, D.L. Photovoltaic Array Performance Model; Technical Report; Sandia National Laboratories: Albuquerque, NM, USA, 2004. [CrossRef]
  7. Standard ISO 9060; Solar Energy, Specification and Classification of Instruments for Measuring Hemispherical Solar and Direct Solar Radiation. International Organization for Standardization: Geneva, Switzerland, 2018.
  8. IEC 61724-1:2021; Photovoltaic System Performance—Part 1: Monitoring. International Electrotechnical Commission: Geneva, Switzerland, 2021; Technical Report.
  9. Sengupta, M.; Habte, A.; Wilbert, S.; Gueymard, C.; Remund, J. Best Practices Handbook for the Collection and Use of Solar Resource Data for Solar Energy Applications: Third Edition; National Renewable Energy Laboratory (NREL): Golden, CO, USA, 2021.
  10. Driesse, A.; Gotseff, P.; Sengupta, M. PV Reference Cells for Outdoor Use: Comparison of First-Year Field Measurements; Technical Report; National Renewable Energy Lab. (NREL): Golden, CO, USA, 2022.
  11. Vignola, F.; Peterson, J.; Kessler, R.; Sandhu, V.; Snider, S.; Habte, A.; Gotseff, P.; Andreas, A.; Sengupta, M.; Mavromatakis, F. Improved field evaluation of reference cells using spectral measurements. Sol. Energy 2021, 215, 482–491. [Google Scholar] [CrossRef]
  12. Chouay, Y.; Ouassaid, M. An accurate real time neural network based irradiance and temperature sensor for photovoltaic applications. Results Eng. 2024, 21, 101766. [Google Scholar] [CrossRef]
  13. Khalid, W.; Jamil, M.; Khan, A.A.; Awais, Q. Open-source internet of things-based supervisory control and data acquisition system for photovoltaic monitoring and control using HTTP and TCP/IP protocols. Energies 2024, 17, 4083. [Google Scholar] [CrossRef]
  14. El-Khozondar, H.J.; Mtair, S.Y.; Qoffa, K.O.; Qasem, O.I.; Munyarawi, A.H.; Nassar, Y.F.; Bayoumi, E.H.; Abd El, A.A.E.B. A smart energy monitoring system using ESP32 microcontroller. E-Prime Electr. Eng. Electron. Energy 2024, 9, 100666. [Google Scholar] [CrossRef]
  15. Witczak, D.; Szymoniak, S. Review of monitoring and control systems based on Internet of Things. Appl. Sci. 2024, 14, 8943. [Google Scholar] [CrossRef]
  16. Mirani, A.A.; Awasthi, A.; O’Mahony, N.; Walsh, J. Industrial IoT-Based Energy Monitoring System: Using Data Processing at Edge. IoT 2024, 5, 608–633. [Google Scholar] [CrossRef]
  17. Rojek, L.; Islam, S.; Hartmann, M.; Creutzburg, R. IoT-based real-time monitoring system for a smart energy house. Electron. Imaging 2021, 33, 38-1–38-10. [Google Scholar] [CrossRef]
  18. Ramadhan, J.M.; Mardiati, R.; Haq, I.N. Iot monitoring system for solar power plant based on mqtt publisher/subscriber protocol. In Proceedings of the 2021 7th International Conference on Wireless and Telematics (ICWT), Bandung, Indonesia, 19–20 August 2021; pp. 1–6. [Google Scholar]
  19. Rouibah, N.; Elhammoumi, A.; Bouttout, A.; Haddad, S.; Oukaci, S.; Limam, A.; Benghanem, M. Smart Monitoring of Photovoltaic Energy Systems: An IoT-Based Prototype Approach. Sci. Afr. 2025, 30, e02973. [Google Scholar] [CrossRef]
  20. Calderón, D.; Folgado, F.J.; González, I.; Calderón, A.J. Implementation and experimental application of industrial IoT architecture using automation and IoT Hardware/Software. Sensors 2024, 24, 8074. [Google Scholar] [CrossRef]
  21. Dobrea, M.A.; Vasluianu, M.; Neculoiu, G.; Arghira, N. Modeling and simulation of a 3 kw photovoltaic system for an autonomous consumer. UPB Sci. Bull. Ser. C 2021, 83, 35–46. [Google Scholar]
  22. Demir, B.E. A New Low-Cost IoT Based Monitoring System Design for Stand-Alone Solar Photovoltaic Plant and Power Estimation. Appl. Sci. 2023, 13, 13072. [Google Scholar] [CrossRef]
  23. Hamied, A.; Mellit, A.; Benghanem, M.; Boubaker, S. IoT-Based Low-Cost Photovoltaic Monitoring for a Greenhouse Farm in an Arid Region. Energies 2023, 16, 3860. [Google Scholar] [CrossRef]
  24. Botero-Valencia, J.; Valencia-Aguirre, J.; Gonzalez Montoya, D.; Ramos-Paja, C. A low-cost system for real-time measuring of the sunlight incident angle using IoT. HardwareX 2022, 11, e00272. [Google Scholar] [CrossRef] [PubMed]
  25. Nava-Pintor, J.A.; Alcalá-Rodríguez, U.E.; Guerrero-Osuna, H.A.; Mata-Romero, M.E.; Lopez-Neri, E.; García-Vázquez, F.; Solís-Sánchez, L.O.; Carrasco-Navarro, R.; Luque-Vega, L.F. Development and Evaluation of Solar Radiation Sensor Using Cost-Effective Light Sensors and Machine Learning Techniques. Technologies 2025, 13, 182. [Google Scholar] [CrossRef]
  26. Abe, C.F.; Dias, J.B.; Notton, G.; Faggianelli, G.A. Experimental Application of Methods to Compute Solar Irradiance and Cell Temperature of Photovoltaic Modules. Sensors 2020, 20, 2490. [Google Scholar] [CrossRef]
  27. Laudani, A.; Lozito, G.M.; Riganti Fulginei, F. Irradiance Sensing through PV Devices: A Sensitivity Analysis. Sensors 2021, 21, 4264. [Google Scholar] [CrossRef]
  28. Kyi, S.; Taparugssanagorn, A. IoT and machine learning models for multivariate very short-term time series solar power forecasting. IET Wirel. Sens. Syst. 2024, 14, 381–395. [Google Scholar] [CrossRef]
  29. Rogier, J.K.; Mohamudally, N. Forecasting Photovoltaic Power Generation via an IoT Network Using Nonlinear Autoregressive Neural Network. Procedia Comput. Sci. 2019, 151, 643–650, The 10th International Conference on Ambient Systems, Networks and Technologies (ANT 2019)/The 2nd International Conference on Emerging Data and Industry 4.0 (EDI40 2019)/Affiliated Workshops. [Google Scholar] [CrossRef]
  30. Hameed, B.H.; Kurnaz, S. Secure low-cost photovoltaic monitoring system based on LoRaWAN network and artificial intelligence. Discov. Comput. 2024, 27, 36. [Google Scholar] [CrossRef]
  31. Bueso, M.C.; Paredes-Parra, J.M.; Mateo-Aroca, A.; Molina-García, A. Sensitive Parameter Analysis for Solar Irradiance Short-Term Forecasting: Application to LoRa-Based Monitoring Technology. Sensors 2022, 22, 1499. [Google Scholar] [CrossRef]
  32. Ansong, M.; Huang, G.; Nyang’onda, T.N.; Musembi, R.J.; Richards, B.S. Very short-term solar irradiance forecasting based on open-source low-cost sky imager and hybrid deep-learning techniques. Sol. Energy 2025, 294, 113516. [Google Scholar] [CrossRef]
  33. Alzahrani, A. Short-Term Solar Irradiance Prediction Based on Adaptive Extreme Learning Machine and Weather Data. Sensors 2022, 22, 8218. [Google Scholar] [CrossRef]
  34. Macias, J.E.Z.; Trilles, S. Machine learning-based prediction model for battery levels in IoT devices using meteorological variables. Internet Things 2024, 25, 101109. [Google Scholar] [CrossRef]
  35. Digi. Digi XBee® 3 RF Module Hardware Reference Manual. Available online: https://docs.digi.com/resources/documentation/digidocs/pdfs/90001543.pdf (accessed on 14 August 2025).
  36. Espressif. ESP32-WROOM-32 Datasheet. Available online: https://www.espressif.com/sites/default/files/documentation/esp32-wroom-32_datasheet_en.pdf (accessed on 14 August 2025).
  37. Instruments, T. ADS131A0x Datasheet. Available online: https://www.ti.com/lit/ds/symlink/ads131a04.pdf (accessed on 14 August 2025).
  38. Instruments, T. TPS732xx-EP Datasheet. Available online: https://www.ti.com/lit/ds/symlink/tps73230-ep.pdf?ts=1755120122873 (accessed on 14 August 2025).
  39. Instruments, T. REF50xxA-Q1 Datasheet. Available online: https://www.ti.com/lit/ds/symlink/ref5020a-q1.pdf?ts=1755156346294&ref_url=https%253A%252F%252Fwww.ti.com%252Fproduct%252FREF5020A-Q1%252Fpart-details%252FREF5020AQDRQ1 (accessed on 14 August 2025).
  40. Instruments, T. TMP11 Datasheet. Available online: https://www.ti.com/lit/ds/symlink/tmp117.pdf?ts=1755096141116&ref_url=https%253A%252F%252Fwww.google.com%252F (accessed on 14 August 2025).
  41. Emelianov, A. Modbus Library for Arduino. Available online: https://github.com/emelianov/modbus-esp8266 (accessed on 11 September 2025).
  42. Software, W. Modbus Poll. Available online: https://www.modbustools.com/modbus_poll.html (accessed on 11 September 2025).
  43. O’Leary, N. Arduino Client for MQTT. Available online: https://github.com/knolleary/pubsubclient (accessed on 11 September 2025).
  44. Foundation, E. Mosquitto. Available online: https://mosquitto.org/ (accessed on 11 September 2025).
  45. Nordquist, T. MQTT-Explorer. Available online: https://mqtt-explorer.com/ (accessed on 11 September 2025).
  46. Instruments, N. USB-6009 Specifications. Available online: https://www.ni.com/docs/en-US/bundle/usb-6009-specs/page/specs.html?srsltid=AfmBOopROhAH3XUCnhV82tD60qahwT0j1oaWNLLHjanlPI_FiqTpipRM (accessed on 26 August 2025).
  47. Solar, I. SI-I-420TC-T Datasheet. Available online: https://imtsolar.com/wp-content/uploads/2012/10/IMT-Sensor-Cut-Sheet-2015.pdf (accessed on 1 September 2025).
  48. DATASOL MET. Radiation Acquisition Manual. Available online: https://atersa.shop/app/uploads/2018/03/MU-38-T-Manual-MET.pdf?srsltid=AfmBOooTximbvR7Z6M-EUEzZNEgr5saN4p9rwAKClMC6QKldL2S7K6H_ (accessed on 1 September 2025).
  49. Phoenix Contact. Axioline F: System and Installation User Manual. Available online: https://www.manualslib.com/manual/1536738/Phoenix-Contact-Axioline-F.html (accessed on 26 August 2025).
  50. Avantech. ADAM-4017 Datasheet. Available online: https://advdownload.advantech.com/productfile/PIS/ADAM-4017+/file/ADAM-4017_4018_4019_DS(092223)20230928142137.pdf (accessed on 26 August 2025).
  51. Energy, J. SOLAR IRRADIANCE SENSOR SI-I-420TC-T. Available online: https://www.jedsenergy.com/products/solar-irradiance-sensor-si-i-420tc-t (accessed on 8 September 2025).
  52. ATERSA. Calibrated Cell 65mV Compensated (ATERSA). Available online: https://atersa.shop/celula-calibrada-0-65-mv-compensada-atersa/ (accessed on 8 September 2025).
  53. Fondriest Environmental, I. Kipp & Zonen SMP Series Smart Pyranometers. Available online: https://www.fondriest.com/kipp-zonen-smp-series-smart-pyranometers.htm (accessed on 8 September 2025).
  54. Computer Science Department @ UPB. Smart Solar Irradiance Sensor-Source Code & Schematics. Available online: https://github.com/cs-pub-ro/smart-solar-irradiance-sensor (accessed on 24 September 2025).
Figure 5. Wireless sensor communication diagram.
Applsci 15 11059 g005
Figure 6. Data acquisition box.
Applsci 15 11059 g006
Figure 7. Test setup architecture.
Applsci 15 11059 g007
Figure 8. Irradiance measurement comparison on 24 July 2025.
Applsci 15 11059 g008
Figure 9. Cell temperature measurement comparison on 24 July 2025.
Applsci 15 11059 g009
Figure 10. Solar irradiance 13–25 July 2025.
Applsci 15 11059 g010
Figure 12. Ambient temperature measurement comparison on 24 July 2025.
Applsci 15 11059 g012
Figure 13. Wireless sensor internal temperature measurement on 24 July 2025.
Applsci 15 11059 g013
Figure 14. Lead–acid battery voltage 15 July 2025 07:00 to 17 July 2025 07:00.
Applsci 15 11059 g014
Figure 15. LiPo battery voltage 9 July 2025 07:00 to 11 July 2025 07:00.
Applsci 15 11059 g015
Figure 16. Super capacitors battery voltage 23 July 2025 07:00 to 25 July 2025 07:00.
Applsci 15 11059 g016
Table 2. Irradiance measurement error on sunny day.
Time PeriodIrradiance Measurement Error [%]
Error vs. Solar METError vs. Si-420TC-TAverage
Sunrise to 9:592.882.452.67
10:00 to 15:591.740.831.29
16:00 to 18:591.163.622.39
19:00 to sunset2.803.773.29
Table 3. Irradiance measurement error on cloudy day.
Time PeriodIrradiance Measurement Error [%]
Error vs. Solar METError vs. Si-420TC-TAverage
Sunrise to 9:592.181.361.77
10:00 to 15:591.792.191.99
16:00 to 18:592.043.832.94
19:00 to sunset1.902.071.99
Table 4. Solar irradiance sensors comparison.
ParameterSensor
IMT Solar Si SeriesAtersa Solar METKipp Zonen SMP SeriesOur Solution
Irradiance0–1200 W/m20–1400 W/m20–1500 W/m20–1200 W/m2 (can be extended)
Cell temperature sensorYesYesYesYes
Ambient temperature sensorOptionalYesOptionalYes
Output typeAnalog/RS-485RS-485Analog/RS-485Wireless/RS-485
(different versions) (different versions)
ProtocolsModbus RTUModbus RTUModbus RTUWi-Fi/ZigBee/MQTT, Modbus TCP,
Modbus RTU (can be extended)
Power supplyWiredWiredWiredBattery/Wired
Price≥400 € [51]≥450 € [52]≥1000 € [53]165 € (BOM)
Disclaimer/Publisher’s Note: The statements, opinions and data contained in all publications are solely those of the individual author(s) and contributor(s) and not of MDPI and/or the editor(s). MDPI and/or the editor(s) disclaim responsibility for any injury to people or property resulting from any ideas, methods, instructions or products referred to in the content.