1. Introduction
Micro-resolution control of ultrasound fields in three-dimensional space is increasingly important in various engineering applications including ultrasound therapies [
1,
2], non-contact particle manipulation [
3,
4], bio-sample patterning/processing [
5,
6], cavitation control [
7], and medical imaging [
8]. Conventional ultrasonic beam control methods typically rely on either a single-focus lens or multi-foci beamforming with a phased array transducer [
9]. A single-element transducer with a spherical curved lens offers simplicity but requires mechanical wobbling or scanning for flexible beam control. In contrast, multi-element phased arrays enable electronic beam steering and focusing; however, their performance comes at the cost of high system complexity and expensive multi-channel electronics. Moreover, phased-array systems still face technical challenges in accurately reconstructing complex or high-resolution multi-target fields, particularly when multiple focal spots or intricate spatial patterns must be generated simultaneously [
10]. To address these limitations, acoustic holograms have emerged over the past decade as a versatile tool in ultrasonic engineering [
11].
Acoustic holograms, which encode a desired wavefront through phase and/or amplitude modulation at a hologram plane, enable highly customizable reconstruction of complex acoustic fields at a predefined target plane [
11,
12,
13]. They consist of high-resolution, pixelized (<100 µm) two-dimensional height profiles that precisely control the time delay across the aperture [
14]. With the advancement of 3D printing, phase plates with pixel counts orders of magnitude higher than those of phased arrays or 2D matrix arrays can now be fabricated, for example, a ~300 × ~300 pixel phase map for 1.5 MHz waves achieved via stereolithography (SLA) 3D printing to generate a pressure amplitude profile with a predefined complex shape with the line width of 0.88λ, where λ is the wavelength of the acoustic medium [
15]. Consequently, acoustic holograms have been actively utilized across a wide range of ultrasonic applications with associated design methodologies and acoustic hologram lens fabrication techniques [
15,
16,
17].
Direct time-reversal (TR) approaches can retrieve the hologram profile in a single back-propagation step, inherently compensating for medium-induced aberrations and making them particularly suitable for transcranial applications such as blood–brain barrier opening, neuromodulation, or tumor ablation [
16,
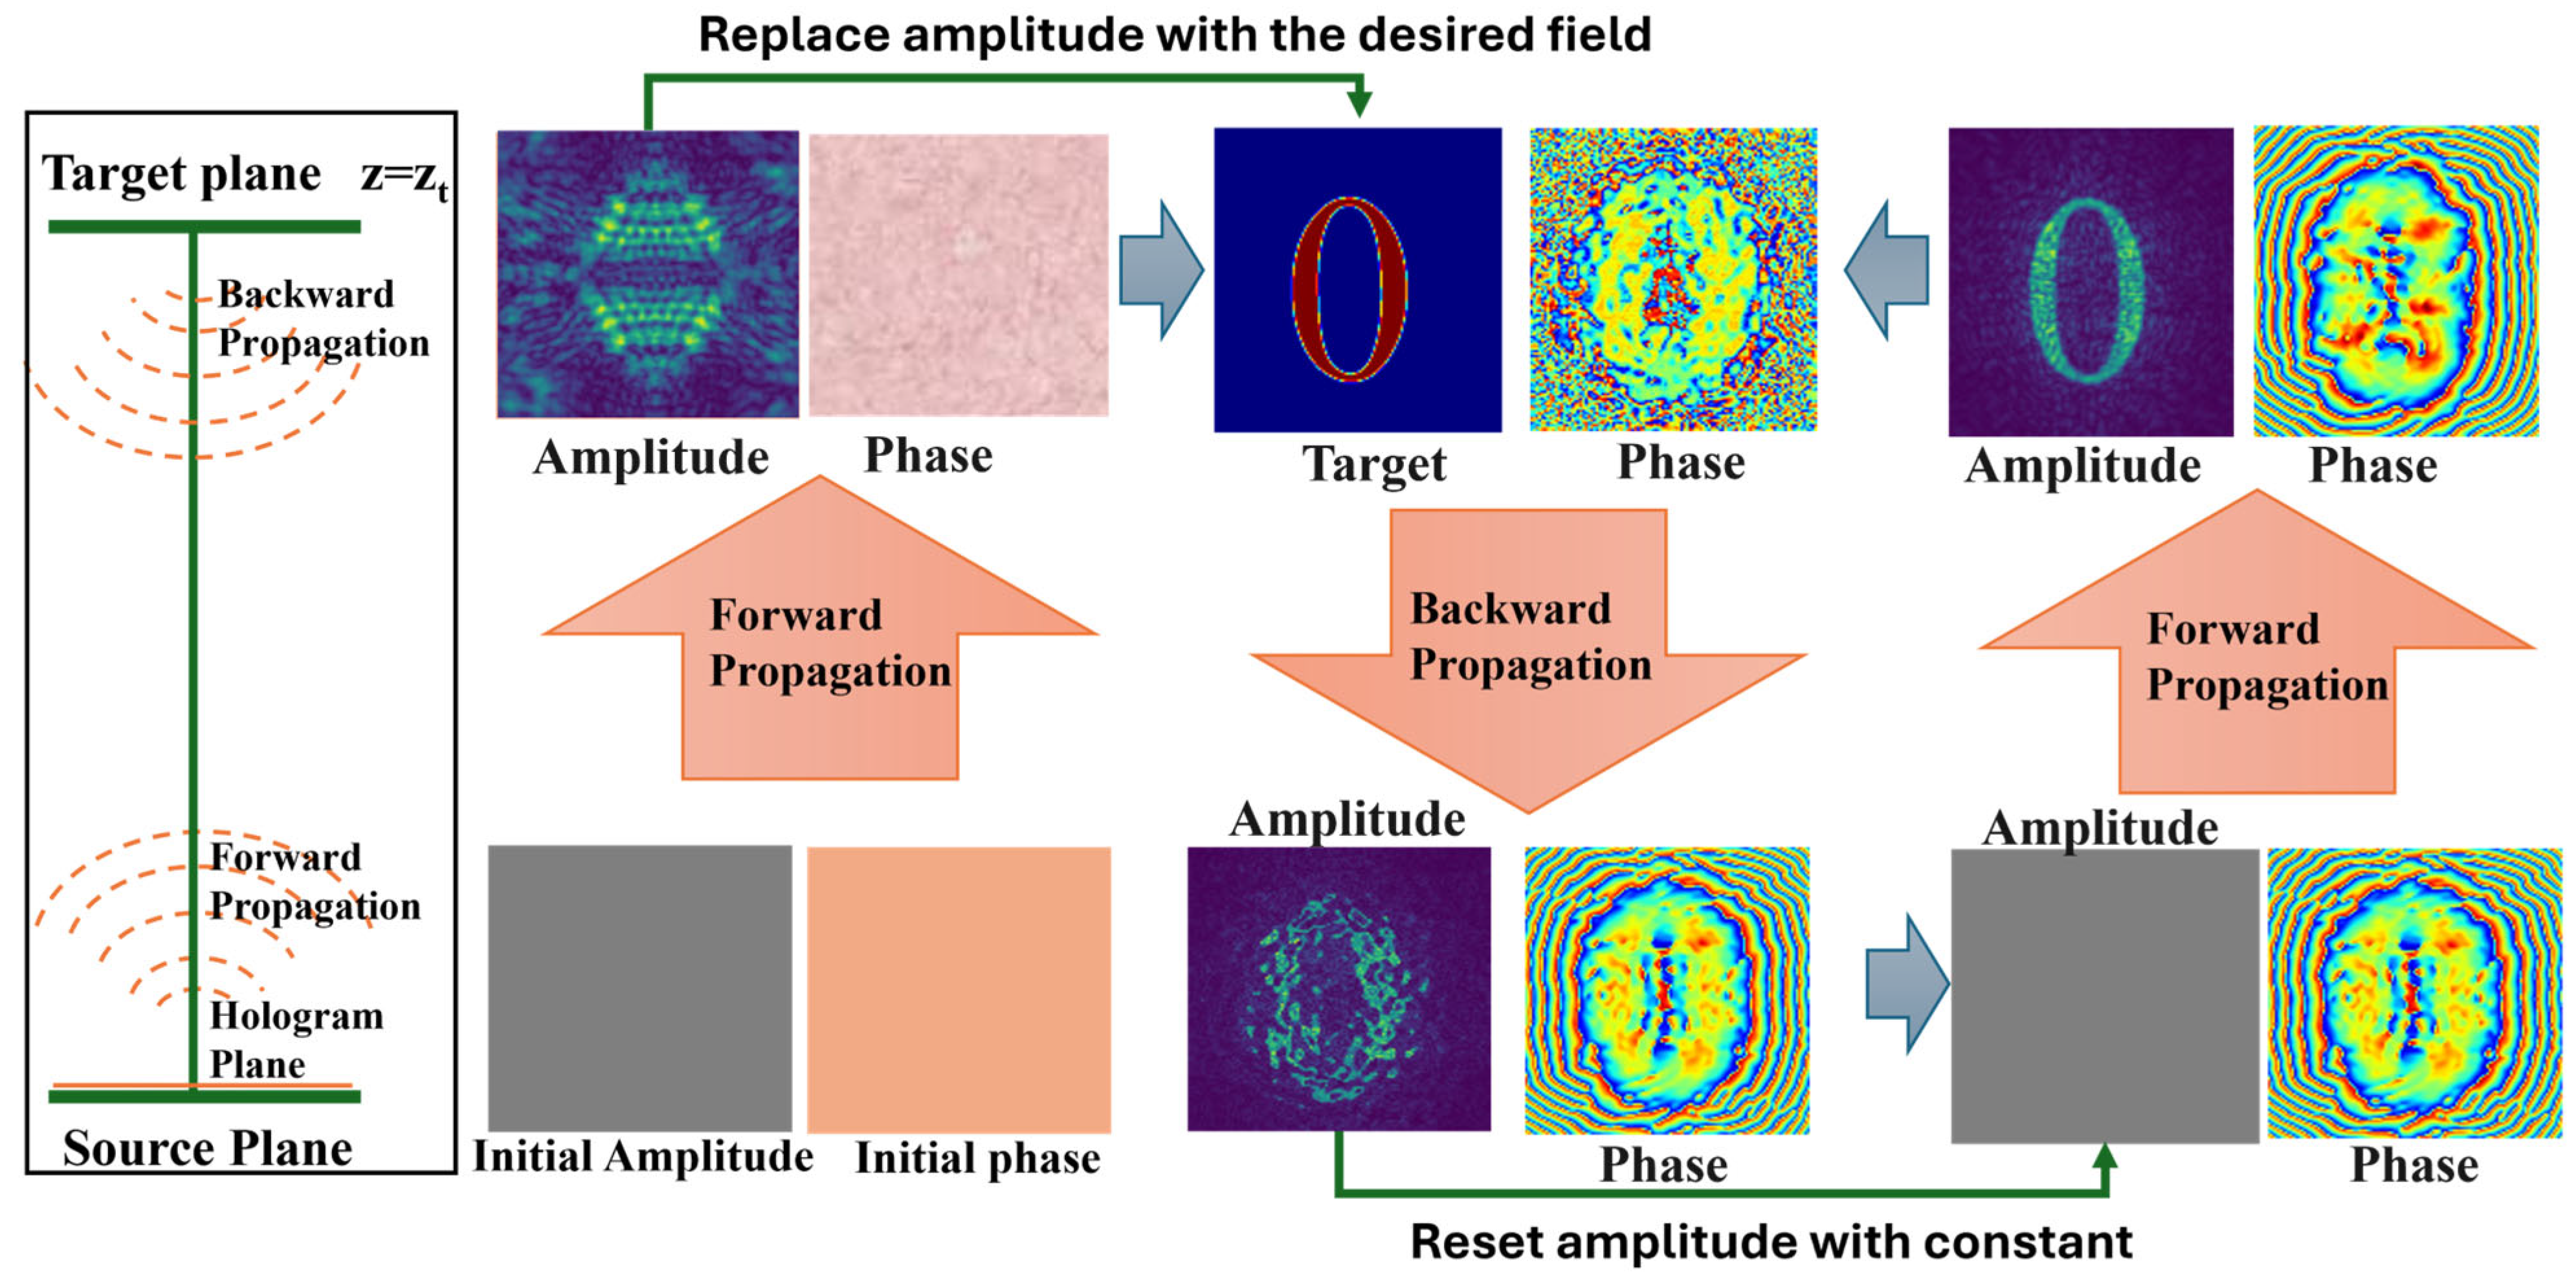
18]. In contrast, a standardized design method in free-field holography is the iterative angular spectrum approach (IASA), which typically requires more than 50 iterations to sufficiently converge [
11]. Although less efficient in heterogeneous media, IASA remains attractive in homogeneous conditions (e.g., water or air) because of its flexibility in enforcing arbitrary pressure distributions. Recently, acoustic hologram reconstruction has further advanced through diverse strategies, ranging from conventional numerical methods to modern artificial intelligence-based frameworks, including differentiable optimization [
3], deep learning models [
19], and physics-informed neural networks [
20]. Despite this progress, most prior research has concentrated on hologram design strategies and the accuracy of reconstructed pressure patterns at a single operating frequency, often chosen arbitrarily without systematic justification.
While the theoretical resolution limit is often taken as the diffraction limit (~λ/2) [
21], the systematic influence of excitation frequency, or equivalently, acoustic wavelength, on reconstruction fidelity, spatial resolution, and energy efficiency remains little explored. Excitation frequency plays a critical role in determining spatial resolution, penetration depth, attenuation losses, and overall transmission efficiency, yet its influence on holographic reconstruction has not been comprehensively examined using consistent evaluation metrics, although a simple qualitative analysis was previously conducted by simulation [
22]. This gap is critical for phase-only passive acoustic holograms, which with phase wrapping [0, 2π] are typically frequency-specific and non-reconfigurable; however, if the phase is fully unwrapped (continuous values) before height conversion, a single hologram can function across multiple frequencies, albeit with reduced fidelity. This frequency dependence introduces practical design constraints that directly influence the quality and robustness of pressure field reconstruction [
22].
To address this issue, the present study performs a frequency-dependent fidelity analysis of phase-only holographic reconstruction, holding common design parameters constant (e.g., aperture size, focal distance, initial excitation pressure amplitude, etc.) while varying excitation frequency from 0.75 to 4 MHz. Reconstruction accuracy is then quantitatively assessed using standardized performance metrics to reveal how frequency fundamentally governs hologram fidelity. This study aims to provide a frequency-resolved understanding of how wavelength governs trade-offs between spatial fidelity, energy distribution, and feasibility in passive hologram design, while offering practical guidelines for frequency selection and supporting the development of application-specific acoustic holography systems.
3. Results
As a result,
Figure 3 illustrates the frequency-dependent evolution of the chessboard target’s acoustic pressure field reconstructed via the acoustic hologram for each excitation frequency. Before quantitative evaluation, we qualitatively analyze the pressure amplitude reconstruction results. At the lower frequencies of 0.75 to 1.0 MHz, the lateral effective point-spread function (PSF) is broad, resulting in rounded edges and dominant halo artifacts around the squares. As the frequency increases to the 1.5 to 2.0 MHz range, the PSF narrows, allowing higher spatial harmonics near the edges to fall within the propagating band. This results in sharper square edges and flatter interiors, improving target fidelity. At even higher frequencies between 3 and 4 MHz, the smallest feature details become more sharply defined; however, faint ringing artifacts appear along high-contrast boundaries, which are characteristics of phase-only holographic synthesis under band-limited conditions. These results highlight how frequency governs spatial resolution and diffraction behavior in acoustic holography, balancing detail enhancement with artifact emergence typical of constrained phase-only reconstruction methods.
This frequency-dependent performance can be further understood by relating the chessboard’s characteristic feature size to the wavelength-limited resolution of the aperture. The embedded chessboard pattern occupies about one-third of the 45 mm aperture, giving an overall tile size of approximately 15 mm across. Within this tile, the 11 × 11 division yields individual square widths of about 1.36 mm. This pitch defines the fundamental spatial frequency of the pattern at roughly 0.74 cycles/mm (1/p), while the sharp edges are encoded in higher harmonics such as 3/p ≈ 2.2 cycles/mm and 5/p ≈ 3.7 cycles/mm. The aperture’s diffraction-limited lateral resolution can be estimated as δ ≈ 1.22 × λ × z/D, where λ = c/f is the wavelength, D = 45 mm is the aperture width, and z = 25 mm is the distance. At 0.75 MHz (λ ≈ 1.99 mm), the resolution is δ ≈ 1.35 mm, which is slightly worse than the 1.36 mm pitch, so adjacent squares are poorly resolved, and the reconstruction is dominated by blurred edges and halo artifacts. At 1.0 MHz (λ ≈ 1.49 mm, δ ≈ 1.01 mm), the system begins to resolve the 1.36 mm squares, allowing the fundamental frequency to pass, but higher harmonics remain suppressed, and edges still appear soft. At 1.5 MHz (λ ≈ 0.99 mm, δ ≈ 0.67 mm), the resolution limit drops below p/2, allowing the third harmonic to enter the passband. This results in sharper edges, flatter interiors, and peaks in PSNR, uniformity, and efficiency. At 2.0 MHz (λ ≈ 0.75 mm, δ ≈ 0.51 mm), the resolution reaches about p/2–p/3, meaning nearly all structural content of the chessboard is captured, and cross-correlation and efficiency reach their maxima. At higher frequencies such as 3.0 MHz (λ ≈ 0.50 mm, δ ≈ 0.34 mm), additional higher-order harmonics are admitted, which further sharpen edges but also increases ringing artifacts and local variance to the features that are already fully reconstructed by lower frequency.
This frequency–feature size relationship also aligns with the intrinsic target descriptors reported in
Table 2, which capture differences in area coverage, edge density, and high-frequency across the three patterns. These qualitative trends are consistent with the target features summarized in
Table 2. The chessboard, with large area coverage (BAF ≈ 49.6%) and very low high-frequency burden (HF50 ≈ 0.73%), reaches flat interiors and high efficiency once edges enter the passband, with only mild ringing thereafter. In contrast, the dove and KNU logo occupy much smaller areas but carry substantially more fine-detail energy (HF50 ≈ 2.6–3.0%), so their edges continue to sharpen with increasing frequency while becoming more susceptible to high-frequency ringing and local variance.
To quantitatively evaluate the frequency-dependent reconstruction results shown in
Figure 3, five key metrics were computed for the main chessboard target and summarized in
Table 3: MSE, PSNR, cross-correlation, uniformity, and efficiency. From 0.75 to 1.5 MHz, the accessible spatial frequency band broadens, and the lateral PSF significantly narrows. This results in a marked reduction in error energy, with MSE decreasing from 0.0145 to 0.0105. Correspondingly, PSNR increases, reaching its peak value of 19.7503 dB at 1.5 MHz, indicating improved overall reconstruction fidelity. As interference between adjacent tiles diminishes, the uniformity metric improves, also peaking at 1.5 MHz with a value of 0.9377. The global structure of the pressure field better matches the target design, leading cross-correlation to rise continuously and reach its maximum of 0.9297 at 2.0 MHz, even as PSNR begins to decline slightly. Moreover, the contracting PSF concentrates more acoustic energy within the chessboard region of interest, translating into enhanced efficiency, which increases steadily from 0.6759 at 0.75 MHz to its maximum of 0.7014 at 2.0 MHz. Together, these metrics capture the interplay between frequency, spatial resolution, and reconstruction accuracy, illustrating how increasing frequency sharpens feature rendition while balancing energy concentration and error reduction within the holographically generated acoustic field.
However, beyond 2 MHz, the finite aperture causes the useful passband to saturate. As a result, further increases in frequency mainly sharpen already well-resolved edges but also introduce mild phase-only ringing artifacts. These artifacts slightly increase local variance and redistribute sidelobes within the reconstructed field. Consequently, MSE exhibits a gradual increase from 0.0115 to 0.0130 (MSE 0.1073 to 0.1142), while PSNR stabilizes around 19 dB (18.8511 to 18.9909 dB). Cross-correlation gently decreases to approximately 0.916–0.917, uniformity fluctuates near 0.926–0.928, and efficiency plateaus or slightly declines to roughly 0.675–0.683 at frequencies of 3–4 MHz. Together, these trends highlight a practical mid-band “knee” between 1.5 and 2.0 MHz: 1.5 MHz optimizes pixel-wise accuracy that is characterized by the lowest error, highest PSNR, and best uniformity, whereas 2.0 MHz maximizes structural similarity and energy concentration, reaching peak cross-correlation and efficiency. Beyond this range, visual sharpness continues to improve; however, global quantitative metrics show diminishing returns due to ringing and saturation effects in the passband. For completeness, we extended the identical frequency sweep to two additional target patterns (
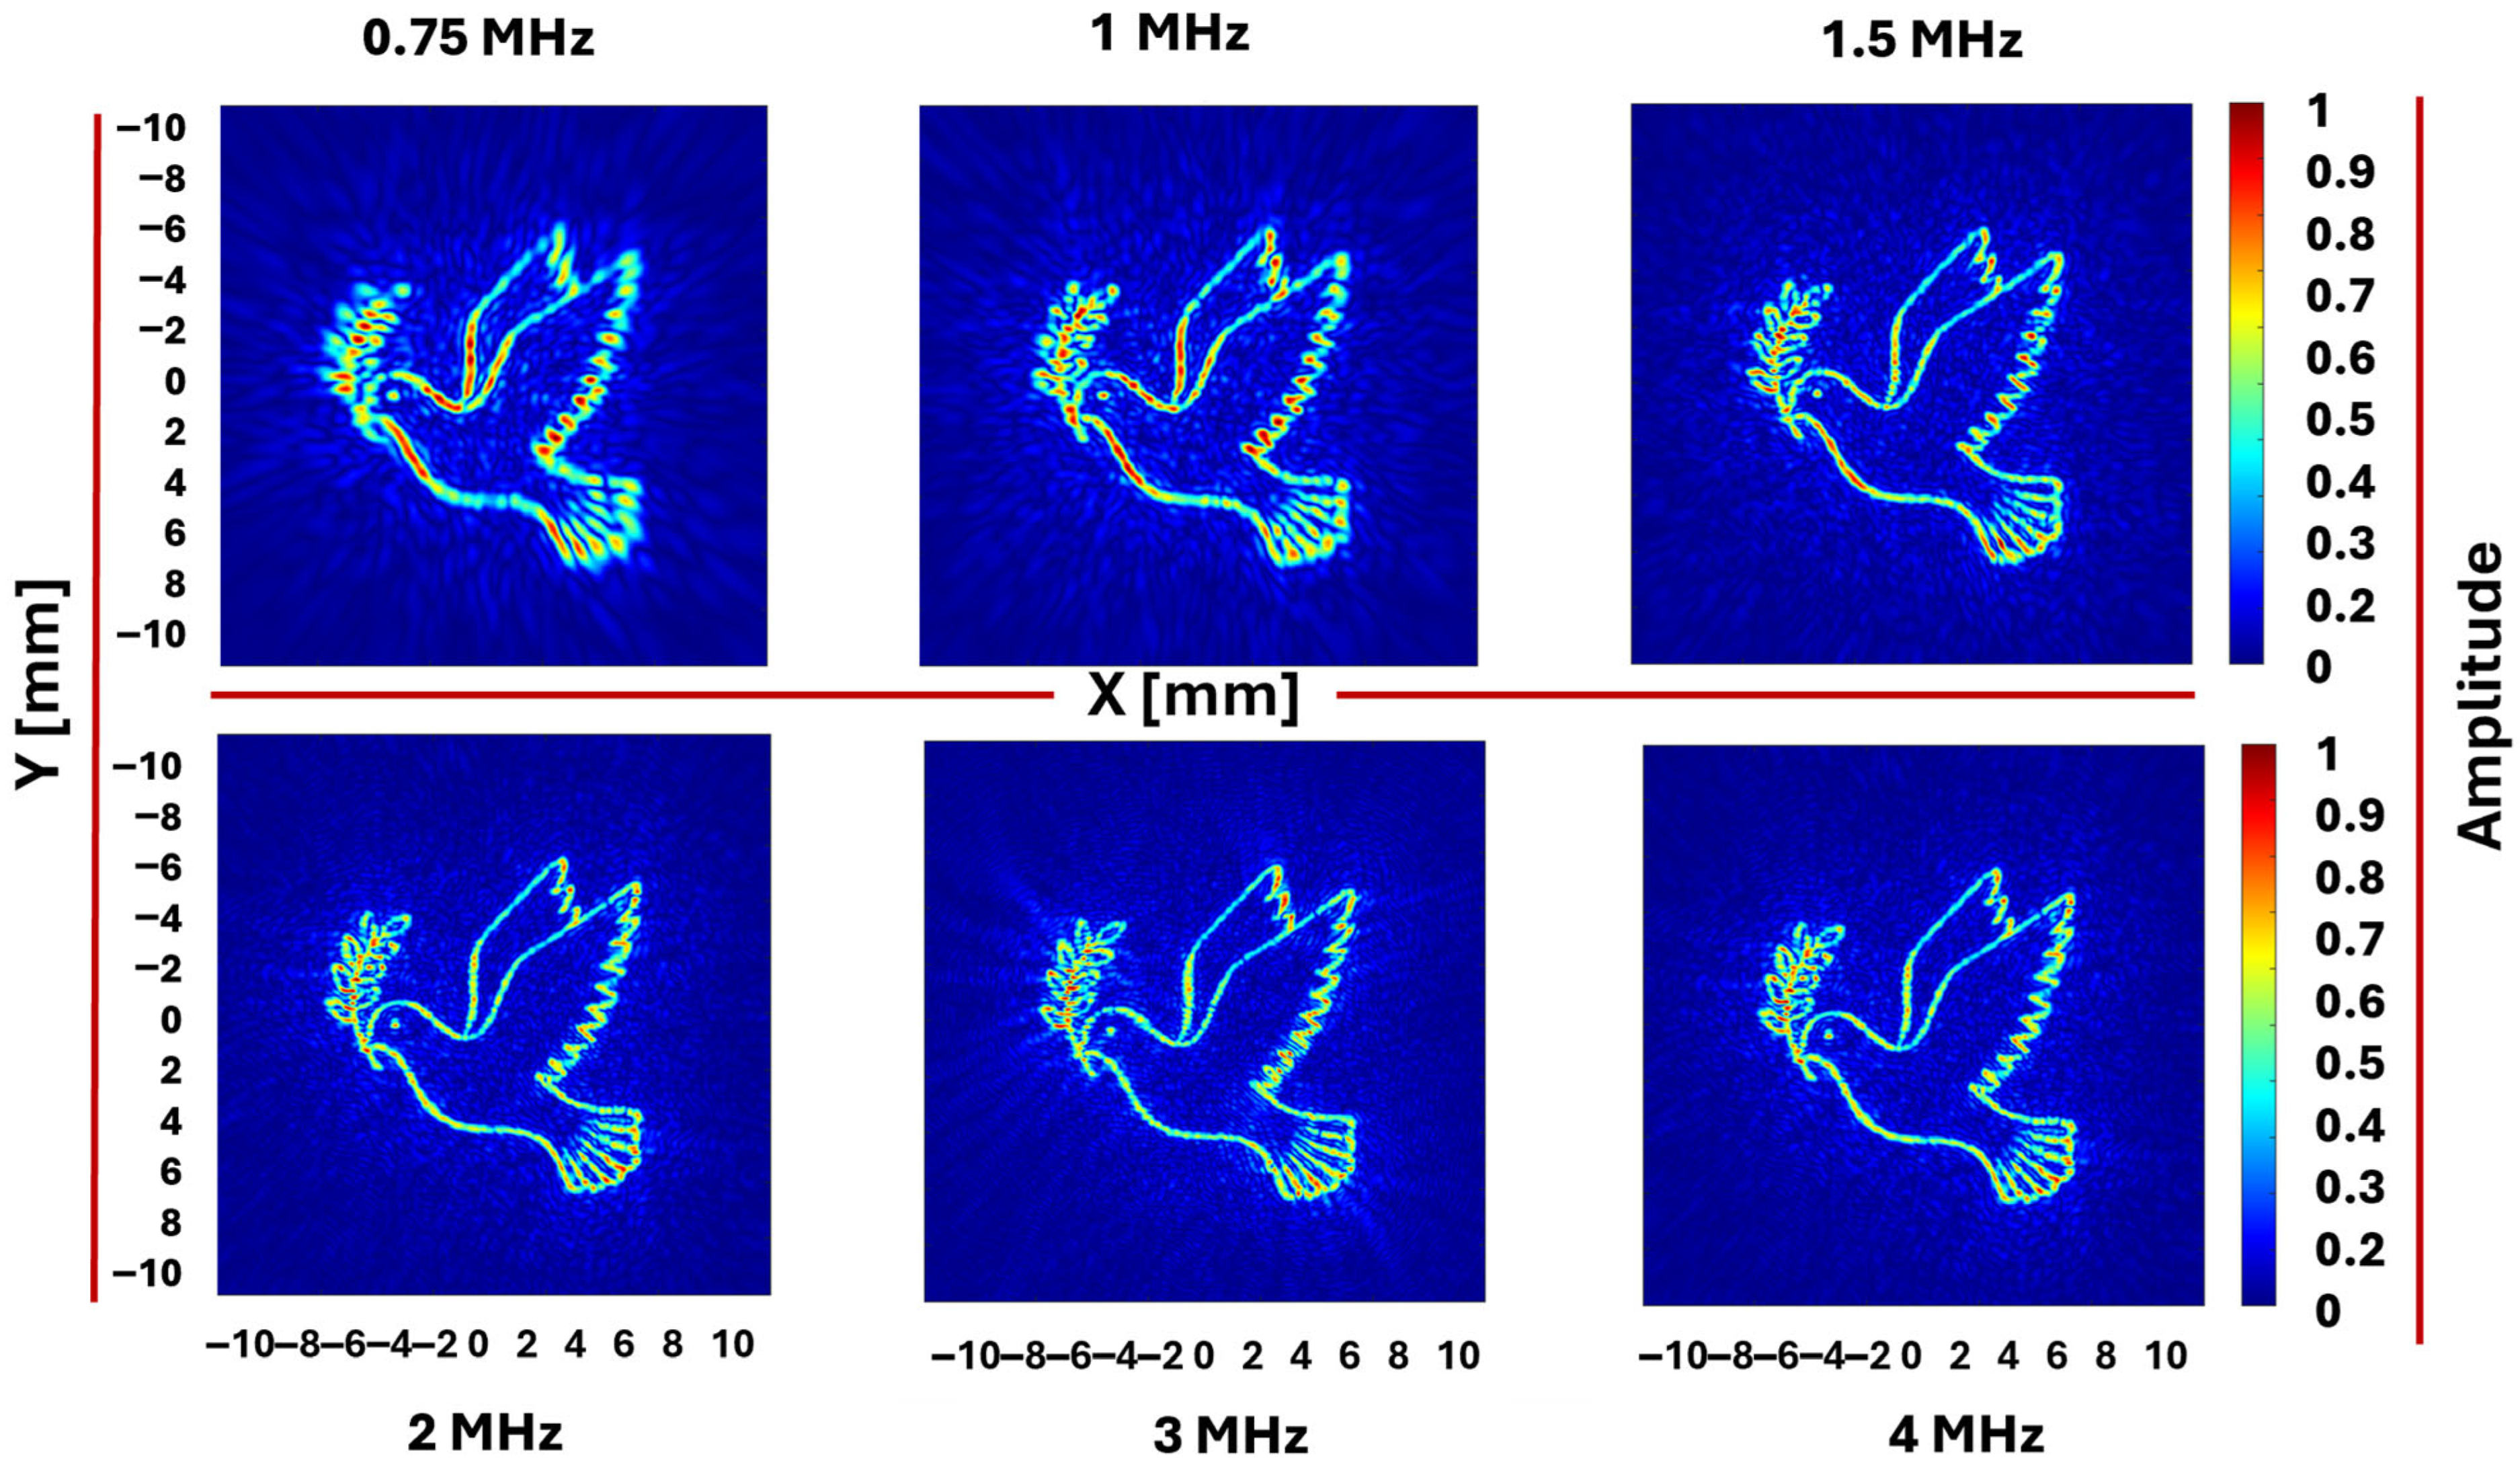
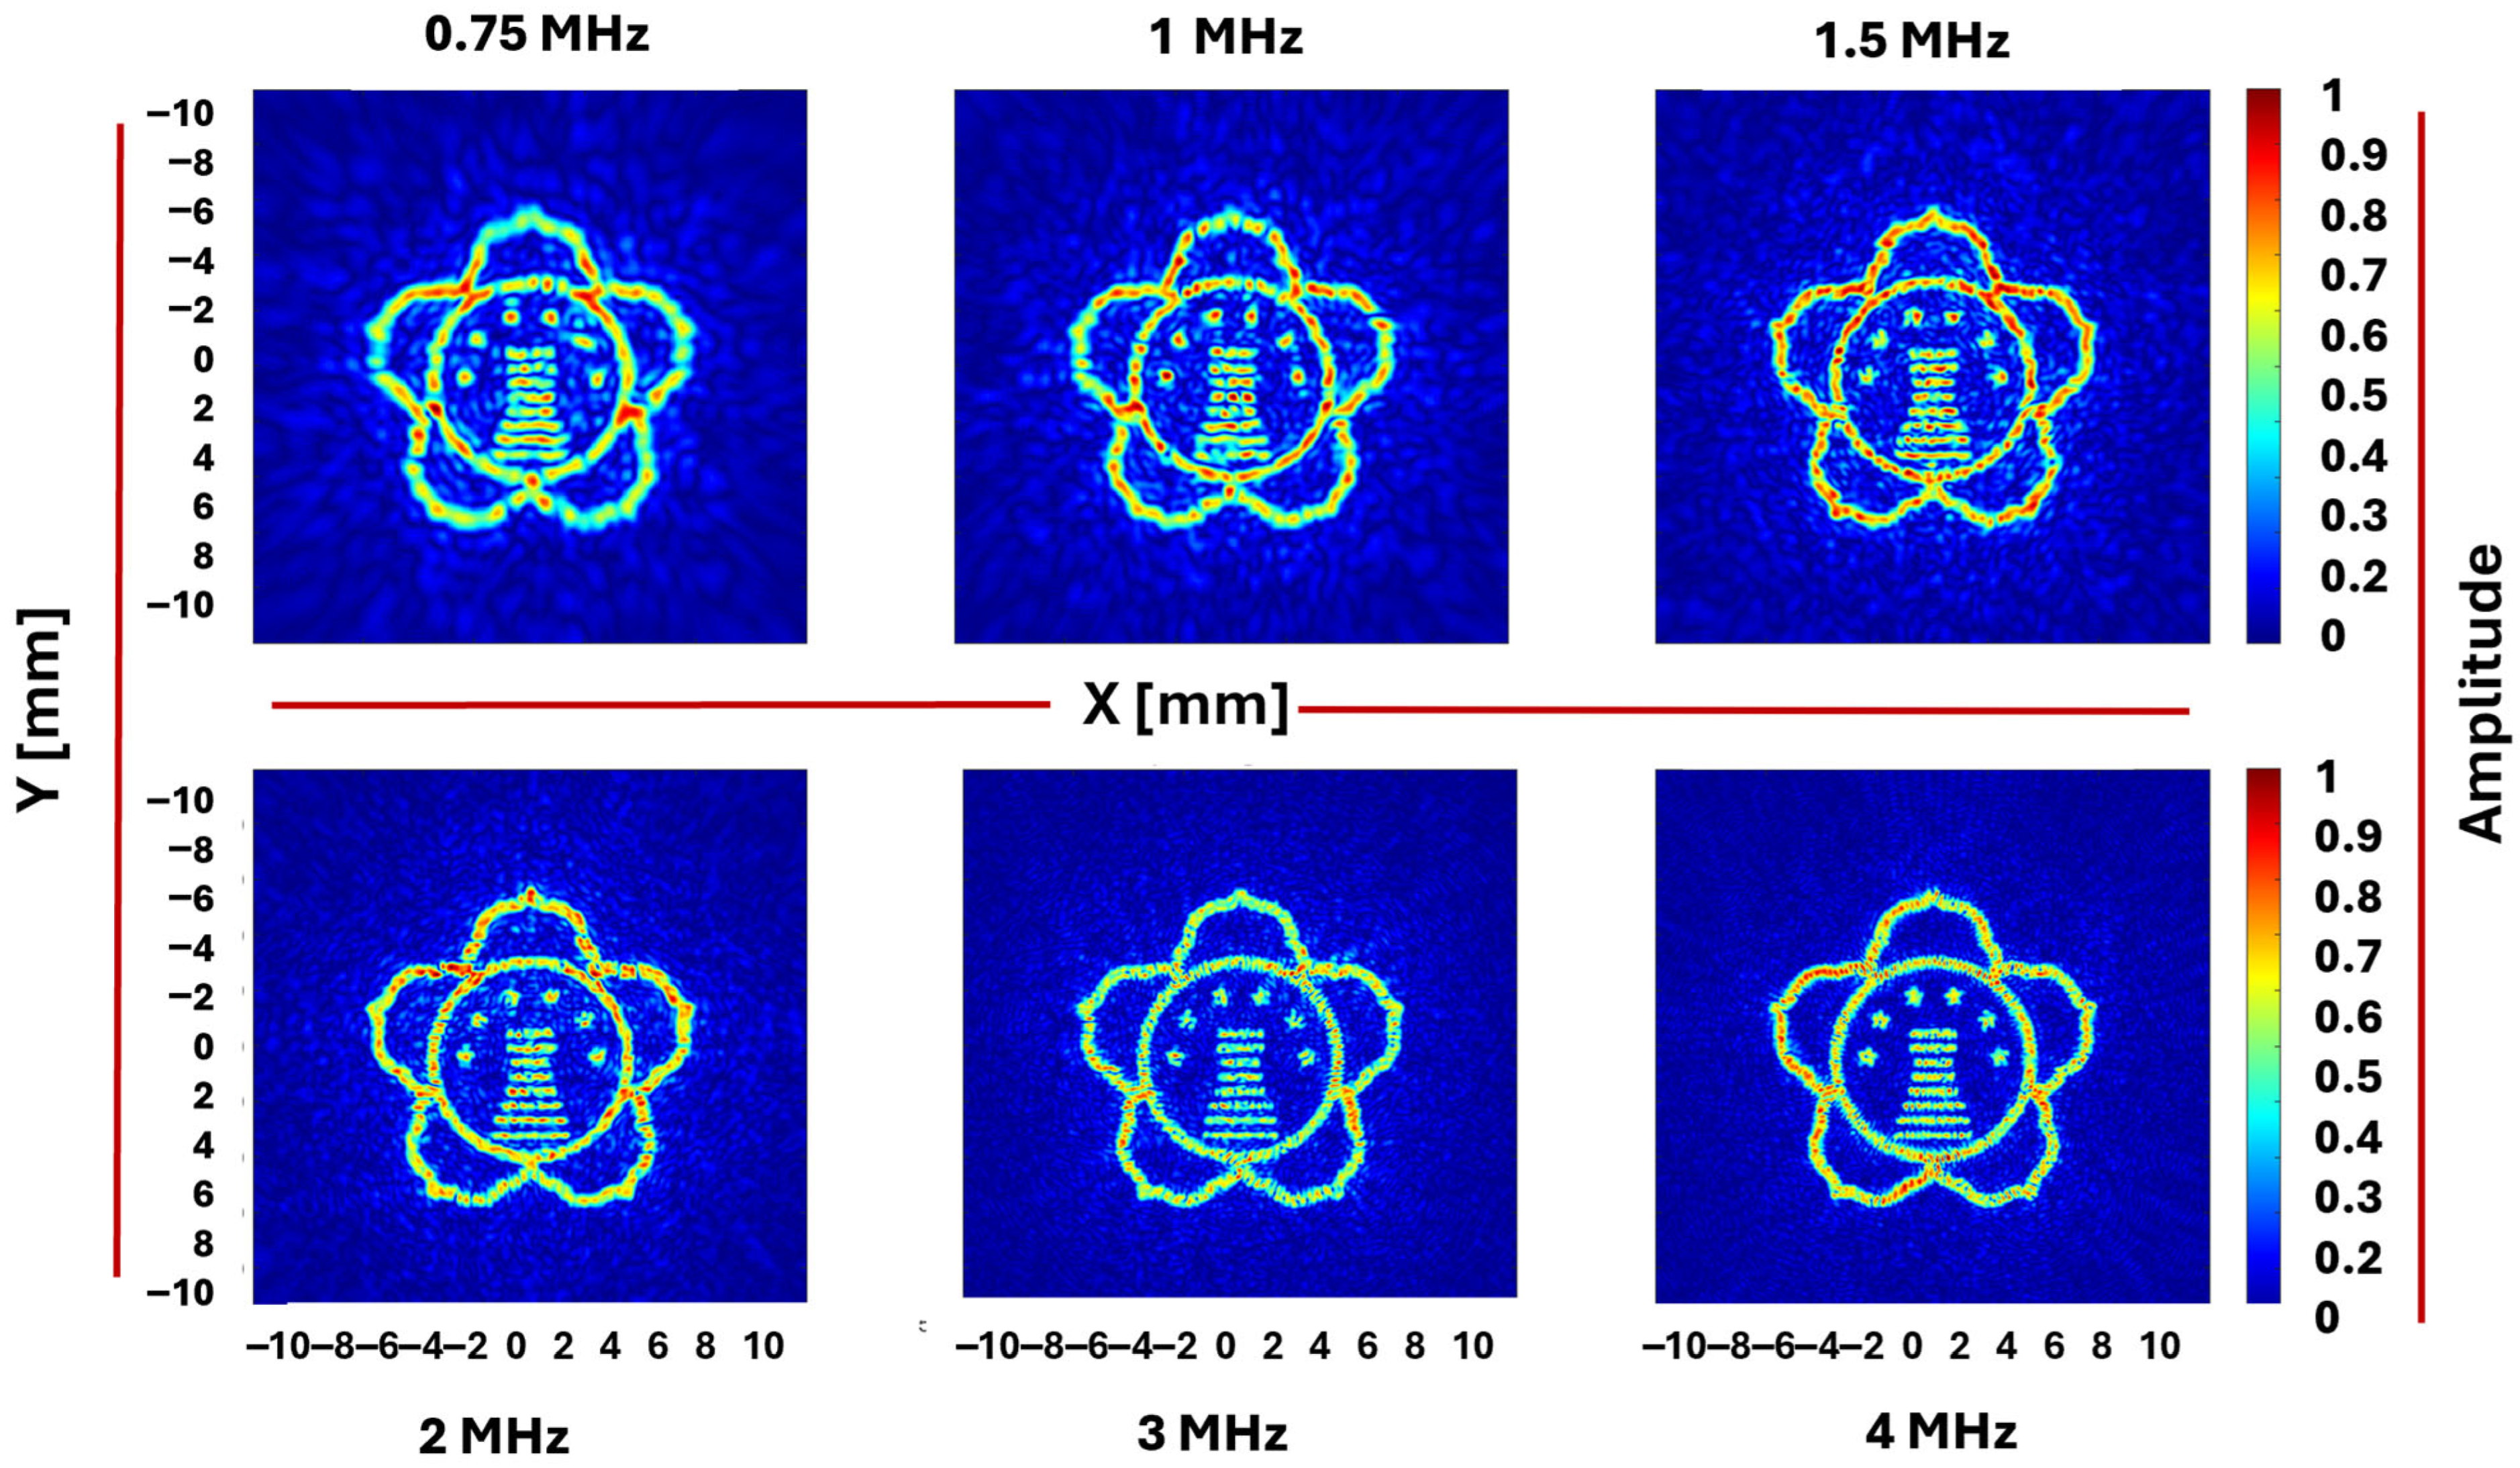
Figure 4), which similarly exhibited the same three-stage behavior observed in Target 1, and thus their detailed descriptions are omitted. At 0.75 to 1.0 MHz, fine details remain blurred, and background halos are significantly uniform interiors, and all metrics improve in concert: PSNR rises, MSE decreases, cross-correlation climbs, uniformity approaches best values, and efficiency grows as more energy is confined within the region of interest. Above 3 to 4 MHz, the smallest features finally become distinguishable; however, global metrics saturate and show minor oscillations due to phase-only ringing edges that increase local variance despite enhanced edge sharpness.
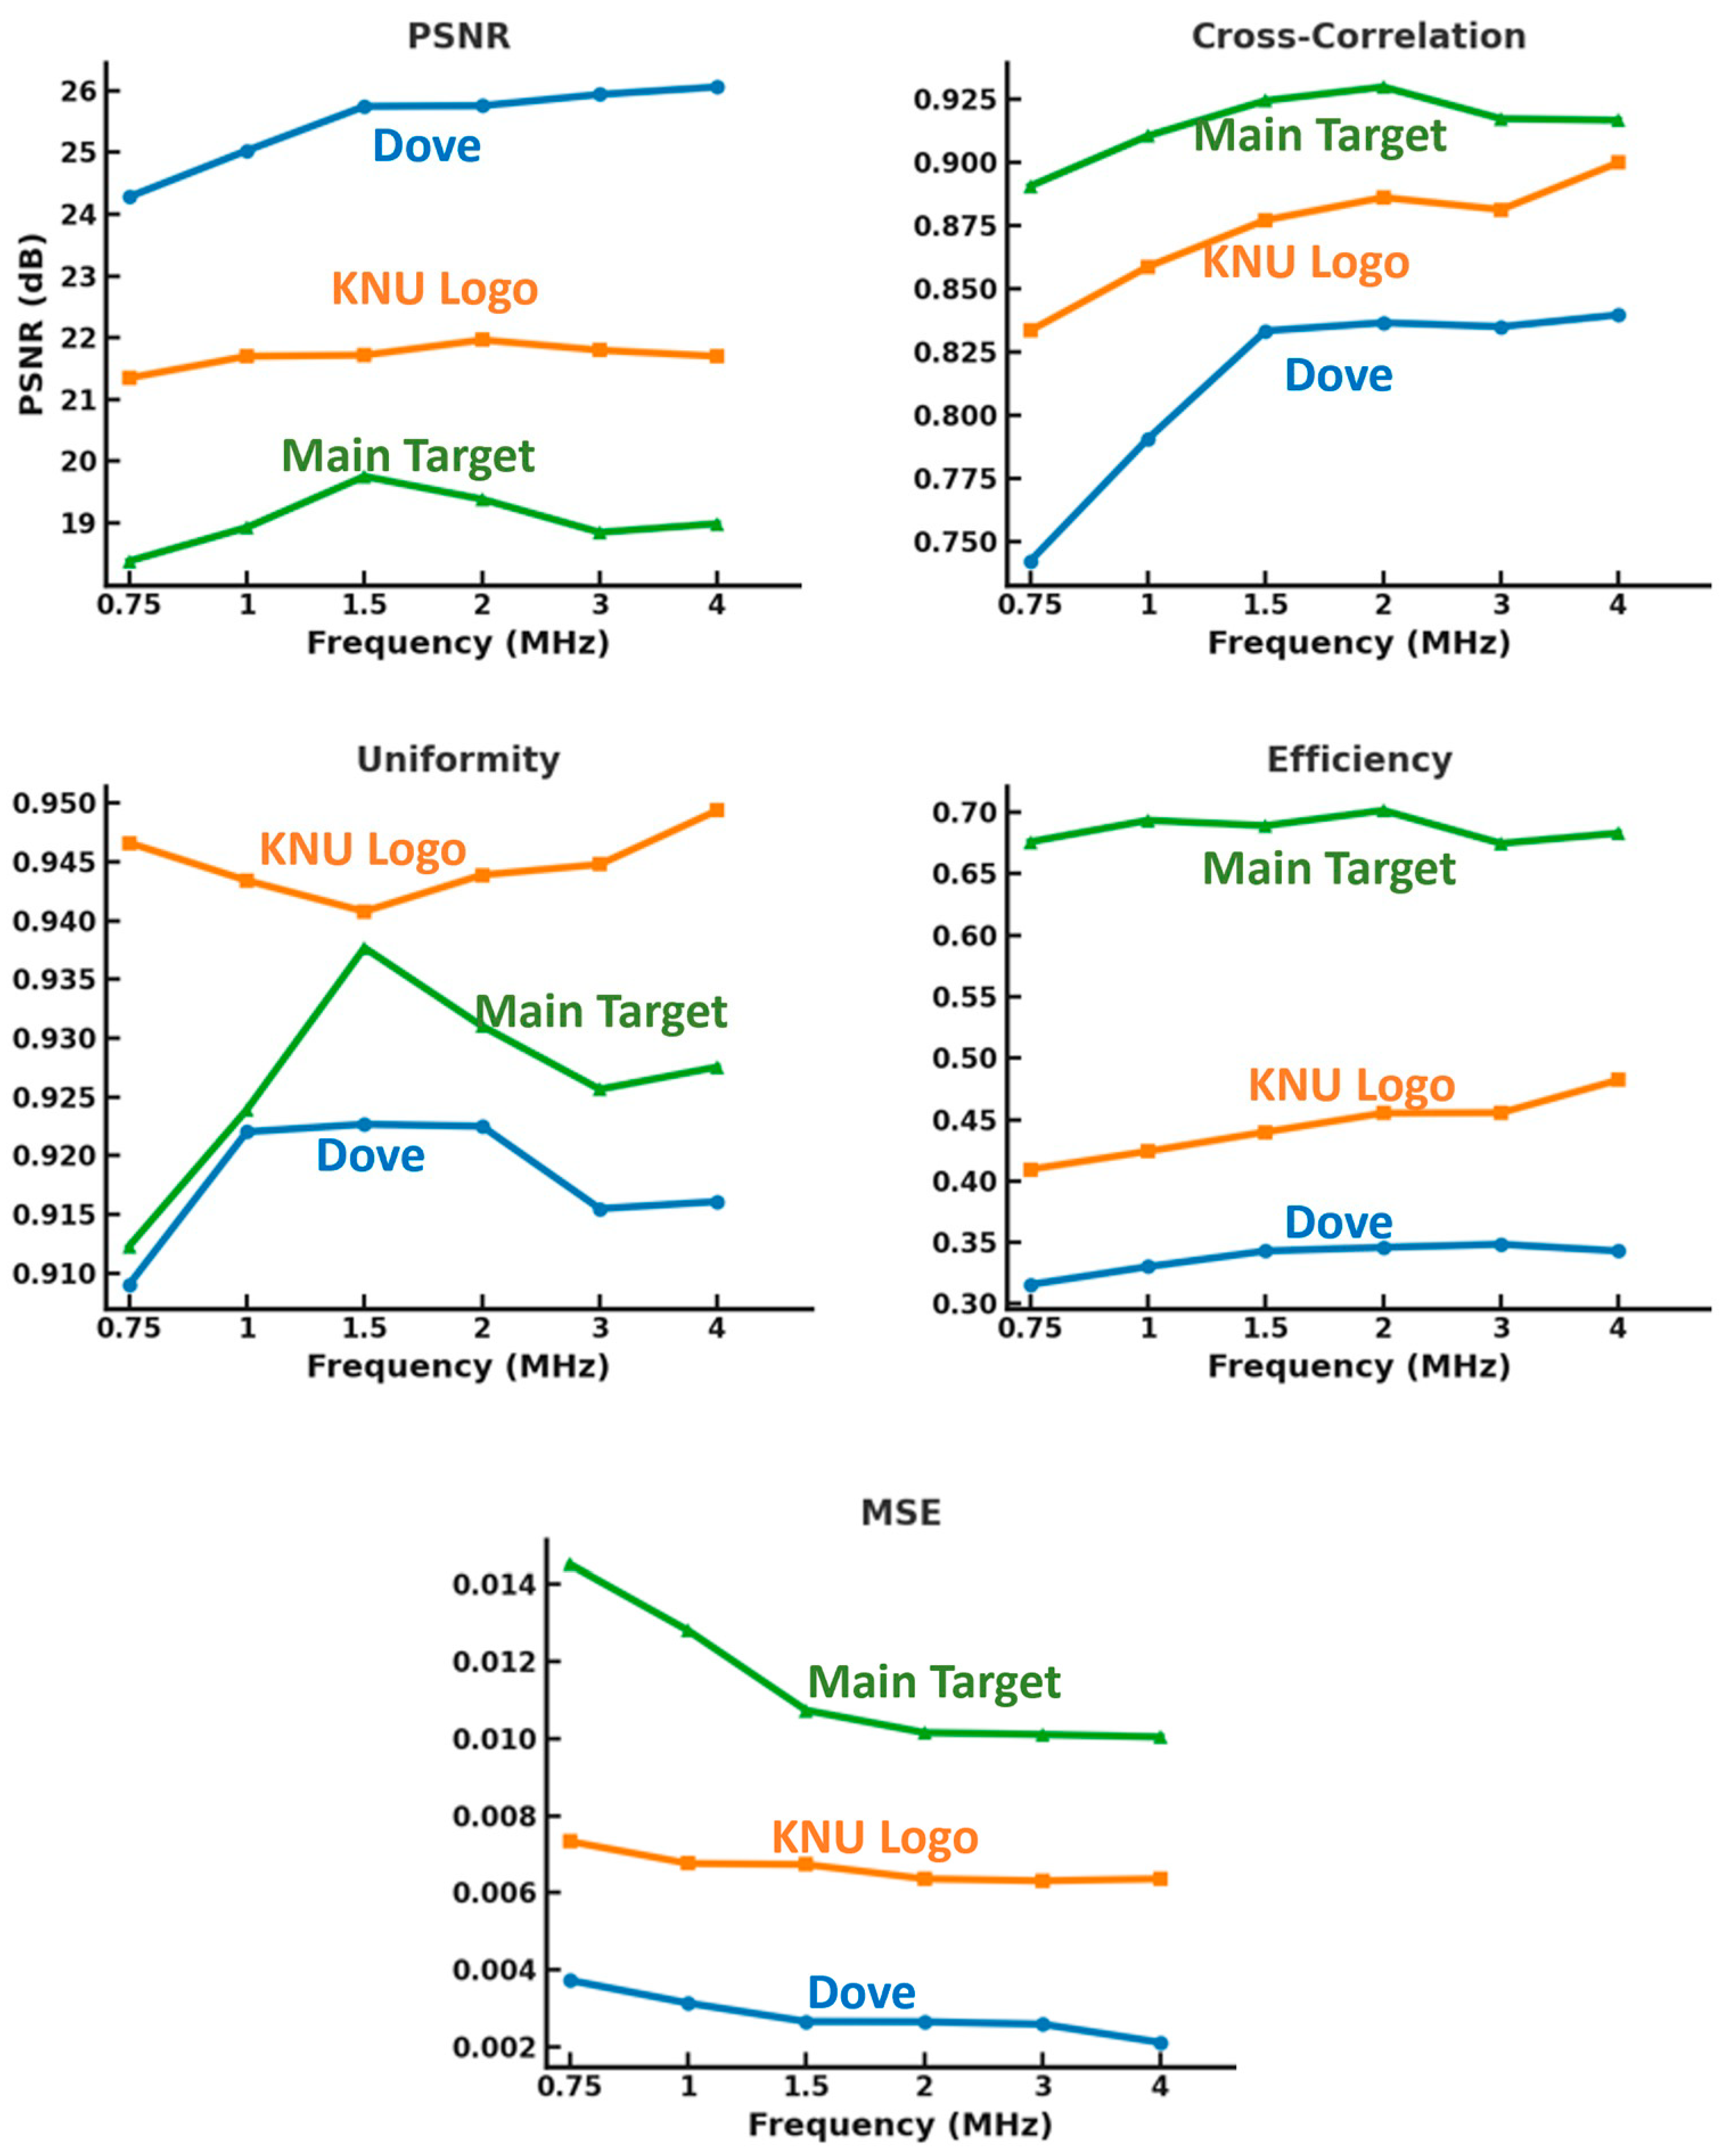
These results collectively reveal that resolution is fundamentally constrained by the diffraction-limited lateral resolution, or the smallest feature spacing the system can resolve. Features narrower than this limit remains merged at low frequencies, became separable at the mid-band, and only the finest details emerge at the highest frequencies. This frequency-dependent behavior observed for Target 1 thus generalizes well to other target geometries. Comparing the three targets’ metrics across frequency shows overall performance improvement with frequency, but the metric curves diverge at specific frequency bands due to differences in feature size and complexity among the targets. This analysis presents the trade-offs involved in acoustic hologram design, where increasing frequency enhances spatial resolution and feature clarity but introduces artifacts and performance limits imposed by system aperture and sampling.
In the primary target, all features share identical dimensions; thus, once the system’s diffraction-limited lateral resolution fully resolves this characteristic feature size at a given frequency, further frequency increases yield minimal gains in resolution. This results in performance metrics improving consistently up to a mid-band, beyond which they saturate, as shown in
Figure 5. The other two targets, featuring diverse lengths, widths, and curvatures, follow similar trends but exhibit approximately 5% deviation relative to the primary target. Notably, the uniformity metric varies non-monotonically because each target balances interior area and edge density differently within the ROI, causing uneven frequency response. For instance, the KNU logo has large homogeneous regions and few sharp edges, leading to early stabilization of interior uniformity and only minor mid-band fluctuations due to transient energy concentration at junctions. Conversely, the edge-dense chessboard, with sharp tile boundaries, shows an initial uniformity increase as cell interiors flatten, followed by slight decreases at higher frequencies due to phase-only ringing that raises local variance despite sharper edges. The dove target, dominated by thin strokes with little interior, exhibits persistent elevated local variance and a lower, flatter uniformity curve, with minor oscillations as various stroke widths become resolvable.
To further examine the role of feature distribution and spatial complexity on reconstruction performance, we performed a quantitative analysis of the three target patterns. Pixel counting revealed that the chessboard occupied approximately 49.6% of the pixels, while the dove and KNU logo occupied only approximately 8.3% and 2.1%, respectively. This difference in illuminated area directly affects efficiency but also interacts with boundary complexity: the chessboard, with relatively high edge density, experiences stronger mid-band uniformity gains as its many tile interiors flatten, whereas the dove and KNU logo, with far smaller brighter regions and lower edge density, exhibit distinct uniformity behavior. The KNU logo achieves the highest uniformity because its large homogeneous interiors dominate despite occupying only 2% of the aperture, while the dove remains lowest in uniformity since its energy is concentrated along thin strokes where ringing offsets interior smoothing.
This analysis indicates that the chessboard distributes acoustic energy across nearly half of the aperture, reducing effective focal gain, whereas the other two patterns concentrate energy into much smaller regions. Complementary frequency-domain analysis using 2D FFT confirmed these differences: the chessboard exhibited predominantly low-frequency components, consistent with its repetitive block structure, while the dove and KNU logo displayed broader spectra with stronger high-frequency contributions due to their sharper outlines and finer details. These quantitative measures explain the observed reconstruction results: the chessboard achieved higher efficiency because of its large, illuminated area but suffered reduced fidelity (lower PSNR and CC) as the energy was spread thinly across many pixels. In contrast, the dove and KNU logo, which occupy fewer pixels, produced reconstructions with higher focal gain and better pixelwise fidelity, but with increased edge-related ringing and nonuniformity arising from their higher spatial frequency content.
Beyond the above trends, it is important to note that frequency selection involves trade-offs, making 1.5–2.0 MHz the optimal range. While fidelity improves with increasing frequency, further gains are constrained by stronger acoustic attenuation and the fabrication complexity of high-resolution holograms [
32]. This creates a balance between spatial resolution, attenuation losses, and practical feasibility. Accordingly, we selected 1.5–2.0 MHz as a practical operating band, since it provides the best compromise between reconstruction accuracy and experimental realizability for the present target geometries. We also emphasize that this choice is application-dependent: in medical contexts, where extremely fine resolution is critical, higher frequencies may still be preferred, while attenuation and fabrication challenges can be mitigated through additional techniques.
4. Discussion
The analysis demonstrates that spatial resolution in acoustic holography is fundamentally constrained by the diffraction-limited lateral resolution relative to feature size [
33,
34]. Features smaller than resolution limit remains unresolved, while finer features become distinguishable near a mid-band and only the finest details fully emerge at higher frequencies. This frequency-dependent reconstruction behavior generalizes across different target geometries due to inherent spatial scale differences, underscoring the importance of considering both global morphology and local spatial frequency content in evaluating reconstruction fidelity and optimizing hologram design [
11].
Our findings align with and extend prior work showing that increasing frequency improves spatial resolution up to a saturation point. Melde et al. demonstrated that shorter wavelengths yield tighter focal spots and enhanced resolution but exacerbate diffraction-induced artifacts in phase-only systems [
11]. It was also previously reported that performance plateaus emerge at high frequencies due to aperture-limited spectral support, a phenomenon that is quantitatively confirmed in our analysis [
35].
As excitation frequency increased from 0.75 to 2.0 MHz, reconstruction improved considerably: MSE decreased steadily, PSNR peaked at 19.75 dB around 1.5 MHz, and cross-correlation reached a maximum of 0.9297 at 2.0 MHz, indicating optimal structural alignment. Beyond this range, gains diminished because the effective passband was saturated by system aperture and sampling, and additional high-frequency components only sharpened already resolved features while introducing mild phase-only ringing that slightly degraded quantitative metrics [
36,
37,
38]. This frequency-dependent performance was consistent across all target types but varied with geometric complexity. The KNU logo’s large homogeneous areas yielded high uniformity early and stable mid- to high-frequency performance. The edge-rich chessboard exhibited pronounced mid-band gains but saw high-frequency degradation from ringing-induced variance. The dove target, dominated by fine strokes, showed lower uniformity and less mid-band improvement, reflecting persistent variance despite resolution gains.
Comparisons with the literature on IASA-based and angular spectrum methods show our results fall within expected ranges. Prior studies report PSNR values of 18–20 dB and structure similarity up to 0.90 for IASA reconstructions [
19], Consistent with our peak values, while higher frequencies improve spatial resolution, they also face practical limitations: increased attenuation in biomedical and fluid media reduces penetration depth, and fabrication of high-frequency phase-only holograms requires finer, more precise patterning. Importantly, as the wavelength becomes comparable to the resolution of the 3D printer, phase inaccuracies and surface roughness introduce artifacts that distort the target-plane reconstruction, further elevating sensitivity to defects [
5].
Although simulations assume ideal propagation and neglect nonlinear and device-specific effects, they establish a foundation for frequency-aware hologram design. Future experimental validation and development of adaptive-frequency methods tailored to spatial complexity may enable higher-fidelity reconstructions in real applications. This work highlights a core design principle: optimal acoustic holography frequency must balance resolution gains against physical and practical system constraints to suit specific application requirements.


