Abstract
Wall plate rupture in liquid storage structures (LSSs) induced by earthquakes is a prevalent issue. To mitigate the impacts of seismic hazards on plate–shell composite concrete liquid storage structures (CLSSs), in this study, we propose an investigation into X-type mild steel–Shape Memory Alloy (SMA) seismic mitigation control for plate–shell composite CLSSs with sand-layer seismic isolation. Via finite element parametric analysis, this study examines the effects of two key parameters—the sand-layer friction coefficient and the spring-damping ratio of X-type mild steel–SMA seismic mitigation elements—on the dynamic response of CLSSs. The results indicate the following: under unidirectional seismic excitation, the proposed mitigation method achieves a favorable control effect on the maximum principal stress of the structure; under bidirectional seismic excitation, the optimal control effect on the maximum principal stress is achieved when the spring-damping ratio of the mitigation elements is 0.3 and the friction coefficient of the seismic isolation sand layer is 0.4. Additionally, under both unidirectional and bidirectional seismic excitation, this method exhibits a noticeable control effect on the peak liquid sloshing height.
1. Introduction
With the rapid development of the global economy, cities, and industries, liquid storage structures (LSSs)—a category of engineering structure specifically designed for storing various liquids, such as petroleum, chemicals, water, and liquid food, including typical forms like storage tanks, reservoirs, and liquid-containing silos—are increasingly developing towards large-scale and heavy-duty trends. These structures serve as critical infrastructure in fields such as petrochemical engineering, water supply and drainage, and food processing, supporting the stable operation of industrial production and urban life. However, if the seismic performance of LSSs is insufficient, wall cracks and liquid leakage are likely to occur in these structures during earthquakes. Notably, the leakage of specific liquids (e.g., flammable or toxic chemicals) can further lead to environmental pollution and secondary disasters such as fires, posing a direct threat to the personal safety and property of nearby residents. Therefore, achieving effective vibration isolation is of great significance for ensuring the safety and reliability of LSSs.
Wang et al. [1] proposed filling a soil bag with a rubber–sand mixture to improve the stability of the rubber–sand layer and achieve effective seismic isolation. Xu et al. [2] produced 1/4-scaled models of two two-story masonry houses, one with an ordinary seismic structure and one with a sand-layer isolation structure, and conducted shaking table tests on them, which proved that they both had a good seismic effect. Jing et al. [3] carried out testing and computational analysis of the dynamic characteristics of a reinforced liquid storage tank at different liquid level heights using scaled-down experiments and acoustic–solid coupling methods. Sun et al. [4] established a simplified mechanical model suitable for shock-isolated liquid storage tanks. Shrimali and Jangid [5] studied the ground motion response of an isolated LSS by using the simplified mechanical model and finite element method. Qi et al. [6] studied the mechanical behavior of each component of a plate–shell integrated concrete LSS under earthquake action. Cheng et al. [7] studied the liquid–solid coupling response of a steel rectangular water purification structure under different opening arrangements. Li et al. [8] studied the influence of lead rubber isolation-bearing parameters on the ground motion response of large, isolated liquid storage tanks. Yang et al. [9] studied the ground motion response of laminated-rubber isolation spherical liquid storage tanks and found that the control effect of isolation measures on structural velocity and acceleration was remarkable. According to the research results of Shekari et al. [10] and Shekari et al. [11], isolation effectively reduces the dynamic response of the structure, but for long-period ground motion excitation, isolation leads to the opposite effect. Vosoughifar and Naderi [12] found that rubber isolation reduced the base shear stress of the liquid storage structure, but the effect on the sloshing wave height was not obvious.
Based on a frame–shear wall structure, Cao [13] found that a seismic isolation and reduction hybrid scheme could reduce the seismic response of the structure. Compared with traditional isolation methods, the seismic isolation and reduction hybrid scheme had better seismic capacity. Ozbulut and Hurlebaus [14] found that a sliding-type isolation system with a Shape Memory Alloy (SMA) re-centering device could reduce the dynamic response of a structure under different temperature conditions. Dai et al. [15] found that the support system of LSSs is the weak point of the structure by analyzing the shock absorption control of an LSS under the effect of liquid–solid coupling. The shock absorber can be set at the support to achieve better shock absorption effects. Wu et al. [16] developed a new type of isolation device composed of a friction pendulum bearing and U-shaped damper to solve the problem that base-isolated Liquefied Natural Gas (LNG) storage tanks may suffer from pipeline fractures and tank overturning due to the displacement of the bearing exceeding the limit under near-fault earthquakes. Chakraborty and Roy [17] designed a nonlinear elastic spring, which provides an effective re-centering mechanism for the planar sliding base isolation system. These studies have shown that a combined control system composed of isolation and energy dissipation devices has a good control effect on the seismic response of the structure, but these research results are not well applied to the seismic design of concrete liquid storage structures. Curadelli [18] used finite element numerical analysis to analyze the ground motion response of an LSS with an additional energy dissipation device and concluded that the energy dissipation device significantly reduced the ground motion response of the structure.
The comprehensive results of the above research show that adding shock absorbers, especially at the bottom of liquid storage tanks, significantly improves LSSs’ control of their ground vibration response and effectively reduces the liquid sloshing wave height. This study’s main objective and contributions are explicit: it investigates the seismic control effect of “sand-layer isolation + X-type soft steel and SMA shock absorption” on CLSS, quantifies key parameters’ (sand-layer friction coefficient, shock absorber spring-damping ratio) impacts on CLSS’ dynamic response via finite element analysis, fills gaps in combined isolation parameter optimization research for CLSS, provides practical engineering guidance, and enriches the scientific system of LSS combined isolation, with both theoretical and application value.
2. Shock Absorption Design
2.1. Seismic Isolation Design for Sand Layer
The sand layer exhibits favorable viscoelasticity and a low friction coefficient. Under seismic action, it generates significant slip relative to the concrete reservoir structure, thereby dissipating seismic energy and reducing the impact of seismic action on the concrete reservoir structure.
In addition, the sand layer directly bears the upper load and must uniformly transfer the load from the liquid storage structure to the underlying structure. Therefore, under the premise of ensuring sufficient strength, the particle gradation of the sand should be reasonably selected to guarantee uniform particle distribution.
The general principles for selecting sand layer materials are as follows: (1) medium-coarse sand with a hard texture is preferred, while fine-powdered sand, water-bearing frozen sand, and gravel should be avoided; (2) the sand should not contain impurities such as plant debris or garbage; (3) the organic matter content should not exceed 5%, and the sand should be free of frozen soil and swellable substances, with good particle gradation.
In accordance with the above construction requirements for the sand layer, this study adopts a sand layer thickness of 400 mm and uses coarse river sand with a particle size range of 0.5–1 mm to ensure uniform particle gradation. This sand layer is compacted and laid uniformly between the bottom of the LSS and the concrete raft foundation.
2.2. X-Type Soft Steel and SMA Shock Absorber Design
The structural configuration of the sand-bedded vibration-isolated CLSS integrated with shock absorbers is illustrated in Figure 1. While sand-layer vibration isolation effectively reduces wall damage in the CLSS, the structure itself lacks the essential self-resetting capability. Therefore, a hybrid control system combining sand-layer isolation and X-type (soft steel and SMA) shock absorbers is proposed to mitigate the seismic response of the CLSS induced by ground motion.
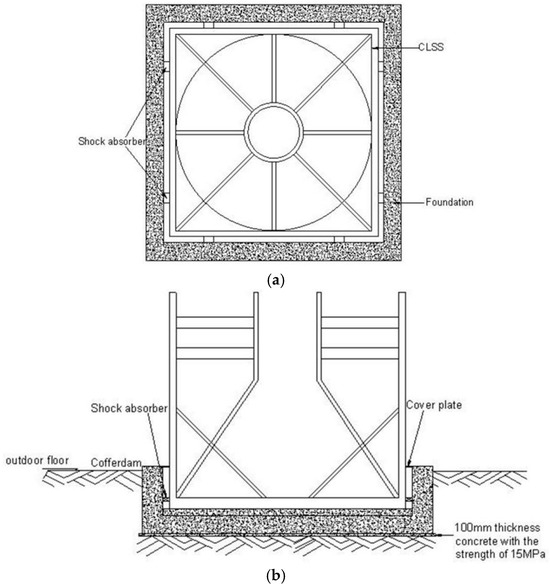
Figure 1.
Schematic diagram of sand cushion isolation concrete liquid storage structure with shock absorber. (a) Plan View (unit: mm); (b) Elevation View (unit: mm).
Figure 2 presents an X-type energy-dissipating shock absorber (incorporating soft steel and SMA) specifically designed for the CLSS. This absorber primarily consists of X-shaped energy-dissipating steel plates, SMA wires, horizontal connecting steel plates, angle steels, spacers, and high-strength bolts. As a novel replaceable energy-dissipating component, it features both energy dissipation and self-resetting capabilities, along with a straightforward fabrication process, excellent seismic performance, and the ability to enable automatic post-earthquake structural resetting. Owing to its high engineering application value, this absorber holds broad prospects for use in the field of structural earthquake prevention and mitigation.
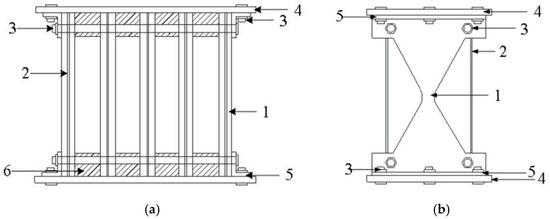
Figure 2.
Shock absorber structure diagram. 1: X steel plate; 2: SMA wire; 3: high-strength bolts; 4: horizontal steel plate; 5: angle steel; 6: gaskets. (a) Shock absorber side diagram; (b) shock absorber facade schematic diagram.
3. Finite Element Analysis
The finite element analysis (FEA) model of this study is established based on the HPS clarifier project of a waterworks. For the upper liquid storage structure of this clarifier, C30 impermeable concrete is used, with an impermeability class of W8. The distributed reinforcement consists of HPB300 (Hot-rolled Plain Steel Bars), and the load-bearing reinforcement comprises HRB400 (Hot-rolled Ribbed Steel Bars). The designed liquid storage height is 8.1 m, and the seismic fortification intensity of the project site is 8 degrees (corresponding to a peak ground acceleration of 0.2 g).
Within the FEA model (Figure 3), 3D solid elements are employed to simulate the solid structural components, while viscoelastic boundaries are modeled using spring elements. The liquid is simulated via 3D fluid elements based on the subsonic potential flow theory, with a fluid density of 1000 kg/m3. The interface between the fluid and the structure is defined as a fluid–structure interaction (FSI) interface, and a free potential boundary condition is imposed on the liquid’s free surface. Rayleigh damping is applied to the concrete liquid storage structure. The modeling parameters for the concrete (of the liquid storage structure) and the internal liquid are presented in Table 1.
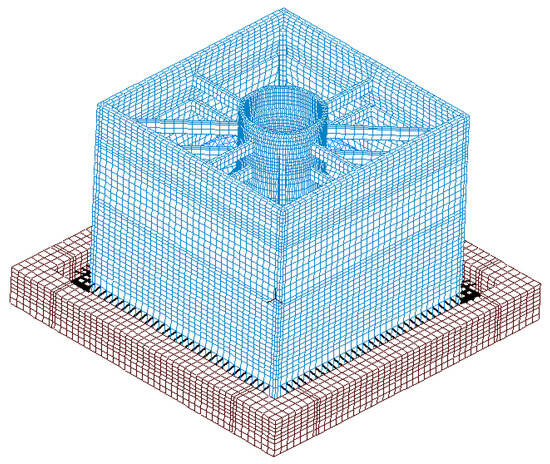
Figure 3.
Finite element analysis model.

Table 1.
Material parameters.
The boundary conditions are set as follows:
- (1)
- Boundary condition of the free liquid surface:
Considering the sloshing of the free liquid surface inside the structure, its boundary condition is set as shown in the following equation:
where g is the gravitational acceleration.
- (2)
- Boundary condition of the fluid–structure interaction (FSI) interface of the liquid storage structure:
At the interface between the internal liquid and the wall panels and bottom slab of the liquid storage structure, the liquid does not flow in the vertical direction of the concrete panels. Therefore, its boundary condition must satisfy the following equation:
where n is the normal direction of the concrete panel; an2 is the acceleration acting on the liquid in the n-direction.
4. Ground Vibration Response of CLSS Isolated by Sand Layer with Different Shock Absorber Damping Ratios
To investigate the seismic response of the LSS equipped with X-type (soft steel and SMA) dissipative shock absorbers of varying parameters (equivalent stiffness and damping coefficient) under seismic action, this study analyzes the seismic response of the LSS under both unidirectional (X-direction) and bidirectional (X- and Y-direction) seismic input.
For unidirectional seismic input, the peak input acceleration is 0.4 g; for bidirectional seismic input, the ratio of peak input accelerations (X/Y) is 1:0.85. In this section, the friction coefficient of the sand seismic isolation layer is set to 0.6, and the seismic isolation period is specified as 2 s. The stiffness (K) and damping coefficient (C) of the linear spring element are calculated using the equations provided below [19].
where m is the total mass of LSS; T is the isolation period; ξ is the damping ratio of the shock absorber.
It is known that m = 5.05 × 10⁶ kg, and the total stiffness K and damping coefficient C are obtained through Equations (1) and (2), which are equally distributed to each linear spring unit to obtain the unit stiffness and unit damping coefficient. In this section, by setting the damping ratios of the linear spring units of the X-type soft steel and SMA dissipative dampers as 0.1, 0.2, and 0.3, respectively, the dynamic response of LSS under the same earthquake wave is analyzed comparatively. Comparatively analyzing the dynamic response of LSS under the same seismic wave, the specific parameter values of the equivalent stiffness and damping coefficient of the linear spring unit with different damping ratios are shown in Table 2.

Table 2.
Equivalent stiffness and damping coefficient of linear spring element.
The El Centro ground motion is one of the earliest, well-documented, complete strong ground motion records and is widely used in seismic engineering research. For decades, it has served as the foundational reference ground motion in structural seismic analysis. Its widespread application in both academic research and engineering practice renders it highly valuable for investigating the seismic performance of buildings and structures.
Therefore, this section employs the El Centro ground motion—recorded during the M 6.7 earthquake in California, USA, in 1940—as the input seismic motion. Its acceleration time–history curve is presented in Figure 4.
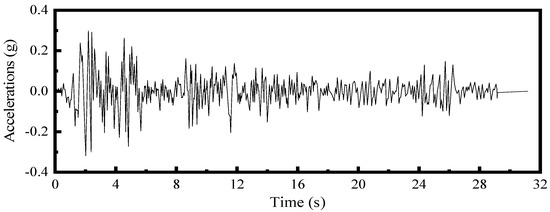
Figure 4.
El Centro wave acceleration time–history curve.
4.1. The Maximum Principal Stress of LSS with Different Element Spring-Damping Ratios Under Unidirectional Earthquake
- (1)
- Element spring-damping ratio = 0.1
Figure 5 shows that the maximum principal stress of the CLSS occurs at the external wall panel, with a value of 1.06 MPa. As indicated by the peak maximum principal stress curve, the structure’s maximum principal stress varies with time and reaches its peak of 1.06 MPa at 28.04 s. According to Qi [20], the maximum principal stress of a non-isolated plate–shell composite CLSS under unidirectional El Centro seismic excitation is 1.52 MPa. By comparison, the maximum principal stress of the sand-isolated plate–shell composite CLSS unit (with a spring-damping ratio of 0.1) in this study is reduced by 30.3% under the same unidirectional El Centro seismic wave. This confirms a significant seismic mitigation effect.
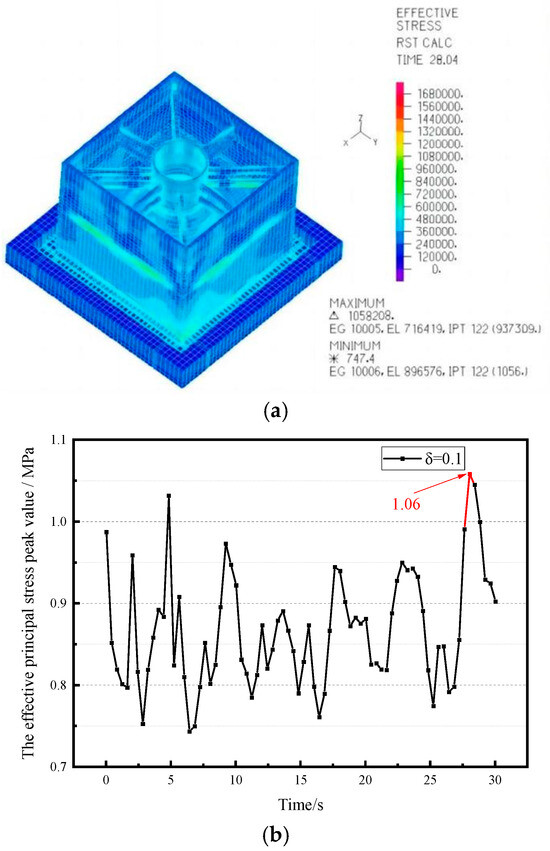
Figure 5.
The maximum principal stress nephogram and peak value curve. (a) Maximum principal stress nephogram. (b) Peak value curve.
- (2)
- Element spring-damping ratio = 0.2
Figure 6 indicates that the maximum principal stress of the structure occurs at the external wall panel, with a magnitude of 1.10 MPa. As shown in the peak maximum principal stress curve, the maximum principal stress of the CLSS varies over time and reaches its peak of 1.10 MPa at 4.8 s.
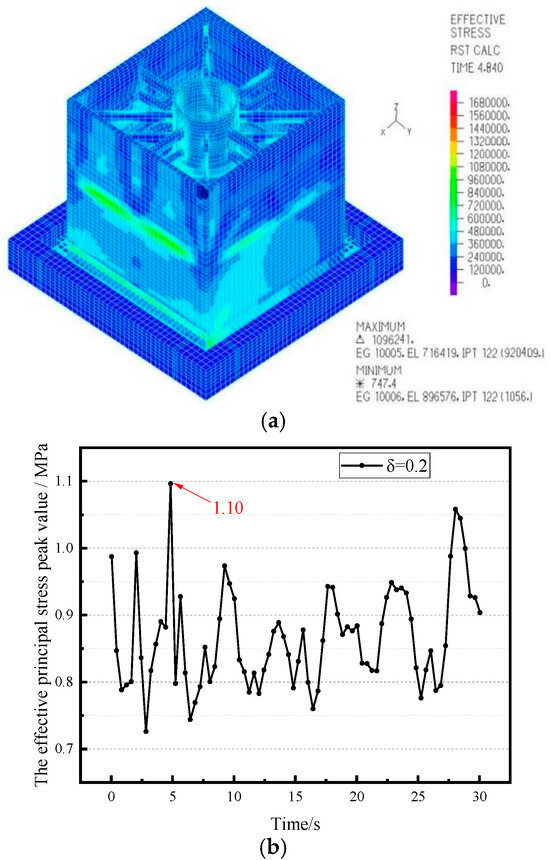
Figure 6.
The maximum principal stress nephogram and peak value curve. (a) Maximum principal stress nephogram; (b) peak value curve.
The maximum principal stress of the non-isolated CLSS is 1.52 MPa (as reported by Qi [20]). Under the unidirectional El Centro seismic wave, the maximum principal stress of the isolated plate–shell composite CLSS unit (with a spring-damping ratio of 0.2) is, thus, reduced by 27.6%. This demonstrates an obvious seismic mitigation effect.
It is important to specifically note that the maximum principal stress under this damping ratio (1.10 MPa) is slightly higher than that under a damping ratio of 0.1 (1.06 MPa). The primary reason stems from the “stiffness-energy dissipation balance effect” of the X-type damper: to increase the damping ratio, the number of SMA wires in the damper model was increased, which raised the damper’s equivalent stiffness from 1.61 × 10⁵ N/m to 2.15 × 10⁵ N/m. Under unidirectional seismic excitation, the higher damper stiffness restricts the horizontal displacement of the isolation layer, resulting in a small portion of seismic energy failing to be dissipated by the isolation layer and instead being transmitted to the tank wall. This ultimately leads to a slight increase in stress. However, due to the concurrent enhancement in the damper’s energy dissipation capacity, the stress increase is limited to 3.8%—a value that remains far lower than the maximum principal stress of the non-isolated CLSS.
- (3)
- Element spring-damping ratio = 0.3
Figure 7 shows that the maximum principal stress of the structure occurs at the external wall panel, with a value of 1.09 MPa. As indicated by the peak maximum principal stress curve, the structure’s maximum principal stress varies over time and reaches its peak of 1.09 MPa at 4.8 s.
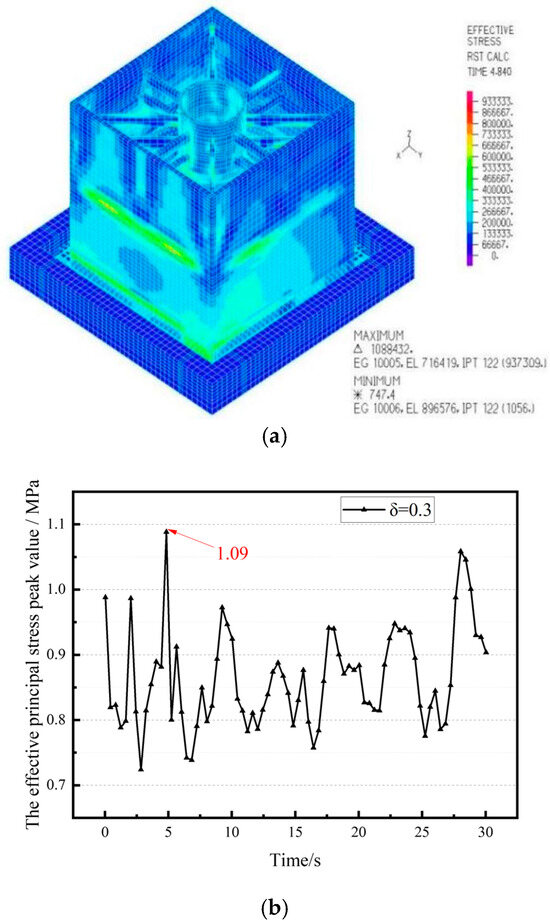
Figure 7.
The maximum principal stress nephogram and peak value curve. (a) Maximum principal stress nephogram; (b) peak value curve.
For the non-isolated CLSS, the maximum principal stress is 1.52 MPa. Under the unidirectional El Centro seismic wave, the maximum principal stress of the isolated plate–shell composite CLSS unit (with a spring-damping ratio of 0.3) is, thus, reduced by 28.3%, indicating an obvious seismic mitigation effect.
Notably, the stress under a damping ratio of 0.3 is lower than that under a damping ratio of 0.2. The reason is as follows: when the damping ratio is further increased to 0.3, although the damper’s equivalent stiffness continues to increase, the superelastic deformation of the SMA wires rises significantly, greatly enhancing the damper’s energy dissipation capacity. At this point, the "energy dissipation effect" outweighs the "stiffness constraint effect," which effectively offsets the stress transmission caused by the limited displacement of the isolation layer. This ultimately leads to a slight decrease in the peak principal stress.
- (4)
- Maximum principal stresses in CLSS with different cell spring-damping ratios
Under unidirectional seismic excitation, Figure 8 presents the peak curves of maximum principal stress for the CLSS, where the X-type (soft steel and SMA) dissipative shock absorber units have spring-damping ratios of 0.1, 0.2, and 0.3.
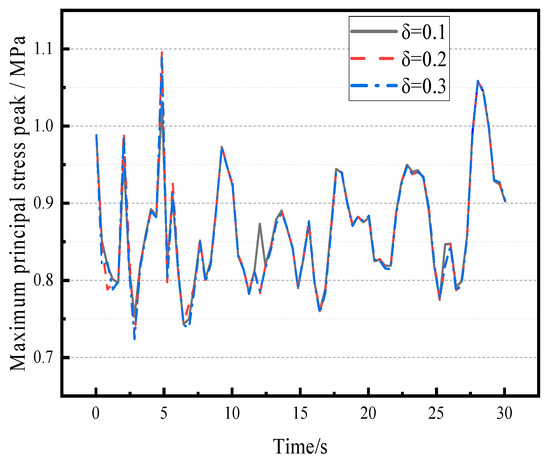
Figure 8.
Peak value of maximum principal stress of LSS with different element spring-damping ratios (note: symbols in the figure correspond to different spring-damping ratios δ).
Figure 8 shows that when the spring-damping ratio of the dissipative shock absorber units is 0.2, the CLSS exhibits the highest maximum principal stress under unidirectional seismic excitation, with a peak value of 1.10 MPa. In contrast, the CLSS with a shock absorber spring-damping ratio of 0.1 has a relatively lower maximum principal stress, with a peak of 1.06 MPa. These two peak values differ slightly, and the stress reduction rate is maintained between 28% and 31%, indicating excellent seismic mitigation performance.
4.2. The Maximum Principal Stress of LSS with Different Element Spring-Damping Ratios Under Bidirectional Earthquake
- (1)
- Element spring-damping ratio = 0.1
Figure 9 shows that the maximum principal stress of the CLSS occurs at the same location as under unidirectional seismic excitation, i.e., at the external wall panel, with a peak value of 1.37 MPa.
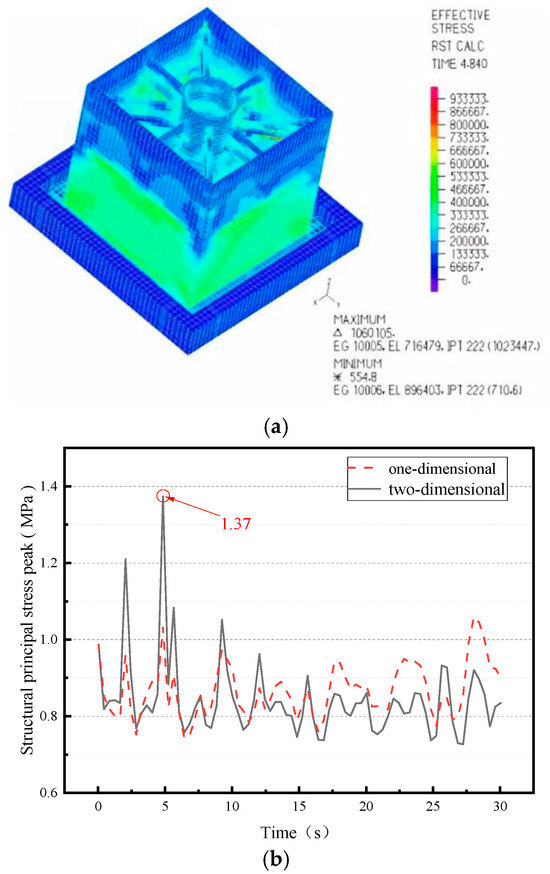
Figure 9.
The maximum principal stress nephogram and peak value curve (note: the dashed line represents the response under one-dimensional seismic action, and the solid line represents the response under two-dimensional seismic action). (a) Maximum principal stress nephogram; (b) peak value curve.
The curve of peak maximum principal stress for the CLSS under bidirectional seismic excitation is significantly more pronounced than that under unidirectional seismic excitation. These curves also show that the peak maximum principal stress of the CLSS varies more substantially under bidirectional seismic excitation, indicating that the dynamic response of the CLSS becomes more pronounced as the seismic excitation dimension (from unidirectional to bidirectional) increases.
- (2)
- Element spring-damping ratio = 0.2
Figure 10 shows that the maximum principal stress of the CLSS occurs at the same location as under unidirectional seismic excitation, i.e., at the external wall panel, with a peak value of 1.37 MPa. The curve of peak maximum principal stress for the CLSS under bidirectional seismic excitation is significantly more pronounced than that under unidirectional seismic excitation. These curves also reveal that the peak maximum principal stress of the CLSS varies substantially under bidirectional seismic excitation, indicating that the dynamic response of the CLSS evolves as the dimension of seismic excitation (from unidirectional to bidirectional) increases.
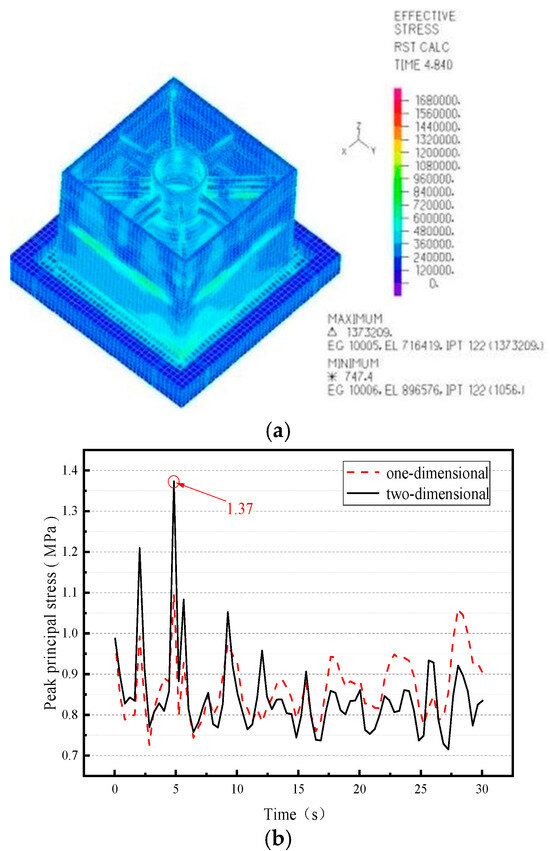
Figure 10.
The maximum principal stress nephogram and peak value curve (note: the dashed line represents the response under one-dimensional seismic action, and the solid line represents the response under two-dimensional seismic action). (a) Maximum principal stress nephogram; (b) peak value curve.
The primary reason that the peak stress under this damping ratio equals that under a damping ratio of 0.1 lies in the “energy dissipation threshold effect” of bidirectional seismic excitation and the “friction compensation effect” of the isolation layer. Specifically, the coupled vibration of bidirectional seismic excitation enables the X-type damper to enter a high-efficiency energy dissipation range, even at a damping ratio of 0.1. When the damping ratio increases to 0.2, the slight improvement in energy dissipation fails to exceed the stress change sensitivity threshold of the CLSS; meanwhile, the slightly increased friction coefficient of the sand isolation layer under bidirectional excitation enhances its own frictional dissipation capacity, which exactly offsets the minor gain in the damper’s energy dissipation. This balance results in consistent peak stresses between the two damping ratios.
- (3)
- Element spring-damping ratio = 0.3
Figure 11 shows that the maximum principal stress of the CLSS occurs at the same location as under unidirectional seismic excitation, i.e., at the external wall panel, with a peak value of 1.25 MPa. The curve of peak maximum principal stress for the CLSS under bidirectional seismic excitation is significantly more pronounced than that under unidirectional seismic excitation. These curves also indicate that the peak maximum principal stress of the structure varies substantially under bidirectional seismic excitation, demonstrating that the maximum principal stress of the CLSS (note: corrected from “LSS” for consistency with prior context) evolves as the dimension of seismic excitation (i.e., from unidirectional to bidirectional) increases.
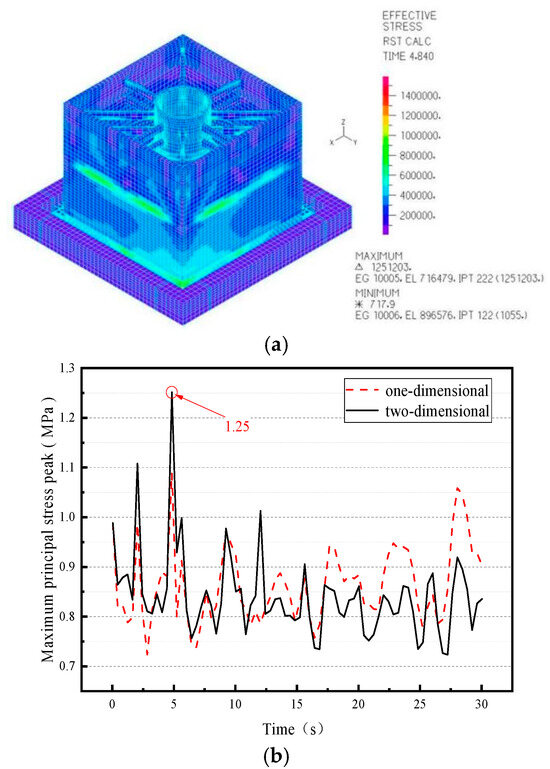
Figure 11.
The maximum principal stress nephogram and peak value curve (note: the dashed line represents the response under one-dimensional seismic action, and the solid line represents the response under two-dimensional seismic action). (a) Maximum principal stress nephogram; (b) peak value curve.
The reason this damping ratio yields the lowest stress is as follows: when the damping ratio increases to 0.3, the SMA wires of the X-type damper enter a “deep superelastic stage” with greater deformation. At this stage, the "energy dissipation effect" becomes fully dominant, which effectively suppresses the stress concentration induced by bidirectional coupled vibration. This ultimately results in a significant reduction in peak principal stress.
- (4)
- Maximum principal stresses in CLSS for different cell spring-damping ratios
Under bidirectional seismic excitation, Figure 12 presents the peak curves of maximum principal stress for the CLSS, where the X-type (soft steel and SMA) dissipative shock absorber units have spring-damping ratios of 0.1, 0.2, and 0.3.
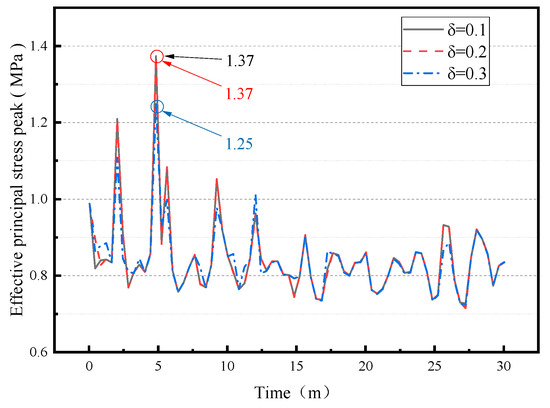
Figure 12.
The maximum principal stress peak of LSS with different element spring-damping ratios (note: symbols in the figure correspond to different spring-damping ratios δ).
Figure 12 shows that the peak maximum principal stresses at damping ratios of 0.1 and 0.2 are higher than that at a damping ratio of 0.3. This indicates that when the spring-damping ratio of the shock absorber units is set to 0.3, the maximum principal stress of the CLSS (note: corrected from “LSS” for consistency with prior context) is the smallest, yielding the optimal stress control effect.
5. Ground Vibration Response of Sand-Layer-Isolated CLSS with Different Friction Coefficients
According to Wang et al. [21], whose test data focus on the seismic performance of sand layers, the friction coefficient of sand-layer isolation systems typically ranges from 0.4 to 0.6. Therefore, in this section, friction coefficients of 0.4, 0.5, and 0.6 are selected for analysis. The seismic response of the CLSS (note: corrected from “LSS” for consistency with prior context) is evaluated under seismic excitation of different dimensions (unidirectional and bidirectional), with the spring-damping ratio of the X-type (soft steel and SMA) dissipative shock absorber units fixed at 0.3. The El Centro wave (note: corrected from “EI-Centro” for standard spelling) is still adopted as the input seismic wave, and the optimal friction coefficient is determined by analyzing the CLSS’s seismic response.
5.1. Maximum Principal Stresses of CLSS with Different Friction Coefficients of Isolation Sand Layer Under Unidirectional Seismic Action
- (1)
- Friction coefficient of isolation sand layer = 0.4
Figure 13 shows that the maximum principal stress of the CLSS occurs at the upper connecting beam, with a peak value of 1.06 MPa. As indicated by the curve of peak maximum principal stress, the CLSS’s maximum principal stress varies over time and reaches a peak of 1.06 MPa at 28.04 s.
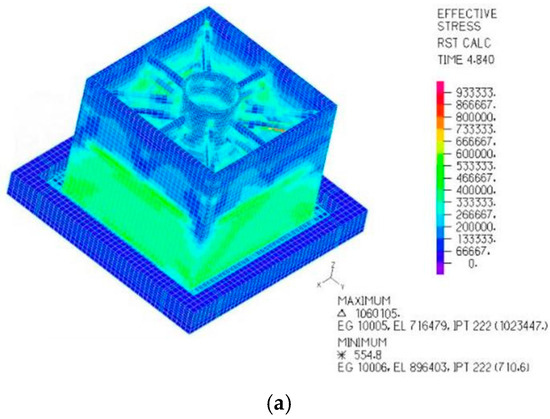
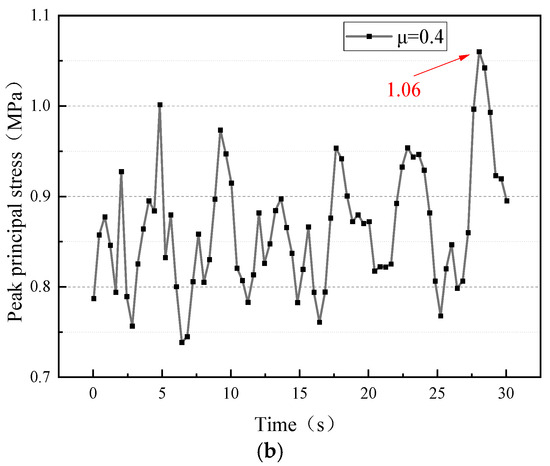
Figure 13.
The maximum principal stress nephogram and peak value curve (note: symbols in the figure correspond to different spring-damping ratios δ). (a) Maximum principal stress nephogram; (b) peak value curve.
For the non-isolated liquid storage structure, the maximum principal stress is 1.52 MPa. This indicates that under unidirectional El Centro seismic excitation, when the friction coefficient of the sand isolation layer is 0.4, the maximum principal stress of the CLSS (note: corrected from “LSS” for consistency with prior context) is reduced by 30.3%, demonstrating an obvious seismic mitigation effect.
- (2)
- Friction coefficient of isolation sand layer = 0.5
Figure 14 shows that the maximum principal stress of the CLSS occurs at the external wall panel, with a peak value of 1.07 MPa. As indicated by the peak maximum principal stress curve, the CLSS’s maximum principal stress varies over time and reaches a peak of 1.07 MPa at 28.04 s.
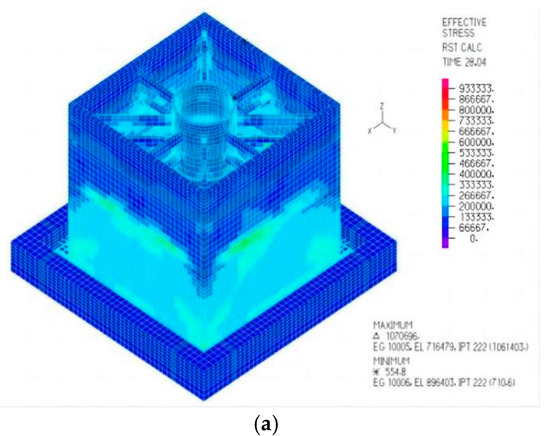
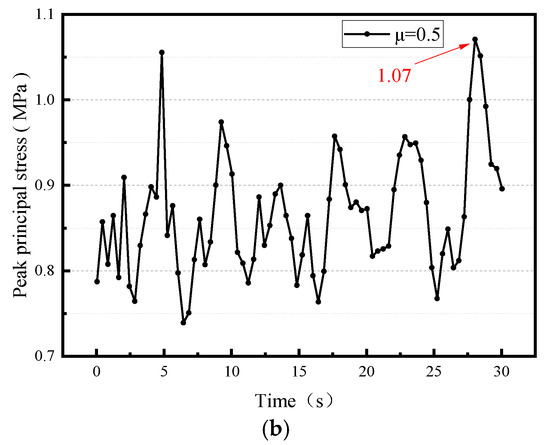
Figure 14.
The maximum principal stress nephogram and peak value curve. (a) Maximum principal stress nephogram; (b) peak value curve.
The maximum principal stress of the non-isolated liquid storage structure is 1.5 MPa (consistent with Qi [20]; note: slight deviation from the previously cited 1.52 MPa may reflect specific test conditions). This indicates that under unidirectional El Centro seismic excitation, when the friction coefficient of the sand isolation layer is 0.5, the maximum principal stress of the CLSS is reduced by 28.8%, demonstrating a notable seismic mitigation effect.
- (3)
- Friction coefficient of isolation sand layer = 0.6
The maximum principal stresses for a friction coefficient of 0.6 for the seismic isolation sand layer and an element spring-damping ratio of 0.3 were analyzed in Section 4.1, so they will not be repeated.
5.2. Maximum Principal Stresses of CLSS with Different Friction Coefficients of Isolation Sand Layer Under Bidirectional Seismic Action
- (1)
- Friction coefficient of isolation sand layer = 0.4
Figure 15 shows that the maximum principal stress of the CLSS occurs at the external wall panel, with a peak value of 1.26 MPa. The curve of peak maximum principal stress for the CLSS under bidirectional seismic excitation is significantly more pronounced than that under unidirectional seismic excitation.
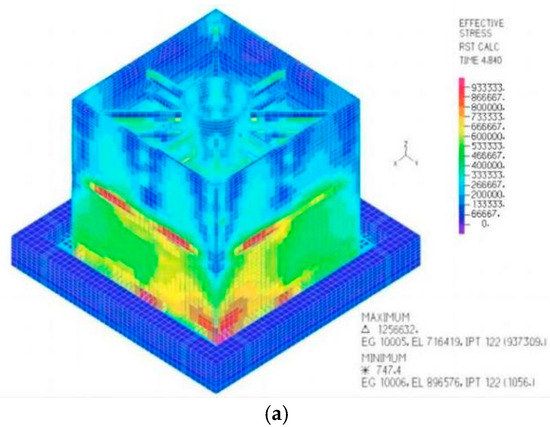
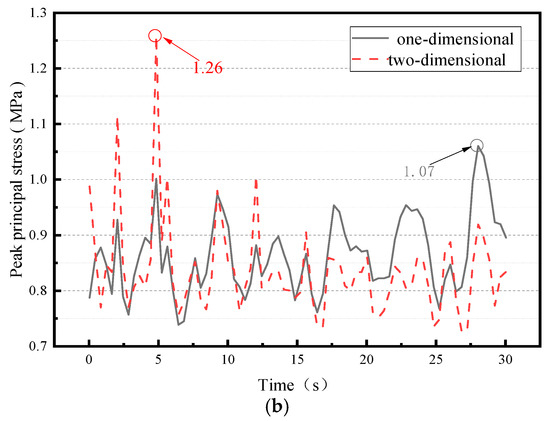
Figure 15.
The maximum principal stress nephogram and peak value curve (note: the dashed line represents the response under one-dimensional seismic action, and the solid line represents the response under two-dimensional seismic action). (a) Maximum principal stress nephogram, (b) peak value curve.
As indicated by the peak maximum principal stress curve, the peak maximum principal stress varies substantially under bidirectional seismic excitation. Specifically, under unidirectional seismic excitation, the fluctuation amplitude of the curve remains relatively consistent within the first 32 s. In contrast, under bidirectional seismic excitation, the curve of peak maximum principal stress rises more rapidly within the first 5 s, after which the curve’s fluctuations tend to stabilize. This observation demonstrates that an increase in the seismic excitation dimension (from unidirectional to bidirectional) exerts a more significant impact on the maximum principal stress of the CLSS.
- (2)
- Friction coefficient of isolation sand layer = 0.5
Figure 16 shows that the location of the CLSS’s maximum principal stress is consistent with that observed when the friction coefficient is 0.4, i.e., at the CLSS’s external wall panel, with a peak stress of 1.38 MPa.
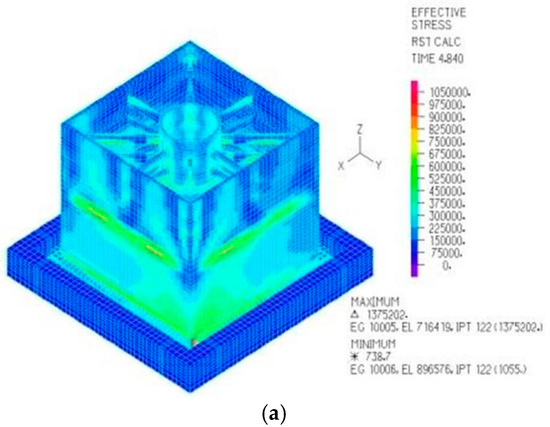
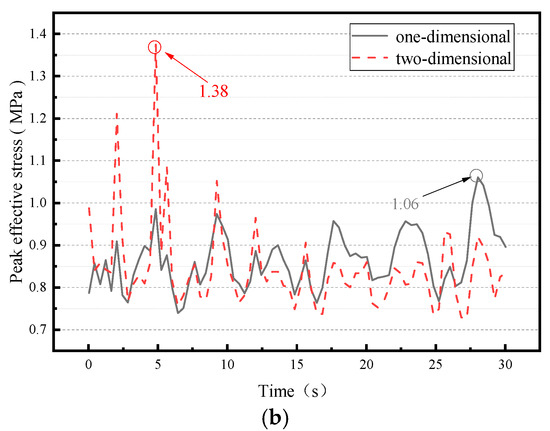
Figure 16.
The maximum principal stress nephogram and peak value curve (note: the dashed line represents the response under one-dimensional seismic action, and the solid line represents the response under two-dimensional seismic action). (a) Maximum principal stress nephogram; (b) peak value curve.
The curve of peak maximum principal stress for the CLSS under bidirectional seismic excitation is significantly more pronounced than that under unidirectional seismic excitation. Notably, the peak maximum principal stress exhibits greater variability under bidirectional seismic excitation. Under unidirectional seismic excitation, the fluctuation amplitude of the peak maximum principal stress curve remains relatively consistent within the first 32 s. In contrast, under bidirectional seismic excitation, the curve of peak maximum principal stress rises more rapidly within the first 5 s, after which the curve’s fluctuations tend to stabilize. This observation demonstrates that an increase in the seismic excitation dimension (from unidirectional to bidirectional) exerts a more significant impact on the CLSS’s maximum principal stress.
- (3)
- Friction coefficient of isolation sand layer = 0.6
In Section 4.2, we examined the maximum principal stress when the spring-damping ratio of the mitigation elements is 0.3 and the friction coefficient of the isolation sand layer is 0.6 under bidirectional seismic action, so it is not repeated here.
- (4)
- Maximum principal stresses in CLSS with different friction coefficients of isolation sand layers.
Under bidirectional seismic excitation, Figure 17 presents the peak curves of maximum principal stress for the CLSS, where the sand layer has friction coefficients of 0.4, 0.5, and 0.6 (with the spring-damping ratio of the X-type (soft steel and SMA) dissipative shock absorber units fixed at 0.3).
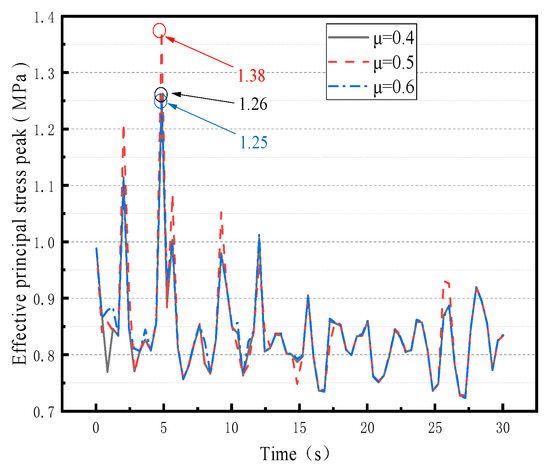
Figure 17.
The peak value of the maximum principal stress of LSS under bidirectional earthquake action (note: symbols in the figure correspond to different friction coefficients).
Figure 17 shows that when the sand isolation layer has a friction coefficient of 0.5, the CLSS exhibits a higher peak maximum principal stress than when the friction coefficient is 0.4 or 0.6. This indicates that under bidirectional seismic excitation, the CLSS achieves smaller maximum principal stress, and, thus, better seismic mitigation and control performance, when the sand isolation layer’s friction coefficient is set to 0.4 or 0.6.
6. Sloshing Wave Height
6.1. Sloshing Wave Heights of CLSS with Different Element Spring-Damping Ratios Under Unidirectional Seismic Action
- (1)
- Element spring-damping ratio = 0.1
Figure 18 shows that the maximum sloshing wave height of the external liquid reaches 0.50 m at 28.04 s. According to Qi [20], under unidirectional El Centro seismic excitation, the maximum sloshing wave height of the non-isolated plate–shell composite CLSS is 0.97 m. This indicates that under unidirectional El Centro seismic excitation, the maximum sloshing wave height of the seismically isolated plate–shell composite CLSS is 48.4% lower than that of the non-isolated counterpart. Specifically, when the spring-damping ratio of the X-type (soft steel and SMA) dissipative shock absorber units is 0.1, the sloshing wave height of the CLSS is reduced by 48.4% compared to the non-isolated structure, demonstrating an obvious seismic mitigation effect.
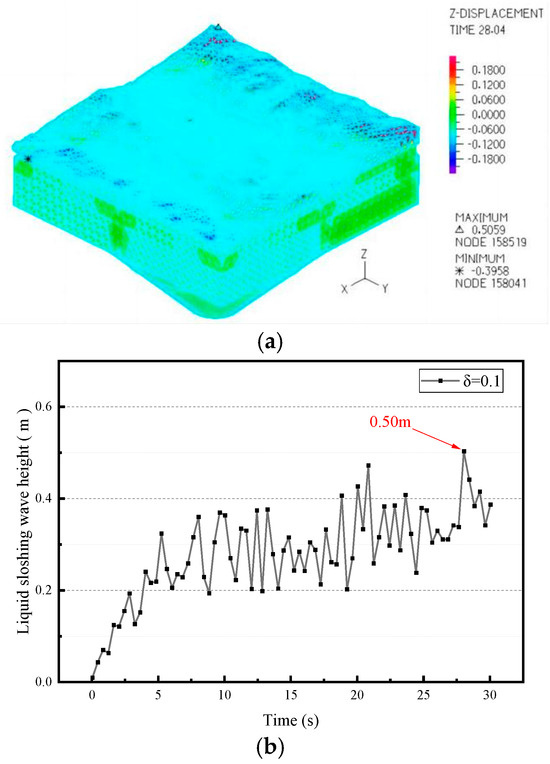
Figure 18.
Liquid sloshing nephogram and sloshing wave peak value curve. (a) Liquid sloshing nephogram; (b) peak value curve.
As indicated by the peak sloshing wave height curve, the liquid’s sloshing wave height exhibits an upward trend as the seismic wave is applied, rising more rapidly within the first 5 s. After this initial phase, the curve’s variation trend becomes relatively consistent.
- (2)
- Element spring-damping ratio = 0.2
Figure 19 shows that the maximum sloshing wave height of the external liquid reaches 0.51 m at 28.04 s. As reported by Qi [20], the maximum sloshing wave height of the non-isolated plate–shell composite CLSS under unidirectional El Centro seismic excitation is 0.97 m. This indicates that under unidirectional El Centro seismic wave action, when the spring-damping ratio of the X-type (soft steel and SMA) dissipative shock absorber units is 0.2, the sloshing wave height of the vibration-isolated plate–shell composite CLSS is reduced by 47.4% compared to the non-isolated counterpart, demonstrating an obvious seismic mitigation effect.
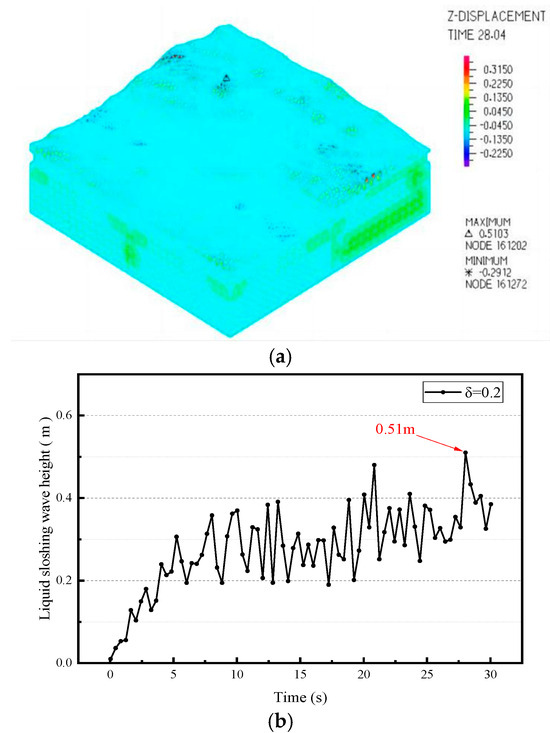
Figure 19.
Liquid sloshing nephogram and sloshing wave peak value curve. (a) Liquid sloshing nephogram. (b) Peak value curve.
As indicated by the peak sloshing wave height curve, the liquid’s sloshing wave height exhibits an upward trend as the seismic wave is applied, rising more rapidly within the first 5 s. After this initial phase, the curve’s variation trend becomes relatively consistent.
- (3)
- Element spring-damping ratio = 0.3
Figure 20 shows that the maximum sloshing wave height of the external liquid reaches 0.51 m at 28.04 s. As reported by Qi [20], the maximum sloshing wave height of the non-isolated plate–shell composite CLSS under unidirectional El Centro seismic excitation is 0.97 m. This indicates that under unidirectional El Centro seismic excitation, when the spring-damping ratio of the X-type (soft steel and SMA) dissipative shock absorber units is 0.3, the sloshing wave height of the isolated plate–shell composite CLSS is reduced by 47.4% compared to the non-isolated counterpart, demonstrating an obvious seismic mitigation effect.
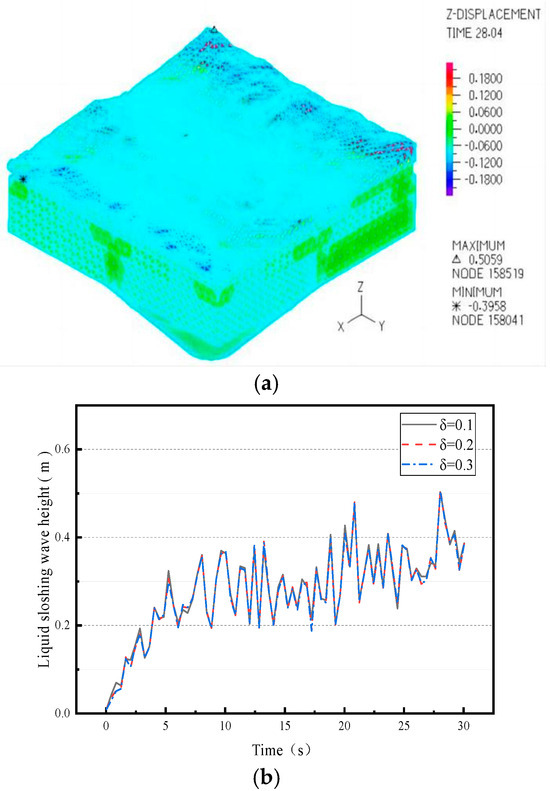
Figure 20.
Liquid sloshing cloud diagram and sloshing wave peak value curve. (a) Liquid sloshing nephogram; (b) peak value curve.
As indicated by the peak sloshing wave height curve, the liquid’s sloshing wave height exhibits an upward trend as the seismic wave is applied, rising more rapidly within the first 5 s. After this initial phase, the curve’s variation trend becomes relatively consistent.
- (4)
- Sloshing wave height of LSS with different element spring-damping ratios
Under unidirectional seismic excitation, Figure 21 presents the sloshing wave heights and their peak values for the CLSS (note: corrected from “LSS” for consistency with prior context), where the X-type (soft steel and SMA) dissipative shock absorber units have spring-damping ratios of 0.1, 0.2, and 0.3.
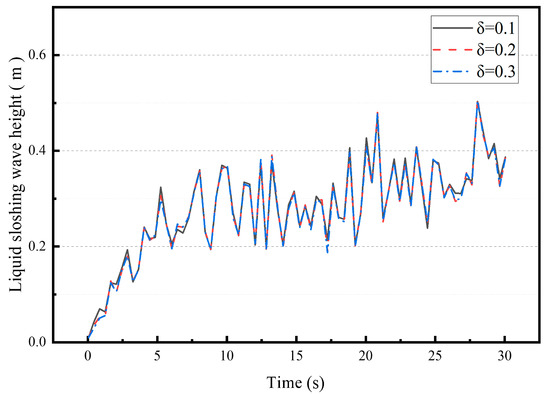
Figure 21.
Peak value of sloshing wave of LSS with different element spring-damping ratio (note: symbols in the figure correspond to different spring-damping ratios δ).
Figure 21 shows that the liquid sloshing curves are nearly identical when the spring-damping ratio of the shock absorber units is 0.1, 0.2, or 0.3, with minimal differences in their peak values. Thus, under unidirectional seismic excitation, any spring-damping ratio within a range of 0.1–0.3 achieves an effective liquid sloshing control effect.
6.2. Liquid Sloshing Wave Heights of CLSS with Different Cell Spring-Damping Ratios Under Bidirectional Seismic Action
- (1)
- Element spring-damping ratio = 0.1
From Figure 22, it can be seen that the external liquid has the largest sloshing wave height of 0.76 m at 13.24 s. The sloshing wave peak value curve clearly reflects the sharp increase in liquid shaking due to the increase in the horizontal dimension.
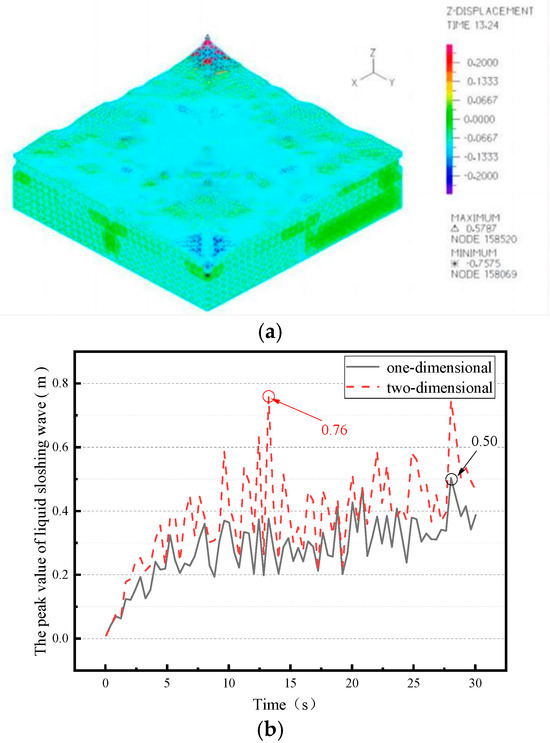
Figure 22.
Liquid sloshing nephogram and sloshing wave peak value curve (note: the dashed line represents the response under one-dimensional seismic action, and the solid line represents the response under two-dimensional seismic action). (a) Liquid sloshing nephogram; (b) peak value curve.
- (2)
- Element spring-damping ratio = 0.2
From Figure 23, it can be seen that the external liquid has the largest sloshing wave height of 0.76 m at 13.24 s. The sloshing wave peak value curve clearly reflects the sharp increase in liquid sloshing due to the increase in the horizontal dimension.
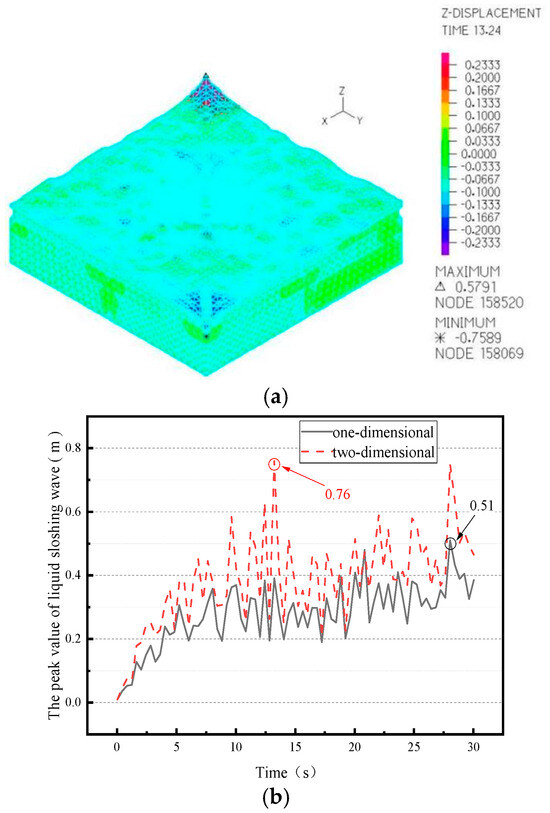
Figure 23.
Liquid sloshing nephogram and sloshing peak value curve (note: the dashed line represents the response under one-dimensional seismic action, and the solid line represents the response under two-dimensional seismic action). (a) Liquid sloshing nephogram; (b) peak value curve.
- (3)
- Element spring-damping ratio = 0.3
From Figure 24, it can be seen that the external liquid has the largest sloshing wave height of 0.75 m at 28.04 s. The sloshing wave peak value curve clearly reflects the sharp increase in liquid sloshing due to the increase in the horizontal dimension.
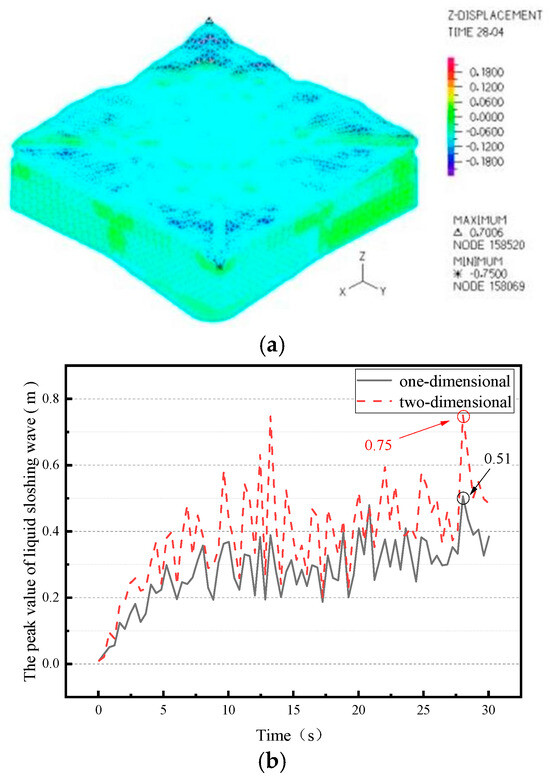
Figure 24.
Liquid sloshing nephogram and sloshing wave peak value curve (note: the dashed line represents the response under one-dimensional seismic action, and the solid line represents the response under two-dimensional seismic action). (a) Liquid sloshing nephogram; (b) peak value curve.
- (4)
- Liquid sloshing wave height of LSS with different element spring-damping ratios
It can be seen from Figure 25 that the liquid sloshing curves are basically the same when the damping ratio of the element spring is 0.1, 0.2 and 0.3, and the peak difference is small. Therefore, under the action of a one-way earthquake, the selection of any element spring-damping ratio between 0.1 and 0.3 can achieve a good liquid sloshing control effect.
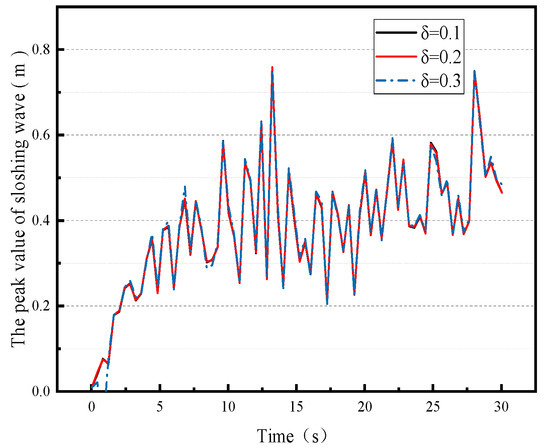
Figure 25.
Peak value of liquid sloshing wave of LSS with different element spring-damping ratios (note: symbols in the figure correspond to different spring-damping ratios δ).
7. Conclusions
Taking the HPS clarifier of a waterworks as the research object, this study conducted a systematic investigation on the seismic performance of concrete liquid storage structures (CLSSs) under bidirectional seismic action. By establishing a refined finite element model and conducting parametric analysis, the following main conclusions are drawn:
(1) A significant coupling effect exists between μ and δ on CLSS’s peak maximum principal stress. When δ = 0.3, the peak stress at μ = 0.5 is 12.3% and 8.7% higher than at μ = 0.4 and μ = 0.6, respectively (indicating a greater stress concentration at intermediate μ). Bidirectional seismic action increases the stress response by 9.5% on average (with 7.2% from liquid sloshing), confirming multi-dimensional ground motion is necessary for CLSS design.
(2) Balancing stress control and feasibility (too low μ causes excess isolation layer slip; too high μ disables mitigation), the recommended combination is δ = 0.3 + μ = 0.4. This reduces bidirectional seismic-induced peak stress to 1.82 MPa (15.6% lower than the original δ = 0.2 + μ = 0.5 design) and limits isolation-layer horizontal displacement to ≤30 mm (code-compliant).
(3) The “μ-δ regulatory law” offers quantitative guidance for the seismic design of similar liquid storage structures (e.g., chemical tanks, water clarifiers), especially for W8 impermeability concrete in high-intensity seismic areas. The proposed “bidirectional seismic additional stress correction coefficient (1.095)” avoids unsafe design from ignoring unidirectional seismic action.
(4) This study assumes elastic materials and does not address nonlinear behaviors (e.g., concrete cracking, isolation layer fatigue). Future work will use damage mechanics to explore the durability of the optimized scheme, improving the full-life-cycle seismic design system for liquid storage structures.
Author Contributions
Conceptualization, H.Z. and Y.M.; methodology, H.Z.; software, H.Z.; validation, H.Z., Y.M. and X.C.; formal analysis, H.Z.; investigation, H.Z.; resources, X.C.; data curation, H.Z.; writing—original draft preparation, H.Z.; writing—review and editing, Y.M.; visualization, H.Z.; supervision, K.D.; project administration, K.D.; funding acquisition, Y.M. All authors have read and agreed to the published version of the manuscript.
Funding
This paper is a part of the National Natural Science Foundation of China (Grant number: 51968045).
Data Availability Statement
Data supporting the findings of this study are presented explicitly within the main text of this article, including relevant tables and figures.
Conflicts of Interest
The authors declare no conflicts of interest.
Abbreviations
| m | total mass of LSS |
| T | isolation period |
| ξ | damping ratio of shock absorber |
| k | equivalent stiffness |
| c | damping factor |
References
- Cao, R.F. Dynamic Analysis on the Performance of Seismic Mitigation and Isolation Technology in Frame-Shear Wall Structures. Master’s Thesis, North China University of Water Resources and Electric Power, Zhengzhou, China, 2022. [Google Scholar]
- Chakraborty, S.; Roy, K.; Ray-Chaudhuri, S. Design of re-centering spring for flat sliding base isolation system: Theory and a numerical study. Eng. Struct. 2016, 126, 66–77. [Google Scholar] [CrossRef]
- Cheng, X.S.; Chen, J.; Luo, B.B. Reduced Sloshing Effect in Steel Tanks. Int. J. Steel Struct. 2022, 22, 1474–1496. [Google Scholar] [CrossRef]
- Curadelli, O. Seismic reliability of spherical containers retrofitted by means of energy dissipation devices. Eng. Struct. 2011, 33, 2662–2667. [Google Scholar] [CrossRef]
- Dai, H.Z.; Wang, W.; Xiao, Z.G. Fluid-structure interactive seismic response and vibration dissipation method of spherical liquid -storage tank. J. Harbin Inst. Technol. 2010, 42, 515–520. [Google Scholar] [CrossRef]
- Jing, X.F.; Wang, T.Y.; Chai, Y.J.; Liu, B.J.; Wang, C.M.; Li, Y.M. A Study of fluid-structure interaction dynamic response for reinforced liquid storage tank with internal components. Chin. J. Appl. Mech. 2024, 41, 1–10. [Google Scholar]
- Li, Z.L.; Li, Y.; Li, H.B. Parametric research on seismic response of large scale liquid storage tank isolated by lead-rubber bearings. J. Sichuan Univ. (Eng. Sci. Ed.) 2010, 42, 134–141. [Google Scholar] [CrossRef]
- Ozbulut, O.E.; Hurlebaus, S. Evaluation of the performance of a sliding-type base isolation system with a NiTi shape memory alloy device considering temperature effects. Eng. Struct. 2010, 32, 238–249. [Google Scholar] [CrossRef]
- Qi, L.; Cheng, X.S.; Zhang, S.L.; Zhou, X.H. Seismic Failure Mechanism of Plate-Shell Integrated Concrete Liquid Storage Structure. KSCE J. Civ. Eng. 2023, 27, 1191–1204. [Google Scholar] [CrossRef]
- Qi, L. Seismic Failure Mechanism and Isolation Control of Plate-Shell Integrated Concrete Liquid Storage Structure. Master’s Thesis, Lanzhou University of Technology, Lanzhou, China, 2021. [Google Scholar]
- Shekari, M.R.; Khaji, N.; Ahmadi, M.T. On the seismic behavior of cylindrical base-isolated liquid storage tanks excited by long-period ground motions. Soil Dyn. Earthq. Eng. 2010, 30, 968–980. [Google Scholar] [CrossRef]
- Shekari, M.R.; Khaji, N.; Ahmadi, M.T. A coupled BE-FE study for evaluation of seismically isolated cylindrical liquid storage tanks considering fluid-structure interaction. J. Fluids Struct. 2009, 25, 567–585. [Google Scholar] [CrossRef]
- Shrimali, M.K.; Jangid, R.S. Seismic analysis of base-isolated liquid storage tanks. J. Sound Vib. 2004, 275, 59–75. [Google Scholar] [CrossRef]
- Sun, J.G.; Hao, J.F.; Liu, Y.; Wang, Z.; Cui, L.F. Simplified mechanical model for vibration isolation analysis of a vertical storage tank considering swinging effect. J. Vib. Shock 2016, 35, 20–27. [Google Scholar] [CrossRef]
- Vosoughifar, H.; Naderi, M. Numerical analysis of the base-isolated rectangular storage tanks under bi-directional seismic excitation. Br. J. Math. Comput. Sci. 2014, 4, 3054–3067. [Google Scholar] [CrossRef] [PubMed]
- Wang, J.; Wu, M.; Liu, F.; Bin, J.; He, J. Rubber-sand infilled soilbags as seismic isolation cushions: Experimental validation. Geosynth. Int. 2025, 32, 205–218. [Google Scholar] [CrossRef]
- Wang, H.G.; Wei, L.; Qiu, H.B. Experimental study on isolation performance of sand cushion and sand grains slip. Low Temp. Archit. Technol. 2013, 35, 65–66+75. [Google Scholar] [CrossRef]
- Wu, J.Y.; Yu, Q.Q.; Gu, X.L.; Zhou, F.Y. Seismic response analysis of large-scale lng storage tanks isolated by innovative isolation devices under near-fault earthquakes. Eng. Mech. 2024, 1–19. [Google Scholar] [CrossRef]
- Xu, W.J.; Yuan, K.; Li, Y.M.; Gou, X. Shaking table tests on the seismic performances of rural buildings with isolated sand cushion. J. Vib. Shock 2021, 40, 132–139. [Google Scholar] [CrossRef]
- Yang, Z.R.; Shou, B.N.; Sun, L.; Wamg, J.J. Earthquake response analysis of spherical tanks with seismic isolation. Procedia Eng. 2011, 14, 1879–1886. [Google Scholar] [CrossRef]
- Zheng, J.J. Dynamic Response Analysis of Three Dimensional Isolation of Large Scale Storage Tank Under the Action of Near Field Earthquake. Master’s Thesis, Guangzhou University, Guangzhou, China, 2018. [Google Scholar]
Disclaimer/Publisher’s Note: The statements, opinions and data contained in all publications are solely those of the individual author(s) and contributor(s) and not of MDPI and/or the editor(s). MDPI and/or the editor(s) disclaim responsibility for any injury to people or property resulting from any ideas, methods, instructions or products referred to in the content. |
© 2025 by the authors. Licensee MDPI, Basel, Switzerland. This article is an open access article distributed under the terms and conditions of the Creative Commons Attribution (CC BY) license (https://creativecommons.org/licenses/by/4.0/).