Article

Design of a Multi-Method Integrated Intelligent UAV System for Vertical Greening Maintenance

School of Industrial Design, Hubei University of Technology, Wuhan 430068, China
*
Author to whom correspondence should be addressed.
Appl. Sci. 2025, 15(20), 10887; https://doi.org/10.3390/app152010887
Submission received: 30 July 2025 / Revised: 6 September 2025 / Accepted: 4 October 2025 / Published: 10 October 2025

Abstract

Vertical greening (VG) delivers measurable urban ecosystem benefits, yet maintenance is constrained by at-height safety risks, heterogeneous facade geometries, and low labor efficiency. Although unmanned aerial vehicles show promise, most studies optimize isolated modules rather than providing a user-oriented, system-level pathway. This paper proposes a closed-loop, multi-method framework integrating the Decision-Making Trial and Evaluation Laboratory-Analytic Network Process, the Functional Analysis System Technique, and the Theory of Inventive Problem Solving. DEMATEL-ANP models causal interdependencies among requirements and derives prioritized weights,; FAST decomposes functions and localizes conflicts, and TRIZ converts those conflicts into principle-guided structural concepts—establishing a traceable requirements → functions → conflicts → structure pipeline. We illustrate the approach at the prototype level with Rhino–KeyShot visualizations under near-facade constraints, showing how prioritized requirements propagate into candidate UAV architectures. The framework structures the identification and resolution of tightly coupled technical conflicts, supports adaptability in facade-proximal scenarios, and provides a transparent mapping from user needs to structure-level concepts. Claims are restricted to methodological feasibility; comprehensive quantitative field validation remains for future work. The framework offers a reproducible methodological reference for the systematic design and decision-making of intelligent UAV maintenance systems for VG.

1. Introduction

With rapid global urbanization, the UHI (UHI: urban heat island) effect, air pollution, and ecological degradation have intensified, and extreme weather events occur with increasing frequency—together posing serious risks to urban environmental quality and human safety. Against this backdrop, VG (VG: vertical greening) has become an essential component of modern urban ecosystems due to its combined functions in cooling and energy conservation, carbon sequestration, air purification, and landscape enhancement [1,2]. Prior studies show that VG can mitigate UHI and urban pollution island effects through plant transpiration and shading, achieving local temperature reductions of approximately 0.1–8.7 °C and markedly lowering summer building cooling demand [3] while also improving urban livability.
Despite the considerable environmental, social, and economic potential of VG systems, their three-dimensional configuration, access constraints, and complex plant–structure interactions introduce unique maintenance challenges that have become a bottleneck to sustainability. Conventional maintenance approaches rely heavily on manual labor [4], scaffolding, or dedicated lifting equipment and face three principal issues: (i) high safety risks associated with work at height, with elevated accident rates when using suspended platforms or aerial work platforms [5]; (ii) complex spatial conditions—diverse facades and dense obstacles—that necessitate specialized equipment and drive up maintenance costs [6]; and (iii) low operational efficiency and high labor intensity of manual tasks, which limit feasible maintenance frequency.
To address these challenges, this study proposes integrating UAVs (UAV: unmanned aerial vehicle) into the maintenance of urban green infrastructure, bridging urban ecology, robotics, and systems engineering. Relative to conventional methods, UAVs offer three salient advantages for VG scenarios: (i) safety and efficiency—remotely operated at-height tasks reduce risks inherent to manual maintenance [7]; (ii) agile navigation—multi-axis attitude control and intelligent path planning enable maneuvering across complex facades and hard-to-reach zones [8]; and (iii) autonomous monitoring and maintenance—onboard sensing and manipulation support automated inspection, precision spraying, and modular plant replacement, thereby reducing manual intervention and ensuring timely upkeep [9]. Consequently, developing an intelligent UAV-based maintenance system tailored to near-facade VG operations is critical for advancing whole-life-cycle management of green infrastructure.
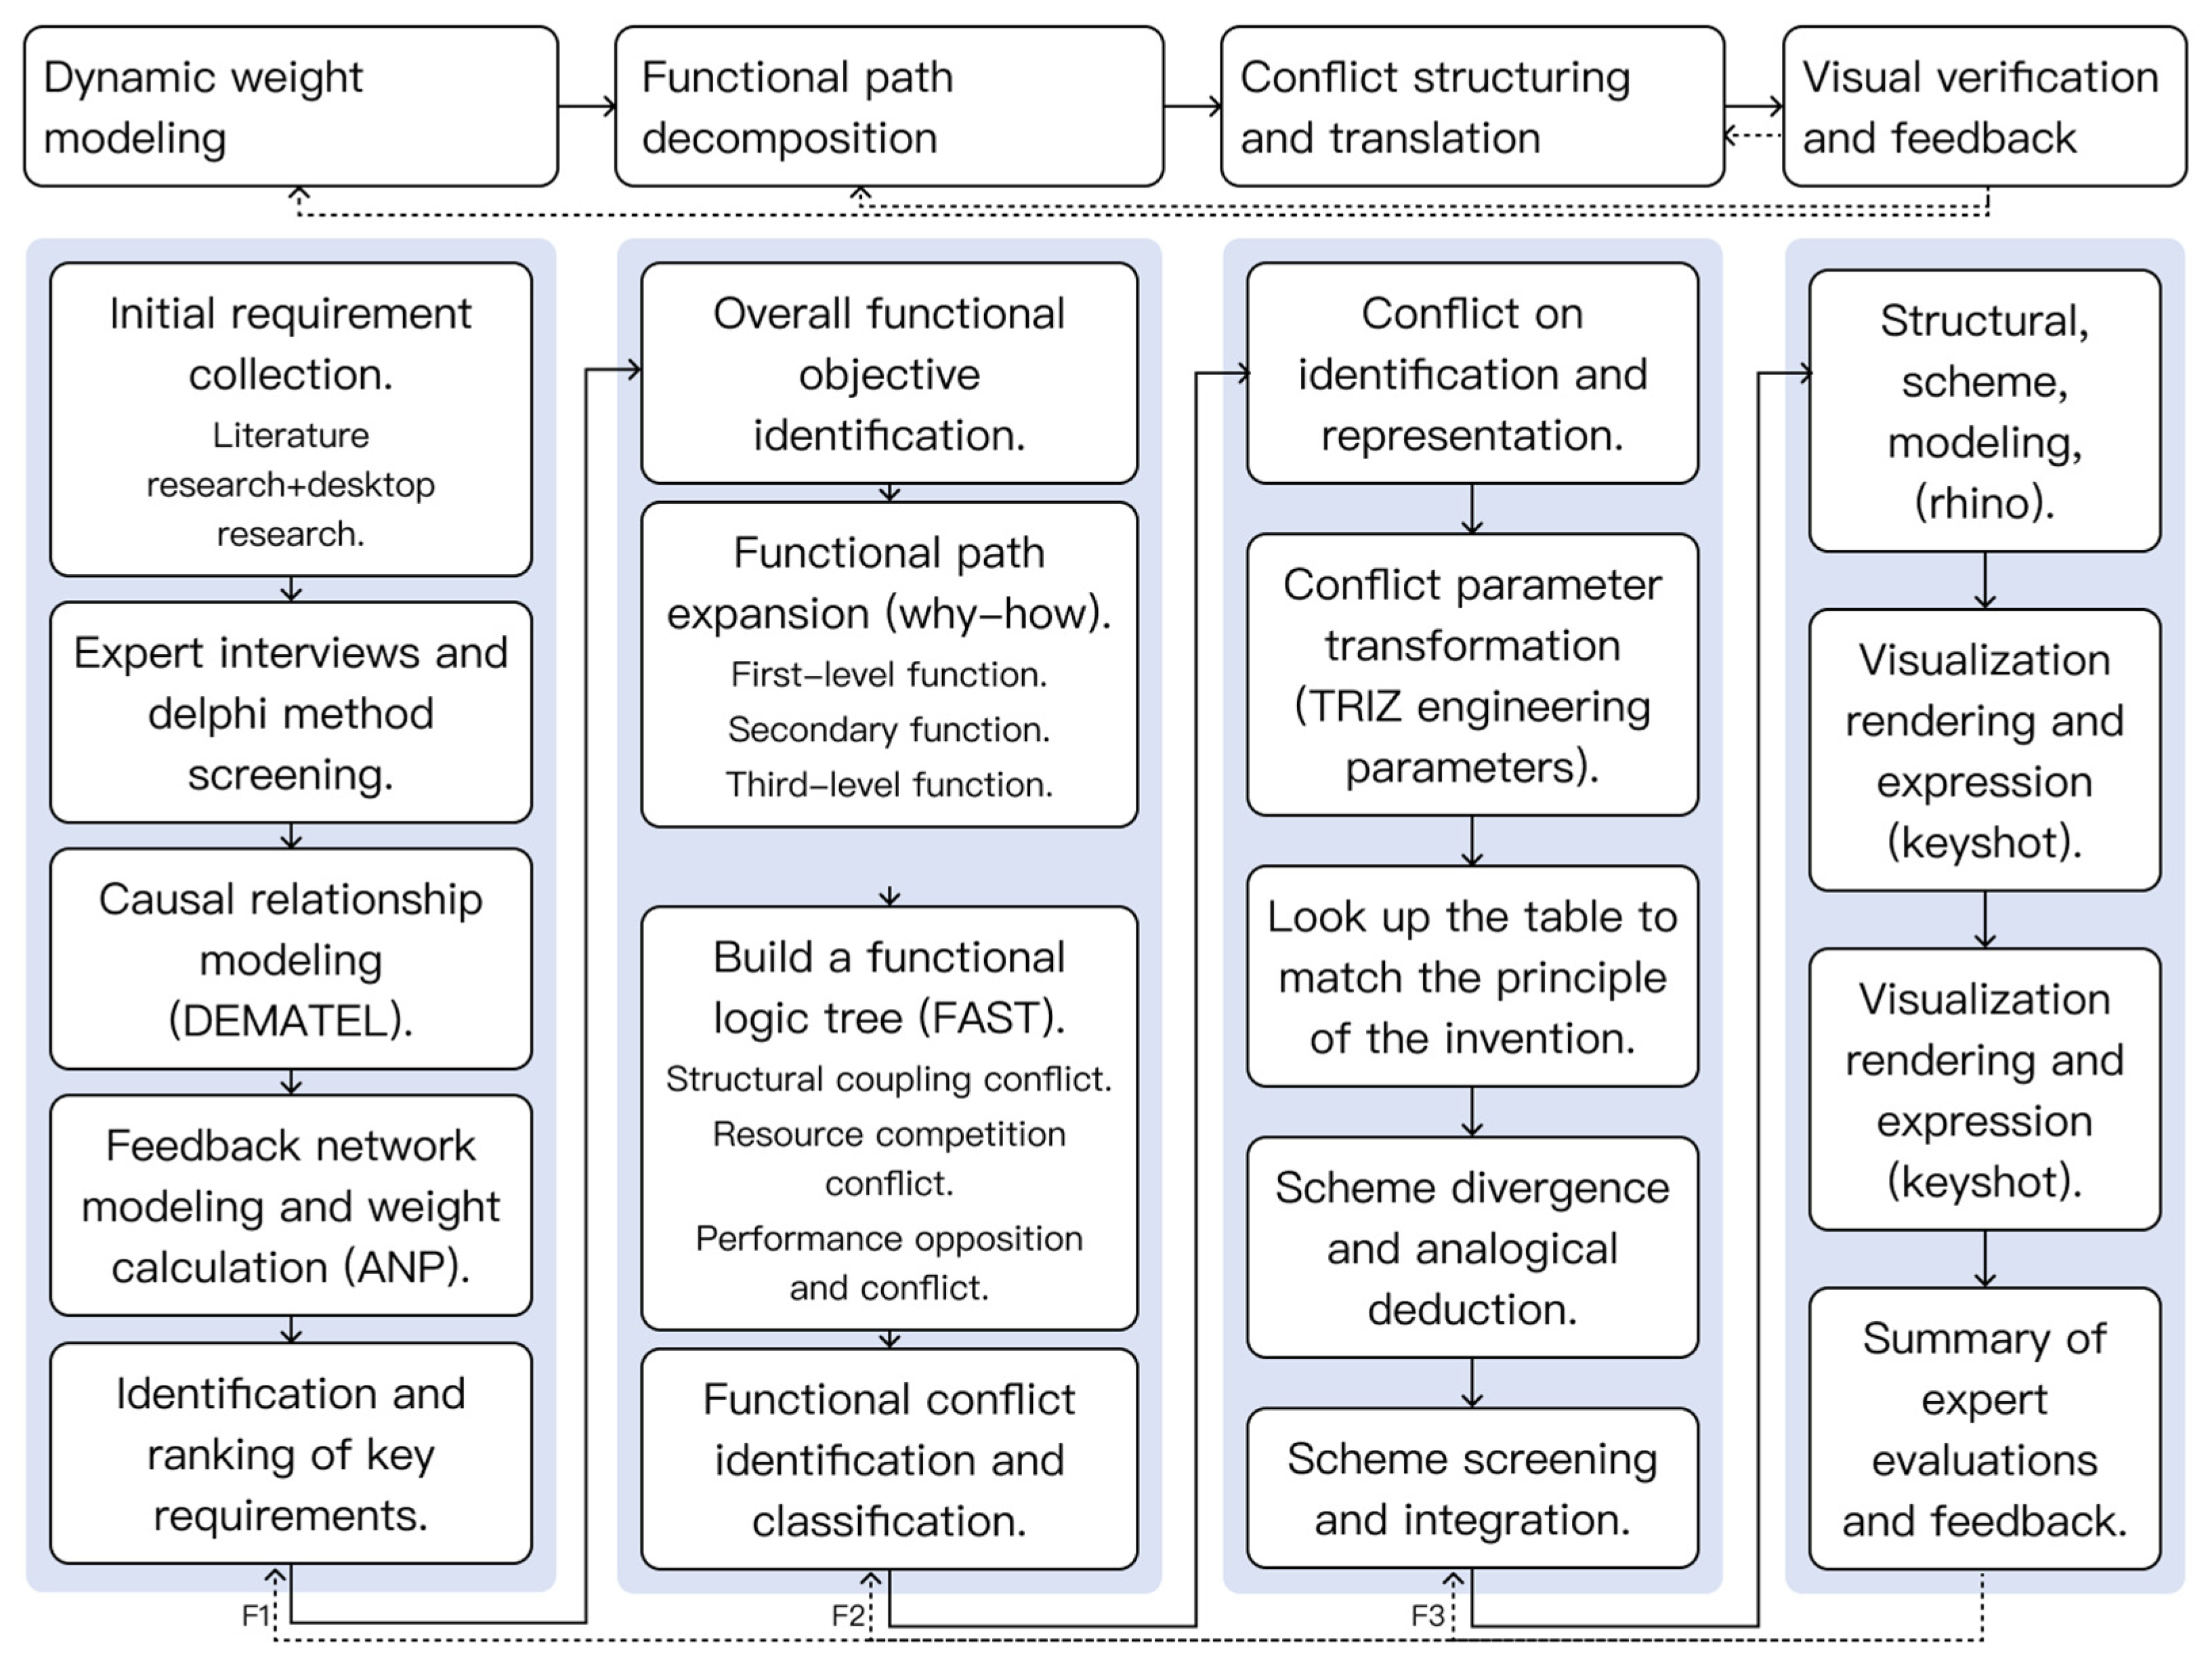
Nonetheless, designing intelligent UAVs for VG maintenance remains challenging. User requirements are dynamic and multidimensional, functional modules are strongly coupled, and conventional single-method approaches struggle to translate evolving needs into implementable functional and structural solutions. This motivates a multi-method, closed-loop design framework that integrates decision-making and inventive methodologies to establish a traceable pathway—user requirements → functional decomposition → conflict identification → structural realization (Figure 1)—hereafter referred to as the D-A-F-T (D-A-F-T: DEMATEL-ANP-FAST-TRIZ) loop. The framework integrates DEMATEL (DEMATEL: Decision-Making Trial and Evaluation Laboratory)-ANP (ANP: Analytic Network Process), FAST (FAST: Functional Analysis System Technique), and TRIZ (TRIZ: Theory of Inventive Problem Solving). In the framework, DEMATEL-ANP models causal interdependencies and derives prioritized requirement weights, FAST decomposes functions and localizes potential conflicts, and TRIZ maps those conflicts to principle-guided structural concepts—forming a D-A-F-T loop (Figure 1). At the prototype level, we illustrate the approach through Rhino–KeyShot visualizations to show how prioritized requirements are transformed into candidate UAV architectures under near-facade constraints, and we evaluate these candidates using expert judgments and a compact analytical envelope. Claims are limited to methodological feasibility; comprehensive quantitative field validation is reserved for future work.
The remainder of this paper is organized as follows: Section 2 reviews related work on VG maintenance and UAV applications, Section 3 details the integrated methodology, Section 4 presents the case-based implementation, Section 5 discusses implications and limitations, and Section 6 concludes and outlines future work.

2. Literature Review

With the expansion of VG in urban ecological construction, intelligent equipment for high-altitude and near-facade maintenance has become a research hotspot. Existing studies on UAV-enabled VG operation and maintenance largely center on three technical modules—flight platforms, environmental perception, and task execution—following a pipeline of detection, path planning, and localized spraying that improves efficiency and reduces excessive chemical use. However, most efforts remain single-technology oriented (e.g., coverage control, geo-registration). In dense and disturbance-prone near-facade scenes, close-range image enhancement and edge detection are often unstable, amplifying system-level complexity under multi-objective trade-offs and strong coupling. Thus, single-method optimization is insufficient for usability and scalability [10].
A systematic upgrade requires digital and networked capabilities to form an integrated sense–understand–control loop: multi-modal sensors continuously collect pH, temperature/humidity, CO2/O2, and water levels; edge/cloud models triggered by thresholds or predictions enable coupled environment–task control and remote supervision. Such pathways have been prototyped in vertical agriculture and smart hydroponics, supporting remote monitoring and actuator coordination via web/mobile interfaces [11]. Energy consumption should simultaneously be treated as a primary constraint to avoid “trading energy for intelligence” [12]. Cross-domain workflows (e.g., task planning → reachability → image processing → quantitative measurement) demonstrate robust recognition and measurement procedures under near-facade disturbances and provide verifiable evidence chains transferable to VG context [10,13]. For construction-like scenarios, sensor-rich UAV payloads (RGB, multispectral, thermal IR, LiDAR) have been used to obtain GPS-referenced 2D/3D data for precise measurements and on-site modeling, supplying data foundations that feed conflict localization and structural synthesis within the D-A-F-T framework [13].
Regarding integrated methodologies, many studies stop at weight calculation or functional decomposition, lacking a systematic bridge from conflict parameterization and TRIZ mapping to structural materialization. Hu Shan et al. [14] proposed an FAHP-FAST-TRIZ-E method for camellia fruit harvesting; while hierarchical analysis and functional decomposition improved feasibility, the open-orchard context limited transfer to highly constrained near-facade spaces. Zhou Hongyu et al. [15] employed QFD-TRIZ to reconcile the “lightweight vs. capacity expansion” conflict in electric water heaters by mapping customer needs to technical characteristics; however, low-altitude flight and facade interaction introduced coupled conflicts and evolving environments that were not addressed. Huang Jiarui et al. [16] integrated Kano-AHP into plant-protection UAV design, strengthening requirement weighting, yet the analysis relied on static needs and overlooked operational variability. Su Chen et al. [17] combined DEMATEL-ANP with a situational FBS model to explore dynamic requirement weighting and scenario-based functional mapping for an intelligent home-care massage chair; however, deep coupling between functional modeling and contradiction-resolution methods remained open.
Synthesizing the above, three gaps persist for complex near-facade VG operations: (1) Dynamic requirement modeling is under-represented—conventional tools (AHP, QFD) treat needs as independent and time-invariant, under-identifying nonlinear, decision-salient weights [14,16]. (2) Function–conflict disconnect—FAST provides hierarchical why–how paths but is seldom tightly bridged to TRIZ, limiting systematic handling of coupled conflicts, such as lightweight, stability, and precision in spraying [14,15,17]. (3) Insufficient scenario adaptability—VG operations differ markedly from open fields, featuring dense obstacles, heterogeneous vertical structures, and rapidly changing micro-environments; targeted scenario modeling and response mechanisms are rarely embedded [15,16,17].
To close these gaps, we propose a D-A-F-T closed-loop design-decision model (Figure 2): DEMATEL-ANP for dynamic weights and core control requirements, FAST for functional pathway decomposition and conflict localization, TRIZ for contradiction parameterization and principle-guided structural solutions, and 3D modeling with visualization feedback for loop validation. Tailored to complex near-facade VG operations, the framework establishes a traceable D-A-F-T loop that provides systematic methodological support for innovative UAV system design under multi-objective coupling.

3. Construction of the Methodological Framework

To enable efficient operation of the intelligent VG-maintenance UAV in complex urban settings, this section builds on the four-stage D-A-F-T closed loop introduced in Section 2. We detail the implementation pathway, operating procedures, and data interfaces and synthesize them into a task-driven framework (Figure 3). The workflow comprises a forward design stream and three feedback routes: visual verification feeds back to DEMATEL-ANP (F1), FAST (F2), and TRIZ (F3), thus closing the D-A-F-T framework.
The proposed methodology consists of the following steps:
(1) Dynamic weight modeling (DEMATEL-ANP). Core user requirements are screened via expert interviews and Delphi. DEMATEL constructs the causal network, identifies driving requirements, and quantifies their impacts; ANP then builds the feedback network and, after consistency checks, yields global dynamic weights and a ranked priority list that informs functional path decomposition.
(2) Functional path decomposition and conflict localization (FAST). Guided by the dynamic-weight results, FAST expands the Why–How paths to construct a complete functional logic tree—organizing primary, supporting, and executive functions—and localizes typical functional conflicts that provide precise inputs for the TRIZ stage.
(3) Structured conflict transformation and solution generation (TRIZ). Functional conflicts are abstracted into contradictory engineering–parameter pairs and mapped, via the TRIZ contradiction matrix, to candidate inventive principles. Through analogy and conceptual sketching, multiple structural alternatives are generated and preliminarily screened for feasibility.
(4) Visualized structural verification and feedback (Rhino–KeyShot). TRIZ-derived concepts are modeled and rendered for expert/user evaluation (aesthetics, adaptability, manufacturability). Verification outputs (e.g., clearance conflicts, reachability/attitude margins, spraying uniformity, recognition errors) feed back to F1–F3 to reweight requirements, revise functional constraints, and refine contradiction parameters/principles—maintaining the D-A-F-T framework.
These steps define inputs, outputs, operating logic, and inter-stage feedback, ensuring a reproducible, operational chain from prioritized requirements to implementable structures for VG UAV design.

3.1. DEMATEL-ANP Implementation Process and Computational Details

3.1.1. Causal Relationship Modeling Using DEMATEL

Originating from the Battelle Institute (1970s), DEMATEL models direct/indirect influences in complex systems using graph- and matrix-based operators, supporting the identification of driving requirements and their impact paths [18,19].
Notation. Let i index user requirements (criteria) and n be the number of requirements. Node i influences node j . I is the identity, X is the direct-relation matrix, and T is the total-influence matrix; bold capitals denote matrices.
(1) Direct-relation matrix, as shown in Equation (1). Experts score pairwise influences on a 0–4 scale to form X ; x i j is the direct influence from i to j .
X = x i j , i , j { 1 , , n }
(2) Normalization, as shown in Equation (2). X is scaled by the maximum row/column sum.
s = m a x max i j x i j , max j i x i j , N = X s
(3) Total-influence matrix, as shown in Equation (3). T = X I X 1 ; t i j is the total influence from i to j .
T = N ( I N ) 1
(4) Influence indices, as shown in Equations (4) and (5). For each requirement i , centrality C i = D i + R i and causality H i = D i R i are computed. A positive H i indicates a driver; a negative H i a receiver.
D i = j = 1 n t i j , ( i = 1,2 , 3 , , n )
R i = j = 1 n t j i , ( i = 1,2 , 3 , , n )
(5) Causal diagram (plotting and quadrant rules). Each node is plotted at ( C i , H i ) with x-axis C i (centrality) and y-axis H i (causality). Sample means (classical) or medians (robust) are used to draw reference lines and assign quadrants (driving hubs, key receivers, peripheral receivers, emerging drivers). The scatter and quadrant table support downstream weighting and design decisions.

3.1.2. ANP Feedback Network and Weight Calculation

The ANP was proposed by Professor Saaty in 1996. It broke through the linear structure limitations of the traditional Analytic Hierarchy Process (AHP) and effectively handled feedback and dependency relationships between elements by constructing a network decision-making model [20]. Based on DEMATEL results, we construct inter- and intra-cluster relations, elicit pairwise comparisons on the 1–9 scale, and perform consistency checks.
(6) Unweighted supermatrix, as shown in Equation (6). Local priority vectors are assembled column-wise into W .
W = w i j , i w i j = 1 j
(7) Weighted supermatrix, as shown in Equation (7). Let c k ( j ) be the cluster weight of the cluster k ( j ) that contains node j (obtained from cluster-level comparisons). The weighted supermatrix is formed by column-wise weighting, followed by column normalization so that each column of W a remains stochastic.
W a i j = c k ( j ) w i j
(8) Limit supermatrix and global weights, as shown in Equation (8).
W * = lim p W a p
ω = ω 1 , ω 2 , , ω n T denotes the global weight vector; every column of the limit supermatrix W * equals ω . These weights provide the decision basis for the subsequent functional-structure design stage.

3.2. Logic and Implementation Steps of FAST Function Tree Construction

FAST is a structured, graphical method from value engineering that converts prioritized user needs into an executable functional architecture. It expands a Why–How logic chain—How moves to the right, Why to the left—with vertical annotations for constraints/resources as needed. In this study, FAST serves two purposes: (i) to derive a complete, hierarchy-aware function tree aligned with DEMATEL-ANP priorities and (ii) to localize typical conflicts for the TRIZ stage [21].
Inputs. The inputs include core requirements and weights (DEMATEL-ANP), scenario constraints (near-facade geometry, payload/energy budgets), and critical KPIs (stability, precision spraying, maintainability).
Process.
  • Define the scope and top function. Phrase all functions as verb–noun pairs; set the system boundary and assumptions.
  • Expand Why–How paths. From the top function, iteratively decompose along How (right) and justify by Why (left), checking logical completeness and dependency consistency.
  • Structure the function tree. Classify nodes as primary, supporting, and executive; annotate interfaces (signals, materials, energy).
  • Conflict localization. Traverse the tree to identify resource competition, spatial/structural coupling, and performance trade-offs; register conflict pairs with their triggering contexts and related KPIs.
  • Prioritization. Weight branches and conflicts by DEMATEL-ANP salience to form a conflict register for TRIZ.
Outputs. The outputs include (i) A reviewed FAST diagram (top/primary/supporting/executive), (ii) an interface list (I/O, constraints), and (iii) a conflict register (parameterizable pairs + evidence) that feeds the TRIZ mappings within the D-A-F-T framework.

3.3. TRIZ-Based Conflict Transformation and Innovation Implementation Path

TRIZ is a systematic innovation methodology proposed by Soviet inventor Genrich Altshuller in 1946. Based on statistical analysis of over 2.5 million patents worldwide, TRIZ distilled the evolution patterns of technical systems and standardized contradiction-solving paradigms. Its primary objective is to overcome the limitations of traditional trial-and-error design by enabling efficient and predictable innovation [22]. TRIZ operationalizes the conflict register from FAST and generates implementable structural concepts for UAVs.
Inputs. The inputs include conflict pairs and contexts from FAST (e.g., lightweight vs. stability, payload vs. endurance, spray precision vs. flight speed, sensor FOV vs. occlusion), together with scenario constraints and KPIs.
Process.
  • Parameter abstraction. Map each conflict to standardized improving and worsening parameters (domain-adapted from the classical set).
  • Contradiction matrix and principle matching. Retrieve candidate inventive principles for each parameter pair; where appropriate, also apply separation principles (in time/space/condition) or Su-Field/Standard solutions for interaction-level issues.
  • Concept synthesis by analogy. Translate principles into multiple structural/architectural alternatives via case-based reasoning and concept sketching; define operating mechanisms and expected KPI effects.
  • Concept screening. Evaluate against engineering constraints (mass/power budgets, reachability and attitude margins, manufacturability, maintainability); down-select via a lightweight Pugh/morphological assessment.
Outputs. The outputs include a principle-to-concept mapping table, short-listed structural schemes with rationale, and KPI impact hypotheses. These feed the visualization/verification step and loop back to requirement weights and functional constraints, maintaining the D-A-F-T framework.
In summary, this paper proposes a methodological prototype—the task-driven D-A-F-T closed loop—for the design of VG-maintenance UAVs. Its innovation lies in a systematic chain that operationalizes requirement modeling (DEMATEL-ANP), functional decomposition and conflict localization (FAST), and contradiction-guided concept generation (TRIZ), with explicitly defined inputs/outputs and F1–F3 feedback routes from visual verification back to the models. The present contribution is method-level and conceptual: we demonstrate feasibility via computations, as shown in Equations (1)–(8), structured artifacts (conflict register, principle-to-concept mapping), and Rhino–KeyShot visualizations, not full controller integration or field-scale performance claims. Future work will implement controller-in-the-loop tests, conduct quantitative benchmarking and ablation across facade types and tasks, and examine transferability to other mechatronic systems.

4. Design Practice

Structural note. Section 4 mirrors the four-stage D-A-F-T framework in Section 3: Section 4.1 (Stage D-A), Section 4.2 (Stage F), Section 4.3 (Stage T), and Section 4.4 and Section 4.5 (Verification and F1–F3 loops). Each subsection explicitly references its methodological counterpart to preserve traceability from models to implementable design artifacts.

4.1. Demand Modeling and Weighting (Stage D-A: DEMATEL-ANP)

This subsection reports only the representative elements needed to preserve traceability within the D-A-F-T framework: (i) indicator construction and validity, (ii) representative DEMATEL matrices/indices and the causal scatter plot with explicit thresholds, (iii) the ANP network with global weights, and (iv) the Top-6 selection used downstream. Full computations, intermediate matrices, and scripts are provided in the Supplementary Materials. All notation and equations follow Section 3.1, as shown in Equations (1)–(8). The complete Round-1 and Round-2 questionnaires (purpose/scope, respondent profile, rating instructions, and item wording) are reproduced in Appendix A and Appendix B.

4.1.1. Indicator System: Construction and Validity

A systematic review and scenario-specific expert interviews generated an initial pool of 22 candidate indicators spanning five dimensions (function, performance, experience, safety, intelligence). A two-round modified Delphi with the same expert panel (n = 18) was then conducted to refine wording, dimensional attributions, and content validity.
Round 1 (22 items). Panel agreement reached a significant level (Kendall’s W = 0.624, χ2 = 235.737, p < 0.001). Screening thresholds were data-driven from the Round-1 distribution (Table 1): mean cutoff = 3.122 and CV cutoff = 0.185 (with full-score frequency as an auxiliary signal). Six items were flagged for “revise/merge” consideration due to low central tendency and/or dispersion: Facade 3D Mapping and Spatial Registration; Deployment and Turnaround Efficiency; Energy Efficiency; Noise Emission and Acoustic Comfort; Maintainability and Modularity; and Self-Diagnostics and Fault Tolerance.
Round 2 (19 items). To better fit near-facade VG operation and maintenance scenarios, four indicators were added prior to Round 2—Plant Replacement, Facade Adaptation, User Interface, and Predictive Maintenance—while the low-consensus items above were merged/removed, yielding the final 19-item set (Table 2). Agreement remained significant (Kendall’s W = 0.603, χ2 = 195.464, p < 0.001). Cutoffs tightened in Round 2 (mean ≥ 3.809; CV ≤ 0.096). Three indicators—Endurance Time, Structural Safety, and Autonomous Decision-Making—were labeled “consider with integration” because the CV was slightly above the tightened cutoff, but they were retained given medians ≥ 4 and acceptable interquartile ranges (IQRs ≤ 0.8).
To mitigate common-method bias, Delphi/ANP panelists (n = 18) and DEMATEL raters (n = 32, front-line practitioners) were separated. The terminology was standardized throughout. All participants provided informed consent; data were anonymized for academic use.
Instrument availability. Appendix A (Round-1 checklist and open-ended prompt) and Appendix B (Round-2 consolidated wording; final 19-item checklist) provide the inputs for DEMATEL-ANP modeling.

4.1.2. DEMATEL: Matrices, Indices, and Causal Plot

Design and data. To avoid common-method bias, DEMATEL ratings were collected from frontline practitioners (n = 32), independent of the Delphi/ANP panel. The respondents scored all C1–C19 pairs on a 0–4 scale with the main diagonal fixed to 0, generating individual 19 × 19 direct-relation matrices. Element-wise averaging produced the group matrix, which was normalized, as shown in Equation (2), and converted to the total-influence matrix, as shown in Equation (3), providing a complete 19 × 19 matrix (Table 3) (Supplementary Materials).
Indices and thresholds. Outgoing influence and incoming influence were computed from as row/column sums, with centrality and causality defined in Equations (4) and (5). The vertical reference line in the causal plot is set at the sample median centrality C ¯ = 4.177 (from Excel), while the horizontal line follows the standard DEMATEL convention H = 0 to separate drivers (H > 0) from receivers (H < 0). The results are reported (Table 4).
Causal Relationship Scatter Plot (Figure 4). Using the thresholds above (vertical at C ¯ = 4.177 ; horizontal at H = 0), nodes partition as follows:
  • Drivers/high centrality (Q1, C C ¯ , H ≥ 0): C8 Payload Capacity (C = 5.243, H = 0.681), C6 Flight Stability (4.903, 0.840), C17 Structural Safety (4.771, 0.050), C2 Precision Spraying (4.536, 0.197), C18 Autonomous Decision-Making (4.490, 0.465), C3 Plant Replacement (4.319, 0.471), C4 Data Transmission (4.225, 0.354), and C1 Automatic Obstacle Avoidance (4.177, 0.749).
  • Drivers/low centrality (Q2, C < C ¯ , H ≥ 0): C9 Facade Adaptation (4.110, 0.789).
  • Receivers/high centrality (Q3, C C ¯ , H < 0): C14 Operational Safety (4.544, −0.877) and C16 Environmental Safety (4.182, −0.395).
  • Receivers/low centrality (Q4, C < C ¯ , H < 0): C5 Environmental Monitoring (3.931, −0.072), C19 Predictive Maintenance (3.849, −0.702), C15 Material Safety (3.801, −0.107), C10 Human–Machine Dimensional Compatibility (3.781, −0.226), C12 User Interface (3.533, −0.153), C11 Color Harmony (3.451, −0.555), C7 Endurance Time (3.371, −0.467), and C13 Aesthetic Appearance (2.988, −1.044).
Findings. The Q1 cluster contains multi-module “driver” requirements with strong network embeddedness—notably, C8 Payload Capacity and C6 Flight Stability, which act as leverage points for performance-safety co-optimization. C1 (Obstacle Avoidance) and C3/C4/C18 (Task Execution and Decision-Making) sit on the same driver ridge, guiding ANP edge directions. C14 and C16 emerge as high-centrality receivers, implying system-level safety is a resultant property shaped by upstream drivers rather than an isolated module. The remaining low-centrality receivers (Q4) inform downstream acceptance/experience constraints and should be protected when resolving conflicts in the FAST-TRIZ steps.
Instrument availability (DEMATEL). The full matrix-style questionnaire, operational definitions, and scoring guide are provided in Appendix C: Table A3 (indicator list), Table A4 (toy 2 × 2 example), and Table A5 (blank 19 × 19 matrix). Individual matrices, the normalization scalar, and computation logs are provided in the Supplementary Materials.

4.1.3. ANP Network and Global Weights

Network and judgments. Significant links extracted from the DEMATEL total-influence matrix (Section 4.1.2) informed the ANP feedback network (Figure 5). Pairwise comparisons were conducted by the Delphi expert panel (n = 18) using the Saaty 1–9 scale; the full ANP pairwise-comparison questionnaire is reproduced in Appendix D. Five cluster-level judgment matrices (w.r.t. B1–B5) all passed the consistency test (CR < 0.1; see below).
Inter-cluster local priorities. To avoid redundancy, we report the 5 × 5 inter-cluster priority matrix W (Table 5). The full pairwise matrices are provided in the Supplementary Materials.
Consistency ratios (from Excel tags; λ max in parentheses): C R B 1 = 0.064 (λ_\max = 5.287), CR = 0.084 (5.376), C R B 3 = 0.067 (5.299), C R B 4 = 0.095 (5.423), and C R B 5 = 0.050 (5.223).
Supermatrix and convergence. Node-level local priorities were stacked to form the unweighted supermatrix, as shown in Equation (6), column-weighted by W to obtain the weighted supermatrix, as shown in Equation (7), and powered to convergence for the limit supermatrix, as shown in Equation (8). The identical column vector of the limit supermatrix gives the global weights for C1–C19 (Table 6).
Rounding: Four d.p. (cluster and global weights). Within-cluster sums equal B1 = 0.4251, B2 = 0.2027, B3 = 0.0600, B4 = 0.1914, and B5 = 0.1208 (tolerance < 1 × 10⁻⁴).
Implications. The Top-6 global priorities are C1 (0.1659), C6 (0.0919), C2 (0.0853), C17 (0.0810), C18 (0.0743), and C3 (0.0688). These align with the DEMATEL drivers (Section 4.1.2), reinforcing their roles as network hubs that should anchor the FAST conflict localization and TRIZ transformations. Lower-weight experience items (C10–C13) function as design constraints to be protected during trade-offs rather than maximized in isolation.

4.1.4. Selection of Core Requirements (Top-6)

Selection criterion. To ensure traceability from causal structure to prioritization within the D-A-F-T framework, we apply a two-gate rule:
(i) Gate-1 (ANP priority): rank indicators by the ANP global weights from the limit supermatrix and retain the top 30% (19 items → 6 items);
(ii) Gate-2 (DEMATEL validation): from these, keep only drivers with high centrality, i.e., H = D R 0 and C = D + R C ¯ with C = 4.177 .
Ties are broken by larger H, then by larger C.
Final Top-6 set (ANP-driven, DEMATEL-validated) (Table 7).
All six items satisfy H 0 and C C ¯ (Q1 quadrant in Figure 4). The weights are ANP global weights; DEMATEL indices use three-decimal rounding.
Coverage. The Top-6 account for 56.7% of the total priority mass (0.567), ensuring focused resource allocation while preserving representativeness across clusters: B1 (C1/C2/C3, 0.320), B2 (C6, 0.092), B4 (C17, 0.081), and B5 (C18, 0.074).

4.2. Functional Decomposition and Conflict Localization (Stage F: FAST)

4.2.1. VG-UAV Black-Box Model (Inputs–Model–Outputs)

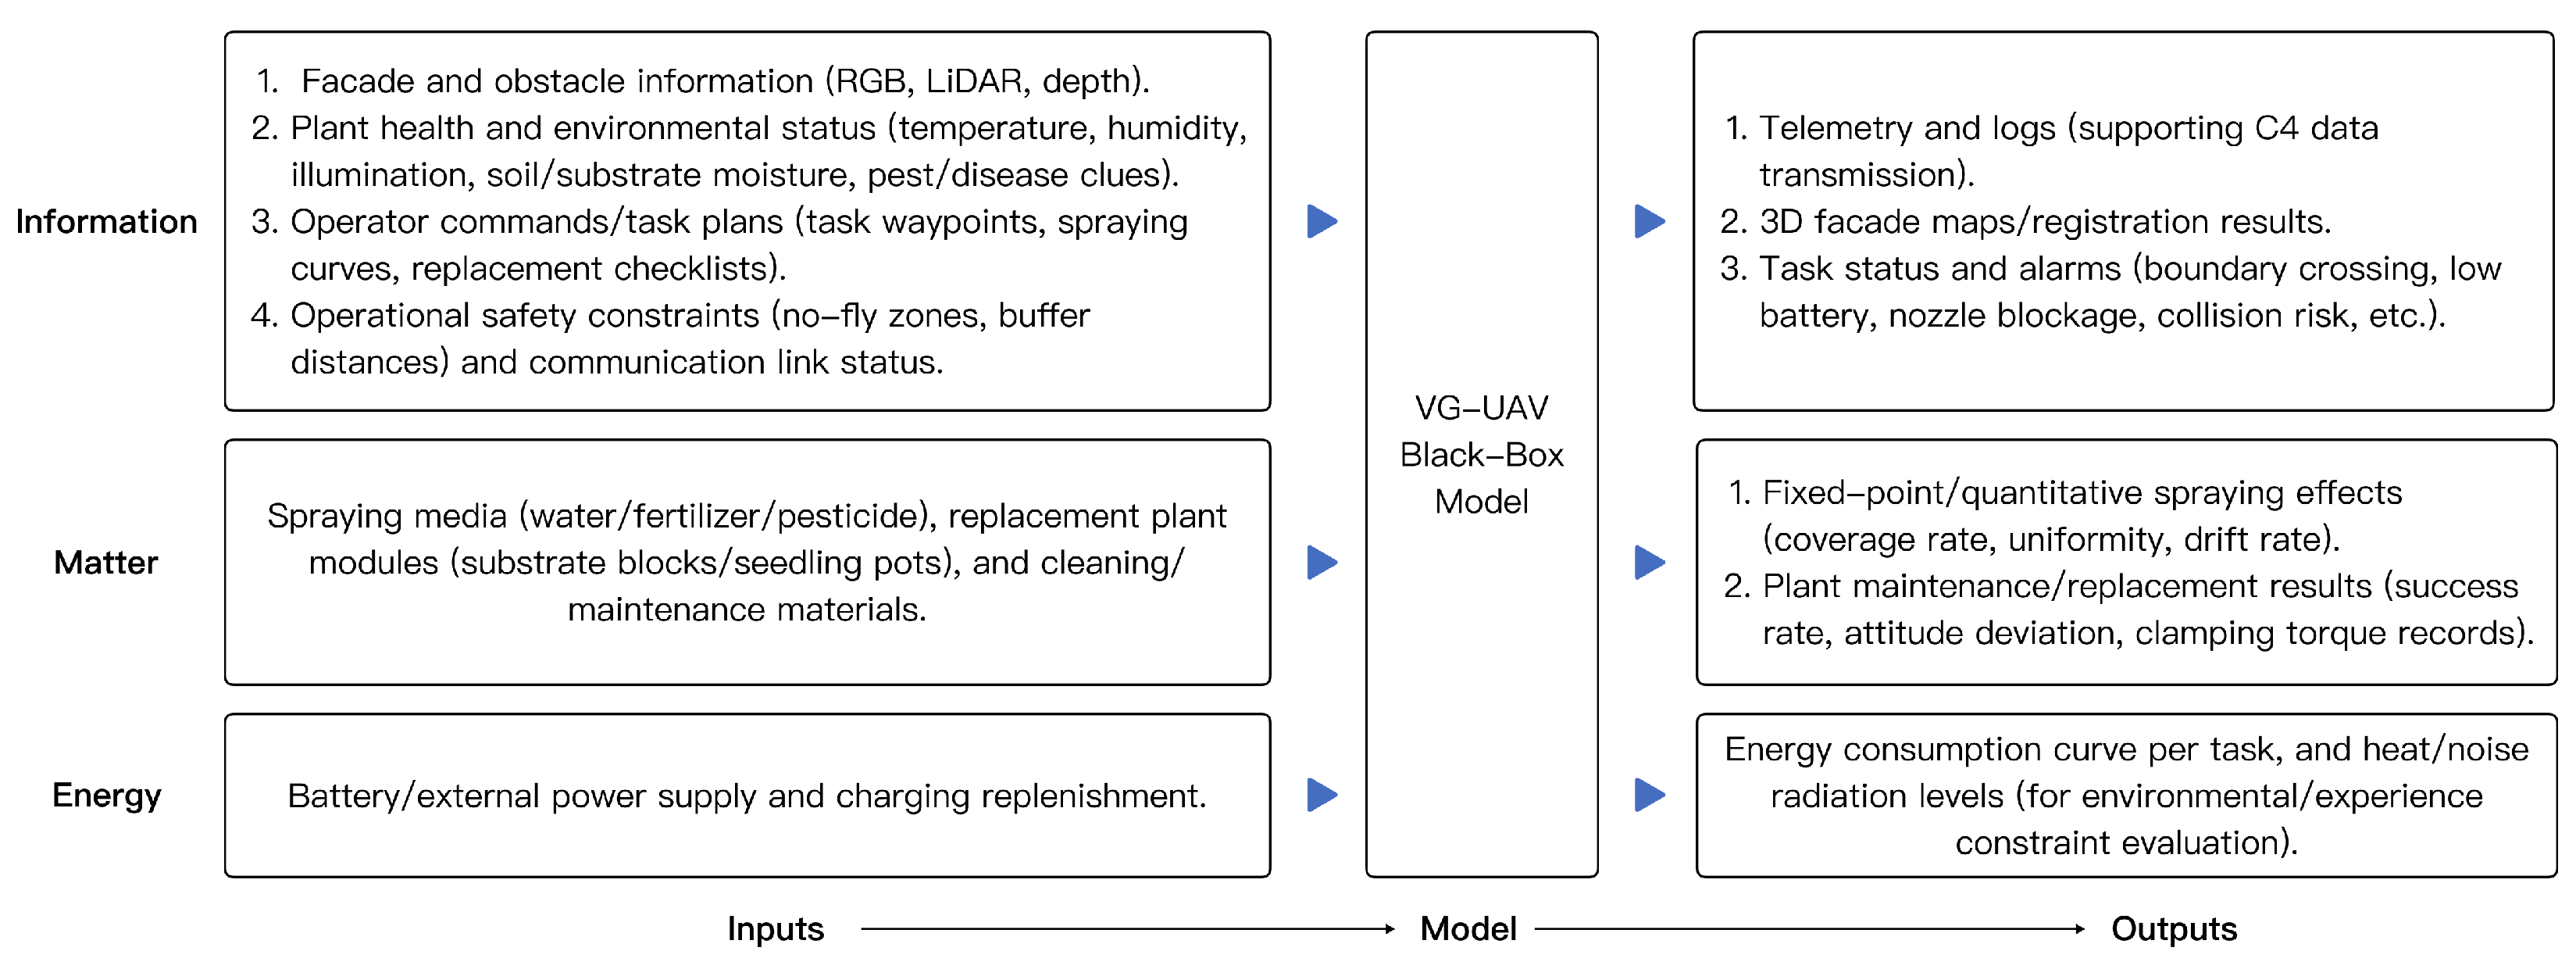
Purpose and boundary. The top function is to perform safe, stable, and efficient maintenance of VG in near-facade environments. Internal mechanisms (algorithms/structures/controllers) are abstracted as a black box, exposing only externally observable inputs, transformed domains, and outputs (Figure 6). Two primary task modes—precision spraying and plant replacement—are supported, with monitoring/inspection and data reporting as auxiliaries.
  • Inputs. The left interface comprises three port classes, aligned with Figure 6 and prioritized by the Top-6 weights from 4.1 (C1, C6, C2, C17, C18, C3).
  • Information: Facade and obstacle information (RGB, LiDAR, depth), plant health and environmental status (temperature, humidity, illumination, soil/substrate moisture, pest/disease clues), operator commands/task plans (task waypoints, spraying curves, replacement checklists), and operational safety constraints (no-fly zones, buffer distances) and communication link status.
  • Matter: Spraying media (water/fertilizer/pesticide), replacement plant modules (substrate blocks/seedling pots), and cleaning/maintenance materials.
  • Energy: Battery/external power supply and charging replenishment.
  • Outputs. Right-side deliverables are grouped as follows:
  • Information: Telemetry and logs (supporting C4 data transmission), 3D facade maps/registration results, and task status and alarms (boundary crossing, low battery, nozzle blockage, collision risk, etc.).
  • Matter: Fixed-point/quantitative spraying effects (coverage rate, uniformity, drift rate) and plant maintenance/replacement results (success rate, attitude deviation, clamping torque records).
  • Energy/loss: Energy consumption curve per task, and heat/noise radiation levels (for environmental/experience constraint evaluation).

4.2.2. FAST-Based Functional Tree Construction

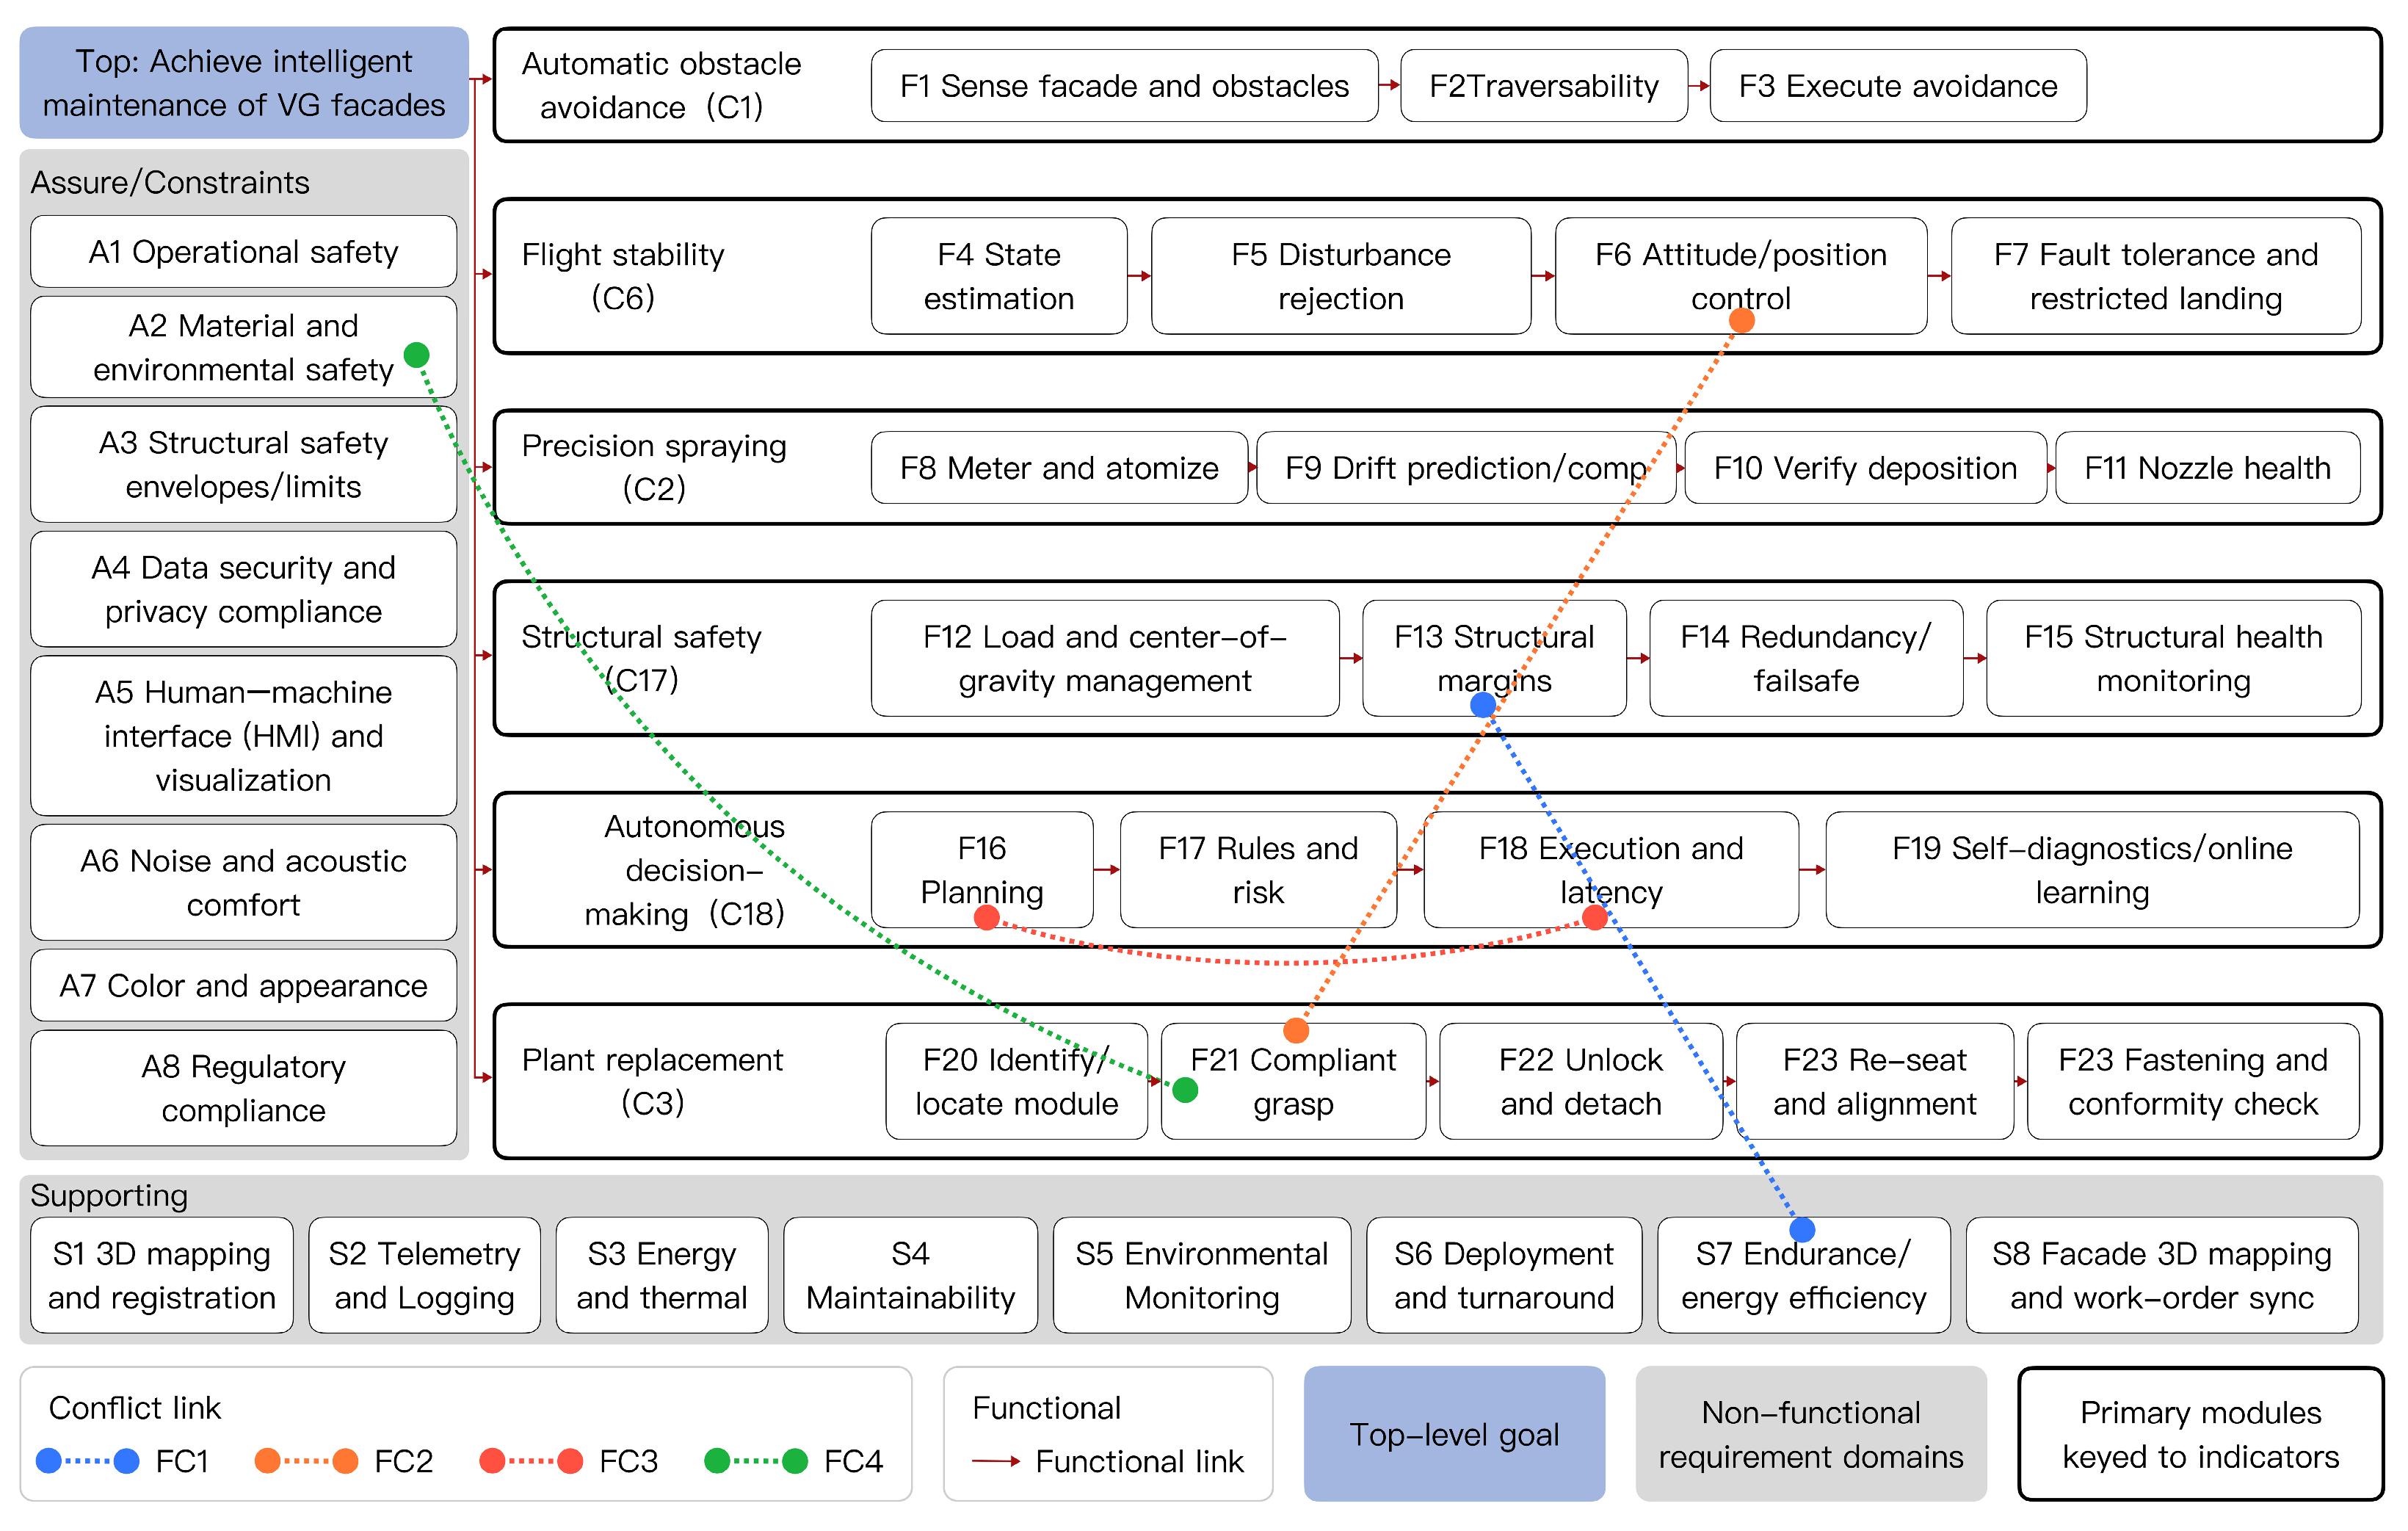
Construction logic. Starting from the black-box top function—to achieve safe, stable and efficient VG maintenance in near-facade environments—we built the FAST tree in four steps (Figure 7):
  • Anchor the primary “How” paths with the Top-6 requirements from 4.1: C1 Obstacle Avoidance, C6 Flight Stability, C2 Precision Spraying, C17 Structural Safety, C18 Autonomous Decision-Making, and C3 Plant Replacement.
  • Decompose each path into executable subfunctions (F-nodes) along the Why–How axis, preserving task causality and control flow.
  • Attach supporting functions (S-nodes) that cross-serve multiple branches, and bind assure/constraints (A-nodes) that cap risk across the whole tree.
  • Localize cross-branch conflicts (FC1–FC4) as dashed links to guide downstream TRIZ resolution.
Primary “How” paths (F-nodes).
  • C1 Automatic Obstacle Avoidance: F1 Sense facade/obstacles → F2 Traversability → F3 Execute avoidance.
  • C6 Flight Stability: F4 State estimation → F5 Disturbance rejection → F6 Attitude/position control → F7 Fault tolerance and restricted landing.
  • C2 Precision Spraying: F8 Meter and atomize → F9 Drift prediction/compensation → F10 Verify deposition → F11 Nozzle health.
  • C17 Structural Safety: F12 Load and Center-of-Gravity management → F13 Structural margins → F14 Redundancy/failsafe → F15 Structural health monitoring.
  • C18 Autonomous Decision-Making: F16 Planning → F17 Rules and risk → F18 Execution and latency → F19 Self-diagnostics/online learning.
  • C3 Plant Replacement: F20 Identify/locate module → F21 Compliant grasp → F22 Unlock and detach → F23 Re-seat and alignment → F24 Fastening and Conformity Check.
Supporting layer (S-nodes).
S1 3D mapping and registration, S2 Telemetry and logging, S3 Energy and thermal management, S4 Maintainability, S5 Environmental monitoring, S6 Deployment and turnaround, S7 Endurance/energy efficiency, and S8 facade 3D Map and work-order sync. These provide shared capabilities (e.g., mapping, energy, data) that enable multiple branches simultaneously.
Assure/Constraints layer (A-nodes).
A1 operational safety, A2 Material and environmental safety, A3 Structural safety envelopes/limits, A4 Data security and privacy compliance, A5 HMI and visualization, A6 Noise and acoustic comfort, A7 Color and appearance, and A8 Regulatory compliance. These impose system-wide guardrails and acceptance criteria.
Conflict localization (dashed links in Figure 7).
  • FC1 (blue): S7 Endurance/energy efficiency ↔ F13 Structural margins—lightweighting vs. structural safety.
  • FC2 (orange): F21 Compliant grasp ↔ F6 Attitude/position control—manipulator/payload disturbance vs. flight stability.
  • FC3 (red): F16 Planning ↔ F18 Execution and latency—autonomy complexity vs. real-time deadlines.
  • FC4 (green): F21 Compliant grasp ↔ A2 Material and environmental safety—grasp stiffness vs. botanical compliance.

4.3. Conflict Transformation and Concept Generation (Stage T: TRIZ)

Objective. Convert the cross-branch conflicts localized into TRIZ parameter pairs, select suitable invention principles, and derive implementable concepts that close the loop from requirements to functions, conflicts, and structures.

4.3.1. Parameterizing the Conflicts

We mapped each conflict FCx to improve vs. worsen factors using the 39 General Engineering Parameters (Appendix E); the full mapping is summarized in Table 8. The rightmost column lists the short-listed invention principles (Appendix F).

4.3.2. Selected Principles and Concept Generation

Following expert screening and feasibility analysis, one primary principle was selected per conflict and turned into a concrete concept. Each concept includes its mechanism, FAST mapping, acceptance metrics, and risk controls.
FC1 → P40 Composite materials.
Concept C1—CFRP high-specific-stiffness airframe.
Mechanism. Carbon-fiber/foam-core (or honeycomb) lattice arms and battery cage; direction-optimized layups at arm seats and tool mounts; replaceable energy-absorbing bumpers (P11).
FAST mapping. F12 Load and CG → F13 Structural margins → F14 Redundancy/failsafe → F15 SHM; S7 Endurance/energy efficiency.
FC2 → P24 Mediator (intermediary).
Concept C2—Rail–counterweight cooperative balancing.
Mechanism. Sliding-rail counterweight aligned to the manipulator axis: A linear rail hosts a fast, lightweight counterweight. The flight controller uses end-effector trajectory/torque estimates to command counterweight position and add torque feed-forward, reducing body-moment spikes during grasp/replace (Figure 8).
FAST mapping. F6 Attitude/position control; F21–F23 Compliant grasp/Unlock/Reseat; F12 Load and CG.
FC3 → P1 Segmentation (multi-rate/layered).
Concept C3—Multi-rate autonomy with lightweight vision.
Mechanism. Hierarchical timing: control 400 Hz, local planning 20–40 Hz, global re-plan 1–5 Hz; vision by YOLOv11 (lightweight variant) for facade/obstacle/target detection to reduce online compute load (internal benchmarks show higher FPS than YOLOv8 on our dataset); facade graphs and cost maps pre-computed/cached; edge–cloud task split.
FAST mapping. F16 Planning → F17 Rules and risk → F18 Execution and latency → F19 Self-diagnostics; S1 3D mapping and registration, S2 Telemetry and logging.
FC4 → P30 Flexible membrane/shell.
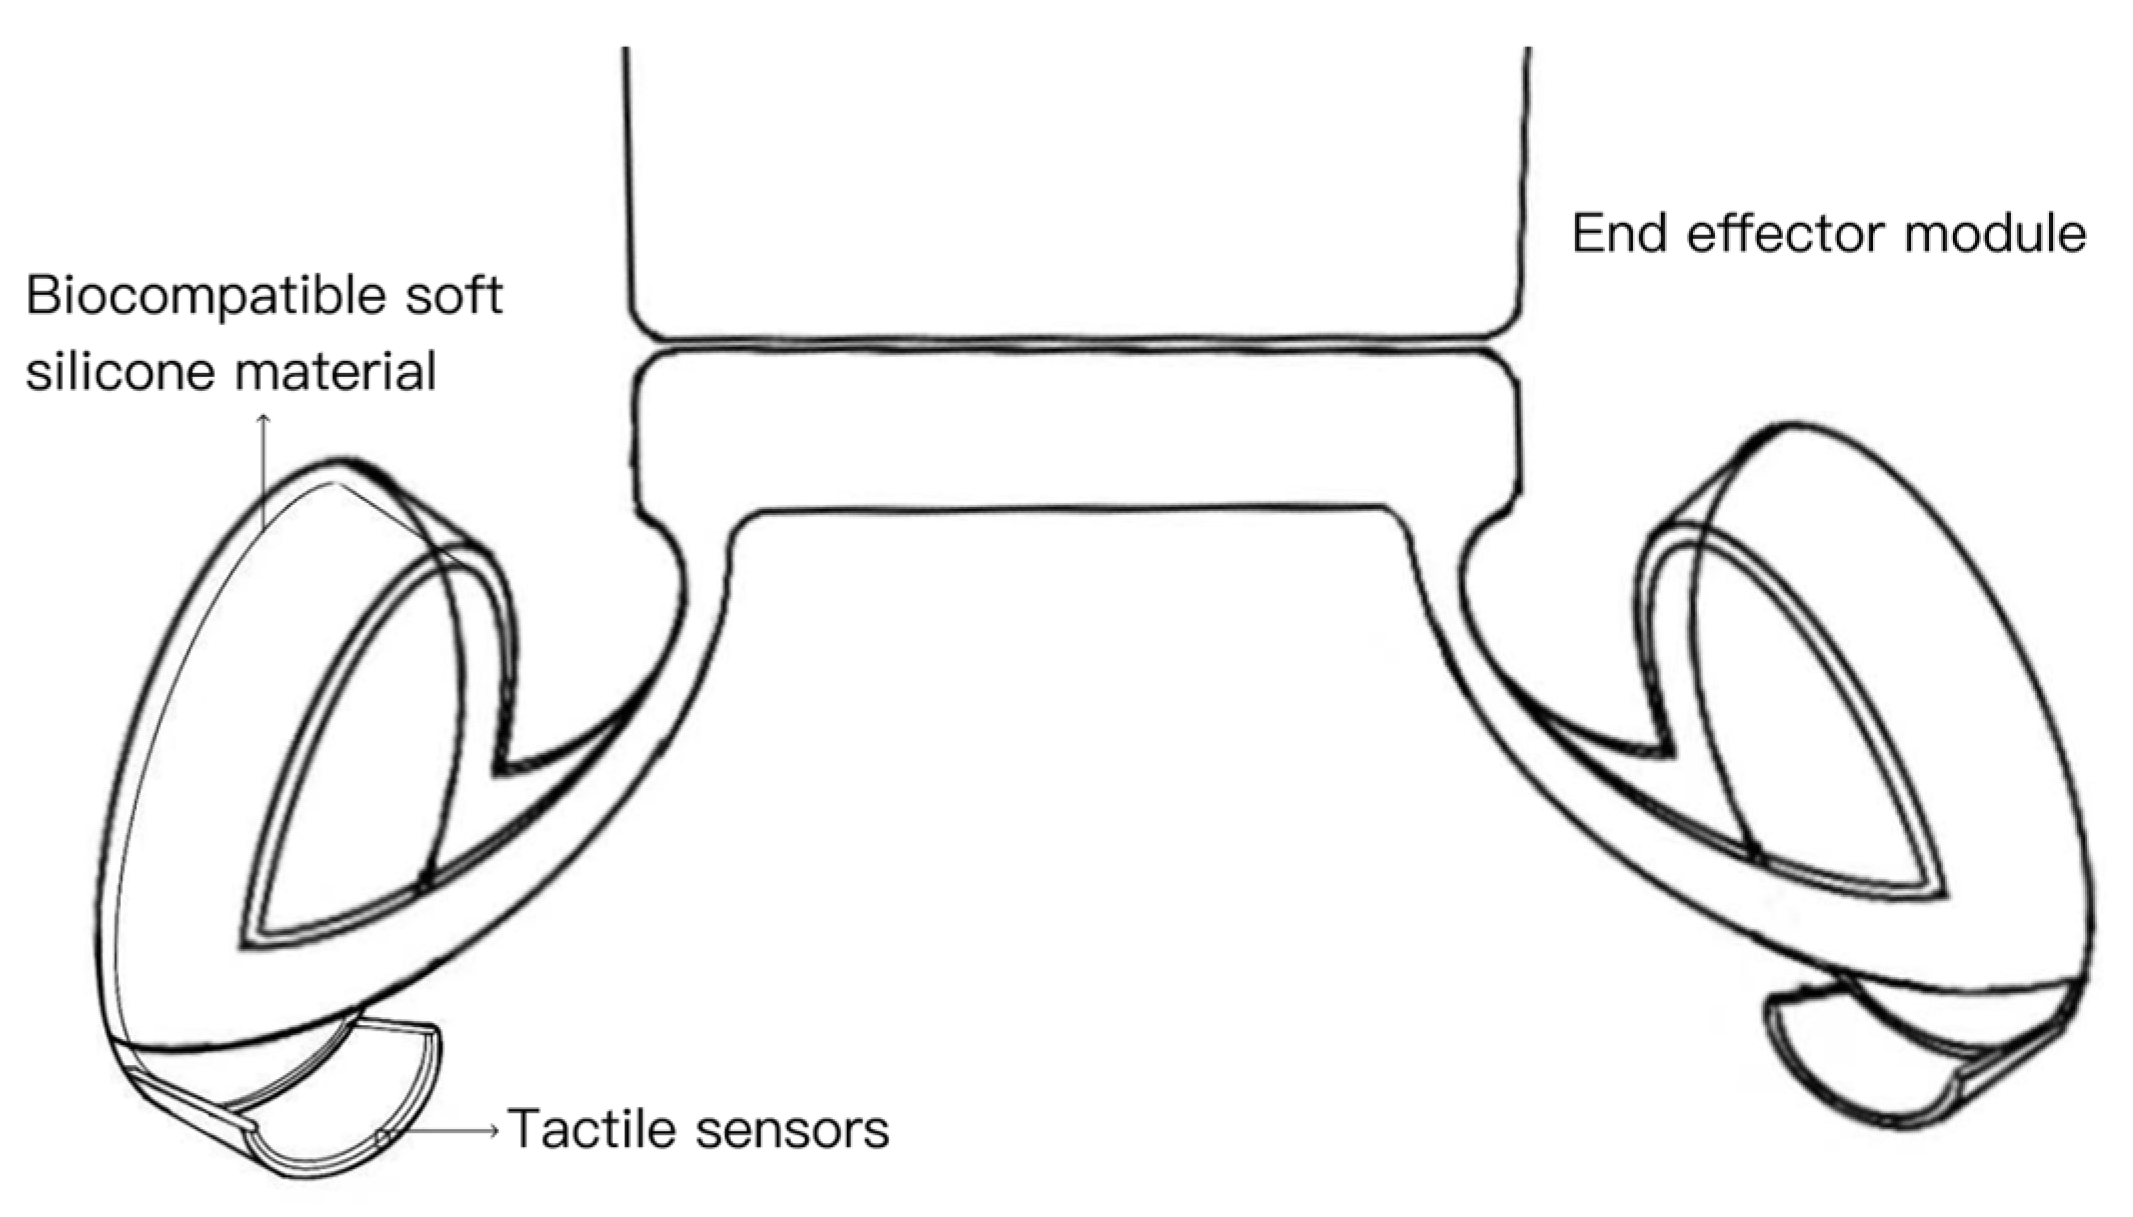
Concept C4—Bionic compliant gripper with soft porous pads (Figure 9).
Mechanism. Variable-stiffness gripper (Shore A ≈ 10–25; porosity 30–50%); integrated vision–tactile sensing for slip/force estimation; pot-rim adapters and protective sleeves act as mediators so the grasp acts on rigid elements instead of leaves.
FAST mapping. F21–F23 (grasp → detach → reseat and QC); A2 Material and environmental safety.

4.4. Design Scheme

This section instantiates the D-A-F-T pipeline into a buildable system and integrates the hardware–software stack required for near-facade tasks. The resulting platform is a symmetric, equal-arm hexacopter with two hot-swappable mission stations supporting a plant-replacement manipulator and a precision sprayer. The following subsections present the overall rendering, exploded architecture, mission workflow, supervisory HMI, and perception model pipeline.

4.4.1. Airframe and Mission Modules (Rhino–KeyShot)

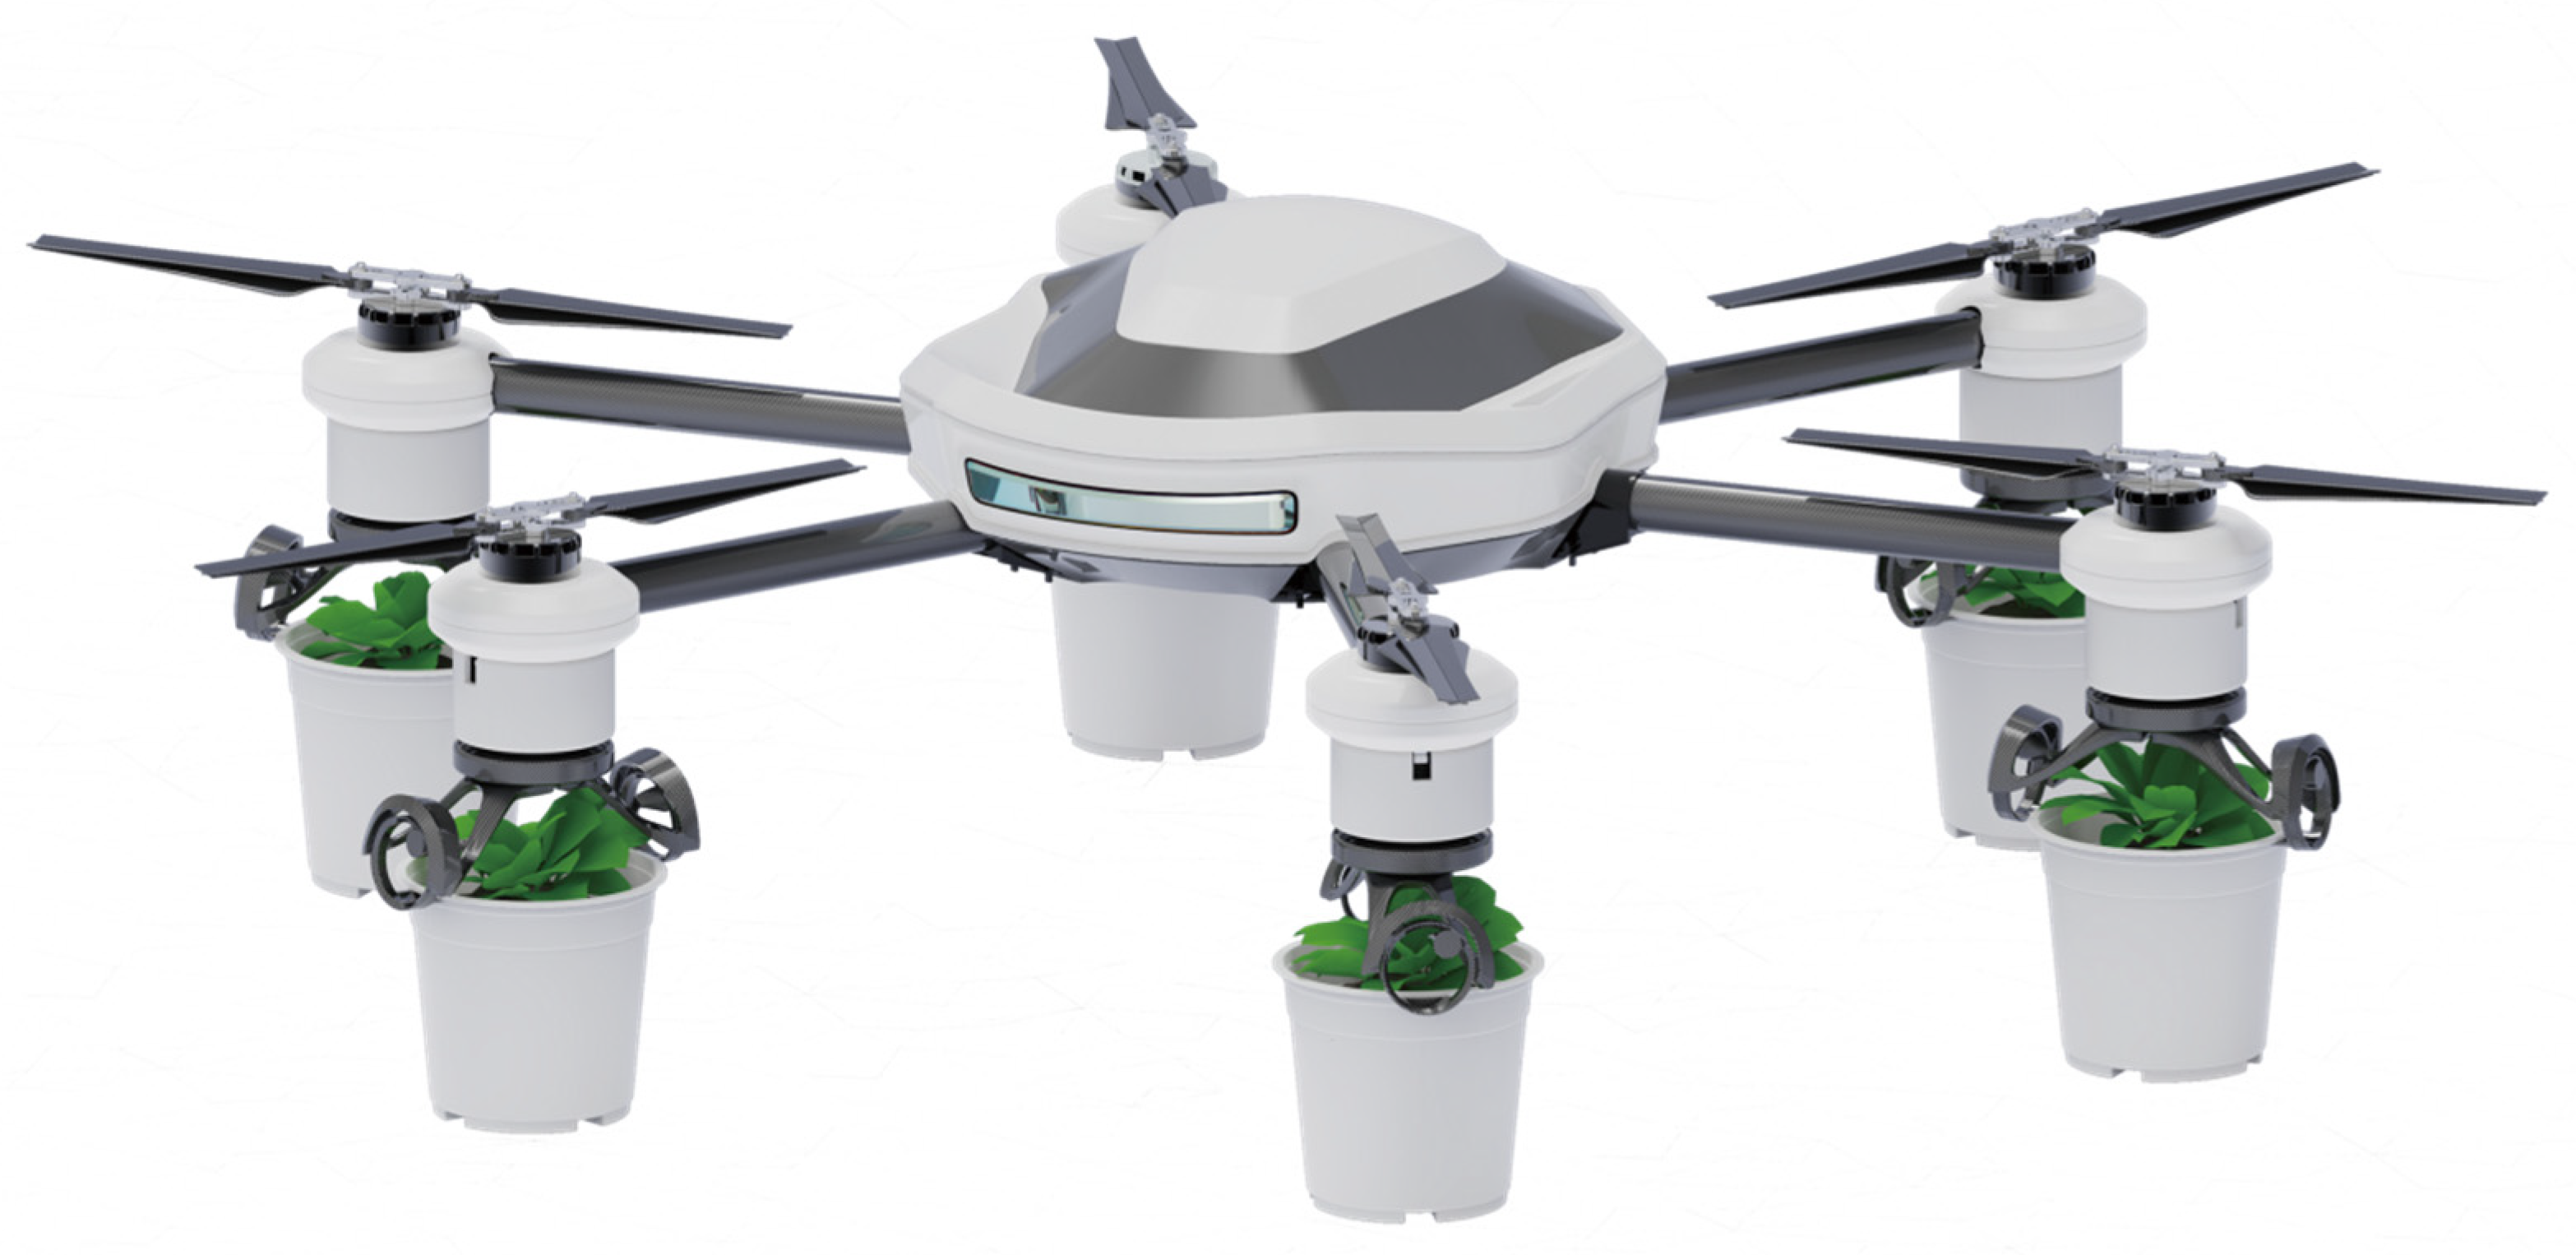
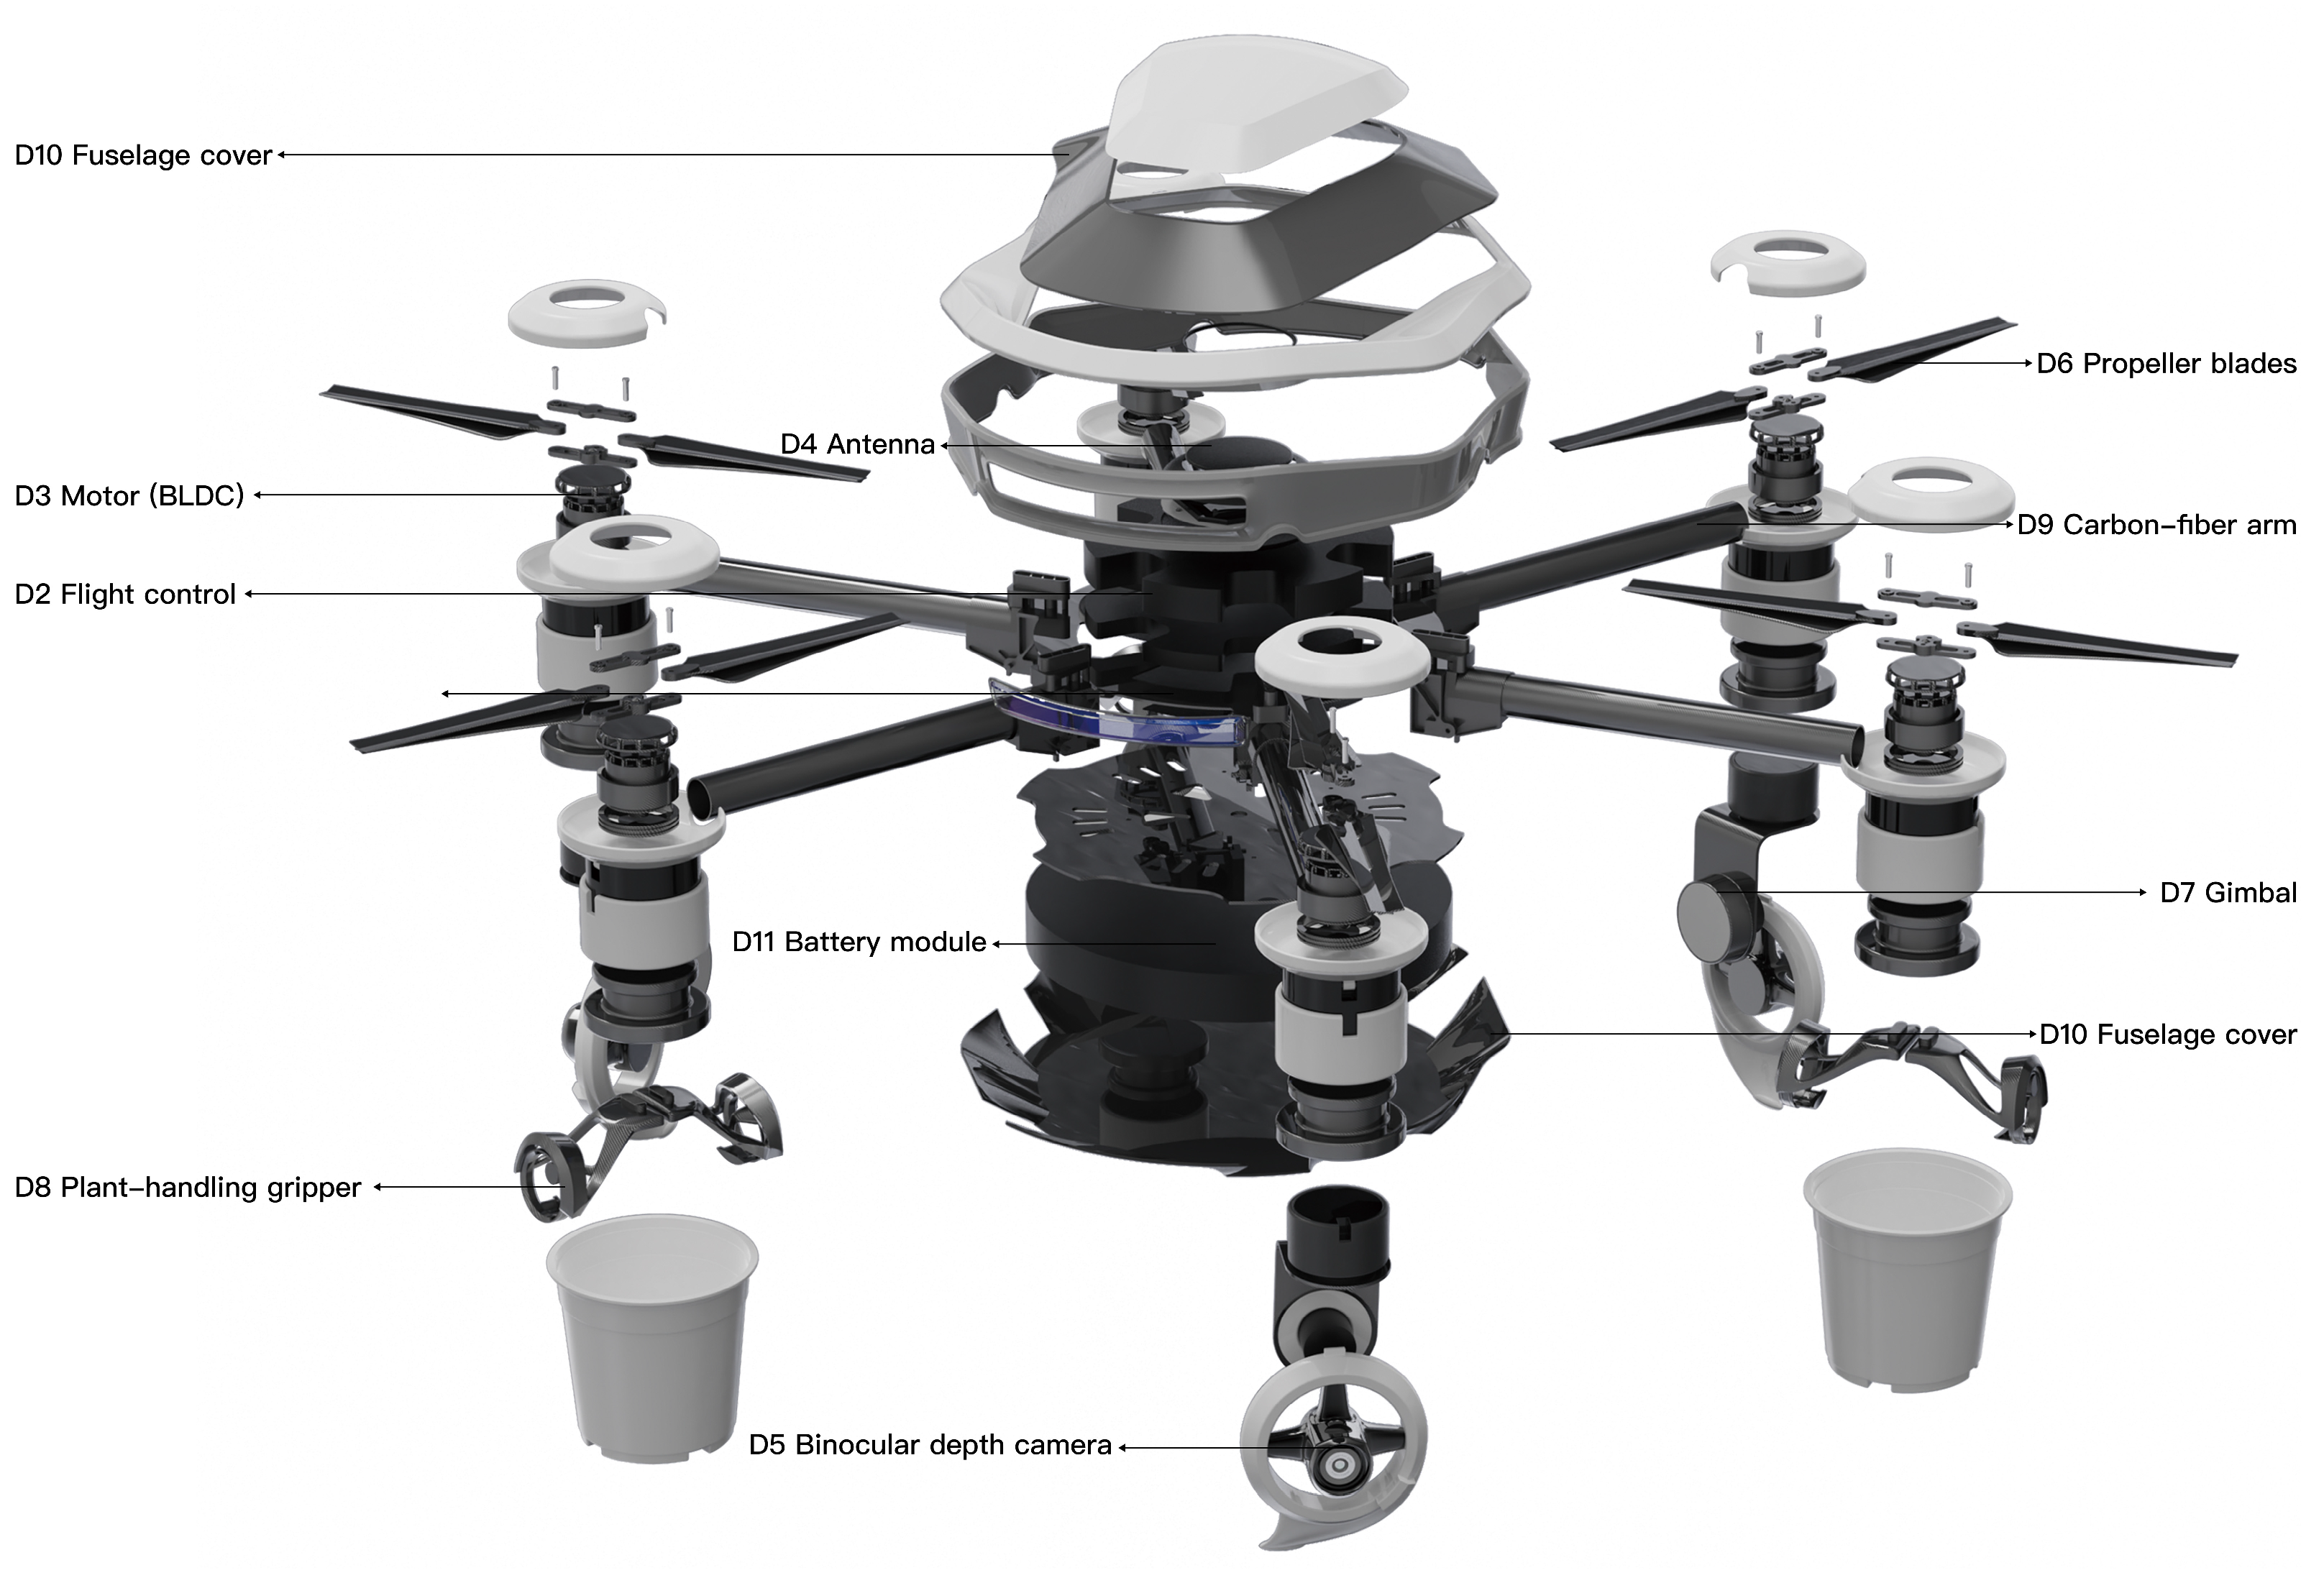
The industrial design emphasizes compact packaging, clear operational affordances, and service access (Figure 10). CFRP/CFRP-foam laminates form the primary structure with local lay-up reinforcement at arm roots and pod interfaces; energy-absorbing bumpers protect the arm tips for confined-space contact. The exploded view (Figure 11) details the propulsion stack, compliant gripper module, perception suite, and dual hot-swap batteries arranged on the lower deck to keep the center of gravity within the sliding-rail counterweight travel (addressing FC2 with P24 Mediator); see Table 9 for the module-callout map. The bionic compliant gripper adopts segmented fingers with soft porous pads so loads act on rigid pot features rather than foliage (addressing FC4 with P30 Flexible shells), enabling gentle grasp–reseat operations.

4.4.2. Mission Workflow

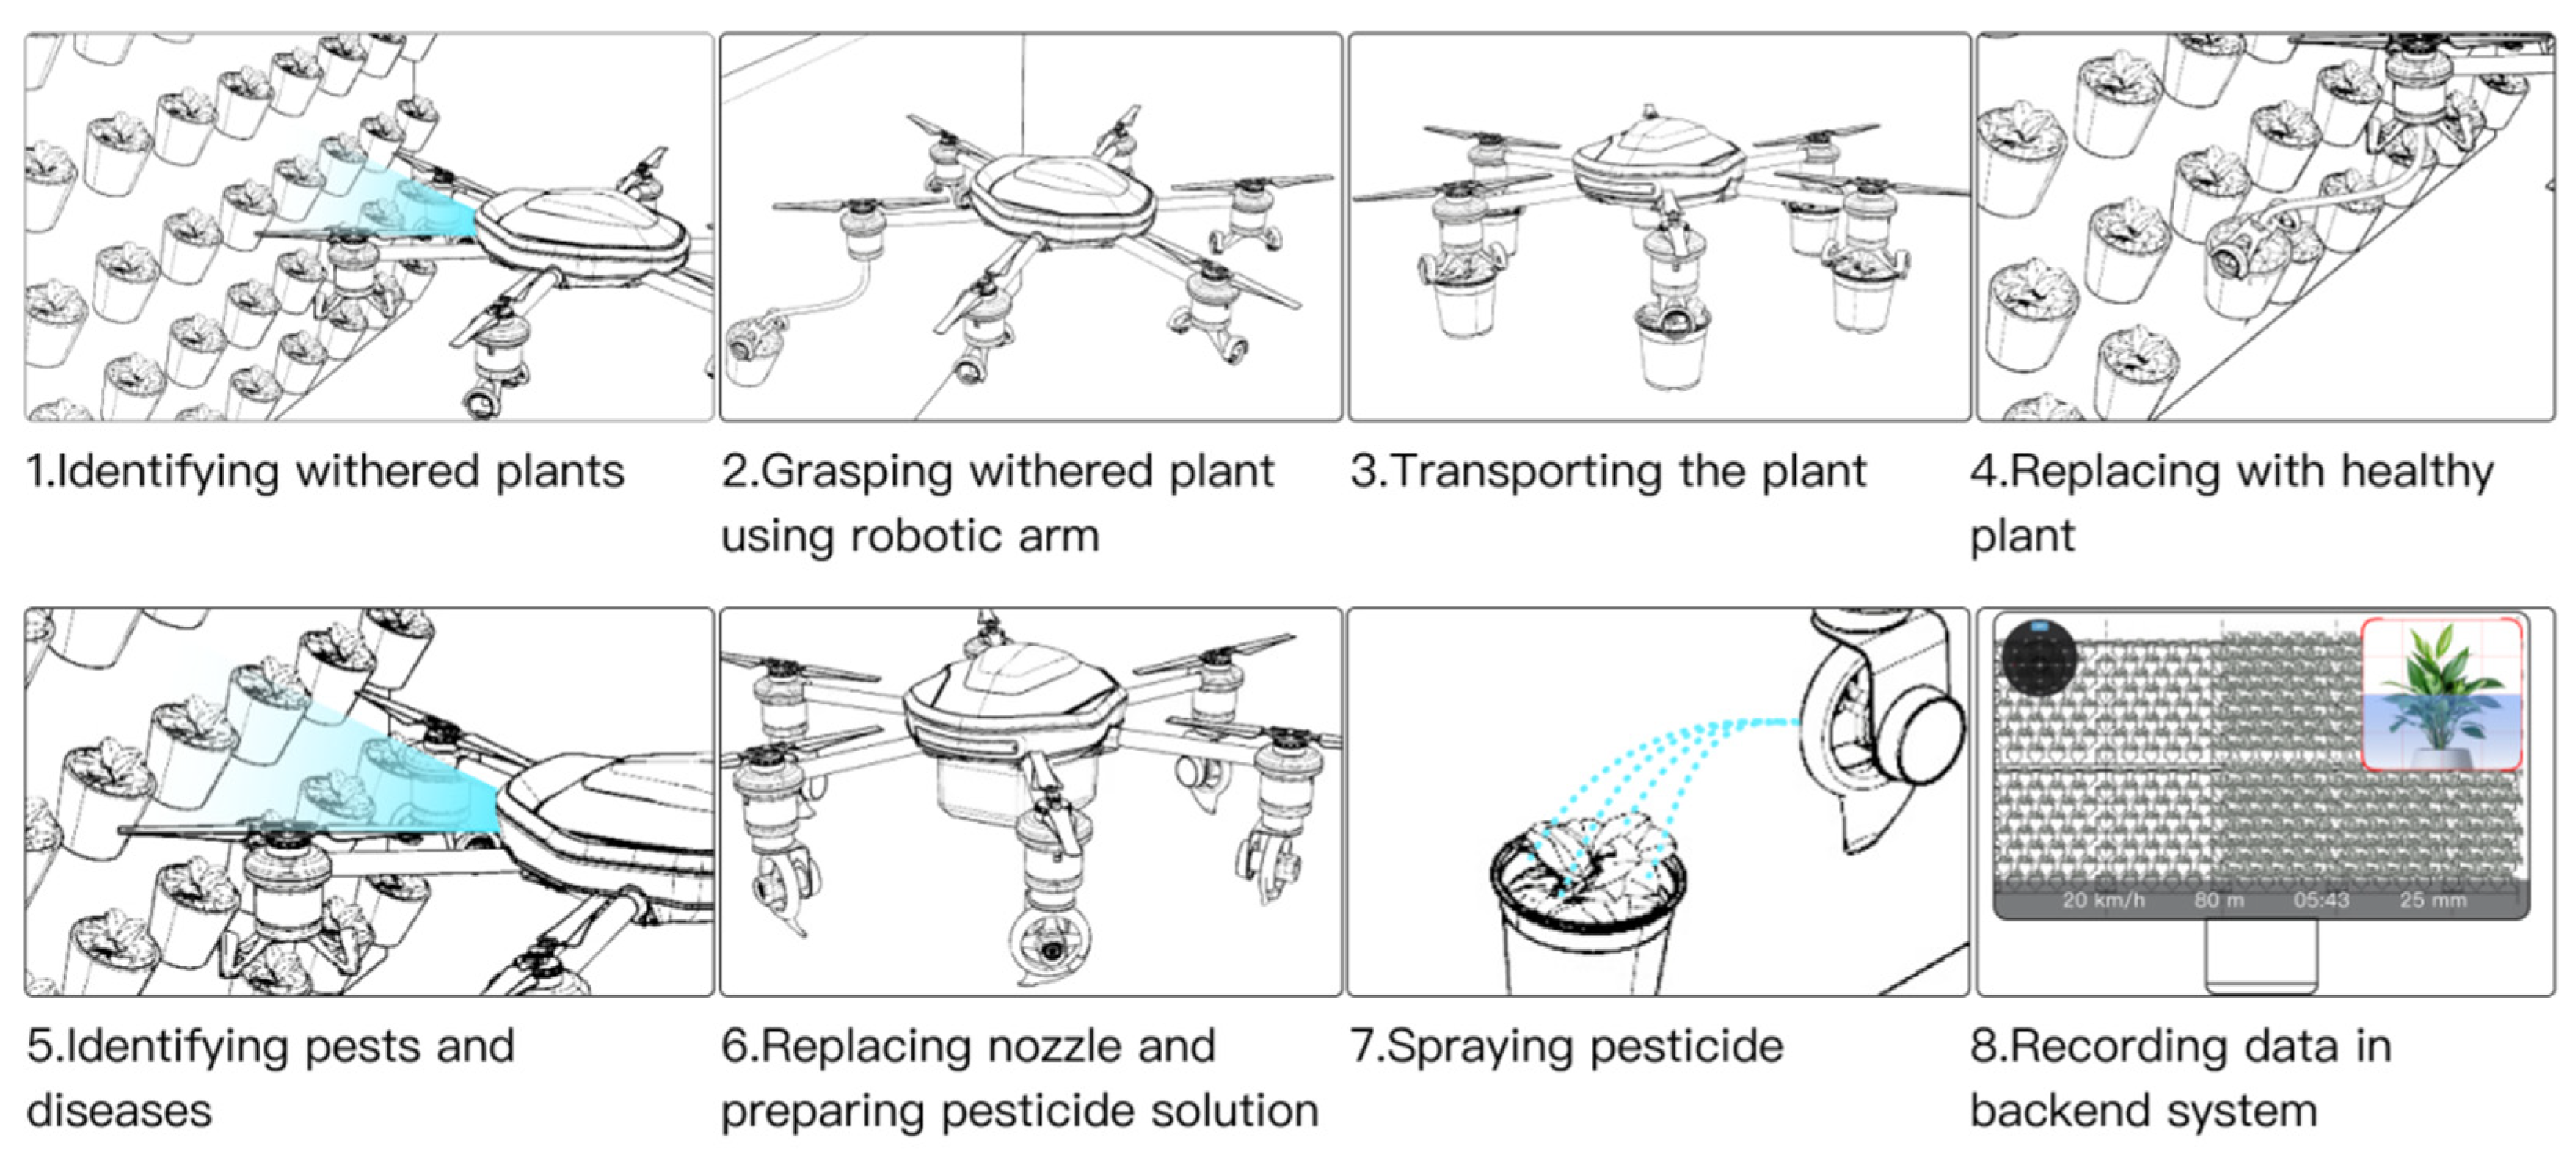
The storyboard (Figure 12) serializes execution logic and interfaces between perception, planning, and actuation. The replacement branch proceeds through identifying withered plants → grasp → transport → reseat with healthy plants (Steps 1–4). The plant-protection branch executes pest/disease identification → nozzle/tool preparation → targeted spraying (Steps 5–7). Step 8 closes the loop by recording telemetry, images, and QC results to the backend.

4.4.3. Web-Based HMI

The web-based dashboard (Figure 13) offers mission supervision and auditability. It integrates a YOLO-based detector, multispectral sensing, an omnidirectional stereo module, and flight-state telemetry, presenting a unified timeline of alerts, goals, and operator inputs. Access control, encrypted logs, and replay functions support post-mission analysis and regulatory compliance.

4.4.4. Visual System

As an advanced iteration of the YOLO family, YOLOv11 enhances feature extraction and multi-scale fusion, which is crucial for near-facade maintenance where targets are small, partially occluded, and embedded in cluttered textures. Empirical evidence supports adopting YOLOv11 as the onboard perception backbone for our VG-UAV: Tang et al. [23] proposed SP-YOLO, a YOLOv11n-based detector that swaps in a hybrid CNN–Transformer backbone (CAT), a Depthwise Separable Convolution Block (DSCB), and a Cross-Layer Path Aggregation Network (CLPAN) to strengthen multi-scale fusion and long-range feature capture. On the BeetPest field dataset, SP-YOLO achieves mAP@50 = 0.884, mAP@50:95 = 0.612, P = 0.887, and R = 0.831, with 136 FPS at only 8.5 M params/2.8 GFLOPs, improving over YOLO11n by +4.9 pp mAP@50, +9.9 pp P, and +1.3 pp R. This proves real-time, edge-feasible multi-scale pest detection built on YOLOv11 while reducing misses/false positives in dense/occluded scenes. Zhang et al. [24] tailored YOLO11-Pear for orchards by adding a small-object head and DySample upsampling to sharpen tiny/occluded targets with minimal compute overhead. They reported the highest mAP among YOLO11n/YOLOv8n/YOLOv5n under occlusion and visibly fewer edge/occluded misses than baselines—proving robustness to occlusion and small objects, which mirrors near-facade VG clutter (frames, leaves, brackets). Zhu et al. [25] conducted a bibliometric review of 13,738 papers (2018–2024) and identified UAV + remote sensing + deep learning as a central hotspot for crop disease/pest monitoring, evidencing a mature, scalable “UAV-AI” pathway that our VG scenario can inherit.
Together, these studies show that YOLOv11 (i) scales to small/occluded vegetation targets, (ii) sustains real-time edge throughput for closed-loop flight/spraying, and (iii) is validated on plant-disease tasks with architecture-level multi-scale enhancements, all within a widely accepted UAV-AI pipeline. Hence, adopting YOLOv11 onboard the VG-UAV is technically sound for near-facade operation.
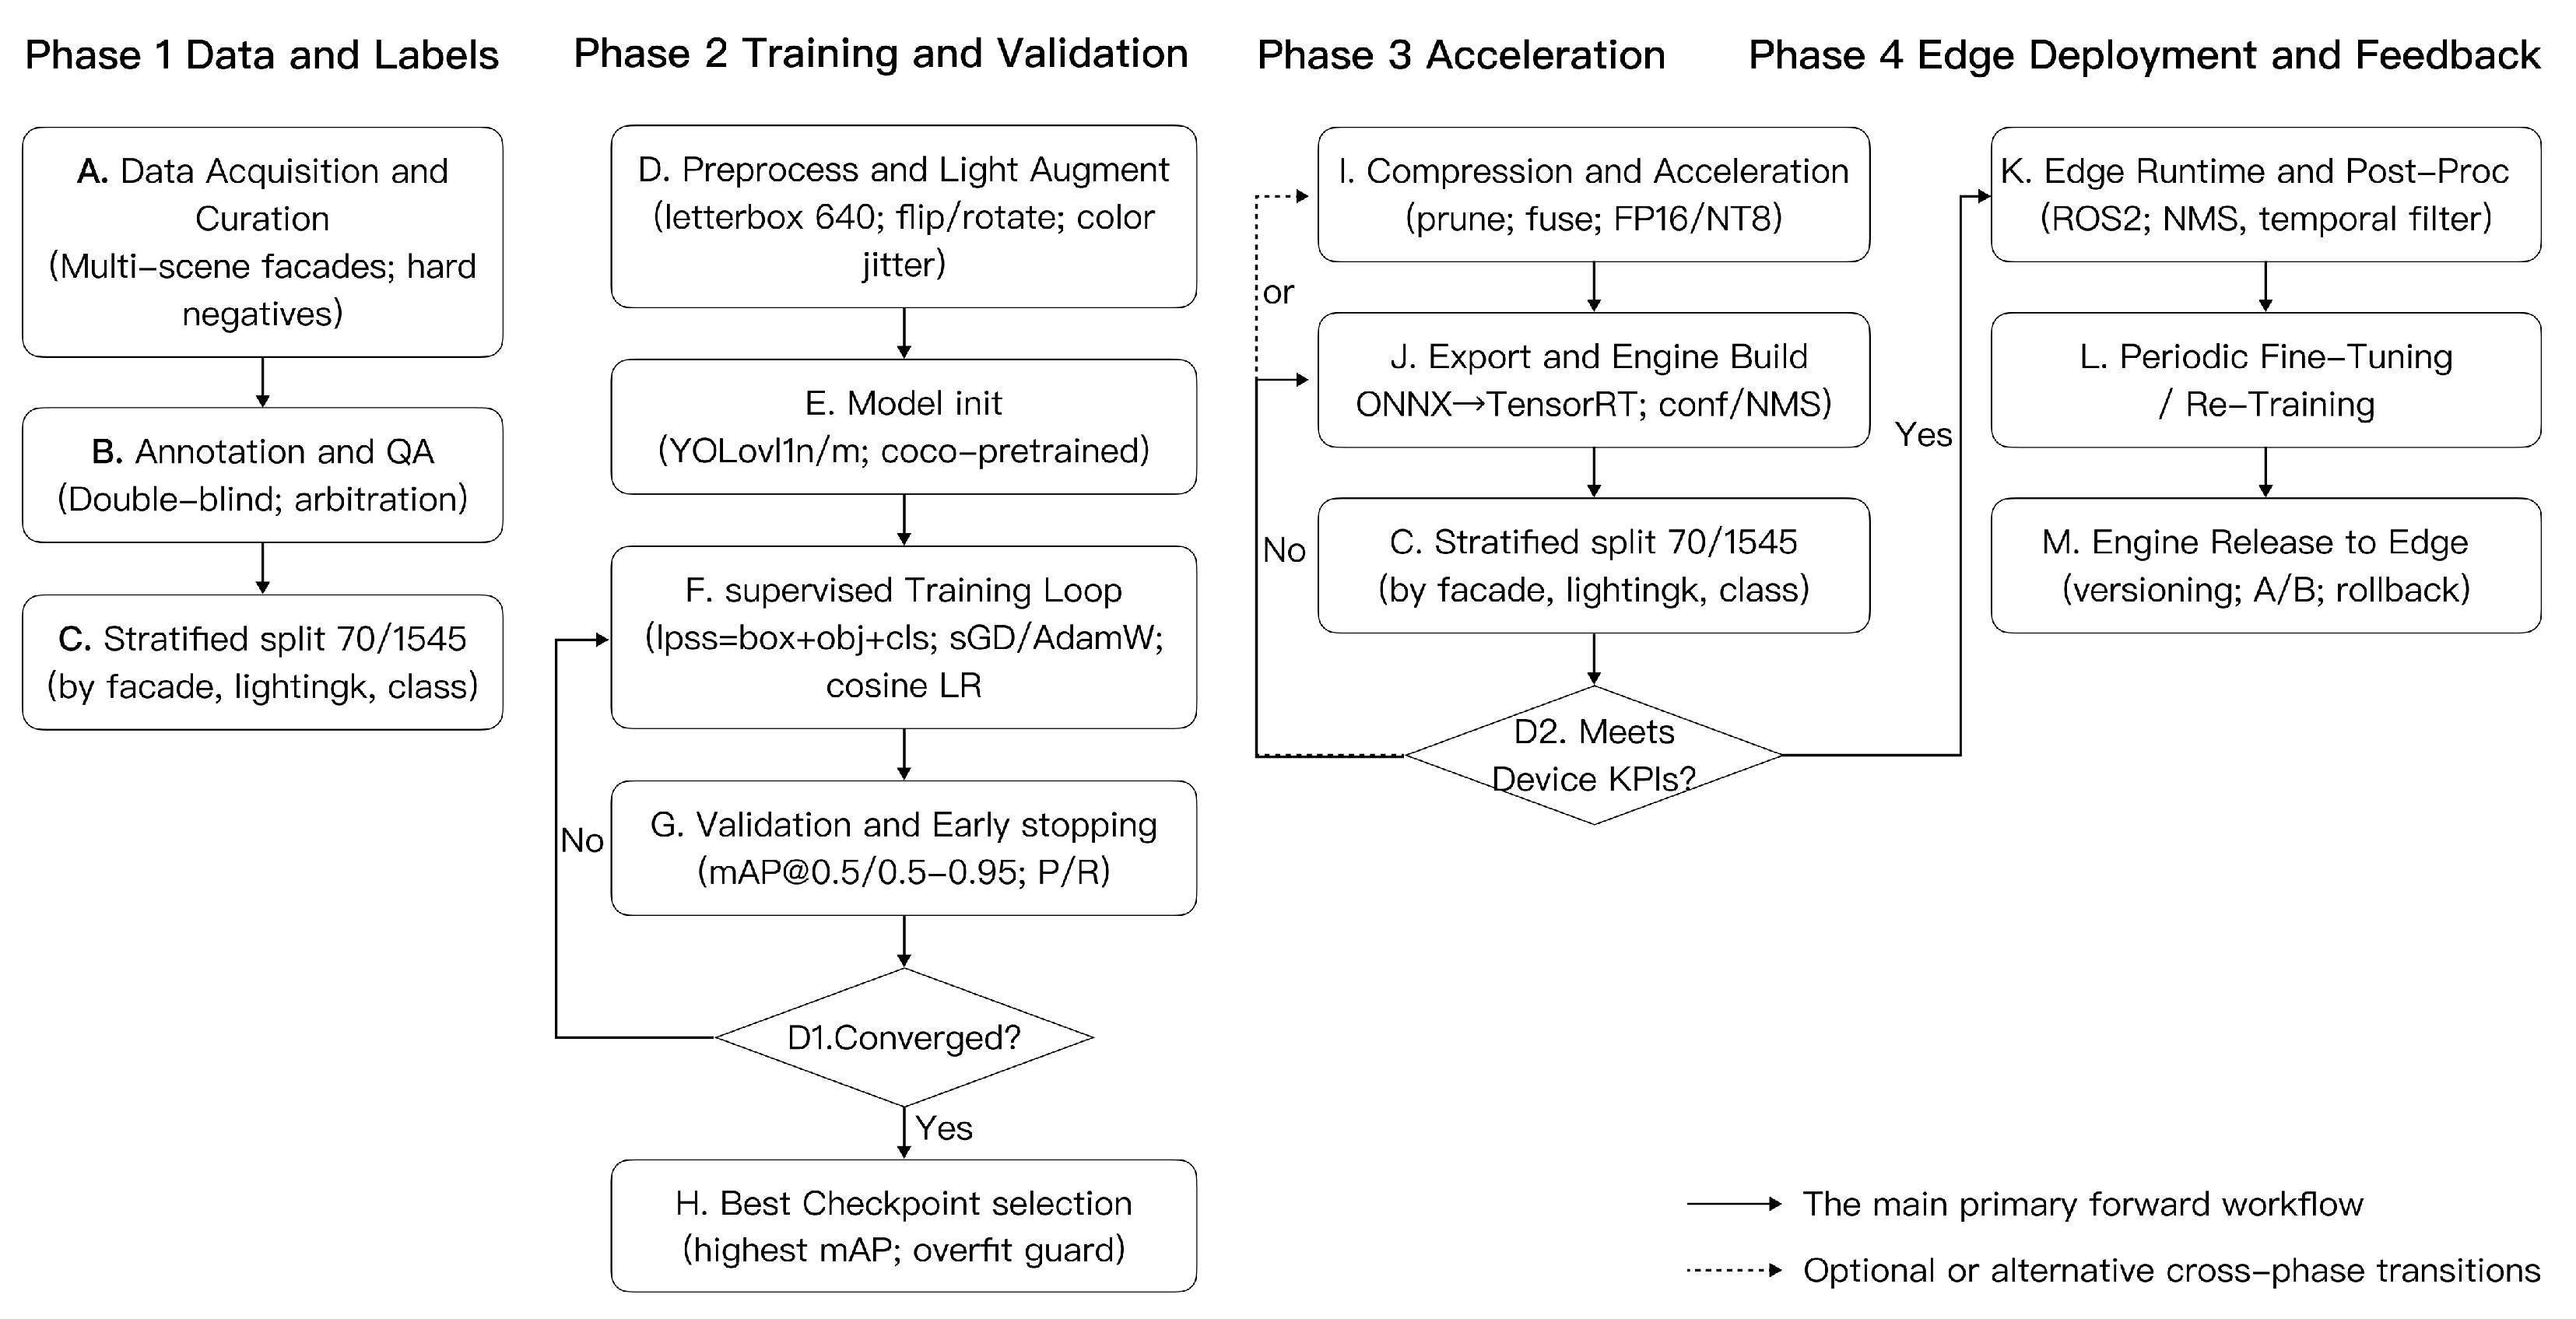
The perception stack follows a four-phase pipeline (Figure 14) designed to meet near-facade latency and power/thermal constraints.
  • Data and labels. Curate multi-scene facade imagery with hard negatives; use double-blind annotation + adjudication; apply stratified splits (by facade type, lighting, and class balance) to prevent leakage.
  • Training and validation. Initialize YOLOv11-lite weights; run supervised loops with early stopping and stratified K-fold checks; monitor mAP@50/50:95, precision/recall, and latency as co-primary criteria.
  • Acceleration. Export ONNX → TensorRT; apply structured pruning and INT8 calibration to meet edge latency on the onboard SoC; verify accuracy drop < 1 pp mAP@50.
  • Edge deployment and feedback. Integrate ROS 2 post-processing (NMS, temporal filters); log telemetry/images/QC to the backend for periodic fine-tuning (Step 8 of the operational loop).

4.5. Design Evaluation

4.5.1. Baseline Systems and Selection Rationale

For a fair, scenario-relevant comparison, the proposed intelligent VG-UAV system (denoted S1) is evaluated against two contrasting benchmark solutions representing current VG maintenance approaches:
S2—Rope-Driven Facade Robot: A cable-suspended maintenance robot designed for large vertical facades. This system can traverse wide areas and supports tasks, such as individual plant module installation, trimming/removal, and zonal irrigation/fertilization, aided by a suite of onboard sensors for condition assessment [26].
S3—Pentapod Climbing Robot: A wall-adherent, contact-based robot that attaches directly to facade surfaces. It demonstrates a high degree of autonomous mobility and can perform in situ plant care (e.g., localized watering) through integrated mechanisms [27].
These two baselines were selected to cover the spectrum of non-contact versus contact-based VG maintenance strategies. S2 exemplifies a large-span, non-contact approach (hanging platform), emphasizing coverage and stability, whereas S3 represents a direct-contact climbing approach, maximizing attachment safety. Together, they provide a balanced reference for evaluating S1’s near-facade agility, multi-task integration, and safety in comparison to established alternatives.

4.5.2. Evaluation Criteria and Scoring Methodology

The evaluation objective is to rigorously assess how well each scheme (S1, S2, S3) fulfills the critical design requirements identified in the D-A-F-T process. We adopted a multi-criteria framework aligned with the five requirement clusters derived earlier (Section 4.1.3). The evaluation dimensions are Functionality (B1), Performance (B2), User Experience (B3), Safety (B4), and Intelligence (B5), each corresponding to a cluster of related criteria (C1–C19):
  • Functionality encompasses the core operational capabilities of the system (e.g., obstacle avoidance, precision spraying, plant replacement, data transmission, environmental monitoring).
  • Performance covers quantitative operational metrics (e.g., flight stability, endurance time, payload capacity, adaptability to facade geometry).
  • User Experience addresses ergonomic and aesthetic factors (e.g., human-factor sizing, visual integration with the environment, user interface usability, overall form appeal).
  • Safety includes operational, material, environmental, and structural safety aspects (e.g., fail-safe operation, material reliability, minimal environmental impact, structural integrity under stress).
  • Intelligence evaluates autonomous and smart maintenance capabilities (e.g., onboard autonomous decision-making and predictive maintenance functions).
These weights ensure that the evaluation scoring aligns with the previously identified priority of requirements in the D-A-F-T framework.
Scoring Methodology: We conducted a structured expert assessment to score each design scheme against the full set of criteria (C1–C19). A panel of domain experts independently rated each scheme on each criterion using a five-point Likert scale (1 = very poor, 5 = excellent performance). The scoring and aggregation procedure was as follows:
  • Criterion-Level Scoring: For each criterion Ci, collect the scores assigned to each scheme by the experts and compute the average score. This yields an average performance score for S1, S2, and S3 on each individual indicator C1–C19.
  • Dimension Aggregation: For each scheme, aggregate its criterion scores into the five B-level dimension scores. This is performed by computing a weighted average of the C-level scores within each cluster B1–B5, using the ANP-derived weight of each criterion as the weighting factor. In other words, a scheme’s score on a given dimension (e.g., B1 Functionality) is the sum of its scores on the associated criteria (C1–C5 for Functionality), each multiplied by that criterion’s priority weight (from the ANP limit supermatrix). This produces a weighted mean score for each dimension per scheme.
  • Composite Score Calculation: Compute an overall composite score for each scheme by taking a weighted sum of its five dimension scores, using the relative importance weights of B1–B5 as coefficients. This mirrors the ANP cluster weights, thereby emphasizing dimensions in proportion to their importance. The resulting composite score is a single value (out of 5) that reflects the scheme’s overall performance with respect to all evaluated criteria.
This evaluation approach ensures both rigor and traceability: expert judgments quantify each design’s performance on specific requirements, and the ANP-derived weights objectively enforce the importance hierarchy obtained from the Stage D-A analysis. Next, we present the results of this multi-criteria evaluation.

4.5.3. Results and Comparative Analysis

Table 10 summarizes the dimension-level scores for each scheme (S1–S3) after weight aggregation. S1 (Proposed VG-UAV) is the UAV-based system developed in this work, S2 is the rope-driven facade robot baseline, and S3 is the pentapod climbing robot baseline.
Table 10 shows the dimension-wise evaluation scores (weighted means on a five-point scale) for each design scheme. Higher scores indicate better performance in that dimension. S1 = proposed UAV-based VG maintenance system; S2 = rope-driven facade robot; S3 = pentapod climbing robot.
Results Interpretation: As shown in Table 10, S1 (VG-UAV) achieves the highest overall composite score, indicating that the proposed UAV system performs most favorably when all criteria are considered with their respective importance weights. In particular, S1 excels in the Functionality (B1) and Performance (B2) dimensions, reflecting its strength in fulfilling core VG maintenance functions and operational performance under near-facade conditions. Key factors such as automatic obstacle avoidance, precision spraying, plant replacement capability, and hover stability (which were top-priority requirements in the DEMATEL-ANP analysis) are well-addressed by S1’s design, leading to its superior B1 and B2 scores. S1 also outperforms the baselines in Intelligence (B5), owing to its integration of autonomous decision-making and predictive maintenance features that support a closed-loop maintenance workflow. The high B5 score suggests that the intelligent functions of the UAV (e.g., onboard planning, health diagnostics) provide a notable advantage in proactive and adaptive maintenance compared to the more manually controlled baseline systems.
The rope-driven system S2 shows competitive performance in the Performance (B2) dimension, scoring nearly as high as S1. This is attributable to S2’s inherent advantages in endurance, payload capacity, and coverage of large facade areas via its tethered, stable platform. S2’s design, optimized for spanning wide sections of vertical greenery, offers robust operational performance (e.g., long operation times and the ability to carry substantial maintenance tools or materials), which is reflected in its strong B2 score. However, S2 trails S1 in Functionality and Intelligence, as its single-platform architecture is less versatile in multi-task integration and lacks the level of autonomy present in the UAV system. S2’s moderate scores in Functionality (B1) indicate that while it can perform several maintenance tasks (such as planting and irrigation), it cannot match the UAV’s flexibility and range of functions (for example, dynamic obstacle avoidance or rapid re-positioning for different tasks). Similarly, the lower Intelligence score for S2 underscores a reliance on human operators and pre-scripted control, whereas S1’s intelligent control and sensing allow more autonomous operation.
The climbing robot S3 distinguishes itself in the Safety (B4) dimension, achieving the highest safety score among the three schemes. This outcome is consistent with S3’s contact-based, firmly attached operation on building surfaces, which inherently reduces certain risks (such as fall hazards or collision with bystanders) and provides greater structural stability during maintenance actions. S3’s design (a pentapod with suction or gripping attachment) minimizes the chance of catastrophic falls and can brace against the facade, leading evaluators to rate its operational and structural safety very highly. On the other hand, S3’s scores in Functionality and Intelligence are the lowest of the three schemes. This indicates that the climbing robot, while safe, has a more limited functional repertoire (e.g., it may move slowly and handle only specific tasks like watering) and less onboard intelligence or adaptability. Its specialization in safe locomotion comes at the cost of reduced multi-functionality and automation, especially compared to the highly versatile and sensor-rich UAV. In User Experience (B3), all schemes scored in a similar range (around 4.0–4.3), with S1 having a slight edge. This suggests that factors like ease of use, human interaction, and aesthetic integration were reasonably addressed by all designs, and differences in this category were less pronounced (which aligns with B3’s lower weight in the ANP hierarchy).
At the same time, the comparative results highlight opportunities to further refine the UAV design by feeding insights back into. Notably, Safety (B4) was the one dimension where S1 did not decisively lead, as the climbing robot S3 achieved a slightly higher safety score. This suggests that certain safety advantages are inherent to contact-based systems (e.g., zero risk of falling debris or loss of control due to secure attachment). To bridge this gap, future iterations of the UAV system could incorporate additional safety enhancements—for example, advanced fail-safe protocols, backup attachment or tether mechanisms for emergency stabilization, or improved material safeguards—without compromising the UAV’s functional agility. By treating this finding as a new input, designers can re-enter the D-A-F-T cycle: updating requirement weights or adding design constraints (e.g., giving Structural Safety (C17) even greater emphasis), identifying any new function conflicts introduced by safety measures, and applying TRIZ principles to resolve them. In this way, the evaluation stage serves as the verification and feedback mechanism that closes the D-A-F-T framework, ensuring that the system design not only meets initial requirements but also continuously improves.
To convert expert judgments into auditable engineering bounds, we constructed an analytical envelope that links the prioritized indicators to closed-form or semi-empirical relations. Section 4.6 parameterizes the hexacopter baseline and substitutes the data into Equations (9)–(16) to produce compact, reproducible bounds, which are then interpreted against acceptance criteria and fed back to the D-A-F-T framework in Section 5.

4.6. Analytical Feasibility Envelope

We analyzed a heavy-class hexacopter (dual-battery, 54 in propellers; D = 1.375 m) using a formula–data–substitution procedure: Section 4.6.1 defines symbols/units and Equations (9)–(16), Section 4.6.2 lists baseline data (peer specifications, standard practice, standard atmosphere values), and Section 4.6.3 reports the numeric substitutions and results.
Scene alignment. We parameterized a heavy-class hexacopter baseline (dual batteries, 54 in) because its higher thrust/inertia margins, lower disk loading, and redundant power suit near-facade VG tasks. The envelope is largely mass–class-agnostic since the governing relations use non-dimensional or intensive variables (e.g., thrust-to-weight μ, disk loading DL, tilt angle θ). So, the results scale to lighter platforms by holding DL or μ approximately constant and matching key assumptions (e.g., propulsive efficiency, battery specific energy).

4.6.1. Equations and Definitions

We state the governing equations (Equations (9)–(16)) and define all symbols and units; then, we use the baseline data in Section 4.6.2 for substitutions. Hover is assumed (T ≈ W = mg) and SI units are used throughout; unless noted otherwise, angles variables (e.g., θ, Δ ϕ ) are in radians inside trigonometric functions; numerical results are reported in degrees.
The thrust margin is shown in Equation (9).
μ = T m a x m g 1
where T m a x is the sum of per-rotor static maximum thrust (N); m is the mass at the considered loading (kg); and g = 9.81   m s 2 . μ is dimensionless.
Hover power (induced-power approximation) is shown in Equation (10). At hover, we assume T m g .
P h o v T 3 / 2 2 ρ A t o t η p
where ρ is the air density ( k g m 3 ); A t o t = n π D / 2 2 is the total rotor disk area ( m 2 ); n is the number of rotors (dimensionless); D is the rotor diameter (m); and η p is propulsive efficiency (dimensionless). This is valid for hover/low-disk-loading conditions.
Endurance is shown in Equation (11).
t = 60 η b C b V n o m D o D P h o v + P p a y l o a d + P a u x
where C b (Ah), V nom (V). The numerator is battery energy in Wh; dividing by power in W yields hours, and multiplying by 60 gives minutes; P p a y l o a d , P a u x are payload/auxiliary power (W).
Crosswind tilt is shown in Equation (12).
F d = 1 2 ρ C d A r e f U 2   ,   θ arctan F d m g
where A r e f is the frontal reference area ( m 2 ), C d is the drag coefficient (dimensionless), and U is the near-wall freestream ( m s 1 ). For small angles, θ arctan F d / m g . For small angles, θ 0.12 rad ≈ 7°), θ F d / m g . (Here, θ is in radians.)
Grasp-induced disturbance is shown in Equation (13).
τ r e q m p g Δ x   ,   Δ ϕ τ r e q K ϕ
where m p is the grasped mass (kg), Δ x is the lever arm (m), and K ϕ is the roll stiffness about CoG ( N m r a d 1 ).
Spray uniformity and drift upper bound are shown in Equation (14). We used a Stokes-based terminal-velocity approximation for v t ; the empirical factor α absorbs non-Stokes and near-wall effects (upper-bound interpretation). The uniformity criterion C V 35 % is defined in Table 11.
C V = σ d d ¯ , v t ( ρ l ρ a ) g d 2 18 μ a , ϕ 1 e x p ( α U h v t cos θ )
where d is the droplet diameter (m), σ d is the standard deviation (m), v t is the terminal settling speed ( m s 1 ), μ a is the air dynamic viscosity ( P a s ), h is the nozzle-to-vegetation height (m), and α is an empirical factor with units m 1 capturing non-Stokes and near-wall effects. The CV threshold and φ acceptance bands are given in Table 11.
Perception-to-actuation latency (on-board) is shown in Equation (15).
L t o t = L s e n s e + L i n f e r + L p l a n + L a c t
where each term is in seconds. Note: L t o t (onboard loop) is distinct from the supervision-platform link latency L r e g (Table 11).
The near-wall sensing requirement is shown in Equation (16).
d s e n s e d s a f e + v m a x L t o t + v m a x 2 2 a m a x + Δ n o i s e
where d s a f e is the obstacle-inflated safety distance (m), v m a x is the capped speed ( m s 1 ), a m a x is the braking deceleration ( m s 2 ), and Δ n o i s e is the range noise/bias budget (m).

4.6.2. Parameterization and Data Sources

Target configuration: a hexacopter with dual batteries (DB2000 × 2) and six 54″ main rotors; peer-class benchmarks are the DJI Fly Cart 30 (DJI—SZ DJI Technology Co., Ltd., Shenzhen, China; cargo) and DJI Agras T100/T50 (DJI—SZ DJI Technology Co., Ltd., Shenzhen, China; agro-spraying); air properties follow the International Standard Atmosphere (ISO 2533:1975) [32].

4.6.3. Numerical Substitutions and Compact Results

Unless otherwise stated, the baseline is hexacopter (n = 6), dual DB2000 batteries (54 in × 6 rotors), ISA sea level; and η p = 0.65, η b = 0.92, DoD = 0.85, and P a u x = 60 W. The symbols and units follow SI.
  • Thrust margin (Equation (9)). Using Equation (10) with per-rotor power P m a x = 4.00   k W and per-rotor disk area A = π D / 2 2 (see Table 12), we obtain T m a x 290.80   N per rotor and hence, T m a x 1.75 kN; thus, μ 95 k g = 0.87 and μ 65 k g = 1.74 .
  • Hover power and endurance (Equations (10) and (11)).
    P h o v ( 65   k g ) 5.30 kW; P h o v ( 95   k g ) 9.37 kW.
    Usable energy E u s e = 3.10 kWh. We use the minutes form t m i n = 60 η b C b V n o m D o D / ( P h o v + P p a y l o a d + P a u x ) .
    Results: empty hover 34.7 min; spraying (+250 W) 33.2 min; MTOW hover 19.8 min.
  • Crosswind tilt (Equation (12)) ( C d = 1.20 , A r e f = 1.00   m 2 ).
    U = 5.00   m s 1 : θ 1.60 ° 65   k g / 1.10 ° 95   k g .
    U = 10.00   m s 1 : θ = 6.60 ° 65   k g / 4.50 ° 95   k g .
    For these speeds the small-angle condition holds ( θ 7 ° ), so θ F d / ( m g ) is a good approximation.
  • Grasp disturbance (Equation (13)) ( m p = 0.5149 kg, x = 0.02 m, K ϕ = 2.86   N m r a d 1 ).
    τ r e q 0.10   N m , ϕ 2.00 ° .
    Drift upper bound and uniformity (Equation (14)) (h = 2.00 m, α = 0.03   m 1 ).
    d = 150   μ m : ϕ 0.35 at U = 5.00   m s 1 ; ϕ 0.59 at U = 10   m s 1 .
    d = 300   μ m : ϕ 0.10 at U = 5.00   m s 1 ; ϕ 0.20 at U = 10   m s 1 .
  • Uniformity criterion for effective swath: CV ≤ 35%.
  • Near-wall safety (Equation (16)) ( L t o t = 40 + 15 + 80 + 20 = 155   m s ; v m a x = 3.00   m s 1 ; a m a x = 3.00   m s 2 ; d s a f e = 3.50   m ; n o i s e = 0.30   m ).
    Reaction distance v m a x L t o t = 0.465   m ; braking distance v m a x 2 / 2 a m a x = 1.50   m .
    Required stable sensing: d s e n s e , r e q = d s a f e + v m a x L t o t + v m a x 2 / 2 a m a x + n o i s e 5.77 m.

4.6.4. Conclusions

Propulsive adequacy. At MTOW = 95 kg, the thrust margin is μ 0.87 (target μ 0.80 satisfied); the empty-mass margin is μ 1.74 .
Energy match. The analytical endurance is 34.7 min (empty) and 19.8 min (MTOW); adding spraying load (+250 W) and auxiliaries gives 33.2 min—a minutes-scale penalty consistent with peer platforms.
Wind robustness. For 5–10 m/s, the tilt remains within θ 1.60 6.60 ° (65 kg) and 1.10 4.50 ° (95 kg), meeting the ≤5–8° acceptance band; MTOW is more stable.
Grasp controllability. A 0.515 kg object with x 0.02 m induces τ r e q 0.10   N m and ϕ 2 ° , well within attitude-loop authority (and the ϕ 3 ° band).
Spray settings. Under 10 m/s winds, small droplets (150 µm) drift excessively ( ϕ 0.59 ); using d 300   µ m and h ≤ 1.5–2.0 m height constrains ϕ ≈ 0.1–0.2, while CV ≤ 35% defines the effective swath per GB/T 43071-2023.
Near-wall safety margin. With L t o t 155   m s and v m a x = 3   m s 1 , the required stable sensing is d s e n s e , r e q 5.77 m, comfortably within the stable ranges of peer sensing suites.
These substitutions bound a feasible envelope for near-facade operations. Section 5 compares these bounds with the acceptance table (Table 11) and maps any shortfalls to TRIZ actions, closing the D-A-F-T framework.

5. Discussion

5.1. Interpretation of the Main Findings

This study set out to establish an operational chain from user requirements to structural concepts for a VG-maintenance UAV.
(i) Causal structure of demand. DEMATEL places C6 (Flight Stability), C8 (Payload Capacity), C1 (Obstacle Avoidance), and C3 (Plant Replacement) in the high-drive/high-centrality quadrant (Figure 4). C18 (Autonomous Decision-Making), C4 (Data Transmission), and C17 (Structural Safety) serve as secondary drivers, while most experiential and environmental items behave as result factors. This aligns with near-facade operations where controllability and close-range navigation precede downstream user experience.
(ii) Dimension-wise quantitative interpretation of Section 4.5. S1 leads in Functionality (B1: 4.53 vs. S2 3.98, S3 4.08; Δ = +0.55/+0.45) and Performance (B2: 4.49 vs. S2 4.40, S3 4.10; Δ = +0.09/+0.39) and shows a margin in Intelligence (B5: 4.46 vs. S2 4.14, S3 4.04; Δ = +0.32/+0.42). User Experience is close (B3: S1 4.31, S2 4.04, S3 4.11). Safety is the only dimension where S1 does not lead (B4: S1 4.49, S2 4.49, S3 4.59), reflecting contact-style advantages under facade constraints. These gaps motivate concrete hooks—fail-safe protocols, emergency tether/backup attachment, and material safeguards—to capture S3’s safety benefits without sacrificing S1’s agility and autonomy.
(iii) ANP corroboration and dual-threshold selection. ANP global weights corroborate the causal view: Function (B1) and Performance (B2) dominate, with C1 and C6 ranked highest, followed by C2 (Precision Spraying), C17, C18, and C3. The agreement supports a dual-threshold rule—driver positivity plus centrality (DEMATEL), then global weight (ANP)—to derive an actionable Top-6 (C1, C6, C2, C17, C18, C3) for design resource allocation.
(iv) From conflicts to implementable concepts. Starting from the Top-6, FAST exposes two recurrent conflicts: FC1 (dynamic load disturbance vs. attitude stability) and FC2 (rigid manipulation vs. foliage compliance). TRIZ maps them to implementable solutions: a sliding-rail counterweight for real-time mass-center compensation (mitigating FC1) and a bio-inspired compliant gripper with multi-modal sensing (mitigating FC2). Expert review of Rhino–KeyShot models indicates improvements in manufacturability and task adaptability; these verification signals feed back to DEMATEL-ANP/FAST, consistent with the intended D-A-F-T loop.
Taken together, weighted requirements, functional paths, conflict structuring, and concept generation form a reproducible, data-informed workflow for VG-UAV design. The FAST tree emphasizes Top-6 “How” paths that drive B1/B2; the Rhino–KeyShot concept operationalizes these paths into modules; and TRIZ turns conflicts into implementable safety/manipulation solutions. This also explains why S1 excels in B1/B2/B5 while leaving headroom in B4 for contact-style safeguards.

5.2. Practical Implications for VG and UAV Practitioners

System architects and OEMs. Prioritize platform controllability: allocate mass and control authority for C6/C1 before form/finish; pair high-update-rate attitude control with multi-sensor fusion (LiDAR/vision/ultrasonic) and near-field path planning targeted at facade proximity. Design for payload and task modularity (C8/C3/C2): reserve structural interfaces (power, comms, quick-release) for end-effectors (sprayer, gripper), and validate mass-center envelopes with the counterweight subsystem. Engineer structural safety as a constraint hub (C17): use lightweight, high-stiffness frames with impact/vibration margins derived from task envelopes; plan redundancy for safe-state transitions under sensor or actuator faults.
Operators and maintenance contractors. Adopt requirement-linked KPIs: track RMS attitude error, obstacle-avoidance success, per-plant replacement cycle time, and impact margin; tie maintenance intervals to predictive models (C19) using flight logs and actuator health. Plan missions with near-facade profiles: pre-map facade zones and revisit paths; stage payload swaps and counterweight re-trim at scheduled waypoints to stabilize dynamics during manipulation.
Asset owners and municipalities. Procurement by weighted priorities: use the Top-6 as a checklist in tenders—mandatory for C1/C6/C2, evaluative for C17/C18/C3—and request evidence of TRIZ-guided mitigation (e.g., compliant grippers, mass-center management). Address privacy and noise via on-device filtering, audit trails for data transmission (C4), and task-time windows aligned with urban comfort.
Regulators and standard bodies. Align risk-based certification with prioritized demands—close-range navigation trials, dynamic-load disturbance tolerance, and safe-state behavior under partial failures—to reflect VG scenarios rather than generic open-field benchmarks.

5.3. Methodological Implications and Impacts on the D-A-F-T Framework

Operational feedback to close the D-A-F-T loop. We operationalize D-A-F-T in three steps:
(i) Triggering: use the dimension gaps in Table 10 as triggers, e.g., if S1’s B4 trails the best baseline by ≥0.1, promote C17 (structural safety) and fail-safe operation.
(ii) Model write-back: (a) in DEMATEL, increase the outgoing influence of C17 toward tasks mitigating B4 risks (restricted landing, emergency tether, backup attachment); (b) in ANP, raise the pairwise importance of C17 against C1/C2 by one Saaty scale step and re-solve the limit supermatrix; and (c) in FAST, add an Assure or Constraint branch “emergency tether + backup attachment,” and re-localize conflicts.
(iii) Envelope check: re-evaluate Equations (9)–(16) under added mass/drag and compute deltas against Table 11 acceptance bands (θ, CV, L t o t , μ). If any KPI violates its band (e.g., θ > 8°, CV > 35%, L t o t 0.2   s ), iterate TRIZ actions (e.g., weight re-distribution/drag reduction) until all KPIs return to the band.
Two choices merit emphasis. First, the dual-threshold selection operationalizes network structure (driver/centrality) with global weights, yielding a small, defensible set of core requirements. Second, the scaffold—reweight (DEMATEL-ANP) → expand functions (FAST) → resolve conflicts (TRIZ) → visualize/review → write-back, enabling continuous refinement as usage data accumulate.

5.4. Limitations, Risks, and Scalability

Method-level limitations. Expert-scored DEMATEL/ANP introduces subjectivity and sample-size sensitivity; TRIZ principle selection may vary across analysts; and evidence transferability from proxies (near-facade tasks) to VG-UAV remains partially inferential. Mitigations include Delphi stability checks, ANP consistency ratios with bootstrap perturbation, cross-reviewed TRIZ mapping with inter-rater agreement, and pre-registered KPI bands (Table 11) to constrain design degrees of freedom before iteration.
Technical limitations. Endurance and payload margins (S7/C8) remain constrained under near-facade wind fields and frequent accelerations during manipulation. Occlusion, specular facades, and illumination changes can degrade sensing, increase perceive–plan–act latency, and propagate to C1/C6 stability. These factors cap duty cycle per sortie and call for conservative mass budgets for end-effectors and perception modules.
Regulatory and safety issues. Urban facade missions trigger stricter airspace and proximity constraints, plus privacy/noise concerns. Beyond airworthiness, risk-based acceptance should reflect representative VG scenarios (tight corridors, pedestrians, windows), with fail-safe behaviors, functional redundancies, and auditable logs.
Cost and resource requirements. Relative to rope/climbing baselines, the UAV route entails higher CAPEX/OPEX. Economic viability hinges on utilization, battery cycle life, and turnaround efficiency. A practical ROI can be framed as ROI = (manual-labor savings − OPEX − amortized CAPEX)/amortized CAPEX, benchmarked against site complexity and service-level agreements.
Data management and processing. Telemetry, mission logs, and facade maps underpin traceability and continuous improvement (C4/C19) but add governance burdens. Data minimization, retention windows, role-based access, and encryption at rest/in transit are necessary. Edge–cloud partitioning should prioritize on-board, low-latency autonomy, with only summarized/anonymized records uploaded for fleet analytics.
Scalability and generalizability. Scaling from pilots to fleets requires scheduling, battery logistics, and health monitoring at fleet level, plus standardized mission profiles across heterogeneous facades. Transferability to inspection/light trimming/cleaning is promising but needs evidence on performance drift and retraining costs.

6. Conclusions

6.1. Summary of Findings and Contributions

This work demonstrates a closed-loop D-A-F-T framework connecting DEMATEL-ANP (weighted requirements), FAST (functional paths), and TRIZ (conflict-to-solution) to move from user needs to structural design for VG-maintenance UAVs.
Empirical findings. DEMATEL reveals a driver-result structure: high-drive/high-centrality factors are C6, C8, C1, and C3; C18, C4, and C17 are secondary drivers. ANP global weights independently affirm the dominance of Function (B1) and Performance (B2) and rank C1/C6 at the top. Using the dual-threshold rule (driver positivity + centrality, followed by ANP ranking), we derive a focused Top-6—C1, C6, C2, C17, C18, and C3.
Design contributions. Guided by the Top-6, FAST exposes two recurrent conflicts—dynamic load vs. attitude stability; rigid grasping vs. foliage compliance—addressed by a sliding-rail counterweight and a bionic compliant gripper with multi-modal sensing. Prototype visualization and expert appraisal indicate improved controllability, task performance, and structural robustness.
Methodological contributions. The process supports iterative reweighting and design refinement with verification feedback. Concretely, we close the loop by (i) using Table 10 gaps as triggers, (ii) writing back to DEMATEL/ANP/FAST with targeted safety constraints, and (iii) re-checking envelope KPIs (Equations (9)–(16) vs. Table 11)—turning discussion results into actionable updates.

6.2. Future Work

Future work will be concise and targeted:
(1) Targeted controlled field trials. Run instrumented trials across representative facade typologies and weather windows to quantify requirement-linked KPIs under near-facade conditions. Candidate configurations will advance only after passing a pre-deployment gate defined by the analytical envelope (Equations (9)–(16); Table 11); returned logs will be used to recalibrate the envelope and refine KPI bands.
(2) Simulation-to-field pipeline. Develop a rehearsal pipeline that identifies and updates envelope parameters, predicts KPI bands, and performs go/no-go checks before sorties. Post-mission reconciliation will feed data-driven reweighting in DEMATEL/ANP and update FAST/TRIZ hooks with minimal edits.
(3) Transferability with minimal edits. Assess adaptation to adjacent near-facade missions (inspection, light cleaning) under the same envelope-gated regimen, measuring performance drift and the cost of network edits needed to maintain KPI bands.
These steps improve external validity and risk discipline while preserving the practical, closed-loop character of the proposed framework.

Supplementary Materials

The following supporting information can be downloaded at: https://www.mdpi.com/article/10.3390/app152010887/s1, Table S1: Delphi Round-1 (R1) indicator survey—item wording and statistics (median, IQR/agreement), with keep/merge/migrate notes; Table S2: Delphi Round-2 (R2) indicator survey—item wording and statistics; finalized 19-item set; Table S3: DEMATEL questionnaire and matrices; Table S4: ANP pairwise-comparison results—cluster (B1–B5) judgment matrices with CR, inter-cluster matrix W, local/global weights of C1–C19.

Author Contributions

Conceptualization, F.Y. and B.Z.; methodology, F.Y. and B.Z.; investigation, B.Z. and X.Z.; writing—original draft, F.Y. and B.Z.; writing—review and editing, B.Z. and X.Z. All authors have read and agreed to the published version of the manuscript.

Funding

This research received no external funding.

Institutional Review Board Statement

Ethical review and approval were waived for this study because it involved an anonymous, minimal-risk expert survey with no personally identifiable information collected, in accordance with the authors’ institutional policy.

Informed Consent Statement

Informed consent was obtained from all subjects involved in this study.

Data Availability Statement

The original contributions presented in this study are included in this article, further inquiries can be directed to the corresponding author.

Conflicts of Interest

The authors declare no conflicts of interest.

Abbreviations

The following abbreviations are used in this manuscript:
D-A-F-TDEMATEL-ANP-FAST-TRIZ
VGVertical Greening
UHIUrban Heat Island
UAVUnmanned Aerial Vehicle
ANPAnalytic Network Process
DEMATELDecision-Making Trial and Evaluation Laboratory
FASTFunctional Analysis System Technique
TRIZTheory of Inventive Problem Solving

Appendix A. VG-UAV User Requirement Indicator Survey (Round-1)

Appendix A.1. Purpose and Scope

This questionnaire is used in the Delphi Round-1 (R1) to evaluate the importance and category validity of user requirement indicators for the vertical-greening maintenance UAV (VG-UAV). Results serve as inputs to the DEMATEL-ANP modeling in the main text. The survey is anonymous and for academic use only. The Round-1 items and response fields are summarized in Table A1.

Appendix A.2. Respondent Profile (to Be Completed by Experts)

Role: ☐ Equipment/System Designer ☐ Researcher ☐ Other: ______
Years of experience: ☐ <1 ☐ 1–3 ☐ 3–5 ☐ >5
Prior participation in UAV design/operations (times): ☐ 0–5 ☐ 6–20 ☐ 21–50 ☐ >50
Primary application scenarios: ☐ Building facades ☐ Transport facilities ☐ Parks/green belts ☐ Rooftops/balconies ☐ Other: ______

Appendix A.3. Rating Instructions

Importance is rated on a 5-point Likert scale: 5 = Very important, 4 = Important, 3 = Neutral, 2 = Unimportant, 1 = Very unimportant.
Category validity asks whether the current dimension assignment of the indicator is reasonable (Yes/No). If “No”, please propose a suggested dimension in Remarks.
R1 rule: only the 22 items below are scored in R1. New items (if any) should be proposed in the open-ended question at the end; they will be defined and scored in R2.

Appendix A.4. Indicator Set and Item Wording (R1)

Table A1. VG-UAV user requirement indicators (R1): item statements, dimensions, and response fields.
DimensionIndicatorOperational Description (Item Wording)Importance (1–5)Category Reasonable? (Y/N)Remarks
FunctionavoidanceIn complex facade environments, detect and avoid obstacles via multi-sensor fusion and online path planning.☐1 ☐2 ☐3 ☐4 ☐5☐Y ☐N
Precision sprayingDeliver water/fertilizer/chemicals at fixed points and doses according to plant water/nutrient needs and micro-plot variation.☐1 ☐2 ☐3 ☐4 ☐5☐Y ☐N
Data transmissionUpload operation and environmental parameters to a remote platform in real time to support telemetry and supervision.☐1 ☐2 ☐3 ☐4 ☐5☐Y ☐N
Environmental monitoringSense micro-environmental factors (temperature, humidity, illumination, etc.) in real time to support decisions.☐1 ☐2 ☐3 ☐4 ☐5☐Y ☐N
Facade 3D path planningBuild/update facade point clouds (SLAM) and align with BIM/GIS to anchor ROIs and revisit paths.☐1 ☐2 ☐3 ☐4 ☐5☐Y ☐N
PerformanceFlight stabilityMaintain stable hover and controllable flight under gusts and boundary-layer effects.☐1 ☐2 ☐3 ☐4 ☐5☐Y ☐N
Endurance timeSustainable operation time per charge or energy-swap cycle.☐1 ☐2 ☐3 ☐4 ☐5☐Y ☐N
Payload capacitySafe carrying limit for task payloads (e.g., nozzle, gripper, tank).☐1 ☐2 ☐3 ☐4 ☐5☐Y ☐N
Deployment and turnaround efficiencyTime/steps from arrival to takeoff and from battery swap to relaunch minimized.☐1 ☐2 ☐3 ☐4 ☐5☐Y ☐N
Energy efficiencyEnergy consumption per unit of task output.☐1 ☐2 ☐3 ☐4 ☐5☐Y ☐N
User experienceHuman-factor size/handlingVolume/weight/grip suitable for one-person or small-team carry and deployment.☐1 ☐2 ☐3 ☐4 ☐5☐Y ☐N
Color harmonizationBody colorway harmonizes with urban visual context and minimizes visual intrusion.☐1 ☐2 ☐3 ☐4 ☐5☐Y ☐N
Aesthetic formExterior aligns with contemporary industrial design aesthetics and conveys professional quality.☐1 ☐2 ☐3 ☐4 ☐5☐Y ☐N
Noise and acoustic comfortOverall noise level/spectrum and its impact on the public and operators.☐1 ☐2 ☐3 ☐4 ☐5☐Y ☐N
SafetyOperational safetyPrevention of personnel/environmental risks in high-altitude operations and fail-safe protection.☐1 ☐2 ☐3 ☐4 ☐5☐Y ☐N
Material safety Materials are eco-friendly and non-toxic; comply with industrial safety and sustainability norms.☐1 ☐2 ☐3 ☐4 ☐5☐Y ☐N
Environmental safetyAvoid pollution or secondary harm during operations (e.g., control of spray drift/runoff).☐1 ☐2 ☐3 ☐4 ☐5☐Y ☐N
Structural safetyResistance to impact/vibration/fatigue to maintain mechanical integrity.☐1 ☐2 ☐3 ☐4 ☐5☐Y ☐N
Data security and privacy complianceEncryption, access control, and audit trails in line with applicable regulations.☐1 ☐2 ☐3 ☐4 ☐5☐Y ☐N
IntelligenceAutonomous decision-makingPerception-driven autonomous path planning, task allocation, and real-time re-planning.☐1 ☐2 ☐3 ☐4 ☐5☐Y ☐N
Maintainability and modularityStandard interfaces, tool-less quick-release, and accessibility to minimize downtime.☐1 ☐2 ☐3 ☐4 ☐5☐Y ☐N
Self-diagnosis and fault toleranceHealth monitoring, redundancy, and graceful degradation to sustain mission continuity.☐1 ☐2 ☐3 ☐4 ☐5☐Y ☐N
Notes to Table A1: “Category reasonable?” evaluates whether the item is placed under the appropriate dimension. If “No”, please specify a suggested dimension in “Remarks”. R1 scores only these 22 items. Newly proposed items are collected below and will be standardized and scored in R2.

Appendix A.5. Open-Ended Question (R1—Proposal Only, Not Scored)

Please list any additional “must-have” indicators and suggested definitions grounded in real scenarios:

Appendix B. VG-UAV User Requirement Indicator Survey (Round-2)

Appendix B.1. Purpose and Scope

This questionnaire is used in Delphi Round-2 (R2) to reassess the importance and category validity of the VG-UAV user requirement indicators after Round-1 feedback and item revisions. R2 incorporates four newly added items proposed in R1 (plant replacement, facade adaptability, user interface, predictive maintenance) and applies item merging/migration/deletion, converging to a 19-item list. The survey is anonymous and for academic use only; results feed into the DEMATEL-ANP modeling in the main text. The consolidated Round-2 items and response fields are summarized in Table A2.

Appendix B.2. Respondent Profile (to Be Completed by Experts)

Role: ☐ Equipment/System Designer ☐ Researcher ☐ Other: ______
Years of experience: ☐ <1 ☐ 1–3 ☐ 3–5 ☐ >5
Prior participation in UAV design/operations (times): ☐ 0–5 ☐ 6–20 ☐ 21–50 ☐ >50
Primary application scenarios: ☐ Building facades ☐ Transport facilities ☐ Parks/green belts ☐ Rooftops/balconies ☐ Other: ______

Appendix B.3. Rating Instructions

Importance: 5-point Likert scale (5 = Very important, 4 = Important, 3 = Neutral, 2 = Unimportant, 1 = Very unimportant).
For each item, select one importance score and mark Category reasonable? (Yes/No). If “No”, suggest a target dimension in Remarks.
R2 uses the unified item definitions and thresholds informed by R1 statistics and controlled feedback.

Appendix B.4. Consolidated Indicator List and Item Wording (R2)

Table A2. VG-UAV user requirement indicators (R2): item statements, dimensions, and response fields (final 19 items).
DimensionIndicatorOperational Description (Item Wording)Importance (1–5)Category Reasonable? (Y/N)Remarks
FunctionAutonomous obstacle avoidanceDetect and avoid obstacles in complex facade environments via multi-sensor fusion and online path planning.☐1 ☐2 ☐3 ☐4 ☐5☐Y ☐N
Precision sprayingPoint/dose-accurate water/fertilizer/chemical delivery per plant needs and micro-plot variation.☐1 ☐2 ☐3 ☐4 ☐5☐Y ☐N
Plant replacementIdentify, grasp, and replace modular plants through vision-end-effector coordination.☐1 ☐2 ☐3 ☐4 ☐5☐Y ☐N
Data transmissionReal-time upload of operation and environmental parameters to a remote platform (telemetry/supervision).☐1 ☐2 ☐3 ☐4 ☐5☐Y ☐N
Environmental monitoringReal-time sensing of micro-environment (temperature, humidity, illumination) to support decisions.☐1 ☐2 ☐3 ☐4 ☐5☐Y ☐N
PerformanceFlight stabilityMaintain stable hover and controllable flight under gusts and boundary-layer effects.☐1 ☐2 ☐3 ☐4 ☐5☐Y ☐N
Endurance timeSustainable operating time per charge or energy-swap cycle.☐1 ☐2 ☐3 ☐4 ☐5☐Y ☐N
Payload capacity Safe payload limit for mission modules (e.g., nozzle, gripper, liquid tank).☐1 ☐2 ☐3 ☐4 ☐5☐Y ☐N
Facade adaptabilityOperational adaptability to diverse facade structures/textures/heights (consolidates goals of facade 3D modeling and spatial registration).☐1 ☐2 ☐3 ☐4 ☐5☐Y ☐N
User experienceHuman-factor sizingVolume/weight/grip suitable for one-person or small-team carry and deployment.☐1 ☐2 ☐3 ☐4 ☐5☐Y ☐N
Color harmonizationBody colorway harmonizes with urban visual context to reduce visual intrusion.☐1 ☐2 ☐3 ☐4 ☐5☐Y ☐N
User interfaceClear logic, intuitive layout, and user-friendly interaction at the control terminal.☐1 ☐2 ☐3 ☐4 ☐5☐Y ☐N
Aesthetic formExterior aligns with contemporary industrial design and conveys professional quality.☐1 ☐2 ☐3 ☐4 ☐5☐Y ☐N
SafetyOperational safetyPrevention of personnel/environmental risks in high-altitude operations; fail-safe protection.☐1 ☐2 ☐3 ☐4 ☐5☐Y ☐N
Material safety Eco-friendly, non-toxic materials compliant with industrial safety and sustainability norms.☐1 ☐2 ☐3 ☐4 ☐5☐Y ☐N
Environmental safetyAvoid pollution or secondary harm during operations (e.g., control of spray drift/runoff).☐1 ☐2 ☐3 ☐4 ☐5☐Y ☐N
Structural safetyResistance to impact/vibration/fatigue; accommodates complex disturbances (partly absorbing reliability concerns of self-diagnosis/fault tolerance).☐1 ☐2 ☐3 ☐4 ☐5☐Y ☐N
IntelligenceAutonomous decision-makingPerception-driven path planning, task allocation, and real-time re-planning (partly absorbing algorithm robustness of self-diagnosis/fault tolerance).☐1 ☐2 ☐3 ☐4 ☐5☐Y ☐N
Predictive maintenanceState monitoring/log analytics and data modeling for early detection of equipment and plant anomalies (absorbing maintainability/modularity objectives).☐1 ☐2 ☐3 ☐4 ☐5☐Y ☐N

Appendix C. VG-UAV User Requirement Indicators—DEMATEL Questionnaire

Appendix C.1. Purpose and Notes

This appendix provides the matrix-style questionnaire used to elicit pairwise influence strengths among secondary indicators (C1–C19) for the DEMATEL analysis reported in the main text. The survey is anonymous and used solely for academic research.
Respondents: frontline practitioners (construction/maintenance/operators) of VG.
Scale: 0–4 (0 = no influence, 1 = weak, 2 = moderate, 3 = strong, 4 = very strong).
Rule: the main diagonal is fixed at 0. Please score the influence of the row item (cause) on the column item (effect).

Appendix C.2. Indicator Set and Operational Definitions

The indicators used for DEMATEL scoring and their operational definitions are summarized in Table A3.
Table A3. VG-UAV user requirement indicators for DEMATEL scoring.
Target (A)Criterion (B)Indicator (C, Code)Operational Description
VG-UAV design goalFunction (B1)Autonomous obstacle avoidance (C1)Detect and avoid obstacles in complex facade environments via multi-sensor fusion and online path planning.
Precision spraying (C2)Point/dose-accurate water/fertilizer/chemical delivery per plant needs and micro-plot variation.
Plant replacement (C3)Identify, grasp, and replace modular plants through vision-end-effector coordination.
Data transmission (C4)Real-time upload of operation and environmental parameters to a remote platform (telemetry/supervision).
Environmental monitoring (C5)Real-time sensing of micro-environment (temperature, humidity, illumination) to support decisions.
Performance (B2)Flight stability (C6)Maintain stable hover and controllable flight under gusts and boundary-layer effects.
Endurance time (C7)Sustainable operating time per charge or energy-swap cycle.
Payload capacity (C8) Safe payload limit for mission modules (e.g., nozzle, gripper, liquid tank).
Facade adaptability (C9)Operational adaptability to diverse facade structures/textures/heights (consolidates goals of facade 3D modeling and spatial registration).
User experience (B3)Human-factor sizing (C10)Volume/weight/grip suitable for one-person or small-team carry and deployment.
Color harmonization (C11)Body colorway harmonizes with urban visual context to reduce visual intrusion.
User interface (C12)Clear logic, intuitive layout, and user-friendly interaction at the control terminal.
Aesthetic form (C13)Exterior aligns with contemporary industrial design and conveys professional quality.
Safety (B4)Operational safety (C14)Prevention of personnel/environmental risks in high-altitude operations; fail-safe protection.
Material safety (C15) Eco-friendly, non-toxic materials compliant with industrial safety and sustainability norms.
Environmental safety (C16)Avoid pollution or secondary harm during operations (e.g., control of spray drift/runoff).
Structural safety (C17)Resistance to impact/vibration/fatigue; accommodates complex disturbances (partly absorbing reliability concerns of self-diagnosis/fault tolerance).
Intelligence (B5)Autonomous decision-making (C18)Perception-driven path planning, task allocation, and real-time re-planning (partly absorbing algorithm robustness of self-diagnosis/fault tolerance).
Predictive maintenance (C19)State monitoring/log analytics and data modeling for early detection of equipment and plant anomalies (absorbing maintainability/modularity objectives).

Appendix C.3. How to Score (Matrix Format)

Score each cell by judging how much the row indicator influences the column indicator. Higher numbers mean stronger influence. A simple 2 × 2 toy example of the scoring matrix is provided in Table A4.
Table A4. Example (toy 2 × 2).
C1C2
C103
C210
Interpretation: C1 has a strong influence on C2 (3); C2 has a weak influence on C1 (1). Diagonal entries are 0.

Appendix C.4. DEMATEL Rating Matrix (C1–C19)

Please fill in each cell with an integer 0–4 according to the scale above. Leave the diagonal as 0.
The blank 19 × 19 pairwise influence matrix to be filled is provided in Table A5.
Table A5. Pairwise influence matrix (row → column).
C1C2C3C4C5C6C7C8C9C10C11C12C13C14C15C16C17C18C19
C1
C2
C3
C4
C5
C6
C7
C8
C9
C10
C11
C12
C13
C14
C15
C16
C17
C18
C19

Appendix D. VG-UAV User Requirement Indicators—ANP Questionnaire

Appendix D.1. Purpose and Notes

This appendix provides the pairwise-comparison questionnaire used for the ANP modeling reported in the main text. The goal is to elicit judgments on the relative importance among criteria and among indicators within each criterion cluster, in order to construct the feedback network and compute global weights. The survey is anonymous and used solely for academic research.

Appendix D.2. Instructions and Saaty Scale

Please compare two elements with respect to a given reference (control) criterion and indicate which one is more important and by how much, using the Saaty 1–9 scale.
Saaty 1–9 scale:
1 = equal importance; 3 = slight; 5 = marked; 7 = strong; 9 = extreme; 2/4/6/8 = intermediate values.
How to mark: If the left element is more important, check a box on the left side (closer to 9 means stronger). If the right element is more important, check a box on the right side. If they are equal, check 1 in the center.
Template row (tick one box):
Left element 9 8 7 6 5 4 3 2 1 2 3 4 5 6 7 8 9 Right element

Appendix D.3. Element Lists

Criterion layer (B):
B1 Function; B2 Performance; B3 User Experience; B4 Safety; B5 Intelligence.
Indicator layer (C) by cluster:
B1 (Function): C1 Autonomous Obstacle Avoidance; C2 Precision Spraying; C3 Plant Replacement; C4 Data Transmission; C5 Environmental Monitoring.
B2 (Performance): C6 Flight Stability; C7 Endurance Time; C8 Payload Capacity; C9 Facade Adaptability.
B3 (User Experience): C10 Human-Factor Sizing; C11 Color Harmonization; C12 User Interface; C13 Aesthetic Form.
B4 (Safety): C14 Operational Safety; C15 Material Safety; C16 Environmental Safety; C17 Structural Safety.
B5 (Intelligence): C18 Autonomous Decision-Making; C19 Predictive Maintenance.

Appendix D.4. Questionnaire Content

D-1. Cluster-Level Pairwise Comparisons with respect to B1 (Function)
Use the scale row for each pair:
B1 9 8 7 6 5 4 3 2 1 2 3 4 5 6 7 8 9 B2
B1 9 8 7 6 5 4 3 2 1 2 3 4 5 6 7 8 9 B3
B1 9 8 7 6 5 4 3 2 1 2 3 4 5 6 7 8 9 B4
B1 9 8 7 6 5 4 3 2 1 2 3 4 5 6 7 8 9 B5
B2 9 8 7 6 5 4 3 2 1 2 3 4 5 6 7 8 9 B3
B2 9 8 7 6 5 4 3 2 1 2 3 4 5 6 7 8 9 B4
B2 9 8 7 6 5 4 3 2 1 2 3 4 5 6 7 8 9 B5
B3 9 8 7 6 5 4 3 2 1 2 3 4 5 6 7 8 9 B4
B3 9 8 7 6 5 4 3 2 1 2 3 4 5 6 7 8 9 B5
B4 9 8 7 6 5 4 3 2 1 2 3 4 5 6 7 8 9 B5
D-2. Cluster-Level Pairwise Comparisons with respect to B2 (Performance)
B1 9 8 7 6 5 4 3 2 1 2 3 4 5 6 7 8 9 B2
B1 9 8 7 6 5 4 3 2 1 2 3 4 5 6 7 8 9 B3
B1 9 8 7 6 5 4 3 2 1 2 3 4 5 6 7 8 9 B4
B1 9 8 7 6 5 4 3 2 1 2 3 4 5 6 7 8 9 B5
B2 9 8 7 6 5 4 3 2 1 2 3 4 5 6 7 8 9 B3
B2 9 8 7 6 5 4 3 2 1 2 3 4 5 6 7 8 9 B4
B2 9 8 7 6 5 4 3 2 1 2 3 4 5 6 7 8 9 B5
B3 9 8 7 6 5 4 3 2 1 2 3 4 5 6 7 8 9 B4
B3 9 8 7 6 5 4 3 2 1 2 3 4 5 6 7 8 9 B5
B4 9 8 7 6 5 4 3 2 1 2 3 4 5 6 7 8 9 B5
D-3. Cluster-Level Pairwise Comparisons with respect to B3 (User Experience)
B1 9 8 7 6 5 4 3 2 1 2 3 4 5 6 7 8 9 B2
B1 9 8 7 6 5 4 3 2 1 2 3 4 5 6 7 8 9 B3
B1 9 8 7 6 5 4 3 2 1 2 3 4 5 6 7 8 9 B4
B1 9 8 7 6 5 4 3 2 1 2 3 4 5 6 7 8 9 B5
B2 9 8 7 6 5 4 3 2 1 2 3 4 5 6 7 8 9 B3
B2 9 8 7 6 5 4 3 2 1 2 3 4 5 6 7 8 9 B4
B2 9 8 7 6 5 4 3 2 1 2 3 4 5 6 7 8 9 B5
B3 9 8 7 6 5 4 3 2 1 2 3 4 5 6 7 8 9 B4
B3 9 8 7 6 5 4 3 2 1 2 3 4 5 6 7 8 9 B5
B4 9 8 7 6 5 4 3 2 1 2 3 4 5 6 7 8 9 B5
D-4. Cluster-Level Pairwise Comparisons with respect to B4 (Safety)
B1 9 8 7 6 5 4 3 2 1 2 3 4 5 6 7 8 9 B2
B1 9 8 7 6 5 4 3 2 1 2 3 4 5 6 7 8 9 B3
B1 9 8 7 6 5 4 3 2 1 2 3 4 5 6 7 8 9 B4
B1 9 8 7 6 5 4 3 2 1 2 3 4 5 6 7 8 9 B5
B2 9 8 7 6 5 4 3 2 1 2 3 4 5 6 7 8 9 B3
B2 9 8 7 6 5 4 3 2 1 2 3 4 5 6 7 8 9 B4
B2 9 8 7 6 5 4 3 2 1 2 3 4 5 6 7 8 9 B5
B3 9 8 7 6 5 4 3 2 1 2 3 4 5 6 7 8 9 B4
B3 9 8 7 6 5 4 3 2 1 2 3 4 5 6 7 8 9 B5
B4 9 8 7 6 5 4 3 2 1 2 3 4 5 6 7 8 9 B5
D-5. Cluster-Level Pairwise Comparisons with respect to B5 (Intelligence)
B1 9 8 7 6 5 4 3 2 1 2 3 4 5 6 7 8 9 B2
B1 9 8 7 6 5 4 3 2 1 2 3 4 5 6 7 8 9 B3
B1 9 8 7 6 5 4 3 2 1 2 3 4 5 6 7 8 9 B4
B1 9 8 7 6 5 4 3 2 1 2 3 4 5 6 7 8 9 B5
B2 9 8 7 6 5 4 3 2 1 2 3 4 5 6 7 8 9 B3
B2 9 8 7 6 5 4 3 2 1 2 3 4 5 6 7 8 9 B4
B2 9 8 7 6 5 4 3 2 1 2 3 4 5 6 7 8 9 B5
B3 9 8 7 6 5 4 3 2 1 2 3 4 5 6 7 8 9 B4
B3 9 8 7 6 5 4 3 2 1 2 3 4 5 6 7 8 9 B5
B4 9 8 7 6 5 4 3 2 1 2 3 4 5 6 7 8 9 B5
D-6. Within-Cluster Pairwise Comparisons—B1 (Function): C1–C5
C1 9 8 7 6 5 4 3 2 1 2 3 4 5 6 7 8 9 C2
C1 9 8 7 6 5 4 3 2 1 2 3 4 5 6 7 8 9 C3
C1 9 8 7 6 5 4 3 2 1 2 3 4 5 6 7 8 9 C4
C1 9 8 7 6 5 4 3 2 1 2 3 4 5 6 7 8 9 C5
C2 9 8 7 6 5 4 3 2 1 2 3 4 5 6 7 8 9 C3
C2 9 8 7 6 5 4 3 2 1 2 3 4 5 6 7 8 9 C4
C2 9 8 7 6 5 4 3 2 1 2 3 4 5 6 7 8 9 C5
C3 9 8 7 6 5 4 3 2 1 2 3 4 5 6 7 8 9 C4
C3 9 8 7 6 5 4 3 2 1 2 3 4 5 6 7 8 9 C5
C4 9 8 7 6 5 4 3 2 1 2 3 4 5 6 7 8 9 C5
D-7. Within-Cluster Pairwise Comparisons—B2 (Performance): C6–C9
C6 9 8 7 6 5 4 3 2 1 2 3 4 5 6 7 8 9 C7
C6 9 8 7 6 5 4 3 2 1 2 3 4 5 6 7 8 9 C8
C6 9 8 7 6 5 4 3 2 1 2 3 4 5 6 7 8 9 C9
C7 9 8 7 6 5 4 3 2 1 2 3 4 5 6 7 8 9 C8
C7 9 8 7 6 5 4 3 2 1 2 3 4 5 6 7 8 9 C9
C8 9 8 7 6 5 4 3 2 1 2 3 4 5 6 7 8 9 C9
D-8. Within-Cluster Pairwise Comparisons—B3 (User Experience): C10–C13
C10 9 8 7 6 5 4 3 2 1 2 3 4 5 6 7 8 9 C11
C10 9 8 7 6 5 4 3 2 1 2 3 4 5 6 7 8 9 C12
C10 9 8 7 6 5 4 3 2 1 2 3 4 5 6 7 8 9 C13
C11 9 8 7 6 5 4 3 2 1 2 3 4 5 6 7 8 9 C12
C11 9 8 7 6 5 4 3 2 1 2 3 4 5 6 7 8 9 C13
C12 9 8 7 6 5 4 3 2 1 2 3 4 5 6 7 8 9 C13
D-9. Within-Cluster Pairwise Comparisons—B4 (Safety): C14–C17
C14 9 8 7 6 5 4 3 2 1 2 3 4 5 6 7 8 9 C15
C14 9 8 7 6 5 4 3 2 1 2 3 4 5 6 7 8 9 C16
C14 9 8 7 6 5 4 3 2 1 2 3 4 5 6 7 8 9 C17
C15 9 8 7 6 5 4 3 2 1 2 3 4 5 6 7 8 9 C16
C15 9 8 7 6 5 4 3 2 1 2 3 4 5 6 7 8 9 C17
C16 9 8 7 6 5 4 3 2 1 2 3 4 5 6 7 8 9 C17
D-10. Within-Cluster Pairwise Comparisons—B5 (Intelligence): C18–C19
C18 9 8 7 6 5 4 3 2 1 2 3 4 5 6 7 8 9 C19

Appendix E

Table A6. 39 General Engineering Parameters and Classification.
No.Parameter NameCategory
1Weight of Moving ObjectPhysical
2Weight of Stationary ObjectPhysical
3Length of Moving ObjectGeometric
4Length of Stationary ObjectGeometric
5Area of Moving ObjectGeometric
6Area of Stationary ObjectGeometric
7Volume of Moving ObjectGeometric
8Volume of Stationary ObjectGeometric
9SpeedPhysical
10ForcePhysical
11Stress/PressurePhysical
12ShapeGeometric
13Structural StabilityCapability
14StrengthCapability
15Action Time (Moving Object)Capability
16Action Time (Stationary Object)Capability
17TemperaturePhysical
18IlluminancePhysical
19Energy Consumption (Moving Object)Resource
20Energy Consumption (Stationary Object)Resource
21PowerPhysical
22Energy LossResource
23Material LossResource
24Information LossResource
25Time LossResource
26Quantity of Substance/MatterResource
27ReliabilityCapability
28Measurement AccuracyControllability
29Manufacturing PrecisionControllability
30Harmful Factors (Acting on Object)Harm
31Harmful Factors (Generated by Object)Harm
32ManufacturabilityCapability
33OperabilityControllability
34MaintainabilityCapability
35Adaptability and VersatilityCapability
36Equipment ComplexityControllability
37Detection ComplexityControllability
38Automation LevelControllability
39ProductivityCapability

Appendix F

Table A7. 40 Invention Principles.
No.NameNo.Name
1Segmentation21Skipping (Reduce Harm Time)
2Extraction22Blessing in Disguise (Harm → Benefit)
3Local Quality23Feedback
4Asymmetry24Mediator (Intermediary)
5Combination25Self-Service
6Universality (Diversity)26Copying
7Nesting27Cheap Substitute
8Counterweight (Mass Compensation)28Mechanical Substitution
9Preliminary Anti-Action29Pneumatic/Hydraulic Structure
10Preliminary Action30Flexible Membrane/Shell
11Cushioning (Precaution)31Porous Materials
12Equipotentiality32Color Changes
13Reverse Action33Homogeneity
14Curvature (Surfaceization)34Discarding and Recovering
15Dynamics (Dynamic Features)35Parameter Changes (Physical/Chemical)
16Partial/Excessive Action36Phase Transition
17Dimension Change37Thermal Expansion
18Vibration38Strong Oxidants
19Periodic Action39Inert Environment
20Continuity of Useful Action40Composite Materials

References

  1. Pan, L.; Zheng, X.-N.; Luo, S.; Mao, H.-J.; Meng, Q.-L.; Chen, J.-R. Review on building energy saving and outdoor cooling effect of vertical greenery systems. Chin. J. Appl. Ecol. 2023, 34, 2871–2880. [Google Scholar] [CrossRef]
  2. Wang, P.; Wong, Y.H.; Tan, C.Y.; Li, S.; Chong, W.T. Vertical Greening Systems: Technological Benefits, Progresses and Prospects. Sustainability 2022, 14, 12997. [Google Scholar] [CrossRef]
  3. Wu, Q.; Huang, Y.; Irga, P.; Kumar, P.; Li, W.; Wei, W.; Shon, H.K.; Lei, C.; Zhou, J.L. Synergistic Control of Urban Heat Island and Urban Pollution Island Effects Using Green Infrastructure. J. Environ. Manag. 2024, 370, 122985. [Google Scholar] [CrossRef]
  4. Okwandu, A.C.; Akande, D.O.; Nwokediegwu, Z.Q.S. Green Architecture: Conceptualizing Vertical Greenery in Urban Design. Eng. Sci. Technol. J. 2024, 5, 1657–1677. [Google Scholar] [CrossRef]
  5. Irga, P.J.; Torpy, F.R.; Griffin, D.; Wilkinson, S.J. Vertical Greening Systems: A Perspective on Existing Technologies and New Design Recommendation. Sustainability 2023, 15, 6014. [Google Scholar] [CrossRef]
  6. Farrokhirad, E.; Rigillo, M.; Köhler, M.; Perini, K. Optimising Vertical Greening Systems for Sustainability: An Integrated Design Approach. Int. J. Sustain. Energy 2024, 43, 2411831. [Google Scholar] [CrossRef]
  7. Xu, H.; Yang, Y.; Li, J.; Huang, X.; Han, W.; Wang, Y. A Unmanned Aerial Vehicle System for Urban Management. In Proceedings of the IGARSS 2024—2024 IEEE International Geoscience and Remote Sensing Symposium, Athens, Greece, 7–12 July 2024; pp. 4617–4620. [Google Scholar] [CrossRef]
  8. Chen, G.; Lin, Y.; Wu, X.; Yue, R.; Chen, W. An Unmanned Aerial Vehicle Based Intelligent Operator for Power Transmission Lines Maintenance. In Proceedings of the 2024 Second International Conference on Cyber-Energy Systems and Intelligent Energy (ICCSIE), Shenyang, China, 17–19 May 2024; IEEE: Piscataway, NJ, USA, 2024; pp. 1–6. [Google Scholar]
  9. Tsellou, A.; Livanos, G.; Ramnalis, D.; Polychronos, V.; Plokamakis, G.; Zervakis, M.; Moirogiorgou, K. A UAV Intelligent System for Greek Power Lines Monitoring. Sensors 2023, 23, 8441. [Google Scholar] [CrossRef] [PubMed]
  10. Forcael, E.; Román, O.; Stuardo, H.; Herrera, R.; Soto-Muñoz, J. Evaluation of Fissures and Cracks in Bridges by Applying Digital Image Capture Techniques Using an Unmanned Aerial Vehicle. Drones 2023, 8, 8. [Google Scholar] [CrossRef]
  11. Dutta, M.; Gupta, D.; Sahu, S.; Limkar, S.; Singh, P.; Mishra, A.; Kumar, M.; Mutlu, R. Evaluation of Growth Responses of Lettuce and Energy Efficiency of the Substrate and Smart Hydroponics Cropping System. Sensors 2023, 23, 1875. [Google Scholar] [CrossRef]
  12. Ng, H.T.; Tham, Z.K.; Abdul Rahim, N.A.; Rohim, A.W.; Looi, W.W.; Ahmad, N.S. IoT-Enabled System for Monitoring and Controlling Vertical Farming Operations. Int. J. Reconfigurable Embed. Syst. (IJRES) 2023, 12, 453. [Google Scholar] [CrossRef]
  13. Aiyetan, A.O.; Das, D.K. Use of Drones for Construction in Developing Countries: Barriers and Strategic Interventions. Int. J. Constr. Manag. 2023, 23, 2888–2897. [Google Scholar] [CrossRef]
  14. Hu, S.; Xin, J.; Zhang, D.; Xing, G. Research on the Design Method of Camellia Oleifera Fruit Picking Machine. Appl. Sci. 2024, 14, 8537. [Google Scholar] [CrossRef]
  15. Zhou, H.; Chen, Y.; Zhang, X. Design of Electric Water Heaters Based on QFD-TRIZ. Packag. Eng. 2023, 44, 215–223. [Google Scholar] [CrossRef]
  16. Huang, J.; Lin, J.; Feng, T. Design of agricultural plant protection UAV based on Kano-AHP. J. Fujian Univ. Technol. 2023, 21, 97–102. [Google Scholar] [CrossRef]
  17. Su, C.; Li, X.; Jiang, Y.; Li, C. Design of intelligent home health equipment based on DEMATEL-ANP. J. Mach. Des. 2025, 42, 161–167. [Google Scholar] [CrossRef]
  18. Thakkar, J.J. Decision-Making Trial and Evaluation Laboratory (DEMATEL). In Multi-Criteria Decision Making; Thakkar, J.J., Ed.; Springer: Singapore, 2021; pp. 139–159. ISBN 978-981-334-745-8. [Google Scholar]
  19. Zhou, Q.; Tang, F.; Zhu, Y. Research on Product Design for Improving Children’s Sitting Posture Based on DEMATEL-ISM-TOPSIS Method. Furnit. Inter. Des. 2024, 31, 48–55. [Google Scholar] [CrossRef]
  20. Taherdoost, H.; Madanchian, M. Analytic Network Process (ANP) Method: A Comprehensive Review of Applications, Advantages, and Limitations. J. Data Sci. Intell. Syst. (JDSIS) 2023, 1, 12–18. [Google Scholar] [CrossRef]
  21. Viola, N.; Corpino, S.; Fioriti, M.; Stesina, F. Functional Analysis in Systems Engineering: Methodology and Applications. In Systems Engineering—Practice and Theory; InTech: London, UK, 2012; ISBN 978-953-51-0322-6. [Google Scholar]
  22. Xie, Q.; Liu, Q. Application of TRIZ Innovation Method to In-Pipe Robot Design. Machines 2023, 11, 912. [Google Scholar] [CrossRef]
  23. Tang, K.; Qian, Y.; Dong, H.; Huang, Y.; Lu, Y.; Tuerxun, P.; Li, Q. SP-YOLO: A Real-Time and Efficient Multi-Scale Model for Pest Detection in Sugar Beet Fields. Insects 2025, 16, 102. [Google Scholar] [CrossRef] [PubMed]
  24. Zhang, M.; Ye, S.; Zhao, S.; Wang, W.; Xie, C. Pear Object Detection in Complex Orchard Environment Based on Improved YOLO11. Symmetry 2025, 17, 255. [Google Scholar] [CrossRef]
  25. Zhu, H.; Lin, C.; Liu, G.; Wang, D.; Qin, S.; Li, A.; Xu, J.-L.; He, Y. Intelligent Agriculture: Deep Learning in UAV-Based Remote Sensing Imagery for Crop Diseases and Pests Detection. Front. Plant Sci. 2024, 15, 1435016. [Google Scholar] [CrossRef] [PubMed]
  26. Holschemacher, D.; Müller, C.; Helbig, M.; Weisel, N. LARGE-SCALE, ROPE-DRIVEN ROBOT FOR THE AUTOMATED MAINTENANCE OF URBAN GREEN FACADES. In State-of-the-art Materials and Techniques in Structural Engineering and Construction, Structural Engineering and Construction, Proceedings of the Fourth European and Mediterranean Structural Engineering and Construction Conference (EURO-MED-SEC-4), Leipzig, Germany, 20–23 June 2022; Holsche macher, K., Quapp, U., Singh, A., Yazdani, S., Eds.; ISEC Press: Fargo, ND, USA, 2022; SUS-12. [Google Scholar] [CrossRef]
  27. Jamšek, M.; Sajko, G.; Krpan, J.; Babič, J. Design and Control of a Climbing Robot for Autonomous Vertical Gardening. Machines 2024, 12, 141. [Google Scholar] [CrossRef]
  28. Hattenberger, G.; Bronz, M.; Condomines, J.-P. Evaluation of Drag Coefficient for a Quadrotor Model. Int. J. Micro Air Veh. 2023, 15. [Google Scholar] [CrossRef]
  29. Weber, C.; Eggert, M.; Udelhoven, T. Flight Attitude Estimation with Radar for Remote Sensing Applications. Sensors 2024, 24, 4905. [Google Scholar] [CrossRef] [PubMed]
  30. SAMR; SAC. GB/T 43071—2023; Unmanned Aircraft Spray System for Plant Protection. State Administration for Market Regulation (SAMR); Standardization Administration of China (SAC): Beijing, China, 2023. Available online: https://openstd.samr.gov.cn/bzgk/gb/newGbInfo?hcno=DE5EB96756889201A2EBA08F003DB744 (accessed on 6 September 2025).
  31. Falanga, D.; Kleber, K.; Scaramuzza, D. Dynamic Obstacle Avoidance for Quadrotors with Event Cameras. Sci. Robot. 2020, 5, eaaz9712. [Google Scholar] [CrossRef] [PubMed]
  32. ISO. ISO 2533:1975; Standard Atmosphere. International Organization for Standardization: Geneva, Switzerland, 1975.
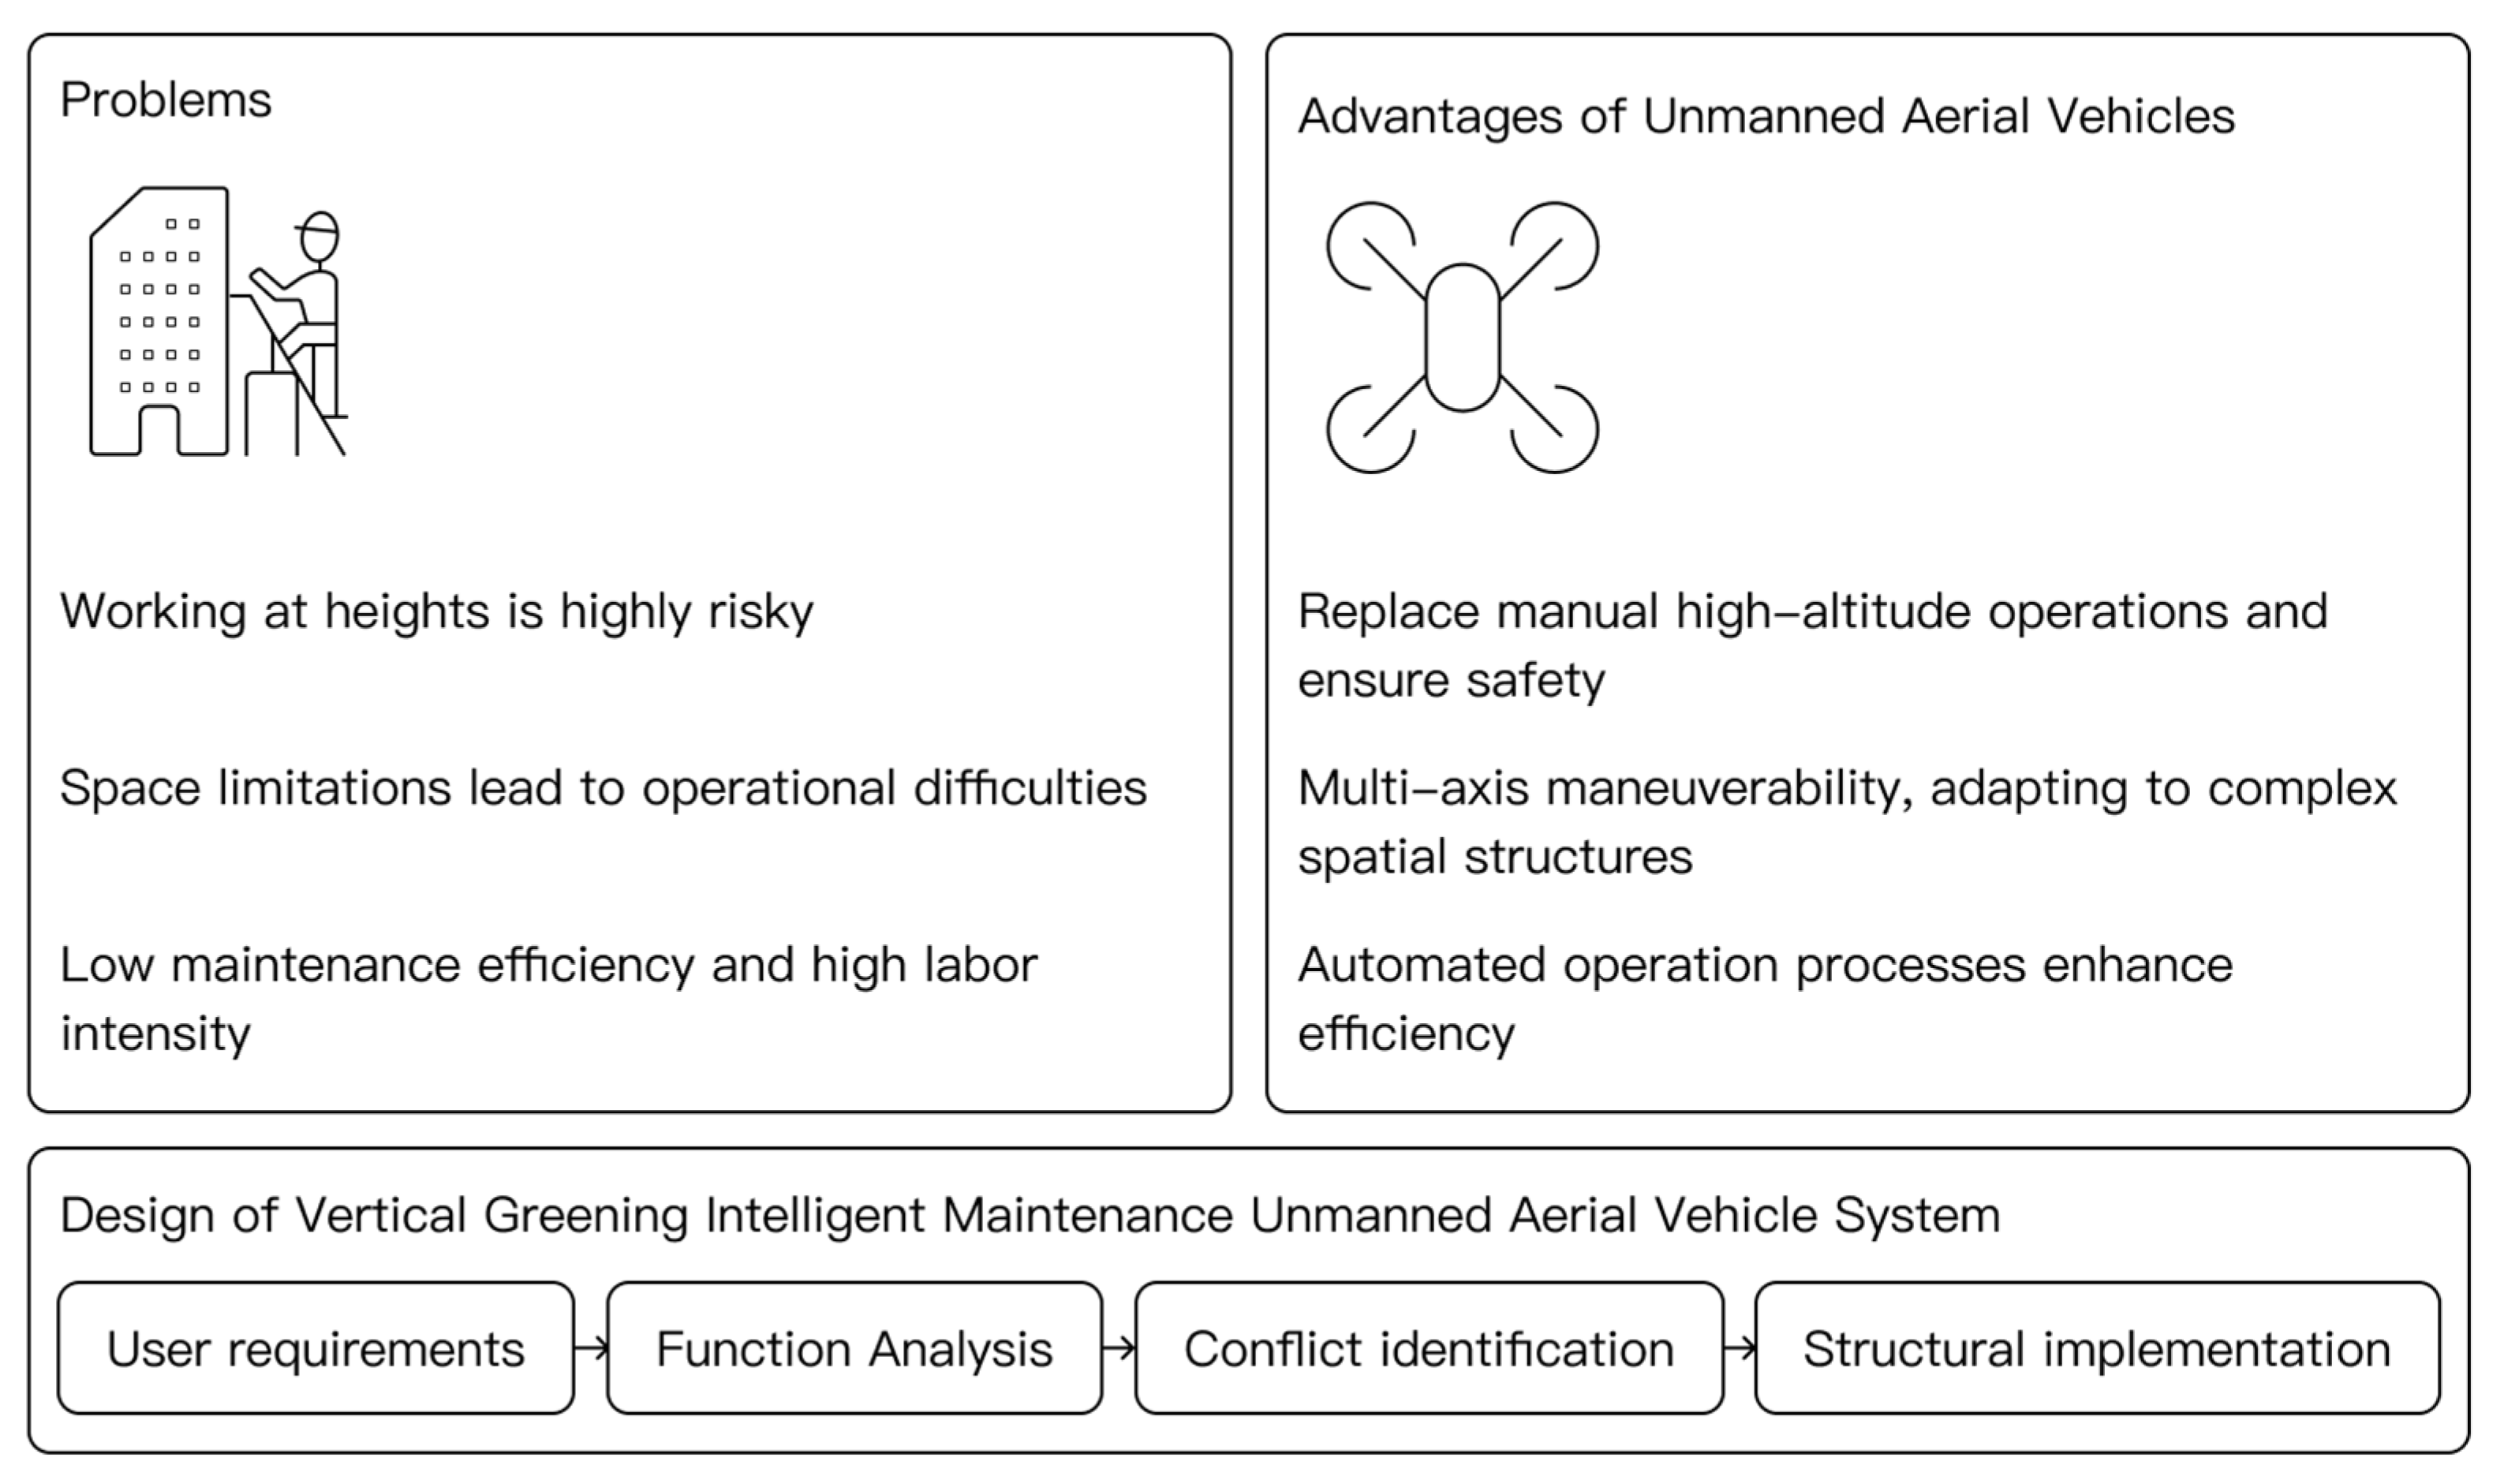
Figure 1. Closed-loop D-A-F-T framework for intelligent UAVs in VG maintenance.
Applsci 15 10887 g001
Figure 2. The D-A-F-T closed-loop workflow. Solid arrows: forward stream (DEMATEL-ANP → FAST → TRIZ → visual verification). Dashed arrows: feedback routes—F1: visual → DEMATEL-ANP (reweight requirements); F2: visual → FAST (revise functional paths/constraints); F3: visual → TRIZ (refine contradiction mapping/principles).
Applsci 15 10887 g002
Figure 3. Task-driven closed-loop workflow for the integrated design of an intelligent VG-maintenance UAV. Solid arrows indicate the process sequence; dashed arrows indicate feedback flows. F1: key requirements and functional metrics (DEMATEL-ANP); F2: functional logic and conflict identification (FAST); F3: solution optimization and validation (TRIZ).
Applsci 15 10887 g003
Figure 4. Causal relationship scatter plot. (Note: C1–C19 denote indicator codes; see Table 2 for full names).
Applsci 15 10887 g004
Figure 5. ANP feedback network diagram for VG-UAV user requirements. Colors are for readability only; they do not encode values. C1–C19 are indicator codes (see Table 2).
Applsci 15 10887 g005
Figure 6. VG-UAV black-box model.
Applsci 15 10887 g006
Figure 7. FAST functional tree of the VG-UAV.
Applsci 15 10887 g007
Figure 8. Coordinated balance system with sliding-rail counterweight.
Applsci 15 10887 g008
Figure 9. Bionic compliant gripper system.
Applsci 15 10887 g009
Figure 10. Overall system rendering.
Applsci 15 10887 g010
Figure 11. Exploded architecture.
Applsci 15 10887 g011
Figure 12. Mission workflow.
Applsci 15 10887 g012
Figure 13. Web-based HMI.
Applsci 15 10887 g013
Figure 14. Visual model pipeline.
Applsci 15 10887 g014
Table 1. Round-specific decision and stopping rules (this study).
PhaseRetainRetain but ReviseRevise/Relocate/Merge (Delete if Necessary)Stopping Rule
Round 1Mean ≥ 3.122 and CV ≤ 0.185; median ≥ 4 with IQR ≤ 1Meets mean/CV but wording/attribution ambiguous, or median ∈ [3.5, 4)Mean < 3.122 and/or CV > 0.185, or persistently low consensus after revisionSignificant W (p < 0.001) and negligible “new/merge” suggestions
Round 2Mean ≥ 3.809 and CV ≤ 0.096; median ≥ 4 with IQR ≤ 1Thresholds met yet residual ambiguity—refine and keepFails tightened cutoffs or consensus remains low → merge/deleteSignificant W (p < 0.001) and list stabilized → freeze
Note: Full-score frequency was monitored as an auxiliary signal and not used as a sole deletion criterion.
Table 2. Final user-requirement indicator set for a VG-UAV.
Goal Layer (A)Criteria Layer (B)Indicator Layer (C)
Design of an Intelligent UAV for VG MaintenanceFunctional Requirements (B1)Automatic Obstacle Avoidance (C1); Precision Spraying (C2); Plant Replacement (C3); Data Transmission (C4); Environmental Monitoring (C5)
Performance Requirements (B2)Flight Stability (C6); Endurance Time (C7); Payload Capacity (C8); Facade Adaptability (C9)
Experience Requirements (B3)Human–Machine Dimensional Compatibility (C10); Color Harmony (C11); User Interface (C12); Aesthetic Appearance (C13)
Safety Requirements (B4)Operational Safety (C14); Material Safety (C15); Environmental Safety (C16); Structural Safety (C17)
Intelligent Decision-Making(B5)Autonomous Decision-Making (C18); Predictive Maintenance (C19)
Table 3. Total-influence matrix.
C1C2C3C4C5C6C7C8C9C10C11C12C13
C10.0750.1720.0910.1590.0950.1610.0940.1120.0850.1420.1500.1190.149
C20.0950.0890.1200.0900.1670.1100.1460.1460.0760.0800.0880.0790.150
C30.1180.1320.0820.1000.1070.1450.1500.1310.0890.1170.1220.1190.108
C40.0890.1430.1120.0780.1430.1190.1200.1500.0820.1430.1080.1340.103
C50.0880.1430.0970.0820.0690.1150.0830.0840.1000.0940.1070.0860.073
C60.1700.1530.1370.1720.1490.1030.1410.1610.1610.1420.1500.1390.141
C70.0660.0660.0570.0640.0770.0600.0480.1430.0580.0920.0810.0690.064
C80.0920.1670.1860.1510.1530.1130.1700.1220.1400.1580.1750.1070.161
C90.1110.1250.1060.1410.0930.1410.1140.1560.0720.1640.1300.1080.154
C100.0720.1030.0990.0900.0910.0930.0910.1440.0720.0620.0960.0640.142
C110.0480.0750.0890.0710.0870.0940.0730.0920.0600.0790.0500.1320.082
C120.0590.0700.0880.1410.0970.0930.0690.0930.0580.1000.0670.0540.099
C130.0390.0630.0550.0370.0610.0440.0490.0430.0280.0500.0760.0320.032
Entry gives the combined (direct + indirect) effect from to per Equation (3). Indicator definitions are in Appendix C; the full 19 × 19 matrix appears in Table A5.
Table 4. Summary of influence indices.
ResultReceived Influence (R)Exerted Influence (D)Prominence (C)Relation (H)
C11.7142.4634.1770.749
C22.1702.3674.5360.197
C31.9242.3954.3190.471
C41.9362.2904.2250.354
C52.0011.9293.931−0.072
C62.0312.8714.9030.840
C71.9191.4523.371−0.467
C82.2812.9625.2430.681
C91.6612.4494.1100.789
C102.0041.7783.781−0.226
C112.0031.4483.451−0.555
C121.8431.6903.533−0.153
C132.0160.9722.988−1.044
C142.7101.8344.544−0.877
C151.9541.8473.801−0.107
C162.2881.8944.182−0.395
C172.3612.4114.7710.050
C182.0132.4784.4900.465
C192.2751.5743.849−0.702
Outgoing D, Incoming R, Centrality C = D + R, Causality H = D − R, as shown in Equations (4) and (5).
Table 5. Inter-cluster local priorities W (rows = influenced cluster; columns = “with respect to” cluster) and consistency.
Row\ColB1B2B3B4B5
B10.4320.3910.2600.4500.502
B20.2010.1290.4460.2140.194
B30.0530.0680.0780.0470.085
B40.2200.2430.1410.1120.154
B50.0940.1690.0750.1770.066
Table 6. Weights of VG-UAV requirement indicators (limit supermatrix).
Primary CriterionWeight Secondary CriterionWeight Rank
Functional Requirements (B1)0.425C1—Automatic Obstacle Avoidance0.1661
C2—Precision Spraying0.0853
C3—Plant Replacement0.0696
C4—Data Transmission0.04011
C5—Environmental Monitoring0.0667
Performance Requirements (B2)0.203C6—Flight Stability0.0922
C7—Endurance Time0.03512
C8—Payload Capacity0.03213
C9—Facade Adaptation0.04510
User Experience Requirements (B3)0.060C10—Human–Machine Dimensional0.02915
C11—Color Harmony0.01118
C12—User Interface0.00919
C13—Aesthetic Appearance0.01217
Safety Requirements (B4)0.191C14—Operational Safety0.0598
C15—Material Safety0.03014
C16—Environmental Safety0.02116
C17—Structural Safety0.0814
Intelligence Requirements (B5)0.121C18—Autonomous Decision-Making0.0745
C19—Predictive Maintenance0.0479
Table 7. Summary of core requirements for system design.
CodeIndicatorANP Global WeightDEMATEL CDEMATEL H
C1Obstacle Avoidance0.1664.1770.749
C6Flight Stability0.0924.9030.840
C2Precision Spraying0.0854.5360.197
C17Structural Safety0.0814.7710.050
C18Autonomous Decision-Making0.0744.4900.465
C3Plant Replacement0.0694.3190.471
Table 8. TRIZ conflict–parameter mapping and recommended inventive principles. P# denotes the ID of a TRIZ general engineering parameter (Appendix E, P1–P39). Arrows (↑/↓) indicate direction of change: in “Improve”, ↑ = desired increase, ↓ = desired decrease; in “Worsen (risk)”, ↑ = undesired increase (risk up), ↓ = undesired decrease (loss of capability).
ConflictImprove (Desired ↑/↓)Worsen (Risk ↑/↓)Recommended Inventive Principles
FC1 lightweighting vs. structural safetyP1 Weight of moving object ↓, P19 Energy consumption (moving) ↓, P39 Productivity ↑P14 Strength ↓, P13 Structural stability ↓, P31 Harmful factors generated by object ↑ 1 Segmentation, 35 Parameter changes, 40 Composite materials
FC2 manipulator/payload disturbance vs. flight stabilityP13 Structural stability ↑, P27 Reliability ↑, P33↑ Operability ↑P10 Force/torque disturbance↑, P31 Harmful factors generated ↑24 Intermediary (mediator), 10 Preliminary action, 15 Dynamics, 28 Mechanics substitution
FC3 autonomy complexity vs. real-time deadlinesP38 Automation level ↑, P28 Measurement accuracy ↑, P39 Productivity ↑P25 Time loss ↑, P37 Detection complexity ↑/P36 Equipment complexity ↑1 Segmentation (multi-rate/layered), 21 Skipping (anytime), 10 Preliminary action
FC4 grasp stiffness vs. botanical complianceP27 Reliability ↑, P33 Operability ↑P30 Harmful factors acting on object ↑, P10 Force ↑30 Flexible shells and thin films, 5 Merging (sensor fusion)
Table 9. Module-callout map for the exploded view.
CalloutModule/SubsystemPrimary Material(s)Function/Notes
D1Obstacle-avoidance systemOptical glass; electronicsNear-field facade sensing (RGB/ToF/ultrasonic)
D2Flight controlFR-4 PCB; Al heat spreader; connectorsAutopilot; power conditioning
D3Motor (BLDC)Cu windings; steel shaftPropulsion; sized to mission load
D4AntennaCu trace; ABS radomeRF link; keep clearance from CFRP to avoid detuning
D5Binocular depth cameraABS shell; optical glass; Al mountDepth/pose for landing, alignment, QC logging
D6Propeller bladesCFRP blades; SS hub fixingsHigh-stiffness, low-inertia rotors
D7GimbalAl 6061-T6 links; PA12 covers; SS fastenersPose stabilization for end-effector/sensors
D8Plant-handling gripperPA12 housings; silicone pads (Shore A ≈ 10–25)Gentle grasp–reseat; loads act on rigid pot rim
D9Carbon-fiber armCFRP tube; metal insertsLightweight, high-specific-stiffness arms; root reinforcement
D10Fuselage coverCFRP laminate; optional ABS trimsAerodynamic/protective cover
D11Battery modulePC/ABS shell; Cu busbarsPrimary power supply; quick-release hot-swap
Table 10. B-level weighted means.
Dimension (B)S1: VG-UAV S2: Rope-DrivenS3: Climbing
Functionality (B1)4.533.984.08
Performance (B2)4.494.404.10
User Experience (B3)4.314.044.11
Safety (B4)4.494.494.59
Intelligence (B5)4.464.144.04
Table 11. Acceptance criteria for interpreting the analytical envelope.
SymbolNameAcceptance Criterion/BandSource
μThrust marginΜ ≥ 0.80 at MTOW (equivalently T/W ≥ 1.8)eCalc suggests a lower-limit thrust-to-weight ratio of ≈1.8 for multirotors; we map this to μ ≥ 0.80 for our envelope (software guideline, not a formal standard).
θCrosswind tilt θ 5 ° (good);
5 ° < θ 8 ° (acceptable)
Hattenberger et al. [28], “Evaluation of drag coefficient for a quadrotor model”: linear bank-angle-speed relation up to ≈9 m·s−1; citing prior work, transition near ≈6° to quadratic drag (≈8–10 m·s−1). Bands above adopted as engineering guidelines.
ΔφRoll angle deviationGood: Δφ ≤ 2.5°; Acceptable: Δφ ≤ 3°.Weber, C. et al. [29] main-flight RMSEs ≈ 1.4–2.5° (roll/pitch), turbulent cases up to 5.1°/7.8°. Bands derived as empirical, non-normative limits.
CVSpray CVCV ≤ 35%GB/T 43071—2023 [30] (national standard; acceptance threshold).
L t o t Sensing → actuation latencyGood ≤ 100 ms; Acceptable ≤ 200 ms (onboard loop).Falanga, D. et al. [31] event–camera pipeline achieves ≈3.5 ms perception-to-first-command; reliably avoids at 10   m s 1 . Thresholds here are conservative engineering bounds; supervision-link latency evaluated separately.
This table lists acceptance bands and default values only; formal definitions and modeling assumptions are given in Section 4.6.1 (Equations (9)–(16)). Defaults correspond to the baseline heavy-class hexacopter in Section 4.6.2 and can be scaled to lighter platforms by holding disk loading D L = W / A tot or the thrust-to-weight ratio μ approximately constant (see Scene Alignment). Unless marked “standard,” entries are engineering guidelines derived from cited studies. In Equation (14), the empirical factor α aggregates non-Stokes and near-wall effects; using d = 300 μm lies near the Stokes validity limit; therefore, the drift estimate is interpreted as an upper bound.
Table 12. Parameterization and data sources used for the substitutions in Section 4.6.
SymbolUnitNameValue/Range (Baseline)Source/Justification (Type)
n-Rotor count6Design setting (within 6–8 for heavy-lift peers)
DmSingle-rotor diameter1.375 (=54″)Peer product spec (manufacturer)
A t o t m2Total rotor disk area 8.91   ( from   A t o t = n π ( D / 2 ) 2 )Actuator-disk (momentum) model; A t o t = n π ( D / 2 ) 2
mkgMass (two points)65 (dual-battery empty), 95 (MTOW)Peer product spec (manufacturer)
ρ k g m 3 Air density1.225ISA standard atmosphere
μ a P a s Air dynamic viscosity 1.789 × 1 0 5 ISA at 20 °C
g m s 2 Gravity9.81Standard constant
η p -Propulsive/rotor efficiency0.60–0.70 (baseline 0.65)Rotor hover FoM (textbook/industry survey)
V n o m VBattery nominal voltage52.22DB2000 datasheet (manufacturer)
C b AhBattery capacity (dual)76 (=2 × 38)DB2000 datasheet
DoD-Depth of discharge0.80–0.90 (baseline 0.85)Mission-window practice (battery life trade-off)
η b -Battery-powertrain efficiency0.90–0.95 (baseline 0.92)ESC/power distribution white papers (engineering range)
P a u x WAuxiliary power60 (vision/link/nav)System budget consistent with peers
P p a y l o a d WPayload powerSpraying: ~250 (dual pumps at mid-flow); Winch: ≈300 W (30 kg, 0.8 m/s)Peer specs + P = ΔpQ/η (pump) and P = mgv/η (winch)
U m s 1 Crosswind speed5 and 10 (evaluation points)Operating subset of 12 m/s wind tolerance
C d -Fuselage drag coefficient1.2 (bluff-body baseline)Multirotor wind-tunnel/CFD ranges
A r e f m 2 Reference frontal area1.0 (effective projection when deployed)Estimated from outer dimensions (standard practice)
m p kgPotted-plant mass0.5149Experimental input (measured)
Δ x mCoG offset due to grasp0.02 (upper bound)End-effector geometry constraint (engineering)
K ϕ N m r a d 1 Roll equivalent stiffness2.86 (from 0.05 N·m/deg)Control stiffness estimate (entry-level identification)
dμmRepresentative droplet size (VMD)150 and 300 (two points)Peer spraying system range; ASABE S572.1 terms
α m 1 Drift empirical factor0.03 (conservative lower end)Literature range pick for envelope use
hmNozzle-to-canopy height2.0 (with sensitivity: 1.5/3.0)Common operating height in field practice
L s e n s e , L i n f e r , L p l a n , L a c t msLatency components40/15/80/20Peer link and onboard inference scales
v m a x , a m a x , d s a f e , Δ n o i s e -Near-wall constraints 3   m s 1 , 3   m s 2 ,   3.5   m , 0.3   m Operational rule consistent with peer “safe distance”
Disclaimer/Publisher’s Note: The statements, opinions and data contained in all publications are solely those of the individual author(s) and contributor(s) and not of MDPI and/or the editor(s). MDPI and/or the editor(s) disclaim responsibility for any injury to people or property resulting from any ideas, methods, instructions or products referred to in the content.