Article

NDEExplorer: Visual Analytics for Exploring Damage Modes via Multimodal Data in the Non-Destructive Examination of Composite Materials

1
The Key Laboratory for Software Engineering of Hebei Province, School of Information Science and Engineering, Yanshan University, Qinhuangdao 066004, China
2
Chongqing Academy of Agricultural Sciences, Nongke Avenue, Baishiyi Town, Jiulongpo District, Chongqing 400000, China
*
Author to whom correspondence should be addressed.
Appl. Sci. 2025, 15(2), 952; https://doi.org/10.3390/app15020952
Submission received: 16 December 2024 / Revised: 10 January 2025 / Accepted: 15 January 2025 / Published: 19 January 2025
(This article belongs to the Special Issue Data Visualization Techniques: Advances and Applications)

Abstract

:
Non-destructive examination (NDE) in the field of materials engineering is a technique based on acoustics and optical principles used for detecting and evaluating internal defects in materials without causing any damage. The majority of current research on material damage focuses on the analysis of a single NDE method, resulting in low correlation between different NDE methods, and their results are frequently presented as complex data and images, making it difficult for professionals to obtain intuitive inspection results. Therefore, we propose a visual analytics system, NDEExplorer, aimed at solving these problems through visual analytics techniques. The system supports the use of two NDE methods, Acoustic Emission (AE) and Digital Image Correlation (DIC), providing interactive and intuitive views for observing composite material damage features. In addition, the system features a fusion analysis approach and a view that combines AE and DIC methods, enabling users to explore the correlations and trends in multimodal data generated during the material damage process. For users, the application of this system can help accurately identify the various material damage stages and their accompanying damage modes. To evaluate the effectiveness of the proposed method, we conduct a case study using two modal datasets from the same composite material damage scenario and carry out qualitative interviews with professionals and graduate students in the field. Finally, the quantitative feedback from a user study confirms the usefulness of our visual system for the multimodal analysis of material damage datasets.

1. Introduction

Composite materials, a novel form of lightweight, high-strength materials, have received broad applications in recent years in industries like aviation, the automotive industry, and construction [1,2,3]. However, due to their unique structure and manufacturing process, composite materials are prone to various types of defects and damage [4,5], such as delamination and matrix cracking. Therefore, analyzing their damage characteristics and evolution process contributes to their safe operation and extended service life.
Non-destructive examination (NDE) technology allows for the evaluation of the material’s health condition without causing any damage. It has proven to be an effective method for inspecting and assessing both the internal and surface structural changes of a specimen by detecting variations in sound, light, heat, and other signals caused by anomalies or defects in the material’s structure [6,7]. To explore the defects and damage of composite materials during their usage, researchers typically employ acoustic emission (AE) testing and digital image correlation (DIC) testing [8]. Although the AE method is well-established, studies have shown that its application in material damage analysis has certain limitations [9,10]. AE methods can typically identify the general region of material failure, but they often lack the spatial resolution necessary to precisely localize the failure points. For example, the AE tool developed by Physical Acoustics Corporation (PAC) (https://www.physicalacoustics.com/ (accessed on 15 December 2024)) is effective in collecting and analyzing AE signals; however, its positioning accuracy is limited, and the signal analysis process can be complex. In contrast, the DIC method [11,12] offers a more precise approach for identifying characteristic locations on the material surface, enabling the analysis of strain evolution under applied stress. This method also facilitates the study of how different loading conditions influence material stress, deformation, and fracture failure. For instance, the VIC-3D system (https://www.correlatedsolutions.com/vic-3d (accessed on 15 December 2024)) allows for high-precision displacement and strain field measurements. However, the accuracy of these measurements can be influenced by factors such as image quality and computational complexity. In recent years, several studies [13,14] have proposed frameworks for multimodal data fusion in material damage analysis. Despite this progress, challenges remain in effectively extracting valuable information and achieving a comprehensive understanding of the damage evolution process.
In this article, we propose an interactive visual analytics tool, NDEExplorer (Figure 1), which focuses on addressing two challenges. The first challenge is the efficient and intuitive presentation of NDE results to staff. NDEExplorer integrates technologies such as principal component analysis, an improved K-means clustering algorithm, and image segmentation to extract damage features. It allows users to perform interactive clustering experiments by continuously selecting representative features from the dataset to uncover potential damage pattern information. The second challenge is correlating the detection results from multiple NDE methods through damage features. To assist users in observing material displacement and deformation during the damage process, NDEExplorer designs an innovative slide-like view. This view allows users to visualize the displacement and deformation in DIC images, with key features extracted for each frame and linked to AE features. Moreover, users can freely select the analysis results from each NDE method and utilize interactive visualization tools to explore the boundary points for each damage stage, thereby enabling the evaluation of the effectiveness of each NDE modality. Finally, the effectiveness of this method is verified through case studies of damage feature data from AE and DIC in composite materials.
Overall, NDEExplorer provides a powerful platform for staff to efficiently and interactively analyze NDE results and explore the correlations between different NDE methods, making it easier to understand the structural health conditions of materials and facilitate decision making in engineering applications. In summary, the main contributions of this article are as follows:
  • A visual analytics system based on NDE methods, NDEExplorer, is designed to explore and evaluate the material damage evolution process;
  • The novel glyph design displays image features of material damage, facilitating the extraction of damage image information and its integration with AE features;
  • Our research is valuable in illuminating the analysis of composite material damage evolution and the exploration of multimodal data relationships.
The remaining sections of the paper are organized as follows: Section 2 summarizes the related work regarding the methods and visualization of NDE; Section 3 presents the system design framework, describes the process of multimodal data extraction, and constructs the system design methods; Section 4 presents case studies and user research, and it discusses the findings based on the research results; Section 5 analyzes the advantages, limitations, and future research directions of the NDE analysis, based on the visualization methods and results discussed above.

2. Related Work

In this section, we discuss the following two aspects of the related work: (1) NDE methods, and (2) visualization in NDE. Since these two areas cover a wide range of topics, we focus only on the aspects relevant to our work.

2.1. NDE Method

The understanding of the damage mechanism of composite materials and the identification of damage modes are crucial for ensuring safe design. In the field of materials engineering, NDE is an important damage detection technology that can be used to monitor the condition of various industrial materials in real time. Since its first use in 1987, the AE method has been widely applied to evaluate the failure features of composite materials [15], and it can be performed without interrupting the test. Recent studies [16,17,18,19] have shown that AE signals can be associated with damage mechanisms using clustering methods based on one or more features. Fotouhi et al. [20] performed a cluster analysis using fuzzy clustering algorithms on AE signals generated during tensile tests on composite materials, extracting corresponding damage source features. Pashmforoush et al. [21] used K-means clustering algorithms for the multi-parameter analysis of AE signals generated during the tensile process of composite materials, thereby revealing the different damage mechanisms of composite materials. However, due to the complex mechanical behavior of composite materials, relying on the AE method alone may not be sufficient to identify their damage modes. Maillet et al. [22] studied the influence of energy attenuation on AE signal features to demonstrate the limitations of relying solely on AE to identify damage. Therefore, it is crucial to equip the AE method with additional measurement technologies to accurately distinguish damage modes.
For composite materials, another widely-used NDE method is DIC [23,24], which evaluates sample damage and defects by collecting speckle images before and after material deformation. Zhang et al. [25] proposed a gray-scale change detection method based on DIC to monitor the damage state of materials by studying the features of gray-scale changes caused by damage during zero-strain experiments. Wang [26] proposed a semantic segmentation technique based on convolutional neural networks (CNN) to classify DIC strain field images at the pixel level, which is used for the structural health monitoring of fiber-reinforced composite materials (CFRP).
Both AE and DIC are widely used NDE methods used for evaluating damage in composite materials. The AE method facilitates the real-time, non-invasive monitoring of damage progression and can detect failure features without interrupting testing. However, its reliance on clustering methods and the complex behavior of composites may limit its accuracy in distinguishing specific damage modes. In contrast, the DIC method offers high spatial resolution by capturing surface deformation through speckle images, but it requires extensive image processing and is limited to surface-level damage detection. Therefore, combining the AE method with the DIC method can enhance the accuracy of damage identification.
Most studies have shown that the damage process of composite materials can be divided into three stages as follows: damage initiation, damage evolution, and damage instability. Andraju et al. [13] compared the damage initiation and propagation of CFRP and found that DIC methods can more accurately identify the boundary points of the latter two stages compared to the AE method. Meanwhile, Lomov et al. [27] evaluated the full-field strains generated in composite materials using DIC and determined the start of damage instability. In addition, Suarez et al. [28] used both AE and DIC methods to study the damage accumulation of CFRP in cyclic tensile tests and found good consistency between DIC results around stress concentration areas and AE results.
Therefore, this paper chooses to use both AE and DIC detection methods in damage experiments, selecting the method with the higher discrimination when distinguishing damage stages. Finally, by combining the features of acoustic and image signals, we can more accurately identify the mode and degree of damage of the material.

2.2. Visualization in NDE

Currently, most visualization literature related to materials science still primarily uses passive visualization techniques [29,30,31], where simple visualization techniques such as measuring and plotting raw data output, histograms, or even extracting binary values are sufficient to answer many questions in materials science, for example, whether a material system is suitable for a specific application. However, for higher-dimensional datasets, interactive visualization is required, for instance, exploring derived values. The interactive concepts used can affect the quality of the data exploration results in materials science. Heinzl et al. [32] identified the main tasks of visual computing, visual analytics, and visualization in materials science by analyzing the existing literature, and they pointed out that standard visualization tools are insufficient for the detailed exploration of generated materials science data.
In terms of design, we need to account for specific areas of interest and guide users in exploration, for example, with custom visualization analysis tools like Fiberscout [33], which assists in exploring individual fibers and fiber classes (groups of fibers with similar features) by connecting parallel coordinate plots and scatterplot matrices with traditional 2D slice views, 3D renderers, and polar plots to make the XCT scan results of composite parts more accurate. In addition, in visual computing-supported materials science data exploration and analysis, several basic interaction techniques such as translation, rotation, and scaling often appear, providing significant benefits for data exploration. For example, Zobel et al. [34] used these methods to explore whether and where the design of a novel fiber-reinforced polymer component might fail, eliminating errors in the parameterization of the simulation or the data acquisition processes.
In summary, visualization technology provides new insights into understanding the complex material systems of interest in the field of materials science. With increasing data complexity and growing analysis needs, interactive visualization methods are expected to be increasingly used in supporting the visual analytics process in materials science.

3. Materials and Methods
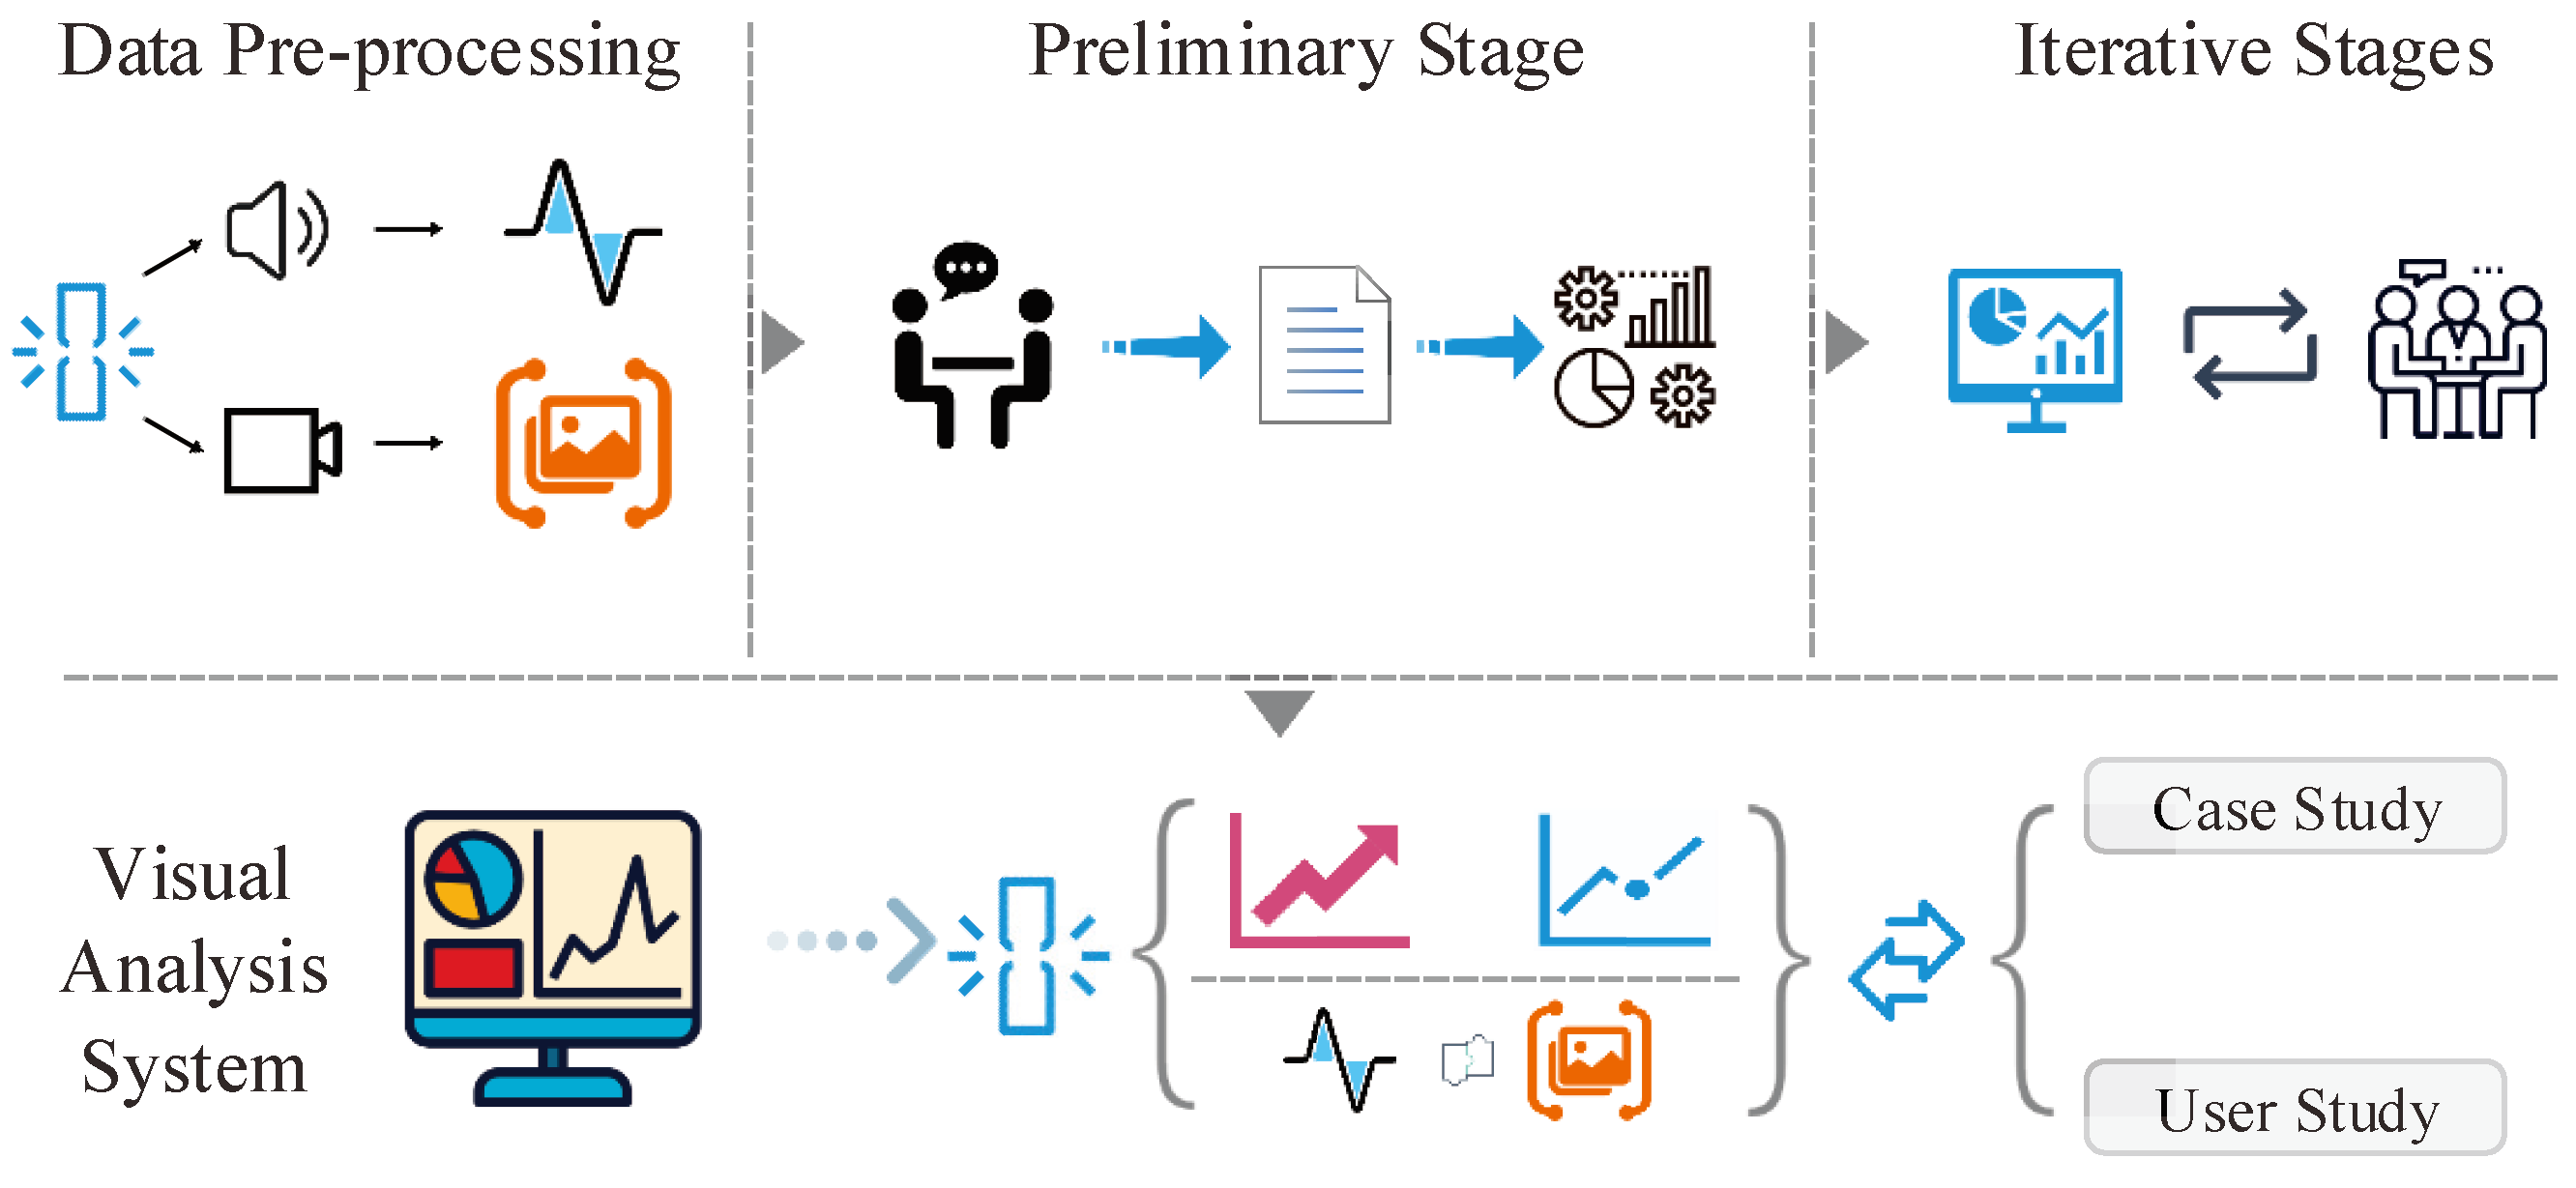
3.1. Workflow

The goal of the work in this paper is to meet the needs of field experts and address the problem of damage feature visualization and the analysis of multimodal data in the NDE of composite materials, rather than simply completing the visualization of AE and DIC data. To determine the analysis requirements for multimodal data, we have closely collaborated with an expert in the field of materials science (referred to as E0) and their team (referred to as S0-2) over an extended period. E0, who has 15 years of research experience in material damage and extensive expertise in NDE, has provided the necessary domain knowledge for the design of NDEExplorer. To ensure the objectivity of expert verification, we strictly adhere to standardized, systematic procedures throughout the analysis process. E0 (the lead expert) and S0-2 (in an advisory capacity) have contributed to the identification and verification of the requirements through multiple discussions and feedback sessions. Specifically, E0 is responsible for determining the main theoretical framework and data requirements, while team member S0-2 has assisted with and supplemented the data collection, selection of analysis methods, and technical details. The feedback from all experts was facilitated through regular meetings and written reports, and their perspectives were compared to maintain consistency and accuracy in the verification process. We further clarify the expert verification process in the case analysis section to ensure the transparency and traceability of our research at every stage. Together, we identified the key needs for analyzing and integrating AE and DIC data, which are summarized as a list of requirements (as shown in Table 1). These requirements cover the critical issues in NDE analysis, and Figure 2 shows the entire workflow.
Data pre-processing. The AE and DIC data acquisition of material damage needs to be consistent, laying the foundation for the fusion analysis of multimodal data. During data pre-processing, multimodal data are processed into formats that meet the analysis requirements according to the requirements of T1–T5.
Preliminary stage. Our visual analytics tool design process began with qualitative interviews with experts in the field, aimed at understanding existing issues. E0 reported that their research mainly focuses on identifying material failure modes using various NDE methods, but earlier research lacked consistency in the visualization process. Although many related works showcase simplistic visualization charts, there is still no standard NDE procedure, resulting in significant time and financial costs in damage analysis [35,36]. Therefore, E0 holds that an ideal visualization system can (G1) explore material damage processes to solve this issue, (G2) improve user experience, and (G3) increase the accuracy of damage pattern recognition.
Iterative stages. We iteratively communicated with E0 and their team members based on the requirements for the designed visualization system. After multiple rounds of refinement and adjustments, the experts suggested that by integrating AE and DIC data, (G4) the results of a single NDE method could be cross-verified. E0 also proposed adding a damage backtracking visualization feature to our existing system, which involves (G5) using DIC images to backtrack and locate the initial point of material instability, i.e., the onset of material instability.
Based on the design requirements and through multiple rounds of iterative development, we developed NDEExplorer, a web-based interactive visual analytics system (Figure 1) that enables users to explore and compare various material failure characteristics using different NDE methods. The visual analytics system consists of the following three functional areas:
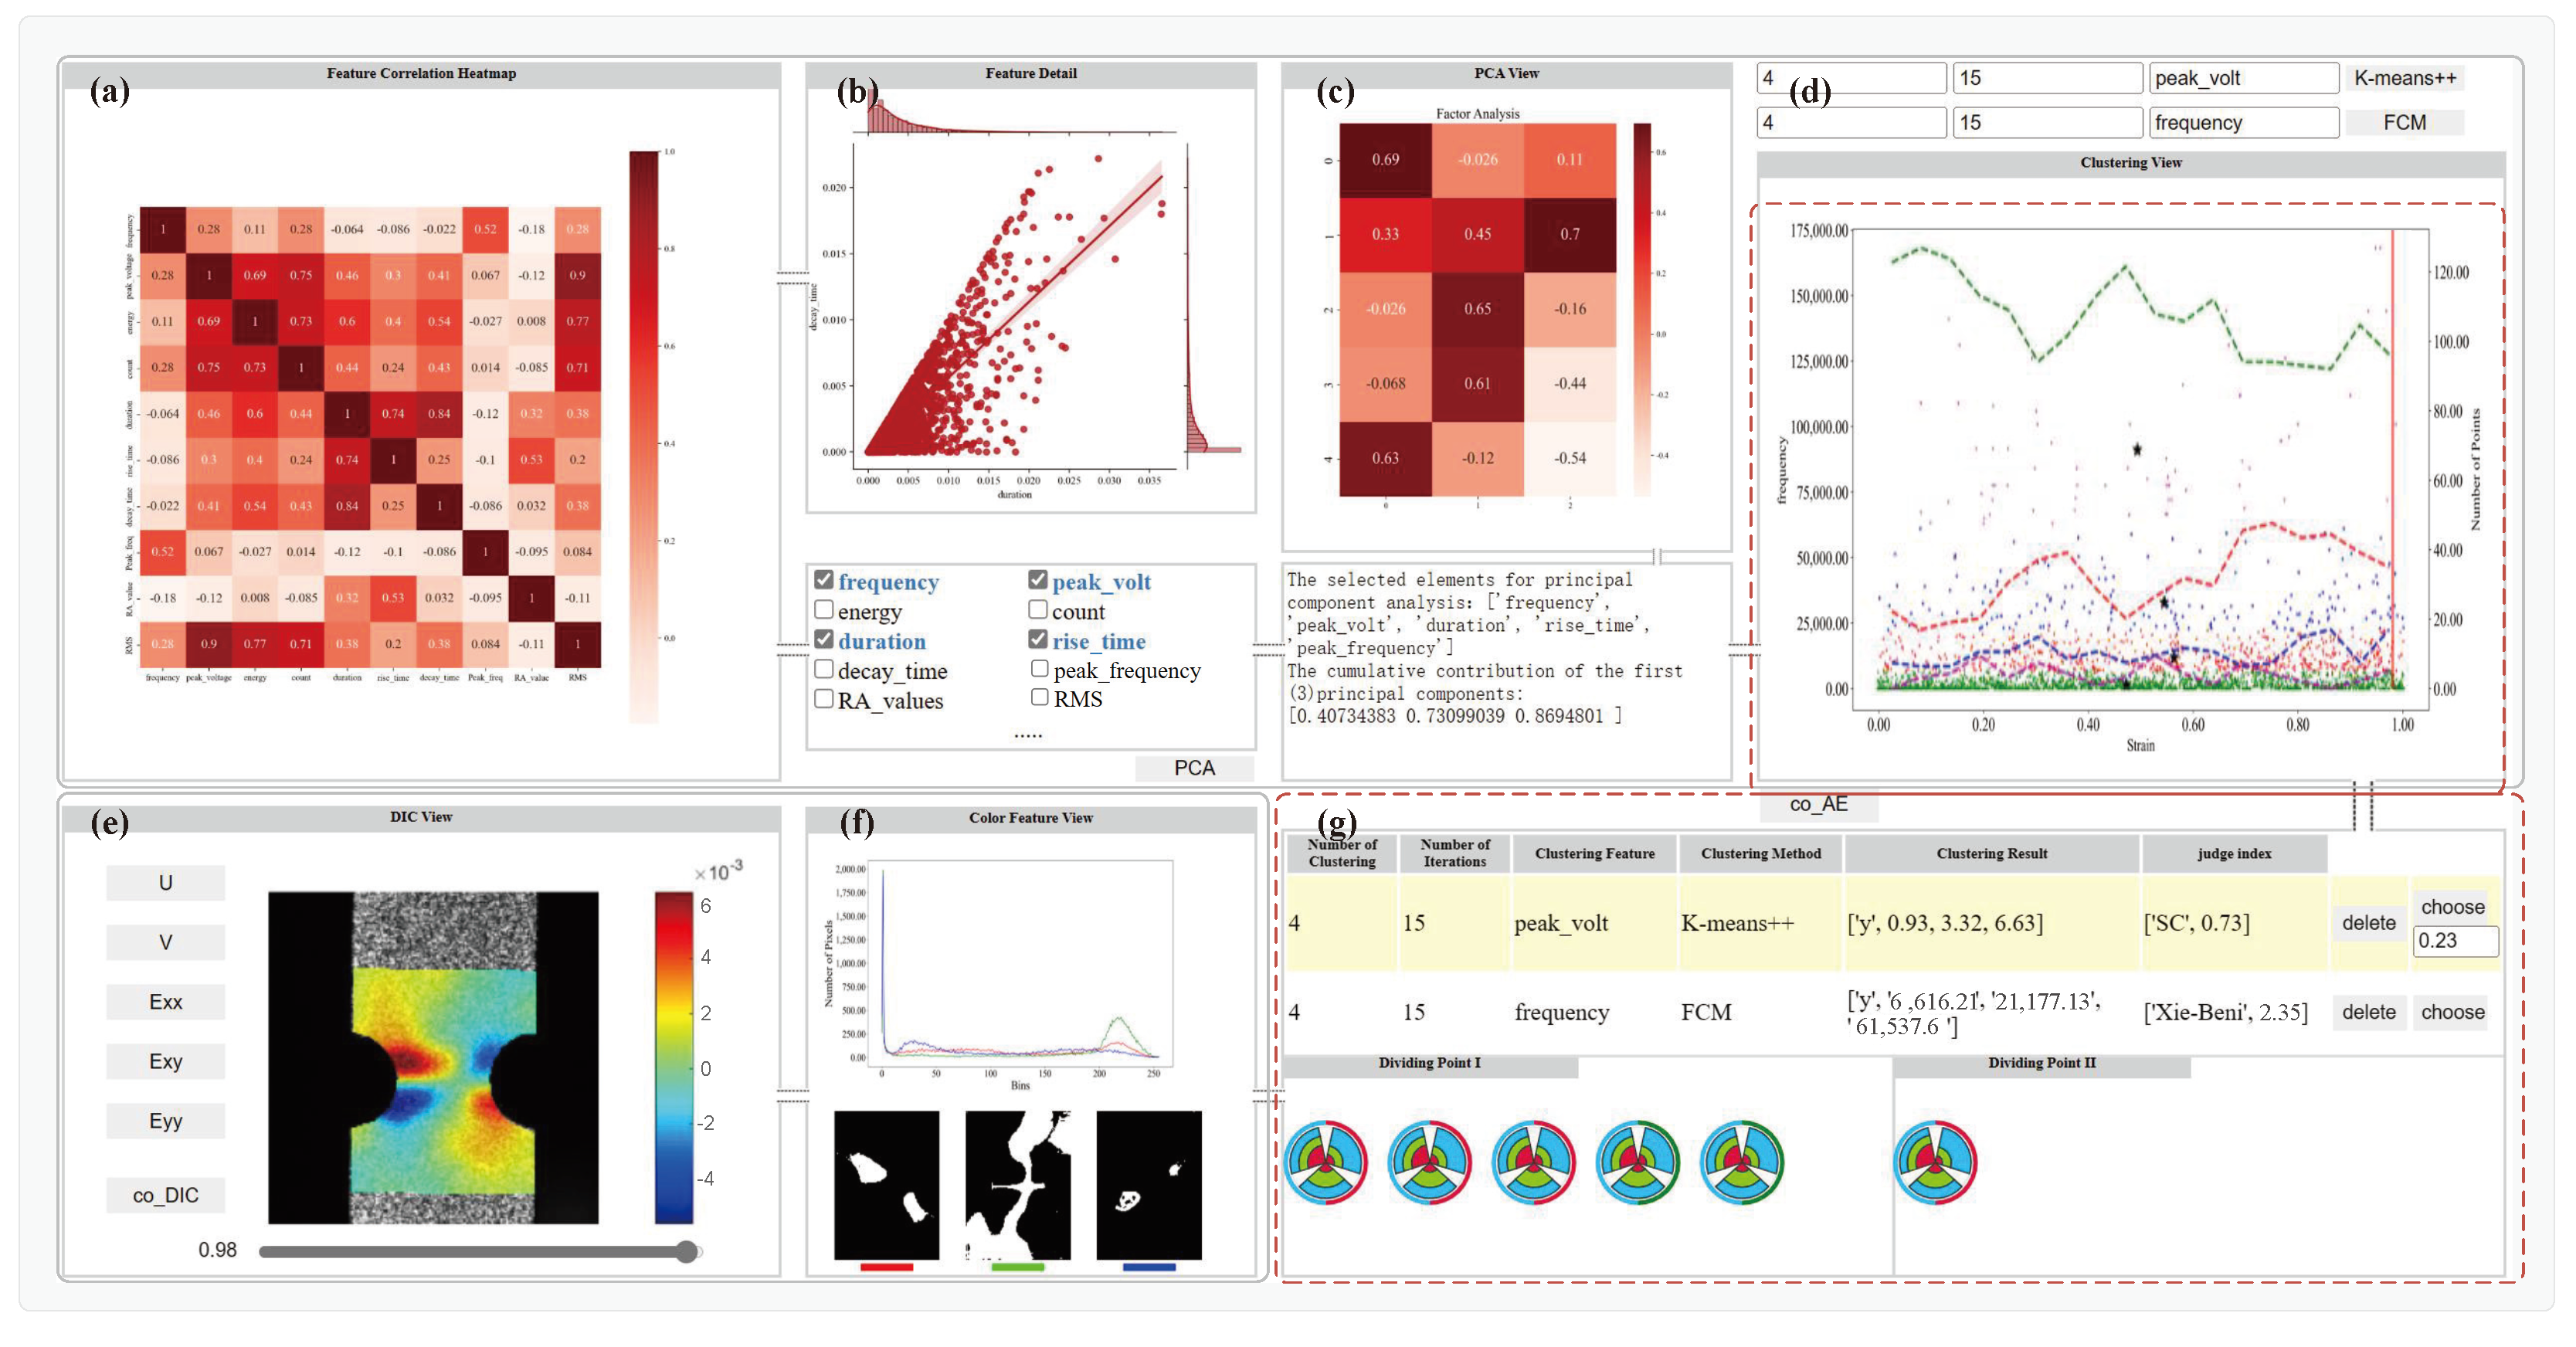
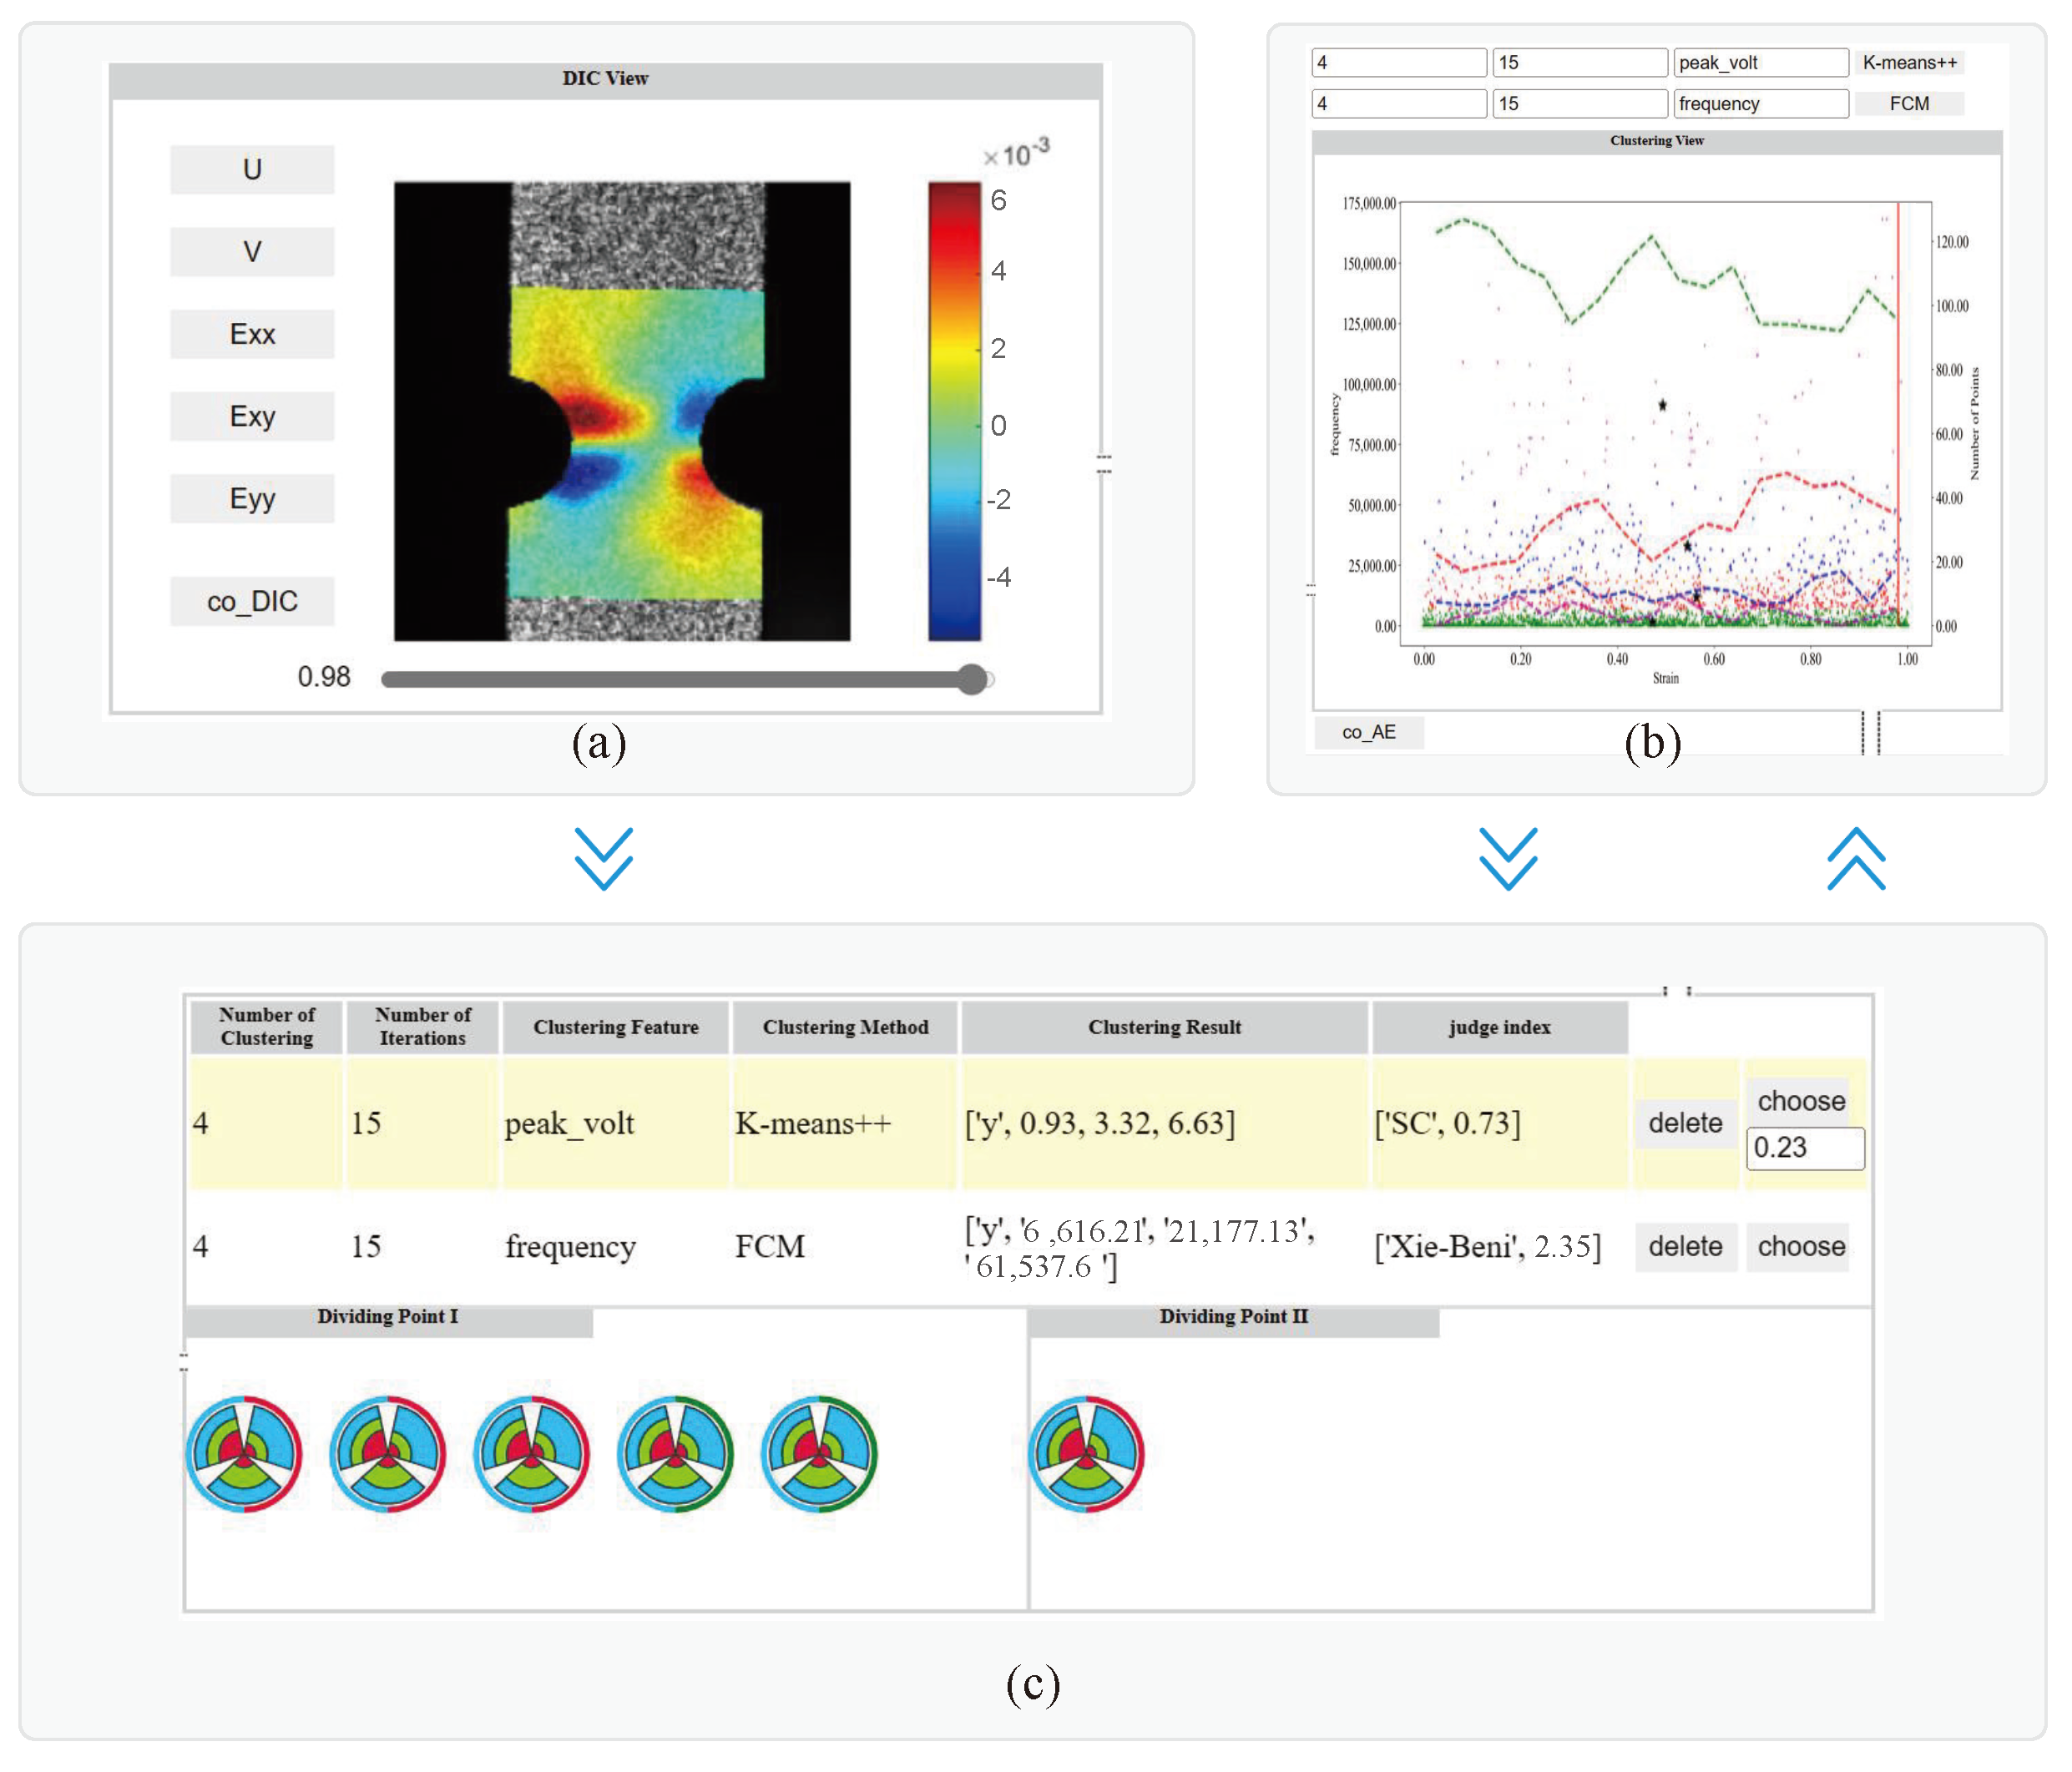
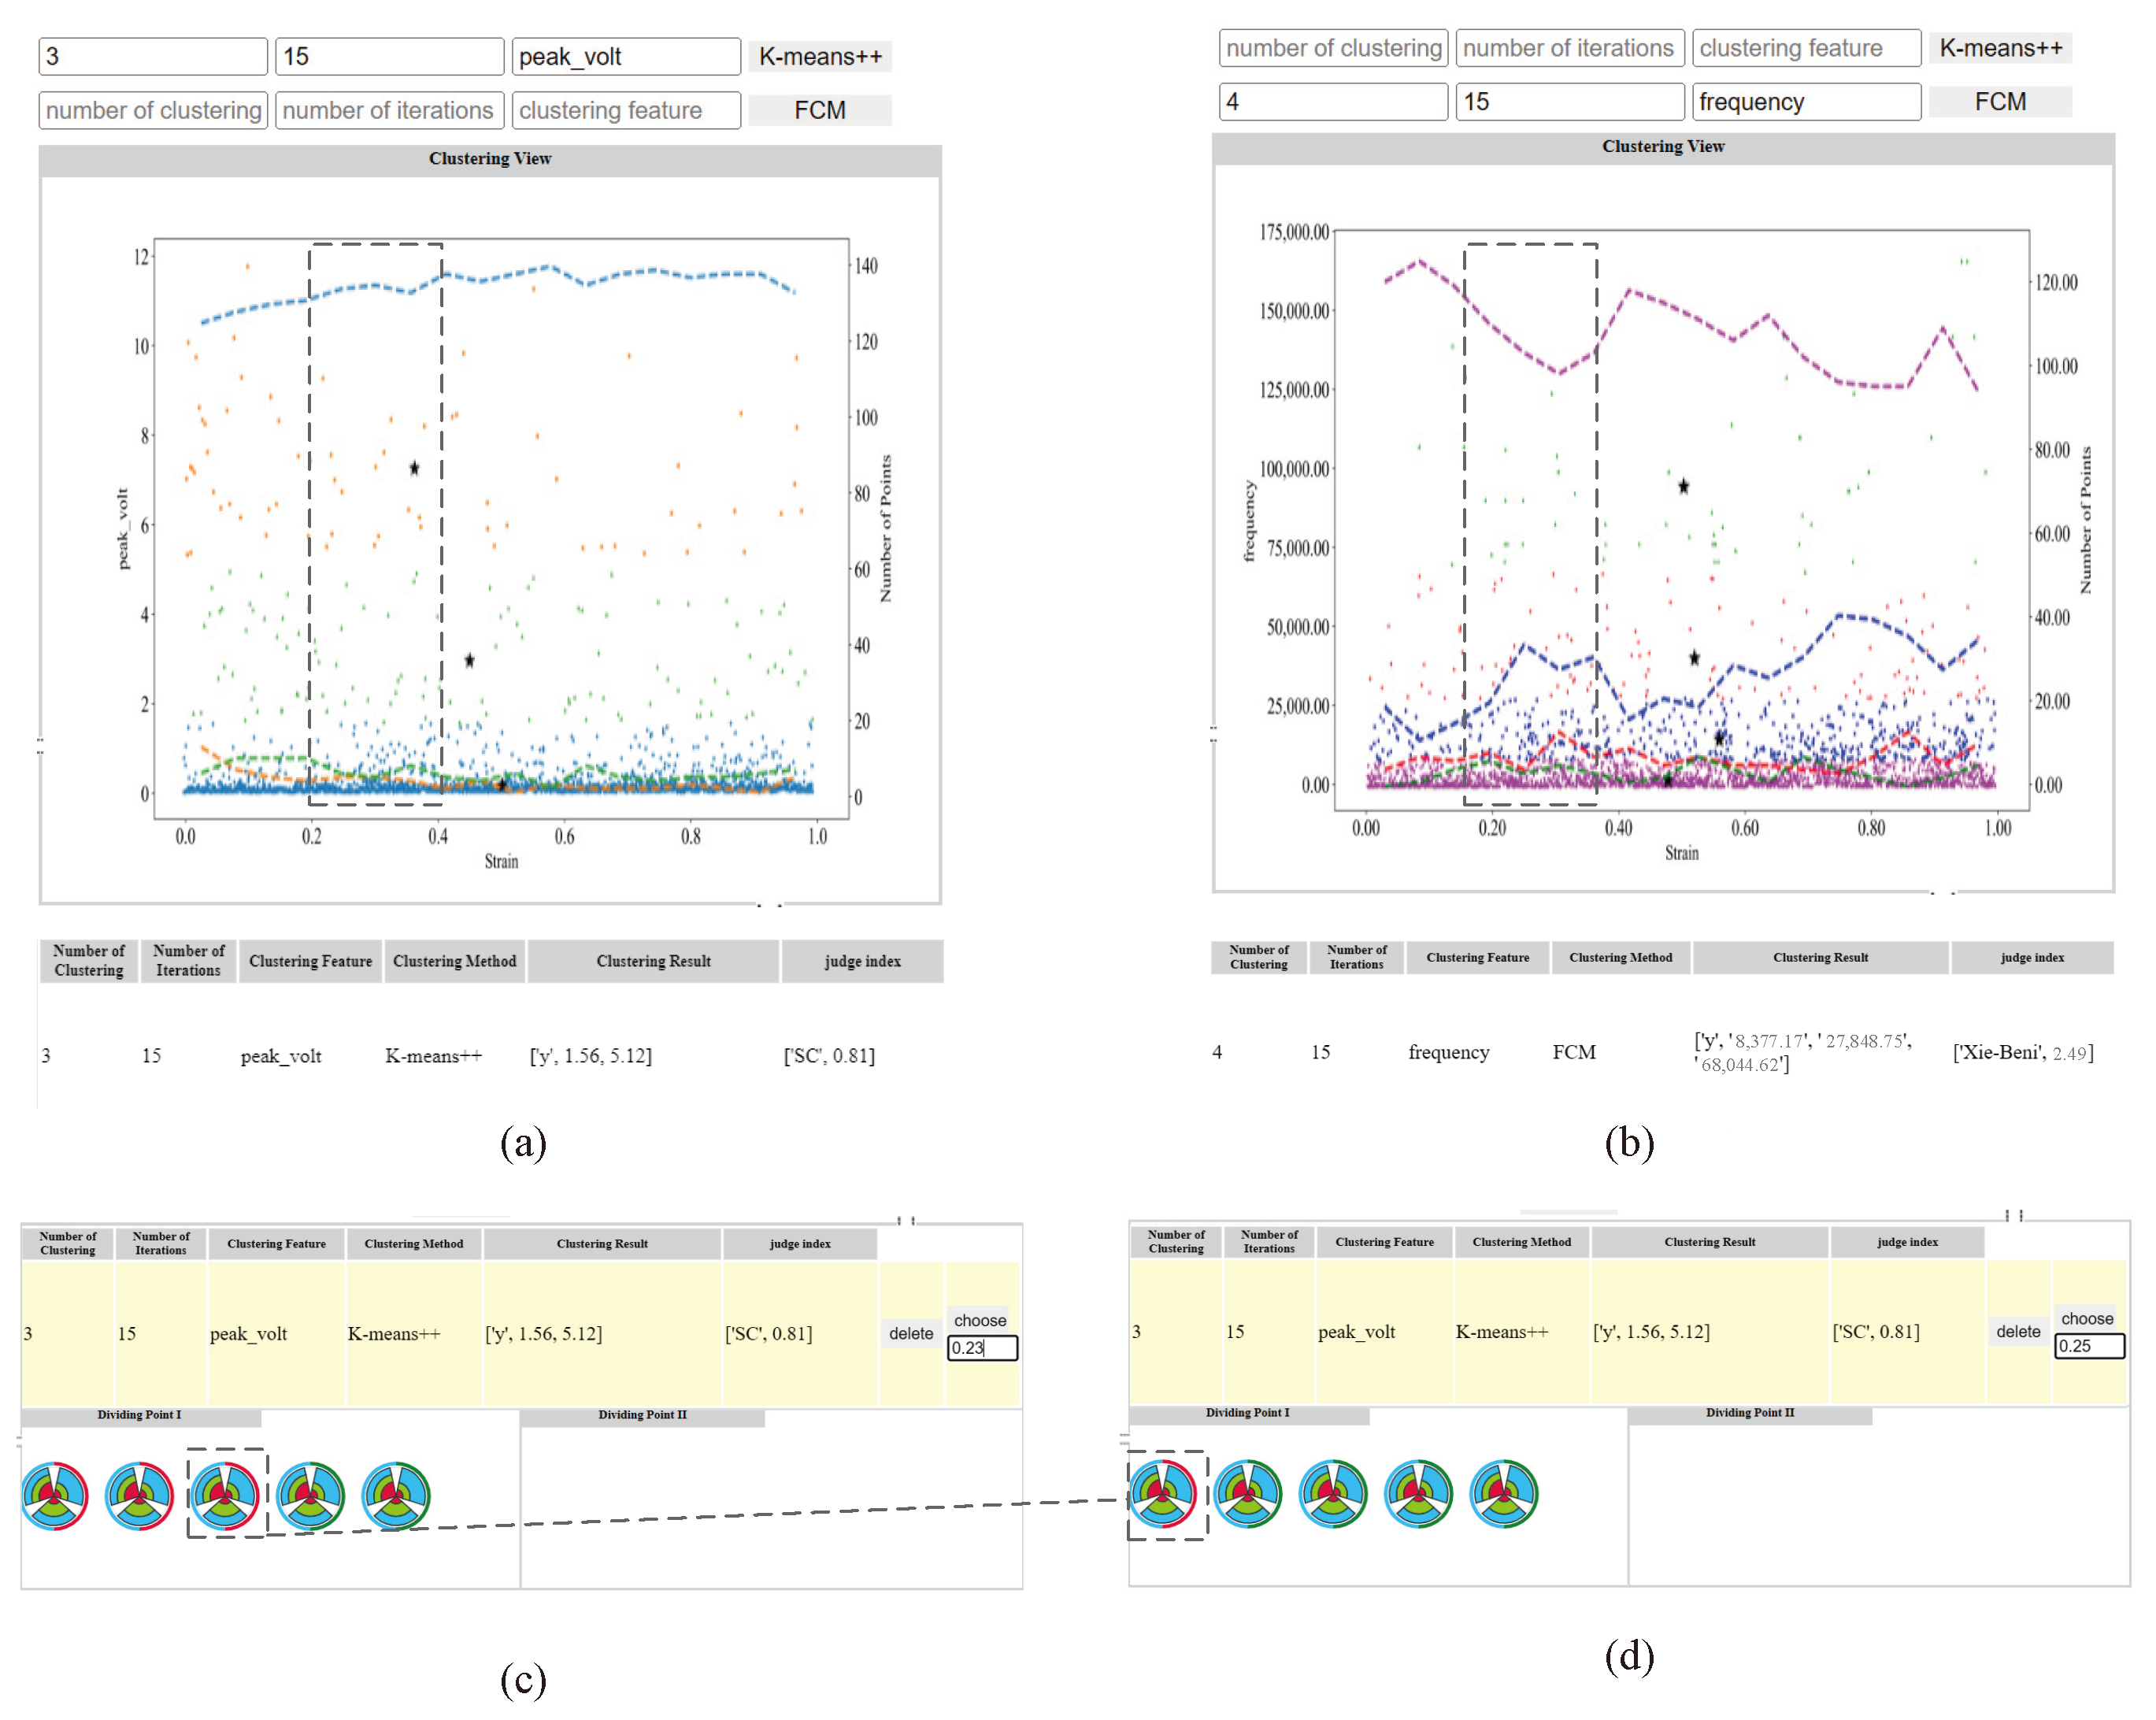
  • The AE analysis area (Figure 1a–d) presents the correlation matrices and scatter plots of various AE features to illustrate their degree of correlation, while the clustering diagram is intended to help users explore different clustering patterns resulting from the AE analysis (T1, T2);
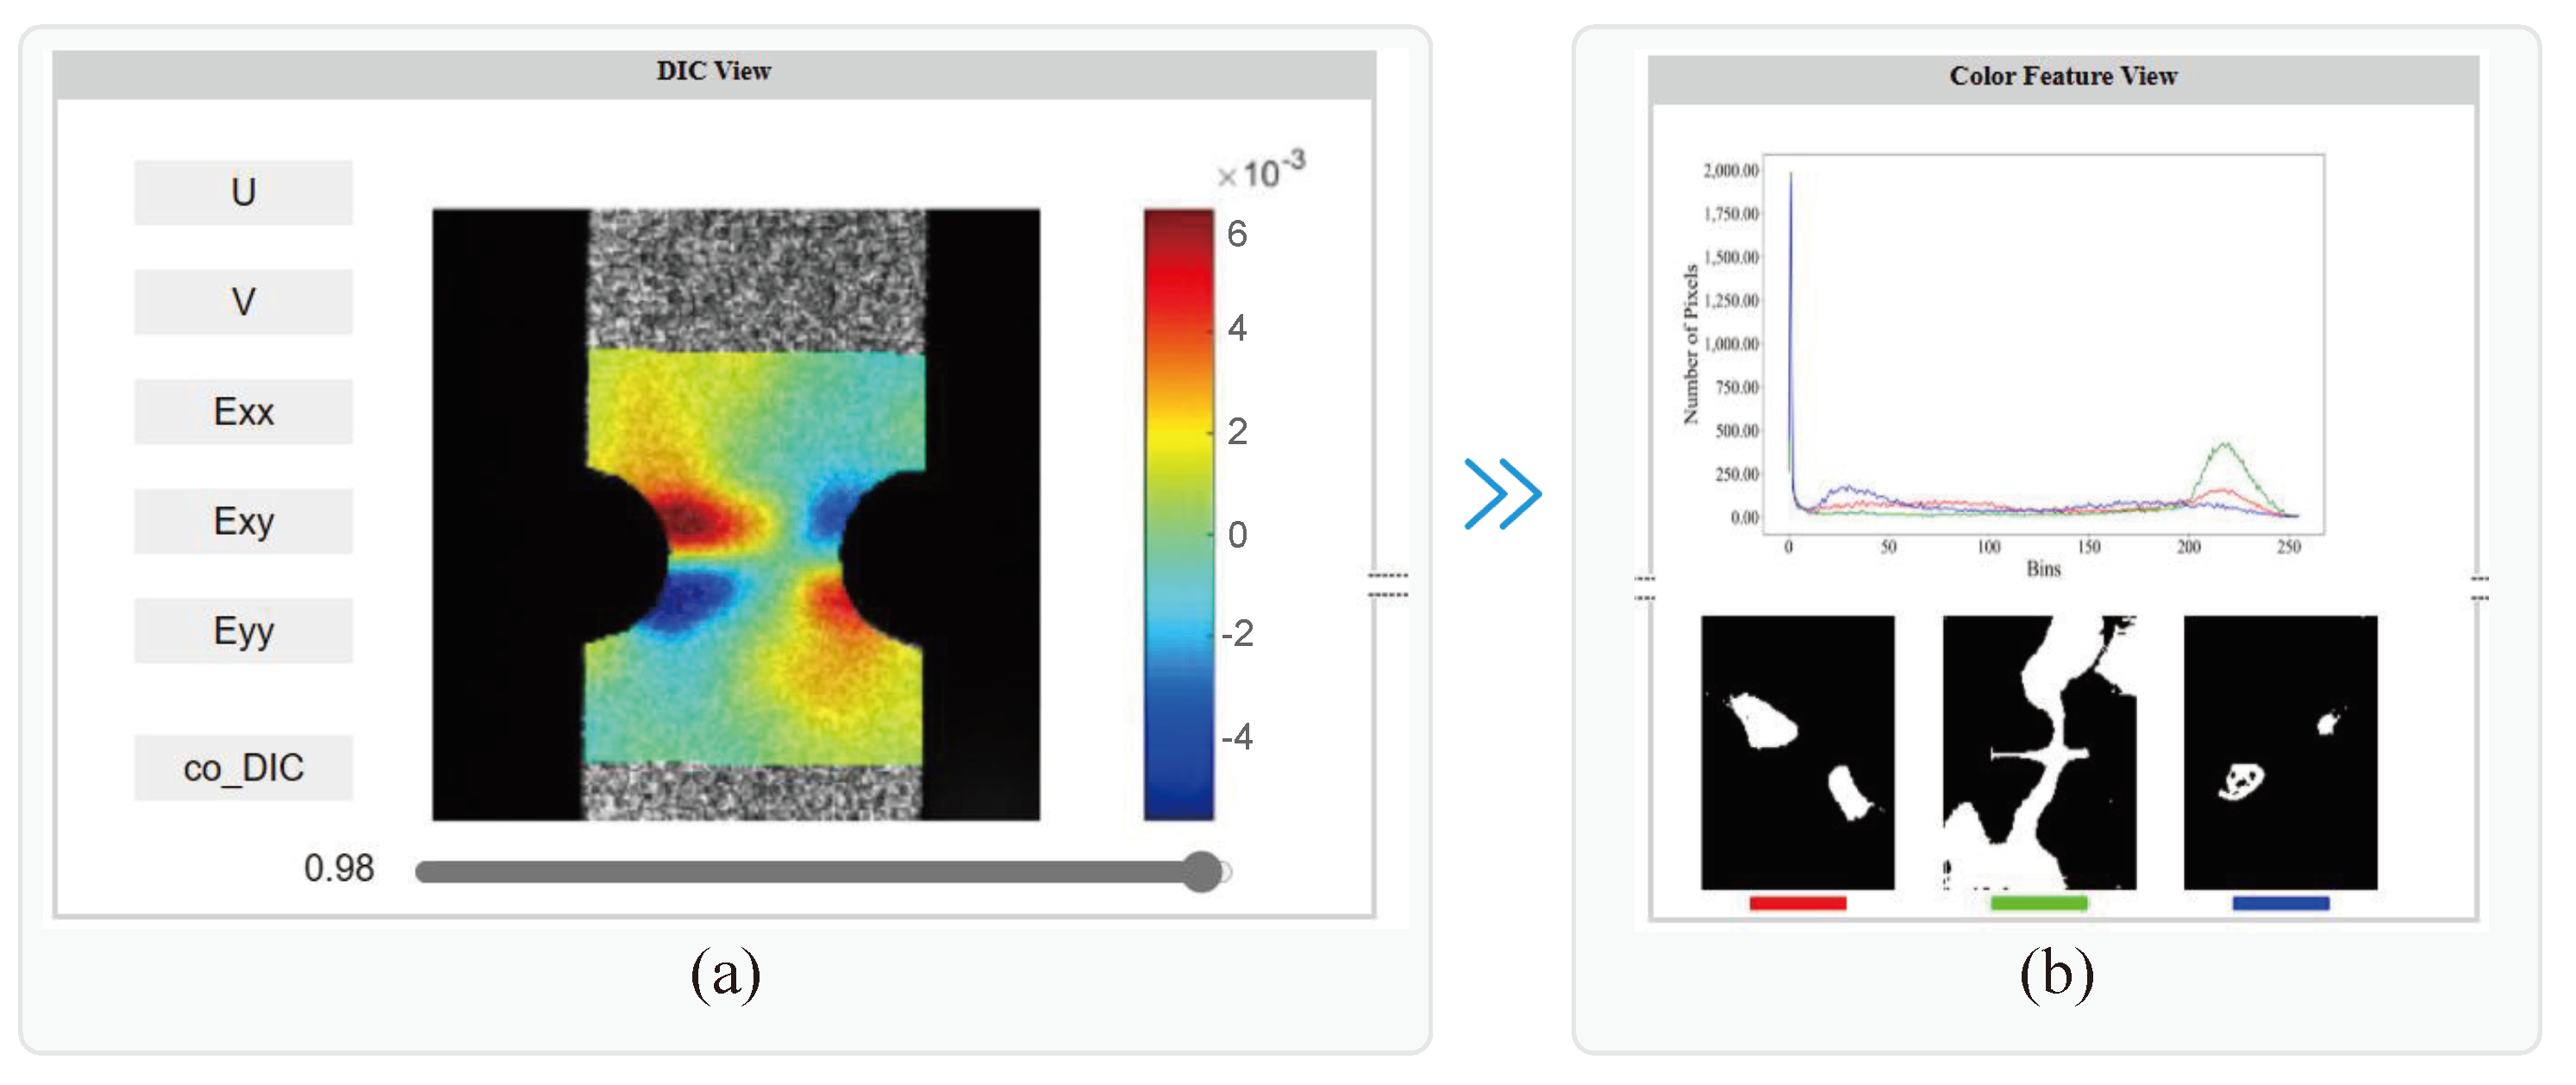
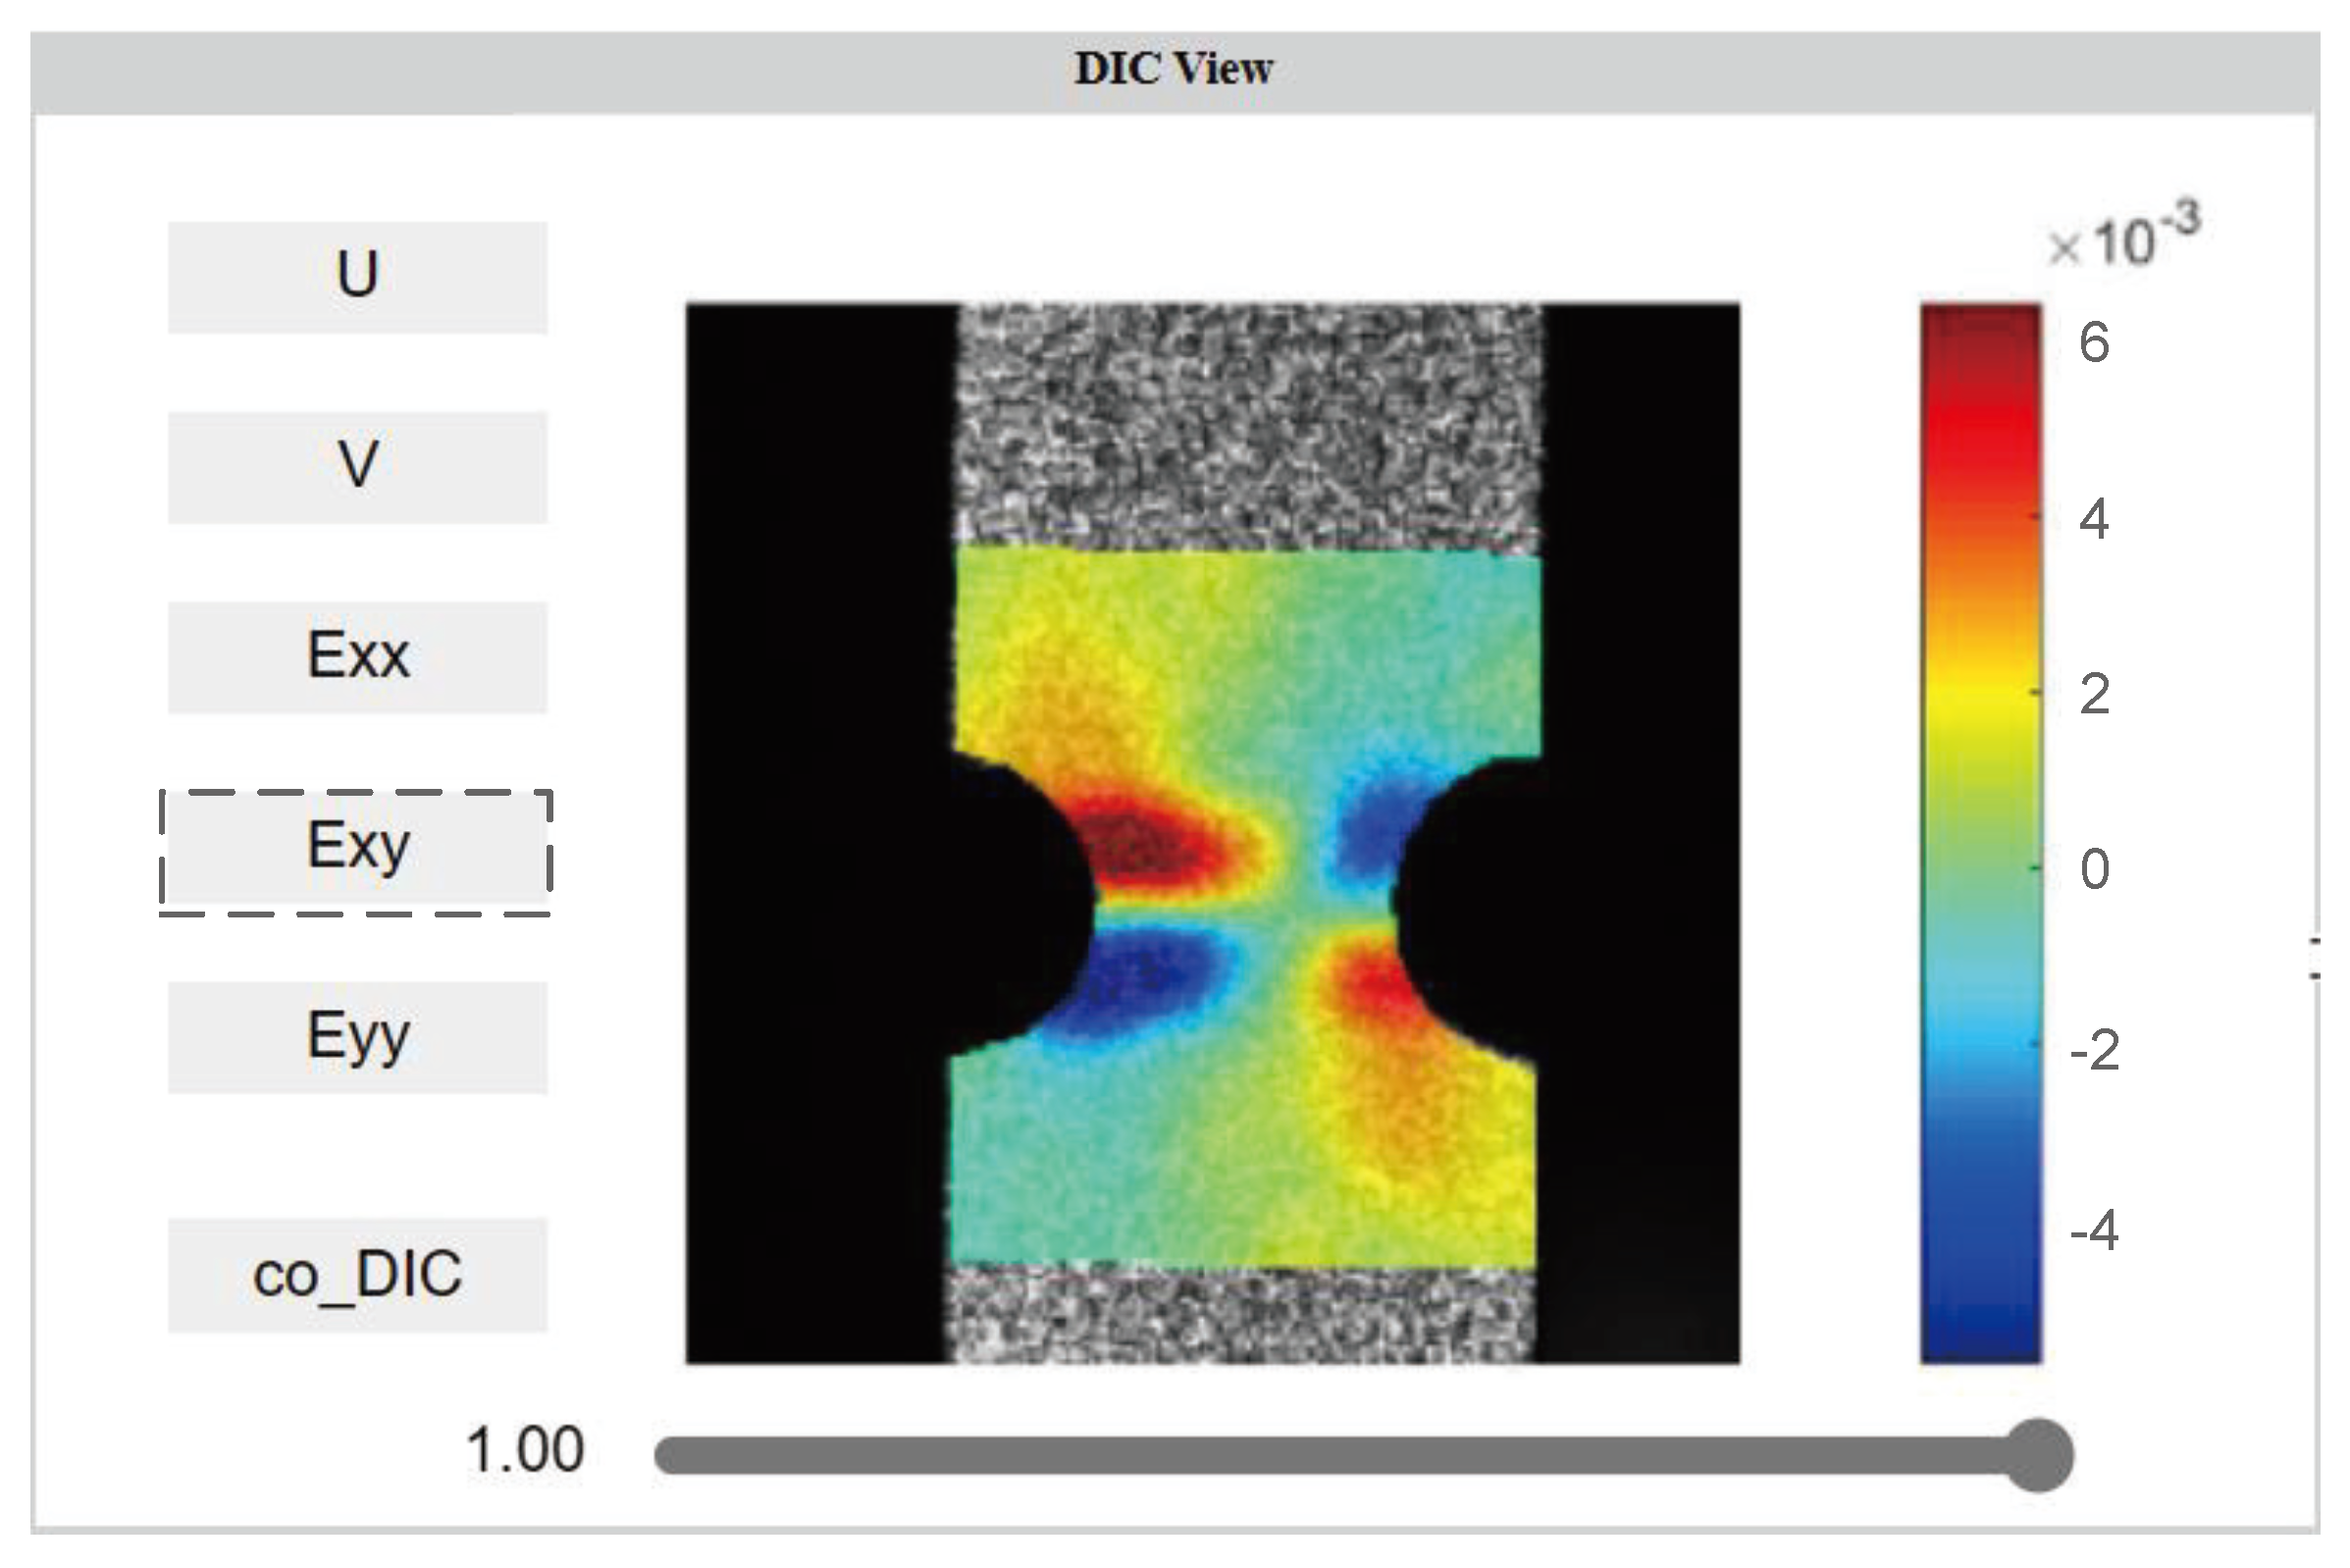
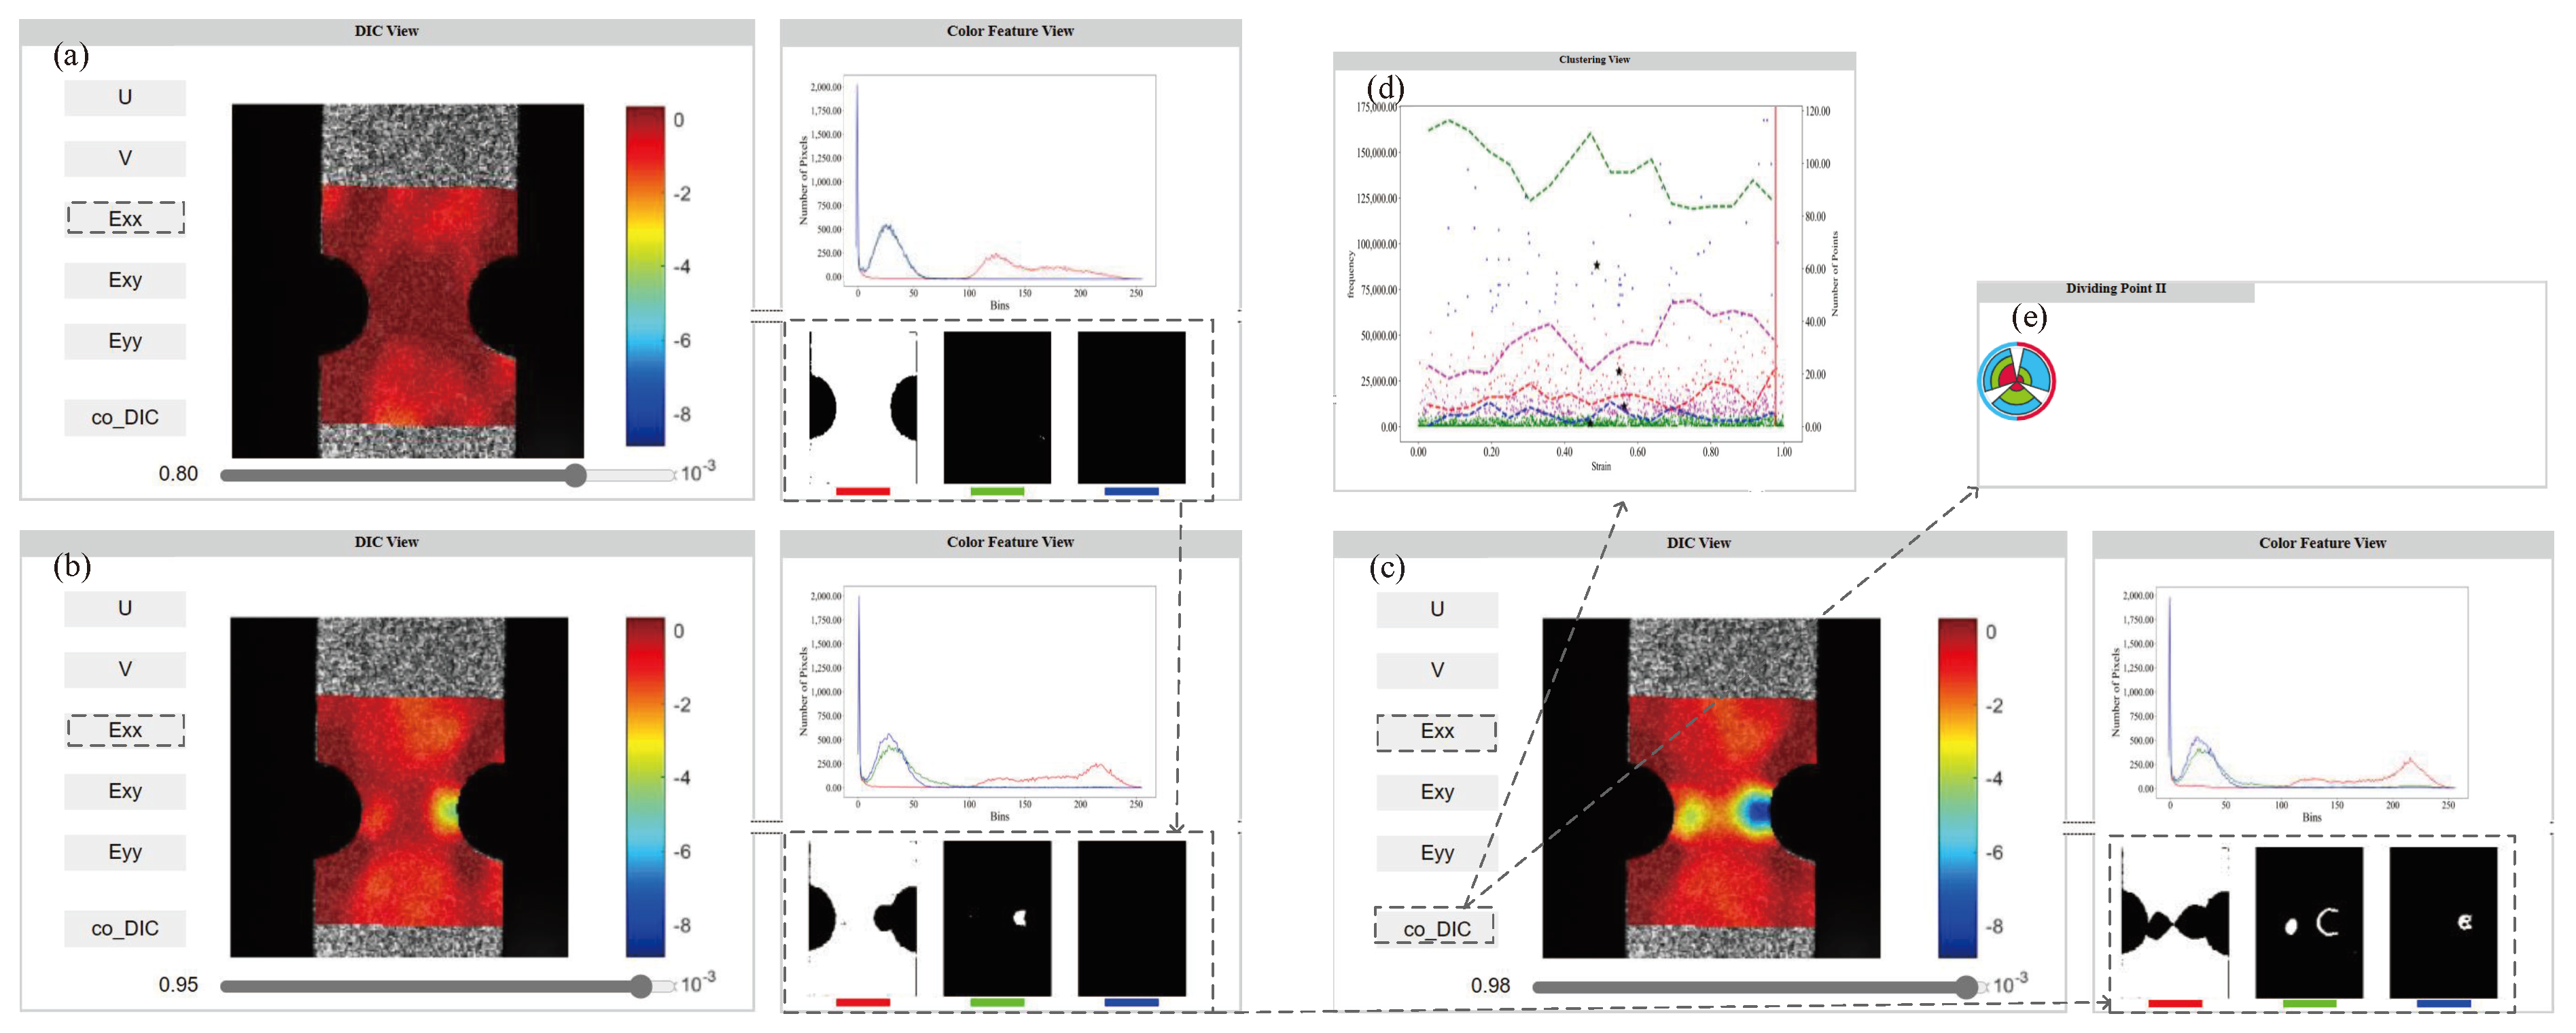
  • The DIC analysis area (Figure 1e,f) allows users to explore the details of DIC images at different levels of damage (T3, T5);
  • The fusion analysis area (Figure 1d,g) provides a table for users to compare different clustering results, with glyphs illustrating the trend of DIC image changes at different damage levels. At the same time, it can interactively verify the AE data breakpoint (T4, T6).
Each module’s detailed functionality is described in Section 3.3, while specific use cases are provided in Section 4.1. Considering the system’s real-time applicability as well as the effectiveness and standardization of the chart design, the front-end is programmed in JavaScript ES5, partially utilizing the ECharts.js data visualization library [37], while the back-end is developed in Python 3.10 using the Matplotlib 3.6.3 [38] and Sklearn 1.2.1 packages. Lastly, we evaluate the effectiveness of the system through a case study and a user study involving domain experts.

3.2. Data Description

The timing and methods used for acquiring material damage information have varying degrees of impact on the results of material damage analysis. To minimize the analysis errors caused by these factors, we selected damage data from acoustic emission and image-based damage for two materials which are two-dimensional woven laminate composites with opposing morphological characteristics as follows: a concave shape on the central side (Figure 3a) and a perforated center (Figure 3b). The damage data for both materials were collected using the same testing machine (Figure 3c), employing a unidirectional tensile loading behavior. The maximum loading capacity of the testing machine used was 10 kN, and the loading rate remained constant at 2 mm/min throughout the entire stretching process.
The data used in this study were collected based on the machine and indicator specifications mentioned above. The visual analytics system can be applied to the force damage data analysis of any composite material as long as it has AE and DIC data associated with force loading in non-destructive testing.

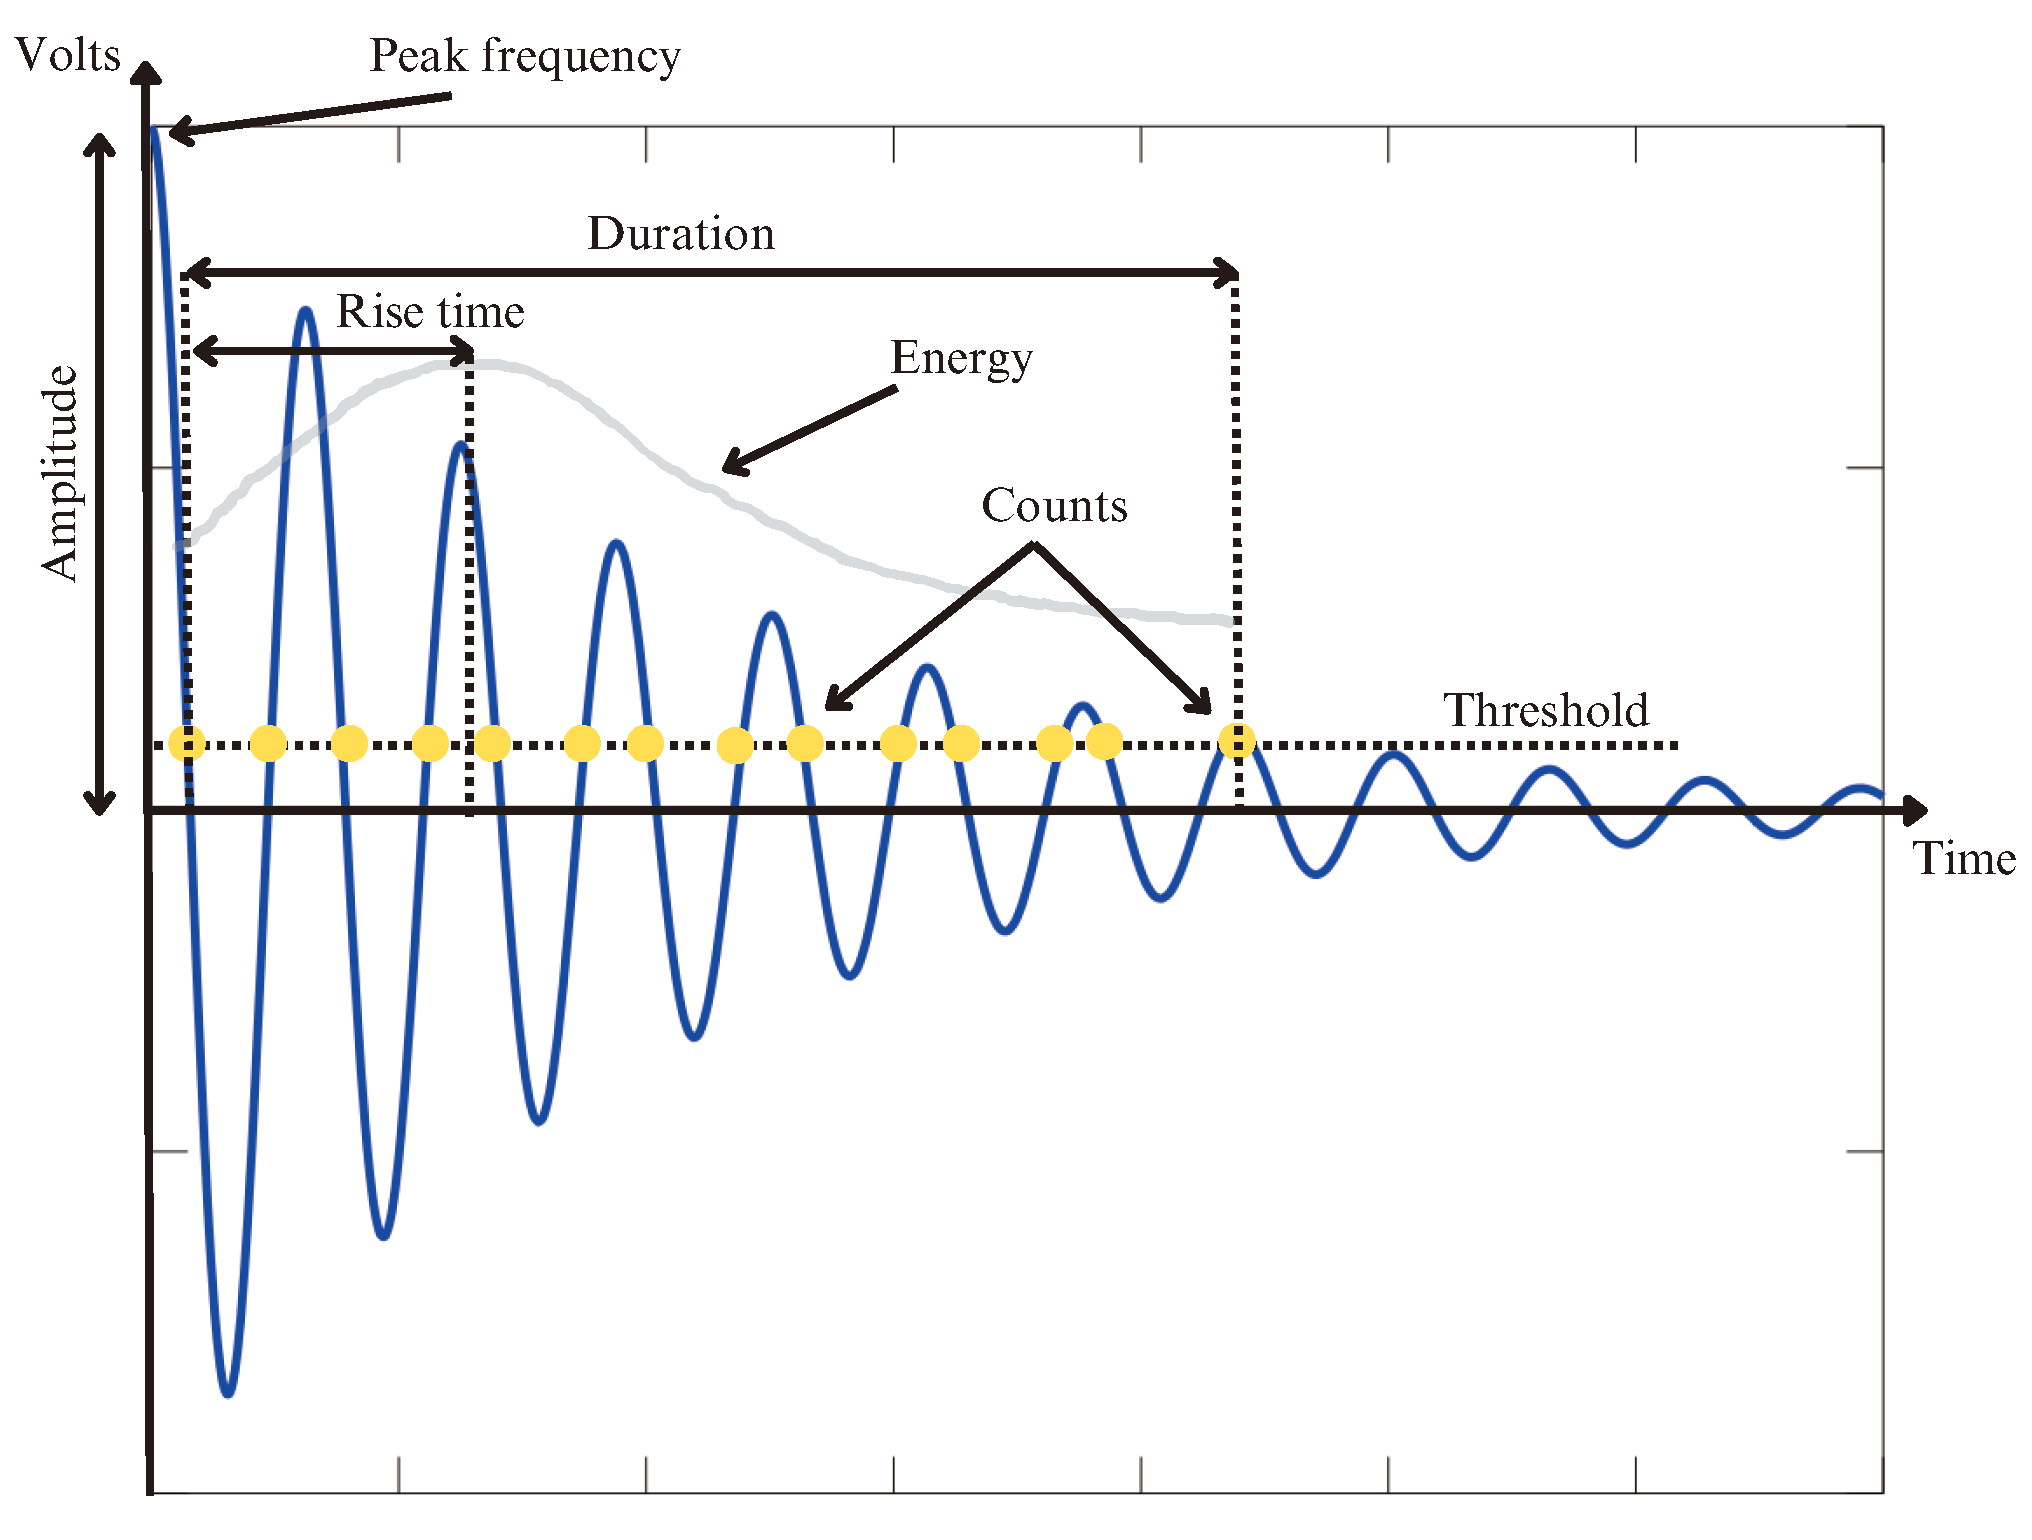
3.2.1. AE Feature Extraction

To ensure the features of the AE signal’s quality, the AE data were recorded using identical AE sensors, which were adhered to the specimen’s front surface by thermal bonding. The sensor model used was the PXR50 (Changsha Pengxiang Electronics Technology Co., Ltd., Changsha, China), a resonant-type sensor with a resonance frequency of 500 kHz and a frequency bandwidth of 300–1000 kHz. The signal amplifier model used was the PXPA3 (Changsha Pengxiang Electronics Technology Co., Ltd., Changsha, China), providing a fixed gain of 40 dB (100 times signal amplification) and a bandwidth of 4 kHz to 2 MHz. Among the most crucial equipment for AE signal collection experiments is the signal acquisition instrument, which consists of a PXI 1033 (National Instruments, Austin, TX, USA) chassis and a two-channel PXI 5122 (National Instruments, Austin, USA) high-speed digitizer board. Before AE data extraction, we conducted pencil lead breakage tests following the ASTM-E976 standards [39] to calibrate the AE measurement. The obtained AE data were continuously monitored and recorded, capturing AE signals from the application of loading to the point of material failure. We obtained sound signal features from each AE event [40,41], and, as illustrated in Figure 4, the features of individual AE events were extracted.
Additionally, to ensure the completeness of the material’s dynamic response features and to further analyze the material performance changes and failure mechanisms, we constructed some extended parameters for AE data as follows:
Peak frequency is the frequency with the highest amplitude after using fast Fourier transform (FFT) to analyze signal coefficients within its frequency domain. A low peak frequency is associated with matrix cracking, while a high peak frequency is related to fiber damage.
The RA value is the ratio of the Rise Time to the Amplitude of the AE signal. The RA value under tensile failure conditions is smaller than that under shear failure conditions. The calculation method for the RA value is expressed by Equation (1).
R A = R i s e T i m e A m p l i t u d e , ms / V
The RMS value is the root mean square value of the AE signal over the sampling time. The larger the RMS value, the higher the energy released by the AE events, which may correspond to more severe material damage. The calculation method for the RMS value is expressed by Equation (2).
R M S = 1 T 0 T ( p ( t ) ) 2 d t
where, p ( t ) represents the function of the signal amplitude as it varies with time, and T represents the observation time.
Peak frequency is more decisive for AE features, as it is unaffected by the sensor’s position. Both RA and RMS values are unaffected by the threshold and are useful in evaluating the mechanisms and extent of material damage.

3.2.2. DIC Feature Extraction

Assessing the degree of damage through the measurement of full-field displacement and strain in specimens represents a widely accepted paradigm of the DIC method. The DIC method typically employs the application of a speckle pattern on the material surface, with the difference in displacement before and after loading serving as an effective means to monitor the progression of specimen damage. Our DIC data were obtained using a camera with a resolution of 12 million pixels to capture the planar displacement and deformation of the specimen, with measurement accuracy ensured by a deviation of less than 0.05 pixels.
Ncorr (https://www.ncorr.com/ (accessed on 15 December 2024)) [42] is an effective software for processing the speckle images captured by the camera. After processing, it generates five displacement and strain images, namely the U, V, E x x , E x y , and E y y images. Among them, U and V represent the displacement amounts in the x and y directions of each pixel, which are usually used to calculate the relative displacement difference between each point. E x x and E y y represent the tensile strains in the x and y directions, respectively, while E x y represents the shear strain in the x y plane. By visualizing the variations in the aforementioned images, the damage progression of the material can be more effectively assessed.

3.2.3. Force Loading

AE data and DIC data represent two different modalities, and there are no common features between them. The two types of modal data used in this study were acquired under the same experimental conditions, which ensures a correlation between the data exists, namely, force loading. Force loading refers to the process of applying a force to a material or structure. With the variation of the force loading, the features of the AE data and DIC data also change. Therefore, in this study, force loading is used to align the features of the AE data and DIC data for the subsequent fusion analysis.

3.3. Visual Design Method

3.3.1. AE Analysis Views

Building on expert insights, we design a procedure specifically designed for AE feature analysis, beginning with the representation of correlations between various sound signal features, for which we used Pearson’s correlation coefficient (as shown in Equation (3)) to measure the correlation. The method first selects a few representative features used for PCA dimensionality reduction, it then clusters the high-dimensional features based on the principal component coefficients to obtain the clustering results. Finally, by comparing the results of multiple clusters, the accuracy of the damage pattern recognition is improved.
r x y = i = 1 n ( x i x ¯ ) ( y i y ¯ ) i = 1 n ( x i x ¯ ) 2 i = 1 n ( y i y ¯ ) 2
To visualize feature relationships, we design a correlation matrix in the form of a feature correlation heatmap (Figure 5a) to show the correlation between all pairs of features, with darker squares indicating stronger correlations between features. Users can click on any independent small square to generate a scatter histogram in the feature detail view (Figure 5b) and examine the detailed distribution of any pair of features. After comparing and analyzing the importance of each feature, the preliminary feature selection is complete, and users can interactively add or remove corresponding features by clicking checkboxes to further reduce the dimensionality of the feature set using PCA. In the PCA view (Figure 5c), the size of the principal component coefficients is still represented by color depth, and we also list the cumulative contribution rate under different numbers of principal components in the lower half. Finally, we can select the most representative features in the AE feature set for the clustering analysis (Figure 5d). Before obtaining the clustering results, we allow users to select two effective clustering methods and specify different numbers of clusters and iteration times.
We implemented two clustering methods, one of which is the fuzzy C-means (FCM) algorithm, frequently used in previous studies. Since traditional K-means clustering is highly dependent on the selection of initial cluster centers, we also adopted another clustering method, K-means++, which improves the selection of initial centroids for the K-means algorithm. The core idea of K-means++ is that when selecting a new cluster center, the farther a point is from the existing centers, the higher the probability of it being chosen as a new cluster center. In the clustering view, the scatter plots corresponding to each category are distinguished by different colors, and we draw line graphs for the number of interval scatter plots for each category. By showing the trend of changes in the number of scatter plots for each category, potential damage patterns can be identified.
To overcome the difficulties experts face in understanding and comparing the quality and effectiveness of different clustering results through visualizations, distinct evaluation metrics are selected for the two clustering algorithms. We chose the Xie-Beni index as the effectiveness evaluation index of the FCM algorithm, with smaller values indicating better clustering effects (as shown in Equation (4)).
X B = i = 1 N j = 1 C ( u i j ) m D i s t a n c e 2 ( x i , v j ) k = 1 C j = 1 N ( u k j ) m D i s t a n c e 2 ( x j , v k )
where, N refers to the number of samples, C represents the number of clusters, u i j represents the degree of membership of the i-th sample in the j-th cluster center, m is the fuzziness parameter (usually set to 2), x i represents the i-th sample, v j represents the j-th cluster center, and Distance ( x i , v j ) represents the Euclidean distance between these two vectors x i and v j .
For the K-means ++ algorithm, we used the Silhouette coefficient to measure the quality of its clustering, with a larger S C representing a more reasonable sample clustering result (as shown in Equation (5)).
S C = 1 n i = 1 n b i a i m a x ( a i , b i )
for the i-th sample, a i represents the average distance between i and all other samples within its belonging cluster, and b i represents the minimum average distance between i and all other samples outside its belonging cluster.

3.3.2. DIC Analysis Views

For DIC image data, experts seek the most intuitive way for observing the trend of variation in material damage. Conventional methods for visualizing the displacement and strain images of materials are limited in interactivity but also consume extensive visual space. To address this issue, a draggable progress bar design (blue bar in Figure 6a) is selected to enable users to better explore and monitor changes in the damaged state of the material. In addition, image segmentation techniques are employed to extract the color distribution features from each DIC image, dynamically displaying the evolution trend of material damage.
The DIC view (Figure 6a) in the system provides users with strain and displacement maps in multiple directions, allowing them to manipulate a progress bar to observe changes in the DIC images throughout the damage process, thereby facilitating an initial understanding. Subsequently, image segmentation techniques are employed to highlight regions corresponding to three distinct colors (Figure 6b), each representing a different degree of deformation as follows: severe (red), moderate (green), and slight (blue). This approach provides a more detailed representation of the damage distribution. To assist users in pinpointing the onset of damage instability, a color histogram is also displayed for the area surrounding the damage crack in each DIC image (Figure 6b). The X-axis of the histogram represents the color values, while the Y-axis indicates the frequency of each color value. The height of the histogram reflects the proportion of corresponding color pixels within the entire image. By examining the image with the most significant variation in color values, users can gain further insights into the damage details.

3.3.3. Fusion Analysis Views

The correlation between various NDE methods is low. Through a review of the literature on multimodal information fusion [43,44] and an analysis of data characteristics, we use a physical layer fusion approach, combining the features of AE and DIC data during the loading process. This approach is based on the high degree of correlation observed between data from both modalities when simultaneously collected from the same material during the applied loading process. By integrating AE and DIC data, the results from individual NDE methods can be cross-verified. For example, the boundary points between damage levels II and III, determined by DIC image feature analysis, can be further confirmed through the AE feature clustering diagram. Cross-validation of the data requires a comparison and retrospective analysis of both AE and DIC data. To address this issue, we propose a method that allows relevant information to be retained after performing analysis with single-modal non-destructive testing techniques, enabling the further verification of the damage patterns (as shown in Figure 7).
The AE data analysis helps delineate the boundaries of the three damage stages in the material. After the user completes each feature clustering, the relevant information can be exported to a spreadsheet (Figure 7b,c). In addition to the initial clustering data, each result row includes the boundaries of each category as well as the validity indicators, facilitating the comparison of the clustering results.
When integrating DIC data, to reduce visual complexity [45], we have designed composite graphics to represent the DIC states, which also allow for the preservation of the DIC state images. The inner layer of the graphic represents three types of strain information, with the stacked bar charts in polar coordinates effectively reflecting the deformation of the DIC images corresponding to different levels of damage (Figure 7a,c Dividing Point I). Each small sector in the graphic corresponds to three segmented regions, with a larger relative radius indicating a larger damaged area. To distinguish displacement from strain information, two semicircular arcs are designed in the outer layer, where the color of the arc represents the overall displacement trend. Red indicates maximum displacement and strain, while blue represents the opposite.
After in-depth discussions with domain experts, we determined that using AE features to define the first boundary and DIC features to define the second boundary is the most appropriate approach. Moreover, mutual validation between the two methods can further improve the accuracy of the results. The system design compares color histograms in the vicinity of the damaged crack region and interacts with the DIC damage state graphic (Figure 7a–c Dividing Point II). This triggers the appearance of a red line on the AE clustering graph (Figure 7c Dividing Point II to Figure 7b), which corresponds to the damage level, thereby enabling an AE-based validity check for the second boundary point.

4. Evaluation and Discussion

To assess the effectiveness of the system, we have selected the center side concave material (Figure 3a) mentioned earlier for a case study, aiming to reflect the achievement of visualization objectives in the relevant domain. We used the center perforated material (Figure 3b) in a user study to evaluate the effectiveness of visualizing and analyzing multimodal NDE data.

4.1. Case Study

As shown in Figure 8, in the correlation heatmap view of AE data from both sides of the recessed material, the closer the value in the red blocks is to 0, the weaker the correlation between the two features, and conversely, the stronger the correlation. By clicking on a block, the AE event relationships between the two features in the feature detail view is displayed. It can be observed that features such as “peak_volt” and “RMS” exhibit a strong correlation. We select features with weak correlations for principal component analysis. By selecting AE features (frequency, duration, peak_volt, rise_time, and peak_frequency) to compare with the lower panel and clicking the PCA button, we can observe which feature is more dominant in the PCA view. As shown in Figure 8, the peak_volt feature, with a max value of 0.7 points, from both recessed materials is the most dominant. The frequency of 0.69 is closer.
Furthermore, by selecting the peak_volt feature and frequency feature for clustering, clustering views can be obtained, as shown in Figure 9, where the trend of AE events can be seen. As shown in Figure 9, the change points in the multiple-line plots represent anomalous variations in AE events (the red box area). We can save and evaluate the current clustering features by clicking the CO-AE button, resulting in an SC value of 0.81 and an Xie-Beni value of 2.49, respectively, indicating good clustering performance. Upon observing the anomalous variation in the force loading, we select the anomalous points within the range of 0.2–0.3 for further analysis. By clicking the “choose” button in Figure 9 and entering the force loading value of 0.23 or 0.25, five pattern plots are generated in the Dividing Point I view. Examining these plots reveals a distinct red state on the outer arc in one plot, indicating that severe material damage occurred near a force stroke of 0.23. The clustering results of two kinds of AEs show that material damage occurs near a force loading of 0.23, and the trend of damage events can be seen from the subsequent AE curves.
In the following, we examine the characteristics of material damage during the second phase using DIC data. By observing the changes in the DIC images, more intuitive information on deformation trends can be obtained. As shown in Figure 10, by examining the colored feature views of U, V, E x x , E x y , and E y y , the corresponding material damage features can be identified in each image. Increasing the force loading value to 1 reveals significant deformation in the E y y direction (see Figure 10).
Compared with the E x x direction change process, when the force loading is 0.8, 0.95, and 0.98 (see Figure 11a–c), the image shows that the material has been severely damaged at a loading of 0.95–0.98. The red feature view shows the obvious morphological change of damage in the two concave parts of the material, and the white area in the green and blue views also verifies this. Clicking the CO_DIC button at a force loading 0.98 gives the graph of Dividing Point II (Figure 11e), indicating the occurrence of severe damage to the material. Clicking on this graph alternately generates red status lines in the acoustic emission event cluster diagram (Figure 11d), verifying the drastic change of AE events. This completes the interactive exploration of both AE and image modality data. Repeating observations, the damage evolution of the material in the regions of the two-sided depressions can be analyzed. The results show that the damage initiation stage occurs at a force loading of 0.23, a damage evolution stage of 0.65–0.98, and an instability stage of 0.98–1.
After the material experts completed the case study, we arranged a follow-up informal interview to conduct a detailed evaluation of the design of our visualization system. Overall, the expert considered that our solution analyzes the trends of material damage (AE data, DIC data) interactively, supporting multimodal data interaction for verifying material damage stages while being more intuitive and convenient compared to previous tools.
E0 commented on the innovative quality of the processing of DIC images in the system, which helps users judge the trend of crack propagation. Furthermore, they noticed the color consistency during AE feature reduction, which improves visual perception, adding that overemphasizing color consistency could lead to information ambiguity when fusing different views. In terms of interactivity, the system has minimized the input fields as much as possible. For example, in the feature correlation heatmap view, it allows users to obtain feature details by directly clicking on each small square instead of selecting feature inputs, which further enhances the experience.
Finally, the domain experts stated that they were able to quickly obtain the desired damage characteristic information for different datasets using this system. Furthermore, they hope for the incorporation of more modal data into the system to perform more comprehensive damage detection work. E0 also noted that the number of extracted features was still relatively limited, and the system would face challenges in multimodal information fusion when dealing with a higher number of features. Furthermore, the system should not be limited to the visual methods already adopted, and supporting adaptive selection could be used to optimize the system.

4.2. User Study

Our visual analytics system offers a promising method for analyzing multimodal data in the context of material damage. The purpose of this study was twofold as follows: to evaluate the effectiveness of our system in facilitating the proposed visualization tasks, and to obtain user feedback on the usefulness of our visual design. We recruited a cohort of 10 students between the ages of 22 and 27 (7 male, 3 female) with a mean age of 24.5 years (standard deviation of 1.23). These participants consisted of both master’s and doctoral students in the field, with a background in materials science and normal or corrected-to-normal vision.
Each session lasted approximately 20 min and was conducted on a 15.6-inch ASUS TUF Gaming F15 laptop. The first 5 min were spent explaining the visualization system, followed by 15 min of free exploration. Participants then had 10 min to complete a series of six tasks designed to utilize all visual components and reflect the full range of visualization tasks outlined in Section 4. We recorded the time it took participants to complete each task from the start to write down their responses. The visualization system was reset before each task. Finally, we administered a survey to each participant.
In Figure 12, we present a description of each user’s tasks and completion times. All participants completed each task within 53 s, with an average completion time of less than 34 s. Specifically, for UT1 and UT3, participants quickly grasped the essence of the problem and completed the tasks quickly, while for UT2, UT4, and UT6, they needed further familiarization with the operational flow before completing the tasks. We observed a significant increase in completion time for UT5 compared to the other tasks, primarily due to its greater complexity.
The questionnaire was designed to evaluate the usefulness of our system and to collect explicit feedback on the visual design. Using the suggestions provided by E0, we developed six questions as shown in (Figure 13) to ensure validity. We used histograms with error bars to show the mean and standard deviation of each question. Overall, all participants agreed that our system is useful for multimodal analysis tasks related to material damage (Q1). For AE analysis (Q2, Q3), the average rating for our system was 4.2 out of 5, which is very encouraging. Our participants were satisfied with the feature selection and clustering processes, and the evaluation of the DIC view (Q5) was also positive. However, there was mixed feedback on the views within the fusion analysis area (Q6), with some debate as to whether AE features should be included in a glyph design. Participants’ satisfaction with the color feature view corresponding to the damage (Q4) was low. They stated that they were not very familiar with the color feature view and somewhat misunderstood damage tracing.
Regarding the representation of AE features using glyphs, we conducted an analysis. The original glyphs consisted of DIC features, and users interacted with the glyphs to observe the AE feature information associated with the corresponding damage degree in the cluster view. If AE features are incorporated into the glyphs, the need to return and observe AE features in the current state would render the inclusion redundant, which we believe is not a favorable approach.
Concerning the issue of the color feature view, we have thoroughly analyzed the feedback. The primary challenge lies in the difficulty users faced when interpreting the overlapping color lines, particularly in states where damage was not immediately obvious. This can lead to misinterpretations, especially among new users. To address this, we plan to potentially add more prominent visual cues to the color feature view when state changes occur. These enhancements would provide clearer guidance, helping users better explore and understand state transitions.
In summary, the case studies and user studies have demonstrated that our method offers an efficient interactive solution for experts in the field of composite non-destructive testing, facilitating multimodal data analysis. The design of the view fits perfectly with the functional requirements for AE and DIC data fusion analysis, providing valuable insights for the interactive assessment of multimodal damage in composite materials.

5. Conclusions

In this article, we proposed NDEExplorer, a visual analytics system that can perform the interactive analysis of multimodal data, allowing users to explore material damage processes using two NDE methods, AE and DIC. Through an iterative design process with domain experts, we identified specific analysis goals for the domain and applied the appropriate methods to extract relevant data. In addition, we derived a set of visualization tasks to guide our design. We conducted two studies to evaluate our system. In-depth case studies with domain experts and novice users demonstrated the effectiveness of our approach in achieving the analysis goals, in line with existing theories, providing further contributions. Through our user studies, we demonstrated the system’s ability to support visual analytics and visualization tasks related to material damage detection. In response to the passive visualization techniques used in the majority of existing research, our interactive analysis system effectively supports the increasing analysis needs in materials science.
The results show that our system is more intuitive and efficient than traditional methods. The force loading method in this paper solves the fusion analysis problem of the multimodal NDE analysis method and has a guiding value. Our method reduces the analysis difficulty of NDE analysis and increases analytical efficiency. It is helpful to judge the damage stage mode of NDE, and this is of great value to the research on the damage characteristics of composite materials.
As our research progresses, we plan to (a) develop more appropriate algorithms to extract additional acoustic and optical features to further enrich the single NDE analysis process and improve accuracy, and (b) add adaptive selection algorithms when judging damage stages and improve the visualization design to reduce the cognitive load on users. We also plan to extract damaged datasets from more complex composite materials for experimentation to further optimize our system.

Author Contributions

Conceptualization, D.G. and L.Z.; methodology, L.Z.; software, X.L.; validation, D.G., L.Z. and X.L.; formal analysis, L.Z. and X.L.; investigation, L.Z. and X.L.; resources, L.Z. and X.L.; data curation, L.Z. and X.L.; writing—original draft preparation, L.Z. and X.L.; writing—review and editing, L.Z.; visualization, L.Z. and X.L.; supervision, D.G.; project administration, D.G.; funding acquisition, D.G. All authors have read and agreed to the published version of the manuscript.

Funding

This work was supported in part by the National Science Foundation of China under Grant 61802334, the Natural Science Foundation of Hebei Province under Grant F2022203015, and the Innovation Capability Improvement Plan Project of Hebei Province under Grant 22567637H.

Institutional Review Board Statement

Not applicable.

Informed Consent Statement

Not applicable.

Data Availability Statement

The original contributions presented in this study are included in the article. Further inquiries can be directed to the corresponding author.

Conflicts of Interest

The authors declare no conflicts of interest. The funders had no role in the design of the study; in the collection, analyses, or interpretation of data; in the writing of the manuscript; or in the decision to publish the results.

References

  1. Hsissou, R.; Seghiri, R.; Benzekri, Z.; Hilali, M.; Rafik, M.; Elharfi, A. Polymer composite materials: A comprehensive review. Compos. Struct. 2021, 262, 113640. [Google Scholar] [CrossRef]
  2. Lunetto, V.; Galati, M.; Settineri, L.; Iuliano, L. Sustainability in the manufacturing of composite materials: A literature review and directions for future research. J. Manuf. Process. 2023, 85, 858–874. [Google Scholar] [CrossRef]
  3. Ozturk, F.; Cobanoglu, M.; Ece, R.E. Recent advancements in thermoplastic composite materials in aerospace industry. J. Thermoplast. Compos. Mater. 2024, 37, 3084–3116. [Google Scholar] [CrossRef]
  4. Awaja, F.; Zhang, S.; Tripathi, M.; Nikiforov, A.; Pugno, N. Cracks, microcracks and fracture in polymer structures: Formation, detection, autonomic repair. Prog. Mater. Sci. 2016, 83, 536–573. [Google Scholar] [CrossRef]
  5. Wang, P.; Yang, J.; Liu, W.; Tang, X.Z.; Zhao, K.; Lu, X.; Xu, S. Tunable crack propagation behavior in carbon fiber reinforced plastic laminates with polydopamine and graphene oxide treated fibers. Mater. Des. 2017, 113, 68–75. [Google Scholar] [CrossRef]
  6. Chaki, S.; Bourse, G. Guided ultrasonic waves for non-destructive monitoring of the stress levels in prestressed steel strands. Ultrasonics 2009, 49, 162–171. [Google Scholar] [CrossRef]
  7. Yin, X.; Hutchins, D.A.; Diamond, G.G.; Purnell, P. Non-destructive evaluation of concrete using a capacitive imaging technique: Preliminary modelling and experiments. Cem. Concr. Res. 2010, 40, 1734–1743. [Google Scholar] [CrossRef]
  8. Niezrecki, C.; Baqersad, J.; Sabato, A. Digital image correlation techniques for non-destructive evaluation and structural health monitoring. In Handbook of Advanced Non-Destructive Evaluation; Springer: Berlin/Heidelberg, Germany, 2018; p. 46. [Google Scholar]
  9. Nsengiyumva, W.; Zhong, S.; Lin, J.; Zhang, Q.; Zhong, J.; Huang, Y. Advances, limitations and prospects of nondestructive testing and evaluation of thick composites and sandwich structures: A state-of-the-art review. Compos. Struct. 2021, 256, 112951. [Google Scholar] [CrossRef]
  10. Zhang, Y.; Zhou, B.; Yu, F.; Chen, C. Cluster analysis of acoustic emission signals and infrared thermography for defect evolution analysis of glass/epoxy composites. Infrared Phys. Technol. 2021, 112, 103581. [Google Scholar] [CrossRef]
  11. Wang, L.S.; Huang, Z.M. On strength prediction of laminated composites. Compos. Sci. Technol. 2022, 219, 109206. [Google Scholar] [CrossRef]
  12. Wang, B.; Zhong, S.; Lee, T.L.; Fancey, K.S.; Mi, J. Non-destructive testing and evaluation of composite materials/structures: A state-of-the-art review. Adv. Mech. Eng. 2020, 12, 1687814020913761. [Google Scholar] [CrossRef]
  13. Andraju, L.B.; Raju, G. Damage characterization of CFRP laminates using acoustic emission and digital image correlation: Clustering, damage identification and classification. Eng. Fract. Mech. 2023, 277, 108993. [Google Scholar] [CrossRef]
  14. Miao, S.; Pan, P.Z.; Zhao, X.; Shao, C.; Yu, P. Experimental study on damage and fracture characteristics of Beishan granite subjected to high-temperature treatment with DIC and AE techniques. Rock Mech. Rock Eng. 2021, 54, 721–743. [Google Scholar] [CrossRef]
  15. Sachse, W.; Kim, K.Y. Quantitative acoustic emission and failure mechanics of composite materials. Ultrasonics 1987, 25, 195–203. [Google Scholar] [CrossRef]
  16. Rishikesan, V.; Chaturvedi, B.; Arunachalam, N. Characterisation of drilling-induced damage in GFRP Honeycomb Sandwich Composites using Acoustic Emission. Procedia Manuf. 2021, 53, 664–672. [Google Scholar]
  17. Pei, N.; Zhou, S.; Xu, C.; Shang, J.; Wu, Q. Cluster analysis of acoustic emission signals for tensile damage characterization of quasi-static indented carbon/glass fiber-reinforced hybrid laminate composites. Compos. Part A Appl. Sci. Manuf. 2021, 150, 106597. [Google Scholar] [CrossRef]
  18. Huguet, S.; Godin, N.; Gaertner, R.; Salmon, L.; Villard, Y.D. Use of acoustic emission to identify damage modes in glass fibre reinforced polyester. Compos. Sci. Technol. 2002, 62, 1433–1444. [Google Scholar] [CrossRef]
  19. Sause, M.G.; Gribov, A.; Unwin, A.R.; Horn, S. Pattern recognition approach to identify natural clusters of acoustic emission signals. Pattern Recognit. Lett. 2012, 33, 17–23. [Google Scholar] [CrossRef]
  20. Fotouhi, M.; Heidary, H.; Ahmadi, M.; Pashmforoush, F. Characterization of composite materials damage under quasi-static three-point bending test using wavelet and fuzzy C-means clustering. J. Compos. Mater. 2012, 46, 1795–1808. [Google Scholar] [CrossRef]
  21. Pashmforoush, F.; Fotouhi, M.; Ahmadi, M. Acoustic emission-based damage classification of glass/polyester composites using harmony search k-means algorithm. J. Reinf. Plast. Compos. 2012, 31, 671–680. [Google Scholar] [CrossRef]
  22. Maillet, E.; Baker, C.; Morscher, G.N.; Pujar, V.V.; Lemanski, J.R. Feasibility and limitations of damage identification in composite materials using acoustic emission. Compos. Part A Appl. Sci. Manuf. 2015, 75, 77–83. [Google Scholar] [CrossRef]
  23. Caminero, M.A.; Lopez-Pedrosa, M.; Pinna, C.; Soutis, C. Damage assessment of composite structures using digital image correlation. Appl. Compos. Mater. 2014, 21, 91–106. [Google Scholar] [CrossRef]
  24. Ubaid, J.; Kashfuddoja, M.; Ramji, M. Strength prediction and progressive failure analysis of carbon fiber reinforced polymer laminate with multiple interacting holes involving three dimensional finite element analysis and digital image correlation. Int. J. Damage Mech. 2014, 23, 609–635. [Google Scholar] [CrossRef]
  25. Zhang, X.; Yang, G.; Zhan, N.; Ji, H. Gray change detection method for damage monitoring in materials. Appl. Opt. 2015, 54, 934–939. [Google Scholar] [CrossRef] [PubMed]
  26. Wang, Y.; Luo, Q.; Xie, H.; Li, Q.; Sun, G. Digital image correlation (DIC) based damage detection for CFRP laminates by using machine learning based image semantic segmentation. Int. J. Mech. Sci. 2022, 230, 107529. [Google Scholar] [CrossRef]
  27. Lomov, S.V.; Ivanov, D.S.; Verpoest, I.; Zako, M.; Kurashiki, T.; Nakai, H.; Molimard, J.; Vautrin, A. Full-field strain measurements for validation of meso-FE analysis of textile composites. Compos. Part A Appl. Sci. Manuf. 2008, 39, 1218–1231. [Google Scholar] [CrossRef]
  28. Suarez, E.; Sause, M.G.R.; Gallego, A. Influence of an optical fiber embedded on unidirectional CFRP laminates evaluated with the Acoustic Emission and 3D Digital Image Correlation techniques. In Proceedings of the Progress in Acoustic Emission XVIII, Kyoto, Japan, 5–9 December 2016; pp. 5–8. [Google Scholar]
  29. Heinzl, C.; Amirkhanov, A.; Kastner, J. Processing, analysis and visualization of CT data. In Industrial X-Ray Computed Tomography; Springer: Berlin/Heidelberg, Germany, 2018; pp. 99–142. [Google Scholar]
  30. Chen, J.; Yu, Z.; Jin, H. Nondestructive testing and evaluation techniques of defects in fiber-reinforced polymer composites: A review. Front. Mater. 2022, 9, 986645. [Google Scholar] [CrossRef]
  31. Nsengiyumva, W.; Zhong, S.; Luo, M.; Zhang, Q.; Lin, J. Critical insights into the state-of-the-art NDE data fusion techniques for the inspection of structural systems. Struct. Control Health Monit. 2022, 29, e2857. [Google Scholar] [CrossRef]
  32. Heinzl, C.; Stappen, S. STAR: Visual Computing in Materials Science. Comput. Graph. Forum 2017, 36, 647–666. [Google Scholar] [CrossRef]
  33. Weissenböck, J.; Amirkhanov, A.; Li, W.; Reh, A.; Amirkhanov, A.; Gröller, E.; Kastner, J.; Heinzl, C. FiberScout: An interactive tool for exploring and analyzing fiber reinforced polymers. In Proceedings of the 2014 IEEE Pacific Visualization Symposium, Yokohama, Japan, 4–7 March 2014; IEEE: Piscataway, NJ, USA, 2014; pp. 153–160. [Google Scholar]
  34. Zobel, V.; Stommel, M.; Scheuermann, G. Feature-based tensor field visualization for fiber reinforced polymers. In Proceedings of the 2015 IEEE Scientific Visualization Conference (SciVis), Chicago, IL, USA, 25–30 October 2015; IEEE: Piscataway, NJ, USA, 2015; pp. 49–56. [Google Scholar]
  35. Andrew, J.J.; Arumugam, V.; Bull, D.J.; Dhakal, H.N. Residual strength and damage characterization of repaired glass/epoxy composite laminates using AE and DIC. Compos. Struct. 2016, 152, 124–139. [Google Scholar] [CrossRef]
  36. Whitlow, T.; Jones, E.; Przybyla, C. In-situ damage monitoring of a SiC/SiC ceramic matrix composite using acoustic emission and digital image correlation. Compos. Struct. 2016, 158, 245–251. [Google Scholar] [CrossRef]
  37. Li, D.; Mei, H.; Shen, Y.; Su, S.; Zhang, W.; Wang, J.; Zu, M.; Chen, W. ECharts: A declarative framework for rapid construction of web-based visualization. Vis. Informat. 2018, 2, 136–146. [Google Scholar] [CrossRef]
  38. Hunter, J.D. Matplotlib: A 2D Graphics Environment. Comput. Sci. Eng. 2007, 9, 90–95. [Google Scholar] [CrossRef]
  39. ASTM E1106-21; Standard Test Method for Primary Calibration of Acoustic Emission Sensors. ASTM International: West Conshohocken, PA, USA, 2021; pp. 1–7.
  40. Roundi, W.; El Mahi, A.; El Gharad, A.; Rebiere, J.L. Acoustic emission monitoring of damage progression in glass/epoxy composites during static and fatigue tensile tests. Appl. Acoust. 2018, 132, 124–134. [Google Scholar] [CrossRef]
  41. Özaslan, E.; Yetgin, A.; Acar, B.; Güler, M.A. Damage mode identification of open hole composite laminates based on acoustic emission and digital image correlation methods. Compos. Struct. 2021, 274, 114299. [Google Scholar] [CrossRef]
  42. Blaber, J.; Adair, B.; Antoniou, A. Ncorr: Open-source 2D digital image correlation matlab software. Exp. Mech. 2015, 55, 1105–1122. [Google Scholar] [CrossRef]
  43. Baltrušaitis, T.; Ahuja, C.; Morency, L.P. Multimodal machine learning: A survey and taxonomy. IEEE Trans. Pattern Anal. Mach. Intell. 2018, 41, 423–443. [Google Scholar] [CrossRef] [PubMed]
  44. Kehrer, J.; Hauser, H. Visualization and visual analysis of multifaceted scientific data: A survey. IEEE Trans. Vis. Comput. Graph. 2012, 19, 495–513. [Google Scholar] [CrossRef]
  45. Borgo, R.; Kehrer, J.; Chung, D.H.; Maguire, E.; Laramee, R.S.; Hauser, H.; Ward, M.; Chen, M. Glyph-Based Visualization: Foundations, Design Guidelines, Techniques and Applications. Eurographics (State of the Art Reports). 2013, pp. 39–63. Available online: http://cronfa.swan.ac.uk/Record/cronfa24643 (accessed on 15 December 2024).
Figure 1. NDEExplorer’s system interface. The system is organized into the following three distinct analysis areas: the AE analysis area (ad), the DIC analysis area (e,f), and the fusion analysis area (d,g). The blank star in (d) is the clustering center of the horizontal dotted line closest to it. And these four lines are trend lines for clustering of AE events generated based on the values of the set clustering method. The dots and dotted lines of each color correspond to same color, indicating the clustering trend of a type of AE event. The red vertical line represents the location of the damage status traced according to the Dividing Point II of (g).
Applsci 15 00952 g001
Figure 2. Overview of the workflow. The system workflow consists of the following four stages: first, the data pre-processing stage; followed by the preliminary stage; then the iterative stages; and finally, the completion of the visual analytics system.
Applsci 15 00952 g002
Figure 3. Test material image. (a) Center side concave material morphology image; (b) center perforated material morphology image; (c) tensile testing machine picture.
Applsci 15 00952 g003
Figure 4. Description of individual AE features. It records the change of a sound wave signal on the time and amplitude axes in a single acoustic event.
Applsci 15 00952 g004
Figure 5. AE feature analysis visualization. (a) Feature correlation heatmap: displays the correlation between acoustic emission data features; (b) feature detail view: illustrates the relationship between two specific features; (c) PCA view: conducts principal component analysis on the features; (d) clustering view: analyzes the clustering of acoustic emission events under force loading conditions. The blank star in (d) is the clustering center of the horizontal dotted line closest to it. And these four lines are trend lines for clustering of AE events generated based on the values of the set clustering method. The dots and dotted lines of each color correspond to same color, indicating the clustering trend of a type of AE event. The red vertical line represents the location of the damage status traced.
Applsci 15 00952 g005
Figure 6. DIC feature analysis visualization. (a) DIC view: shows images of U, V, E x x , E x y , and E y y in force loading; (b) color feature view: displays the image feature curves of each color channel in the selected state and the corresponding channel images.
Applsci 15 00952 g006
Figure 7. Fusion analysis visualization. (a) DIC view: provides the co_DIC button to generate a damage status graph in (c) the Dividing Pint II area; (b) clustering view: offers the co_AE button to generate the cluster evaluation indicator displayed in (c). The blank star in (b) is the clustering center of the horizontal dotted line closest to it. And these four lines are trend lines for clustering of AE events generated based on the values of the set clustering method. The dots and dotted lines of each color correspond to same color, indicating the clustering trend of a type of AE event. The red vertical line represents the location of the damage status traced according to the Dividing Point II of (c); (c) fusion view: uses the evaluation indicator choose option to fine-tune the judgment of damage force travel points, generate a damage status graph in the Dividing Point I area, and click the graph of the Dividing Point II area to interactively generate an AE damage force loading trace line in (b).
Applsci 15 00952 g007
Figure 8. AE feature analysis of center side concave material. Among ‘frequency’, ‘duration’, ‘peak_volt’, ‘rise_time’, and ‘peak_frequency’ features, ‘peak_volt’ scored the highest in the principal component analysis.
Applsci 15 00952 g008
Figure 9. Comparison of AE events under two clustering methods. The results show the initial damage state of the material occurred at a force loading of 0.23. (a) is the result of the K-means++ method for 3-clustering of AE data. (b) is the result of the FCM method for 4-clustering of AE data. The blank star in (a,b) is the clustering center of the horizontal dotted line closest to it. And these four lines are trend lines for clustering of AE events generated based on the values of the set clustering method. The dots and dotted lines of each color correspond to same color, indicating the clustering trend of a type of AE event. (c) is the glyph plots of Dividing Point I when the force loading is 0.23. (d) is the glyph plots of Dividing Point I when the force loading is 0.25.
Applsci 15 00952 g009
Figure 10. Damage image of E x y at a force loading of 1 for the center side concave material.
Applsci 15 00952 g010
Figure 11. Comparison of different force loading values. (a) DIC view and color feature view of E x x at a force loading of 0.80; (b) DIC view and color feature view of E x x at a force loading of 0.95; (c) DIC view and color feature view of E x x at a force loading of 0.98; (d) AE boundary verification line in (c); (e) dividing point graph in (c). The blank star in (d) is the clustering center of the horizontal dotted line closest to it. And these four lines are trend lines for clustering of AE events generated based on the values of the set clustering method. The dots and dotted lines of each color correspond to same color, indicating the clustering trend of a type of AE event. The red vertical line represents the location of the damage status traced according to the Dividing Point II of (c).
Applsci 15 00952 g011
Figure 12. User tasks and completion time. The middle column indicates the corresponding visualization tasks (Table 1). Red points show the mean.
Applsci 15 00952 g012
Figure 13. Description and results of questionnaires. The right-hand section indicates the mean ± SD.
Applsci 15 00952 g013
Table 1. Visualization tasks with requirement category and the corresponding analytical goals.
Requirement CategoryVisualization TaskAnalytical Goals
Damage analysisT1: Design a materials damage visulization workflow.G1, G2
Feature processingT2: Select an appropriate clustering method. T3: Optimize image processing methods.G3 G2
Information fusionT4: Combine AE and DIC data based on damage severity.G4, G5
System optimizationT5: Visualization of damage retrogression. T6: Incorporate evaluation metrics for clustering methods.G5 G3, G5
Disclaimer/Publisher’s Note: The statements, opinions and data contained in all publications are solely those of the individual author(s) and contributor(s) and not of MDPI and/or the editor(s). MDPI and/or the editor(s) disclaim responsibility for any injury to people or property resulting from any ideas, methods, instructions or products referred to in the content.

