Article

Thermodynamics of Liquid Uranium from Atomistic and Ab Initio Modeling

Lawrence Livermore National Laboratory, Livermore, CA 94551-0808, USA
*
Author to whom correspondence should be addressed.
Appl. Sci. 2025, 15(2), 896; https://doi.org/10.3390/app15020896
Submission received: 19 December 2024 / Revised: 14 January 2025 / Accepted: 14 January 2025 / Published: 17 January 2025

Abstract

:
We present thermodynamic properties for liquid uranium obtained from classical molecular dynamics (MD) simulations and the first-principles theory. The coexisting phases method incorporated within MD modeling defines the melting temperature of uranium in good agreement with the experiment. The calculated melting enthalpy is in agreement with the experimental range. Classical MD simulations show that ionic contribution to the total specific heat of uranium does not depend on temperature. The density of states at the Fermi level, which is a crucial parameter in the determination of the electronic contribution to the total specific heat of liquid uranium, is calculated by ab initio all electron density functional theory (DFT) formalism applied to the atomic configurations generated by classical MD. The calculated specific heat of liquid uranium is compared with the previously calculated specific heat of solid γ-uranium at high temperatures. The liquid uranium cannot be supercooled below Tsc ≈ 800 K or approximately about 645 K below the calculated melting point, although, the self-diffusion coefficient approaches zero at TD ≈ 700 K. Uranium metal can be supercooled about 1.5 times more than it can be overheated. The features of the temperature hysteresis are discussed.

1. Introduction

In a recent paper [1], we presented the results of first-principles calculations of the thermodynamic properties of γ-phase uranium (γ-U) within its temperature range of stability, 1049 K ≤ TTm = 1408 K, where Tm is the melting temperature. The first-principles method was coupled to a lattice dynamics scheme which was used to model anharmonic lattice vibrations. The calculated heat capacity was predicted to have significant thermal dependence due to the electronic contribution.
There are a significant number of calculations that have been performed to study thermal properties of the solid α-, β-, and γ-phases of uranium metal, as seen in Ref. [1] for details. However, there are only a handful of theoretical studies of liquid uranium performed either by classical molecular dynamics (MD), i.e., the so-called atomistic modeling with empirical interatomic potential [2,3,4,5,6,7], or by quantum molecular dynamics (QMD) [8,9,10,11,12]. The interatomic potential developed in Ref. [2] was fitted to the properties of α-U and was not well suited for high temperature applications. Contrarily, the potential developed in Ref. [3] was fitted to data on the structure of liquid uranium in the vicinity of the melting temperature but was not appropriate to describe the properties of the low-temperature α-uranium phase.
By using the force-matching method, Smirnova et al. [4] modified the embedded atom method (EAM) potential suggested in Ref. [3] in order to study the structure and thermodynamic properties of α-U, γ-U, and liquid uranium. The same year, Beeler et al. [5] suggested the modified embedded atom method (MEAM) potential to calculate the atomistic properties of γ-U. Moore et al. [6] expanded upon the MEAM approach for the case of the U-Zr system and reported the results of calculations of the numerous mechanical and thermodynamical properties of this system, including the enthalpy and heat capacity at the melting temperature. Pascuet and Fernández [7] independently constructed an MEAM potential and applied it to study the melting of U-Al alloys.
By using the ab initio plane-wave pseudopotential method and QMD, Hood et al. [8] performed constant volume modeling of α-U, γ-U, and liquid uranium. QMD based on the Vienna Ab initio Simulation Package (VASP) has been performed in Refs. [9,10,11] in order to study the thermodynamic properties of liquid uranium, e.g., the equation of state (EOS), the basic structural and thermodynamic properties, the bulk modulus, atomic self-diffusion, and viscosity. Finally, the fully relativistic calculations within VASP-QMD (the spin–orbit coupling (SOC) accounted for both core and valence electrons) [12] revealed the significant impact of the relativistic effects on the thermodynamic properties of liquid uranium at melting point.
In our previous paper [1], we paid special attention to the temperature behavior of the heat capacity, Cp(T), of γ-U at high temperatures. There is significant scatter in the experimental data on the heat capacity of γ-U [1]. The experimental data on the heat capacity of liquid uranium show an even higher level of uncertainty due the chemical volatility of uranium metal at high temperatures [13,14,15,16,17,18]. According to Equation (3) from Ref. [1], the following can be observed:
C p T = C p l a t T + C p e l T + C p m a g T ,
where C p l a t T , C p e l T , and   C p m a g T are the lattice, electronic, and magnetic contributions to the heat capacity, respectively. The lattice, or the ionic in the case of a liquid, contribution is calculated from MD as the change in total energy divided by the change in temperature. The electronic contribution is derived from the electronic density of states, D(E), at the highest occupied energy state (Fermi level, EF), D(EF):
C p e l T = π 2 3 D E F k B 2 T = γ e T
where γe is the Sommerfeld coefficient [19]. Note that D(EF) depends on temperature in two ways. First, it is broadened by a Fermi–Dirac temperature distribution. Second, it is sensitive to the atomic volume that increases with the temperature due to thermal volume expansion. We account for both these effects when determining   C p e l T . As was conducted for γ-U in Ref. [1], we ignore the magnetic contribution C p m a g T ,   to the constant pressure heat capacity Cp(T) while performing calculations for liquid uranium because the contribution is very small.
There have numerous reports on the experimental value of the Sommerfeld constant for α-U, for example the following: 10.0 mJ/(mol·K2) [15], 12.2 mJ/(mol·K2) [20], 9.14 mJ/(mol·K2) [21]. According to Ref. [6], γe for α-U have been shown to be micro-structurally dependent with an average value of the experimental results of about 10.12 mJ/(mol·K2).
Moore et al. [6] and Xiong et al. [22] calculated the electronic contribution to the specific heat using the electronic DOS derived from VASP formalism. In consistency with our paper [1], the electronic contribution to the specific heat of liquid uranium is calculated by using the electronic DOS derived from the reliable all-electron full-potential linear muffin-tin orbital (FPLMTO) method [23].
In this study, by using the LAMMPS code [24,25] and EAM potential [4], we perform a classical MD simulation of liquid uranium in the temperature range of 1400–2000 K. The melting temperature of uranium is derived from the simulation of coexisting phases [26,27,28]. The ionic (EAM) heat capacity is defined by monitoring the change in the enthalpy of the system over a change in temperature with the pressure fixed. The atomic configurations generated by the LAMMPS MD simulator are used to calculate the electronic contribution to the constant pressure heat capacity of liquid uranium by using an all-electron full-potential linear muffin-tin orbitals (FPLMTO) formalism.
Related details of the classical MD and FPLMTO computational methods are outlined in Section 2 and Section 3, respectively, followed by a presentation of the results in Section 4 and a discussion in Section 5. Lastly, a summary and concluding remarks are outlined in Section 6.

2. Classical Molecular Dynamics Methodology

In order to calculate the melting temperature of uranium metal, we constructed a simulation box containing 20 × 20 × 100-body-centered cubic (BCC) unit cells, resulting in a total of 80,000 atoms, with the equilibrium lattice constant (calculated by EAM [4]), a = 3.543 Å, defined at T = 1400 K, which is very close to the experimental melting point of uranium metal, Tm = 1408 K. Half of the atoms in this supercell were kept at a specific temperature (see Section 4 for details) while the other half of the atoms were subsequently melted. Classical MD simulations were performed using Parinello–Rahman [29] dynamics, restricting the supercell dimension change in the normal direction to the interface dynamic (z-dimension), and the dimensions parallel to the solid–liquid interface (x- and y-), which were fixed. Then, the whole supercell was equilibrated via an NPH ensemble, and the melting point was estimated from the average temperature measured from the coexistence simulation of the solid and liquid phases (the solid–liquid interphase). MD simulations were performed with the velocity Verlet algorithm [30,31] with a time step of 1 fs. The temperature was controlled using the Nosé–Hoover thermostat [32,33]. The temperature, energy, pressure, and lattice parameters were written out every 1000 time steps. The total duration of the melting temperature calculation was 2 ns.
In order to calculate the lattice contribution to the specific heat, we performed an equilibration of the 20 × 20 × 20-BCC unit cells simulation box, resulting in 16,000 atoms in the NPT ensemble at numerous temperatures. In distinction with the previous case, there were no restrictions applied to the supercell dimension change during the classical MD simulations using the Parinello–Rahman technique. The temperature, energy, and pressure were outputted every 10,000 time steps. The total duration of the calculations of the lattice contribution to the specific heat was 15 ns.
As we mentioned in the Introduction, the atomic configurations generated by the LAMMPS MD simulator were used to calculate the electronic contribution to the constant pressure heat capacity of liquid uranium. Due to the strict computational cell size restrictions imposed by ab initio methodologies, we performed an equilibration of the 3 × 3 × 3-BCC unit cells simulation box, resulting in 54 atoms in the NPT ensemble at numerous temperatures. Due to the small size of the computational cells, the equilibration at each temperature was performed over 1,000,000 time steps, and the atomic configuration was generated by averaging the last 10,000 time steps of the simulation cycle.

3. Ab Initio Computational Methodology

Uranium, and actinide metals in general, can very effectively be modeled from the first-principles theory as implemented in density-functional theory (DFT) codes. Particularly, all-electron implementations are robust, while the pseudopotential approximation commonly used in DFT calculations may struggle when dealing with f-electron physics. One review of the efficacy of this approach for actinide metals was presented some time ago [34].
Specifically, for this investigation, we applied the all-electron full-potential linear muffin-tin orbitals (FPLMTO) method [23]. As necessary, we needed to choose an approximation for the electron exchange and correlation potential, and for this purpose, we used the generalized gradient approximation in the simplified PBE form [35]. There have been some discussions in the past that the description of uranium would benefit from the application of intra-atomic Coulomb repulsion [36], but we have shown that this is not the case [37].
We focused on the liquid of uranium and calculated the electronic contribution to the specific heat from the DFT electronic structure of uranium atoms in liquid configurations. The configurations consisted of 54-atom cells that are snapshots from molecular dynamics simulations. The electronic temperature ranged from 1400 K to 2000 K and was incorporated through a Fermi–Dirac broadening of the DFT electronic structure. The calculations were standard [34], with 6s and 6p semi-core states that hybridize with the valence-band 7s, 7p, 6d, and 5f states for a total of 14 electrons per uranium atom. We used a double basis set and allowed two tail parameters with different kinetic energy for each given l-specific orbital. Spin–orbit coupling was applied for the d and f states but excluded for the p states, as discussed in the literature [38]. The number of k points in the integrations in the reciprocal space was 8, and more k points did not change the results appreciably. To each energy eigenvalue, we applied 20 mRy Gaussian broadening. In FPLMTO, one divided the crystal into muffin tins and an interstitial region. The muffin tin sphere radius, SMT, was chosen to avoid overlap. Because of the distortions of the liquid structure, we scaled SMT/SWS = 0.72, where SWS is the atomic-sphere radius. A more common value for solids is SMT/SWS = 0.80. The specific heat contribution was obtained from the Sommerfeld assumption as discussed above, as seen in Equation (2).

4. Results

Figure 1 shows the measured temperature of the coexistence simulation of the solid and liquid phases as a function of MD steps performed with a time step of 1 fs. In this case, we used the 20 × 20 × 100-BCC unit cell simulation box. As was mentioned in Section 2, the simulation box is divided into two equal parts. During the first 20,000 time steps, the upper part of the simulation box was heated up to T1 = 2500 K where it melts, and the lower part of the simulation box was kept at the initial temperature, T0 = 1300 K. During the second 20,000 time steps, the upper box of the simulation cell was cooled down to the initial temperature, T0 = 1300 K. Then, during the remaining 1,960,000 time steps of the simulation (1.96 ns), both parts of the simulation box were equilibrated together via an NPH ensemble. The measured temperature of the whole box was about T2 ≈ 1445 K, which we consider to be the melting temperature of uranium metal modeled by the EAM [4]. The calculated melting temperature of the EAM [4] uranium is very close to the calculated melting temperature of T3 = 1455 K defined by the EAM [3]. The original paper by Smirnova et al. [4] did not specify the melting temperature of uranium metal modeled by the suggested EAM. Hu et al. [39] used a similar methodology to estimate the melting temperature of uranium metal described by EAM potential [4]. According to the calculations by Hu et al. [39], uranium melts at T4 = 1524 K, which is about 80 K above the results of the present calculations, T2 ≈ 1445 K, and 116 K above the experimental point, Tm = 1408 K.
As was mentioned in the Introduction, the measured temperature was recorded every 1000 MD time steps. This output result is shown in Figure 1 as a black line with a significant noise. In this plot, we also show the value of the measured temperature averaged every 1 ps (the red line), which shows significantly smoother behavior.
Figure 2 shows the temperature dependence of the total energy of γ-U and liquid uranium derived from the MD simulations. In this case, we used the 20 × 20 × 20-BCC unit cells simulation box. Initially, the simulation box was equilibrated at T = 1400 K for 1,000,000 time steps and was then heated up to T = 2000 K for 100,000 time steps. Even though the previous calculations show that BCC uranium melts at T2 ≈ 1445 K, the simulation box remained solid approximately up to Tsh =1875 K where the total energy jump signaled the melting. Then, we equilibrated the simulation box at T = 2000 K for 1,000,000 time steps and started to cool it down to T = 1400 K with the step of ΔT = 100 K, the equilibration time at each temperature for 1 ns, and the cooling time for each ΔT for 1 ns. Finally, opposite to Figure 1 when both the output “snapshot” and the average temperature are plotted, Figure 2 shows only the average energy output over the interval of 10,000 time steps.
The melting enthalpy, (ΔHM), was calculated from the energy difference between the liquid and crystalline system at the calculated melting point, T2 = 1445 K. The required energies are obtained from the data shown in Figure 2. Our calculations reveal ΔHM = 94.02 meV/atom ≈ 6.91 mRy/atom ≈ 9.07 kJ/mole, which is close to the experimental value of 9.14 kJ/mole [40].
Figure 3 shows the calculated density of liquid uranium as a function of temperature, together with the experimental data of Fokin [41]. There is some scattering in the experimental data on the density of liquid uranium at the experimental melting point: 16.95 g/cm3 [42], 17.23 g/cm3 [41], 17.27 g/cm3 [16], 17.60 g/cm3 [43], 17.90 g/cm3 [44].
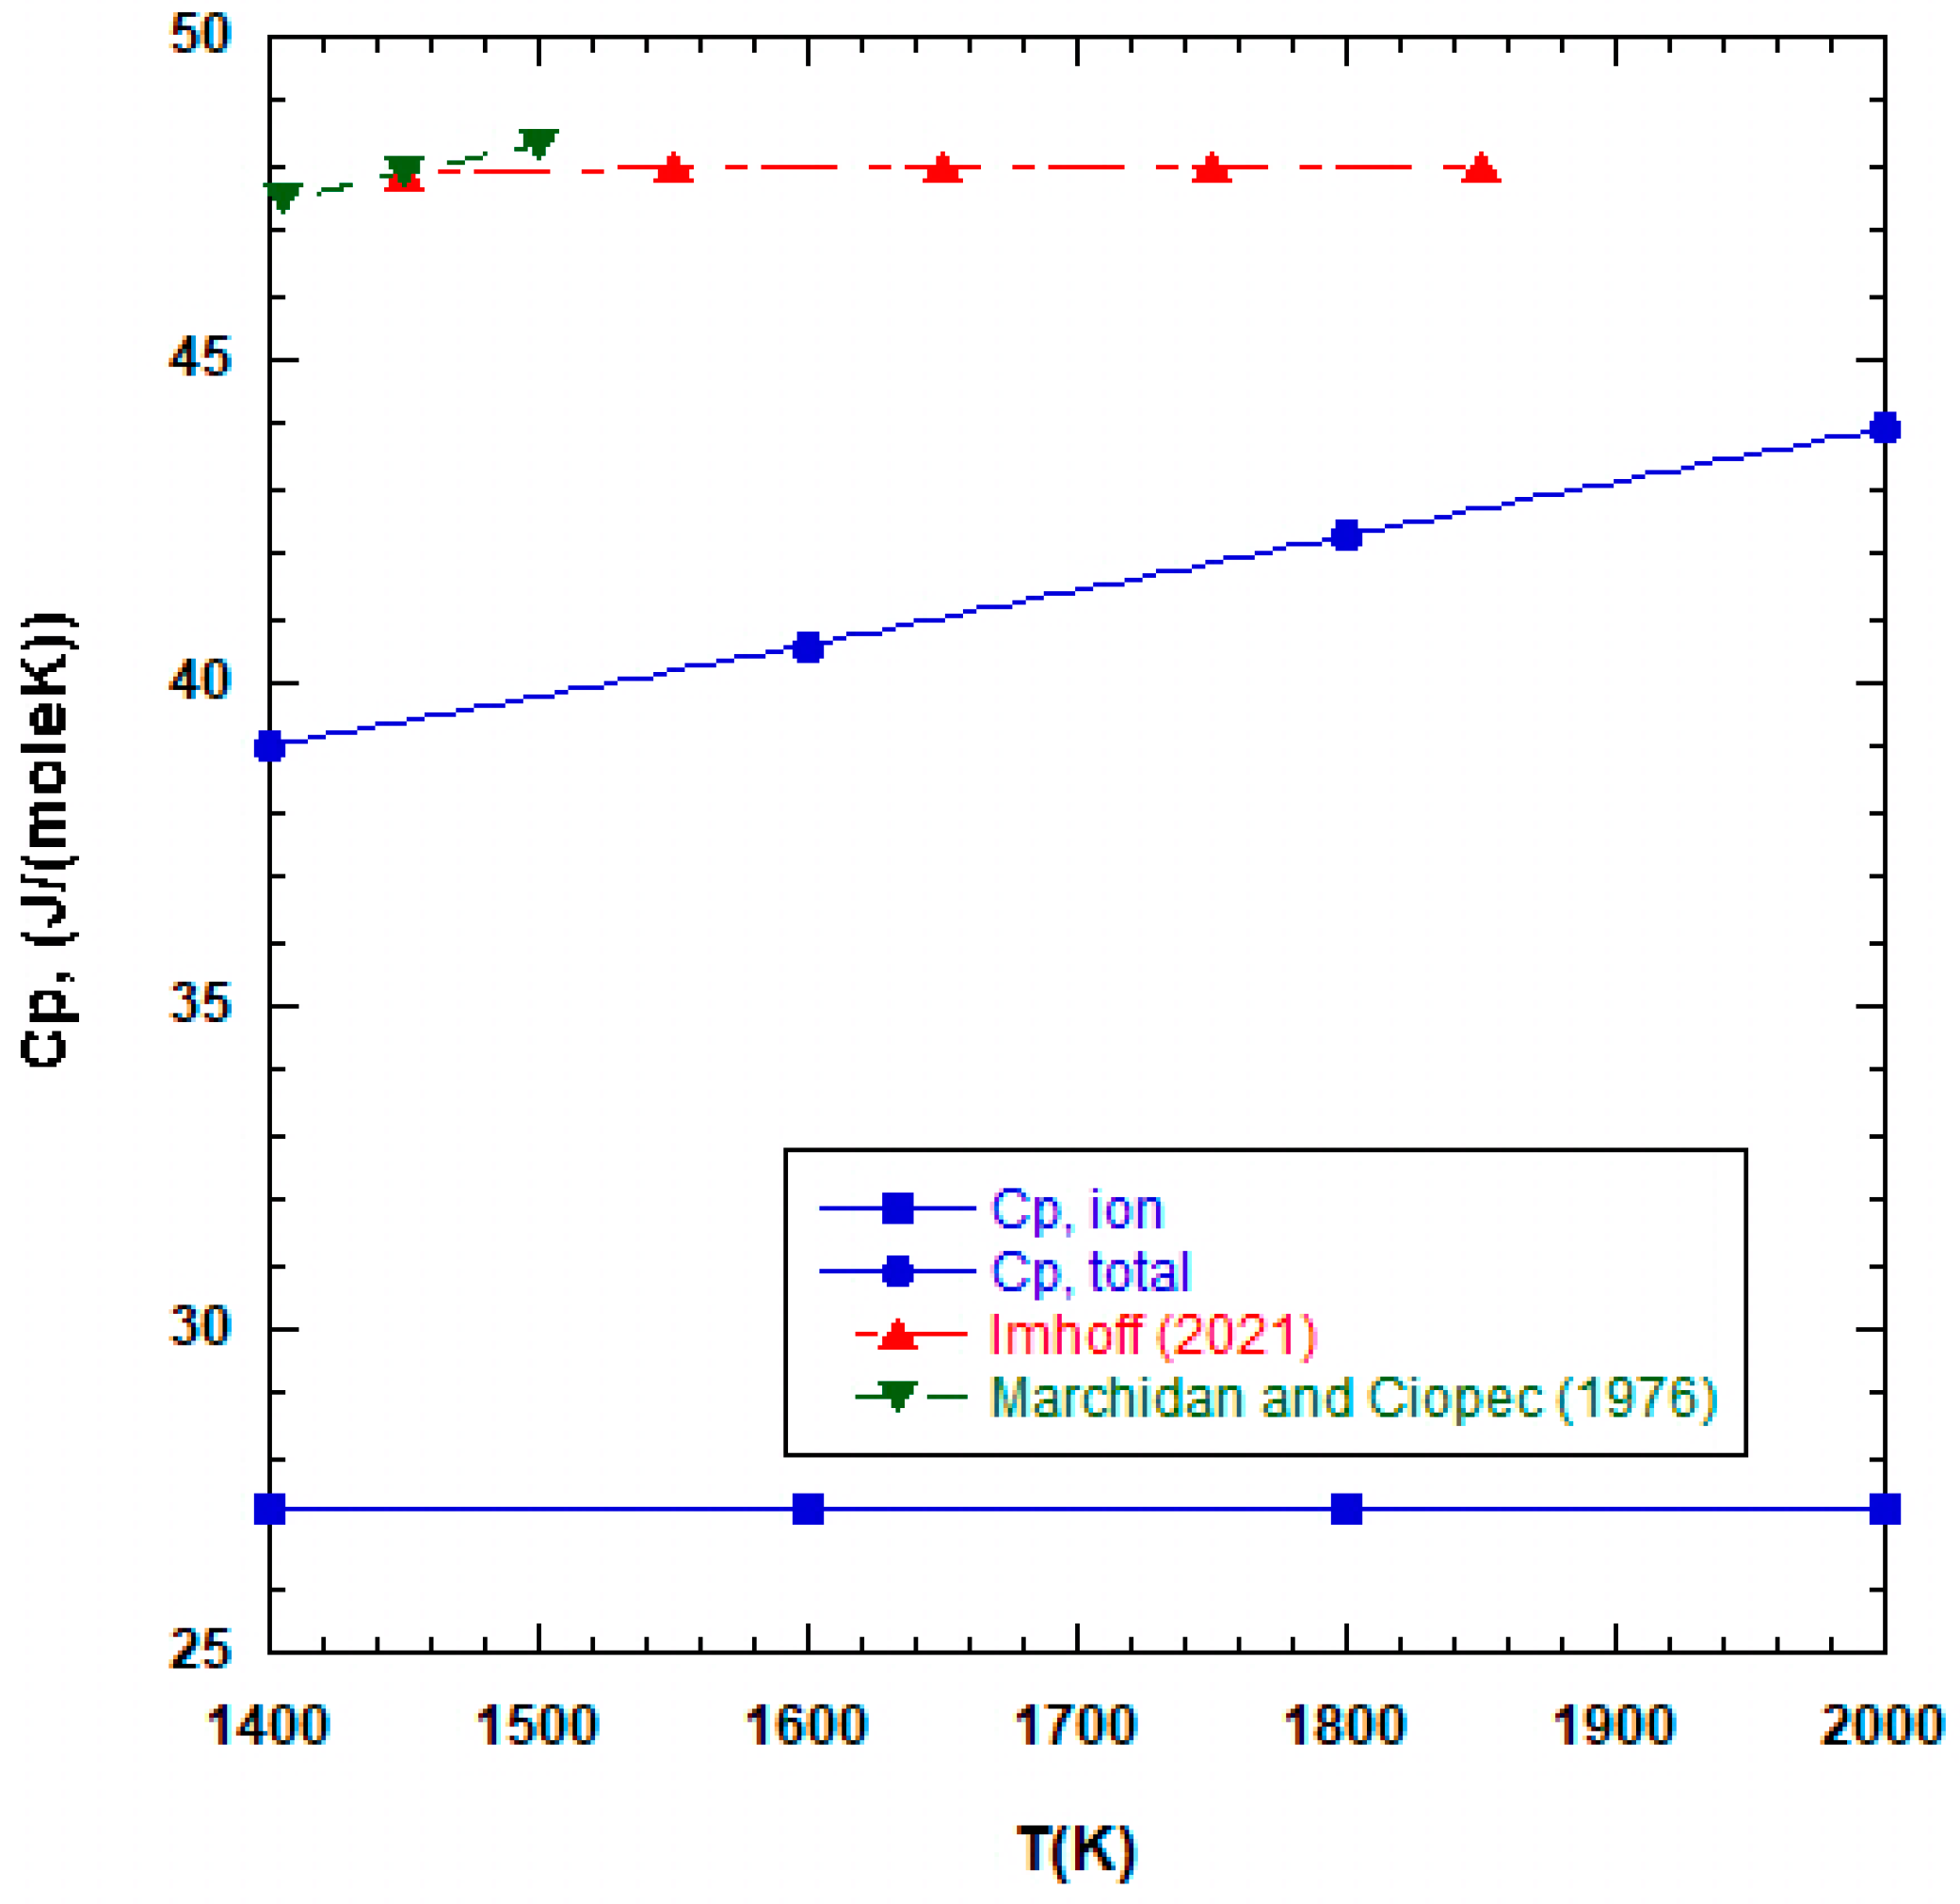
Using the expression C p = H T p , N = E T p , N , we calculated the ionic contribution to the specific heat C p i o n T = 27.24 J/(mole K) that does not change with temperature.
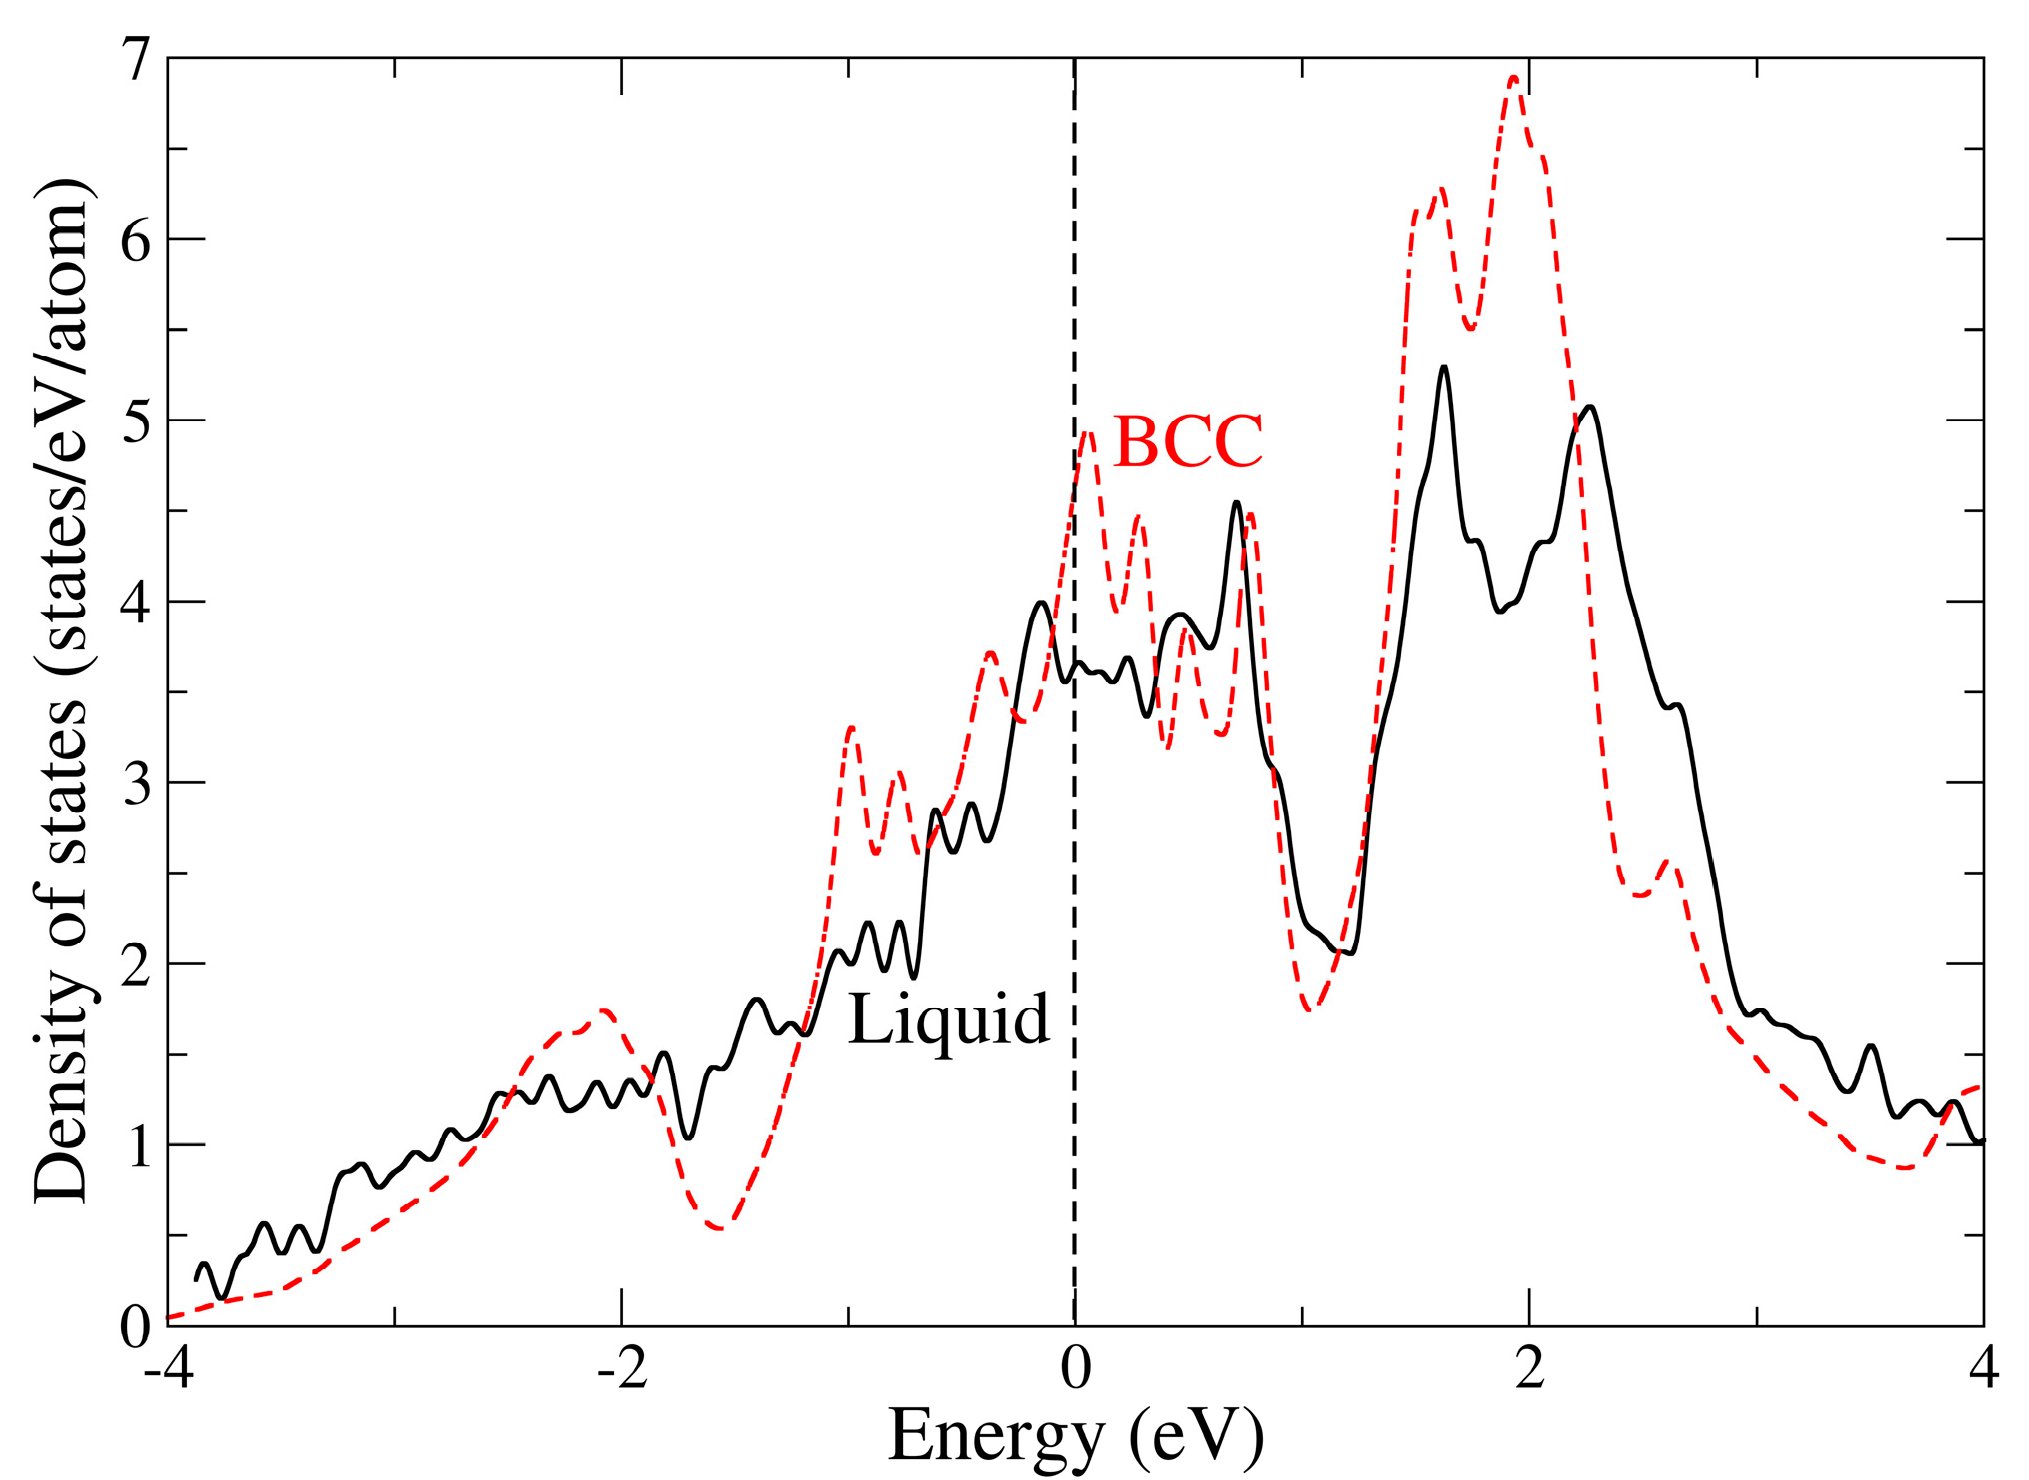
The electronic contribution was calculated according to Equation (2). The fundamental input to Equation (2) from the electronic structure is the density of states at the highest occupied energy state (the Fermi level). For the liquid, we calculated this number assuming the atomic density and positions obtained from the MD simulation. In Figure 4, we show one example of the electronic density of states at 1400 K (liquid uranium) and compare it with the perfect BCC solid (γ-U) at the same atomic density.
We notice, unsurprisingly, that the density of states at the Fermi level, D(EF), is about 25% higher for the BCC solid relative to the liquid. This is due to a lowering of the symmetry in the liquid that is higher for the crystal BCC phase, leading to the symmetry-related degeneracies of some states and a higher D(EF). This phenomenon also takes place at low temperatures for uranium where the orthorhombic α-U phase is stable due to this symmetry-breaking mechanism, which has been referred to as a Jahn–Teller or Peierls distortion [45]. As a result, the electronic contribution to the specific heat of liquid uranium is about 20% lower than the similar contribution to the specific heat of the BCC solid γ-U.
The calculated ionic (LAMMPS) and total specific heat of liquid uranium, calculated by Equation (1), are shown in Figure 5 together with experimental data from Refs. [15,46].
As was in the case for γ-U [1], the calculated heat capacity of liquid uranium has a significant thermal dependence due to electronic contribution. In addition to Refs. [15,46], there are few measurements of the specific heat of liquid uranium. According to Ref. [47], the specific heat of liquid uranium at T ≤ 6000 K is described by the following equation:
Cp(J/(mole·K)) = 42.144 + 3.232x + 2.07/x2, where x = T/1000,
which reveals Cp = 47.72 J/(mole K) at T = 1400 K and Cp = 49.13 J/(mole K) at T = 2000 K. Levinson [13] reported Cp = 47.93 J/(mole K) in the temperature interval 1415 K ≤ T ≤ 1579 K. Mulford and Sheldon [16] reported Cp = 47.3 J/(mole K) in the temperature interval 2786 K ≤ T ≤ 5408 K, and Stephens [40] reported Cp = 48.66 J/(mole K) in the temperature range 1348 K ≤ T ≤ 2348 K. So, according to Refs. [13,16,40], the specific heat of liquid uranium does not change with temperature at all, and Refs. [46,47] indicate a very weak dependence of the specific heat of liquid uranium from temperature.
The picture is different in the case presented by Marchidan and Ciopec [15]. Although their measurements were restricted to a very narrow temperature interval of 1405 K ≤ T ≤ 1500 K, the slope of the measured heat capacity (the increase rate with the temperature change) slightly exceeds the similar characteristic derived by our present calculations. We do not make any conclusion on this matter, understanding the difficulties of any measurements in liquid uranium.
Figure 6 shows the total specific heats of solid γ-U, FPLMTO [1], and liquid uranium, LAMMPS. The lattice (solid) and ionic (liquid) contributions to the total specific heat are also shown separately in Figure 6. As was reported in Ref. [1], the calculations for γ-U were performed up to T = 2000 K, which is well above the experimental melting point, Tm = 1408 K, The electron contribution to the total specific heat is significant for both γ-U and liquid uranium, but the total specific heat of liquid uranium increases slower with the temperature that is the total specific heat of γ-U because (1) the ionic specific heat of liquid uranium is constant (it does not depend on temperature) while the lattice specific heat of γ-U increases with temperature [1]; and (2) the electronic contribution to the specific heat of liquid uranium is lower than the electronic contribution to the specific heat of solid γ-U.
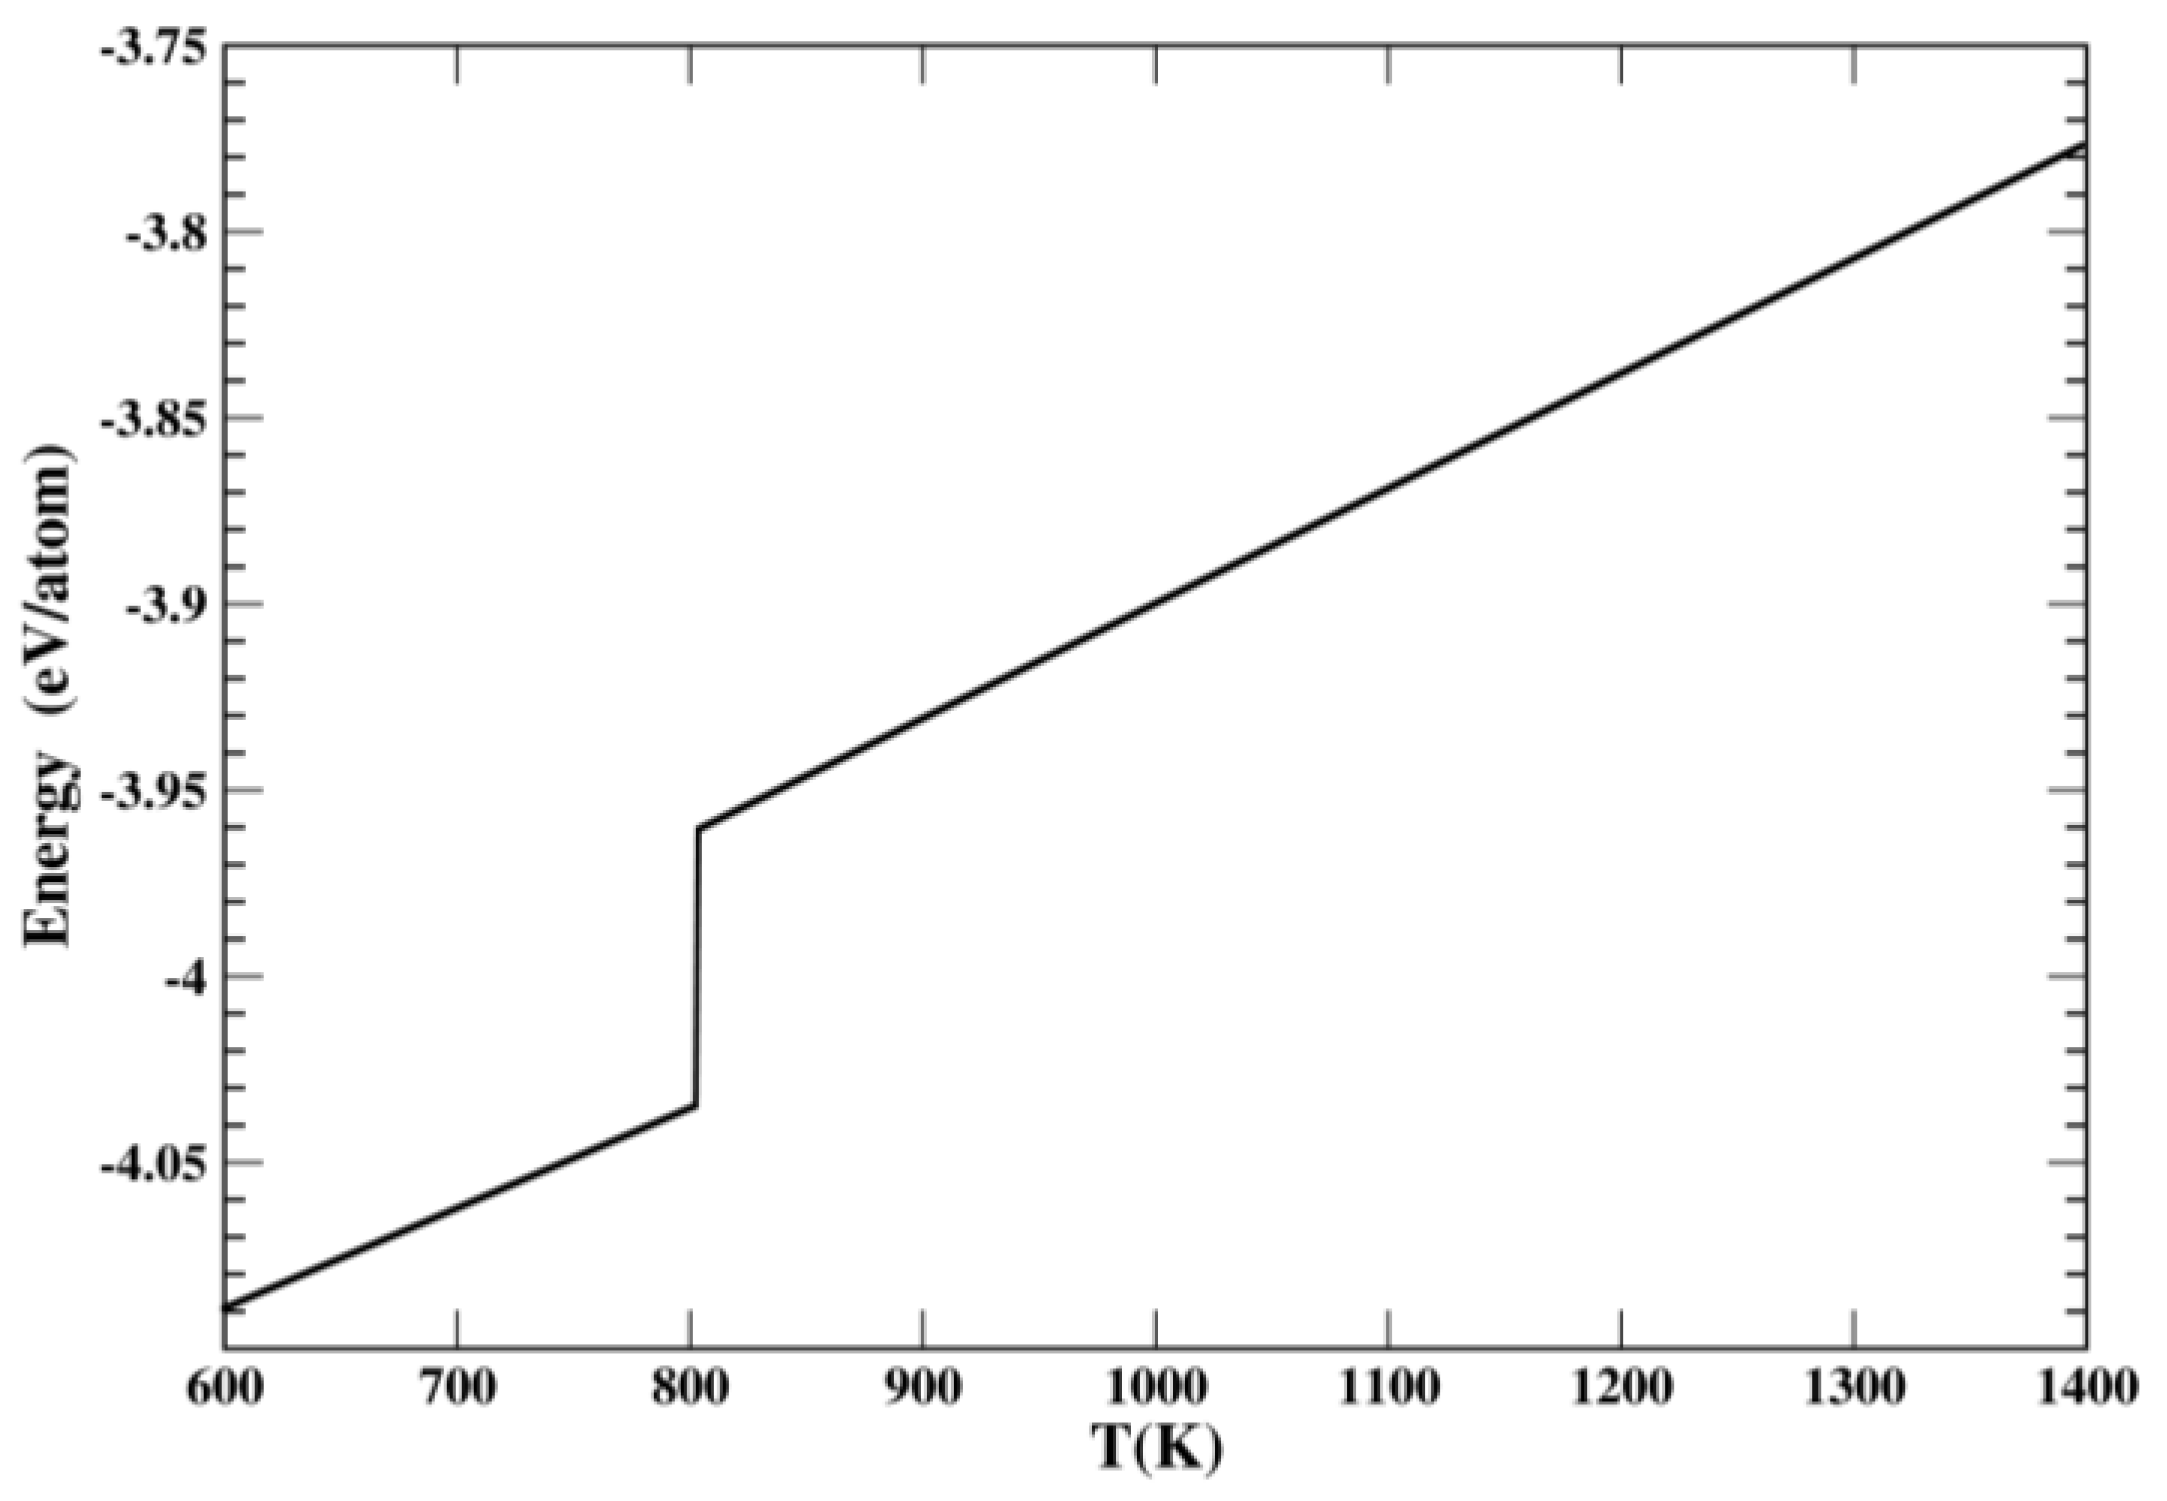
Figure 7 shows the temperature dependence of the atomic energy of the supercooled liquid uranium from 1400 K to 600 K. One can see the drop of the energy vs. the temperature curve at Tsc ≈ 800 K that manifests the solidification of supercooled (remaining liquid below the melting temperature) uranium.
One should mention that the energy released during solidification, ΔHS = 73.13 meV/atom ≈ 5.38 mRy/atom ≈ 7.06 kJ/mole, is about 22% smaller than the melting enthalpy, ΔHM ≈ 9.07 kJ/mole, as calculated above. We will explain this phenomenon in the Discussion section.
We also calculated the self-diffusion coefficient for liquid uranium through the Stokes–Einstein relation [48]:
D = l i m t Δ r 2 t 6 t
where
< r 2 t > = 1 N i = 1 N r i t + t 0 r i t 0 2
is the atomic mean-square displacement (MSD).
The results of these calculations are shown in Figure 8. Although the supercooled liquid uranium solidifies at Tsc ≈ 800 K, the self-diffusion coefficient approaches zero at TD ≈ 700 K, which is about 100 K below the thermodynamical solidification temperature Tsc.
The calculated (LAMMPS, EAM [4]) self-diffusion coefficient of liquid uranium is in good agreement with the results of QMD (VASP) calculations [10] and experimental data [49]. The experimental data of the self-diffusion coefficient of liquid uranium at the experimental melting point, Dm = 0.192 Å2/ps =1.92 × 10⁻⁹ m2/s, are also shown in Figure 8. This value was estimated in Ref. [10] on the measurements of the viscosity of liquid uranium at the melting point [49], η = 6.59 cP, and its relationship with diffusivity through the Stoke–Einstein relation; see Equation (14) from Ref. [3] for details.

5. Discussion

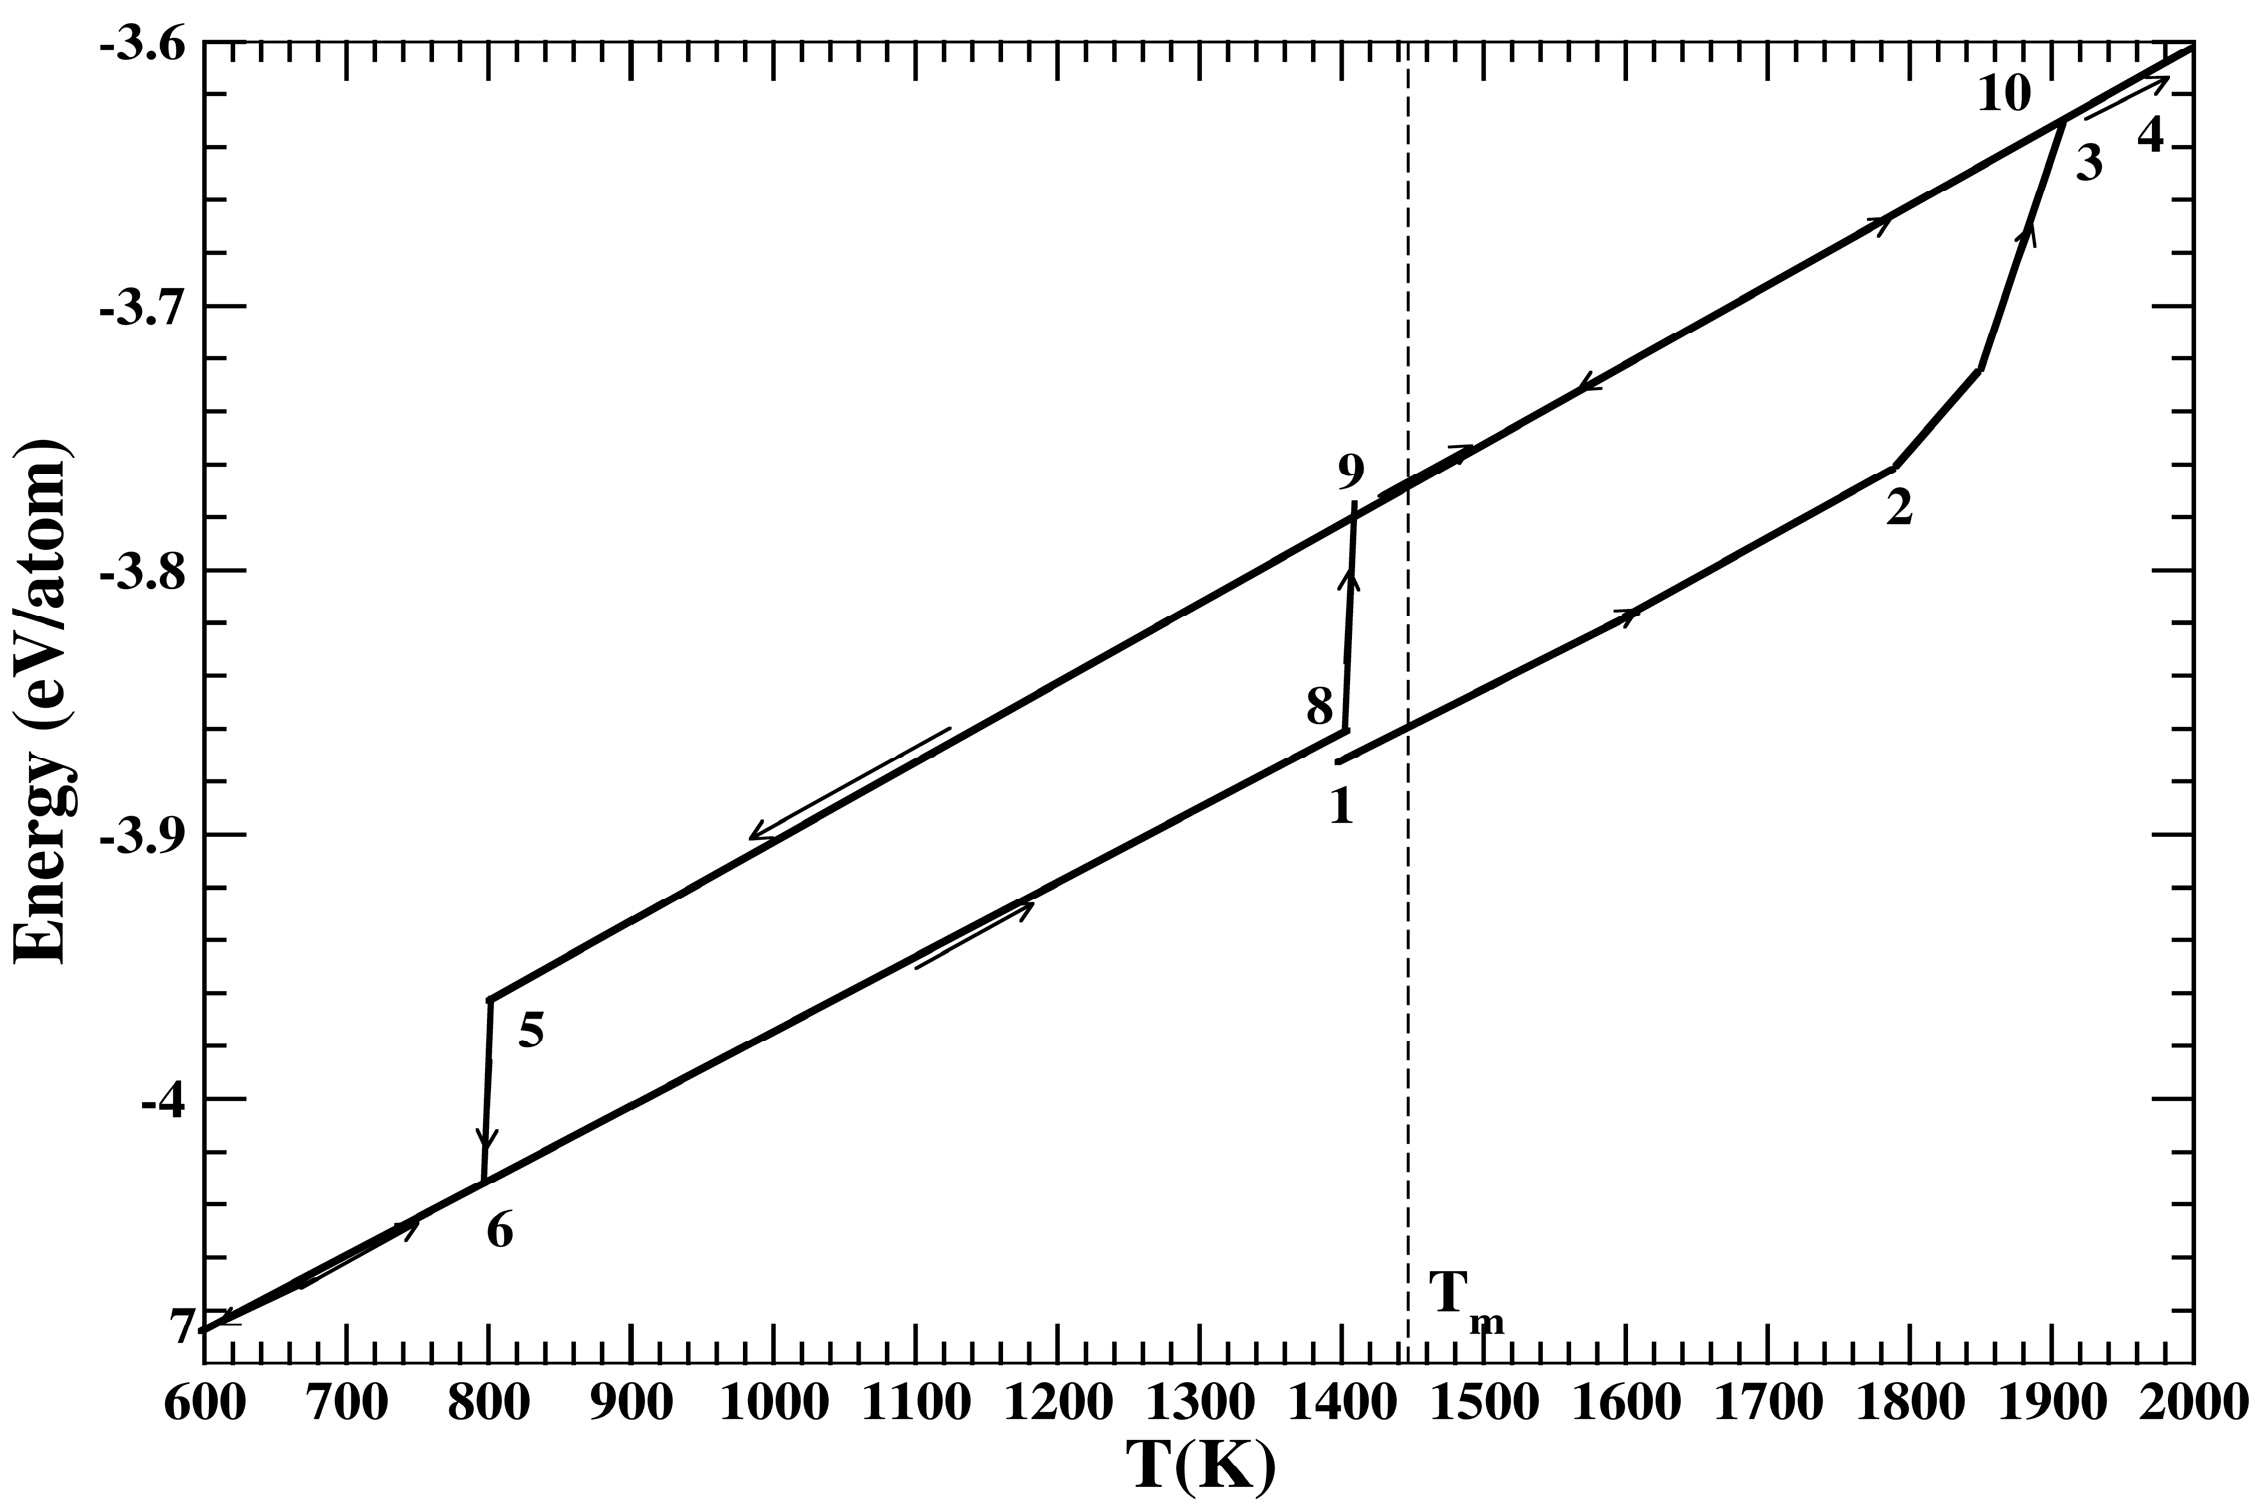
Figure 9 shows the atomic energy of uranium metal through the sequences of the heating (1–2), melting (2–3), heating (3–4), cooling (4–5), solidification (5–6), cooling (6–7), heating (7–8), remelting (8–9), and final heating (9–10) stages. The liquid paths, 3–4, 4–5, and 9–10, are fully reversable, which means that the atomic structure of liquid uranium is temperature-independent (there are no phase transitions). The calculated melting temperature, T2 = 1445 K, is shown by the chain line. As we discussed before, the heat of melting at T2 is ΔHM ≈ 9.07 kJ/mole and the heat of solidification at 800 K is ΔHS ≈ 7.06 kJ/mole. Ater solidification, 5–6, cooling, 6–7, and heating, 7–8, uranium metal remelts, 8–9, at the temperature, TrrM ≈ 1400 K, which is smaller than the calculated melting temperature, T2, and the remelting enthalpy ΔHrM ≈ 7.84 kJ/mole is about 13.6% smaller than the calculated melting enthalpy ΔHM ≈ 9.07 kJ/mole at T2 = 1445 K.
In order to investigate the asymmetry between superheating (sh), Tsh = 1875 K, and supercooling (sc), Tsc ≈ 800 K, temperatures in solid–liquid transitions in uranium metal, we employed the formalism developed by Luo et al. [50] and Luo and Swift [51] which is based on the classical nucleation theory of Kelton [52]. The authors [50,51] introduced the degree of superheating, Θsh = (TshTm)/Tm, and degree of supercooling, Θsc = (Tm − Tsc)/Tm. According to Ref. [51], 0 ≤ Θsh ≤ 1/3 or Tsh ≤ 4/3 Tm; and 0 ≤ Θsc ≤ 2/3 or Tsc ≥ 1/3 Tm. Taking into account the calculated values of Tsc, Tm = T2, and Tsh for uranium metal, Θsh ≈ 0.2976 and Θsc ≈ 0.4464. Thus, in the case of the EAM [4], uranium metal can be supercooled Θscsh ≈ 1.5 times more than it can be overheated.
The classical nucleation theory predicts the relation [50,51]:
Θsh2(1 + Θsh) = Θsc2(1 − Θsc).
In the ideal case, Θsh = 1/3 and Θsc = 2/3, and Θsh2(1 + Θsh) = Θsc2(1 − Θsc) = 4/27 ≈ 0.14815. According to our calculations, for Θsh ≈ 0.2976, Θsh2(1 + Θsh) ≈ 0.11492, and for Θsc ≈ 0.4464, Θsc2(1 − Θsc) ≈ 0.11031. So, even our Θsh and Θsc are different from the ideal case of 1/3 and 2/3, respectively, and Relation (6) holds an accuracy of 4%.
By using the classical nucleation theory of Kelton [52], Luo et al. [50,53], Luo and Ahrens [54], and Zhang et al. [55], we derived an equation that gives the melting temperature, Tm, from the superheating, Tsh, and supercooling, Tsc, temperatures:
T m = T s h + T s c T s c T s c
By substituting Tsh = 1875 K and Tsc = 800 K into Equation (7), one obtains Tm ≈ 1450 K, which is five degrees above the melting temperate T2 = 1445 K calculated independently by the coexistence simulation of the solid and liquid phases discussed in Section 4.
The heating and cooling curves in Figure 9 reveal a significant hysteresis effect which manifests itself as the superheating and supercooling phenomena. One should notice that when the supercooled liquid uranium solidifies, it has slightly higher energy than the ideal solid. In other words, the solid uranium, which results from solidification at Tsc ≈ 800 K, is not the original ideal solid uranium that we started with: the path 7–8 is slightly above the path 1–2. The fact that the energy of the solidified crystal is slightly higher than the original ideal crystal means that there is little extra energy associated with the presence of defects. That is why the latent heat of solidification of supercooled uranium at Tsc ≈ 800 K, HS ≈ 7.06 kJ/mole is smaller than the melting enthalpy, ΔHM ≈ 9.07 kJ/mole. A similar effect is shown in Figure 1 of Ref. [56]. The presence of defects in solidified uranium explains the fact that the remelting temperature TrM ≈ 1400 K is smaller than calculated melting temperature T2 ≈ 1445 K, as well as the calculated remelting enthalpy, ΔHrM ≈ 7.84 kJ/mole, which smaller than the calculated melting enthalpy, ΔHM ≈ 9.07 kJ/mole.
Perhaps this is the general property of the solidification of such MD systems: the presence of some defects is unavoidable. What kind of defects and what their concentration is can be determined, in principle, but this requires some geometrical analysis of the system. Such analysis is out of the scope of our paper.
In Section 4, we mentioned that the calculated melting enthalpy of uranium metal is ΔHM ≈ 9.07 kJ/mole. Indeed, the value of the melting enthalpy for uranium is ambiguous: the review ([57], p. 14), with the corresponding references, gives a set of values of 8.72–9.30 kJ/mole. The calculated melting enthalpy for the EAM [4] potential of uranium metal is in agreement within the experimental range. However, the review [57] also mentions another set of uranium melting enthalpy values, 15.50–19.60 kJ/mole, also according to the correspondence references, which is basically twice as high as 8.7–9.3 kJ/mole. According to Moore et al. [6] (Table 6), a second set of measurements was performed between 1956 and 1960 and the first set—in the seventieth and later. We consider that the first set of measurements is more reliable due to the further developments of the experimental technique. The calculations of Beeler et al. [5] and Moore et al. [6] reveal a melting enthalpy of uranium metal equal to 8.66 kJ/mole and 8.52 kJ/mole, respectively. Our results are withing the range of the first set of experimental data.

6. Summary and Conclusions

The key to metallic fuel development is the fabrication of uranium metal and alloys into fuel forms. Casting (the process in which a liquid metal is poured into a mold) has been a key component of the metallic fuel cycle, and process models require thermophysical parameters at elevated temperatures, particularly above the melting temperatures regarding which experimental data are scarce, for accurate simulations and process development. Specific heat and thermal diffusivity are the critical paraments of casting because the former parameter defines how much energy is necessary to raise the temperature necessary to melt and superheat the metallic alloy, and the former parameter defines the rate of heat transfer inside a material. Additional challenges to the measurement of the needed values are contamination and the rapid oxidation of the melt. These complications introduce uncertainty into the measurements and often have unforeseen influences on the measured values. It is therefore very useful to have thermophysical data without these influences. Present calculations address the need to develop these trusted thermophysical property data.
The atomistic properties of liquid uranium in the temperature range of 1400 K ≤ T 2000 K are calculated using the EAM potential [4] and the LAMMPS classical MD package. The melting temperature of uranium metal, defined from the simulation of coexisting phases, is found to be T2 ≈ 1445 K which is about 37 degrees above the experimental melting point, Tm = 1408 K. The calculated melting temperature is confirmed independently from the classical nucleation theory.
For the first time, the electronic contribution to the specific heat of liquid uranium is calculated by ab initio full-potential formalism, which is applied to the atomic configurations generated by the classical MD. We strongly believe that the specific heat of liquid uranium increases linearly with temperature and that this behavior is solely due to the characteristics of the electronic contribution to the heat capacity imposed by the Sommerfelt model. At the same time, we realize the practical difficulties in measuring the thermodynamic properties of liquid uranium that could explain the disagreement of the experiments with the theoretical results (see Ref [1] for details).
We found that the low border of the supercooling of liquid uranium, Tsc ≈ 800 K, is approximately 645 K below the calculated melting temperature, T2 ≈ 1445 K. We also found that uranium metal can be supercooled about 1.5 times more than it can be overheated.
The success of the atomistic modeling of U-Zr [6,58,59] and U-Mo [60,61,62] alloys encourages further modeling of U-Nb alloys, which are considered to be promising metallic fuel candidates for Gen-IV fast breeder reactors [63] due to their high melting point, good corrosion resistance, good thermos-conductivity, continuous BCC region ad high temperatures (there are UZr2 and U2Mo compounds in U-Zr and U-Mo alloys, respectively), and excellent mechanical properties.

Author Contributions

Conceptualization, A.L. and P.S.; methodology, A.L. and P.S.; software, A.L. and P.S.; investigation, A.L. and P.S.; writing—original draft preparation, A.L. and P.S.; writing—review and editing, P.S., A.L., J.R., and J.T.M. All authors have read and agreed to the published version of the manuscript.

Funding

This research received no external funding.

Institutional Review Board Statement

Not applicable.

Informed Consent Statement

Not applicable.

Data Availability Statement

Data is contained within the article.

Acknowledgments

We acknowledge helpful discussions with L. Hale, T. Oppelstrup, L. Burakovsky, and D.K. Belashchenko. This work was performed under the auspices of the U.S. DOE by LLNL under Contract DE-AC52-07NA27344.

Conflicts of Interest

The authors declare no conflicts of interest.

References

  1. Söderlind, P.; Landa, A.; Moore, E.E.; Perron, A.; Roehling, J.; McKeown, J.T. High-temperature thermodynamics of uranium from ab initio modeling. Appl. Sci. 2023, 13, 2123. [Google Scholar] [CrossRef]
  2. Pascuet, M.I.; Bonny, G.; Fernández, J.R. Many-body interatomic U and Al–U potentials. J. Nucl. Mater. 2012, 424, 158–163. [Google Scholar] [CrossRef]
  3. Belaschenko, D.K.; Smirnova, D.E.; Ostrovsky, O.I. Molecular-dynamic simulation of the thermophysical properties of liquid uranium. High Temp. 2010, 48, 363–375. [Google Scholar] [CrossRef]
  4. Smirnova, D.E.; Starikov, S.V.; Stegailov, V.V. Interatomic potential for uranium in a wide range of pressures and temperatures. J. Phys. Condens. Matter. 2012, 24, 015702. [Google Scholar] [CrossRef]
  5. Beeler, B.; Deo, C.; Baskes, M.; Okuniewski, M. Atomistic properties of γ uranium. J. Phys. Condens. Matter 2012, 24, 075401. [Google Scholar] [CrossRef] [PubMed]
  6. Moore, A.P.; Beeler, B.; Deo, C.; Baskes, M.I.; Okuniewski, M.A. Atomistic modeling of high temperature uranium-zirconium alloy structure and thermodynamics. J. Nucl. Mater. 2015, 467, 802–819. [Google Scholar] [CrossRef]
  7. Pascuet, M.I.; Fernández. Atomic interaction of the MEAM type for the study of intermetallics in the Al-U alloy. J. Nucl. Mater. 2015, 467, 229–239. [Google Scholar] [CrossRef]
  8. Hood, R.; Yang, L.H.; Moriarty, J. Quantum molecular dynamics simulations of uranium at high pressure and temperature. Phys. Rev. B 2008, 78, 024116. [Google Scholar] [CrossRef]
  9. Yanilkin, A.V. Investigation of a-phase and liquid uranium by the method of quantum molecular dynamics. High Temp. 2017, 55, 40–46. [Google Scholar] [CrossRef]
  10. Del Rio, B.G.; González, L.E.; Gonzales, D.J. First principles study of liquid uranium at temperatures up to 2050 K. J. Phys. Cond. Matter. 2020, 32, 304001. [Google Scholar] [CrossRef] [PubMed]
  11. Zhang, H.; Sun, H.; Li, Q.; Wang, L. Origin of local structures of u-co melts: A first-principles study. Front. Mater. 2022, 8, 821306. [Google Scholar] [CrossRef]
  12. Minakov, D.; Paramonov, M.; Levashov, P. Effect of the spin-orbit interaction on thermodynamic properties of liquid uranium. arXiv 2020, arXiv:2005.05468. [Google Scholar]
  13. Levinson, L.S. Heat content of molten uranium. J. Chem Phys. 1964, 40, 3584–3585. [Google Scholar] [CrossRef]
  14. Gathers, G.R. Dynamic methods for investigating thermophysical properties of matter at very high temperatures and pressures. Rep. Prog. Phys. 1986, 49, 341–396. [Google Scholar] [CrossRef]
  15. Marchidan, D.; Ciopec, M. Enthalpy of uranium to 1500 K by drop calorimetry. J. Chem. Thermodyn. 1976, 8, 691–701. [Google Scholar] [CrossRef]
  16. Mulford, R.N.R.; Sheldon, R.I. Densi1y and heat capacity of liquid uranium at high temperatures. J. Nucl. Mater. 1988, 154, 268–275. [Google Scholar] [CrossRef]
  17. Dinsdale, A.T. SGTE data for pure elements. Calphad 1991, 15, 317–425. [Google Scholar] [CrossRef]
  18. Gurvich, L.V.; Veits, I.V.; Medvedev, V.A. Thermodynamic Properties of Individual Substances, 4th ed.; Gurvich, L.V., Veits, I.V., Alcock, C.B., Eds.; Begell House: Danbury, CT, USA, 1994; Volume 4, Part 1–2; 448p. [Google Scholar]
  19. Grimvall, G. Thermophysical Properties of Materials; Elsevier BV: Amsterdam, The Netherlands, 1999; pp. 157–172. [Google Scholar]
  20. Crangle, J.; Temporal, J. Heat capacity and transformations in alpha uranium at low temperature. J. Phys. F Met. Phys. 1973, 3, 1097–1105. [Google Scholar] [CrossRef]
  21. Stewart, G.R. Measurement of low-temperature specific heat. Rev. Sci. Instrum. 1983, 54, 1–20. [Google Scholar] [CrossRef]
  22. Xiong, W.; Xie, W.; Shen, C.; Morgan, D. Thermodynamic modeling of the U–Zr system—A revisit. J. Nucl. Mater. 2013, 443, 331–341. [Google Scholar] [CrossRef]
  23. Wills, J.M.; Eriksson, O.; Andersson, P.; Delin, A.; Grechnyev, O.; Alouani, M. Full-Potential Electronic Structure Method; Springer Series in Solid-State Science; Springer: Berlin/Heidelberg, Germany, 2010; Volume 167. [Google Scholar]
  24. Plimpton, S. Fast parallel algorithms for short range molecular dynamics. J. Comp. Phys. 1995, 117, 1–19. [Google Scholar] [CrossRef]
  25. Thompson, A.P.; Aktulga, H.M.; Berger, R.; Bolintineanu, D.S.; Brown, W.M.; Crozier, P.S.; In’T Veld, P.J.; Kohlmeyer, A.; Moore, S.G.; Nguyen, T.D.; et al. LAMMPS—A flexible simulation tool for particle-based materials modeling at the atomic, meso, and continuum scales. Comput. Phys. Commun. 2022, 271, 108171. [Google Scholar] [CrossRef]
  26. Morris, J.R.; Wang, C.Z.; Ho, K.M.; Chan, C.T. Melting line of aluminum from simulations of coexisting phases. Phys. Rev. B 1994, 49, 3109–3115. [Google Scholar] [CrossRef]
  27. Morris, J.R.; Song, X. The melting lines of model systems calculated from coexistence simulations. J. Chem. Phys. 2002, 116, 9352–9358. [Google Scholar] [CrossRef]
  28. Mendelev, M.I.; Han, S.; Srolovitz, J.; Ackland, G.J.; Sun, D.Y.; Asta, M. Development of new interatomic potentials appropriate for crystalline and liquid iron. Phil Mag. 2003, 83, 3977–3994. [Google Scholar] [CrossRef]
  29. Parrinello, M.; Rahman, A. Polymorphic transitions in single crystals: A new molecular dynamics method. J. Appl Phys. 1981, 52, 7182–7190. [Google Scholar] [CrossRef]
  30. Verlet, P. Computer "Experiments" on Classical Fluids. I. Thermodynamical Properties of Lennard-Jones Molecules. Phys. Rev B 1967, 159, 98–103. [Google Scholar] [CrossRef]
  31. Verlet, P. Computer "Experiments" on Classical Fluids. II. Equilibrium Correlation Functions. Phys. Rev. 1968, 165, 201–214. [Google Scholar] [CrossRef]
  32. Nosé, S. A molecular dynamics method for simulations in the canonical ensemble. Mol. Phys. 1984, 52, 255–268. [Google Scholar] [CrossRef]
  33. Hoover, W.G. Canonical dynamics: Equilibrium phase-space distributions. Phys. Rev. A 1985, 31, 1695–1697. [Google Scholar] [CrossRef] [PubMed]
  34. Söderlind, P. Theory of the crystal structures of cerium and the light actinides. Adv. Phys. 1998, 47, 959–998. [Google Scholar] [CrossRef]
  35. Perdew, J.P.; Burke, K.; Ernzerhof, M. Generalized gradient approximation made simple. Phys. Rev. Lett. 1996, 77, 3865–3868. [Google Scholar] [CrossRef]
  36. Xie, W.; Xiong, W.; Marianetti, C.A.; Morgan, D. Correlation and relativistic effects in U metal and U-Zr alloy: Validation of ab initio approaches. Phys. Rev. B 2013, 88, 235128. [Google Scholar] [CrossRef]
  37. Söderlind, P.; Landa, A.; Turchi, P.E.A. Comment on “Correlation and relativistic effects in U metal and U-Zr alloy. Phys. Rev. B 2014, 90, 157101. [Google Scholar] [CrossRef]
  38. Sadigh, B.; Kutepov, A.; Landa, A.; Söderlind, P. Assessing relativistic effects and electron correlation in the actinide metals Th-Pu. Appl. Sci. 2019, 9, 5020. [Google Scholar] [CrossRef]
  39. Hu, G.; Luo, C.; Wu, L.; Tang, Q.; Ren, Z.; Xu, B. Molecular dynamics simulation of solid/liquid interfacial energy of metallic uranium. J. Nucl. Mater. 2020, 538, 152183. [Google Scholar] [CrossRef]
  40. Stephens, H. Determination of the Enthalpy of Liquid Copper and Uranium with a Liquid Argon Calorimeter. High Temp. Sci. 1974, 6, 156–166. [Google Scholar]
  41. Fokin, L.R. Liquid Uranium, Density Isobar, 1406-3500 K. Analysis and Generalization of the Experimental data. In Problems of Atomic Science and Technology. Serie: Nuclear-Reactor Constants; 2016; Issue 3, pp. 24–36. Available online: https://vant.ippe.ru/en/year2016/3/thermal-physics-hydrodynamics/1188-2.html (accessed on 18 December 2024).
  42. Shapiro, A.B.; Summers, L.T.; Eckels, D.J.; Sahai, V. Modeling of Casting Microstructures and Defects; UCRL-ID-128519; LLNL Internal Report: Livermore, CA, USA, 1997. [Google Scholar]
  43. Shaner, J.W. Thermal expansion of metals over the entire liquid range. In Thermal Expansion; Peggs, I.D., Ed.; Plenum Publishing Company: New York, NY, USA, 1978; Volume 6, pp. 69–81. [Google Scholar]
  44. Grosse, A.V.; Cahill, J.A.; Kirshenbaum, A.D. Density of liquid uranium. J. Am. Chem. Soc. 1961, 83, 4665–4666. [Google Scholar] [CrossRef]
  45. Söderlind, P.; Eriksson, O.; Wills, J.; Boring, A. A unified picture of the crystal structures of metals. Nature 1995, 374, 524–525. [Google Scholar] [CrossRef]
  46. Imhoff, S.D. Uranium Density, Thermal Conductivity, Specific Heat, and Thermal Diffusivity. 2021, Report, LA-UR-21-21810, 02.24.2021, 20p. Available online: https://www.osti.gov/biblio/1768421 (accessed on 18 December 2024).
  47. Gurvich, L.V.; Veits, I.V.; Medvedev, V.A.; Yungman, V.S.; Bergman, G.A.; Iorish, V.S.; Gusarov, A.V.; Leonidov, V.Y.; Dorofeeva, O.V.; Nazarenko, I.I.; et al. Thermodynamic Properties of Individual Substances: Handbook; Glushko, V.P., Ed.; USSR: Nauka, Moscow, 1982; Volume 4. (In Russian) [Google Scholar]
  48. Einstein, A. Über die von der molekularkinetischen Theorie der Wärme geforderte Bewegung von in ruhenden Flüssigkeiten suspendierten Teilchen. Ann. Phys. 1905, 322, 549–560. [Google Scholar] [CrossRef]
  49. Ofte, D. The viscosity of liquid uranium, gold and lead. J. Nucl Mater. 1967, 22, 28–32. [Google Scholar] [CrossRef]
  50. Luo, S.-N.; Strachan, A.; Swift, D.C. Nonequilibrium melting and crystallization of a model Lennard-Jones system. J. Chem. Phys. 2004, 120, 11640–11649. [Google Scholar] [CrossRef] [PubMed]
  51. Luo, S.-N.; Swift, D.C. On asymmetry between superheating and supercooling in solid-liquid transitions: Landau models. J. Chem. Phys. 2004, 121, 7387–7389. [Google Scholar] [CrossRef]
  52. Kelton, K.F. Crystal Nucleation in Liquids and Glasses. Solid St. Phys. 1991, 45, 75–177. [Google Scholar]
  53. Luo, S.-N.; Ahrens, T.J.; Çaĝin, T.; Strachan, W.; Goddard III, W.A.; Swift, D.C. Maximum superheating and undercooling: Systematics, molecular dynamics simulations, and dynamic experiments. Phys. Rev. B 2003, 68, 134206. [Google Scholar] [CrossRef]
  54. Luo, S.-N.; Ahrens, T.J. Shock-induced superheating and melting curves of geophysically important minerals. Phys. Earth Planet. Inter. 2004, 143–144, 369–386. [Google Scholar] [CrossRef]
  55. Zhang, W.-J.; Liu, Z.-Y.; Liu, Z.-L.; Cai, L.-C. Melting curves and entropy of melting of iron under Earth’s core. Phys. Earth Planet. Inter. 2015, 244, 69–77. [Google Scholar] [CrossRef]
  56. Zhang, H.; Kalvapalle, P.; Douglas, J.F. String-like collective atomic motion in the melting and freezing of nanoparticles. J. Phys. Chem. 2011, 115, 14068–14076. [Google Scholar] [CrossRef]
  57. Thermophysical Properties of Materials for Nuclear Engineering: A Tutorial and Collection of Data; International Atomic Energy Agency (IAEA): Vienna, Austria, 2008.
  58. Beeler, B.; Casagranda, A.; Aagesen, L.; Zhang, Y.; Novascone, S. Atomistic calculations of the surface energy as a function of composition and temperature in g U-Zr to inform fuel performance modeling. J. Nucl. Mater. 2020, 540, 152271. [Google Scholar] [CrossRef]
  59. Aly, A.; Beeler, B.; Avramova, M. Ab initio molecular dynamics investigation of γ-(U,Zr) structural and thermal properties as a function of temperature and composition. J. Nucl. Mater. 2022, 561, 153523. [Google Scholar] [CrossRef]
  60. Starikov, S.V.; Kolotova, L.N.; Kuksin, A.Y.; Smirnova, D.E.; Tseplyaev, V.I. Atomistic simulation of cubic and tetragonal phases of U-Mo alloy: Structure and thermodynamic properties. J. Nucl. Mater. 2018, 499, 451–463. [Google Scholar] [CrossRef]
  61. Kolotova, L.; Gordeev, I. Structure and phase transition features of monoclinic and tetragonal phases in U–Mo alloys. Crystals 2020, 10, 69–77. [Google Scholar] [CrossRef]
  62. Starikov, S.; Smirnova, D. Details of structure transformations in pure uranium and U-Mo alloys: Insights from classical atomistic simulation. J. Nucl. Mater. 2023, 576, 154265. [Google Scholar] [CrossRef]
  63. Duong, T.C.; Hackenberg, R.E.; Attari, V.; Landa, A.; Turchi, P.E.; Arroyave, R. Investigation of the discontinuous precipitation of U-Nb alloys via thermodynamic analysis and phase-field modeling. Comput. Mater. Sci. 2020, 175, 109573. [Google Scholar] [CrossRef]
Figure 1. The measured temperature of the coexistence simulation of the solid and liquid phases as a function of MD steps.
Applsci 15 00896 g001
Figure 2. The atomic energy of uranium during heating, melting, and cooling as a function of temperature.
Applsci 15 00896 g002
Figure 3. The density of liquid uranium as a function of temperature. The experimental data are taken from Ref. [41].
Applsci 15 00896 g003
Figure 4. The electronic density of states for liquid uranium (solid black line) and γ-U at 1400 K and the same atomic density (red dashed lines). The vertical dashed line at zero energy indicates the Fermi level.
Applsci 15 00896 g004
Figure 5. The total specific heat of liquid uranium. The experimental data are taken from Refs. [15,46].
Applsci 15 00896 g005
Figure 6. Specific heat of γ-U and liquid uranium.
Applsci 15 00896 g006
Figure 7. The atomic energy of uranium as a function of temperature during cooling below 1400 K.
Applsci 15 00896 g007
Figure 8. The self-diffusion coefficient for liquid uranium. The results of the previous ab initio calculations are taken from Ref. [10]. The experimental data are taken from Ref. [49].
Applsci 15 00896 g008
Figure 9. Atomic energy of uranium for heating and cooling cycles.
Applsci 15 00896 g009
Disclaimer/Publisher’s Note: The statements, opinions and data contained in all publications are solely those of the individual author(s) and contributor(s) and not of MDPI and/or the editor(s). MDPI and/or the editor(s) disclaim responsibility for any injury to people or property resulting from any ideas, methods, instructions or products referred to in the content.