Featured Application
The results of the research reported in this article are applicable to the evaluation of the technological quality of products manufactured by additive methods by the fused filament fabrication (FFF) technique. They can also be helpful in selecting the parameters of the FFF process, considering the desired quality of the created models.
Abstract
Despite many studies, implementation of the additive manufacturing process in industrial and research practice is limited due to the numerous distortions affecting the obtained dependencies to a degree that is difficult to predict. No uniform methodology has been developed for the study of the impact of changes in the FFF parameters on the technological quality indicators. This paper presents a description of the original procedure for assessing technological quality using a reference component. The aim of the research was to analyze the impact of changes in the FFF additive manufacturing parameters on selected indicators of technological quality assessment of products. To compare the technological quality of the various models produced, measurements of surface roughness as well as dimensional and shape accuracy were carried out using stylus profilometry and coordinate measurement. The conducted tests showed that samples with a layer height of 0.12 mm have the most advantageous surface roughness parameters compared to the other layer heights of 0.16 mm and 0.20 mm tested. All the samples obtained were characterized by smaller dimensions than nominal, indicating the material shrinkage occurring during the FFF process. The study showed a negligible effect of material fill rate on surface roughness parameters as well as on the dimensions and shape accuracy. The obtained measurement results allow determining the most advantageous parameters of the FFF process depending on the adopted quality requirements.
1. Introduction
Additive is called the process of manufacturing 3D objects directly from a 3D CAD (Computer Aided Design) model, without the need to prepare special tools dedicated to the manufactured product. Colloquially, this process is called “3D printing” because of the direct relationship that makes it possible to obtain a physical object from a prepared 3D model. This fact makes the very process of obtaining a 3D CAD representation of the product relatively simple [1,2,3,4,5,6].
The first step in the additive manufacturing process is to define a computer model representing the product to be manufactured. Then, using special software dedicated to the method and the device. Information is generated about the individual layers of which the finished product will be composed. The layers are cross-sections of the product, which will be overlapped in the manufacturing process. The obtained information on individual layers is transferred to the software of the device, in which the process will be carried out [7].
Additive manufacturing methods are also referred to by the term rapid prototyping (RP). Originally, this technology was used to develop a new product or analyze prototypes. Due to the very fast time to obtain a physical representation of a 3D CAD model, this allowed designers to develop a new product quickly; hence the term rapid prototyping continues to be widely used. However, it was quickly recognized that additive manufacturing technology could have a much broader application than just assisting in the development of a new product. Significant improvements in accuracy, material availability, and speed of manufacturing make it possible to produce not only prototypes but also functional products with previously unseen shapes at very affordable prices [8,9].
Additive manufacturing is one of the three primary manufacturing methods, along with subtractive methods such as machining and abrasive machining, as well as forming methods such as casting and forging. The main factor that distinguishes additive methods from other manufacturing methods is that there is no need to produce technological tools for individual products. There is a relatively high degree of freedom in terms of the geometries of the products obtained. Additive manufacturing processes can generally be produced without direct process planning and sequence of operations. Although it is usually not so easy in practice, the unique features of additive techniques allow parts to be produced without defining tools, operations, molds, or fixtures, which is often a great convenience in the manufacturing process [1].
One of the more popular methods of additive manufacturing is fused filament fabrication (FFF), layer by layer, of thermoset polymer material. During the manufacturing process, raw plastic material in the form of a filament (a spool of plastic in the form of a wire with a diameter of 0.1 mm to 0.25 mm) is extruded through a heated component of the device, making it melt or plasticize. The material in this form is extruded through the head and then placed on the workspace (the first layer) or built up in successive layers of the manufactured model layer by layer [1,9,10,11].
The most used materials for the FFF method are ABS (acrylonitrile-co-butadiene-co-styrene) and PLA (polylactide). The device that produces products using the FFF method consists of a heated chamber or plate (for ABS it is about 80 °C) equipped with an extrusion head that extrudes the heated material at a temperature of 180 °C to 250 °C. The design of the device allows the head to move appropriately along the X and Y axes on a plotter principle, according to pre-programmed layers. The device, after laying down the current layer, moves the head or platform by a given value in the Z-axis, making it possible to build up the material layer by layer [1]. The correct temperature in the process and the fact that the material is in a semi-molten state make the layers stick together, thus making it possible to obtain a solid 3D product [12].
Transparent, black, white, or colored materials can be used to make a product in the FFF method. Products made using the FFF method are characterized by one color depending on the spool of material used; however, modern devices often have two heads that work in parallel, allowing the production of products with different colors and properties [1].
Products obtained by the FFF method resemble products obtained by plastic injection molding processes in shape and structure. However, it is important to keep in mind the right choice of parameters, such as the orientation of making the product, layer thickness, or process temperature. The correct orientation has a direct impact on the possibility of making the product with or without process supports (as the material must be overlapped) and on the process time [1].
The properties of the surface obtained by the FFF process depend on the above-mentioned parameters, but as in any additive manufacturing process, there is a stepping effect. In some cases, it is necessary to make support to hold the manufactured product. After the process is completed, manual processing is necessary, which involves the removal of previously made process supports [1]. To achieve better quality of the product, it is possible to reduce the thickness of the layer; however, such a solution is associated with a longer process time, which can last up to several days [6].
Analysis of the state of the art has shown that several additive manufacturing methods have been developed, each with specific limitations as well as different quality of the products and the materials that are used. Due to the nature of additive manufacturing processes, there is a stepping effect in the manufactured products, resulting from the build-up of layers on top of each other. The thickness of the layers results from the method adopted or the choice of parameters of the additive process. When manufacturing products using the FFF method, the parameters used have a direct impact on the dimensional and shape accuracy as well as on the strength properties of the manufactured products. Despite many studies on the additive manufacturing process parameters, their implementation in industrial and research practice is limited due to the numerous distortions affecting the obtained dependencies to a degree that is difficult to predict.
Current trends in the development of the FFF technique mainly focus on overcoming its fundamental limitations, which are shortcomings in the strength of models, their dimensional accuracy, and their morphology. Researchers are working intensively to expand the knowledge of the strength properties of models by determining, among other things:
- The effect of changing the values of various process parameters [13,14].
- The possibility of supporting the process with vibration to increase the strength of models and surface quality [15].
- The role of temperature in the formation of defects [16,17].
- The influence of structural features of products (cell size and wall thickness [18]).
- The influence of model operating conditions (e.g., cryogenic [19]).
- The influence of building material [20,21,22,23,24].
Especially in the latter area, significant potential for improving the FFF process is evident. There are two main developments in this regard. The first concerns the reinforcement of the building material with additives in the form of fibers [20,21] or with additives that improve crystallization, interlayer bonding, and mechanical performance of polylactide parts [21]. The second focuses on the possibility of using recycled polylactic acid filaments to build models using the FFF method [23,24].
The paper [20] describes the possibility of using fibrous reinforcement to strengthen the thermoplastic matrix to produce structurally complex, small-sized parts using the FFF method. Aligned discontinuous fiber composites allow obtaining models with higher formability and fewer defects. However, achieving such favorable results is strongly dependent on deposition speed, processing temperature, and layer thickness. This type of filament significantly affects the obtained strength properties of models. The possibility of reinforcing the building material with carbon fibers is also being investigated. Studies described in [21] have shown that the use of such an additive makes it possible to increase the maximum hardness of the model by up to 37.95% with respect to models made from pure PLA. This effect is caused by differences in the crystallinity of carbon fiber-reinforced PLA due to rapid heating/cooling of the fiber. On the other hand, the paper [22] presents the results of studies on improving the quality of interlayer bonding and reducing the mechanical anisotropy of PLA models by adding poly(ethylene glycol) (PEG) with various molecular weights. It was determined, among other things, that the obtained improvement of mechanical properties of models from the modified material is the result of enhanced molecular diffusion and entanglements at the bond zone, rather than the crystallinity of PLA parts.
The paper [23] made a comparative analysis of the technological quality of products shaped from virgin and recycled material. The surface roughness, dimensional deviations, and mechanical properties of the printed parts were considered. The results showed that recycled PLA required higher extrusion temperature and speed to extrude filament than virgin one. The tensile and flexural strength of manufactured parts from recycled material were more than 15% lower than that from virgin filament. The paper [24] investigates the thermal, rheological, and mechanical properties of PLA filament for large-format additive manufacturing after multiple (up to six) recycling processes. A multi-criteria evaluation of the material’s degradation due to recycling was applied using techniques such as gel permeation chromatography, differential scanning calorimetry, flow stress ramp tests, tensile tests, and colorimetry. As a result, the range of applications for this type of material was determined, confirming that it represents a potential alternative to virgin pellets for large-format material extrusion additive manufacturing. However, the great importance of the ecological impacts of the application of the FFF technique is manifested not only in research on the use of post-recycled plastics but also by exploring the energy aspects of the process. In recent work, researchers have addressed issues related to energy consumption in the material extrusion process of polylactic acid [25], including the possibility of predicting energy consumption based on mathematical modeling [26].
Research related to improving the strength properties of parts manufactured using the FFF technique is accompanied by intensive work on finding ways to improve the geometric accuracy of manufactured parts [27,28]. Both parameters related to dimensional accuracy and shape accuracy are being evaluated [27], as well as issues of surface morphology evaluation [28]. In a wider context, the above-mentioned research directions aim to improve the broadly understood quality of the FFF process and the product obtained in it. In this context, it seems interesting to search for methods of comprehensive analysis of the technological quality of parts. A proposal for such an approach is presented in the work [27], which proposes a synthetic geometrical performance index combining dimensional deviations and shape deviations of manufactured models to assess their technological quality. The construction of the index causes that the smaller the value of this index, the greater the part quality. The authors confirmed through experimental studies its usefulness in assessing the quality of parts produced by the FFF process from biological polymer. However, in the case described here, only the accuracy of the dimensions and shape of the part was not considered, omitting other possible criteria for assessing technological quality, such as surface roughness and mechanical strength.
A general definition of the concept of product quality in the literature refers to technological quality and service quality. Technological quality depends on the choice of method, parameters, material, and equipment used in the manufacturing process. It is characterized by the degree of reproduction of the finished product in relation to technical requirements or customer expectations. Factors characterizing technological quality include dimensional accuracy, shape accuracy, accuracy of mutual position, stress state, or surface roughness. Service quality, on the other hand, is a set of characteristics that can be characterized using the product and its applicability, such as functionality, durability, wearing, and reliability [29]. Hence, technological quality can be characterized in a measurable way by quality indicators such as accuracy of dimension, shape, or surface roughness, while service quality is a set of subjective characteristics about the product and its properties [30].
The characteristics of current trends in the development of the FFF method indicate that no uniform methodology for assessing technological quality in this sense has been developed. Attempts to generalize the evaluation of the quality of the FFF process and its results are characterized by a selective nature and are not sufficiently multi-criteria. Studies focus on strength, quality, or material aspects with limited integration of these aspects into a coherent evaluation system. This is mainly due to the complexity of the issue of creating models using the FFF technique and the multitude of directions for modifying this process. For the reasons mentioned above, it seems purposeful to develop a methodology for assessing technological quality, which, in the long perspective, will allow the development of a universal set of evaluation criteria to facilitate the comparison of the results of research conducted by different research teams. The present work is a case study that proposes an original approach to multi-criteria evaluation of the technological quality of products manufactured with additive techniques. It describes an original procedure for assessing the technological quality of the FFF process using a specially developed reference component from PLA, considering dimensional deviations, shape deviations, and surface roughness of the model.
2. Materials and Methods
2.1. Aim and Scope of the Study
The aim of the research was to define the key parameters of the FFF additive manufacturing process and then to analyze the impact of changes in parameters on selected indicators of technological quality assessment of products to identify the relationships occurring between process and quality parameters. To achieve this aim, it was necessary to:
- Develop an experimental test methodology.
- Develop a technological quality assessment methodology.
- Design a special model test geometry.
- Carry out the FFF additive manufacturing process in multiple variants.
- Measure selected output quantities of the process.
- Elaborate on the measurement results.
- Formulate conclusions based on the conducted experiments.
2.2. Model Material
The study was carried out using polylactic acid (PLA) as a model material. It is a biodegradable polymer belonging to the group of aliphatic polyesters. It is obtained from renewable raw materials, such as Corn meal. Polylactide is used mainly for biomedical purposes, including the production of dental implants and resorbable surgical threads. Nowadays it is also used as a filament in amateur and professional FFF additive manufacturing (3D printing) equipment. The properties of this material have been well studied, and its characteristics can be found in numerous literature sources, including, but not limited to: [31,32,33].
One of the key factors determining the achieved technological quality of models formed using the additive technique is the type and quality of the building material used. Currently, there is a wide range of manufacturers of filaments for the FFF technique, due to which the offered materials differ in composition, purity, homogeneity, or number of inclusions. Differences in the quality of the building material can occur even between batches from the same manufacturer. This paper does not consider the impact of the quality of the filament due to the substantive breadth of this issue. A revised version of the paper includes information clarifying this issue.
2.3. Experiment Plan and Set Parameters of the FFF Process
Main parameters of the FFF process (in addition to the type of building material) affecting process time and model quality are the height of the material layer to be applied, the distance between individual material paths, the head feed rate, the diameter of the material extrusion nozzle, the degree to which the model is filled with material (fill rate), the shape of the fill, the temperature of the material extrusion, and in some devices also the table temperature and the speed of the fan cooling the work zone. The orientation of the product on the work platform as well as the method the CAD model is processed into the STL batch file (including chord height, angle control, and step size) are also important. When creating models in additive processes, it is important to know the relationship of the various process parameters and their impact on the quality indicators of the product. It should also be noted that changing the value of the parameters also affects the time consumption of the process and, as a result, its cost. The most important advantages of the FFF method are the low cost of the model and the relatively short time to produce it, and it is most often because of these features that users decide to use the FFF method. However, these features can be achieved through a kind of compromise between the pursuit of high technological quality of the product and the process time determining its efficiency and cost. In the described research, the influence of two key parameters of the FFF process on selected indicators of model technological quality was studied. These were layer height and percentage fill rate. The selected parameters are easily controllable and significantly affect both the technological quality of the model as well as the process execution time, so examining their impact allows for making informed decisions regarding the aforementioned compromise.
By layer height, we mean the amount of material extruded during one pass in the Z axis. The layer height is always smaller than the diameter of the material extrusion head; in this case, the diameter is 0.4 mm. A smaller layer height results in a higher resolution of the manufactured product and, by definition, a better reproduction of the set geometry. Reducing the layer height also results in increased process time. During the conducted tests, samples were prepared at three values of layer height: 0.12 mm, 0.16 mm, and 0.20 mm.
The density of the filament fill of the manufactured product has a direct impact on its mechanical and geometric properties. The more material inside the fills, the more durable the finished product will be. Similarly, a higher percentage of fill will result in a longer process time. Due to the nature of the process and the stresses present in the material, the finished product may have deformations or deviations in size and shape [11]. During the conducted tests, models were produced with fill rates of 30%, 50%, and 70%.
Nine specimens produced with different parameters of the FFF process were prepared during the conducted research. Table 1 shows the experiment plan, according to which the models for the measurements were manufactured. Table 1 also provides information on the estimated manufacturing time of each model.

Table 1.
Experiment plan.
Other adjustable parameters of the FFF process remained unchanged, and their values are given below:
- Head temperature: 200 °C
- Build plate temperature: 50 °C
- Head feed rate: 50 mm/s
- Wall thickness: 0.8 mm
- Top/bottom thickness: 0.8 mm
- Top/bottom layers number: 4
- Fan speed: 100%
Experimental studies were carried out assuming the number of repetitions for each of the nine points of the experiment plan of n = 1. Preliminary tests carried out by the authors showed statistically acceptable repeatability of the results of the FFF process using PLA implemented on the used test stand equipped with the Ender-3 V2 device from Creality (Shenzhen, China) described in Section 2.5.
2.4. Geometry of the Reference Component and Measured Quantities
To conduct experimental studies, a special geometry of the reference component was developed to indicate differences in the technological quality of the shaped product caused by changes in the FFF process setpoints. Figure 1 shows a 3D CAD model of the component along with its dimensions. The geometry of the CAD model was developed with the following assumptions:
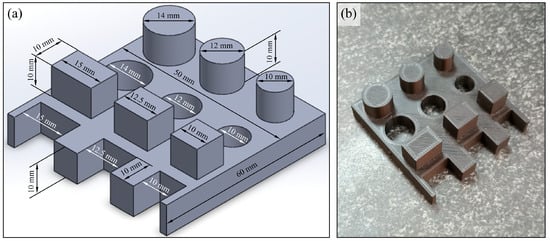
Figure 1.
An isometric view of the 3D CAD model of the reference component (a) and a view of the example physical model produced (b).
- The overall dimensions of the model must not exceed the dimensions of the working zone of the FFF machine.
- The model should have typical geometric features found in machine parts, such as cylindrical protrusions (external cylindrical surfaces), cylindrical openings (internal cylindrical surfaces), perpendicular protrusions, and perpendicular niches.
- The model should allow measurement of lateral surface roughness (perpendicular to the base plane).
- The model should allow measurement of dimensional and shape accuracy of geometric features using coordinate measuring techniques in X (width), Y (depth), and Z (height) axes.
- The model should be characterized by dimensional variation of geometric features in at least two axes (X and Y).
To compare the technological quality of the various models produced, measurements of surface roughness as well as dimensional and shape accuracy were carried out.
The measurement of the roughness profile of the test samples was carried out using a Mitutoyo SJ-210 stylus profilometer (Mitutoyo Corporation, Kawasaki, Japan) described in Section 2.6. The measurement was performed on the lateral surface to map the arrangement of layers formed in the FFF additive manufacturing process. The measurement was obtained at a length of 2.4 mm, with a stylus feed rate of 0.5 mm/s and a sampling resolution of 2.5 µm. The lateral surface area obtained as a result of overlapping layers was measured, so the effect of layer height on the roughness of the shaped model surface could be determined.
There are about 100 parameters by which the roughness of a measured profile can be defined; however, the following set of parameters was described and used in this paper:
- The Ra parameter is the average deviation of the peaks and valleys on the measured surface. The greater the difference between high points and depressions, the greater the value of the Ra parameter. It is used as a basic indicator for determining surface roughness because of its simplicity.
- The parameter Rq is the mean square deviation of the profile. This parameter is used to eliminate the influence of random impurities or scratches on the surface.
- The Rz parameter is the average value of the height of the largest peaks and valleys in the five measurement sections. This value represents the characteristics of the average deviation between peaks and valleys.
Dimensional and shape accuracy is defined by the degree of reproduction of the designed product relative to that obtained in the manufacturing process. In many applications it is allowed to reproduce the product with a certain deviation, i.e., the obtained dimension differs from the one specified in the design, to ensure the tolerance of the parts or due to the production process used and its limitations.
The dimensional and shape accuracy of the model produced by the FFF method is particularly dependent on the set process parameters and the accuracy of the guides and positioning system responsible for the precise positioning of the material extrusion nozzle in the working space of the device. In the case of the described tests, the characteristic dimensions of cylindrical openings and protrusions of various sizes, as well as parallelograms and niches in the material presented in Figure 1a, were measured. The test stand on which the measurements were realized was equipped with a CrystaApex V544 coordinate measuring machine from Mitutoyo (Mitutoyo Corporation, Kawasaki, Japan), described in Section 2.6.
2.5. Test Stand
The Ender-3 V2 device from Creality (Shenzhen, China) was used to carry out the research. This device was characterized by a rigid metal working platform, so the head movements are precise, and thus more accurate products are obtained during the process. The device allows manufacturing with filaments such as TPU (thermoplastic polyurethane) or PLA, and the manufacturing process was prepared in Cura Ultimaker 3 software. Figure 2 presents a general view of the described device, and Table 2 shows its basic technical parameters.
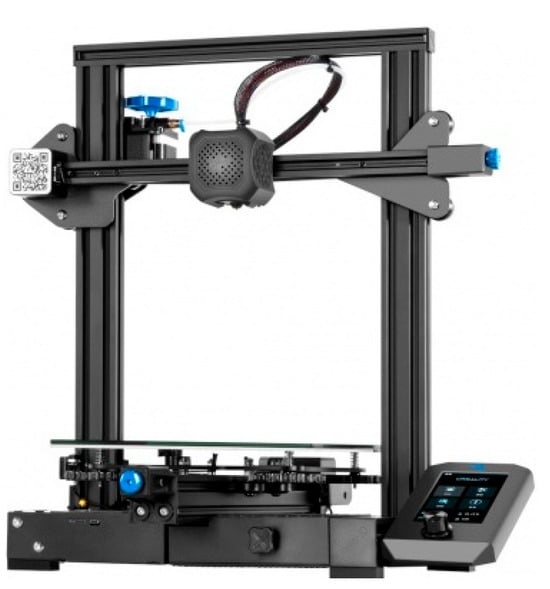
Figure 2.
General view of the Ender-3 V2 device used to conduct the tests [34].

Table 2.
Technical parameters of the Ender-3 V2 device [34].
2.6. Measurement Stands
The SJ-210 stylus profilometer from Mitutoyo (Mitutoyo Corporation, Kawasaki, Japan) was used for surface roughness measurements. It is a portable system that allows measurement of surface roughness profiles for various types of products directly at the workstation. The measurement was carried out by means of a powered arm placed on an adjustable tripod. The radius of the measuring tip was 2.0 µm. The device allows measurement according to many standards, including DIN, ISO, ANSI, and JIS, and the determination of a wide set of roughness parameters [35]. A view of the device during measurement is presented in Figure 3.
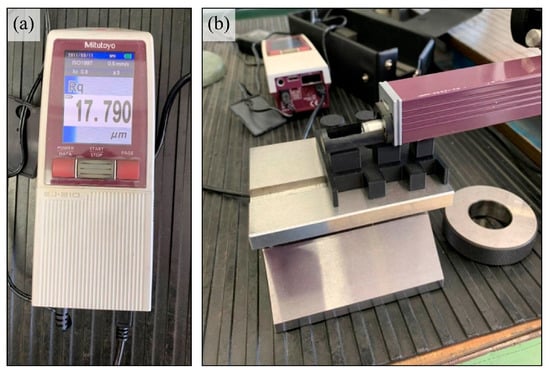
Figure 3.
View of the Mitutoyo SJ-210 surface microtopography measurement system equipped with a stylus profilometer: (a) general view; (b) view of the system during measurement.
Measurement of the dimensional and shape accuracy of the manufactured parts was realized using a CrystaApex V544 coordinate measuring machine (CMM) from Mitutoyo (Mitutoyo Corporation, Kawasaki, Japan). This system allows measurements in the range of 500 × 400 × 400 mm, using interchangeable measuring probes. The measurement resolution of the CMM is 0.0001 mm, which makes the obtained measurement results very precise. The manufacturer’s software designed for the CMM allows the measurements to be programmed, making it possible to automate the measurement process in industrial or laboratory conditions [36]. Figure 4 shows the CMM during measurement.
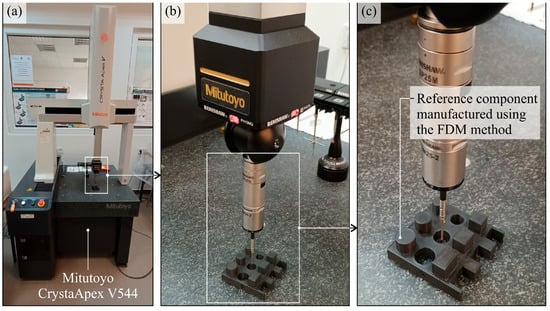
Figure 4.
Mitutoyo’s CrystaApex V544 coordinate measuring machine in the Metrology and Measurement Systems Laboratory of the Department of Production Engineering at Koszalin University of Technology: (a) general view; (b) view of the measuring head; (c) view of the measuring probe during measurement of one of the cylindrical openings in the model.
Figure 5 graphically illustrates the logical connections between the main stages of the work carried out in the scope of the described research, together with information summarizing the described methodology.
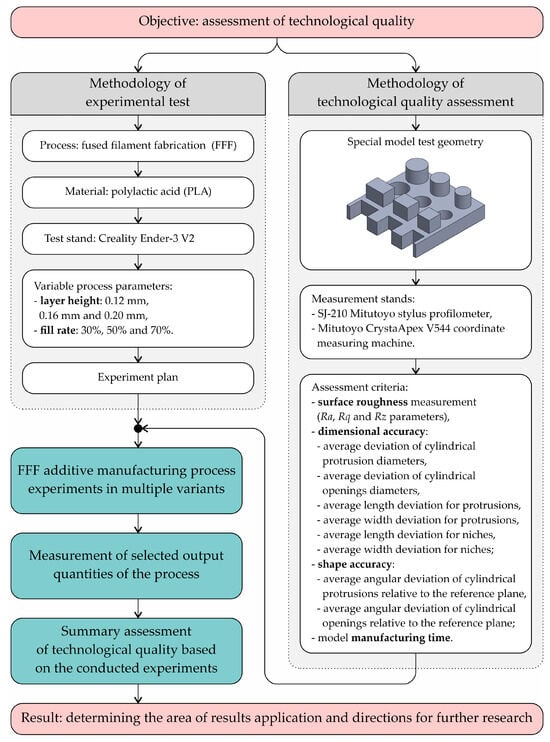
Figure 5.
Flow chart of logical connections between the main stages of the work carried out in the scope of the described research.
3. Results and Discussion
This section describes the experimental results obtained from the manufactured models. The analysis of the test results was divided into two parts relating to measurements of surface roughness (Section 3.1) as well as dimensional and shape accuracy (Section 3.2) of the produced models. In Section 3.3, a synthetic summary of the obtained measurement results was presented.
3.1. Results of Surface Roughness Measurement
Due to the layered nature of model formation in the FFF additive manufacturing process, the roughness parameters were determined on the side surface of the reference component in the vertical direction (perpendicular to the layer system). The sidewall is obtained by extruding successive layers in the Z-axis, and its roughness is directly influenced by the height of the layer of the applied filament. Figure 6 shows the results of measuring the Ra parameter values for analyzed models.
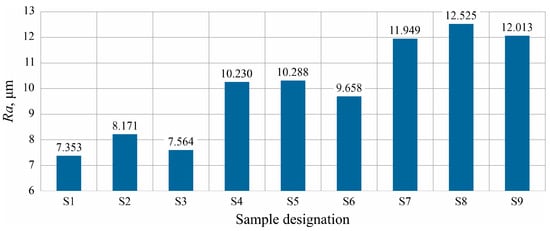
Figure 6.
Results of measurements of the Ra parameter values of the surface roughness of analyzed models.
As expected, the layer height has a direct effect on the value of the Ra parameter describing the average height of surface roughness. Increasing the layer height by 0.04 mm increased the value of the Ra parameter by an average of 2.23 µm when changing the height from 0.12 mm to 0.16 mm and further to 0.20 mm. For a layer height of 0.12 mm, the value of the Ra parameter for the produced samples averaged 7.70 µm, which is comparable to the surface obtained by drilling or the surface obtained by rough turning. No clear and unambiguous influence of the fill rate on the measured values of the Ra parameter was noted.
Figure 7 shows the results of measuring the values of the Rq parameter for individual models manufactured with varying FFF process parameters.
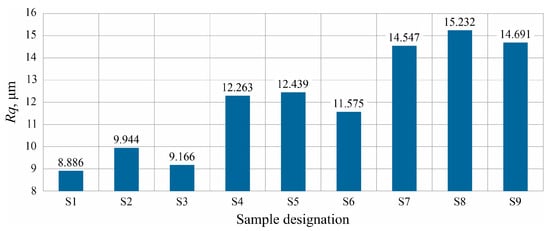
Figure 7.
Results of measurements of the Rq parameter values of the surface roughness of analyzed models.
Similarly, to the Ra parameter, a lower value of the Rq parameter should be assessed as more beneficial and indicating a higher quality of the manufactured model. In the case of the mean square deviation of the profile Rq, an increase of its value by an average of 2.74 µm can be observed for a change in the layer height by 0.04 mm resulting from the applied experiment plan.
Figure 8 presents a chart of changes in the value of the Rz parameter measured on the lateral surface of analyzed models.
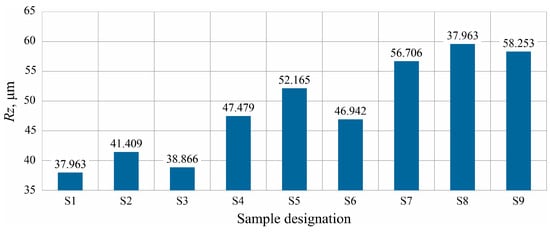
Figure 8.
Results of measurements of the Rz parameter values of the surface roughness of analyzed models.
The value of the Rz parameter determines the average amplitudes between peaks and valleys on the measurement section. A lower value is more beneficial considering the assessment of the technological quality and accuracy of model geometry mapping. On average, the value of the Rz parameter increases by 9.38 µm with an increase in the layer height by 0.04 mm (from 0.12 mm to 0.16 mm and further to 0.20 mm).
The obtained results of measurements of selected parameters of the surface roughness of the models revealed a strong relationship between the layer height and the surface roughness. The measurements can be used to estimate the influence of the layer height on the obtained values of surface parameters when selecting the adjustable parameters of the FFF process carried out in similar conditions using PLA as the model material. The obtained set of results did not allow for determining a clear and unambiguous influence of changes in the percentage of the filling degree on the measured values of selected parameters describing the roughness of the lateral surface of the models (Ra, Rq, and Rz).
Figure 9 shows the measured lateral surface profiles for representative samples from the group with different layer heights.
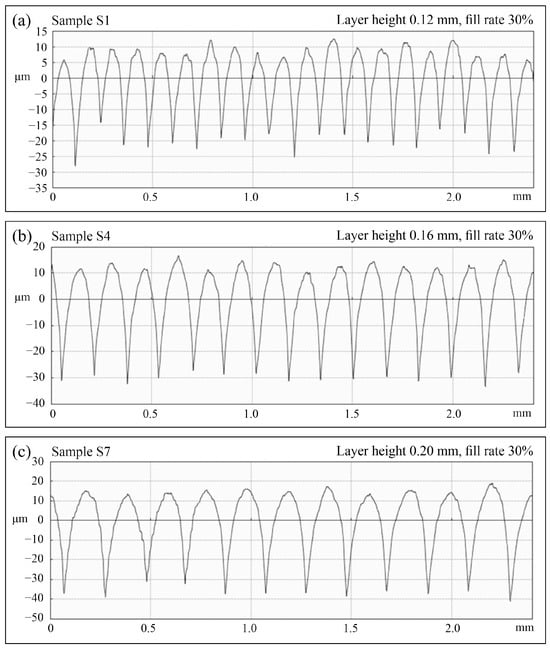
Figure 9.
Side surface roughness profiles recorded by stylus profilometry for selected models produced with three different layer heights: (a) profile of sample S1, layer height 0.12 mm, fill rate 30%; (b) profile of sample S4, layer height 0.16 mm, fill rate 30%; (c) profile of sample S7, layer height 0.20 mm, fill rate 30%.
According to the characteristics of the FFF process, the S1 sample manufactured using a 0.12 mm layer was characterized by a higher density of peaks and valleys compared to the other samples. This directly affects the height of the surface unevenness—mainly by limiting the depth of the valleys. As a result, a model of higher technological quality was obtained, but it was obtained by dividing the 3D CAD model into a larger number of layers during the preparation of the process and ultimately requires a larger number of working passes, extending the manufacturing time.
3.2. Results of Measuring the Accuracy of Dimensions and Shape of the Manufactured Models
The geometry of the reference component was developed in such a way that it was possible to determine the influence of the tested parameters of the FFF additive manufacturing process on selected indicators of technological quality assessment. In Figure 10, the reference plane is marked in red, against which the angle of perpendicularity of cylindrical geometries (cylindrical openings and protrusions) marked in green was measured.
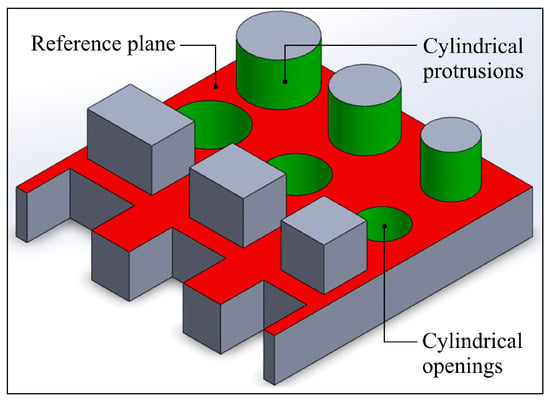
Figure 10.
Measured geometric features marked on the isometric view of the 3D CAD model of the reference component: the red color indicates the reference plane against which the perpendicularity of the cylindrical geometries marked in green was measured.
To determine the plane during measurements on the coordinate measuring machine, points were recorded, which were then averaged, thus obtaining the plane. Cylinders were measured by recording points along the circumference at three heights, and then the result of each measurement was averaged to indicate the average value of the cylinder diameter. Figure 11 contains charts presenting obtained measurements results of the average deviation of the outer diameter of cylindrical protrusions relative to the nominal diameter (Figure 11a) and the average deviations of the perpendicular angle of the cylindrical protrusions axis relative to the reference plane (Figure 11b).
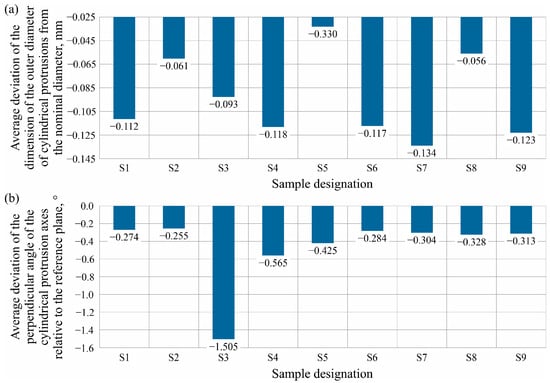
Figure 11.
Charts showing the obtained measurement results: (a) average deviation of the outside diameter dimension of cylindrical protrusions from the nominal diameter; (b) average deviation of the perpendicular angle of the cylindrical protrusion axes relative to the reference plane.
Each of the measured geometries was characterized by dimensions smaller than the specified ones, which is due to the accuracy of the print head positioning system during the application of individual layers of material and the thermal shrinkage of PLA. The results of the measurements show that the models with a fill rate of 50% (samples S2, S5, and S8) were characterized by the most accurate representation of the outer diameters of the cylindrical protrusions (dimension deviation ranges from −0.033 to −0.061 mm). In the case of angular deviation, no correlations can be found, except for the occurrence of an angular deviation significantly larger than the other models for sample S3 (−1.505°). This could be due to the occurrence of an interference in the additive manufacturing process, such as vibration of the base, unsticking of the model from the working table during the process, or deformations occurring due to cooling and solidification of PLA. It is also worth noting that the samples produced using a higher layer are characterized by larger diameter deviations of about 0.01 mm compared to the values obtained with layer heights of 0.12 mm and 0.20 mm.
Figure 12 shows the results of coordinate measurements for the openings diameters of the individual samples, with Figure 12a plotting the average deviation of the hole’s inner diameter dimension against the nominal diameter and Figure 12b plotting the average deviation of the perpendicular angle of the openings axes relative to the reference plane.
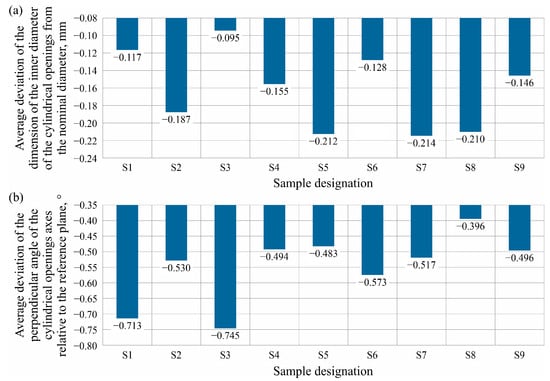
Figure 12.
Charts showing the obtained measurement results: (a) average deviation of the dimension of the inner diameter of the cylindrical openings from the nominal diameter; (b) average deviation of the perpendicular angle of the cylindrical openings axes relative to the reference plane.
For the openings (as in the case of cylindrical protrusions), the diameters measured on the models manufactured by the FFF method are characterized by smaller values with respect to the designed nominal dimension. The results of the measurements showed that openings made with a 50% fill rate (the opposite of what was the case for cylindrical protrusions) are characterized by larger dimensional deviations relative to samples made with the same layer height but a different fill rate. However, in the case of the angular deviation of the opening’s axis, the same samples were characterized by the relatively most accurate representation of the right angle in relation to the reference plane. In addition, an upward trend in dimensional deviation can be observed with increasing material layer height.
Figure 13 graphically presents another set of features measured as part of the assessment of the dimensional and shape accuracy of the reference component. The surface of the model, highlighted in red, was used to determine the reference plane in measuring the perpendicularity of the protrusions and niches walls (highlighted in blue in Figure 13). The walls of the perpendicular protrusions and niches were measured relative to each other to determine the deviation in length and width of these geometric features of the samples. The measurement, as in the case of cylindrical features, was completed by contact measurement at different heights of the walls, which made it possible to determine the distance between the planes of the protrusions and niches.
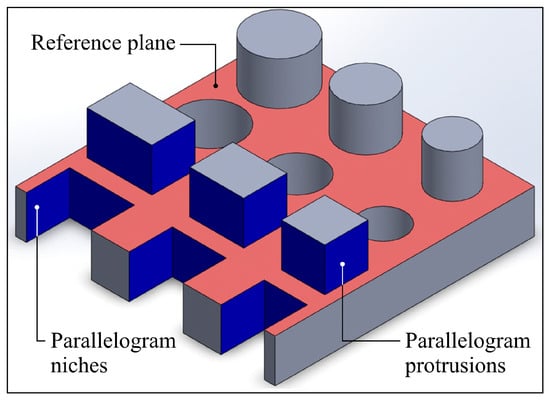
Figure 13.
Measured geometric features marked on the isometric view of the 3D CAD model of the reference component: the red color indicates the reference plane against which the perpendicularity of the geometries marked in blue was measured.
Figure 14 presents a chart of length and width deviation of perpendicular protrusions for the nine samples measured.
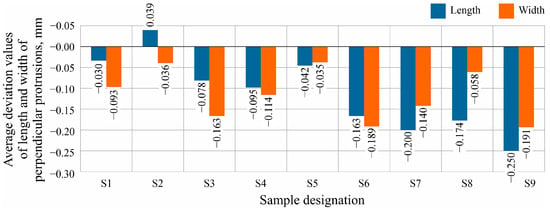
Figure 14.
Average values of length and width deviation of perpendicular protrusions for the nine samples measured.
The measured values of the length and width deviations of the perpendicular protrusions indicate that the accuracy of the CAD model geometry reproduction in the FFF additive manufacturing process decreases with increasing layer height. In addition, samples with a fill rate of 50% have smaller values of dimensional deviations compared to samples with the same layer height but a different percentage of material filling. Most of the dimension deviation values are below the nominal dimension, which is due to thermal shrinkage of the filament material.
Figure 15 presents a chart of length and width deviation of perpendicular niches for the nine samples measured.
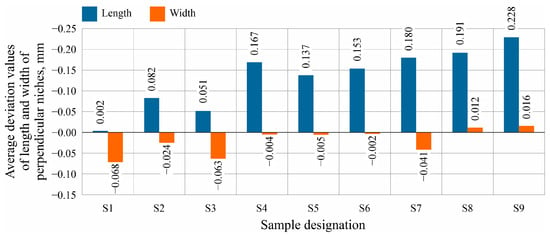
Figure 15.
Average values of length and width deviation of perpendicular niches for the nine samples measured.
As in the case of protrusions, niches are characterized by deteriorating geometric feature reproduction with increasing layer height. For example, for a fill rate of 70%, the niche length increases from 0.051 mm, with a layer height of 0.12 mm, to 0.228 mm for a layer height of 0.20 mm. For width, the deviation values range from −0.068 mm to 0.016 mm. This indicates the need to consider the thermal shrinkage of the filament material.
3.3. Summary of Research Results
The conducted tests of surface roughness, as well as dimensional and shape accuracy, allowed for the elaboration of samples classification according to the adopted criteria for technological quality assessment. The prepared ranking was presented in Table 3.

Table 3.
Classification of individual samples with respect to the assessed indicators of technological quality.
Based on the data in Table 3, it is possible to select FFF process parameters to achieve the most favorable results for the various technological quality indicators considered in the described studies. In the case of process time, samples with higher layers and lower fill rates are produced faster due to the lower number of working passes of the printing device.
Samples with lower layers of material lining were characterized by the best technological quality according to the tested parameters. Sample S1 was characterized by the most favorable quality parameters, while sample S9 meets them to the least extent. However, it should be emphasized that the selection of FFF process parameters each time depends on the characteristics of the geometry of the manufactured product, the required surface roughness, the available process time, or (not tested in this case) the mechanical strength of the model. Summarizing the conducted research, the following can be stated:
- The lower layer height of 0.12 mm has a direct, beneficial effect on the obtained roughness of the product’s lateral surfaces relative to samples with layer heights of 0.16 mm or 0.2 mm.
- For models with the same layer height, samples with a 50% fill rate have slightly worse surface roughness parameters, probably due to the fill pattern used or the deformation occurring in the material during the process.
- Cylindrical protrusions obtained using a 50% fill rate have the smallest deviations in diameter dimension compared to other samples obtained using the same layer height.
- All diameters of cylindrical protrusions and openings have a dimension below the nominal value, which indicates shrinkage of the obtained protrusion during the FFF process.
- Cylindrical openings obtained using a 50% fill rate have the largest deviations in diameter dimension, averaging −0.061 mm compared to other samples obtained using the same layer height.
- The angular deviation error for cylindrical openings decreases when using the higher layer, on average from 0.663° for 0.12 mm to 0.470° for 0.2 mm.
- Samples manufactured with a 50% fill rate have a smaller cylinder diameter deviation relative to models obtained with the same layer height.
- 8 out of 9 models are characterized by protrusions with dimensions below the nominal from −0.03 mm to −0.25 mm; the only sample with a dimension larger than nominal is sample S2.
- The length of the created niches expands from the nominal by an average of 0.15 mm, due to shrinkage of the material dividing the cavities.
The results of the described studies are valid only within the assumed range of variability of the process conditions, which also applies to the scale of the model. There is a large group of machine parts with similar dimensions, and in these cases the results of the described research may be applicable. The transfer of the obtained research results both to models of significantly larger and significantly smaller dimensions is not a trivial issue and cannot be implemented based on simple scaling, primarily due to the unique nature of additive manufacturing of models using layers (the range of variation in layer thickness determines the range of potential scaling possibilities).
4. Conclusions
This paper describes the author’s methodology for studying the influence of the FFF additive manufacturing process parameters on the technological quality of shaped models. As a result, the influence of layer thickness and fill rate on the surface roughness as well as dimensional and shape accuracy of the manufactured models was determined. The analysis of the state of the art made it possible to identify the main limitations of manufacturing by additive methods and then enabled the development of the original research methodology adapted to the assessment of the technological quality of products shaped using the FFF method. For this purpose, a test model (reference component) with a special geometry was developed and fabricated, enabling the measurement of typical geometric features of products. The following conclusions were drawn from the verification tests conducted.
- Layer height has a direct impact on the dimensional and shape accuracy of the models. Samples with a layer height of 0.12 mm have the most advantageous surface roughness parameters compared to the other layer heights of 0.16 mm and 0.20 mm tested.
- The study showed a negligible effect of material fill rate on surface roughness parameters. Samples with a 50% fill rate showed less favorable surface roughness parameters by an average of 6.5% compared to samples with a 30% and 70% fill rate.
- All the samples obtained were characterized by smaller dimensions than nominal, with an average of −0.112 mm for protrusions and −0.128 mm for cylindrical diameters, indicating the material shrinkage occurring during the FFF additive manufacturing process. To obtain the indicated products, it would be necessary to properly enlarge the 3D model relative to the assumed one, depending on the parameters used, thus eliminating the effects of material shrinkage.
- The obtained results of measurements of the accuracy of dimensions and shape indicate that the fill rate has a much smaller influence on the measured deviations than the height of the material layer applied in the FFF process.
The presented methodology for proceeding with the results of the research work and its analysis is an example of one of many possible solutions to the lack of a uniform methodology for evaluation of changes in the FFF process parameters on the technological quality assessment, identified based on the literature analysis. The described experiments may contribute to the development of a more universal strategy for evaluating the quality of the results of additive processes.
In further work, the authors want to focus on extending the set of indicators for assessing the technological quality of models to include strength parameters. It is also possible to expand the scope of analysis to include the remaining adjustable parameters of the FFF process. Expanding the set of input and output parameters of the studied process could consequently lead to the development of guidelines for evaluating the effects of the FFF process of a more universal nature, applicable by other researchers and in industrial practice. An important direction for further research work is also to determine the influence of the quality of the filament material, its manufacturer, and differences resulting from batches or types.
Author Contributions
Conceptualization, K.N. and M.Ł.; methodology, K.N., W.Z. and M.Ł.; software, W.Z. and M.Ł.; validation, K.N.; formal analysis, M.Ł. and K.N.; investigation, M.Ł. and W.Z.; resources, K.N.; data curation, M.Ł. and W.Z.; writing—original draft preparation, M.Ł.; writing—review and editing, K.N.; visualization, M.Ł.; supervision, K.N.; project administration, K.N.; funding acquisition, K.N. and M.Ł. All authors have read and agreed to the published version of the manuscript.
Funding
This research received no external funding.
Institutional Review Board Statement
Not applicable.
Informed Consent Statement
Not applicable.
Data Availability Statement
The data presented in this study are available on request from the corresponding author because they require licensed software to process them.
Conflicts of Interest
The authors declare no conflicts of interest.
References
- Gebhardt, A. Understanding Additive Manufacturing; Hanser: New York, NY, USA, 2011; pp. 2–62. [Google Scholar]
- Bandyopadhyay, A.; Bose, S. Additive Manufacturing; CRC Press: Boca Raton, FL, USA, 2020; pp. 1–93. [Google Scholar]
- Moltich-Hou, M. Overview of additive manufacturing process. In Materials, Processes, Quantifications and Applications; Butterworth-Heinemann: Oxford, UK, 2018; pp. 1–38. [Google Scholar]
- Kalyan, S.; Kumar, H.; Nagdeve, L. Latest trends in Additive manufacturing. In IOP Conference Series: Materials Science and Engineering; IOP Publishing: Bristol, UK, 2020; Volume 1104. [Google Scholar]
- Stavropoulos, P.; Foteinopoulos, P. Modelling of additive manufacturing processes: A review and classification. Manuf. Rev. 2018, 5, 2. [Google Scholar] [CrossRef]
- Wong, K.V.; Hernandez, A. A Review of Additive Manufacturing. Int. Sch. Res. Not. 2012, 2012, 10. [Google Scholar] [CrossRef]
- Prakash, K.; Nancharaih, T.; Subba Rao, V.V. Additive Manufacturing Techniques in Manufacturing—An Overview. Mater. Today Proc. 2017, 5, 3873–3882. [Google Scholar] [CrossRef]
- Gibson, I.; Rosen, D.; Stucker, B.; Khorasani, M. Additive Manufacturing Technologies; Springer: Berlin/Heidelberg, Germany, 2021; pp. 2–285. [Google Scholar]
- Montez, M.; Willis, K.; Rendler, H.; Marshall, C.; Rubio, E.; Rajak, D.K.; Rahman, M.H.; Menezes, P.L. Chapter 5—Fused deposition modeling (FDM): Processes, material properties, and applications. In Elsevier Series on Tribology and Surface Engineering, Tribology of Additively Manufactured Materials; Kumar, P., Misra, M., Menezes, P.L., Eds.; Elsevier: Amsterdam, The Netherlands, 2022; pp. 137–163. ISBN 9780128213285. [Google Scholar] [CrossRef]
- Dudek, P. FDM 3D Printing technology in manufacturing composite elements. Arch. Metall. Mater. 2013, 58, 4. [Google Scholar] [CrossRef]
- Solomon, I.J.; Sevvel, P.; Gunasekaran, J. A review on the various processing parameters in FDM. Mater. Today Proc. 2020, 37, 509–514. [Google Scholar] [CrossRef]
- Gordelier, T.J.; Thies, P.R.; Turner, L.; Johanning, L. Optimising the FDM additive manufacturing process to achieve maximum tensile strength: A state-of-the-art review. Rapid Prototyp. J. 2019, 25, 953–971. [Google Scholar] [CrossRef]
- Cláudio, R.A.; Dupont, J.; Baptista, R.; Leite, M.; Reis, L. Behaviour evaluation of 3D printed polylactic acid under compression. J. Mater. Res. Technol. 2022, 21, 4052–4066. [Google Scholar] [CrossRef]
- Usman, A.; Sandhu, K.; Singh, S.; Singh, H. Chapter 1-On quality characteristics of additively manufactured polypropylene (PP). In Woodhead Publishing Reviews: Mechanical Engineering Series, Innovative Processes and Materials in Additive Manufacturing; Singh, S., Prakash, C., Ramakrishna, S., Eds.; Woodhead Publishing: Sawston, UK, 2023; pp. 1–19. ISBN 9780323860116. [Google Scholar] [CrossRef]
- Siyajeu, Y.; Jiang, S.; Wen, B.; Li, H. Investigation on the improvement of mechanical properties and surface quality of the polylactic acid (PLA) fused filament fabrication parts manufactured without and with vibrations dependent utilization. J. Mech. Behav. Biomed. Mater. 2023, 143, 105949. [Google Scholar] [CrossRef]
- Zhang, J.; Neeckx, J.; Troukens, J.; Ferraris, E. A reheating temperature criterion for adaptive strategy in fused filament fabrication. CIRP Ann. 2022, 71, 197–200. [Google Scholar] [CrossRef]
- Vanaei, H.R.; Khelladi, S.; Deligant, M.; Shirinbayan, M.; Tcharkhtchi, A. Numerical Prediction for Temperature Profile of Parts Manufactured using Fused Filament Fabrication. J. Manuf. Process. 2022, 76, 548–558. [Google Scholar] [CrossRef]
- Netto, J.J.; Sardinha, M.; Leite, M. Influence of the cell size and wall thickness on the compressive behaviour of fused filament fabricated PLA gyroid structures. Mech. Mater. 2024, 195, 105051. [Google Scholar] [CrossRef]
- Vaught, L.; Gonzalez, E.; Meyer, J.L.; Polycarpou, A.A. Rapid qualification of fused filament fabrication thermoplastics for cryogenic applications. Polym. Test. 2023, 129, 108288. [Google Scholar] [CrossRef]
- Krajangsawasdi, N.; Longana, M.L.; Hamerton, I.; Woods, B.K.; Ivanov, D.S. Batch production and fused filament fabrication of highly aligned discontinuous fibre thermoplastic filaments. Addit. Manuf. 2021, 48, 102359. [Google Scholar] [CrossRef]
- Ansari, A.A.; Kamil, M. Izod impact and hardness properties of 3D printed lightweight CF-reinforced PLA composites using design of experiment. Int. J. Lightweight Mater. Manuf. 2022, 5, 369–383. [Google Scholar] [CrossRef]
- Gao, X.; Qi, S.; Zhang, D.; Su, Y.; Wang, D. The role of poly (ethylene glycol) on crystallization, interlayer bond and mechanical performance of polylactide parts fabricated by fused filament fabrication. Addit. Manuf. 2020, 35, 101414. [Google Scholar] [CrossRef]
- Wei, X.; Bähr, R. A comparative study of 3D printing with virgin and recycled polylactic acid filaments. CIRP J. Manuf. Sci. Technol. 2024, 54, 75–84. [Google Scholar] [CrossRef]
- Romani, A.; Perusin, L.; Ciurnelli, M.; Levi, M. Characterization of PLA feedstock after multiple recycling processes for large-format material extrusion additive manufacturing. Mater. Today Sustain. 2024, 25, 100636. [Google Scholar] [CrossRef]
- Devito, F.; Mazzarisi, M.; Dassisti, M.; Lavecchia, F. Causal technological model for predicting void fraction and energy consumption in material extrusion process of polylactic acid. J. Manuf. Process. 2024, 129, 187–201. [Google Scholar] [CrossRef]
- Manford, D.; Budinoff, H.D.; Callaghan, B.J.; Jeon, Y. Towards a general model to predict energy consumption for fused filament fabrication. Manuf. Lett. 2023, 35, 1358–1365. [Google Scholar] [CrossRef]
- Vendittoli, V.; Polini, W.; Walter, M.S. Geometrical deviations of green parts due to additive manufacturing: A synthetic geometrical performance index. Procedia CIRP 2022, 114, 159–164. [Google Scholar] [CrossRef]
- Karamimoghadam, M.; Dezaki, M.L.; Zolfagharian, A.; Bodaghi, M. Influence of post-processing CO2 laser cutting and FFF 3D printing parameters on the surface morphology of PLAs: Statistical modelling and RSM optimization. Int. J. Lightweight Mater. Manuf. 2023, 6, 285–295. [Google Scholar] [CrossRef]
- Huang, T.; Wang, S.; He, K. Quality Control for Fused Deposition Modeling Based Additive Manufacturing: Current Research and Future Trends. In Proceedings of the 2015 First International Conference on Reliability Systems Engineering, Beijing, China, 21–23 October 2016; pp. 1–6. [Google Scholar]
- Anitha, R.; Arunachalam, S.; Radhakrishnan, P. Critical parameters influencing the quality of prototypes in fused deposition modelling. J. Mater. Process. Technol. 2001, 118, 385–388. [Google Scholar] [CrossRef]
- Nagarajan, V.; Mohanty, A.K.; Misra, M. Perspective on Polylactic Acid (PLA) based Sustainable Materials for Durable Applications: Focus on Toughness and Heat Resistance. ACS Sustain. Chem. Eng. 2016, 4, 2899–2916. [Google Scholar] [CrossRef]
- Simmons, H.; Tiwary, P.; Colwell, J.E.; Kontopoulou, M. Improvements in the crystallinity and mechanical properties of PLA by nucleation and annealing. Polym. Degrad. Stab. 2019, 166, 248–257. [Google Scholar] [CrossRef]
- Martin, O.; Avérous, L. Poly(lactic acid): Plasticization and properties of biodegradable multiphase systems. Polymer 2001, 42, 6209–6219. [Google Scholar] [CrossRef]
- Available online: https://www.creality.com/products/ender-3-v2-3d-printer-csco (accessed on 23 November 2024).
- Available online: https://shop.mitutoyo.pl/web/mitutoyo/pl_PL/mitutoyo/1292249246959/Surftest%20SJ-210R%20%5Bmm%5D/$catalogue/mitutoyoData/PR/178-562-11D/index.xhtml (accessed on 23 November 2024).
- Available online: https://shop.mitutoyo.pl/web/mitutoyo/pl_PL/mitutoyo/CRYSTA-APEX%20S900%20Series/CRYSTA%20APEX%20V%20544%20CNC%20CMM/$catalogue/mitutoyoData/PR/191-121/index.xhtml (accessed on 23 November 2024).
Disclaimer/Publisher’s Note: The statements, opinions and data contained in all publications are solely those of the individual author(s) and contributor(s) and not of MDPI and/or the editor(s). MDPI and/or the editor(s) disclaim responsibility for any injury to people or property resulting from any ideas, methods, instructions or products referred to in the content. |
© 2025 by the authors. Licensee MDPI, Basel, Switzerland. This article is an open access article distributed under the terms and conditions of the Creative Commons Attribution (CC BY) license (https://creativecommons.org/licenses/by/4.0/).