Article

Occurrence of Aflatoxin M1 in Raw and Processed Milk: A Contribution to Human Exposure Assessment After 12 Years of Investigation

Chemistry Department, Istituto Zooprofilattico Sperimentale della Puglia e della Basilicata, Via Manfredonia 20, 71121 Foggia, Italy
*
Author to whom correspondence should be addressed.
Appl. Sci. 2025, 15(2), 853; https://doi.org/10.3390/app15020853
Submission received: 7 December 2024 / Revised: 5 January 2025 / Accepted: 14 January 2025 / Published: 16 January 2025
(This article belongs to the Special Issue Recent Advances in the Processing of Milk and Milk Products)

Abstract

:
The aim of this study was to estimate the aflatoxin M1 (AFM1) contamination in raw milk and processed milk (pasteurized or UHT) collected from two regions in Italy (Puglia and Basilicata) during a 12-year period: 2012–2023. A total of 1017 milk samples were analyzed first proceeding with screening analysis by enzyme-linked immunosorbent assay (ELISA), and suspected non-compliant samples (AFM1 concentration higher than 0.042 µg/kg) were then analyzed by high performance liquid chromatographic with fluorimetric detection (HPLC/FLD) confirmation method. AFM1 concentration ≥ 0.005 µg/kg (ELISA limit of quantitation) was detected in 553 of the 1017 milk samples (54.4%). AFM1 levels exceeding the European Union maximum limit (ML) of 0.050 µg/kg were detected in 70 samples, 49 of which were determined as non-compliant samples (4.8%). Particularly high concentrations of AFM1, exceeding 200 µg/kg, were found in four samples, three raw milk and one pasteurized. Regarding this risk exposure study, only the MOE values obtained under “high exposure scenario” were lower than 10,000, while those calculated from the overall mean values resulted as not of concern.

1. Introduction

Climate change has been reported as a driver for emerging food and feed safety issues worldwide [1], and the presence of mycotoxins is one of the most important food safety hazards affected by this issue [2,3]. To date, more than 300 mycotoxins have been identified [4,5]. Among them, the aflatoxins (AFs) group is probably of greatest importance regarding human health, with significant economic repercussions.
AFs are particularly important because of their prevalence and their high toxicity. These compounds are secondary metabolites produced by molds belonging to Aspergillus species, especially Aspergillus flavus, Aspergillus parasiticus, and Aspergillus nomius [6], which can grow on a wide variety of foods and feeds under favorable temperature and humidity [7].
Aflatoxins became globally known in the 1960s, when they were isolated and identified as the cause of ‘Turkey X disease’ in England, a very serious intoxication that affected a large number of turkeys fed with Brazilian peanuts contaminated by Aspergillus flavus. Contamination by AFs can take place at any point along the food chain from the field, harvest, handling, shipment and storage [8].
In farm animals, chronic exposure to AFs can reduce performance, alter liver function, compromise immune function, and increase disease susceptibility [9]. The susceptibility of both humans and animals can vary with regard to many factors such as age, exposure length, species, nutrition, etc. It is also worth noting another significant variable which is the possible co-occurrence of different mycotoxins in food and feed (synergistic action) [10].
There are more than 20 known AFs, but regarding food safety the most relevant ones are aflatoxin B1 (AFB1), aflatoxin B2 (AFB2), aflatoxin G1 (AFG1), aflatoxin G2 (AFG2), and aflatoxin M1 (AFM1) [11,12]. AFM1 is a 4-hydroxylated derivate of aflatoxin B1 (AFB1), formed in the liver by the group of cytochrome P450 (CYP450) enzymes, so it can be found in the milk of cattle fed with AFB1-contaminated feed. A percentage in the range 0.3–6.2% of AFB1 in feed is converted to AFM1 [13]. This percentage depends on the genetic features of the animals, breed, period of lactation, and environmental factors [14,15]. In dairy cows, the excretion takes 12–24 h after AFB1 intake, and the depuration interval is about 2–3 days from feeding with AFB1-free feed [16,17,18].
Regarding human health, the International Agency for Research on Cancer (IARC) has classified AFB1 as a human carcinogen (Group 1), while its metabolite AFM1 is considered less toxic and has been classified as a possible human carcinogen, Group 2B [19,20]. The liver is the main target organ, as demonstrated by several studies conducted on aflatoxins toxicity [21] which demonstrated that high AFB1 intake can be associated with increased incidence of hepatocellular carcinoma, liver cirrhosis, and human liver cancer, other than immunosuppressive effects [22,23,24].
AFM1 occurrence in milk and dairy products poses a concern for the global population, particularly for infants and children who are more susceptible to adverse effects because of high exposure (low body weight) and lower detoxification capability [25]. Taking into account the milk consumption, the AFM1 toxicity, and its heat stability (pasteurization 72–75 °C or ultra-high temperature processing 120–150 °C do not significantly reduce or inactivate AFM1) [26], the maximum level (ML) in milk set in Europeis 0.050 µg/kg in raw and heat-treated milk and 0.025 µg/kg for infant formulae and milk products for infants [27]. In other countries such as China, Russia, and the USA, the AFM1 ML allowed in milk is higher, equal to 0.5 µg/kg [28].
To prevent AFM1 contamination and its occurrence in dairy products, the most effective approach is to reduce AFB1 contamination in animal feed, i.e., through the application of a field biological control, i.e., by using non-toxigenic strains of A. flavus and appropriate storage of crops [29]. Another valuable approach to prevent contamination may be the use of detoxification techniques on animal feed products, i.e., physical, chemical, and biological processes whose acceptability criteria are defined in the EU Regulation 2015/786 [30]. Recent studies focused on AFM1 decontamination of milk based on the proposed use of microbial or mineral adsorbents [31,32].
Several analytical procedures for the determination of AFM1 in milk have been developed. Enzyme linked immunosorbent assay (ELISA)-based techniques have been used for screening purposes and became very popular due to their relatively low cost, easy application, rapidity, and high sensitivity [33], with the disadvantage of pseudo-positive results and quite low accuracy. Therefore, the additional confirmatory analysis is needed [34]. High performance liquid chromatography (HPLC) combined with different detection principles has become the most important technique for the determination of most important mycotoxins in food and feed. HPLC with fluorescence detection (HPLC/FLD) and chromatography tandem mass-spectrometry (HPLC-MS/MS) represent the most used approaches for confirmatory analysis of mycotoxins in food and feed comprising AFM1 [35,36]. These methods of analysis, as used for food control purposes (screening and confirmation), shall comply with the performance criteria requirements described in Annex II of the Regulation (EC) No 401/2006 [37].
The aim of this study was the monitoring of AFM1 occurrence in raw and processed bovine milk samples, collected from two Italian regions (Puglia and Basilicata) and analyzed during the last twelve years (2012–2023), within the official control activities in charge of the Istituto Zooprofilattico Sperimentale della Puglia e della Basilicata (Foggia, Italy). A total of 1017 milk samples, 843 raw milk and 174 processed milk, were submitted for official control analysis. Screening analyses were conducted using the ELISA method, followed by confirmatory analysis by HPLC/FLD, only for samples with AFM1 concentration above 0.042 µg/kg. After full validation, both methods have been accredited by ACCREDIA, the Italian Organism of accreditation for laboratories. All data have been then elaborated in order to provide a final contribution to risk assessment.

2. Materials and Methods

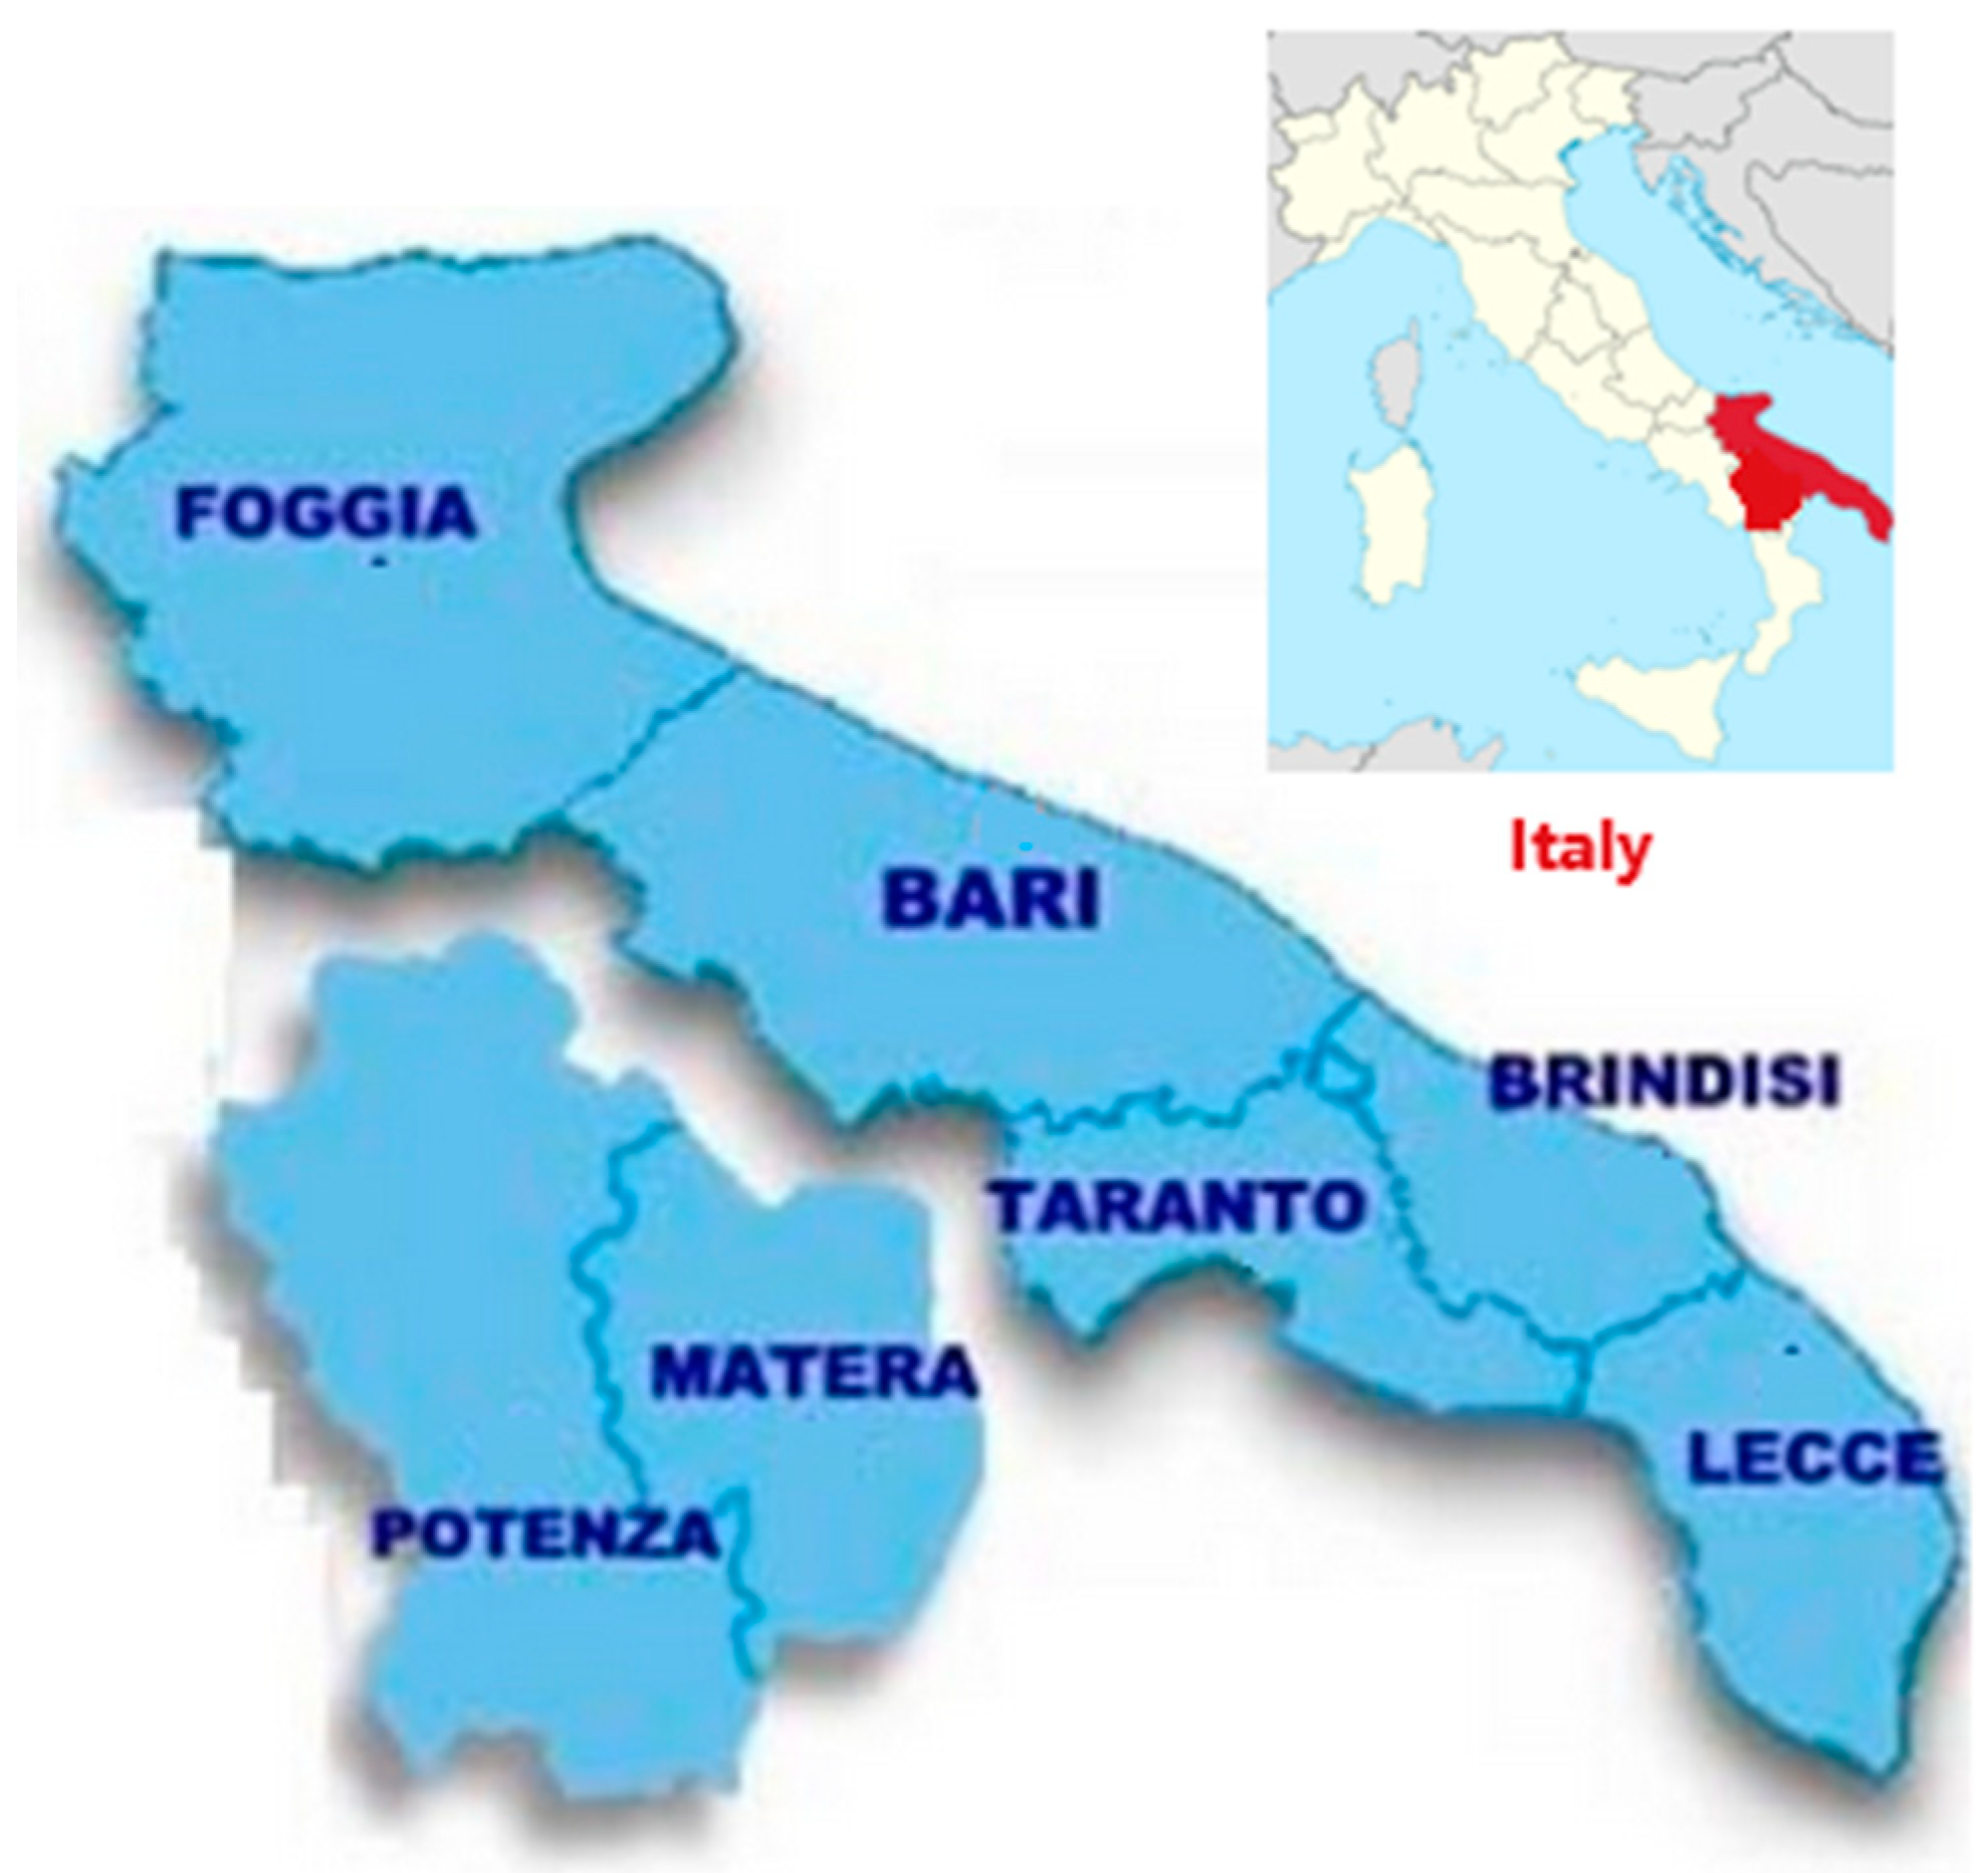
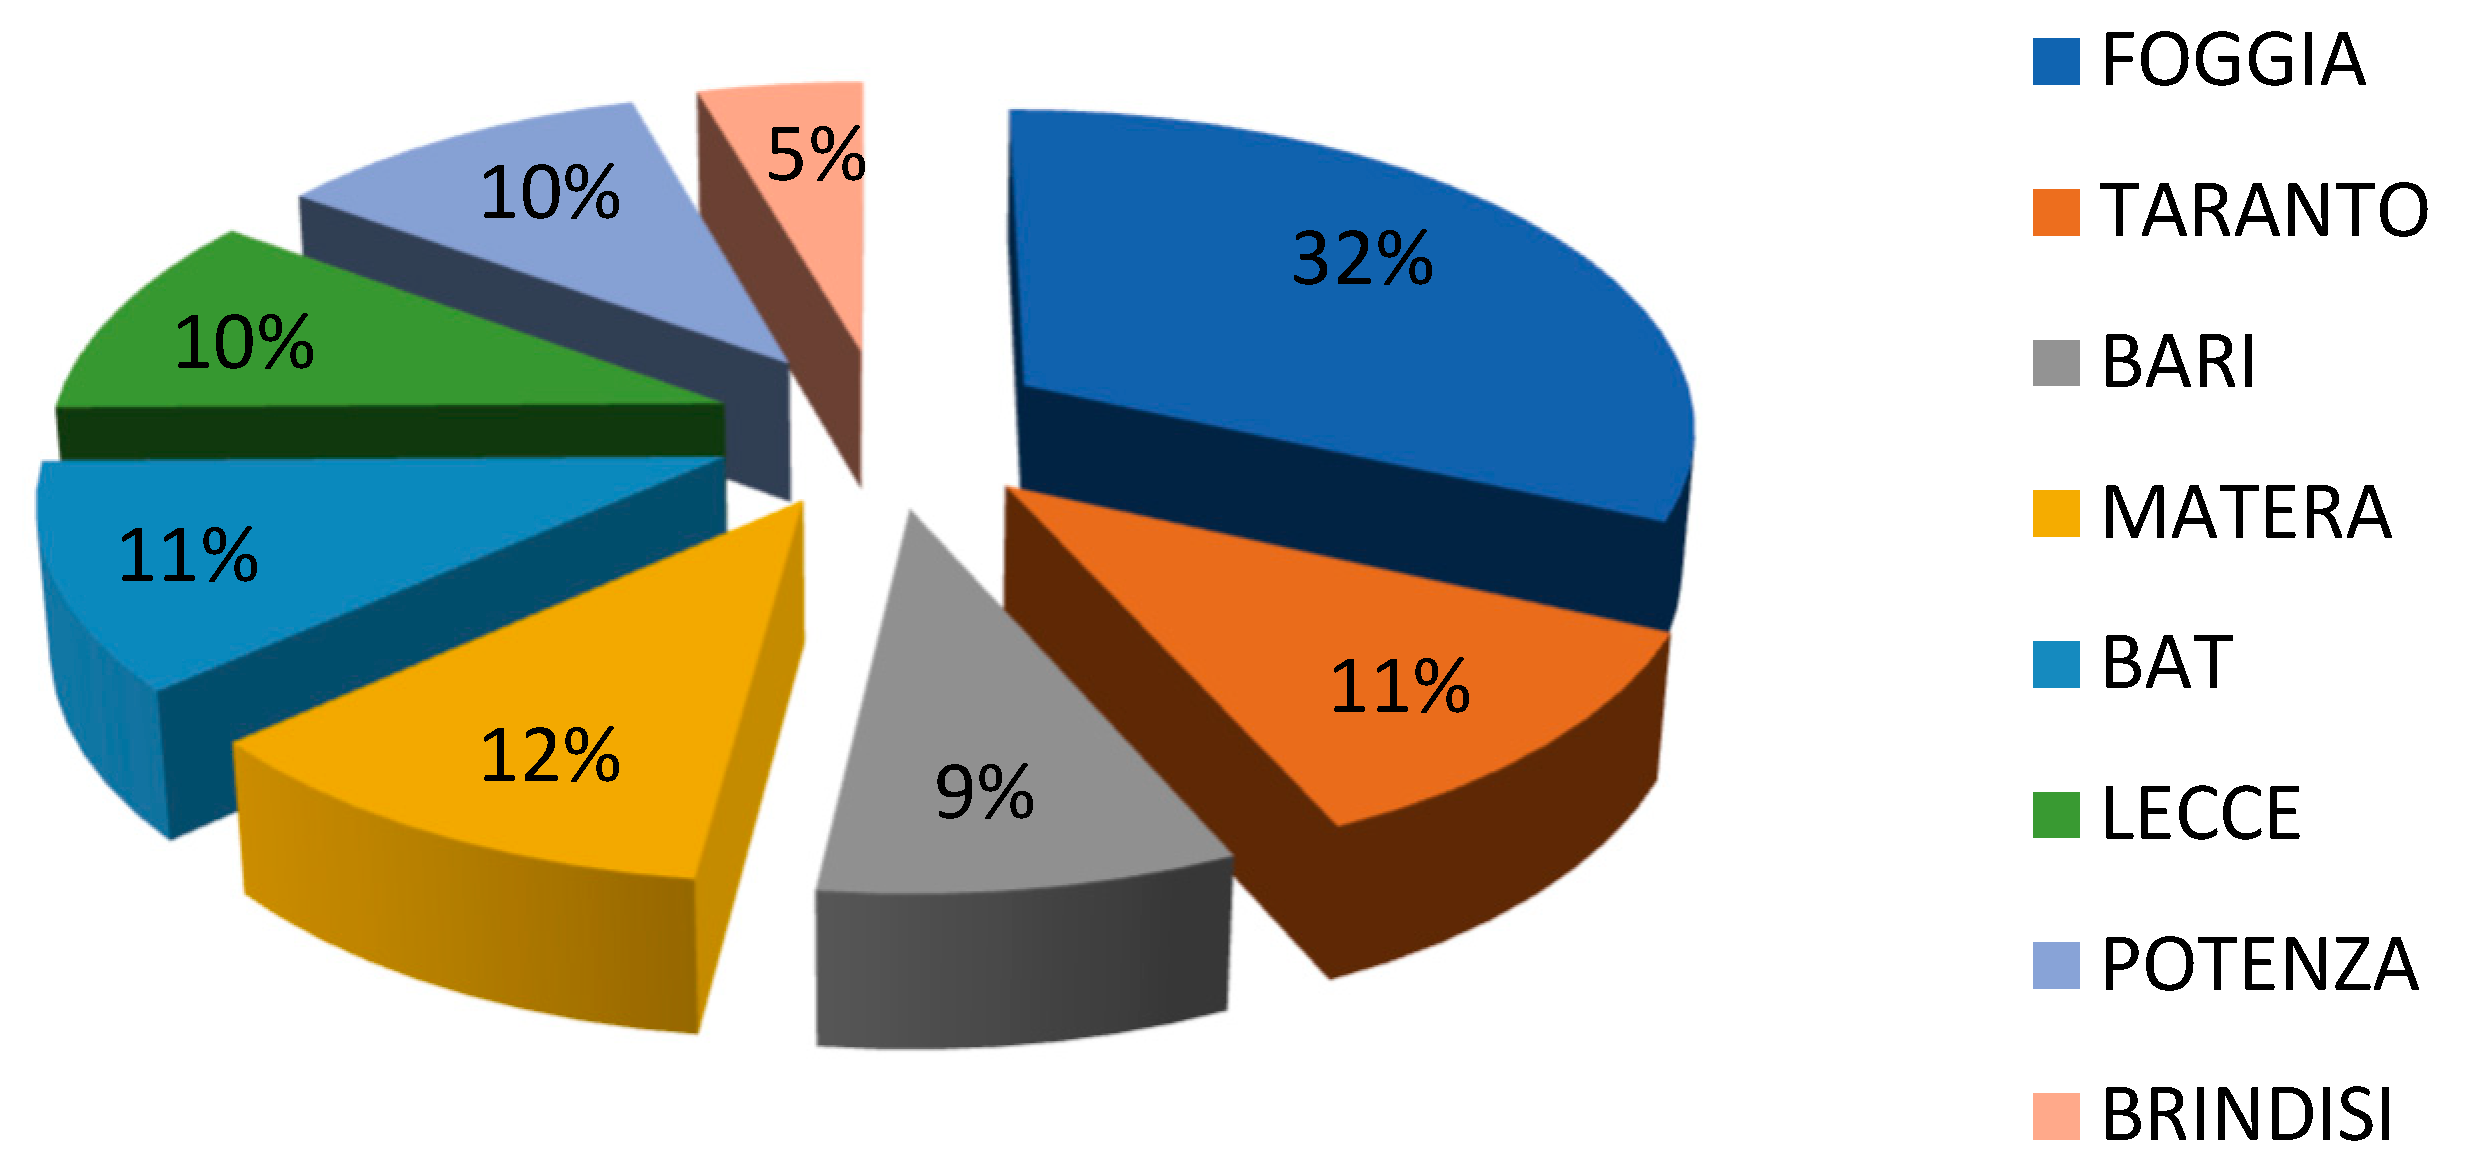
2.1. Sample Collection

Overall, 1017 bovine milk samples (843 raw and 174 processed) were collected from Puglia and Basilicata (Italy) (Figure 1) during twelve years: 2012–2023. Most samples were taken from farms and agricultural holdings of both regions. Figure 2 shows the number of samples subdivided for province of origin, with a substantial portion of samples coming from the province of Foggia, similar percentages from Taranto, Matera, BAT, Lecce, and Potenza, while the smallest number of samples were collected from the province of Brindisi.
Milk samples received in the laboratory, if not immediately analyzed, were stored under refrigeration at 4 °C if analyzed within 24 h and at −20 °C for longer storage after analysis and protected from light until the time of analysis. Processed UHT milk samples were maintained at room temperature until analysis.

2.2. Chemicals and Analytical Methods

2.2.1. Sample Pre-Treatment

Sample pre-treatment step is common for both ELISA screening method and HPLC/FLD method, consisting of a raw milk defatting procedure. Specifically, milk samples were centrifuged at 10 °C in a polypropylene tube at 2112× g for 10 min. The upper layer of fat was discarded and the skimmed milk was directly tested as such by the ELISA method. The quantitative determination of AFM1 in confirmatory analyses was performed by immunoaffinity column (IAC) sample cleanup, followed by HPLC separation with FLD detection.

2.2.2. Immunoassay Reagents, Equipment and Procedure

Screening analyses were carried out using aRidascreen® Aflatoxin M1 ELISA kit (R-Biopharm, Darmstadt, Germany). All reagents used for the ELISA test were furnished by R-Biopharm. Skimmed milk sample, without any further dilution, was ready to be analyzed according to the instructions reported in the manufacturer’s kit manual.
The absorbance reading of ELISA plates was obtained using amicrotitre plate spectrophotometer (Multiskan FC, Thermo Fisher Scientific (Waltham, MA, USA), United states) at 450 nm. The absorbance values were plotted against the concentration of standard solutions to build the calibration curve, using the following levels: 0; 0.005; 0.010; 0.020; 0.040; and 0.080 µg/kg. The AFM1 concentration values were obtained using the R-Biopharm Ridasoft-Win software (version 1.100.0.0202). ELISA test allowed to detect AFM1 content at concentration between 0.005 and 0.080 µg/kg. The method was validated evaluating specificity and β-error verification, precision, recovery, and ruggedness.
All samples analyzed by screening analyses with an AFM1 content greater than 0.042 µg/kg were judged as “suspicious non-compliant”. This concentration corresponds to the maximum limit—2× relative standard deviation of repeatability. These samples were then analyzed by HPLC/FLD confirmation method.

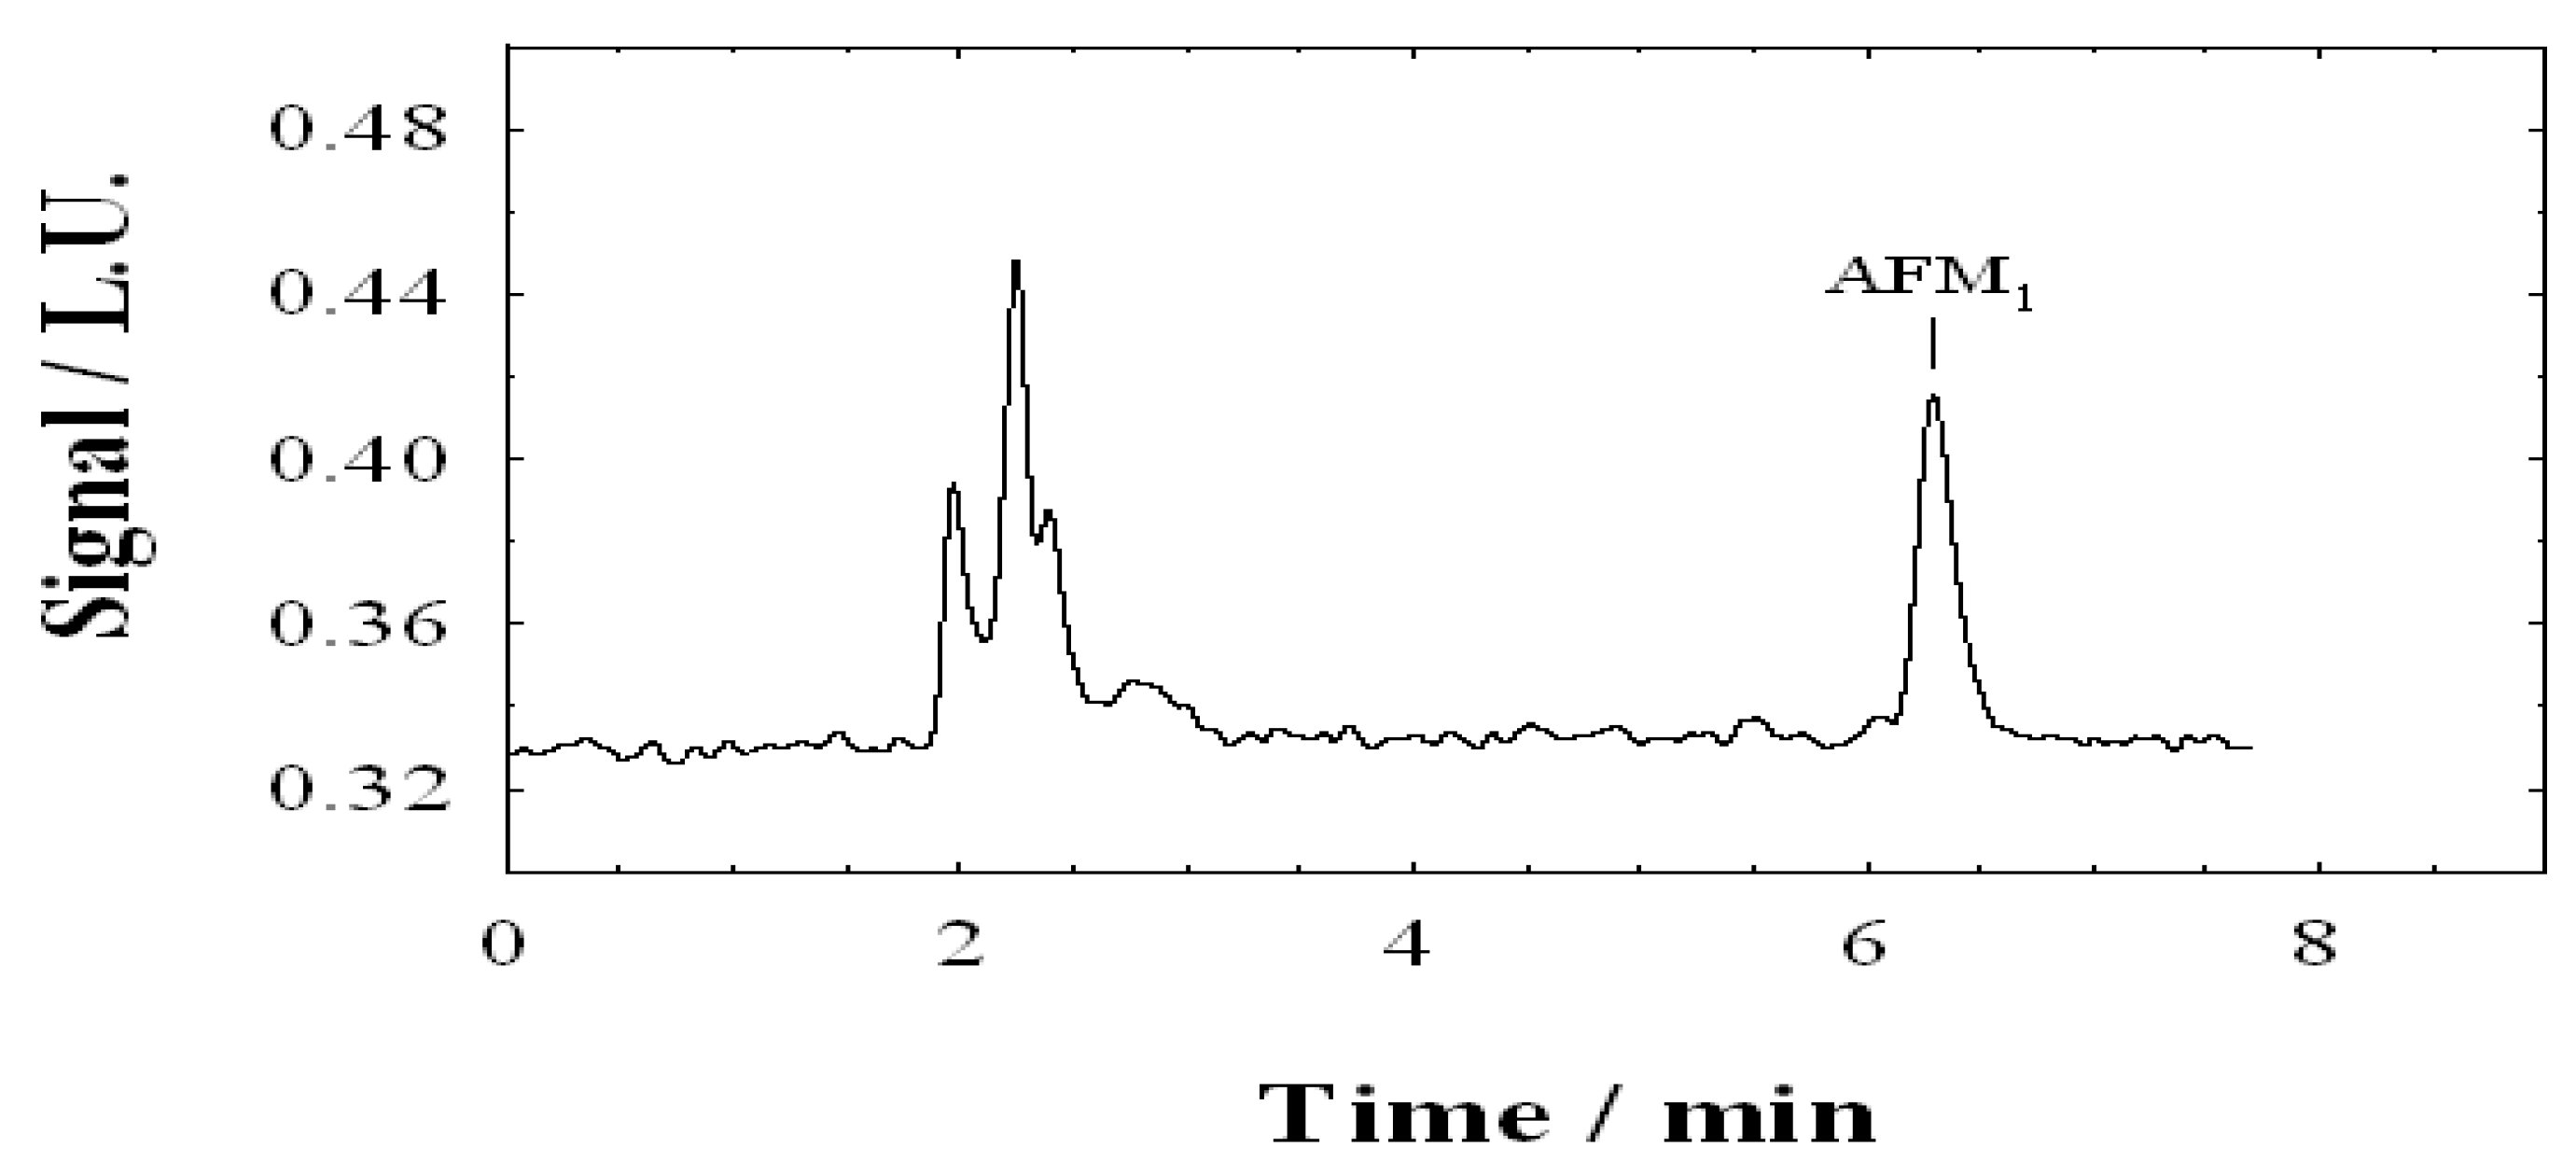
2.2.3. HPLC Reagents, Equipment and Procedure

Acetonitrile, methanol, and water were of HPLC grade and were purchased from Carlo Erba (Milano, Italy). The reference standard of AFM1 with purity grade of 99.6% was supplied by Sigma-Aldrich (Milano, Italy). Working standard solutions (0.2, 0.6, 0.9, 2.0, 5.0) µg/L were prepared by appropriate dilution in mobile phase just before analysis.
Chromatographic separations were performed on an HPLC system Agilent Technologies 1100 Series (Waldbronn, Germany), consisting of a quaternary pump provided with a micro vacuum degasser, a thermostated autosampler, a 20 µL loop, a thermostated column compartment, and a fluorescence detector. All chromatographic separations were performed using Agilent columns ZORBAX Eclipse XDB-C18 (250 mm × 4.6 mm i.d., particle size 5 µm). The mobile phase consisted of water, acetonitrile, and methanol flowed at 0.8 mL/min. The optimized elution gradient is detailed in Table 1. The injection volume was 30 µL and the column compartment temperature was set at 30 °C. Fluorescence detection was performed at the excitation and emission wavelengths of 360 and 440 nm, respectively.
Details about sample preparation step are reported elsewhere [38]. Briefly, 10 g of skimmed milk were purified by an immunoaffinity column (RIDA Aflatoxin column, R-Biopharm, Darmstadt, Germany). The eluate was evaporated to dryness at 40 °C under a nitrogen stream and the residue was solubilized in 500 µL of mobile phase and then injected. The procedure resulted in a 20-fold concentration of AFM1 evaluated against a known concentration added to a blank real sample. HPLC/FLD method allowed to detect AFM1 content at concentration between 0.010 and 0.250 µg/kg. Figure 3 shows an example of AFM1 analysis performed using HPLC/FLD method.
ELISA and HPLC/FLD methods are currently used in laboratory for official control activity. ELISA method is very advantageous for speed and simplicity of operation and HPLC/FLD method, because of its specificity and high sensitivity, allows accurate confirmation analyses of milk samples resulted as suspicious by the screening method.

2.3. Risk Exposure

The risk exposure study of genotoxic and carcinogenic compounds such as aflatoxin M1 is approached based on the Margin of Exposure (MOEs), corresponding to the ratio between benchmark dose lower limit (BMDL) and the estimated daily exposure. A specific BMDL is not available for AFM1, thus the BMDL established for AFB1 (0.4 μg/kg or 400 ng/kg body weight per day) was used in this study applying a potency factor of 0.1. MOE values lower than the threshold set at 10,000 are considered of concern [39,40,41]. Regarding milk consumption, the reference data were taken from the INRAN-SCAI 2005-06 Italian National surveys on food consumption provided to EFSA and elaborated taking into account 65 kg as reference body weight, and the upper boundary that is 95th percentile (P95) [39,42,43]. The following population subgroups were considered: children (3–9 years), adolescents (10–17 years), adults (18–64 years), and elderly (65–97 years) (females + males, whole population). Regarding scenario, the high exposure was evaluated using the mean concentration of non-complaint samples as the reference value; moreover, a very interesting and useful parameter, named “most-likely exposure”, already proposed elsewhere [44] was elaborated, considering the overall mean contamination. In this case, a concentration equal to the LOD of ELISA method (0.005 µg/kg) was assigned to samples with “not detectable” amount of AFM1. This is a protective measure for both human health and the environment proposed by the Italian Institute of Health and known as “upper-bound” approach [45]. The elaborations were made from both raw and processed milk samples regarding “most-likely exposure” scenario, and for all samples relating to “high exposure” scenario.

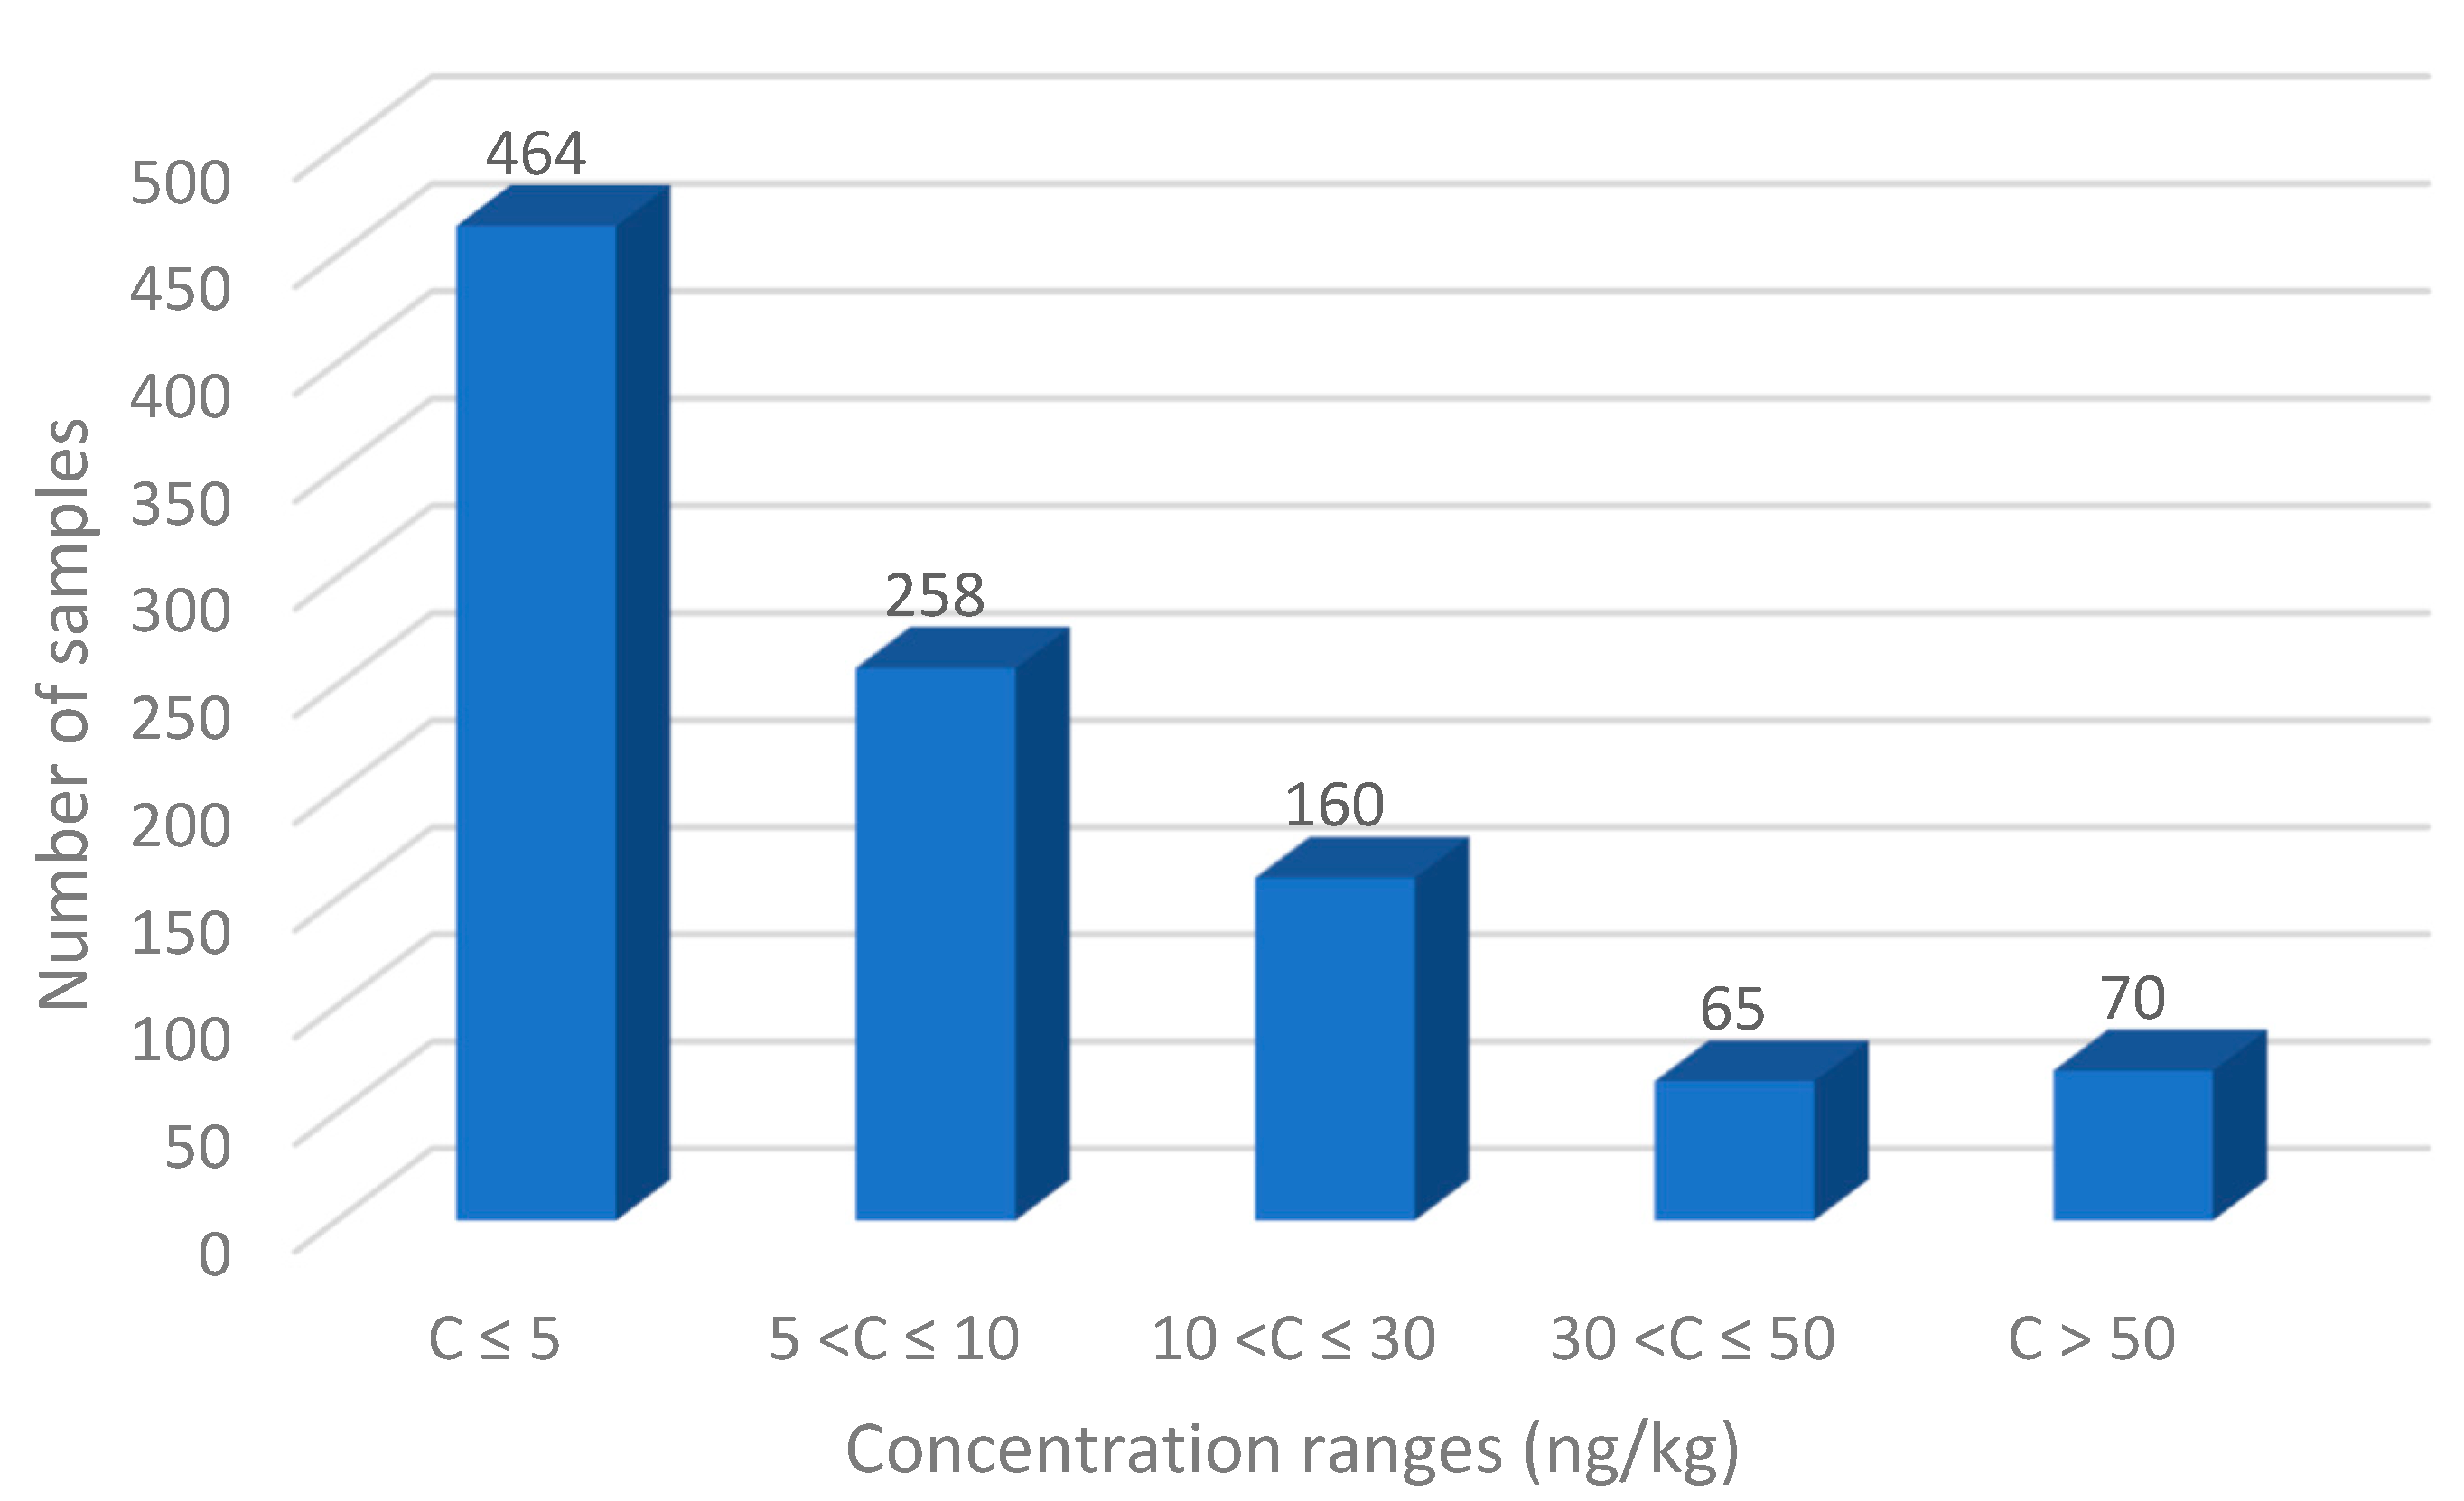
3. Results and Discussion

The overall results of this study and the number of total samples subdivided by concentration ranges are displayed in Figure 4. An AFM1 level greater than 5 ng/kg (quantification limit value of the ELISA method) was detected in 553 of the 1017 analyzed samples (54.4%). As also shown in Figure 3, most of these samples present a concentration range between 5 and 50 ng/kg. AFM1 levels greater than 50 ng/kg were detected in 70 samples (6.9%), with 49 non-compliant responses (4.8%), while 21 samples (2.1% of total samples), although above 50 ng/kg, taking into account the measurement of uncertainty (9.2%) complied with the legal limit.
Another significant finding arises by comparing the data obtained for raw milk with those of pasteurized or UHT milk. Figure 5 shows the AFM1 percentages of samples as associated with concentration ranges of raw and processed milk. As shown, a higher percentage of samples with AFM1 level below 10 ng/kg (89.7%) was observed for processed milk versus raw milk (67.2%); therefore, the processed milk was characterized by lower AFM1 levels (one-way ANOVA, p = 0.05). This trend is well appreciable from the graph shown in Figure 4, where the percentage of raw milk samples increases with the increase in AFM1 concentration.
With regard to the non-compliant samples found, 49 milk samples (4.8%) showed a concentration of AFM1 above the legal limits, i.e., greater than 0.050 µg/kg, taking into account the measurement of uncertainty. Table 2 shows in detail the number of these samples and their characteristics, including concentration values, type, and province of origin. We first noted that four samples showed a quite high AFM1 concentration, exceeding 0.20 µg/kg. These samples all came from the province of Foggia; three samples were raw milk and only one pasteurized. We also verified that almost all of the non-compliant samples were composed of raw milk. Indeed, only two samples of pasteurized milk with concentrations above the legal limit were registered, both collected from the province of Foggia.
Figure 6 shows the distribution of non-compliant samples as subdivided by province of origin. Some provinces, particularly Foggia and Brindisi, are characterised by a number of analyzed samples that are very different from other six provinces. For this reason, the results were evaluated in percentage and not absolute terms. The province of Potenza recorded 18.1% of non-compliances (19 non-compliant samples out of 105 analyzed), followed by the provinces of Bari and Taranto, which accounted for 10.2% and 8.7% of non-compliances, respectively.
Several articles reported that the AFM1 contamination of raw milk can be influenced by the season. Indeed, milk samples collected during winter can be more contaminated by AFM1 than those collected during summer. This relationship can be justifiable taking into account the low availability of fresh green feed in colder seasons which leads to the increased use of stored concentrated feedstuffs [46,47]. Even in our study, most of samples with higher AFM1 levels were collected during autumn and winter.
In 2003, for the first time, Italy was faced with an outbreak related to the effects of climate change on cultivated crops. The summer was particularly dry and hot, with maize crops stressed by drought and lack of water, with the consequence of higher AFB1 contamination [48]. Important repercussions occurred in the dairy industry, with significant levels of AFM1 in milk. A similar situation occurred in Italy during the summer of 2012, and lasted until 2016, with an increase in the mean levels of AFM1 in milk [49].
According to this scenario, in a twelve-year survey (2012–2023) in Puglia and Basilicata, AFM1 contamination showed a substantial increase in 2012 and 2013. Indeed, while the mean contamination registered in other years was always below 10 ng/kg, the mean AFM1 contamination rose to 29 ng/kg in 2012 and to 17 ng/kg in 2013. The highest number of registered non-compliant samples also belonged to these years: 44 out of 49 total non-compliant samples.
As it regards a risk of exposure study, the values obtained for Margin of Exposure are reported in Table 3. Data elaboration was conducted taking as reference consumption data related to the 95th percentile (P95), as made in the recent “Risk assessment of aflatoxins in food” published by EFSA [39]. Indeed, if considering the mean consumption of different population classes, all MOE values resulted as higher than 10,000 and so did not represent a food safety risk (10,400 was the lowest value calculated, for children consumption under “high exposure” scenario). However, in risk assessment studies, P95 is usually adopted as a more protective measure for human health and food safety. As appreciable from Table 3, all MOE values obtained under “high exposure scenario” were lower than 10,000 and so represented a food safety risk. These values were obtained by taking into account all “non-compliant” concentrations quantified during this survey, belonging to both raw (47) and processed (2) samples. This result confirmed the validity of legal limits set at the European level, the need of implementing official control, and the reliability and effectiveness of the analytical approach applied in this study. Regarding the “most-likely exposure” scenario, all MOE values resulted as lower than 10,000, with values of processed milk well higher than those calculated for raw milk, confirming the considerations reported above regarding the possible effect of processing on residual AFM1 levels. Thus, these last results confirm an overall low risk for food safety relating to AFM1 exposure from milk consumption, with reference to the south of Italy.

4. Conclusions

A consolidated approach composed of both screening and confirmatory analysis was used to carry out comprehensive monitoring of AFM1 contamination levels in bovine raw and processed milk samples collected from two Italian regions (Puglia and Basilicata) during 12 years (2012–2023). The results showed that 4.8% of total analyzed samples (49 out of 1017) were “non-compliant”, confirming the need for continuous monitoring of this contaminant in milk to improve food safety. These non-compliances, in the concentration range 0.061–0.052 µg/kg, mainly concerned raw milk samples. The highest number of “non-compliant” samples was verified among samples analyzed in the years 2012 and 2013, when the climatic conditions (high humidity and high temperatures) were particularly favorable to the mold growth and subsequent formation of aflatoxins. Finally, all MOE values obtained under “high exposure scenario” were lower than 10,000 (<8000) so represented a food safety risk; while regarding “most-likely exposure” scenario, all MOE values resulted higher than 10,000 (>37,000), confirming an overall low risk for food safety relating to AFM1 exposure from milk consumption, with reference to the south of Italy.

Author Contributions

Conceptualization, S.S., S.L.M., M.I. and M.M.; Software, S.S., S.L.M. and M.I.; Validation, S.S., S.L.M., C.F., V.V. and V.S.; Investigation, S.S., S.L.M., C.F., V.V. and V.S.; Resources, M.M., R.D.P. and M.I.; Project administration, S.S., M.M., R.D.P. and M.I.; Visualization, M.M. and R.D.P.; Supervision, M.I., M.M. and R.D.P.; Formal analysis, S.S., S.L.M., P.D., C.F., V.V. and V.S.; Data curation, S.S., S.L.M., V.V., M.I. and C.F.; Funding acquisition, M.M., R.D.P. and M.I.; Methodology, S.S., S.L.M. and C.F.; Writing original draft, S.S., S.L.M. and M.I.; Writing—review & editing, M.I. All authors have read and agreed to the published version of the manuscript.

Funding

This research received no external funding.

Institutional Review Board Statement

Not applicable.

Informed Consent Statement

Not applicable.

Data Availability Statement

Dataset available on request from the authors.

Acknowledgments

Istituto Zooprofilattico Sperimentale della Puglia e della Basilicata (Foggia, Italy) is thanked for providing financial support.

Conflicts of Interest

The authors declare no conflicts of interest.

References

  1. FAO (Food and Agriculture Organization of the United Nations). Climate change and food security: Risks and responses. In Food and Agriculture Organization of the United Nations (FAO) Report; FAO: Rome, Italy, 2016. [Google Scholar]
  2. Battilani, P.; Toscano, P.; Van der Fels-Klerx, H.J.; Moretti, A.; Camardo Leggieri, M.; Brera, C.; Rortais, A.; Goumperis, T.; Robinson, T. Aflatoxin B1 contamination in maize in Europe increases due to climate change. Sci. Rep. 2016, 6, 24328. [Google Scholar] [CrossRef] [PubMed]
  3. Medina, A.; Gonzalez-Jartín, J.M.; Sainz, M.J. Impact of global warming on mycotoxins. Curr. Opin. Food Sci. 2017, 18, 76–81. [Google Scholar] [CrossRef]
  4. El-Sayed, R.A.; Jebur, A.B.; Kang, W.; El-Demerdash, F.M. An overview on the major mycotoxins in food products: Characteristics, toxicity, and analysis. J. Future Foods 2022, 2, 91–102. [Google Scholar] [CrossRef]
  5. Trucksess, M.W.; Diaz-Amingo, C. Mycotoxins in Foods. In Encyclopedia of Environmental Health; Elsevier: Amsterdam, The Netherlands, 2011; pp. 888–897. [Google Scholar] [CrossRef]
  6. Kumar, A.; Pathak, H.; Bhadauria, S. Aflatoxin contamination in food crops: Causes, detection, and management: A review. Food Prod. Process. Nutr. 2021, 3, 17–26. [Google Scholar] [CrossRef]
  7. Khayoon, W.S.; Saad, B.; Yan, C.B.; Hashim, N.H.; Ali, A.S.M.; Salleh, M.I.; Salleh, B. Determination of aflatoxins in animal feeds by HPLC with multifunctional column clean-up. Food Chem. 2010, 118, 882–886. [Google Scholar] [CrossRef]
  8. Giray, B.; Girgin, G.; Engin, A.B.; Aydin, S.; Sahin, G. Aflatoxin levels in wheat samples consumed in some regions of Turkey. Food Control 2007, 18, 23–29. [Google Scholar] [CrossRef]
  9. Fink-Gremmels, J. The role of mycotoxins in the health and performance of dairy cows. Vet. J. 2008, 176, 84–92. [Google Scholar] [CrossRef] [PubMed]
  10. Kralj Cigić, I.; Prosen, H. An overview of conventional and emerging analytical methods for the determination of Mycotoxins. Int. J. Mol. Sci. 2009, 10, 62–115. [Google Scholar] [CrossRef] [PubMed]
  11. International Agency for Research on Cancer (IARC). Aflatoxins. In Chemical Agents and Related Occupations; Agency for Research on Cancer: Lyon, France, 2012; pp. 225–248. [Google Scholar]
  12. Zain, M.E. Impact of mycotoxins on humans and animals. J. Saudi Chem. Soc. 2011, 15, 129–144. [Google Scholar] [CrossRef]
  13. Vaz, A.; Cabral Silva, A.C.; Rodrigues, P.; Venâncio, A. Detection Methods for Aflatoxin M1 in Dairy Products. Microorganisms 2020, 8, 246. [Google Scholar] [CrossRef]
  14. Asi, M.R.; Iqbal, S.Z.; Ariño, A.; Hussain, A. Effect of seasonal variations and lactation times on aflatoxin M1 contamination in milk of different species from Punjab, Pakistan. Food Control 2012, 25, 34–38. [Google Scholar] [CrossRef]
  15. Zentai, A.; Jóźwiak, Á.; Süth, M.; Farkas, Z. Carry-Over of Aflatoxin B1 from Feed to Cow Milk—A Review. Toxins 2023, 15, 195. [Google Scholar] [CrossRef] [PubMed]
  16. Serraino, A.; Bonilauri, P.; Kerekes, K.; Farkas, Z.; Giacometti, F.; Canever, A.; Zambrini, A.V.; Ambrus, À. Occurence of Aflatoxin M1 in raw milk marketed in Italy: Exposure assessment and risk characterization. Front. Microbiol. 2019, 10, 2516. [Google Scholar] [CrossRef] [PubMed]
  17. Girolami, F.; Barbarossa, A.; Badino, P.; Ghadiri, S.; Cavallini, D.; Zaghini, A.; Nebbia, C. Effects of Turmeric Powder on Aflatoxin M1 and Aflatoxicol Excretion in Milk from Dairy Cows Exposed to Aflatoxin B1 at the EU Maximum Tolerable Levels. Toxins 2022, 14, 430. [Google Scholar] [CrossRef] [PubMed]
  18. Topi, D.; Spahiu, J.; Rexhepi, A.; Marku, N. Two-year survey of aflatoxin M1 in milk marketed in Albania, and human exposure assessment. Food Control 2022, 136, 108831. [Google Scholar] [CrossRef]
  19. International Agency for Research on Cancer (IARC). IARC Monographs on the Evaluation of Carcinogenic Risks to Humans; International Agency for Research on Cancer: Lyon, France, 2002; Volume 56, pp. 171–176. [Google Scholar]
  20. Ibáñez-Vea, M.; Corcuera, L.N.; Remiro, R.; Murillo-Arbizu, M.T.; González-Peñas, E.; Lizarraga, E. Validation of a UHPLC-FLD method for the simultaneous quantification of aflatoxins, ochratoxin A and zearalenone in barley. Food Chem. 2011, 127, 351–358. [Google Scholar] [CrossRef]
  21. Cullen, J.M.; Newberne, P.M. Acute Hepatotoxicity of Aflatoxins. In The Toxicology of Aflatoxins: Human Health, Veterinary, and Agricultural Significance; Eaton, D.L., Groopman, J.D., Eds.; Academic Press: San Diego, CA, USA, 1993; Volume 129, pp. 3–26. [Google Scholar]
  22. Ferreira, R.G.; Cardoso, M.V.; de Souza Furtado, K.M.; Espíndola, K.M.M.; Amorim, R.P.; Monteiro, M.C. Epigenetic alterations caused by aflatoxin b1: A public health risk in the induction of hepatocellular carcinoma. Transl. Res. 2019, 204, 51–71. [Google Scholar] [CrossRef] [PubMed]
  23. Sweeney, M.J.; Dobson, A.D.W. Mycotoxin production by Aspergillus, Fusarium and Penicillium species. Int. J. Food Microbiol. 1998, 43, 141–158. [Google Scholar] [CrossRef]
  24. Eaton, D.L.; Gallagher, E.P. Mechanisms of Aflatoxin Carcinogenesis. Annu. Rev. Pharmacol. Toxicol. 1994, 34, 135–172. [Google Scholar] [CrossRef] [PubMed]
  25. Boudra, H.; Barnouin, J.; Dragacci, S.; Morgavi, D.P. Aflatoxin M1 and Ochratoxin A in Raw Bulk Milk from French Dairy Herds. J. Dairy Sci. 2007, 90, 3197–3201. [Google Scholar] [CrossRef]
  26. Tajkarimi, M.; Aliabadi-Sh, F.; Salah Nejad, A.; Poursoltani, H.; Motallebi, A.A.; Mahdavi, H. Aflatoxin M1 contamination in winter and summer milk in 14 states in Iran. Food Control 2008, 19, 1033–1036. [Google Scholar] [CrossRef]
  27. Commission Regulation (EU) No. 915/2023 of 25 April 2023 on Maximum Levels for Certain Contaminants in Food and Repealing Regulation (EC) No. 1881/2006. Off. J. Eur. Union 2023, L119, 103–157. Available online: https://eur-lex.europa.eu/legal-content/EN/TXT/PDF/?uri=CELEX:32023R0915 (accessed on 13 January 2025).
  28. FAO (Food and Agriculture Organization of the United Nations). Worldwide Regulations for Mycotoxins in Food and Feed in 2003; Food and Agriculture Organization, FAO Food and Nutrition: Rome, Italy, 2004; Available online: https://www.fao.org/4/y5499e/y5499e02.htm (accessed on 7 November 2024).
  29. Womack, E.D.; Sparks, D.L.; Brown, A.E. Aflatoxin M1 in milk and milk products: A short review. World Mycotoxin J. 2016, 9/2, 305–315. [Google Scholar] [CrossRef]
  30. Commission Regulation (EU) No 786/2015 of 19 May 2015 Defining Acceptability Criteria for Detoxification Processes Applied to Products Intended for Animal Feed as Provided for in Directive 2002/32/EC of the European Parliament and of the Council. Off. J. Eur. Union 2015, L125, 10–14. Available online: https://eur-lex.europa.eu/legal-content/EN/TXT/PDF/?uri=CELEX:32015R0786 (accessed on 7 November 2024).
  31. Assaf, J.C.; Nahle, S.; Chokr, A.; Louka, N.; Atoui, A.; El Khoury, A. Assorted Methods for Decontamination of AflatoxinM1 in Milk Using Microbial Adsorbents. Toxins 2019, 11, 304. [Google Scholar] [CrossRef] [PubMed]
  32. Carraro, A.; De Giacomo, A.; Giannossi, M.L.; Medici, L.; Muscarella, M.; Palazzo, L.; Quaranta, V.; Summa, V.; Tateo, F. Clay minerals as adsorbents of aflatoxin M1 from contaminated milk and effects on milk quality. Appl. Clay Sci. 2014, 88/89, 92–99. [Google Scholar] [CrossRef]
  33. Turner, N.W.; Subrahmanyamb, S.; Piletsky, S.A. Analytical methods for determination of mycotoxins: A review. Anal. Chim. Acta 2009, 632, 168–180. [Google Scholar] [CrossRef]
  34. Kos, J.; Janić Hajnal, E.; Jajić, I.; Krstović, S.; Mastilović, J.; Šarić, B.; Jovanov, P. Comparison of ELISA, HPLC-FLD and HPLC-MS/MS methods for determination of aflatoxin M1 in natural contaminated milk samples. Acta Chim. Slov. 2016, 63, 747–756. [Google Scholar] [CrossRef]
  35. Cavaliere, C.; Foglia, P.; Pastorini, E.; Samperi, R.; Laganà, A. Development of a multiresidue method for analysis of major Fusarium mycotoxins in corn meal using liquid chromatography/tandem mass spectrometry. Rapid Commun. Mass Spectrom. 2005, 19, 2085–2093. [Google Scholar] [CrossRef] [PubMed]
  36. Soleimany, F.; Jinap, S.; Abas, F. Determination of Mycotoxins in Cereals by Liquid Chromatography Tandem Mass Spectrometry. Food Chem. 2012, 130, 1055–1060. [Google Scholar] [CrossRef]
  37. Commission Regulation (EC) No. 401/2006 of 23 February 2006 Laying Down the Methods of Sampling and Analysis for the Official Control of the Levels of Mycotoxins in Foodstuffs. Off. J. Eur. Union 2006, L70, 12–34. Available online: https://eur-lex.europa.eu/legal-content/EN/TXT/PDF/?uri=CELEX:32006R0401 (accessed on 7 November 2024).
  38. Muscarella, M.; Lo Magro, S.; Palermo, C.; Centonze, D. Validation according to European Commission Decision 2002/657/EC of a confirmatory method for aflatoxin M1 in milk based on immunoaffinity columns and high performance liquid chromatography with fluorescence detection. Anal. Chim. Acta 2007, 594, 257–264. [Google Scholar] [CrossRef] [PubMed]
  39. EFSA CONTAM Panel (EFSA Panel on Contaminants in the Food Chain); Schrenk, D.; Bignami, M.; Bodin, L.; Chipman, J.K.; del Mazo, J.; Grasl-Kraupp, B.; Hogstrand, C.; Hoogenboom, L.R.; Leblanc, J.-C.; et al. Scientific opinion—Risk assessment of aflatoxins in food. EFSA J. 2020, 18, e06040. [Google Scholar] [CrossRef]
  40. Kortei, N.K.; Annan, T.; Kyei-Baffour, V.; Ken Essuman, E.; Boakye, A.A.; Tettey, C.O.; Boadi, N.O. Exposure assessment and cancer risk characterization of aflatoxin M1 (AFM1) through ingestion of raw cow milk in southern Ghana. Toxicol. Rep. 2022, 9, 1189–1197. [Google Scholar] [CrossRef]
  41. Djekic, I.; Petrovic, J.; Jovetic, M.; Redzepovic-Djordevic, A.; Stulic, M.; Lorenzo, J.M.; Iammarino, M.; Tomasevic, I. Aflatoxins in Milk and Dairy Products: Occurrence and Exposure Assessment for the Serbian Population. Appl. Sci. 2020, 10, 7420. [Google Scholar] [CrossRef]
  42. Leclercq, C.; Arcella, D.; Piccinelli, R.; Sette, S.; Le Donne, C.; Turrini, A. The Italian national food consumption survey INRAN-SCAI 2005-06: Main results in terms of food consumption. Public Health Nutr. 2009, 12, 2504–2532. [Google Scholar] [CrossRef] [PubMed]
  43. European Food Safety Authority. Guidance of EFSA—Use of the EFSA Comprehensive European Food Consumption Database in Exposure Assessment. EFSA J. 2011, 9, 2097. [Google Scholar] [CrossRef]
  44. Lo Magro, S.; Summa, S.; Iammarino, M.; D’antini, P.; Marchesani, G.; Chiaravalle, A.E.; Muscarella, M. A 5-Years (2015–2019) Control Activity of an EU Laboratory: Contamination of Histamine in Fish Products and Exposure Assessment. Appl. Sci. 2020, 10, 8693. [Google Scholar] [CrossRef]
  45. Italian National Institute of Health. Trattamento dei Dati Inferiori al Limite di Rivelabilità nel Calcolo dei Risultati Analitici—Rapporti ISTISAN 04/15. 2004. Available online: https://www.iss.it/documents/20126/955767/0415.1106219644.pdf/51c15924-7b63-07ca-cce4-9a37d772190d?t=1575578775857 (accessed on 30 November 2024).
  46. Li, S.; Min, L.; Wang, P.; Zhang, Y.; Zheng, N.; Wang, J. Aflatoxin M1 contamination in raw milk from major milk-producing areas of China during four seasons of 2016. Food Control 2017, 82, 121–125. [Google Scholar] [CrossRef]
  47. Bilandzic, N.; Varga, I.; Varenina, I.; Kolanovic, B.S.; Luburic, D.B.; Dokic, M.; Sedak, M.; Cvetnic, L.; Cvetnic, Z. Seasonal Occurrence of Aflatoxin M1 in Raw Milk during a Five-Year Period in Croatia: Dietary Exposure and Risk Assessment. Foods 2022, 11, 1959. [Google Scholar] [CrossRef] [PubMed]
  48. Ferrari, L.; Fumagalli, F.; Rizzi, N.; Grandi, E.; Vailati, S.; Manoni, M.; Ottoboni, M.; Cheli, F.; Pinotti, L. An Eight-Year Survey on Aflatoxin B1 Indicates High Feed Safety in Animal Feed and Forages in Northern Italy. Toxins 2022, 14, 763. [Google Scholar] [CrossRef] [PubMed]
  49. Ferrari, L.; Rizzi, N.; Grandi, E.; Clerici, E.; Tirloni, E.; Stella, S.; Bernardi, C.E.M.; Pinotti, L. Compliance between Food and Feed Safety: Eight-Year Survey (2013–2021) of Aflatoxin M1 in Raw Milk and Aflatoxin B1 in Feed in Northern Italy. Toxins 2023, 15, 168. [Google Scholar] [CrossRef]
Figure 1. Provinces of Puglia and Basilicata.
Applsci 15 00853 g001
Figure 2. Percentage distribution of milk samples collected from different provinces of Puglia and Basilicata.
Applsci 15 00853 g002
Figure 3. Chromatogram of a contaminated milk sample (AFM1 = 0.158 µg/kg).
Applsci 15 00853 g003
Figure 4. Concentration ranges (ng/kg) of AFM1 in analyzed samples.
Applsci 15 00853 g004
Figure 5. Comparison of AFM1 levels of raw and processed milk. Blue rods: processed milk samples; orange rods: raw milk samples.
Applsci 15 00853 g005
Figure 6. Number and relative percentage values of non-compliant samples by province of origin.
Applsci 15 00853 g006
Table 1. Optimized elution gradient of HPLC/FLD method.
Time (min)Water% Acetonitrile% Methanol%
0.055405
6.055405
7.015805
10.015805
11.055405
17.055405
Table 2. Non-compliant samples: type, concentration value, and province of origin.
Sample nMilk TypeAFM1 Concentration Values
(µg/kg ± Measurement Uncertainty)
Province of OriginYear of Sampling/Analysis
1RAW0.216 +/− 0.030FOGGIA2012
2RAW0.062 +/− 0.010BARI2012
3RAW0.552 +/− 0.070FOGGIA2012
4RAW0.065 +/− 0.009BARI2012
5RAW0.099 +/− 0.014TARANTO2012
6RAW0.162 +/− 0.021TARANTO2012
7RAW0.095 +/− 0.013FOGGIA2012
8PASTEURIZED0.162 +/− 0.022FOGGIA2012
9RAW0.070 +/− 0.009BARI2012
10RAW0.162 +/− 0.022POTENZA2012
11RAW0.134 +/− 0.018POTENZA2012
12RAW0.126 +/− 0.017POTENZA2012
13RAW0.134 +/− 0.018POTENZA2012
14RAW0.103 +/− 0.014POTENZA2012
15RAW0.091 +/− 0.013POTENZA2012
16RAW0.167 +/− 0.022POTENZA2012
17RAW0.097 +/− 0.013POTENZA2012
18RAW0.173 +/− 0.023POTENZA2012
19RAW0.158 +/− 0.022TARANTO2012
20RAW0.154 +/− 0.021POTENZA2012
21RAW0.162 +/− 0.022POTENZA2012
22RAW0.148 +/− 0.020POTENZA2012
23RAW0.107 +/− 0.014TARANTO2012
24RAW0.077 +/− 0.010TARANTO2012
25RAW0.154 +/− 0.021TARANTO2012
26RAW0.085 +/− 0.012TARANTO2012
27RAW0.106 +/− 0.015POTENZA2012
28RAW0.142 +/− 0.019POTENZA2012
29RAW0.090 +/− 0.012TARANTO2012
30RAW0.270 +/− 0.036FOGGIA2013
31RAW0.084 +/− 0.011FOGGIA2013
32RAW0.061+/− 0.009MATERA2013
33RAW0.109 +/− 0.015POTENZA2013
34RAW0.086 +/− 0.012POTENZA2013
35RAW0.066 +/− 0.009POTENZA2013
36RAW0.099 +/− 0.013BARI2013
37RAW0.073 +/− 0.010BARI2013
38RAW0.080 +/− 0.011BRINDISI2013
39RAW0.110 +/− 0.015POTENZA2013
40RAW0.095 +/− 0.014POTENZA2013
41RAW0.071 +/− 0.010TARANTO2013
42RAW0.061 +/− 0.009TARANTO2013
43RAW0.061 +/− 0.009BARI2013
44RAW0.062 +/− 0.009BARI2013
45RAW0.110 +/− 0.015FOGGIA2014
46PASTEURIZED0.401 +/− 0.055FOGGIA2015
47RAW0.067 +/− 0.009BARI2017
48RAW0.066 +/− 0.009BARI2019
49RAW0.182 +/− 0.025MATERA2023
Table 3. Risk exposure assessment *.
Margin of Exposure (P95)
ChildrenAdolescentsAdultsElderly
Most-likely exposure
scenario
Raw milk37,14252,00065,00052,000
Processed milk65,00086,667130,00086,000
High-exposure scenario (all samples)5098666778796667
Disclaimer/Publisher’s Note: The statements, opinions and data contained in all publications are solely those of the individual author(s) and contributor(s) and not of MDPI and/or the editor(s). MDPI and/or the editor(s) disclaim responsibility for any injury to people or property resulting from any ideas, methods, instructions or products referred to in the content.

