Article

Plate Size Effects in Gravelly Soil Based on In Situ Plate Load Tests and Finite Element Analysis

1
School of Civil Engineering, Southeast University, Nanjing 211189, China
2
Sichuan Highway Planning, Survey, Design and Research Institute Ltd., Chengdu 610041, China
3
Sichuan Transportation Construction Group Co., Ltd., Bridge Engineering Branch, Chengdu 610041, China
*
Author to whom correspondence should be addressed.
Appl. Sci. 2025, 15(2), 760; https://doi.org/10.3390/app15020760
Submission received: 23 October 2024 / Revised: 7 January 2025 / Accepted: 8 January 2025 / Published: 14 January 2025
(This article belongs to the Section Civil Engineering)

Abstract

:
The average contact stress–settlement behavior observed in plate load tests provides essential data for reliable foundation design. However, the test plate is often smaller than the actual foundation, requiring size extrapolation to interpret in situ plate load test results accurately. This study combines in situ plate load test results in gravelly soil with finite element analysis to evaluate test plates of varying sizes. The findings suggest that the coefficient of subgrade reaction for gravelly soil foundations can be effectively estimated using Terzaghi’s extrapolation method for the coefficient of subgrade reaction in clay. Although variations in test plate diameter may alter the shape of the average contact stress–settlement curve, the overall pattern of change remains consistent. The average contact stress–settlement relationship in gravelly soil can be represented by a three-phase linear model, corresponding to the elastic, yield, and failure stages. Additionally, while the elastic limit load in gravelly soil remains unaffected by plate size, the ultimate bearing capacity increases with larger plates before stabilizing.

1. Introduction

The bearing capacity of soil refers to the maximum load intensity that the soil can withstand under external forces without experiencing excessive deformation, failure, or settlement. Both the bearing capacity and deformation behavior under the load of soil are critical in geotechnical engineering design [1,2]. With the advancement of numerical computation technologies and sophisticated computational tools, researchers have increasingly utilized more efficient numerical methods to model the actual site conditions and failure mechanisms of foundation soils [3,4,5,6]. However, the plate load test (PLT) remains recognized as a direct, rapid, and reliable field test, useful for investigating soil deformation and estimating the ultimate bearing capacity of the on-site soil [7,8].
The plate load test (PLT) is a significant in situ test in geotechnical engineering, providing essential information for foundation design. The stress–displacement trends observed from the in situ PLT can be used to determine the load–settlement relationship, failure mechanisms, subgrade modulus, and bearing capacity of the foundation [8]. However, in many instances, the dimensions of the test plate used in the test are generally smaller than those of the actual foundation. Since the dimensions of the foundation differ significantly from those of the load plate used in the plate load test (PLT), it is necessary to extrapolate the load–displacement relationship determined from the load plate test to the foundation prototype in the foundation design [9].
Compression bearing tests on square and circular foundations in non-cohesive soils show that the bearing capacity increases as the foundation size increases [10,11]. This conclusion is further confirmed by PLT tests in reinforced soft soils [3].
PLT tests in non-cohesive soils indicate that, for both square and circular foundations, the settlement increases with larger foundation sizes under identical loading conditions, with the settlement increasing as the foundation diameter grows [12,13].
Analyzing the test results in conjunction with existing literature reveals that the bearing capacity of the foundation and the settlement displacement under identical loads are closely related to the size of the foundation [9]. Specifically, under identical pressure conditions, the magnitude of the settlement differs with variations in foundation size, leading to discrepancies in the pressure–settlement curves for foundations of varying sizes. Therefore, the proportional limit and ultimate bearing capacity obtained from the stress–settlement curve will also change. Simultaneously, based on Winkler’s theory [14], the determined coefficient of subgrade reaction and the secant modulus established from the semi-infinite elastic space theory will also vary with changes in foundation size.
In this study, horizontal plate load tests were conducted on gravel soil foundations in a flat tunnel environment, and finite element analysis software was used for supplementary analysis to investigate the relationship between the foundation stiffness coefficient, loading response, and plate size.

2. Geotechnical Profile and Soil Parameter

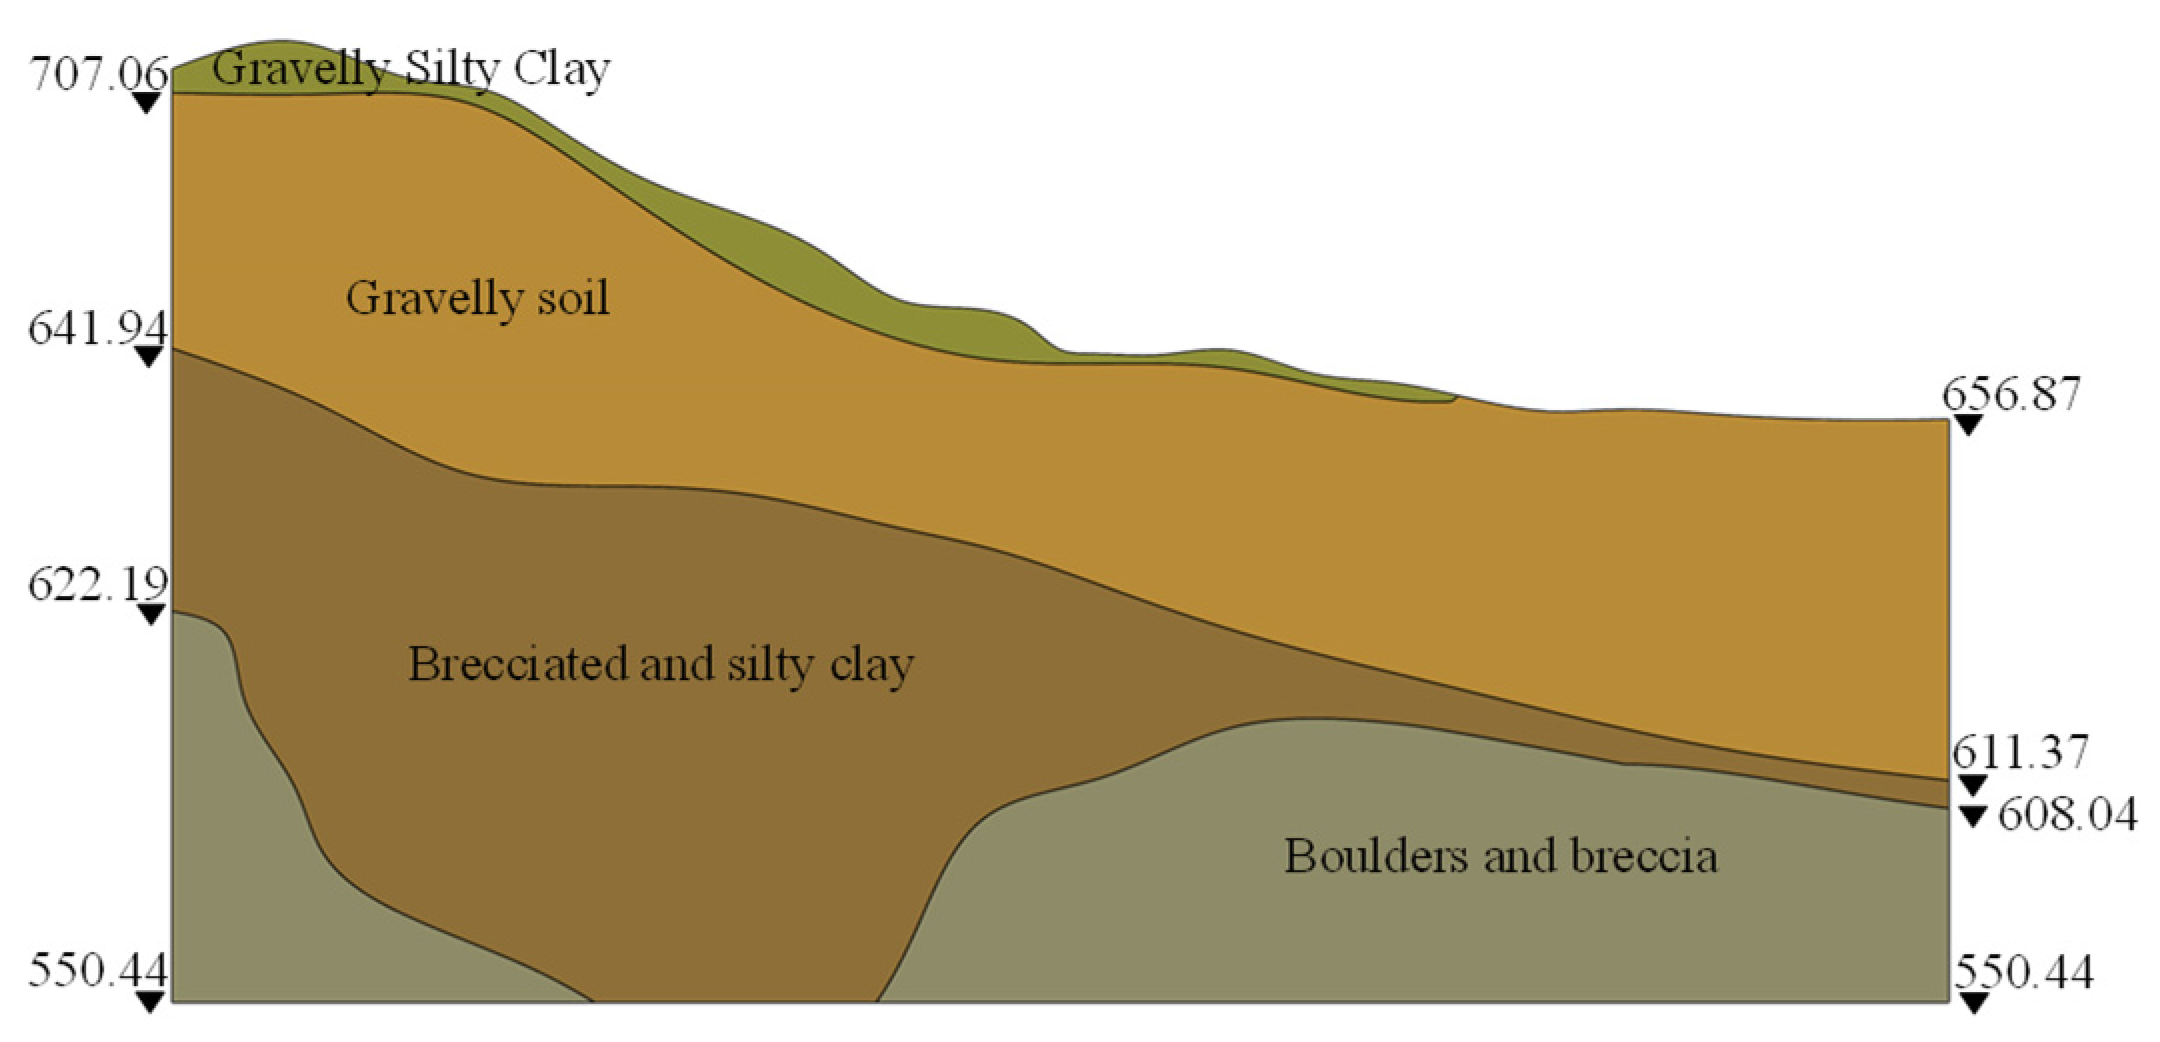
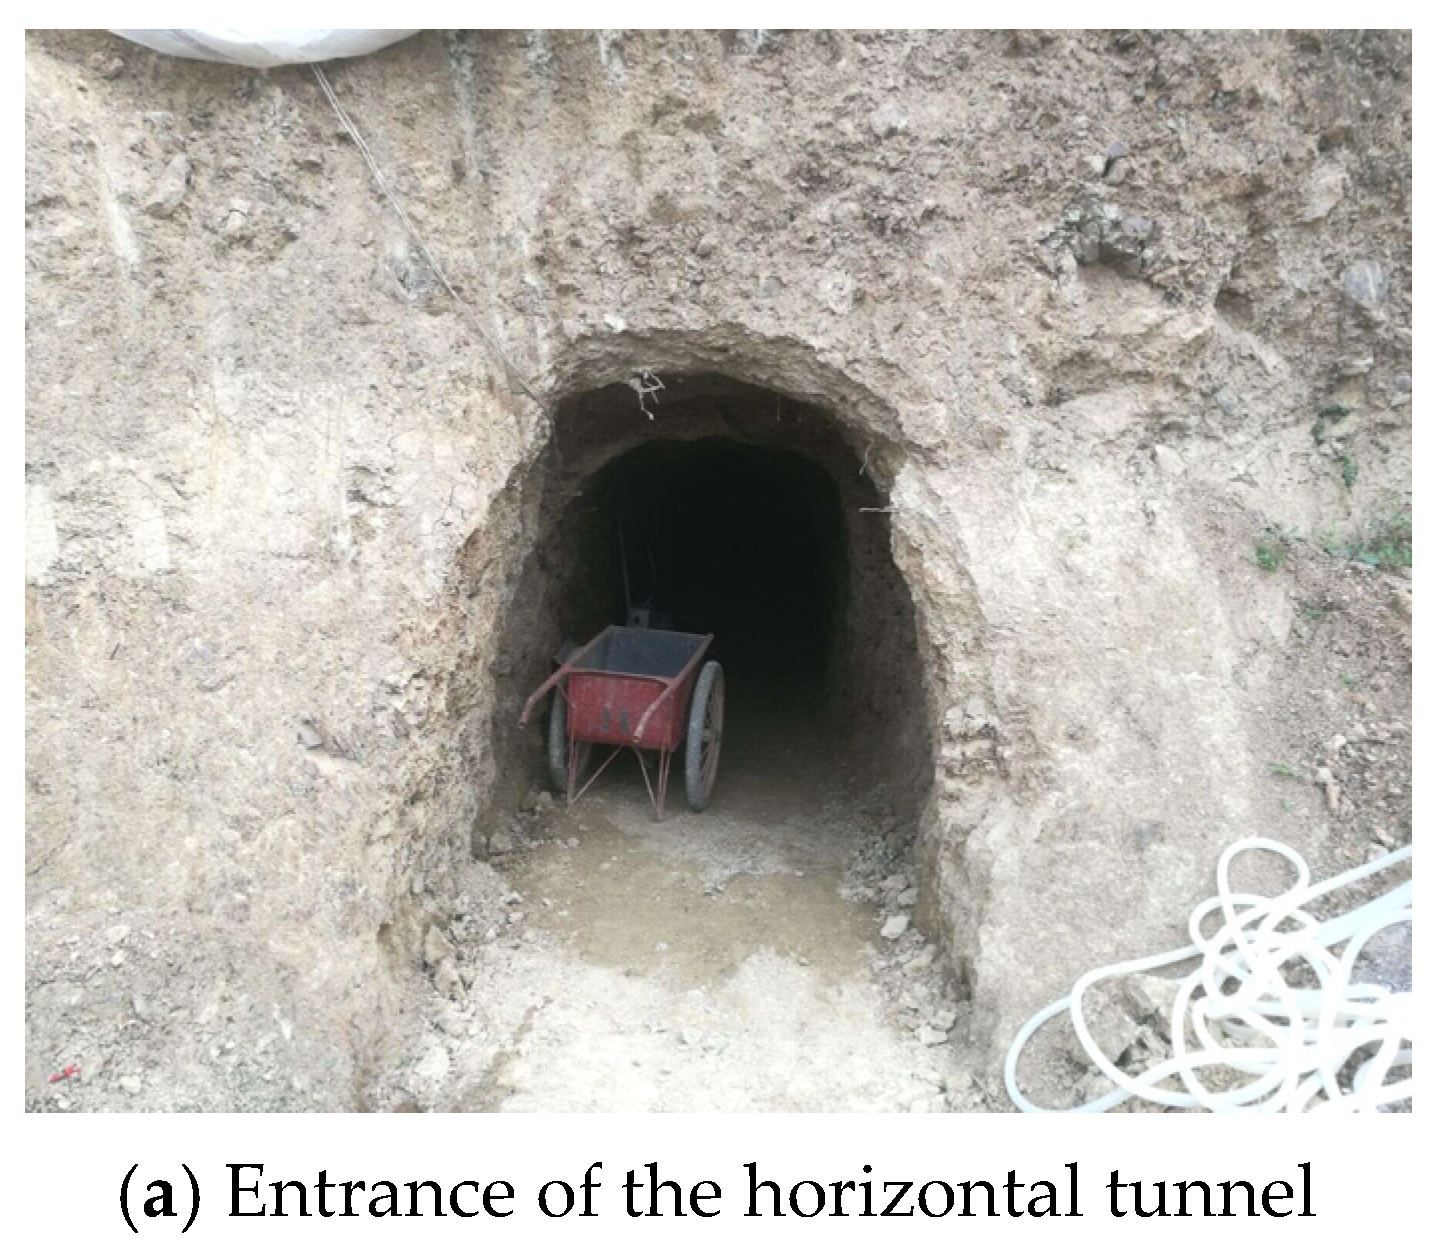
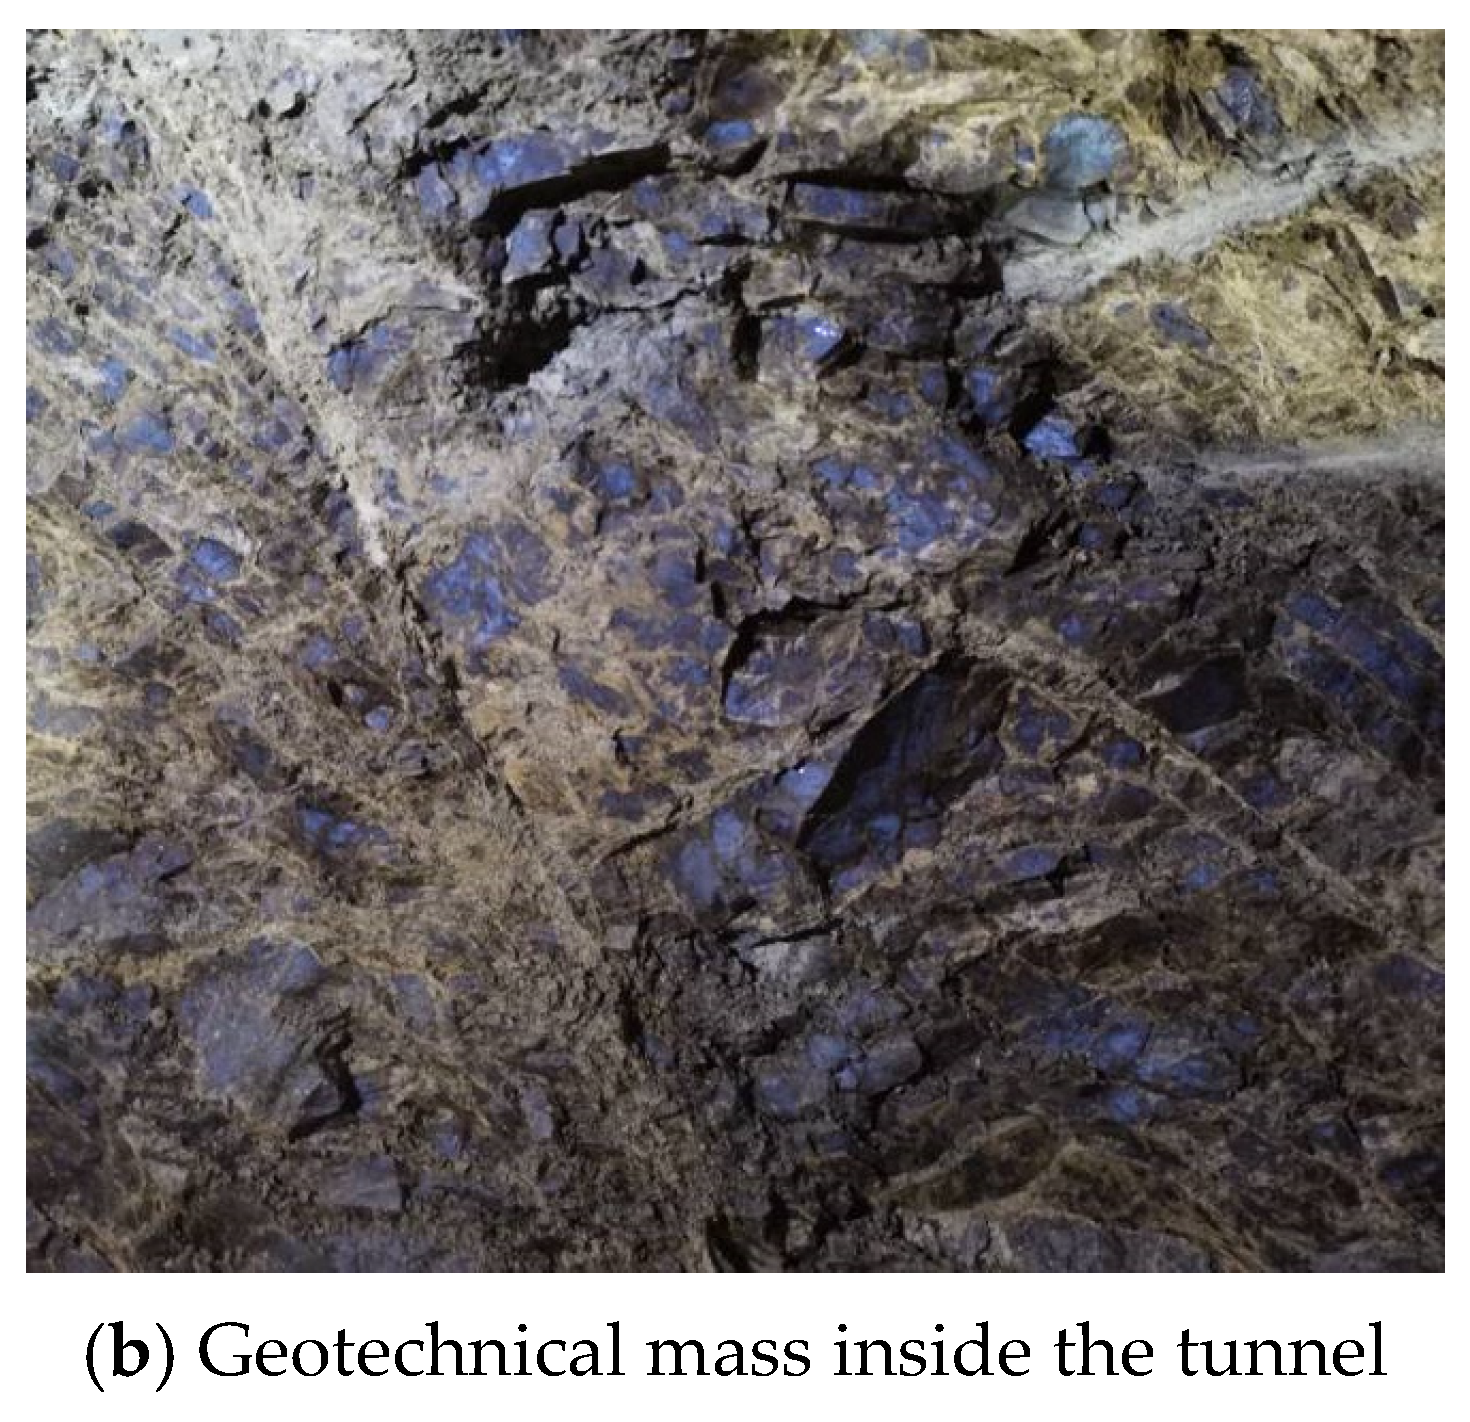
2.1. Geotechnical Profile

The Kahaluo Jinsha River Bridge [15], situated at the boundary between the Sichuan and Yunnan provinces in China, is a highway suspension bridge. Geological surveys indicate that the slope on the Sichuan side of the bridge site consists of a thick overburden layer made up of breccia, gravel, boulders, pebbles, and silty clay, classified as medium to hard soil. The overburden is stratified as follows from top to bottom: Quaternary Holocene landslide deposits, primarily composed of silty clay with gravel, breccia, and boulders, with a drilling-revealed thickness of 4.0 to 14.0 m, mostly in a slightly dense state. The Quaternary Upper Pleistocene landslide deposits, reaching a maximum thickness of 145 m, are composed of silty clay mixed with gravel, breccia, and boulders, underlain by coarse sand from the Upper Pleistocene alluvial deposits, creating a steep soil slope. The weathering of rock in this layer weakens gradually from top to bottom, while the overall density increases, consisting mainly of medium-dense to dense gravelly soil and boulders. The Quaternary Upper Pleistocene alluvial deposits are partially interspersed with pebbles and cobbles, with drilling showing a thickness of about 22 m and a lenticular distribution. The geological profile is shown in Figure 1.
Based on Chinese code DL/T 5356-2006 [16], the particle size distribution analysis of the geotechnical mass revealed that it consists of well-graded gravel. Particles with sizes between 20 mm and 100 mm constitute 20% to 25% of the total mass, with 20 mm particles being predominant.

2.2. Soil Parameter

To identify the load-deformation behavior of the geotechnical mass at the Sichuan-side bridge location of the Kahaluo Jinsha River Bridge, a horizontal tunnel was excavated within the slope, and physical and mechanical tests were conducted on the gravelly soil inside. The horizontal tunnel was approximately 25 m long, 1.8 to 2.0 m wide, and 2 m high, as shown in Figure 2, which illustrates the tunnel and the internal rock–soil mass. In accordance with Chinese code DL/T 5356-2006, large-scale direct shear tests and horizontal plate load tests were performed on the undisturbed soil within the tunnel to determine the shear strength and deformation parameters of the geotechnical mass. The elastic modulus of the gravelly soil was obtained from a cyclic plate load test with five cycles. The large-scale direct shear test specimens measured 900 mm in side length and 500 mm in height, while the configuration of the plate load test is shown in Figure 3. The physical and mechanical properties of the gravelly soil are provided in Table 1, where γ denotes the unit weight, w represents the moisture content, Es refers to the elastic modulus, φ indicates the soil’s friction angle, and c represents the soil’s cohesion. The soil was analyzed according to Chinese code DL/T 5356-2006. Particles greater than 20 mm were measured in the field using a tape measure, and those smaller than 20 mm were tested for particle size distribution in the laboratory. The results indicated that the soil was well-graded gravel.

3. In Situ Plate Load Test

3.1. Experimental Setup

Plate load tests (PLT) were conducted at distances of 15.8 m, 19 m, and 23 m from the tunnel entrance. The procedures for the PLT in Chinese code DL/T 5356-2006 are comparable to those specified in DD ENV 1997-3:2000 [8]. The setup of the horizontal PLT is illustrated in Figure 3. To minimize the impact of gravel particle size, a circular rigid plate with a diameter of 800 mm was selected as the test plate. A square rigid plate with a side length of 1.5 m was used on the reaction side to ensure that the stress on this side remained significantly lower than on the test side. The test point surface was leveled within a 1.6 m radius, and the gap between the rigid plate and the tunnel wall was filled with cement mortar. According to Chinese code DL/T 5356-2006, the maximum applied load should be no less than 1.2 times the design bearing capacity of 0.6 MPa, while the actual load reached 2 MPa.

3.2. Field PLT Results

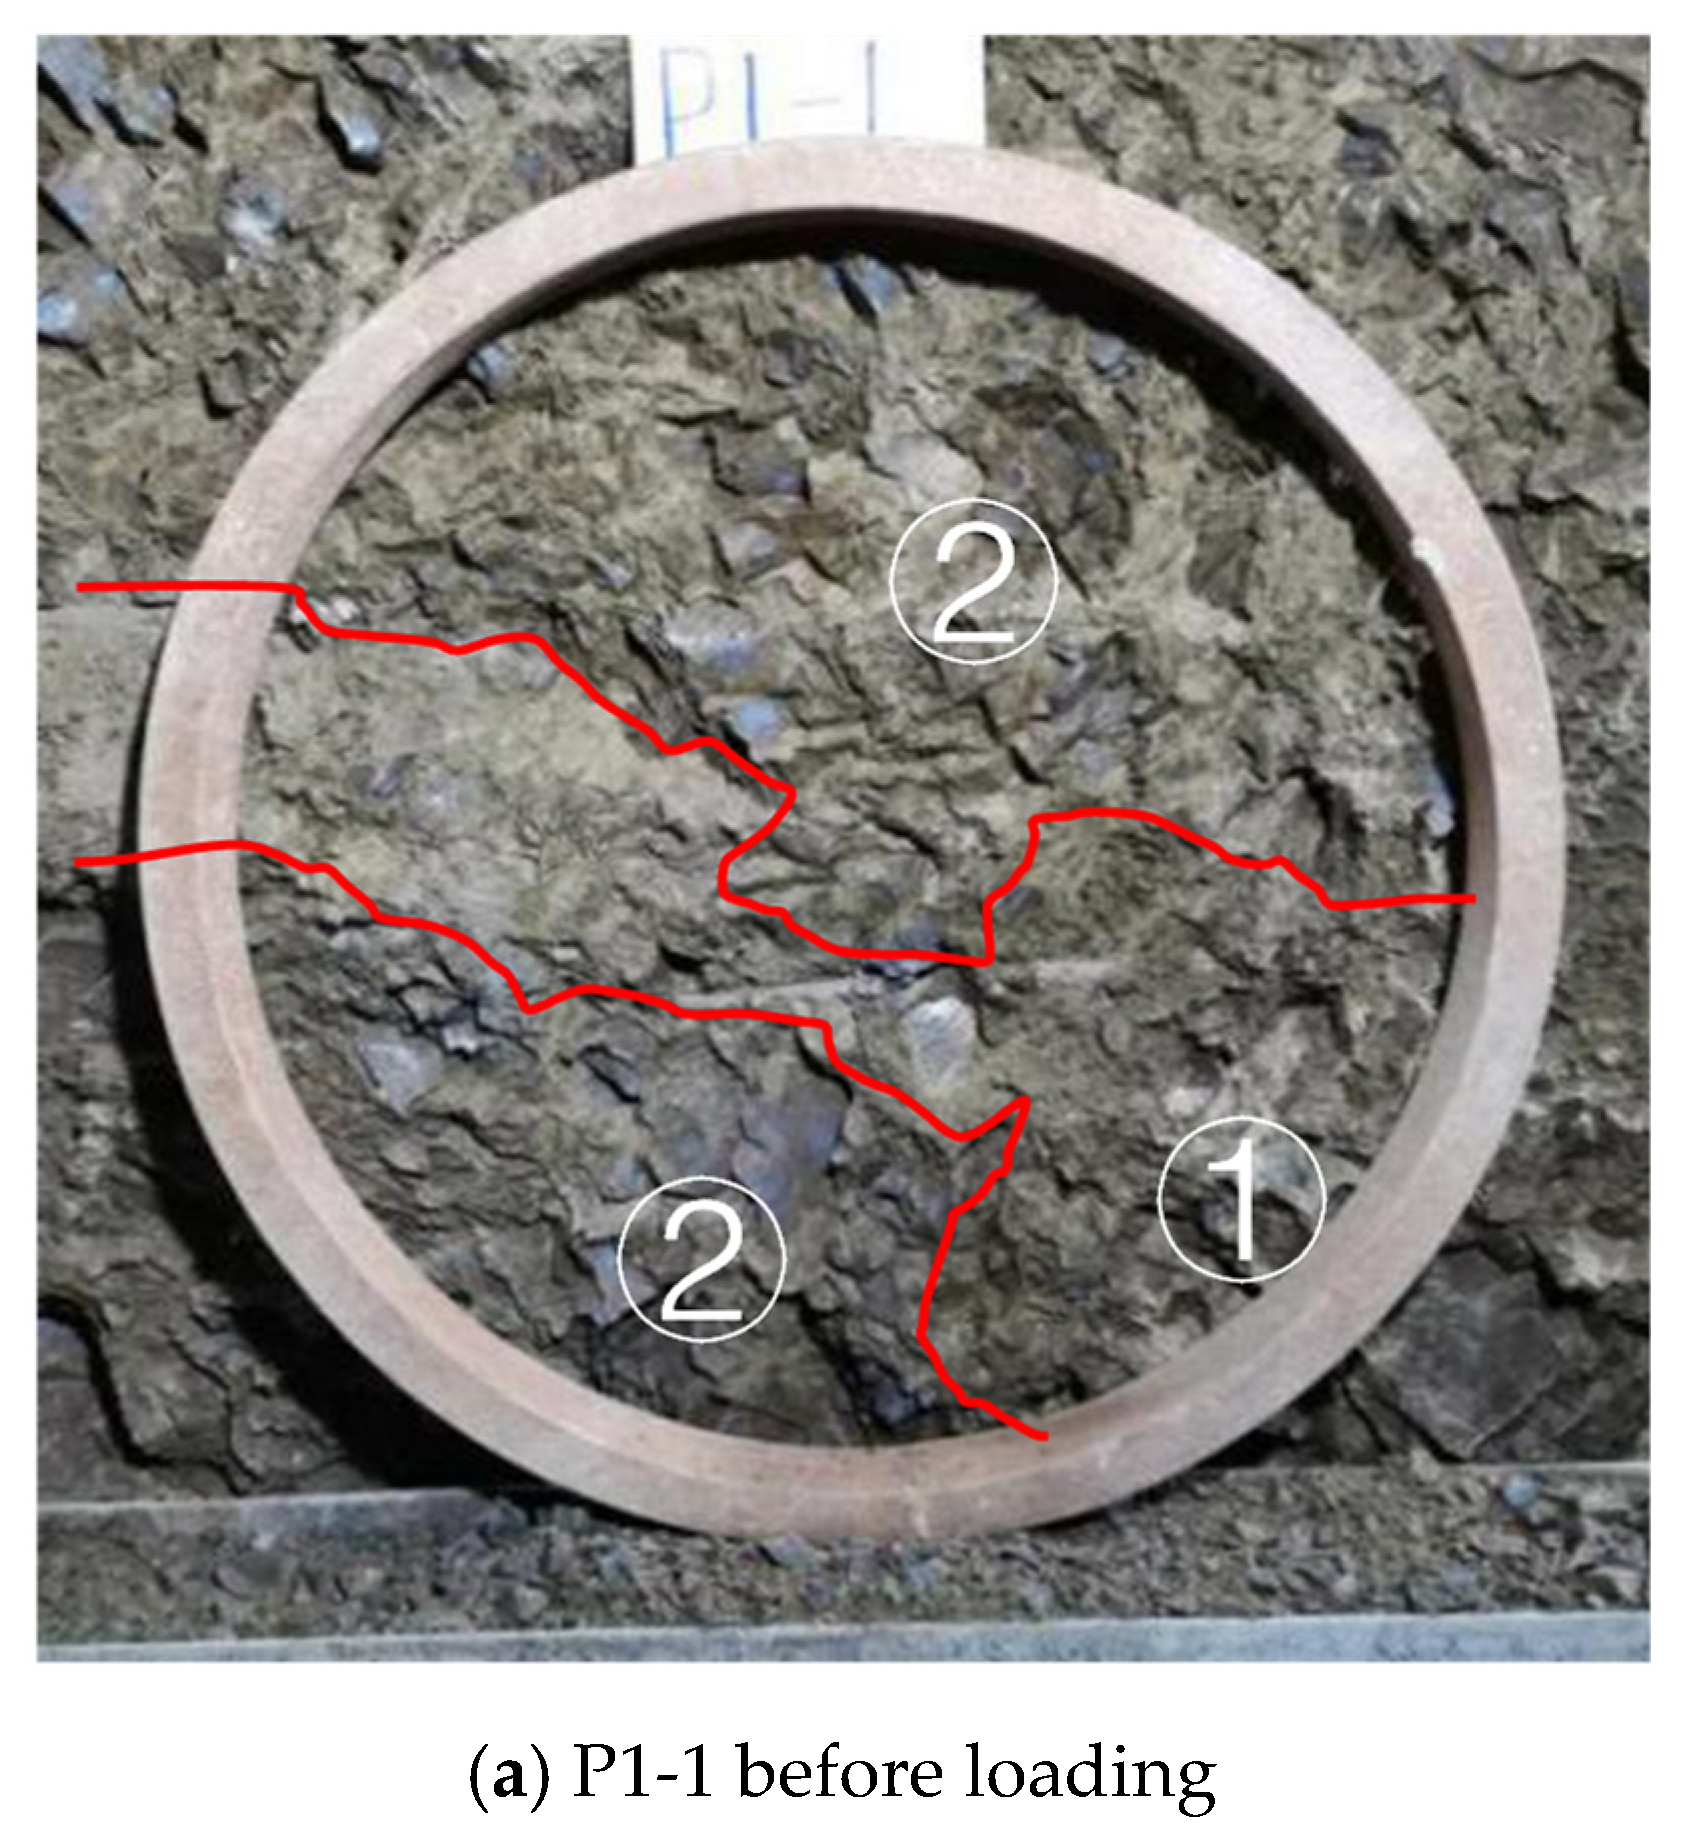
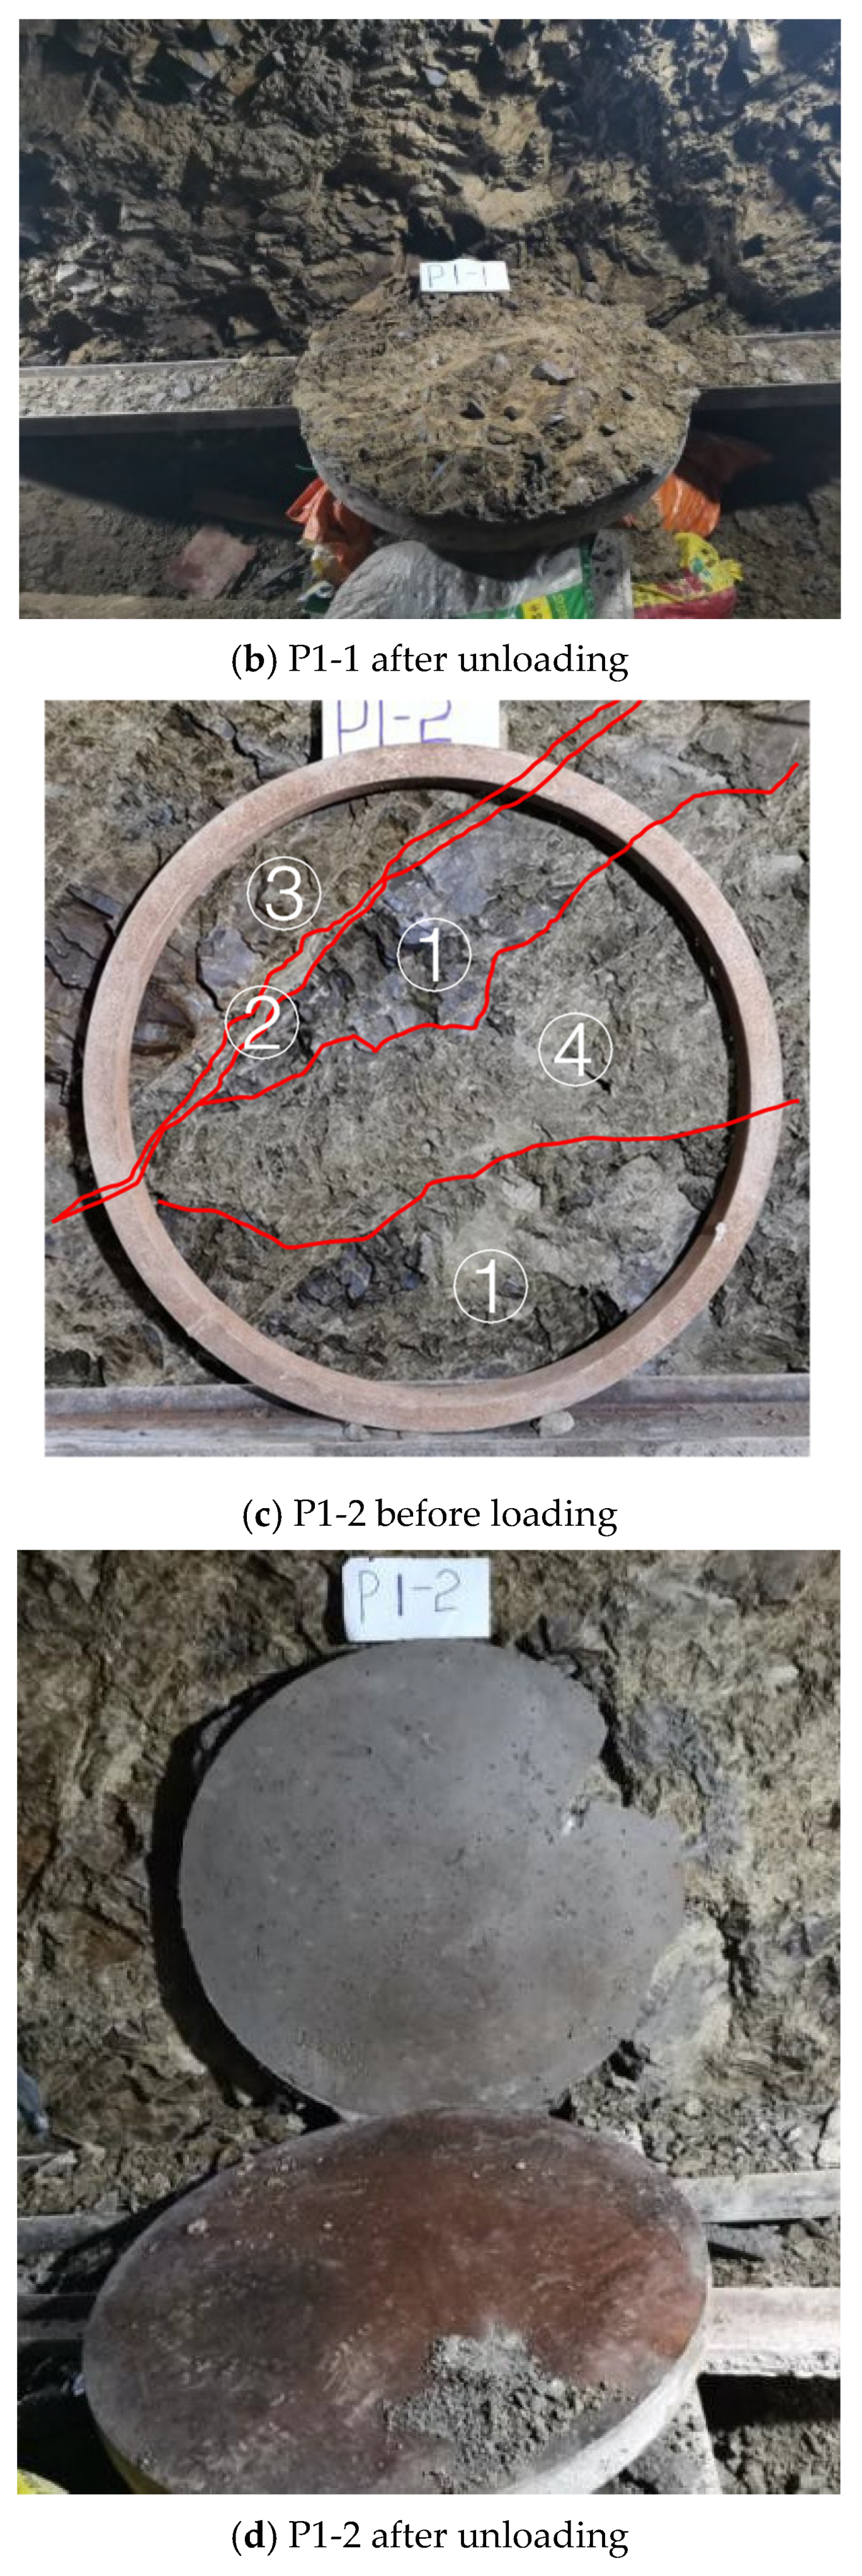
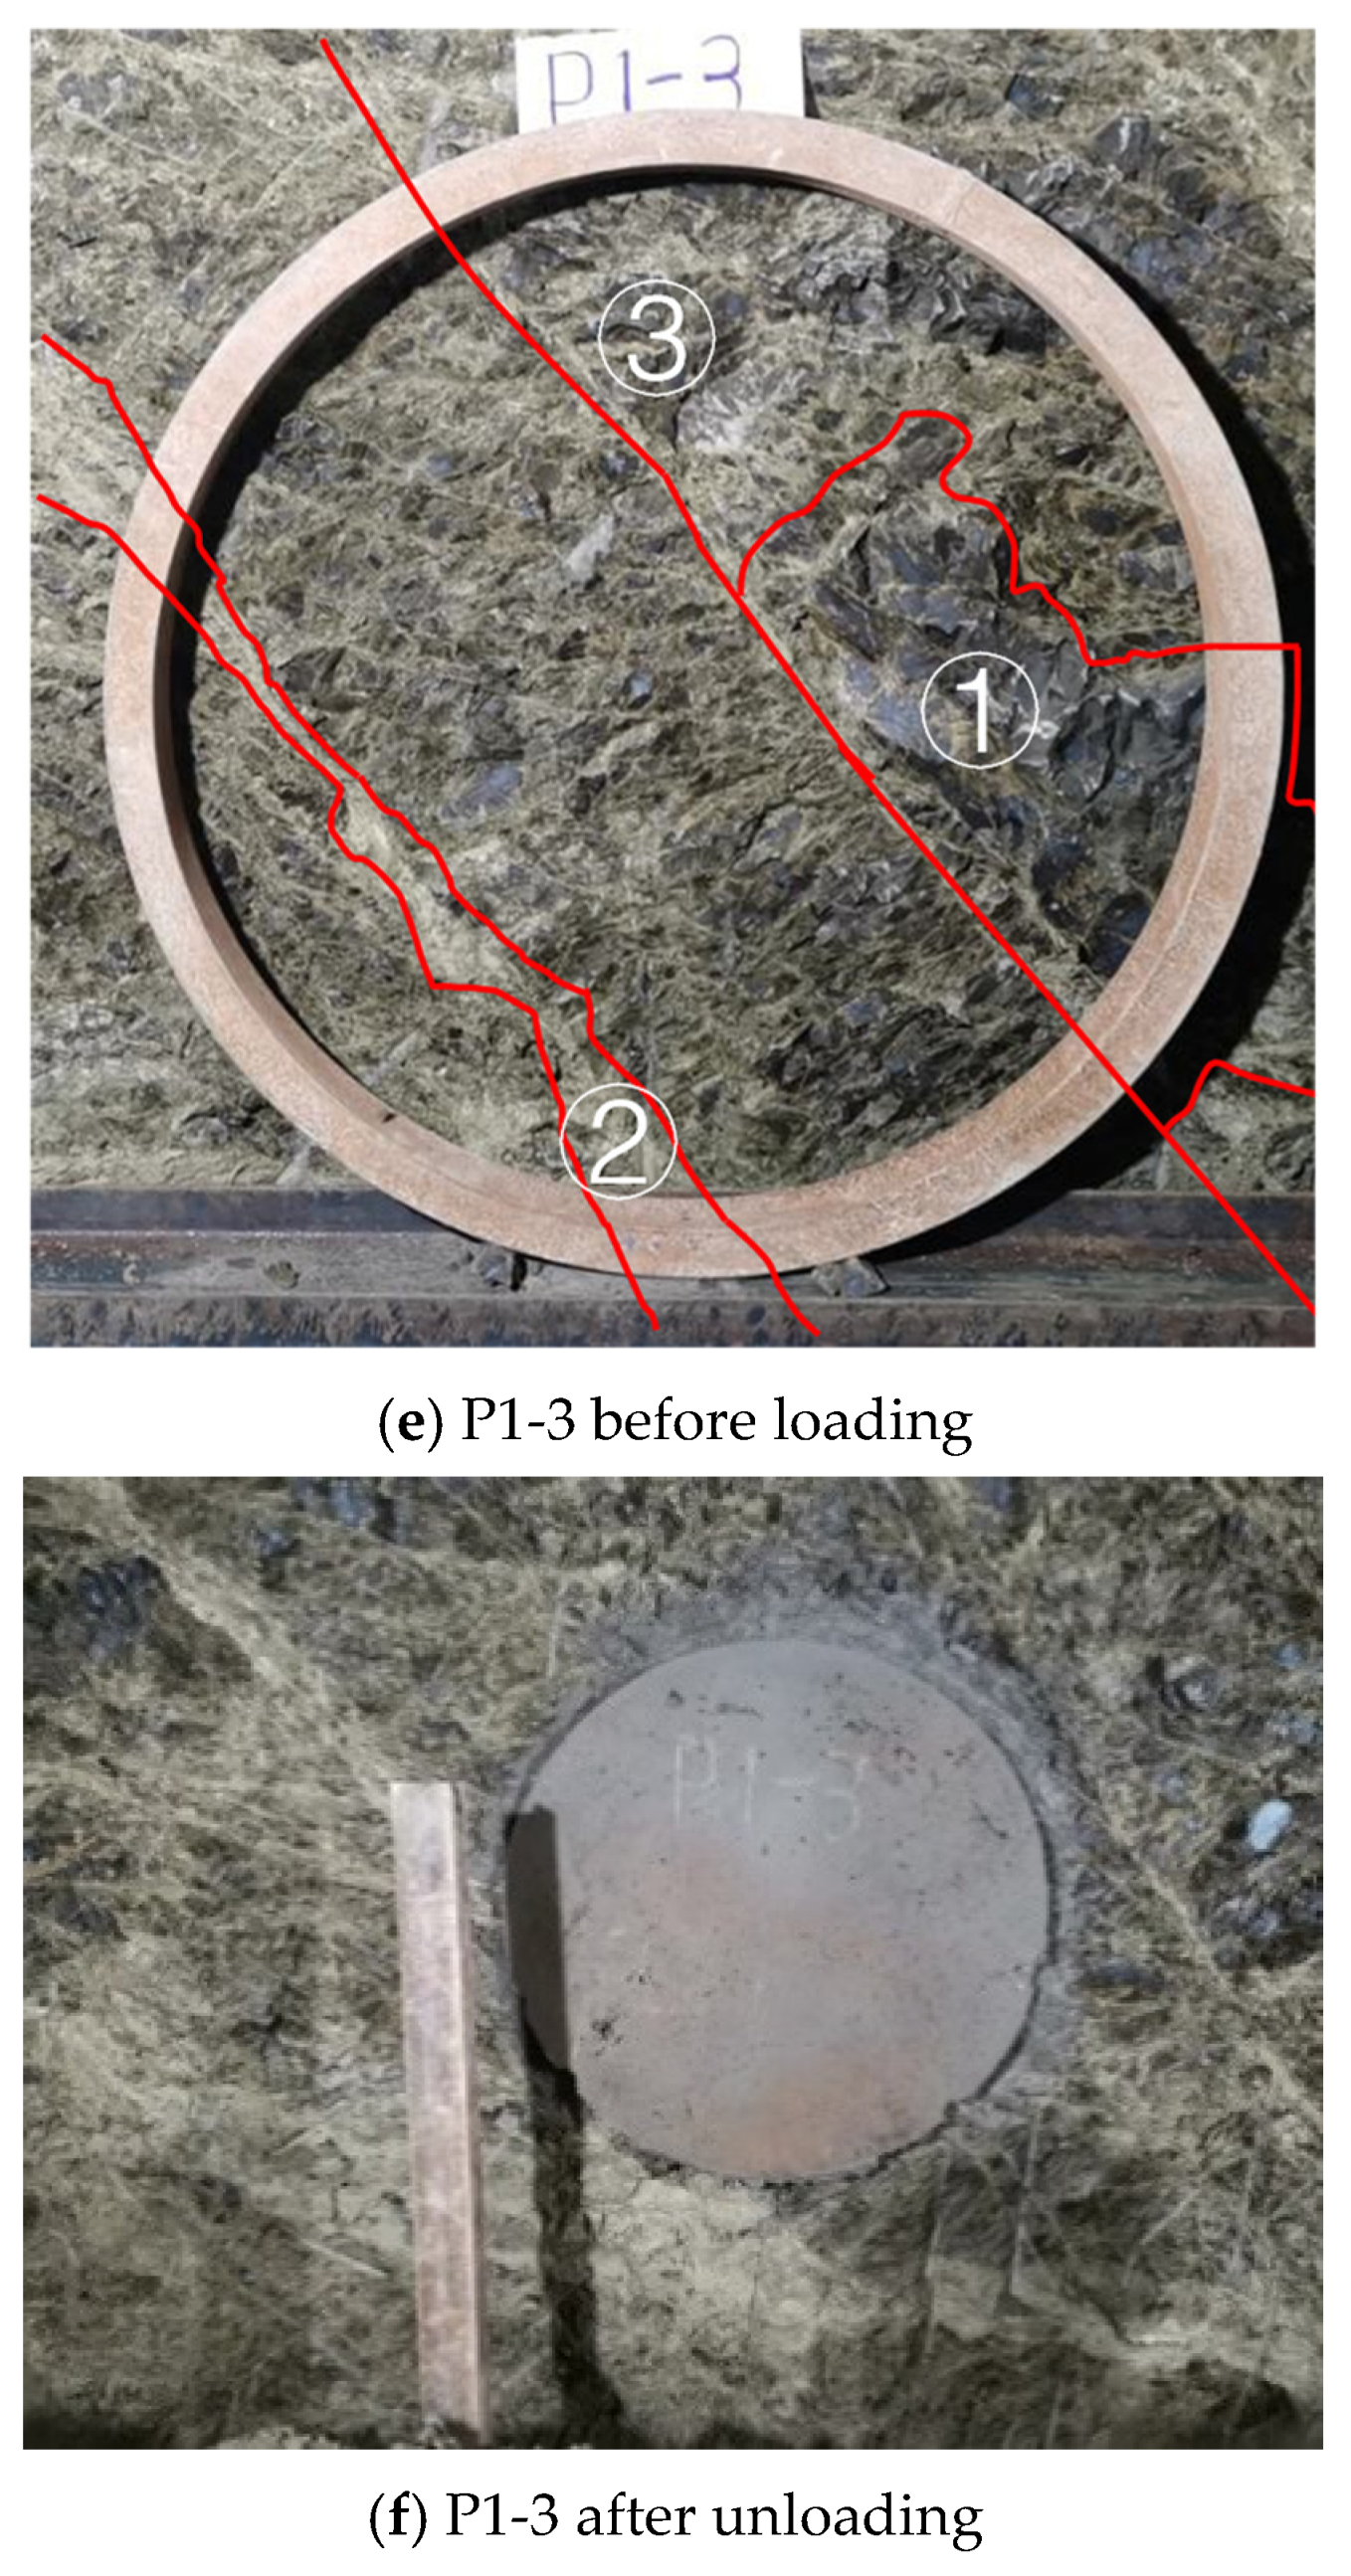
3.2.1. Geological Description of PLT Test Sites

Figure 4 illustrates the geological conditions at each test point for the load test. All three test points exhibited fractures and broken rock areas (highlighted in red), with the surface level differences at the test points ranging from 0 to 10 mm.
As illustrated in Figure 4a, the soil at test point P1-1 can be divided into two zones: Zone ① consisted of hard plastic, white, and yellow–brown sandy gravelly soil; Zone ② was characterized by intensely weathered argillaceous yellow–brown rock with well-developed, loosened fractures filled with light-yellow clayey material. Figure 4b shows that after unloading, the test plate adhered to the soil, resulting in the formation of a failure plane.
As illustrated in Figure 4c, the soil at test point P1-2 was divided into four regions: Zone ① was a moderately weathered gray rock zone with developed fractures, and its lower part was covered by a soft plastic, white clay film, with a thickness of 1 to 3 mm; Zone ② was a weak layer filled with soft plastic, pale-yellow clay, 1 to 20 mm wide; Zone ③ was a highly weathered yellow–brown rock zone; and Zone ④ consisted of soft plastic, white, and sandy gravelly soil. Figure 4d indicates that no failure cracks occurred following the test.
As illustrated in Figure 4e, the soil at test point P1-3 was divided into three zones: Zone ① consisted of moderately weathered gray rock with varying degrees of fracture development. Zone ② was a weak layer filled with pale-yellow, hard plastic clay, 1 to 40 mm wide. Zone ③ contained steep structural planes, with pale-yellow, hard plastic clay, 1 to 3 mm thick, filling the gaps. The remainder section consisted of fully weathered, argillaceous yellow–brown rock layers, with fractures filled by pale-yellow, hard plastic clay. Figure 4f shows that no failure cracks occurred following the test.

3.2.2. Average Contact Pressure Settlement

Figure 5 illustrates the stress–displacement curves (p-s curves) from the in situ PLT. The tests at P1-2 and P1-3 were completed successfully. However, the test at P1-1 was abruptly halted due to a partial collapse at the top of the test tunnel when the average contact stress reached 1.6 MPa, preventing the recording of the unloading phase.
Analysis of Figure 4 showed that during the test, there was no significant extrusion, cracking, or uplift of the soil around the test plates at any of the three test points. The total settlement was well below 0.1 times the plate diameter. From the p-s curves in Figure 5, it is clear that no sudden increase in settlement occurred during loading. Therefore, it can be concluded that the soil did not fail during the test but remained in a densified state.
Based on the principles of elasticity [17], within the linear range of the average contact stress–settlement curve for a circular test plate, the plate settlement modulus (EPLT) [8] can be calculated using Equation (1), where EPLT is determined by the average contact stress (Δp) and the corresponding settlement displacement (Δs).
E P L T = K p π d 1 μ 2 4
Here, Kp represents the coefficient of subgrade reaction corresponding to PLT, Kp = Δps, Δp is the average contact stress within the linear range of the p-s curves, and Δs is the corresponding settlement; Bp is the diameter of the rigid plate, and μ is the Poisson’s ratio of the soil. The results are presented in Table 2.

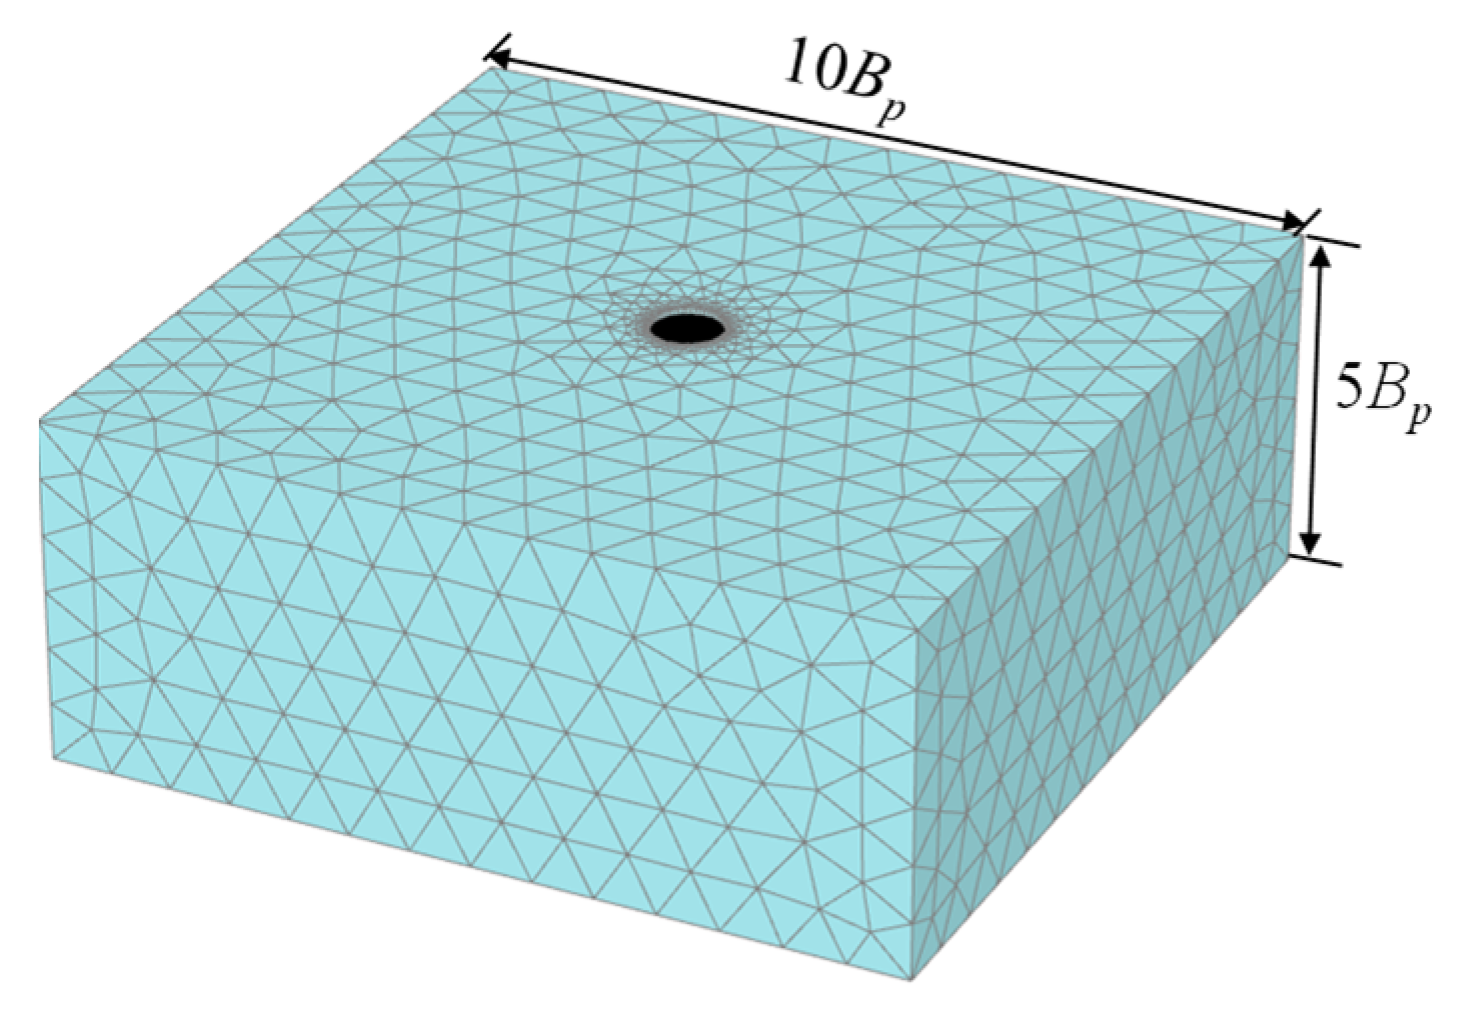
4. Finite Element Analysis

4.1. Calibration of the Model

Both the finite element method (FEM) and discrete element method (DEM) can be applied in numerical computations [18,19]. At low stress levels, the stress propagation in the soil follows discrete medium behavior, whereas under higher stress, it tends to behave as a continuous medium [20]. In civil engineering, the stresses associated with foundation–soil interaction are generally large; thus, this paper analyzed the PLT test based on the finite element method for continuous media.
Based on the conclusions from previous studies [8,21,22] regarding the attenuation range of the stress bulb during the interaction between the test plate and the soil, along with preliminary calculations, the boundary dimensions of the PLT finite element model in this study were set to a plane size of 10 Bp × 10 Bp, with a depth of 5 Bp. The boundary conditions were set as follows: horizontal displacement was fixed at the boundary in the horizontal direction, while both horizontal and vertical displacements were fixed at the bottom, as shown in Figure 6.
The Mohr–Coulomb constitutive model was utilized in the finite element analysis to represent the soil behavior, with parameters derived from field geotechnical tests (see Table 1). The test plate was modeled as a rigid body. The finite element model simulated the three test points using the same loading methods as actual experiments, as shown in Figure 7. The computed results closely matched the actual test results, demonstrating the model’s high reliability and accuracy, based on the field test.
Following the loading procedure of the in situ PLT, an equal incremental loading approach was implemented, with an increment of 0.1 MPa, which is smaller than that used in the experiments. Taking P1-2 as a reference, Plaxis3D was utilized to analyze PLT with varying diameters, examining the effect of foundation width on the interaction between the foundation and the soil. The diameters analyzed for the test plate were 0.8 m, 2 m, 4 m, 6 m, 8 m, 10 m, 12 m, 14 m, and 16 m.

4.2. Results and Analysis

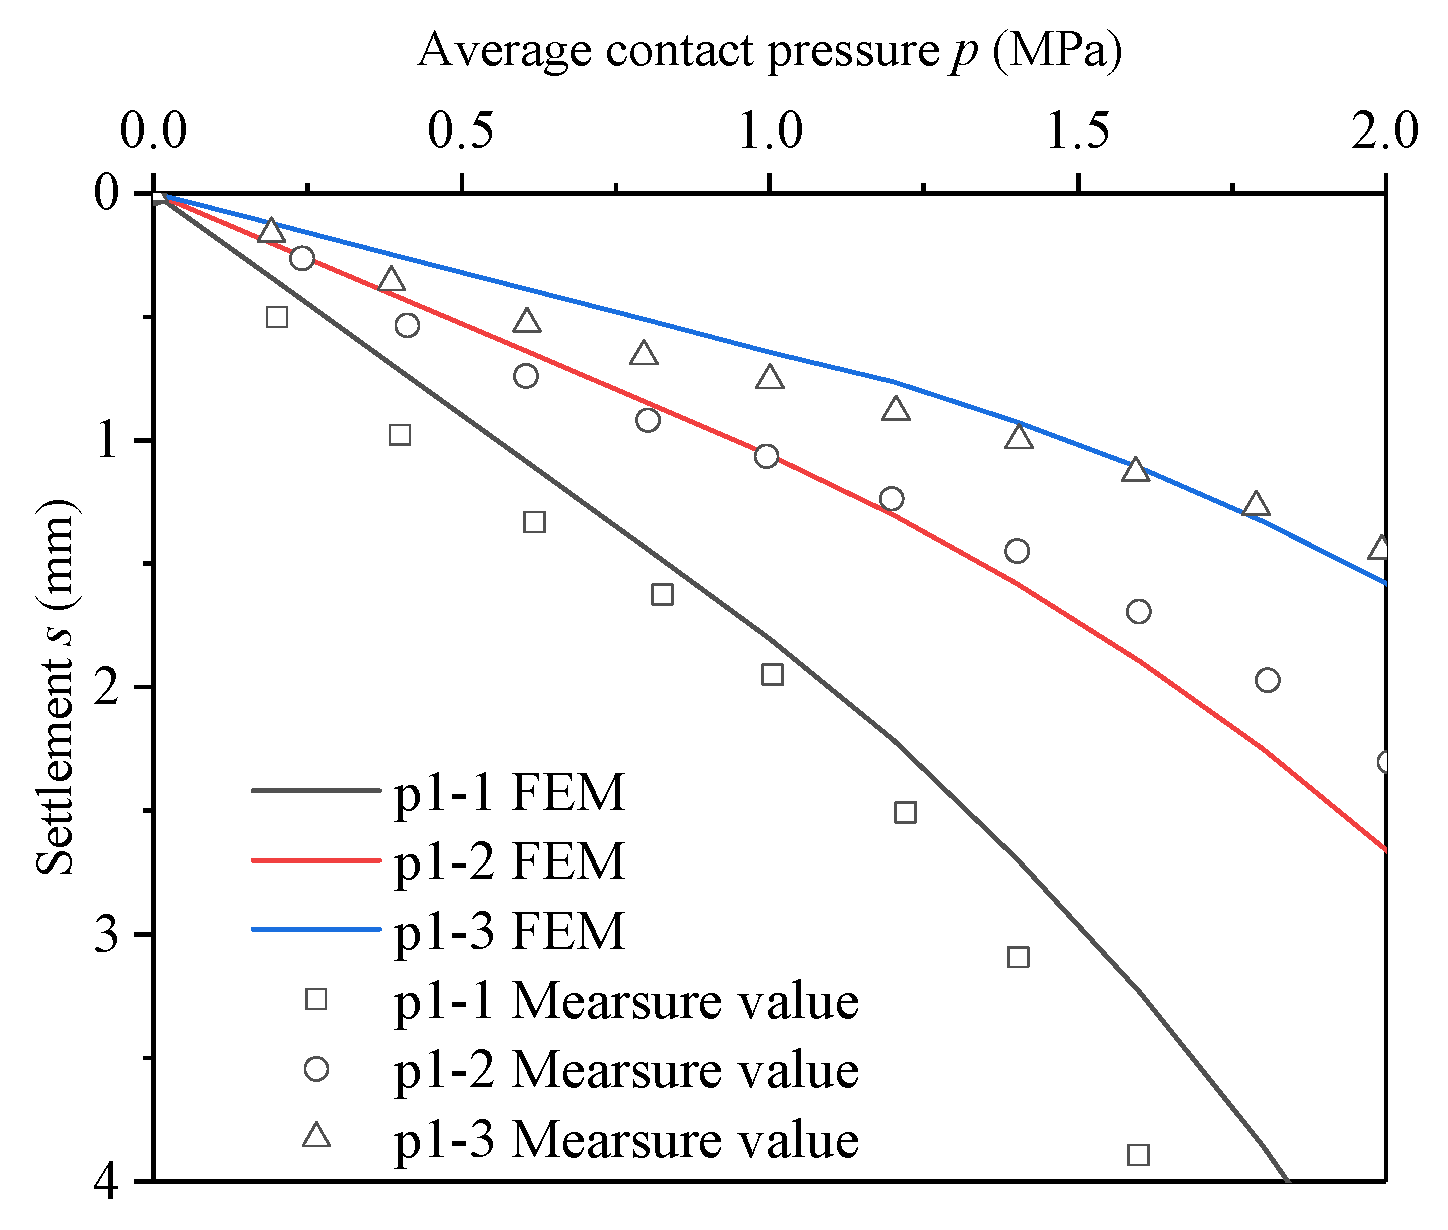
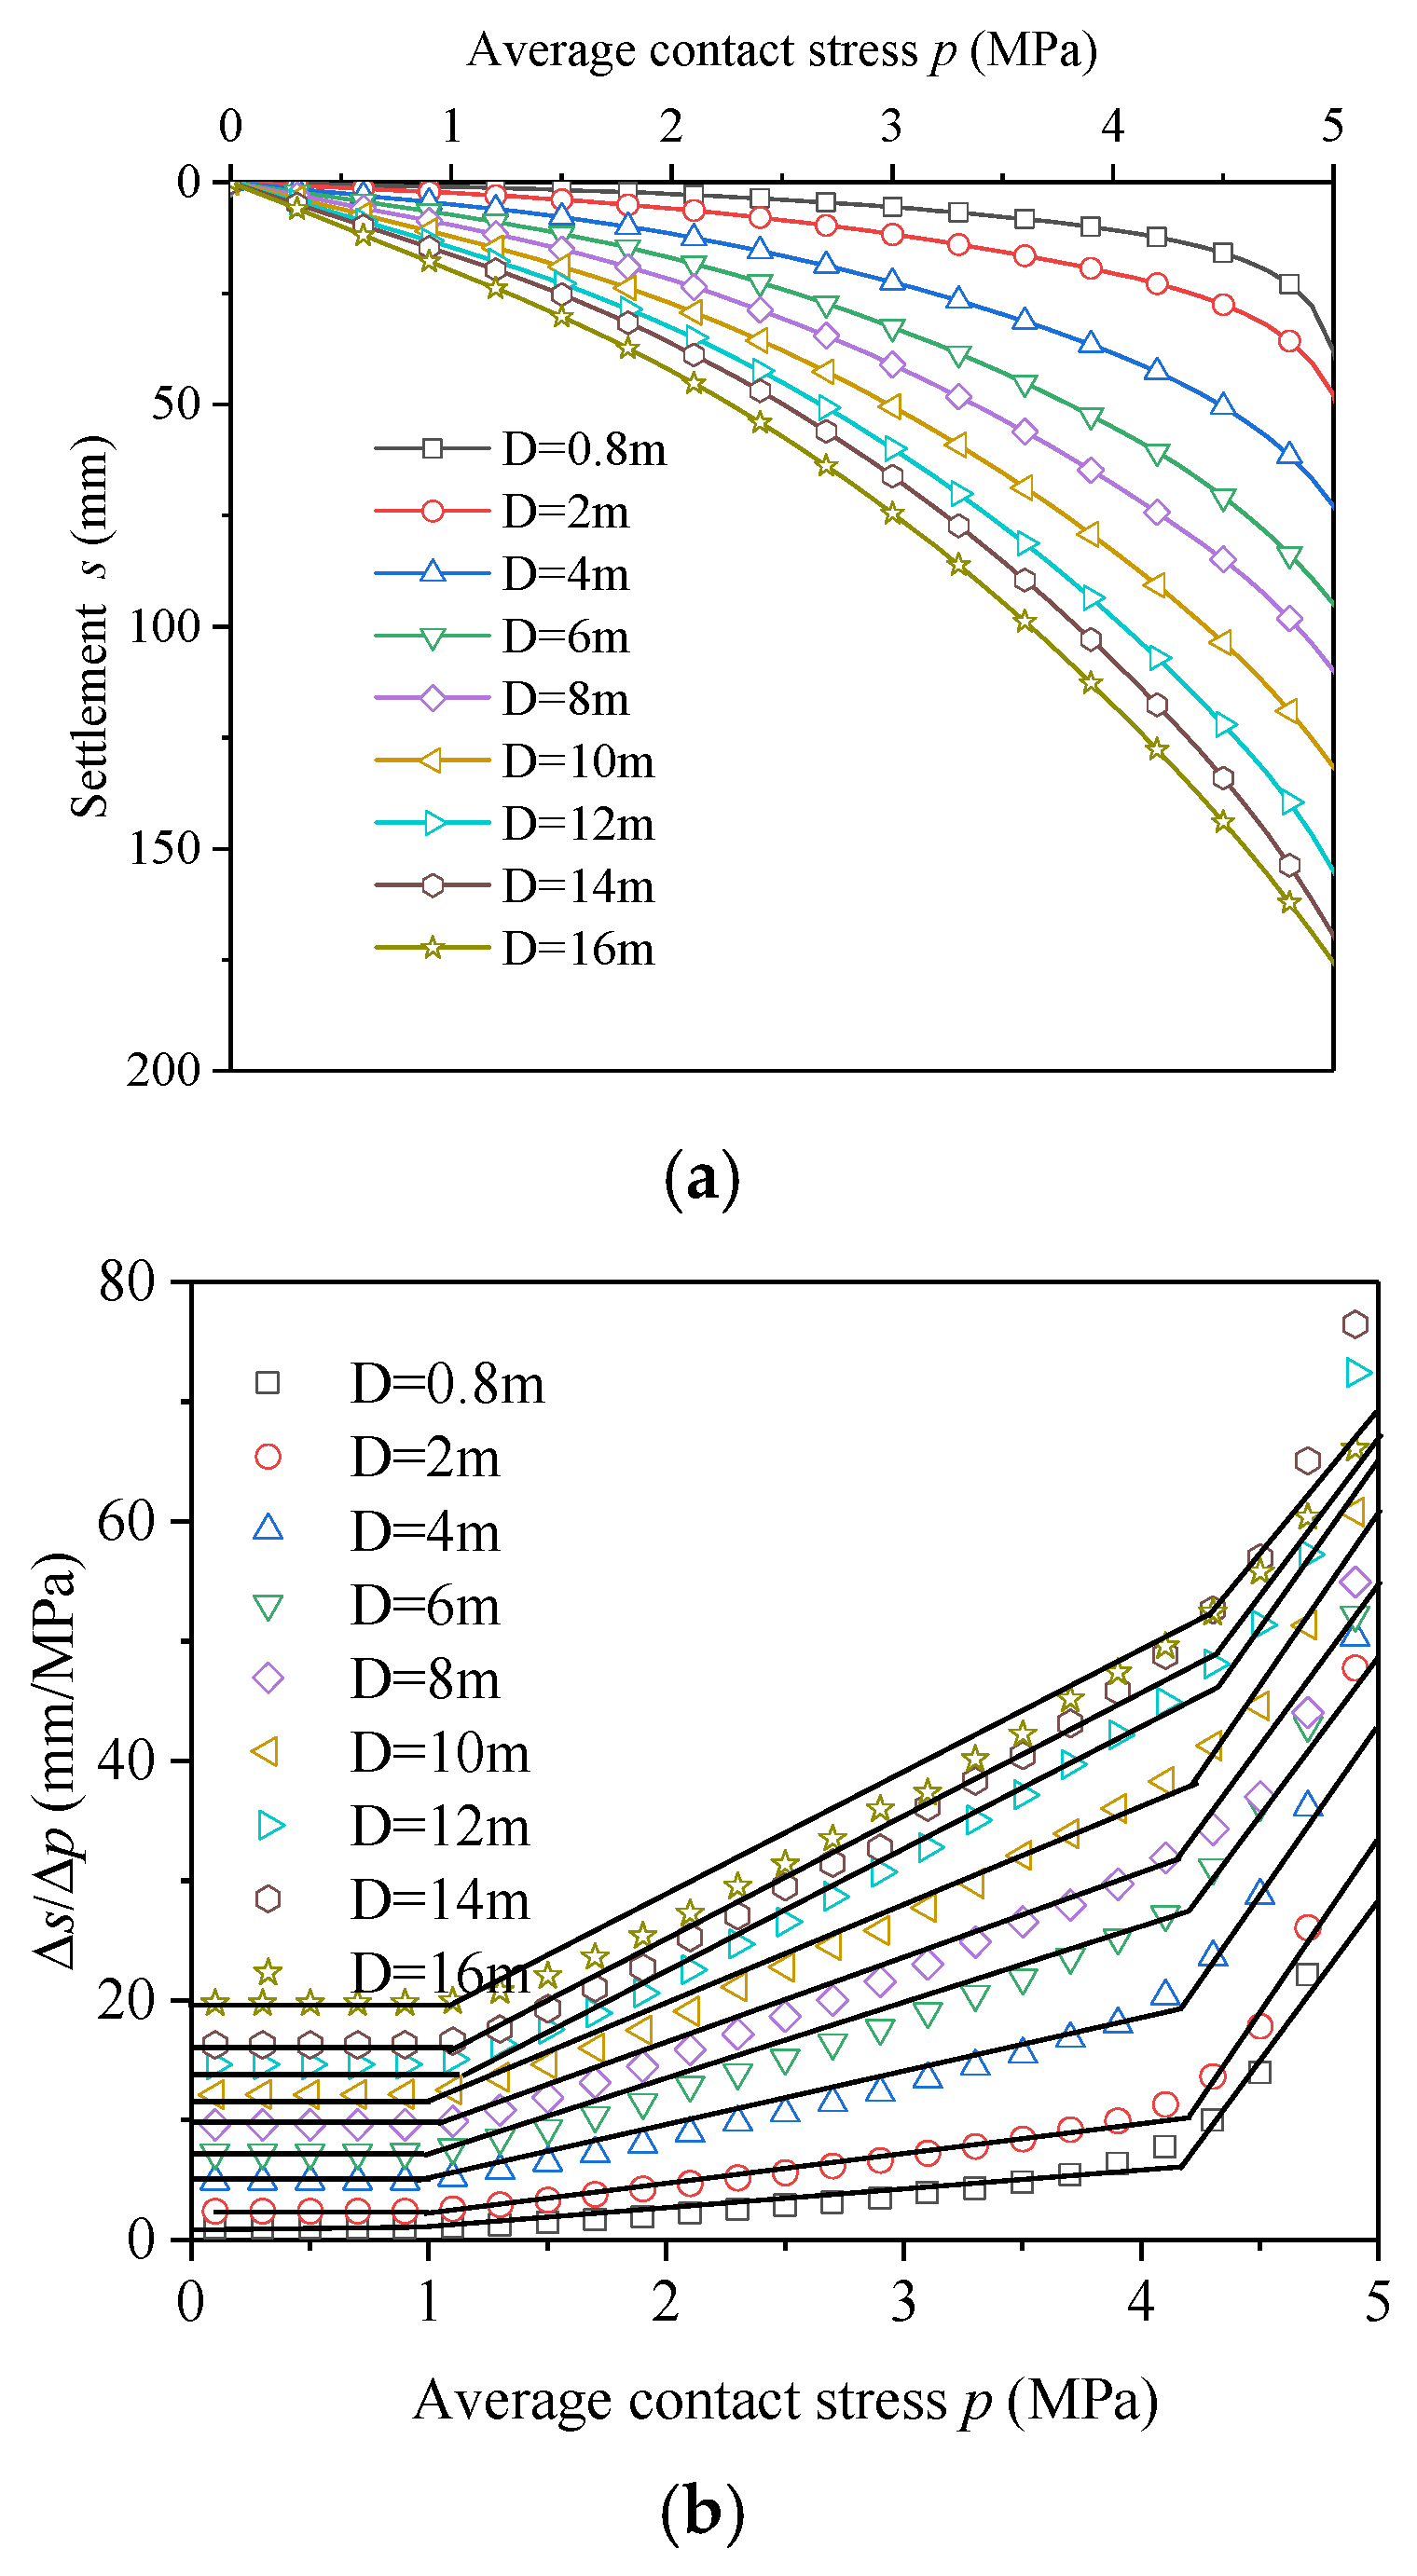
4.2.1. Average Contact Pressure–Settlement Curves

As shown in Figure 8a, the variation pattern of the average contact pressure–settlement curve (p-s curves) changed with the increasing diameter of the test plate. Specifically, as the test plate diameter increased, the p-s curve exhibited more pronounced nonlinear characteristics. Additionally, at the same contact stress, larger diameter test plates resulted in greater displacements.
As shown in Figure 8b, despite the variation in test plate diameters, the average contact stress–settlement gradient (Δsp) followed a consistent pattern with the average contact stress (p). This can be effectively described using a three-stage linear model.
In the first stage, Δsp was constant, indicating that its slope was zero as the load increased. This suggests that the p-s curve remained in the elastic phase.
In the second stage, as the load increased, the Δsp began to rise, with its rate of increase becoming a non-zero constant. This indicates that the p-s curve entered the yield phase.
In the third stage, as the load continued to increase, the rate of increase of the Δsp rose sharply, suggesting that the soil reached the failure stage.
Table 3 presents the elastic and yield limit loads derived from the average contact stress–settlement gradient curves. For test plates of different diameters, the load at the elastic limit state remained constant at 1 MPa. In contrast, the yield limit load progressively increased with the test plate size and eventually leveled off at 4.6 MPa. Notably, the yield limit load did not follow a linear relationship with the increasing size of the loading plate, aligning with findings from load tests on pebble layer foundations in literature [23].
To clearly illustrate the shear failure behavior of the soil, the relative shear stress [24] was introduced, and it is defined as:
τ r e l = τ τ m a x
τmax represents the maximum shear stress when the Mohr stress circle is tangent to the Coulomb failure envelope. τ represents the shear stress in the soil. When τrel equals 1, it signifies that the Coulomb failure envelope has been reached. When τrel equals 0, it indicates that the soil remains entirely undisturbed.
Figure 9 illustrates the shear failure condition of the soil beneath test plates with diameters of 2 m and 16 m at an average contact stress of 1 MPa, as determined by the relative shear stress τrel. The figure shows significant differences in the shear failure behavior of the soil under the two test plate sizes. According to Table 3, the 2 m test plate experienced a settlement of 2.42 mm at an average pressure of 1 MPa, with a complete shear band from beneath it. In contrast, under the same load, the 16 m diameter test plate underwent a settlement of 19.89 mm, with only localized shear bands forming near the plate’s edge.
This phenomenon suggests that under the same average contact stress conditions, the soil beneath the smaller test plate reached its failure point within a limited deformation range, resulting in the formation of a continuous shear plane. However, this does not imply that this level of deformation approached or reached the soil’s actual ultimate deformation capacity.
Therefore, the ultimate bearing capacity determined from small test plate tests may satisfy safety standards based on strength failure, but it may fall short of the deformation safety requirements in real-world engineering applications.

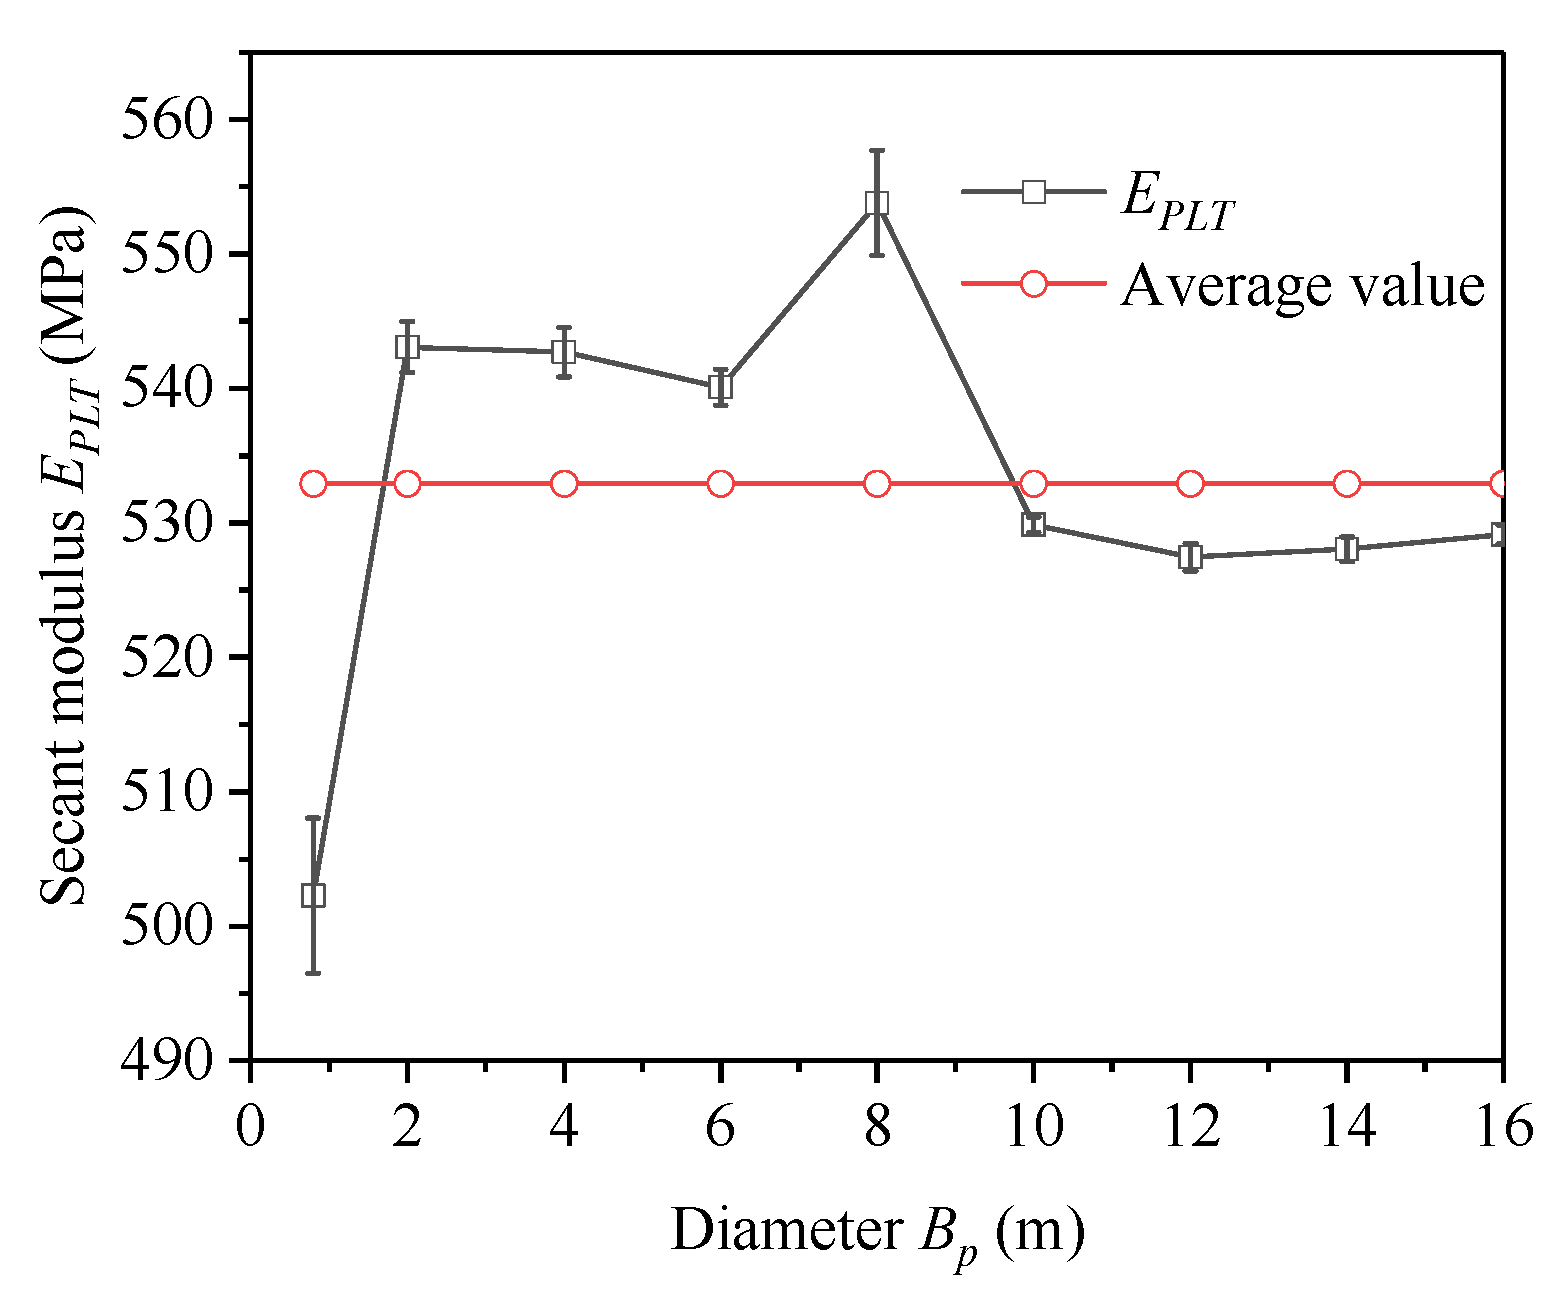
4.2.2. Secant Modulus EPLT

The secant modulus, as calculated from Equation (1), varied with the diameter of the test plate, as depicted in Figure 10. As the test plate diameter increased, the secant modulus EPLT showed a fluctuating trend, averaging 534.47 MPa. Specifically, when the test plate diameter was 800 mm, the calculated EPLT deviated the most from the average, with an absolute difference of 5.75%. Furthermore, the difference between the average secant modulus and the elastic modulus of the material was 7.69%.
Although the test plate size affected the average contact stress–settlement curve to a certain extent, its influence on the secant modulus EPLT remained relatively minor, and overall stability was maintained. From the analysis of the Δsp in Figure 8b, it is evident that while the test plate size can cause some variation in the average contact stress–settlement curve, it does not significantly affect the load-bearing characteristics of the soil–plate interaction.

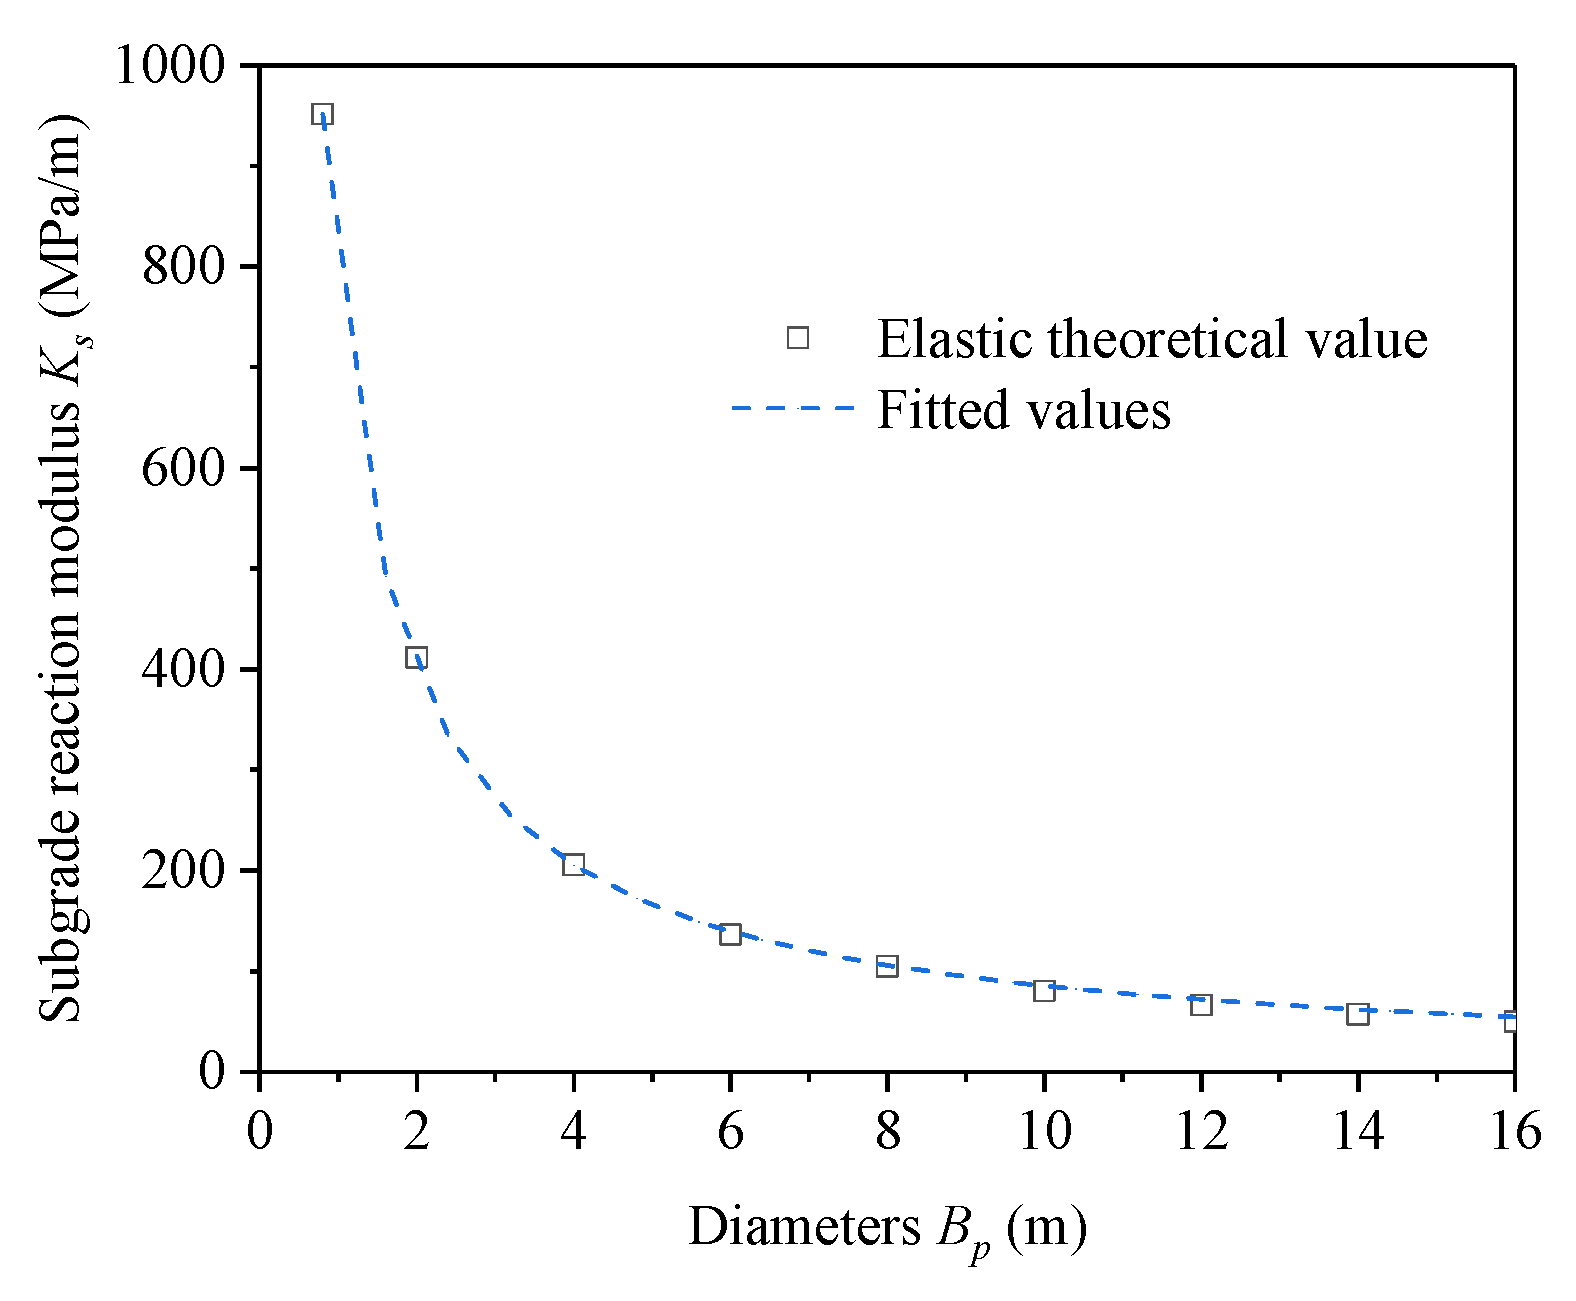
4.2.3. Coefficient of Subgrade Reaction

As illustrated in Figure 11, the Kp decreased with the increasing test plate diameter in a power-law function. Based on Terzaghi’s [25] correction formula for the coefficient of subgrade reaction in clay, a correction relationship was derived for Equation (3). Using the test plate with an 800 mm diameter as a reference, the coefficient of subgrade Ks for different diameters was fitted, yielding an exponent n. The fitting result for Equation (4) resulted in n = 0.953, which is highly consistent with Terzaghi’s [25] formula, indicating that the subgrade modulus of gravelly soil can be extrapolated through Terzaghi’s method from PLT.
K s = K p ( B p B ) n
Here, Kp represents the subgrade modulus of the reference test plate, Bp denotes the diameter of the reference test plate, and n is the exponent that needs to be determined.

5. Discussions

Previous studies [26,27] have shown that different soil types exhibit distinct stress–displacement characteristics, suggesting that soils of the same type should have comparable settlement responses under average contact stress. However, Figure 8a shows that as the test plate diameter increased, the shapes of the p-s curves changed, seemingly contradicting established empirical findings. This discrepancy can be explained by examining the average contact stress gradient (Figure 8b) and the shear stress conditions beneath the test plate (Figure 9).
Figure 9 illustrates that under the same average contact stress, the shear stress in the soil varied with the test plate diameter. The soil beneath the small-diameter test plate reached failure and formed a complete shear band with a relatively small settlement, while the soil under the large-diameter test plate, despite a larger settlement, only experienced localized shear failure. These differences in shear failure explain the variations in average contact stress–settlement curves for different plate sizes. However, Figure 7b reveals that the Δsp for test plates of various diameters followed a similar overall pattern.
Table 4 presents the method for calculating Ks based on the extrapolation from the PLT. The PLT results showed that when the exponent n ranged from 3/4 to 1, the interaction between the test plate and the soil approached an elastic state [28]. In this study, Equation (5) was used to fit the relationship between the coefficient of subgrade reaction and the plate diameter, yielding an n value of 0.953. This agrees with the results in [29], which showed that for a 300 mm test plate on gravel and crushed stone, Ks had an inversely proportional relationship (1st-order) with the foundation width B.
Additionally, the relationship between the Ks and the Bp of different test plates in this study showed that Terzaghi’s [25] coefficients of subgrade reaction formula for clay also applies to gravelly soil and is not restricted by the foundation width B.

6. Conclusions

Based on the results of the in situ PLT, finite element software was used to analyze the PLT for various diameters in gravelly soil, leading to the following conclusions:
1. The Ks of the gravelly soil was inversely related to the foundation width (to the first degree), which is consistent with Terzaghi’s formula for extrapolating the subgrade modulus of a plate in clay to the prototype foundation size. Furthermore, this relationship was not constrained by foundation width.
2. The effect of test plate diameter on the secant modulus EPLT was relatively small. With increasing diameter, EPLT maintained consistent stability, with an average value of 532 MPa, roughly 92% of the elastic modulus.
3. The diameter of the test plate had a certain influence on the macroscopic changes in the average contact stress–settlement curves. Analysis of the Δsp suggests that the average contact stress–settlement curves of test plates with varying diameters followed the same fundamental development pattern.
4. With increasing test plate diameter, the ultimate load in the elastic state remained at 1 MPa, whereas the ultimate load in the yield state increased and eventually stabilized, reaching a final stable value of 4.6 MPa.
In this study, plate load tests (PLT) were conducted on undisturbed gravel soil, and numerical analysis methods were used for an in-depth investigation of its loading response. Future research can build upon this study to further explore the loading response characteristics of gravel soil foundations, providing theoretical support for the design and calculation of laterally loaded foundations.

Author Contributions

Conceptualization: W.L., Q.T. and W.G.; Methodology: R.G., C.L. and G.D.; Software: W.L.; Validation: W.L., Q.T. and W.G.; Formal Analysis: W.L.; Investigation: W.L., W.G. and Q.T.; Resources: Q.T., W.G. and R.G.; Data Curation: W.L., Q.T. and W.G.; Writing—Original Draft Preparation: W.L.; Writing—Review and Editing: W.L., Q.T., W.G. and G.D.; Visualization: W.L.; Supervision: C.L. and W.G.; Funding Acquisition: Q.T., W.G., G.D. and C.L. All authors have read and agreed to the published version of the manuscript.

Funding

This work was supported by the National Natural Science Foundation of China (No. 52378328, 52208333, and 52178317) and the Research Fund for Advanced Ocean Institute of Southeast University (Key Program KP202404; Major Program GP202403).

Informed Consent Statement

Not applicable.

Data Availability Statement

The raw data supporting the conclusions of this article will be made available by the authors upon request.

Conflicts of Interest

Authors Qiyu Tao and Rui Gu was employed by the company Sichuan Highway Planning, Survey, Design and Research Institute Ltd. Author Chao Li was employed by the company Sichuan Transportation Construction Group Co., Ltd. The remaining authors declare that the research was conducted in the absence of any commercial or financial relationships that could be construed as a potential conflict of interest.

References

  1. Akbas, S.O.; Kulhawy, F.H. Axial compression of footings in cohesionless soils. II: Load-settlement behavior. J. Geotech. Geoenviron. Eng. 2009, 135, 1575–1582. [Google Scholar] [CrossRef]
  2. Oh, W.T.; Vanapalli, S.K. Infuence of poisson’s ratio on the stress vs. settlement behavior of shallow foundations in unsaturated fne-grained soils. Soils Rocks 2016, 39, 71–79. [Google Scholar] [CrossRef]
  3. Consoli, N.C.; Rosa, F.D.; Fonini, A. Plate load tests on cemented soil layers overlaying weaker soil. J. Geotech. Geoenviron. Eng. 2009, 135, 1846–1856. [Google Scholar] [CrossRef]
  4. Nwokediuko, N.M.; Ogirigbo, O.R.; Inerhunwa, I. Load-settlement characteristics of tropical red soils of southern nigeria. Eur. J. Eng. Res. Sci. 2019, 4, 107–113. [Google Scholar] [CrossRef]
  5. Demir, A.; Yildiz, A.; Laman, M.; Ornek, M. Experimental and numerical analyses of circular footing on geogrid-reinforced granular fll underlain by soft clay. Acta Geotech. 2014, 9, 711–723. [Google Scholar] [CrossRef]
  6. Ebid, A.M.; Onyelowe, K.C.; Salah, M. Load-settlement curve and subgrade reaction of strip footing on bi-layered soil using constitutive fem-ai coupled techniques. Designs 2022, 6, 104. [Google Scholar] [CrossRef]
  7. Tang, Y.; Vo, T.; Taiebat, H.A.; Russell, A.R. Influences of suction on plate load tests on unsaturated silty sands. J. Geotech. Geoenviron. Eng. 2018, 144, 04018043. [Google Scholar] [CrossRef]
  8. EN 1997-2:2007; Eurocode 7: Geotechnical Design—Part 2: Design Assisted by Field Testing. European Committee for Standardization: Brussels, Belgium, 2004.
  9. Bowles, J.E. Foundation Analysis and Design, 5th ed.; McGraw-Hill: New York, NY, USA, 1997; pp. 318–319. [Google Scholar]
  10. Cerato, A.B.; Lutenegger, A.J. Scale effects of shallow foundation bearing capacity on granular material. J. Geotech. Geoenviron. Eng. 2007, 133, 1192–1202. [Google Scholar] [CrossRef]
  11. Zhu, F.; Clark, J.I.; Phillips, R. Scale effect of strip and circular footings resting on dense sand. J. Geotech. Geoenviron. Eng. 2001, 127, 613–621. [Google Scholar] [CrossRef]
  12. Araujo, D.A.M.; Costa, C.M.L.; Costa, Y.D.J. Dimension effect on plate load test results. In Proceedings of the 2nd World Congress on Civil, Structural, and Environmental Engineering, Barcelona, Spain, 2–4 April 2017; pp. 2–4. [Google Scholar] [CrossRef]
  13. Briaud, J.L.; Gibbens, R. Predicted and measured behavior of five large spread footings on sand. In Proceedings of the Prediction Symposium, ASCE, GSP41, Texas City, TX, USA, 16–18 June 1994. [Google Scholar]
  14. Winkler, E. Die Lehre von der Elastizität und Festigkeit (on Elasticity and Fixity); Dominicius: Prague, Czech Republic, 1867; p. 182. Available online: https://books.google.co.th/books?id=25E5AAAAcAAJ&printsec=frontcover&hl=th&source=gbs_ge_summary_r&cad=0#v=onepage&q&f=false (accessed on 23 October 2024).
  15. Li, W.; Yuan, W.; Tao, Q.; Gong, W.; Dai, G. The influence of pile shaft distributed grouting on the horizontal load response of rectangular piles. KSCE J. Civ. Eng. 2024, 28, 5516–5523. [Google Scholar] [CrossRef]
  16. DL/T 5356-2006; Code for Coarse-Grained Soil Tests for Hydropower and Water Conservancy Engineering. National Development and Reform Commission (NDRC) of the People’s Republic of China, China Electric Power Press: Beijing, China, 2004.
  17. Timoshenko, S.; Goodier, J.N. Theory of Elasticity, 2nd ed.; McGraw-Hill: New York, NY, USA, 1951; pp. 368–372. [Google Scholar]
  18. Fu, Z.; Chen, S.; Liu, S. Discrete element simulations of shallow plate-load tests. Int. J. Geomech. 2016, 16, 04015077. [Google Scholar] [CrossRef]
  19. Sadeghi-Chahardeh, A.; Gumiere, S.J. Application of discrete element method simulation in environmental modeling. In Soil Health and Environmental Sustainability: Application of Geospatial Technology; Springer International Publishing: Cham, Switzerland, 2022; pp. 43–59. [Google Scholar]
  20. Bahrami, M.; Naderi-Boldaji, M.; Ghanbarian, D.; Keller, T. Simulation of soil stress under plate sinkage loading: A comparison of finite element and discrete element methods. Soil Tillage Res. 2022, 223, 105463. [Google Scholar] [CrossRef]
  21. Ping, W.V.; Ge, L. Field verification of laboratory resilient modulus measurements on subgrade soils. Transp. Res. Rec. 1997, 1557, 53–61. [Google Scholar] [CrossRef]
  22. Japan Road Association. Specifications for Highway Bridges, 5th ed.; Japan Road Association: Tokyo, Japan, 2017. [Google Scholar]
  23. Lin, P.S.; Yang, L.W.; Juang, C.H. Subgrade reaction and load-settlement characteristics of gravelly cobble deposits by plate-load tests. Can. Geotech. J. 1998, 35, 801–810. [Google Scholar] [CrossRef]
  24. Bentley Systems. Plaxis 3D Reference Manual (Version 2022). Available online: https://www.plaxis.com/manuals (accessed on 23 October 2024).
  25. Terzaghi, K. Evaluation of coefficients of subgrade reaction. Geotechnique. 1955, 5, 297–326. [Google Scholar] [CrossRef]
  26. Construction Civil. Plate Load Test: Determining the Bearing-Capacity of Soils. Available online: https://www.theconstructioncivil.org/ (accessed on 23 October 2024).
  27. IS 1888: 1982; Method of Load Test on Soils. Bureau of Indian Standards: New Delhi, India, 1982.
  28. Nishioka, H.; Anzai, A.; Koda, M.; Tateyama, M. Estimation of deformation modulus of ground and coefficient of subgrade reaction depending on ground investigation method. RTRI Report. J. Railw. Tech. Res. Inst. 2010, 24, 11–16. [Google Scholar]
  29. Fukushima, H.; Nishimoto, S.; Tomizawa, K. Scale Effect of Spread Foundation Using Various Size Plates Loading Tests. In Proceedings of the 39th Geotechnical Engineering Research Presentation Conference, Niigata, Japan, 7–9 July 2004; pp. 1395–1396. [Google Scholar] [CrossRef]
  30. Yoshida, I.; Yoshinaka, R. A method to estimate modulus of horizontal subgrade reaction for a pile. Soils Found. 1972, 12, 1–17. [Google Scholar] [CrossRef] [PubMed]
Figure 1. Geological profile.
Applsci 15 00760 g001
Figure 2. Horizontal tunnel and the internal rock–soil mass.
Applsci 15 00760 g002aApplsci 15 00760 g002b
Figure 3. Testing apparatus.
Applsci 15 00760 g003
Figure 4. Geological description of PLT sites.
Applsci 15 00760 g004aApplsci 15 00760 g004bApplsci 15 00760 g004c
Figure 5. Average contact stress versus settlement of PLT.
Applsci 15 00760 g005
Figure 6. Boundary conditions of the finite element model.
Applsci 15 00760 g006
Figure 7. Results of finite element analysis and measured data.
Applsci 15 00760 g007
Figure 8. The relationship between average contact stress and settlement. (a) Average contact stress versus settlement. (b) Average contact stress–settlement gradient versus contact stress.
Applsci 15 00760 g008
Figure 9. Relative shear stress contour under 1 MPa average contact stress.
Applsci 15 00760 g009
Figure 10. Relationship between EPLT and diameters.
Applsci 15 00760 g010
Figure 11. Relationship between Ks and diameters.
Applsci 15 00760 g011
Table 1. Soil parameters.
Parametersγ/(kN/m3)w/(%)Es/(MPa)φ/(°)c/(kPa)
Es1Es2Es3
Value245.54338.15579.69886.5826°128
Table 2. Results of the in situ PLT.
ParametersP1-1P1-2P1-3
EPLT/(kN/m2)275.4485.1761.4
Ks/(kN/m3)522.1919.61443.3
Table 3. Average contact stress and corresponding settlement.
Diameter/(m)0.8246810121416
Elastic limit load/(MPa)1
Displacement/(mm)1.04592.42424.85117.31699.513612.412514.952517.455919.8946
Yield limit load/(MPa)3.844.14.14.54.64.64.64.6
Displacement/(mm)9.3720.423940.461057.765584.8532108.2208127.3327140.0661149.7152
Table 4. The relationship between the KS and foundation width B.
ReferenceEquation for KsExponent nComment
Terzaghi [25] K s = K p ( B p B ) n 1Clay
Foundation width B ≤ 3 BP
JRA [22]3/4NAN
Nishioka [28]1Clay
Fukushima [29]1Gravelly crushed stone
Bowles [9]0.5Sandy
Yoshida [30]3/4NAN
Disclaimer/Publisher’s Note: The statements, opinions and data contained in all publications are solely those of the individual author(s) and contributor(s) and not of MDPI and/or the editor(s). MDPI and/or the editor(s) disclaim responsibility for any injury to people or property resulting from any ideas, methods, instructions or products referred to in the content.

