
Exploration of the Mountainous Urban Rail Transit Resilience Under Extreme Rainfalls: A Case Study in Chongqing, China

 ,
, 
Abstract
1. Introduction
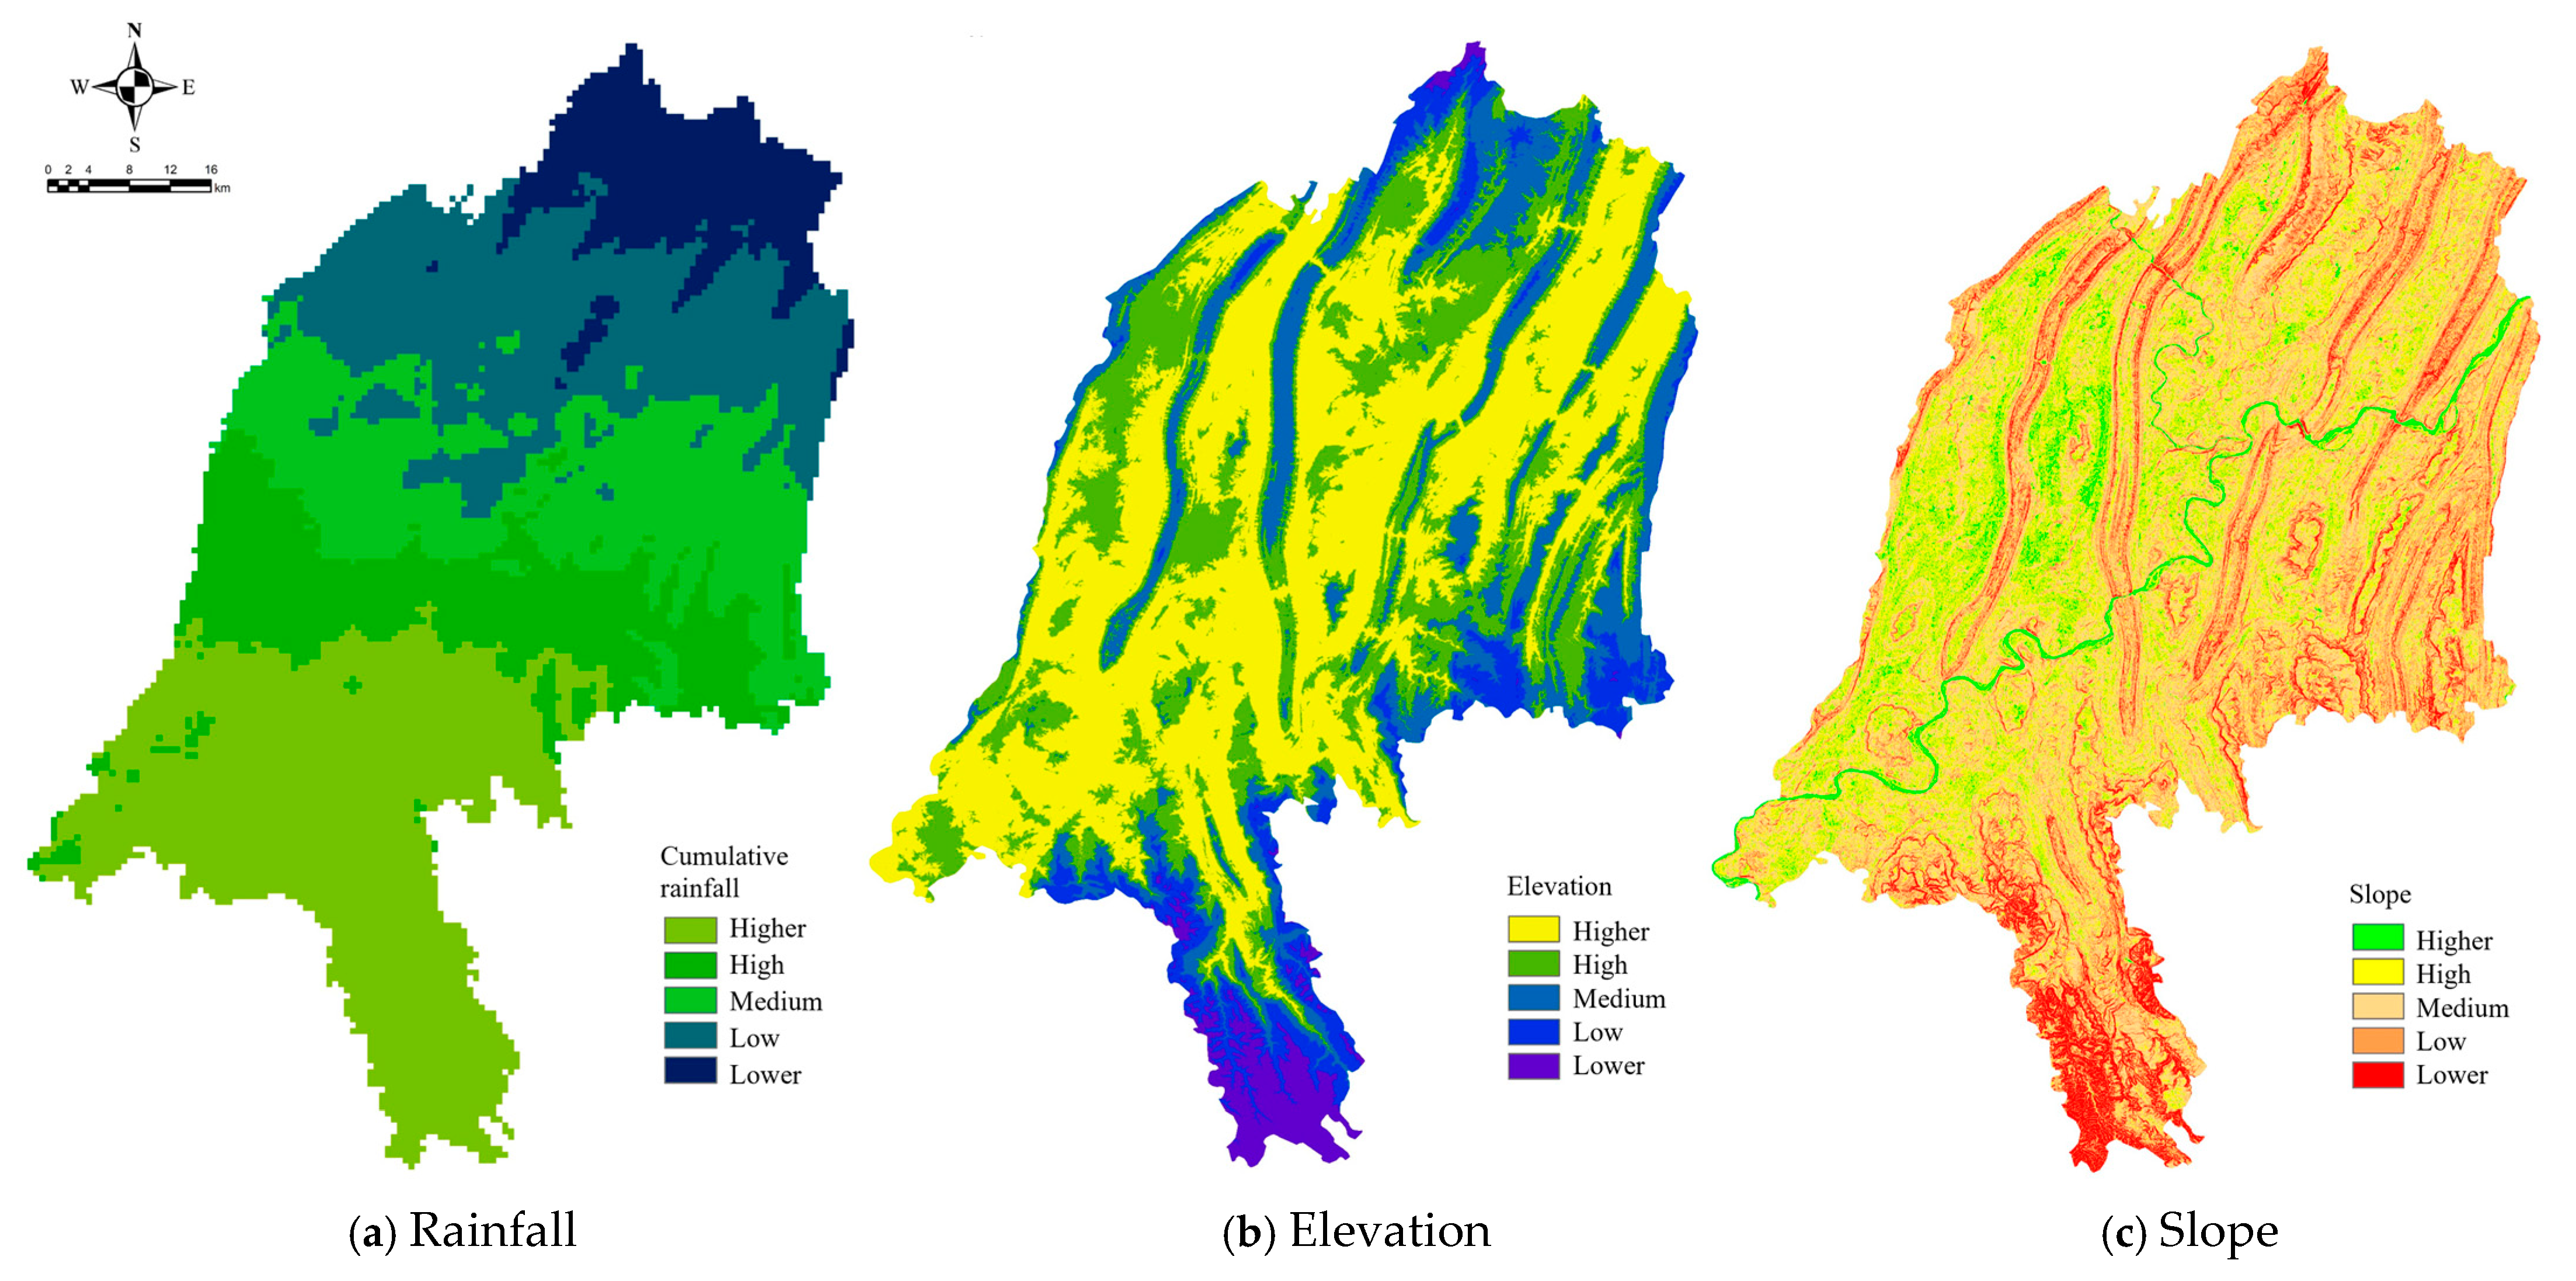
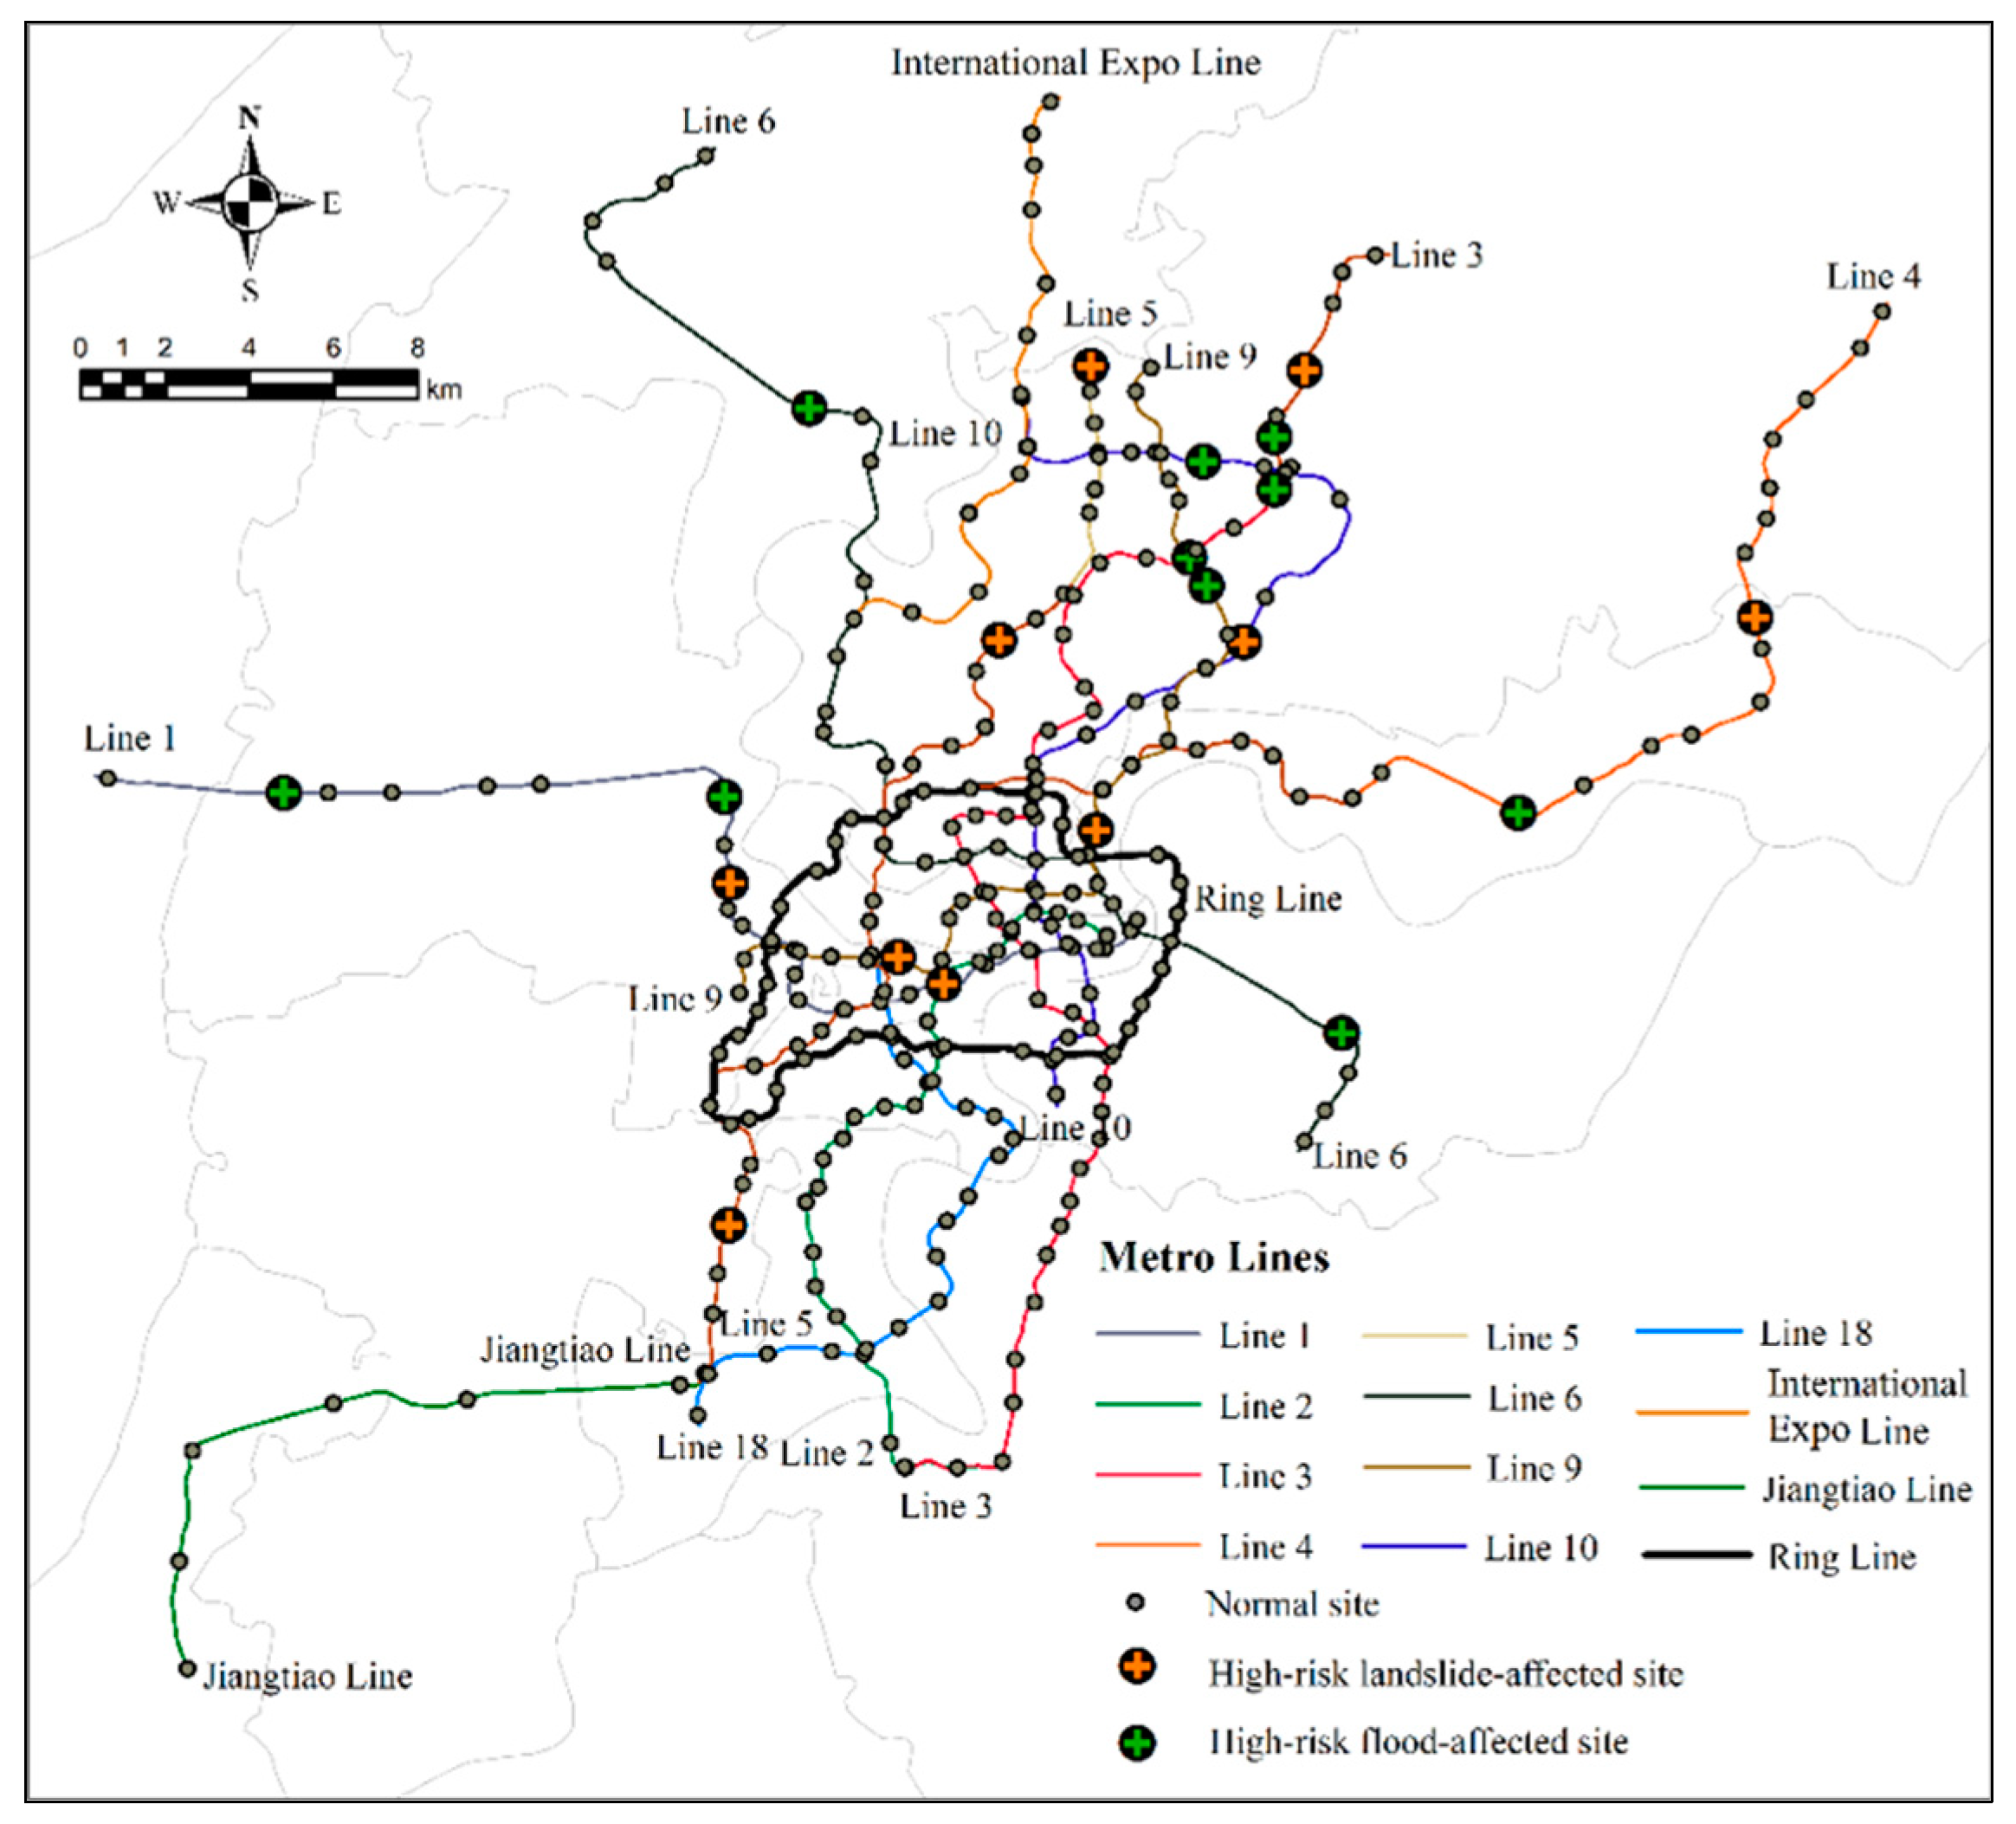
2. Materials
3. Methods
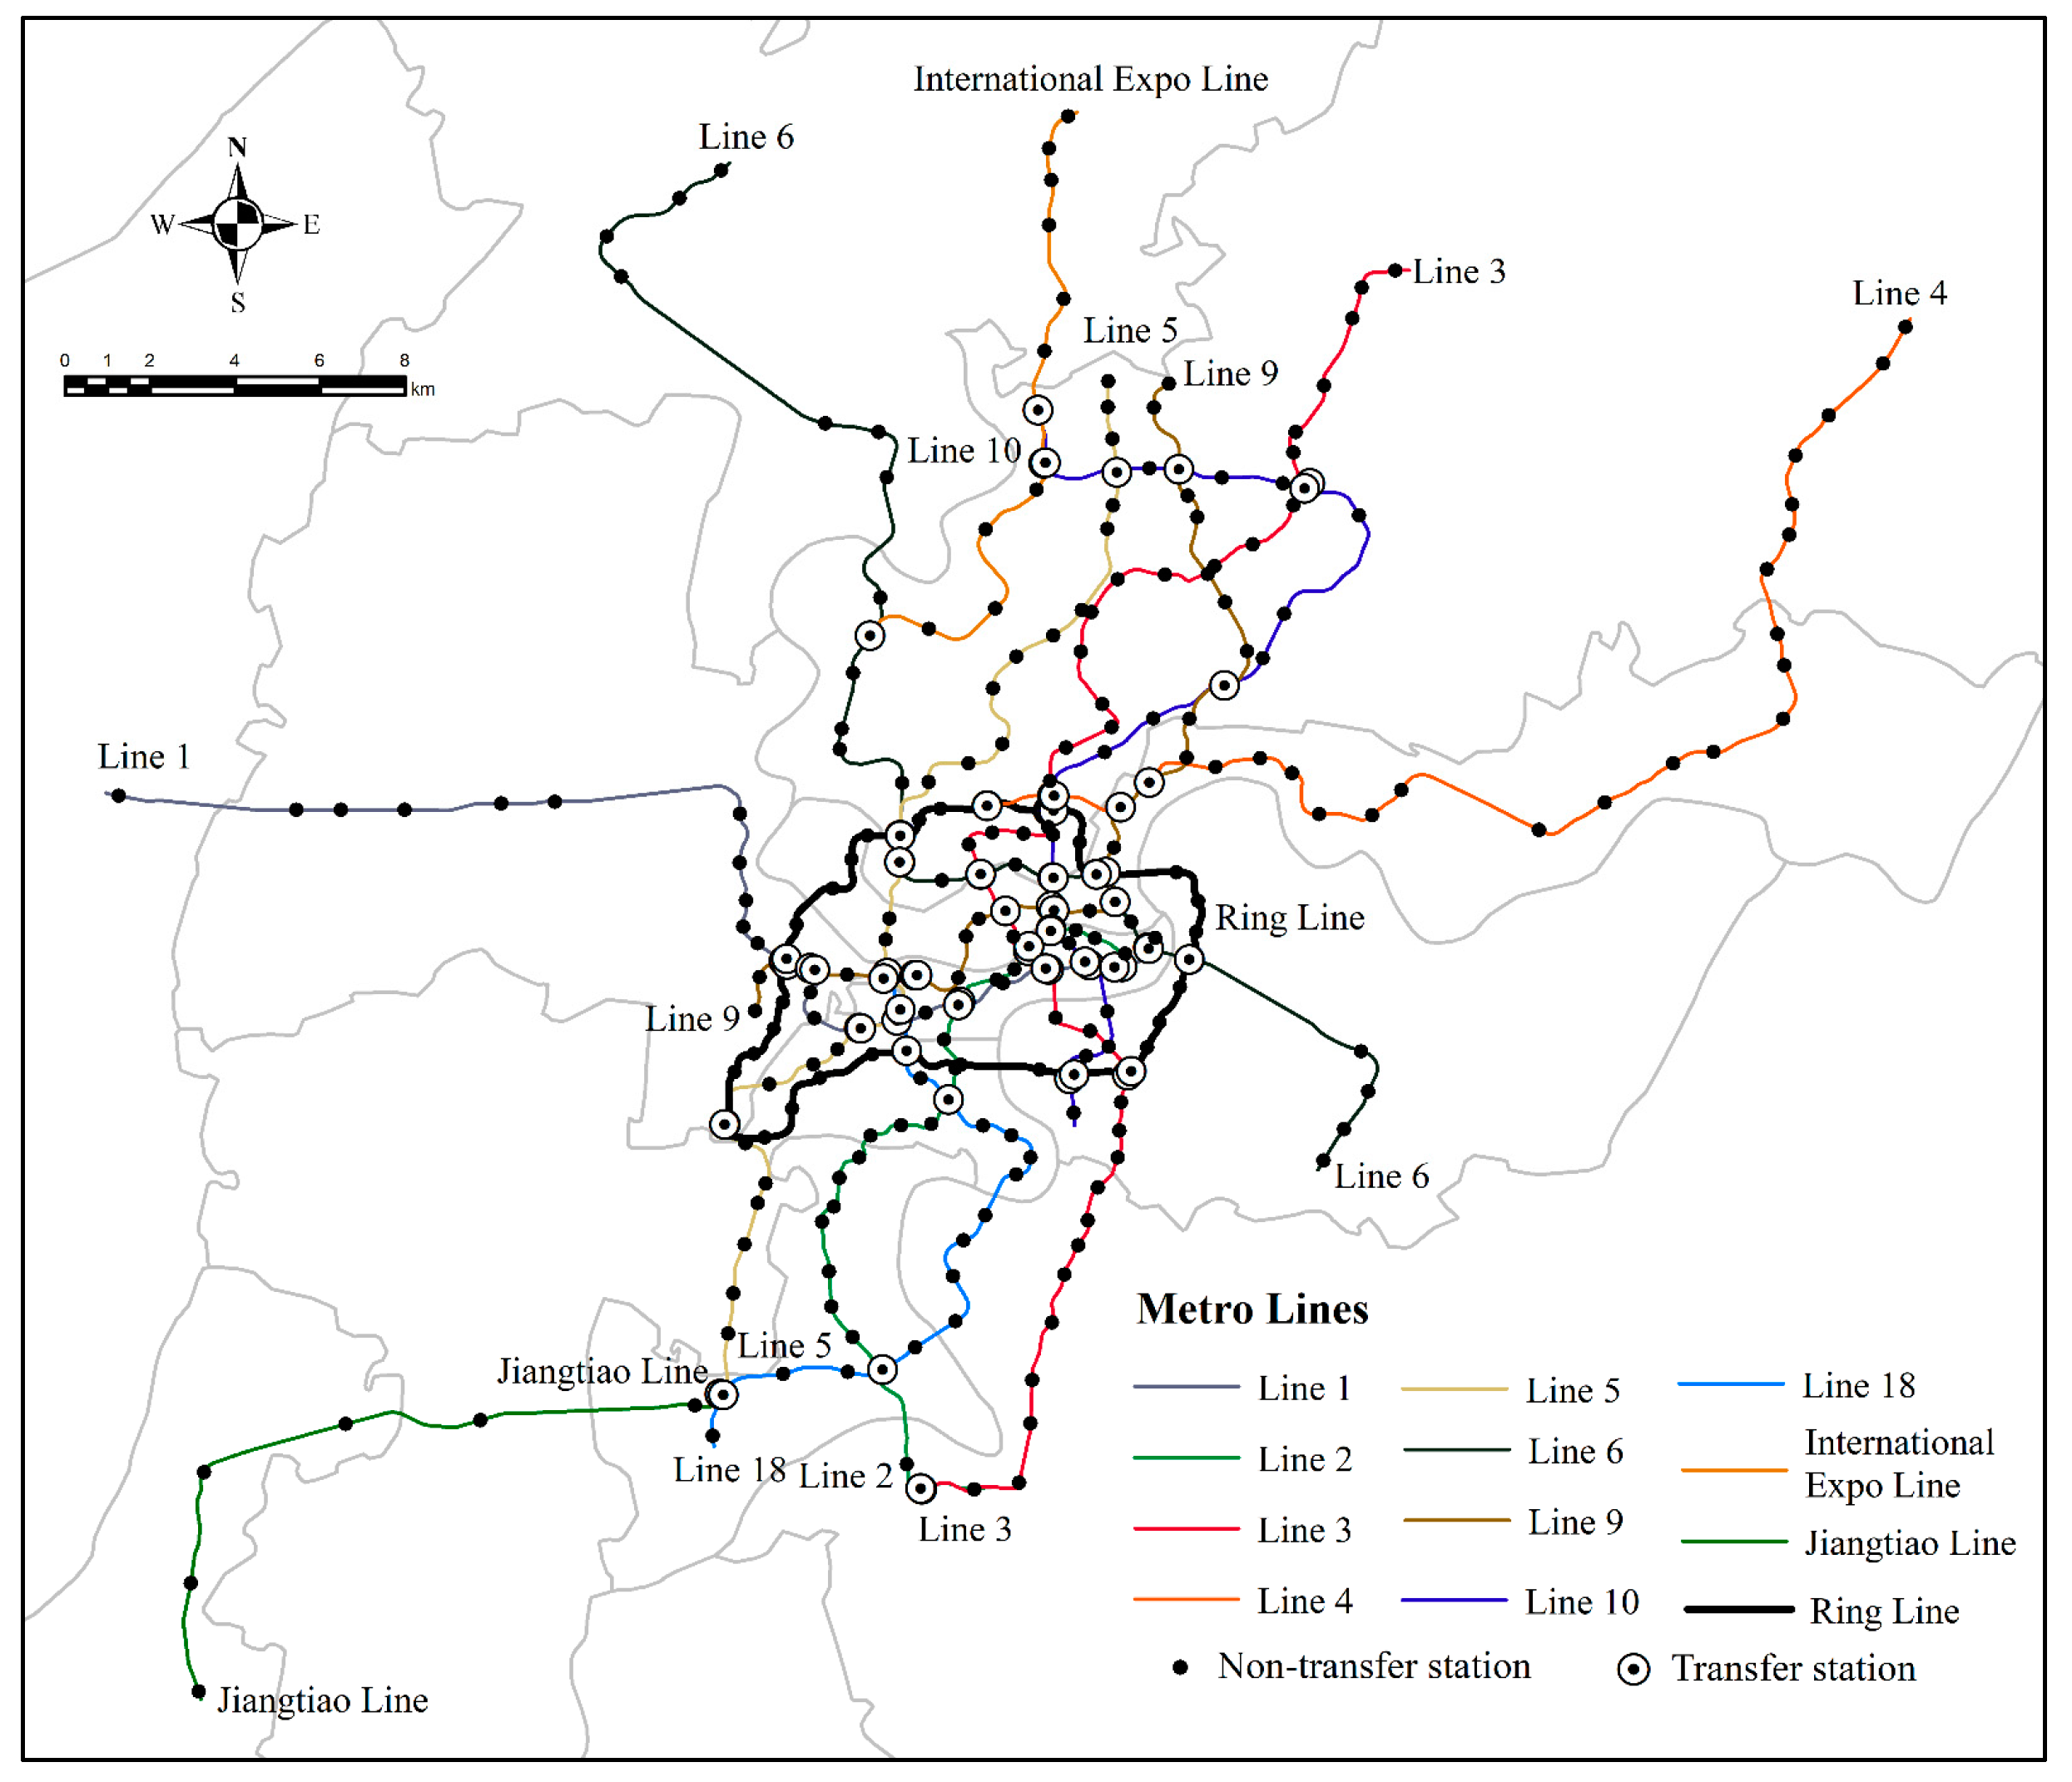
3.1. Network Topology Model
3.2. Network Topological Metrics
3.2.1. Service Efficiency Index
3.2.2. Topological Importance Index
3.3. Resilience Evaluation and Network Repair
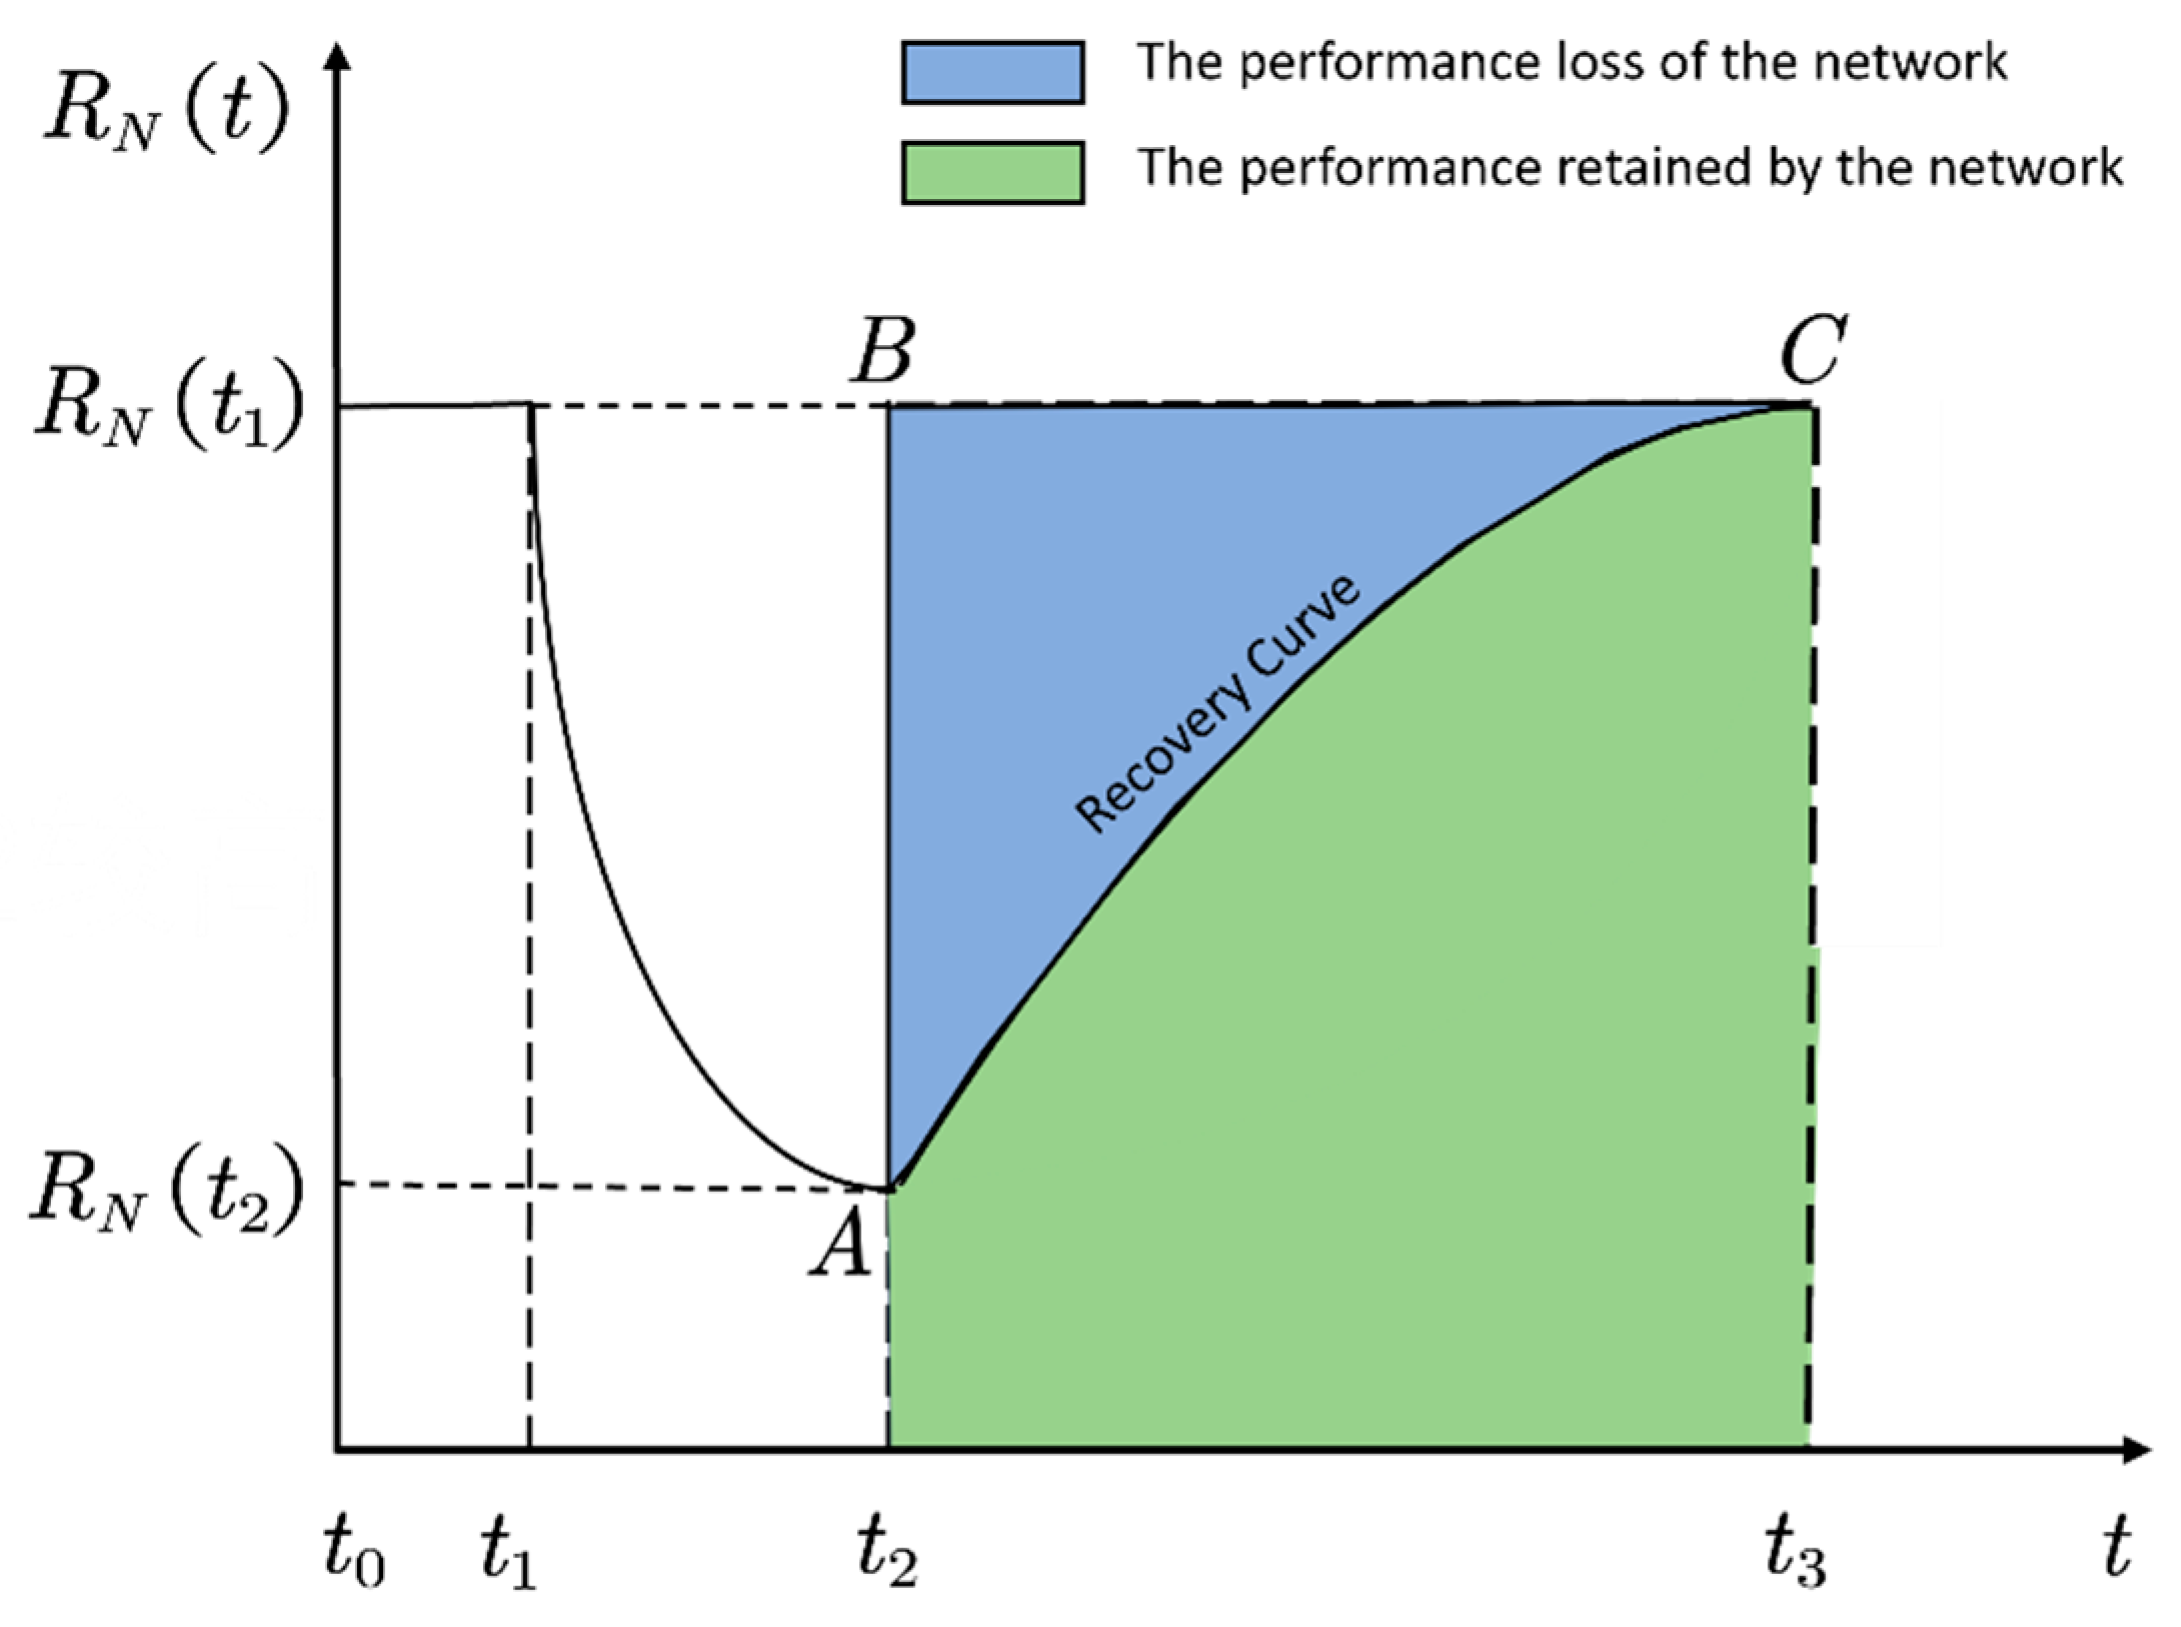
3.3.1. Network Resilience Assessment Model
3.3.2. Repair Strategies
4. Results and Discussion
4.1. Network Topology Analysis
4.2. Topological Analysis of Affected Nodes
4.3. Analysis of Repair Strategies
4.3.1. Resilience Assessment Under Multiple Strategies
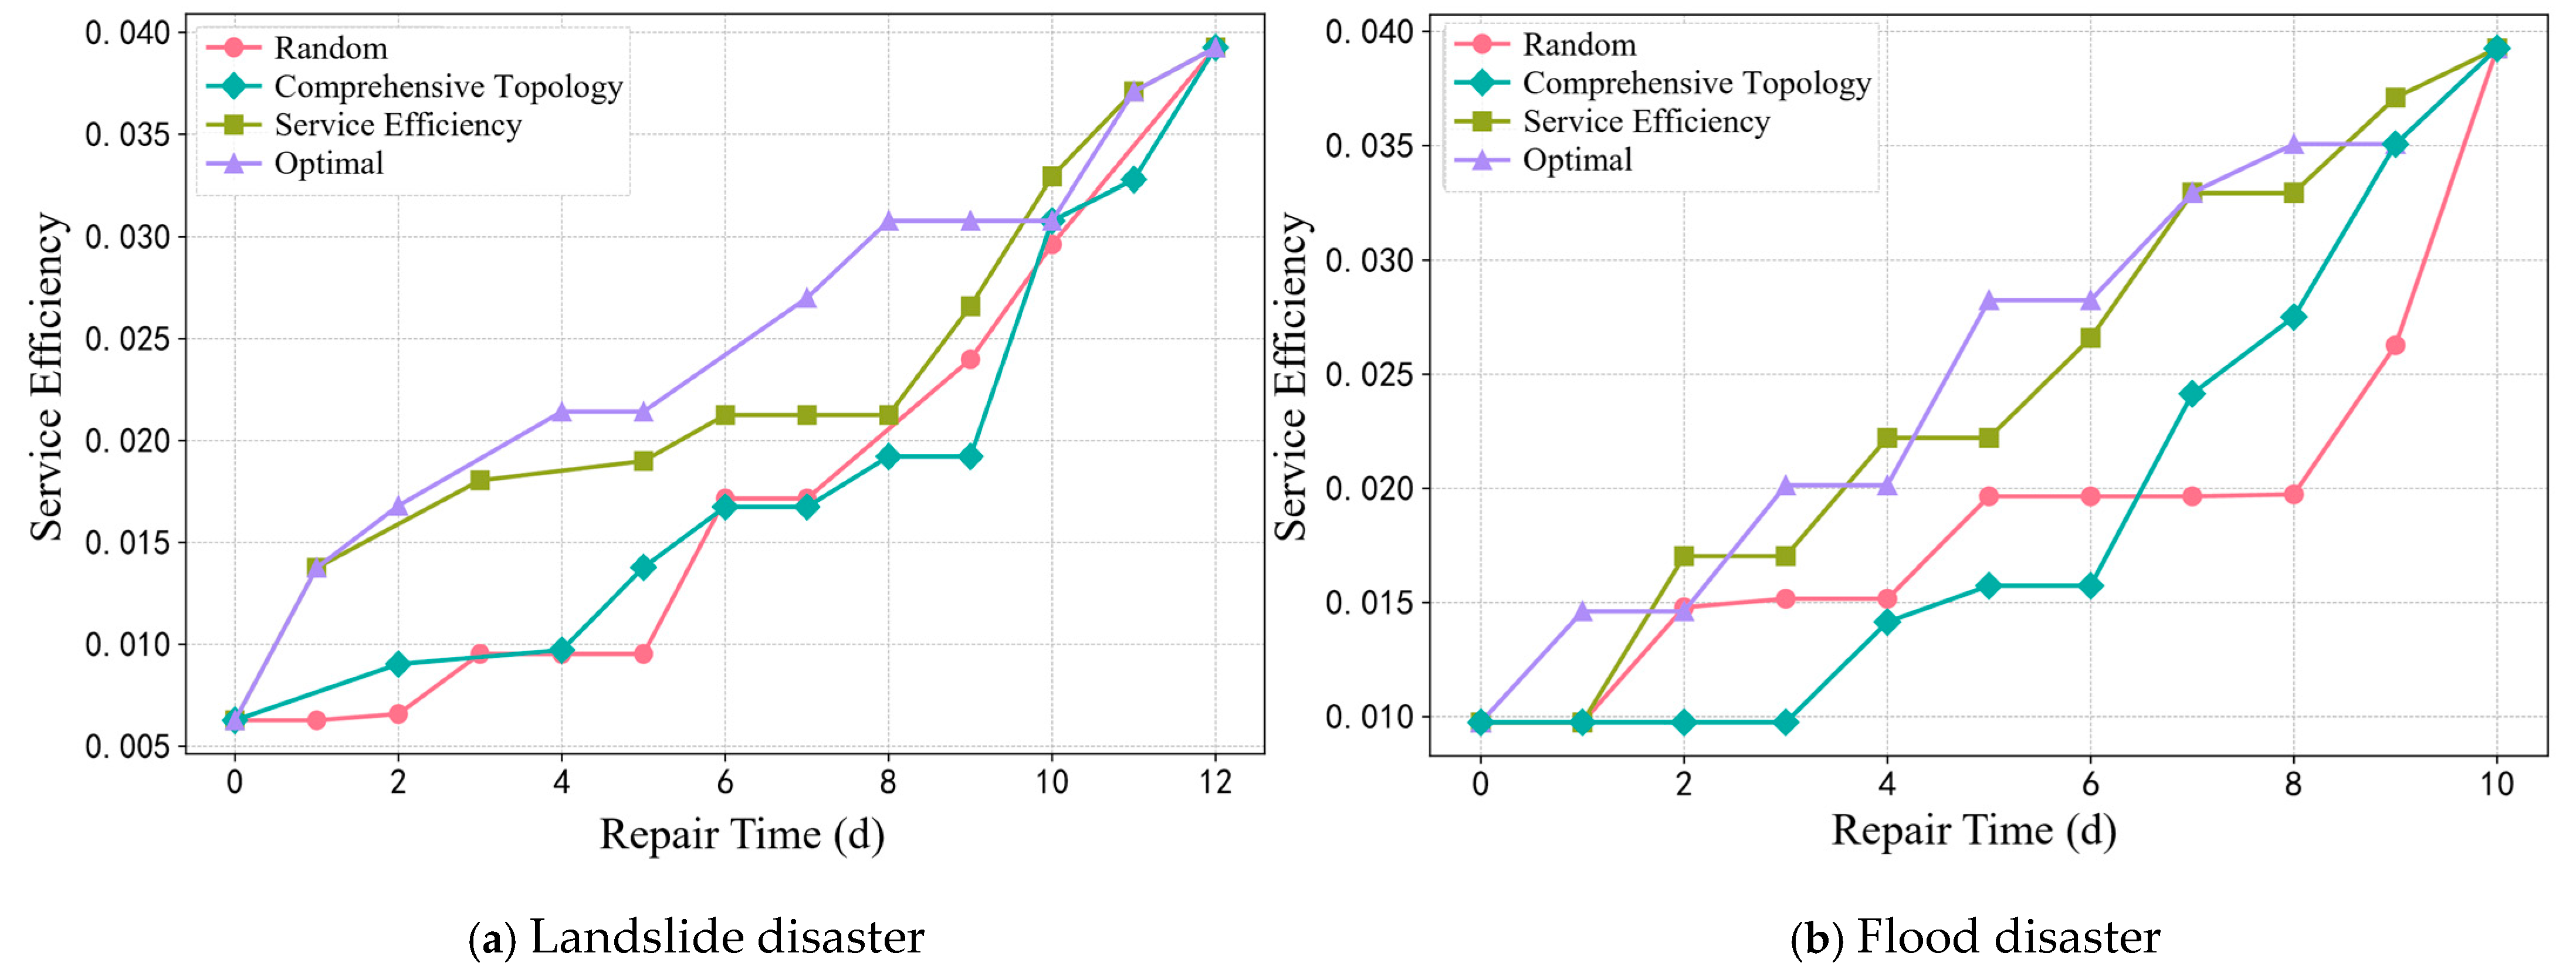
4.3.2. Temporal Analysis of Network Service Efficiency
5. Conclusions
Author Contributions
Funding
Institutional Review Board Statement
Informed Consent Statement
Data Availability Statement
Conflicts of Interest
References
- Han, B.; Yu, Y.; Xi, Z.; Sun, Y.; Lu, F.; Li, S.; Li, Z.; Huang, S.; Hu, J.; Sang, Y.; et al. Statistical Analysis of Urban Rail Transit Operations Worldwide in 2023: A Review. Urban Rapid Rail Transit 2024, 37, 1–9. [Google Scholar]
- Zou, H.; He, F.; Bai, J. Factors Affecting Rainfall-induced Landslides in Huanggang and Its Relation with Precipitation. J. Yangtze River Sci. Res. Inst. 2023, 40, 124–130. [Google Scholar]
- Li, H.; Chen, Z.; Fang, W.; Haijia, W. The statistical risk analysis model of rainfall-induced landslide in large areas. J. Nat. Disast. 2018, 27, 103–111. [Google Scholar]
- Meng, J.; Wu, Y.; Ke, C.; Miao, F. Intelligent prediction and analysis of influencing factors of Quaternary accumulation layer thickness in landslide-prone areas: A case study in the Tiefeng area of Wanzhou District, Chongqing City. Chin. J. Geol. Hazard Control 2023, 34, 2. [Google Scholar]
- Chen, B.; Song, C.; Chen, Y.; Li, Z.; Yu, C.; Liu, H.; Jiang, H.; Liu, Z.; Cai, X.; Nai, Y. Emergency identification and influencing factor analysis of coseismic landslides and building damages induced by the 2023 Ms 6.2 Jishishan (Gansu, China) earthquake. Geomat. Inf. Sci. Wuhan Univ. 2024. [Google Scholar] [CrossRef]
- Wang, D.; Wu, Q.; Zhang, L.; Guo, H.; Ke, X. Research on Assessment and Zoning of Urban Heavy Rainfall Induced Flood Risk: A Case Study of Wuhan. J. Catastrophol. 2023, 38, 107–113. [Google Scholar]
- Wan, F.; Zhang, N.; Zhang, Y. Study on Highway Tunnel Anti-flood Index System. J. Highw. Transp. Res. Dev. 2023, 40, 209–218. [Google Scholar]
- Deng, X.; Zhang, Y.; Tang, Y. Investigation on slope rainfall threshold surface based on failure probablolity. Chin. J. Geol. Hazard Control 2021, 32, 70–75. [Google Scholar]
- Zhou, J.; Tang, M.; Xu, Q.; Wu, H.; Wang, X. Early warning model of rainfall-induced landslide in Chongqing of China based on rainfall threshold. Mt. Res. 2022, 40, 847–858. [Google Scholar]
- Ji, T.; Yao, Y.; Huang, X.; Zhu, Y.; Deng, S.; Yu, S.; Liao, H. Progress and future development trend of urban transportation resilience research. Prog. Geogr. 2023, 42, 1012–1024. [Google Scholar] [CrossRef]
- Patriarca, R.; Bergstrom, J.; Di Gravio, G.; Costantino, F. Resilience engineering: Current status of the research and future challenges. Saf. Sci. 2018, 102, 79–100. [Google Scholar] [CrossRef]
- Testa, A.C.; Furtado, M.N.; Alipour, A. Resilience of Coastal Transportation Networks Faced with Extreme Climatic Events. Transp. Res. Rec. 2015, 2532, 29–36. [Google Scholar] [CrossRef]
- Ganin, A.A.; Kitsak, M.; Marchese, D.; Keisler, J.M.; Seager, T.; Linkov, I. Resilience and efficiency in transportation networks. Sci. Adv. 2017, 3, e1701079. [Google Scholar] [CrossRef] [PubMed]
- Frangopol, D.M.; Soliman, M. Life-cycle of structural systems: Recent achievements and future directions. Struct. Infrastruct. Eng. 2016, 12, 1–20. [Google Scholar] [CrossRef]
- Li, Z.; Jin, C.; Hu, P.; Wang, C. Resilience-based recovery strategy optimization in emergency recovery phase for transportation networks. Syst. Eng. Theory Pract. 2019, 39, 2828–2841. [Google Scholar]
- Zhou, Y.M.; Wang, J.W.; Yang, H. Resilience of Transportation Systems: Concepts and Comprehensive Review. IEEE Trans. Intell. Transp. Syst. 2019, 20, 4262–4276. [Google Scholar] [CrossRef]
- Zhang, D.; Du, F.; Huang, H.; Zhang, F.; Ayyub, B.M.; Beer, M. Resiliency assessment of urban rail transit networks: Shanghai metro as an example. Saf. Sci. 2018, 106, 230–243. [Google Scholar] [CrossRef]
- Zhang, J.; Ren, G.; Ma, J.; Gao, J.; Zhu, X. Decision-making Method of Repair Sequence for Metro Network Based on Resilience Evaluation. J. Transp. Syst. Eng. Inf. Technol. 2020, 20, 14–20. [Google Scholar]
- Minette, D.L.; Medda, F. A new measure of resilience: An application to the London Underground. Transp. Res. Part A-Policy Pract. 2015, 81, 35–46. [Google Scholar] [CrossRef]
- Lu, Q. Modeling network resilience of rail transit under operational incidents. Transp. Res. Part A-Policy Pract. 2018, 117, 227–237. [Google Scholar] [CrossRef]
- Xu, Z.; Chopra, S.S.; Lee, H. Resilient Urban Public Transportation Infrastructure: A Comparison of Five Flow-Weighted Metro Networks in Terms of the Resilience Cycle Framework. IEEE Trans. Intell. Transp. Syst. 2022, 23, 12688–12699. [Google Scholar] [CrossRef]
- Ma, Z.; Yang, X.; Wu, J.; Chen, A.; Wei, Y.; Gao, Z. Measuring the resilience of an urban rail transit network: A multi-dimensional evaluation model. Transp. Policy 2022, 129, 38–50. [Google Scholar] [CrossRef]
- Serdar, M.Z.; Koç, M.; Al-Ghamdi, S.G. Urban Transportation Networks Resilience: Indicators, Disturbances, and Assessment Methods. Sustain. Cities Soc. 2022, 76, 103452. [Google Scholar] [CrossRef]
- Zhang, W.; Wang, N. Resilience-based risk mitigation for road networks. Struct. Saf. 2016, 62, 57–65. [Google Scholar] [CrossRef]
- Perea, F.; Puerto, J. Revisiting a game theoretic framework for the robust railway network design against intentional attacks. Eur. J. Oper. Res. 2013, 226, 286–292. [Google Scholar] [CrossRef]
- Lv, B.; Guan, X.; Gao, Z. Evaluation and optimal recovery strategy of metro network service resilience. J. Transp. Syst. Eng. Inf. Technol. 2021, 21, 198. [Google Scholar]
- Chen, J.; Zuo, T.; Zhu, M.; Peng, Q.; Yin, Y. Repair strategies for a damaged urban rail transit network. J. Saf. Environ. 2022, 22, 316–323. [Google Scholar] [CrossRef]
- Yin, Y.; Chen, J.; Zhu, M.; Liu, J. Repair strategies for failure of urban rail transit stations. J. Southwest Jiaotong Univ. 2020, 55, 865–872. [Google Scholar]
- Yu, Y.; Zhang, H.; Yang, D. Mechanism and Development of Chongqing Railway Culture Path Enabled by the “Two Roads” Spirit. J. Chongqing Jiaotong Univ. Soc. Sci. Ed. 2024, 24, 107. [Google Scholar]
- Chongqing Railway Transportation (Group). Available online: https://www.cqmetro.cn/zjwm/jtjs/jtjj/default_1.shtml (accessed on 20 September 2024).
- Qi, Q.; Meng, Y.; Zhao, X.; Liu, J. Resilience Assessment of an Urban Metro Complex Network: A Case Study of the Zhengzhou Metro. Sustainability 2022, 14, 11555. [Google Scholar] [CrossRef]
- Chang, S.; Zhang, Q.; Wang, W. Centrality analysis of transportation networks. J. Acad. Mil. Transp. 2011, 13, 4. [Google Scholar]
- Wang, Y.; Yang, C. Characteristics of the Complex Network in Shanghai Urban Rail Transit. Urban Mass Transit 2009, 12, 33–36+55. [Google Scholar]
- Wei, Y. Analysis of Rail Transit Topology Based on Passenger FlowWeighting and Its Vulnerability. Master’s Thesis, Chongqing Jiaotong University, Chongqing, China, 2019. [Google Scholar]
- Bonacich, P. Power and centrality: A family of measures. Am. J. Sociol. 1987, 92, 1170–1182. [Google Scholar] [CrossRef]
- Gao, Z.; Wu, J.; Mao, B.; Huang, H. Study on the complexity of traffic networks and related problems. J. Transp. Syst. Eng. Inf. Technol. 2005, 5, 79. [Google Scholar]
- Sun, D.; Guan, S. Measuring vulnerability of urban metro network from line operation perspective. Transp. Res. Part A-Policy Pract. 2016, 94, 348–359. [Google Scholar] [CrossRef]
- Wang, P.; Zhou, M.; Huang, Z. Research on Evolution of Large Passenger Flow in Urban Metro Based on Anomalous Mobility Network. J. Univ. Electron. Sci. Technol. China 2020, 49, 732–738. [Google Scholar]


| Index | Definition | Formula |
|---|---|---|
| Average node degree | The average degree of all nodes in the network (the number of connections each node has with other nodes) | |
| Average clustering coefficient | The average level of clustering among nodes in the network | |
| Average shortest path length | The average shortest path length between any two nodes in the network |
| Index | Definition | Formula |
|---|---|---|
| Degree centrality [32] | It is the total number of the connected edges of a node. | |
| Betweenness centrality [33] | It is the sum of the fractions of all-pairs shortest paths that pass through a node. | |
| Closeness centrality [34] | It is used to measure the ability of a station to affect another node through the network. | |
| Eigenvector centrality [35] | It can identify the different effects of neighbors of a node on it. |
| Degree Centrality | Betweenness Centrality | Closeness Centrality | Eigenvector Centrality |
|---|---|---|---|
| 0.353 | 0.277 | 0.297 | 0.073 |
| Network Parameters | Values |
|---|---|
| Nodes | 256 |
| Edges | 288 |
| Average node degree | 2.25 |
| Average shortest path length | 15.4 |
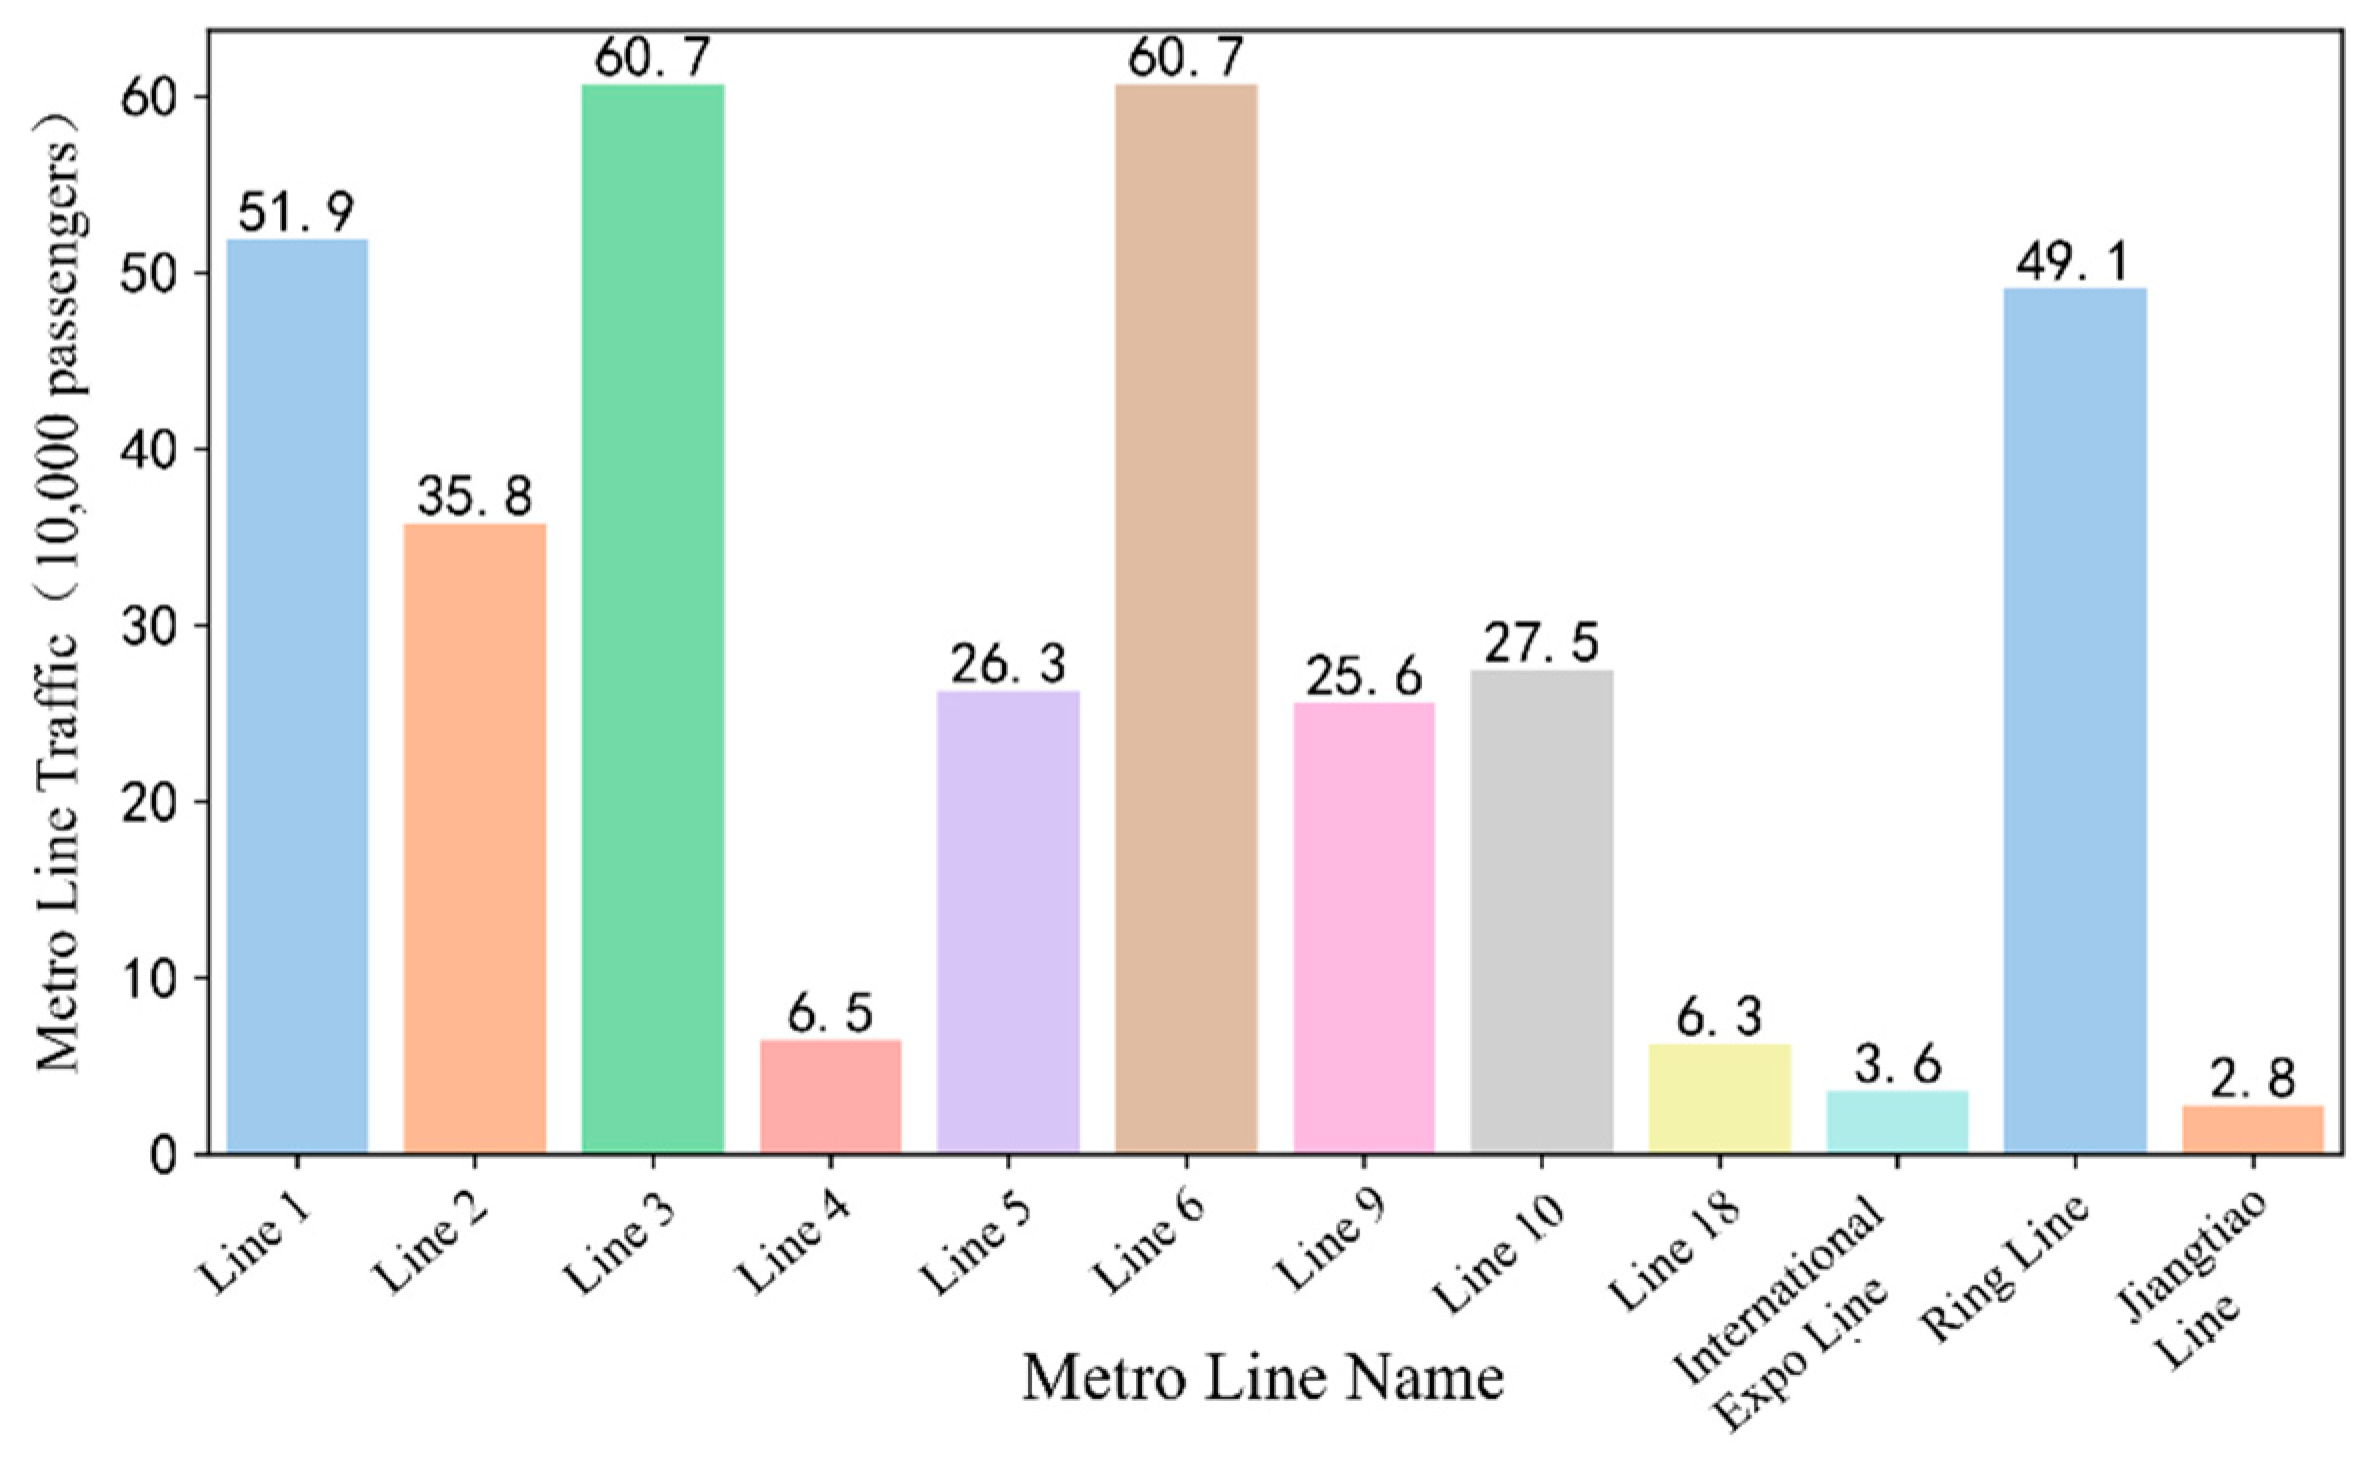
| Disturbance Scenario | Station Name | Line(s) | Line Traffic (10,000 Passeengers) | Topological Importance Index | Service Efficiency Index | Transfer Available |
|---|---|---|---|---|---|---|
| Landslide disaster | Daping | Line 1, Line 2 | 87.7 | 0.564 | 0.245 | 1 |
| Fuhua Road | Line 9, Line 18 | 30.9 | 0.453 | 0.245 | 1 | |
| Gailanxi | Line 9 | 25.6 | 0.422 | 0.165 | 0 | |
| Huanshan Park | Line 10 | 27.5 | 0.324 | 0.16 | 0 | |
| Huxia Street | Line 5 | 26.3 | 0.294 | 0.165 | 0 | |
| Ciqikou | Line 1 | 51.9 | 0.284 | 0.107 | 0 | |
| Zhongliang Mountain | Line 5 | 26.3 | 0.24 | 0.165 | 0 | |
| Gaopu Lake | Line 3 | 60.7 | 0.18 | 0.331 | 0 | |
| Sanbanxi | Line 4 | 6.5 | 0.159 | 0.055 | 0 | |
| Yuegang North Road | Line 5 | 26.3 | 0.0915 | 0.165 | 0 | |
| Flood disaster | Bijin | Line 3 | 60.7 | 0.325 | 0.331 | 0 |
| Baosheng Lake | Line 9 | 25.6 | 0.289 | 0.206 | 0 | |
| Liujiaping | Line 6 | 60.7 | 0.282 | 0.181 | 0 | |
| Xingke Avenue | Line 9 | 25.6 | 0.271 | 0.206 | 0 | |
| Luxi | Line 4 | 6.5 | 0.255 | 0.055 | 0 | |
| Shuangbei | Line 1 | 51.9 | 0.236 | 0.107 | 0 | |
| Shuangfeng Bridge | Line 3 | 60.7 | 0.22 | 0.331 | 0 | |
| Lushan | Line 10 | 27.5 | 0.215 | 0.16 | 0 | |
| Xiangjiagang | Line 6 | 60.7 | 0.208 | 0.181 | 0 | |
| Jiandingpo | Line 1 | 51.9 | 0.141 | 0.107 | 0 |
| Disturbance Scenario | Recovery Strategy | Node Recovery Order | Resilience Value |
|---|---|---|---|
| Landslide disaster | Random Recovery | Yuegang North Road—Sanbanxi—Huanshan Park—Ciqikou—Gailanxi—Gaopu Lake—Huxia Street—Fuhua Road—Zhongliang Mountain—Daping | 0.440 |
| Priority Recovery Based on Topological Importance Index | Daping—Fuhua Road—Gailanxi—Huanshan Park—Huxia Street—Ciqikou—Zhongliang Mountain—Gaopu Lake—Sanbanxi—Yuegang North Road | 0.441 | |
| Priority Recovery Based on Service Efficiency index | Gaopu Lake—Daping—Fuhua Road—Gailanxi—Huxia Street—Zhongliang Mountain—Yuegang North Road—Huanshan Park—Ciqikou—Sanbanxi | 0.570 | |
| Optimal Recovery Based on Genetic Algorithm | Gaopu Lake—Huanshan Park—Daping—Gailanxi—Fuhua Road—Ciqikou—Yuegang North Road—Huxia Street—Zhongliang Mountain—Sanbanxi | 0.628 | |
| Flood disaster | Random Recovery | Shuangbei—Jiandingpo—Luxi—Xiangjiagang—Lushan—Shuangfeng Bridge—Xingke Avenue—Liujiaping—Baosheng Lake—Bijin | 0.470 |
| Priority Recovery Based on Topological Importance Index | Bijin—Baosheng Lake—Liujiaping—Xingke Avenue—Luxi—Shuangbei—Shuangfeng Bridge—Lushan—Xiangjiagang—Jiandingpo | 0.474 | |
| Priority Recovery Based on Service Efficiency index | Bijin—Shuangfeng Bridge—Baosheng Lake—Xingke Avenue—Xiangjiagang—Liujiaping—Lushan—Shuangbei—Jiandingpo—Luxi | 0.617 | |
| Optimal Recovery Based on Genetic Algorithm | Lushan—Shuangfeng Bridge—Bijin—Xiangjiagang—Liujiaping—Xingke Avenue—Baosheng Lake—Luxi—Shuangbei—Jiandingpo | 0.646 |
Disclaimer/Publisher’s Note: The statements, opinions and data contained in all publications are solely those of the individual author(s) and contributor(s) and not of MDPI and/or the editor(s). MDPI and/or the editor(s) disclaim responsibility for any injury to people or property resulting from any ideas, methods, instructions or products referred to in the content. |
© 2025 by the authors. Licensee MDPI, Basel, Switzerland. This article is an open access article distributed under the terms and conditions of the Creative Commons Attribution (CC BY) license (https://creativecommons.org/licenses/by/4.0/).
Share and Cite
Liu, C.; Su, X.; Wu, Z.; Zhang, Y.; Zhou, C.; Wu, X.; Huang, Y. Exploration of the Mountainous Urban Rail Transit Resilience Under Extreme Rainfalls: A Case Study in Chongqing, China. Appl. Sci. 2025, 15, 735. https://doi.org/10.3390/app15020735
Liu C, Su X, Wu Z, Zhang Y, Zhou C, Wu X, Huang Y. Exploration of the Mountainous Urban Rail Transit Resilience Under Extreme Rainfalls: A Case Study in Chongqing, China. Applied Sciences. 2025; 15(2):735. https://doi.org/10.3390/app15020735
Chicago/Turabian StyleLiu, Chenhui, Xue Su, Zhichun Wu, Yingjun Zhang, Cuizhu Zhou, Xiangguo Wu, and Yong Huang. 2025. "Exploration of the Mountainous Urban Rail Transit Resilience Under Extreme Rainfalls: A Case Study in Chongqing, China" Applied Sciences 15, no. 2: 735. https://doi.org/10.3390/app15020735
APA StyleLiu, C., Su, X., Wu, Z., Zhang, Y., Zhou, C., Wu, X., & Huang, Y. (2025). Exploration of the Mountainous Urban Rail Transit Resilience Under Extreme Rainfalls: A Case Study in Chongqing, China. Applied Sciences, 15(2), 735. https://doi.org/10.3390/app15020735