
Optimization of Coating Process Parameters by Analysis of Target Powder Thickness and Regression Modeling


Abstract
1. Introduction
2. Experimental Research
2.1. Preliminary Experiment
2.2. Main Experiment and Analysis of Obtained Results
3. Conclusions
Author Contributions
Funding
Institutional Review Board Statement
Informed Consent Statement
Data Availability Statement
Conflicts of Interest
References
- Montoya, L.F.; Contreras, D.; Jaramillo, A.F.; Carrasco, C.; Fernández, K.; Schwederski, B.; Rojas, D.; Melendrez, M.F. Study of anticorrosive coatings based on high and low molecular weight polyphenols extracted from the Pine radiata bark. Prog. Org. Coat. 2019, 127, 100–109. [Google Scholar] [CrossRef]
- Dariva, C.G.; Galio, A.F. Corrosion Inhibitors—Principles, Mechanisms and Applications. In Developments in Corrosion Protection; Intech: London, UK, 2014; pp. 365–380. [Google Scholar]
- Chen, B.-Q.; Zhang, X.C. Guedes Soares: The effect of general and localized corrosion on the collapse pressure of subsea pipelines. Ocean. Eng. 2022, 247, 110719. [Google Scholar] [CrossRef]
- Shojai, S.; Schaumann, P.; Braun, M.; Ehlers, S. Influence of pitting corrosion on the fatigue strength of offshore steel structures based on 3D surface scans. Int. J. Fatigue 2022, 164, 107128. [Google Scholar] [CrossRef]
- Okyere, M.S. Corrosion Protection for the Oil and Gas Industy: Pipelines, Subsea Equipment, and Structures; CRC Press: Boca Raton, FL, USA; Taylor & Francis Group: Abingdon, UK, 2019; p. 169. [Google Scholar]
- NACE International. International Measures of Prevention, Application, and Economics of Corrosion Technologies Study; NACE International: Houston, TX, USA, 2016; p. 72. [Google Scholar]
- Li, J.; He, J.; Chisholm, B.J.; Stafslien, M.; Battocchi, D.; Bierwagen, G.P. An investigation of the effects of polymer binder compositional variables on the corrosion control of aluminum alloys using magnesium-rich primers. J. Coat. Technol. Res. 2010, 7, 757–764. [Google Scholar] [CrossRef]
- Šolić, T.; Marić, D.; Novoselović, D.; Samardžić, I. Optimization of Parameters for Protection of Materials by Primer Application. Coatings 2022, 12, 413. [Google Scholar] [CrossRef]
- Chang, C.-H.; Huang, T.-C.; Peng, C.-W.; Yeh, T.-C.; Lu, H.-I.; Hung, W.-I.; Weng, C.-J.; Yeh, J.-M. Novel anticorrosion coatings prepared from polyaniline/graphene composites. Carbon 2012, 50, 5044–5051. [Google Scholar] [CrossRef]
- Chang, K.-C.; Ji, W.-F.; Lai, M.-C.; Hsiao, Y.-R.; Hsu, C.-H.; Chuang, T.-L.; Wei, Y.; Yeh, J.-M.; Liu, W.-R. Synergistic effects of hydrophobicity and gas barrier properties on the anticorrosion property of PMMA nanocomposite coatings embedded with graphene nanosheets. Polym. Chem. 2013, 5, 1049–1056. [Google Scholar] [CrossRef]
- Ding, J.; Rahman, O.U.; Peng, W.; Dou, H.; Yu, H. A novel hydroxyl epoxy phosphate monomer enhancing the anticorrosive performance of waterborne graphene/epoxy coatings. Appl. Surf. Sci. 2018, 427, 981–991. [Google Scholar] [CrossRef]
- Javidparvar, A.A.; Ramezanzadeh, B.; Ghasemi, E. Effect of Various Spinel Ferrite Nanopigments Modified by Amino Propyl Trimethoxy Silane on the Corrosion Inhibition Properties of the Epoxy Nanocomposites. Corrosion 2016, 72, 761–774. [Google Scholar] [CrossRef] [PubMed]
- Yang, W.; Xu, D.; Wang, J.; Yao, X.; Chen, J. Microstructure and corrosion resistance of micro arc oxidation plus electrostatic powder spraying composite coating on magnesium alloy. Corros. Sci. 2018, 136, 174–179. [Google Scholar] [CrossRef]
- Zhang, T.; Zhang, T.; He, Y.; Wang, Y.; Bi, Y. Corrosion and aging of organic aviation coatings: A review. J. Aeronaut. 2023, 36, 1–35. [Google Scholar] [CrossRef]
- Zhnag, J.; Kong, G.; Li, S.; Le, Y.; Che, C.; Zhang, S.; Lai, D.; Liao, X. Graphene-reinforced epoxy powder coating to achieve high performance wear and corrosion resistance. J. Mater. Res. Technol. 2022, 20, 4148–4160. [Google Scholar] [CrossRef]
- Barletta, M.; Gisario, A.; Rubino, G. Scratch response of high-performance thermoset and thermoplastic powders deposites by the electrostatic spray and ‘hot dipping’ fluidised bed coating methods: The role of the contact condition. Surf. Coat. Technol. 2011, 205, 5186–5198. [Google Scholar] [CrossRef]
- Mariappan, T.; Kamble, A.; Naik, S.M. An investigation of primer adhesion and topcoat compatibility on the waterborne intumescent coating to structural steel. Prog. Org. Coat. 2019, 131, 371–377. [Google Scholar] [CrossRef]
- Puspitasari, W.C.; Ahmad, F.; Ullah, S.; Hussain, P.; Megat-Yusoff, P.S.M.; Masset, P.J. The study of adhesion between steel substrate, primer, and char of intumescent fire retardant coating. Prog. Org. Coat. 2019, 127, 181–193. [Google Scholar] [CrossRef]
- Esih, I. Osnove Površinske Zaštite; Fakultet Strojarstva i Brodogradnje: Zagreb, Hrvatska, 2010. [Google Scholar]
- Juraga, I.; Alar, V.; Stojanović, I. Korozija i Zaštita Premazima; Fakultet Strojarstva i Brodogradnje: Zagreb, Hrvatska, 2014; p. 186. [Google Scholar]
- Ye, Q.; Domnick, J. On the simulation of space charge in electrostatic powder coating with a corona spray gun. Powder Technol. 2003, 135, 250–260. [Google Scholar] [CrossRef]
- Montgomery, D.C. Design and Analysis of Experiments, 9th ed.; John and Wiley and Sons: Hoboken, NJ, USA, 2017. [Google Scholar]


| Parameters | Galvanized Steel | Carbon Steel |
|---|---|---|
| U = 20 kV and I = 20 µA | PL1 | UC1 |
| U = 20 kV and I = 100 µA | PL2 | UC2 |
| U = 100 kV and I = 20 µA | PL3 | UC3 |
| U = 100 kV and I = 100 µA | PL4 | UC4 |
| Test Sample | Thickness of the Applied Coating/µm |
|---|---|
| PL1 | 26 |
| PL2 | 14 |
| PL3 | 62 |
| PL4 | 69 |
| UC1 | 23 |
| UC2 | 21 |
| UC3 | 43 |
| UC4 | 78 |
| Coded Values | Factor 1—Electric Current/µA (Numerical) | Factor 2—Voltage/kV (Numerical) | Factor 3—Material (Categorical) | ||
|---|---|---|---|---|---|
| –1.414 | 20 | 20 | carbon steel | galvanized steel | aluminum |
| –1 | 31.7157 | 31.7157 | |||
| 0 | 60 | 60 | |||
| 1 | 88.2843 | 88.2843 | |||
| 1.414 | 100 | 100 | |||
| Test Sample | Experiment Run | Current/µA | Voltage/kV | Material | Coating Thickness/µm |
|---|---|---|---|---|---|
| 1 | 17 | 31.7157 | 31.7157 | Carbon steel | 36.92 |
| 2 | 22 | 88.2843 | 31.7157 | Carbon steel | 41.82 |
| 3 | 14 | 31.7157 | 88.2843 | Carbon steel | 63.08 |
| 4 | 25 | 88.2843 | 88.2843 | Carbon steel | 77.86 |
| 5 | 5 | 20 | 60 | Carbon steel | 52 |
| 6 | 21 | 100 | 60 | Carbon steel | 68.9 |
| 7 | 30 | 60 | 20 | Carbon steel | 35.4 |
| 8 | 1 | 60 | 100 | Carbon steel | 65.6 |
| 9 | 10 | 60 | 60 | Carbon steel | 72.14 |
| 10 | 3 | 60 | 60 | Carbon steel | 69.94 |
| 11 | 27 | 60 | 60 | Carbon steel | 71.32 |
| 12 | 11 | 31.7157 | 31.7157 | Galvanized steel | 23.5 |
| 13 | 9 | 88.2843 | 31.7157 | Galvanized steel | 28.28 |
| 14 | 4 | 31.7157 | 88.2843 | Galvanized steel | 50.88 |
| 15 | 29 | 88.2843 | 88.2843 | Galvanized steel | 58.4 |
| 16 | 26 | 20 | 60 | Galvanized steel | 48.2 |
| 17 | 12 | 100 | 60 | Galvanized steel | 49.7 |
| 18 | 18 | 60 | 20 | Galvanized steel | 26.3 |
| 19 | 23 | 60 | 100 | Galvanized steel | 55 |
| 20 | 15 | 60 | 60 | Galvanized steel | 52.58 |
| 21 | 28 | 60 | 60 | Galvanized steel | 47.48 |
| 22 | 7 | 60 | 60 | Galvanized steel | 52.4 |
| 23 | 33 | 31.7157 | 31.7157 | Aluminum | 27.4 |
| 24 | 20 | 88.2843 | 31.7157 | Aluminum | 38.46 |
| 25 | 2 | 31.7157 | 88.2843 | Aluminum | 59 |
| 26 | 24 | 88.2843 | 88.2843 | Aluminum | 68.72 |
| 27 | 6 | 20 | 60 | Aluminum | 49.3 |
| 28 | 13 | 100 | 60 | Aluminum | 55.4 |
| 29 | 32 | 60 | 20 | Aluminum | 24.2 |
| 30 | 31 | 60 | 100 | Aluminum | 57.6 |
| 31 | 16 | 60 | 60 | Aluminum | 63.34 |
| 32 | 8 | 60 | 60 | Aluminum | 57.08 |
| 33 | 19 | 60 | 60 | Aluminum | 62.98 |
| Model | Mean Square Deviation, p-Value | Deviation from the Model, p-Value | Coefficient of Determination | Adjusted Coefficient of Determination | Predicted Coefficient of Determination |
|---|---|---|---|---|---|
| Linear | <0.0001 | 0.0039 | 0.7632 | 0.7294 | 0.6826 |
| 2FI | 0.9600 | 0.0023 | 0.7730 | 0.6842 | 0.5764 |
| Quadratic | <0.0001 | 0.1275 | 0.9557 | 0.9325 | 0.8823 |
| Cubic | 0.0376 | 0.3634 | 0.9845 | 0.9618 | 0.8748 |
| Source | Sum of Squares | Number of Degrees of Freedom | Mean Square Deviation | Value of the F-Test | p-Value |
|---|---|---|---|---|---|
| Model | 6987.22 | 11 | 635.20 | 41.20 | <0.0001 |
| A—Current | 318.34 | 1 | 318.34 | 20.65 | 0.0002 |
| B—Voltage | 4058.39 | 1 | 4058.39 | 263.21 | <0.0001 |
| C—Material | 1203.26 | 2 | 601.63 | 39.02 | <0.0001 |
| AB | 10.60 | 1 | 10.60 | 0.6877 | 0.4163 |
| AC | 53.15 | 2 | 26.58 | 1.72 | 0.2027 |
| BC | 7.72 | 2 | 3.86 | 0.2502 | 0.7809 |
| A2 | 248.87 | 1 | 248.87 | 16.14 | 0.0006 |
| B2 | 1306.79 | 1 | 1306.79 | 84.75 | <0.0001 |
| Residual | 323.79 | 21 | 15.42 | ||
| Lack of Fit | 279.86 | 15 | 18.66 | 2.55 | 0.1275 |
| Pure Error | 43.93 | 6 | 7.32 | ||
| Cor Total | 7311.01 | 32 |
| Factor | Coefficient Estimate | Number of Degrees of Freedom | Standard Error | 95% CI Low | 95% CI High |
|---|---|---|---|---|---|
| Independent variable | 61.03 | 1 | 1.31 | 58.31 | 63.75 |
| A—Current | 3.64 | 1 | 0.8015 | 1,98 | 5.31 |
| B—Voltage | 13.00 | 1 | 0.8015 | 11.34 | 14.67 |
| C [1] | 7.69 | 1 | 0.9667 | 5.68 | 9.70 |
| C [2] | −7.06 | 1 | 0.9667 | −9.07 | −5.05 |
| AB | 0.9400 | 1 | 1.13 | −1.42 | 3.30 |
| AC [1] | 1.81 | 1 | 1.13 | −0.5518 | 4.16 |
| AC [2] | −1.84 | 1 | 1.13 | −4.20 | 0.5180 |
| BC [1] | 0.1098 | 1 | 1.13 | −2.25 | 2.47 |
| BC [2] | −0.7428 | 1 | 1.13 | −3.10 | 1.61 |
| A2 | −3.83 | 1 | 0.9540 | −5.82 | −1.85 |
| B2 | −8.78 | 1 | 0.9540 | −10.77 | −6.80 |
| Input Parameter | Goal | Lower Limit | Upper Limit |
|---|---|---|---|
| Current/µA | in range | 20 | 100 |
| Voltage/kV | in range | 20 | 100 |
| Coating thickness/µm | ≈60 µm | ||
| Current/µA | Voltage/kV | Material | Coating Thickness/µm |
|---|---|---|---|
| 74.813 | 43.984 | carbon steel | 60 |
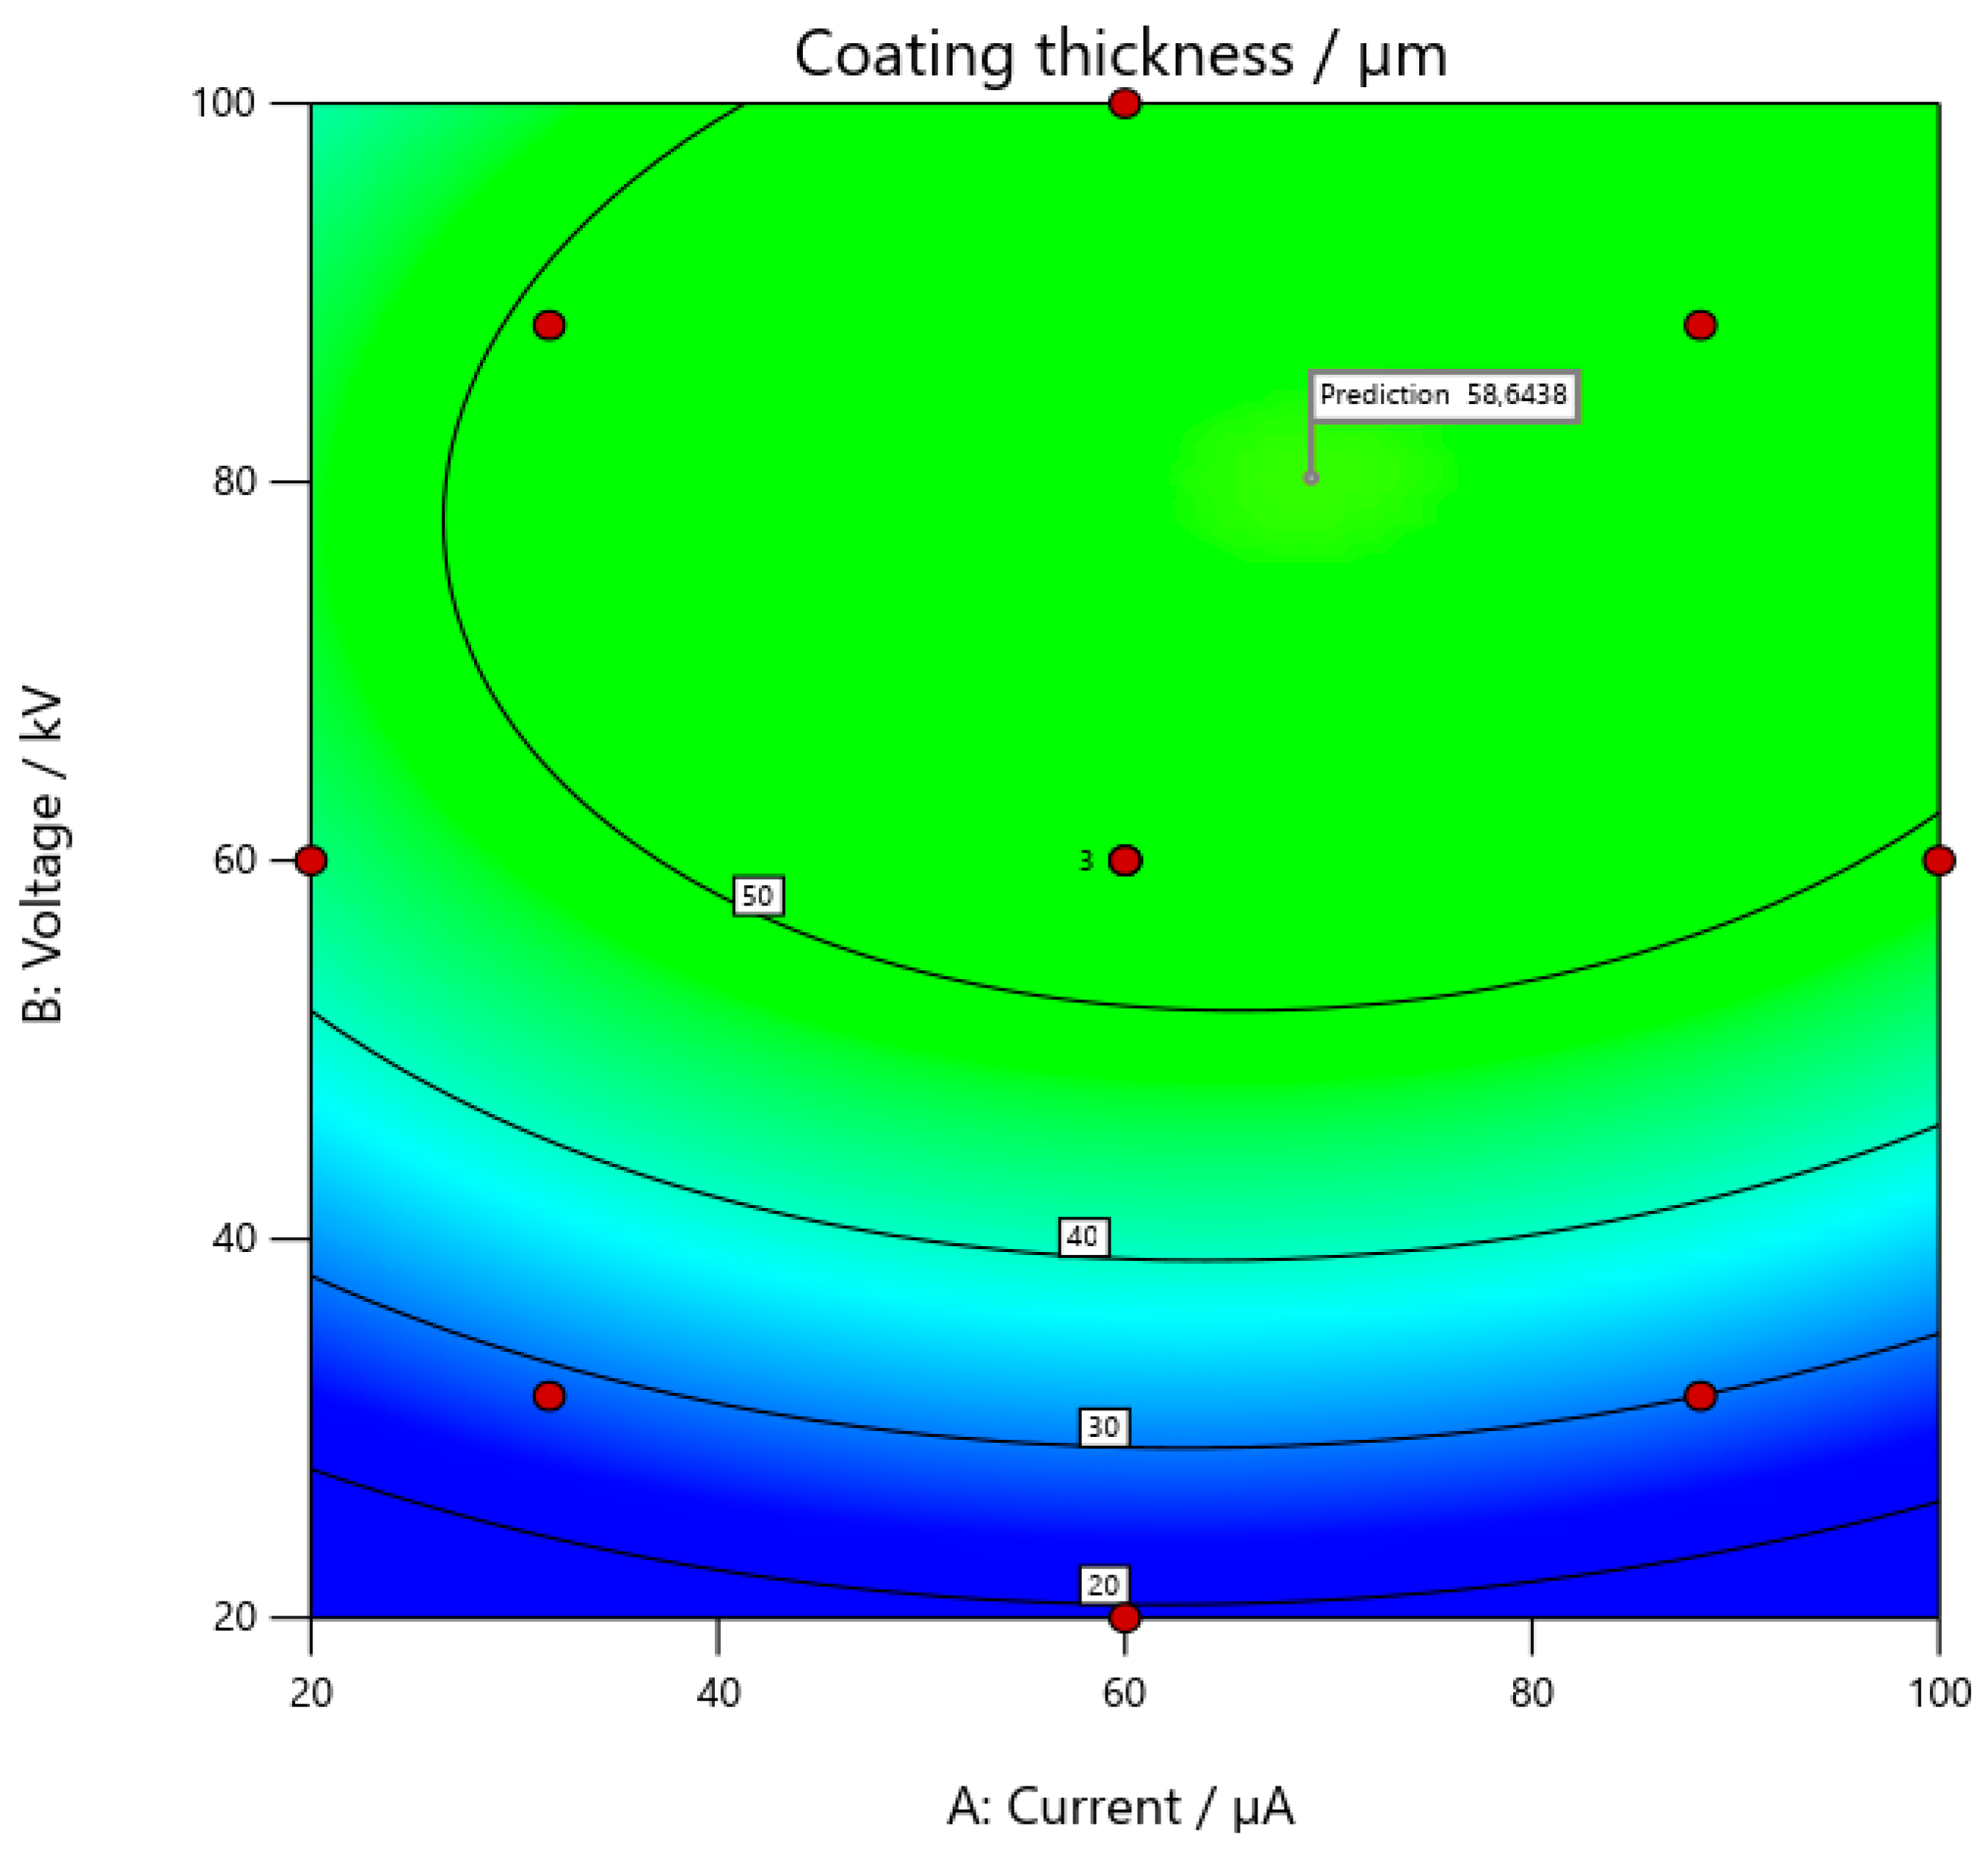
| 69.150 | 80.236 | galvanized steel | 58.644 |
| 98.405 | 63.420 | aluminum | 60 |
Disclaimer/Publisher’s Note: The statements, opinions and data contained in all publications are solely those of the individual author(s) and contributor(s) and not of MDPI and/or the editor(s). MDPI and/or the editor(s) disclaim responsibility for any injury to people or property resulting from any ideas, methods, instructions or products referred to in the content. |
© 2025 by the authors. Licensee MDPI, Basel, Switzerland. This article is an open access article distributed under the terms and conditions of the Creative Commons Attribution (CC BY) license (https://creativecommons.org/licenses/by/4.0/).
Share and Cite
Šolić, T.; Marić, D.; Peko, I.; Samardžić, I. Optimization of Coating Process Parameters by Analysis of Target Powder Thickness and Regression Modeling. Appl. Sci. 2025, 15, 673. https://doi.org/10.3390/app15020673
Šolić T, Marić D, Peko I, Samardžić I. Optimization of Coating Process Parameters by Analysis of Target Powder Thickness and Regression Modeling. Applied Sciences. 2025; 15(2):673. https://doi.org/10.3390/app15020673
Chicago/Turabian StyleŠolić, Tomislav, Dejan Marić, Ivan Peko, and Ivan Samardžić. 2025. "Optimization of Coating Process Parameters by Analysis of Target Powder Thickness and Regression Modeling" Applied Sciences 15, no. 2: 673. https://doi.org/10.3390/app15020673
APA StyleŠolić, T., Marić, D., Peko, I., & Samardžić, I. (2025). Optimization of Coating Process Parameters by Analysis of Target Powder Thickness and Regression Modeling. Applied Sciences, 15(2), 673. https://doi.org/10.3390/app15020673