
Review and Improvement of Runway Friction and Aircraft Skid Resistance Regulation, Assessment and Management


Abstract
1. Introduction
2. Friction Phenomenon
2.1. Rolling Resistance
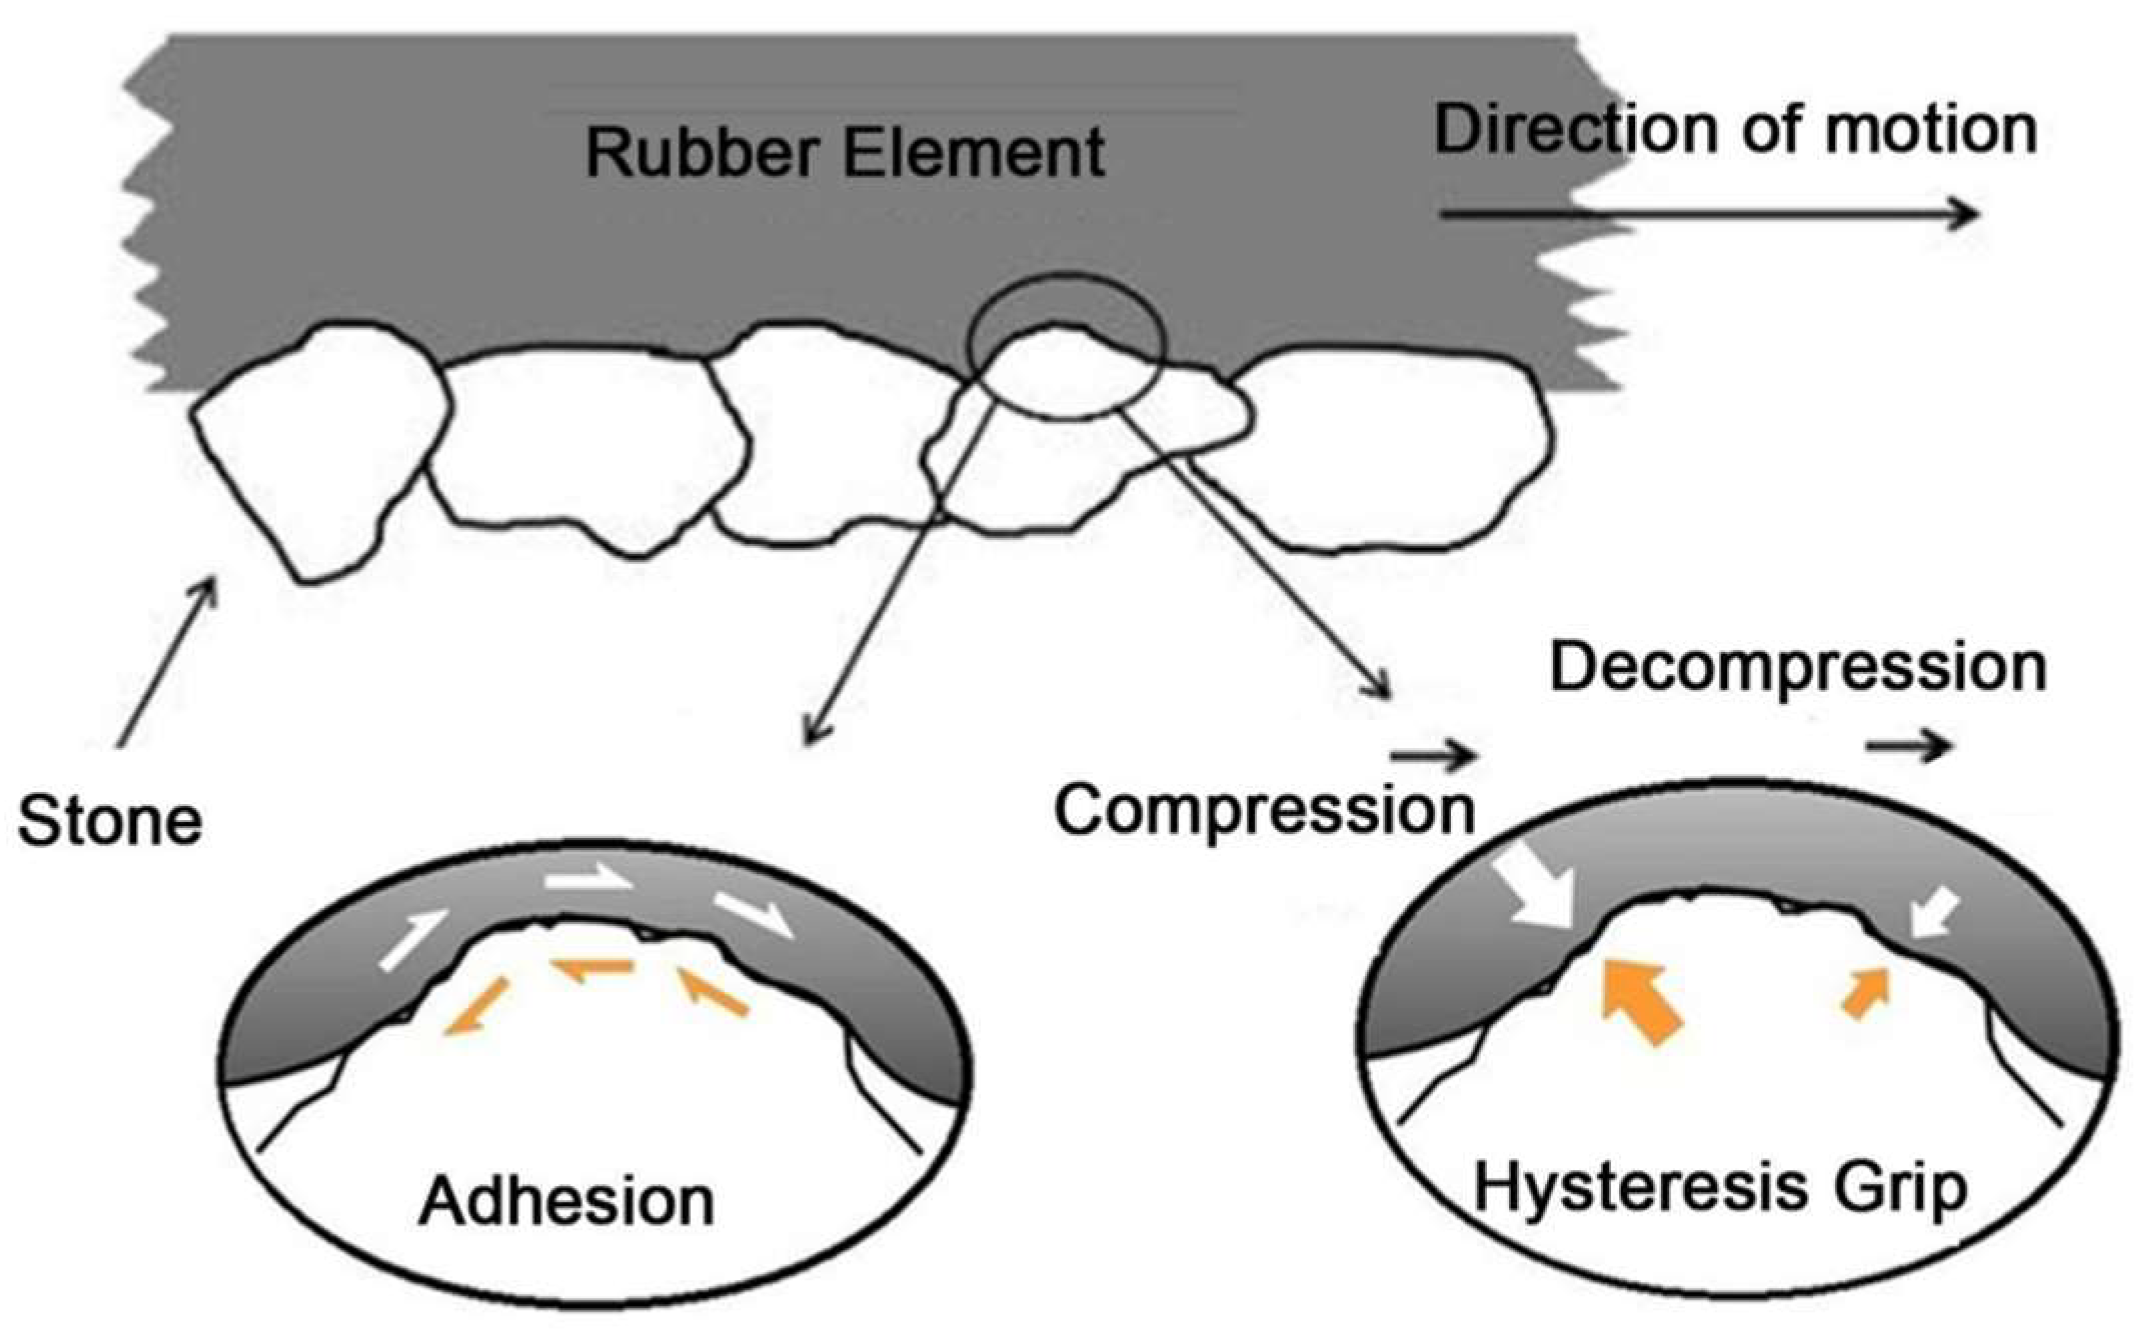
2.2. Sliding Friction
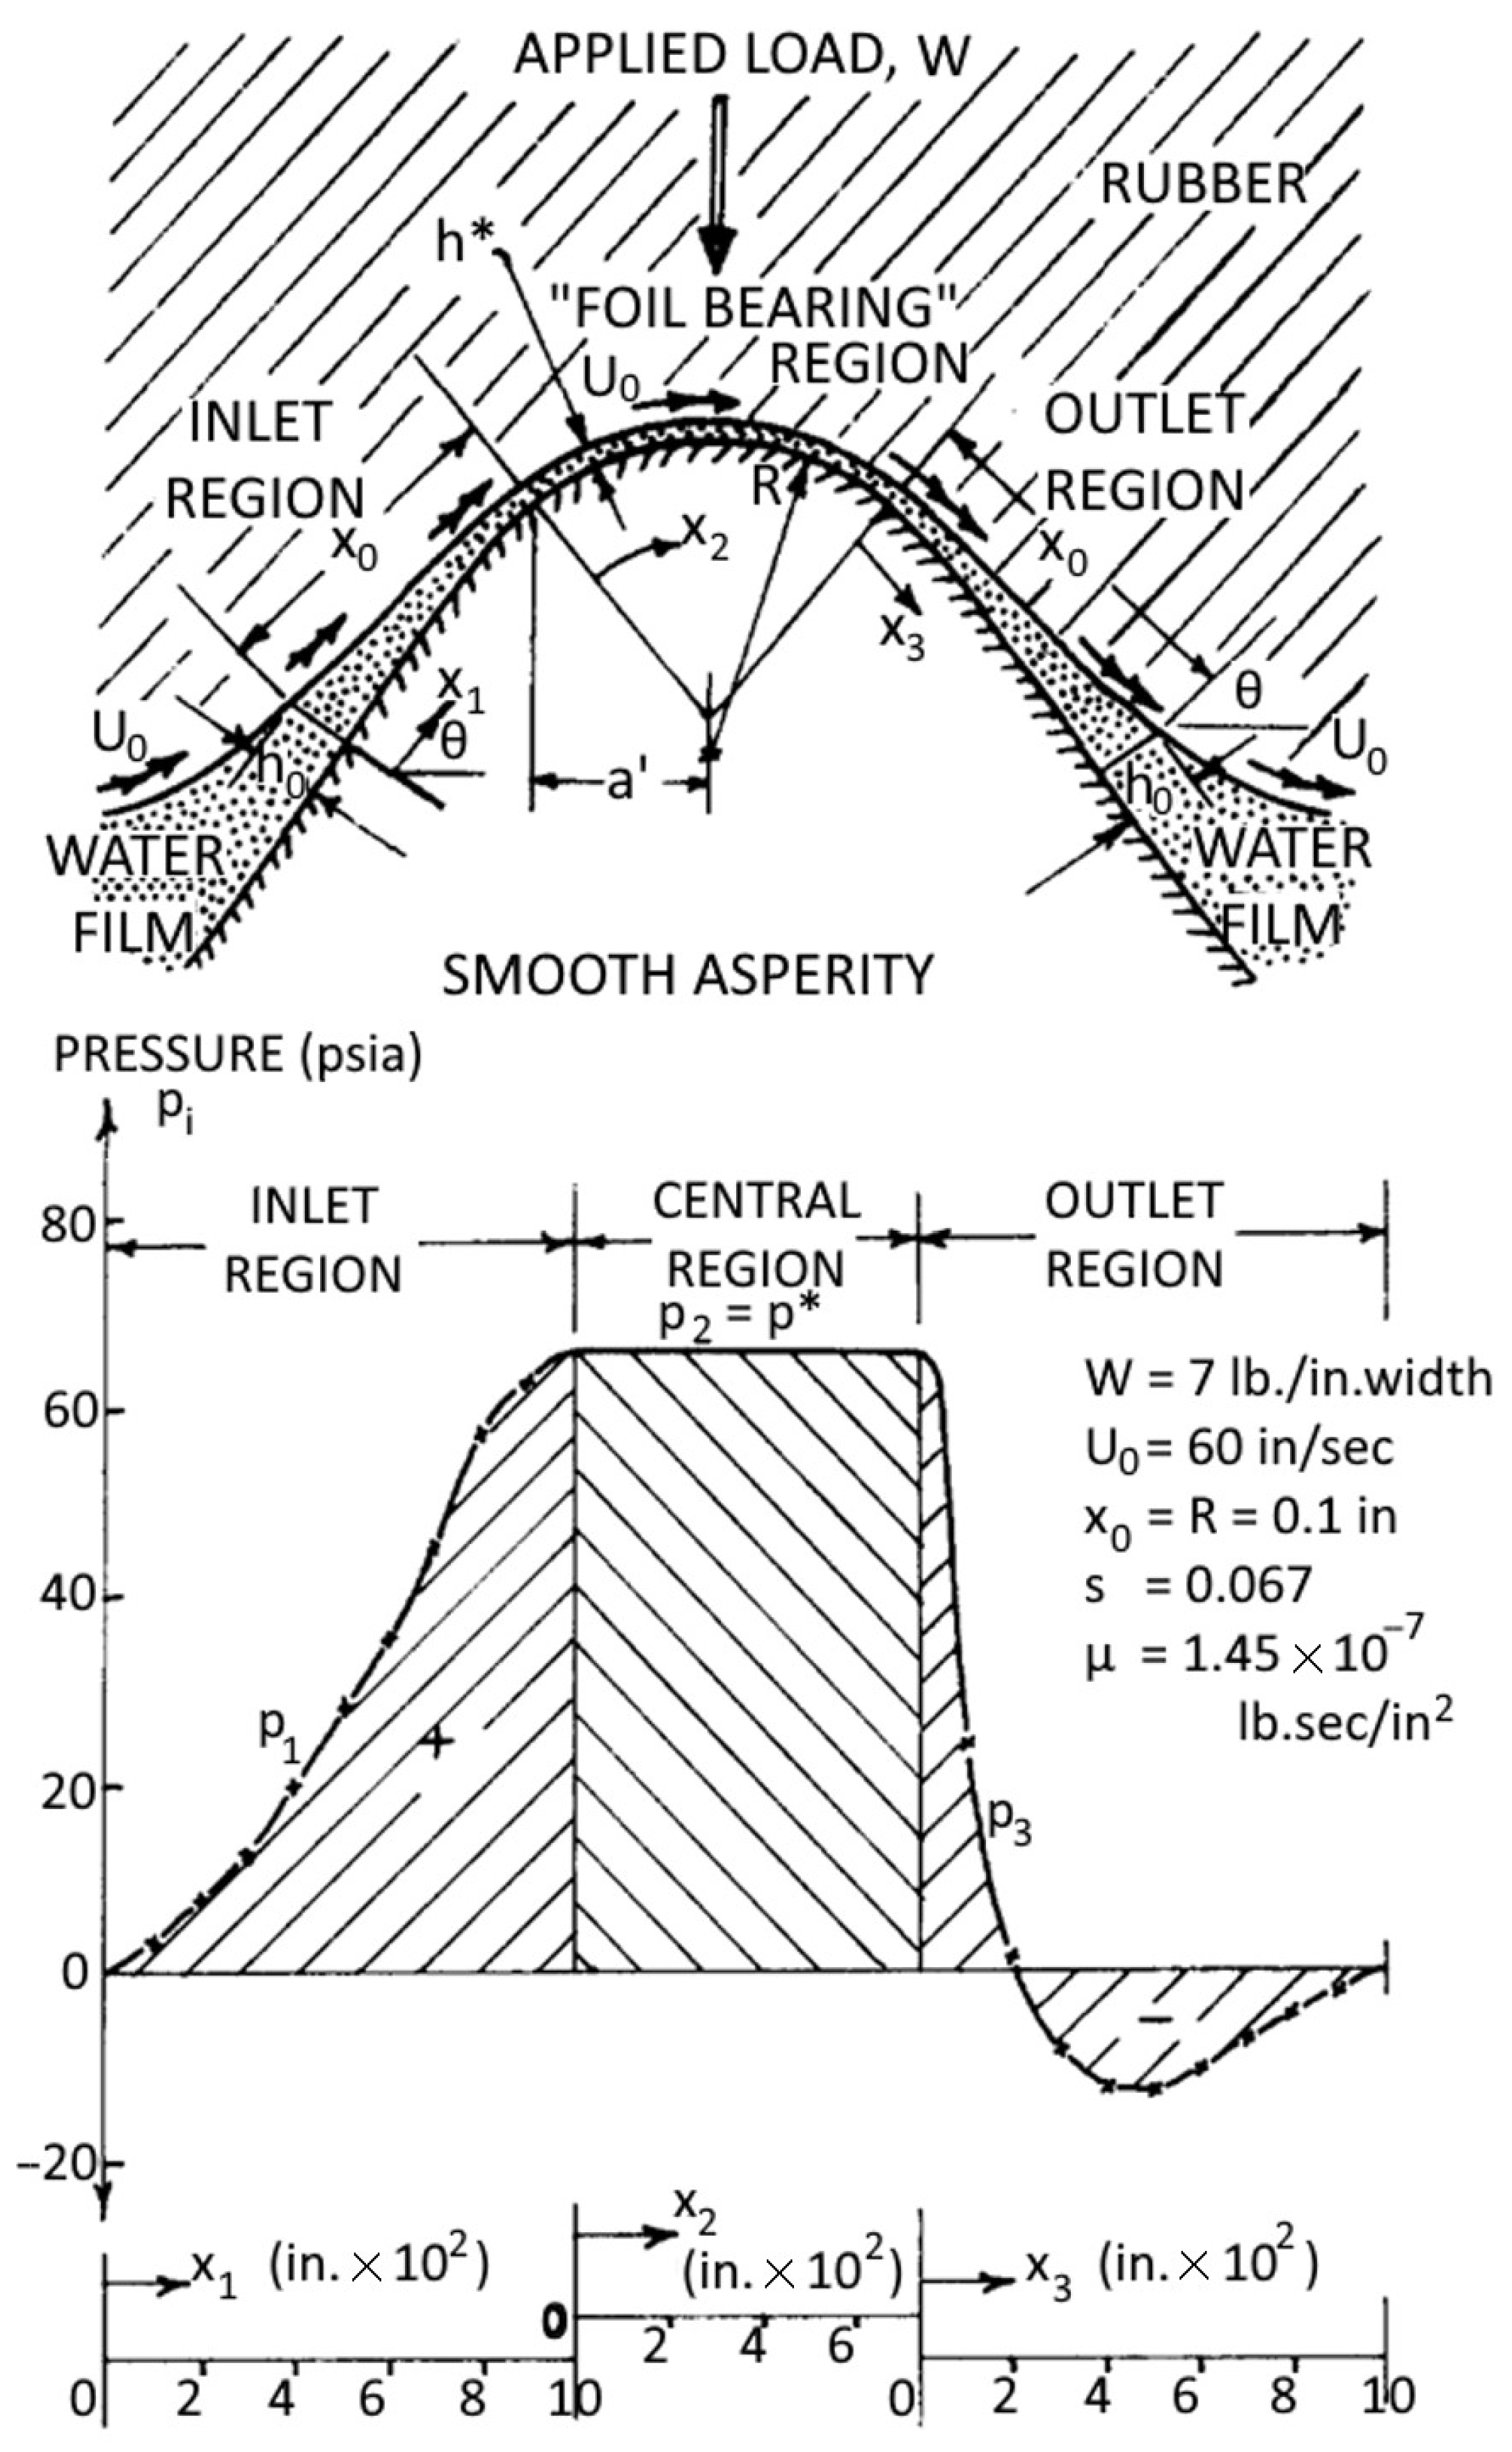
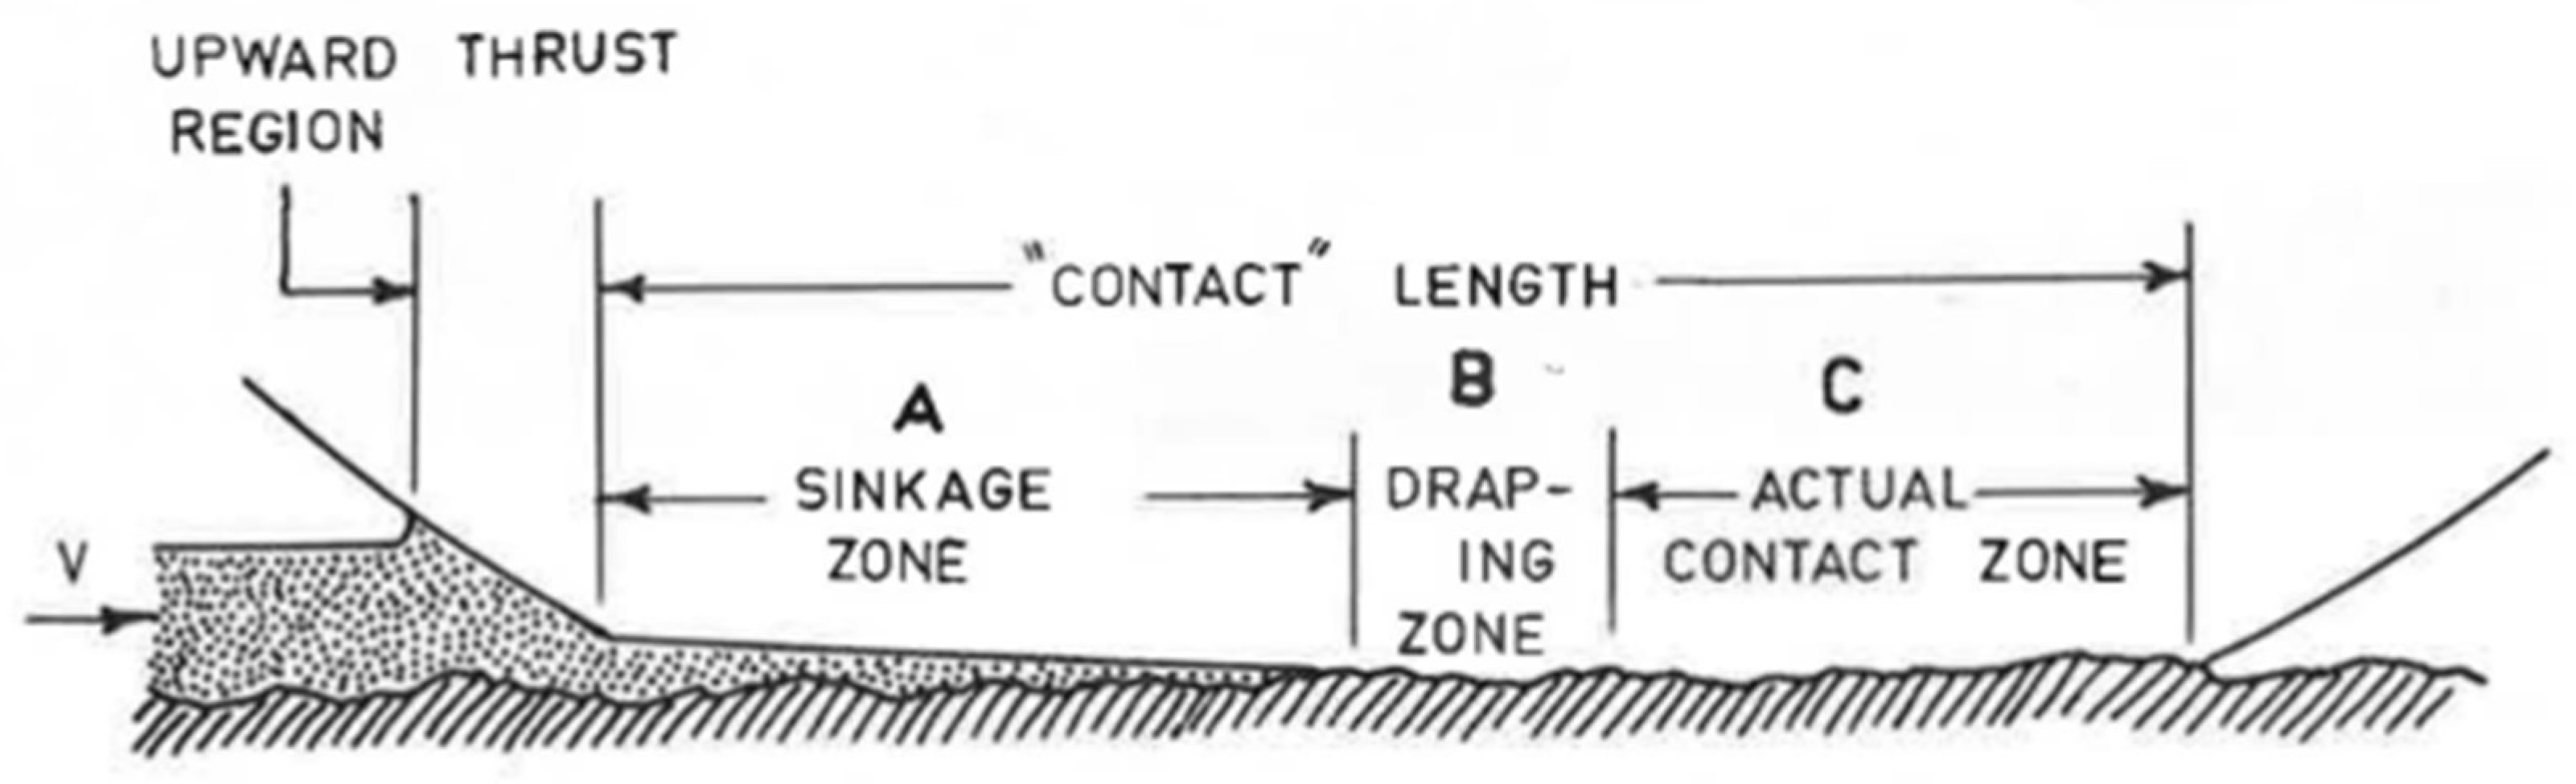
2.2.1. Viscous Hydroplaning
2.2.2. Dynamic Hydroplaning
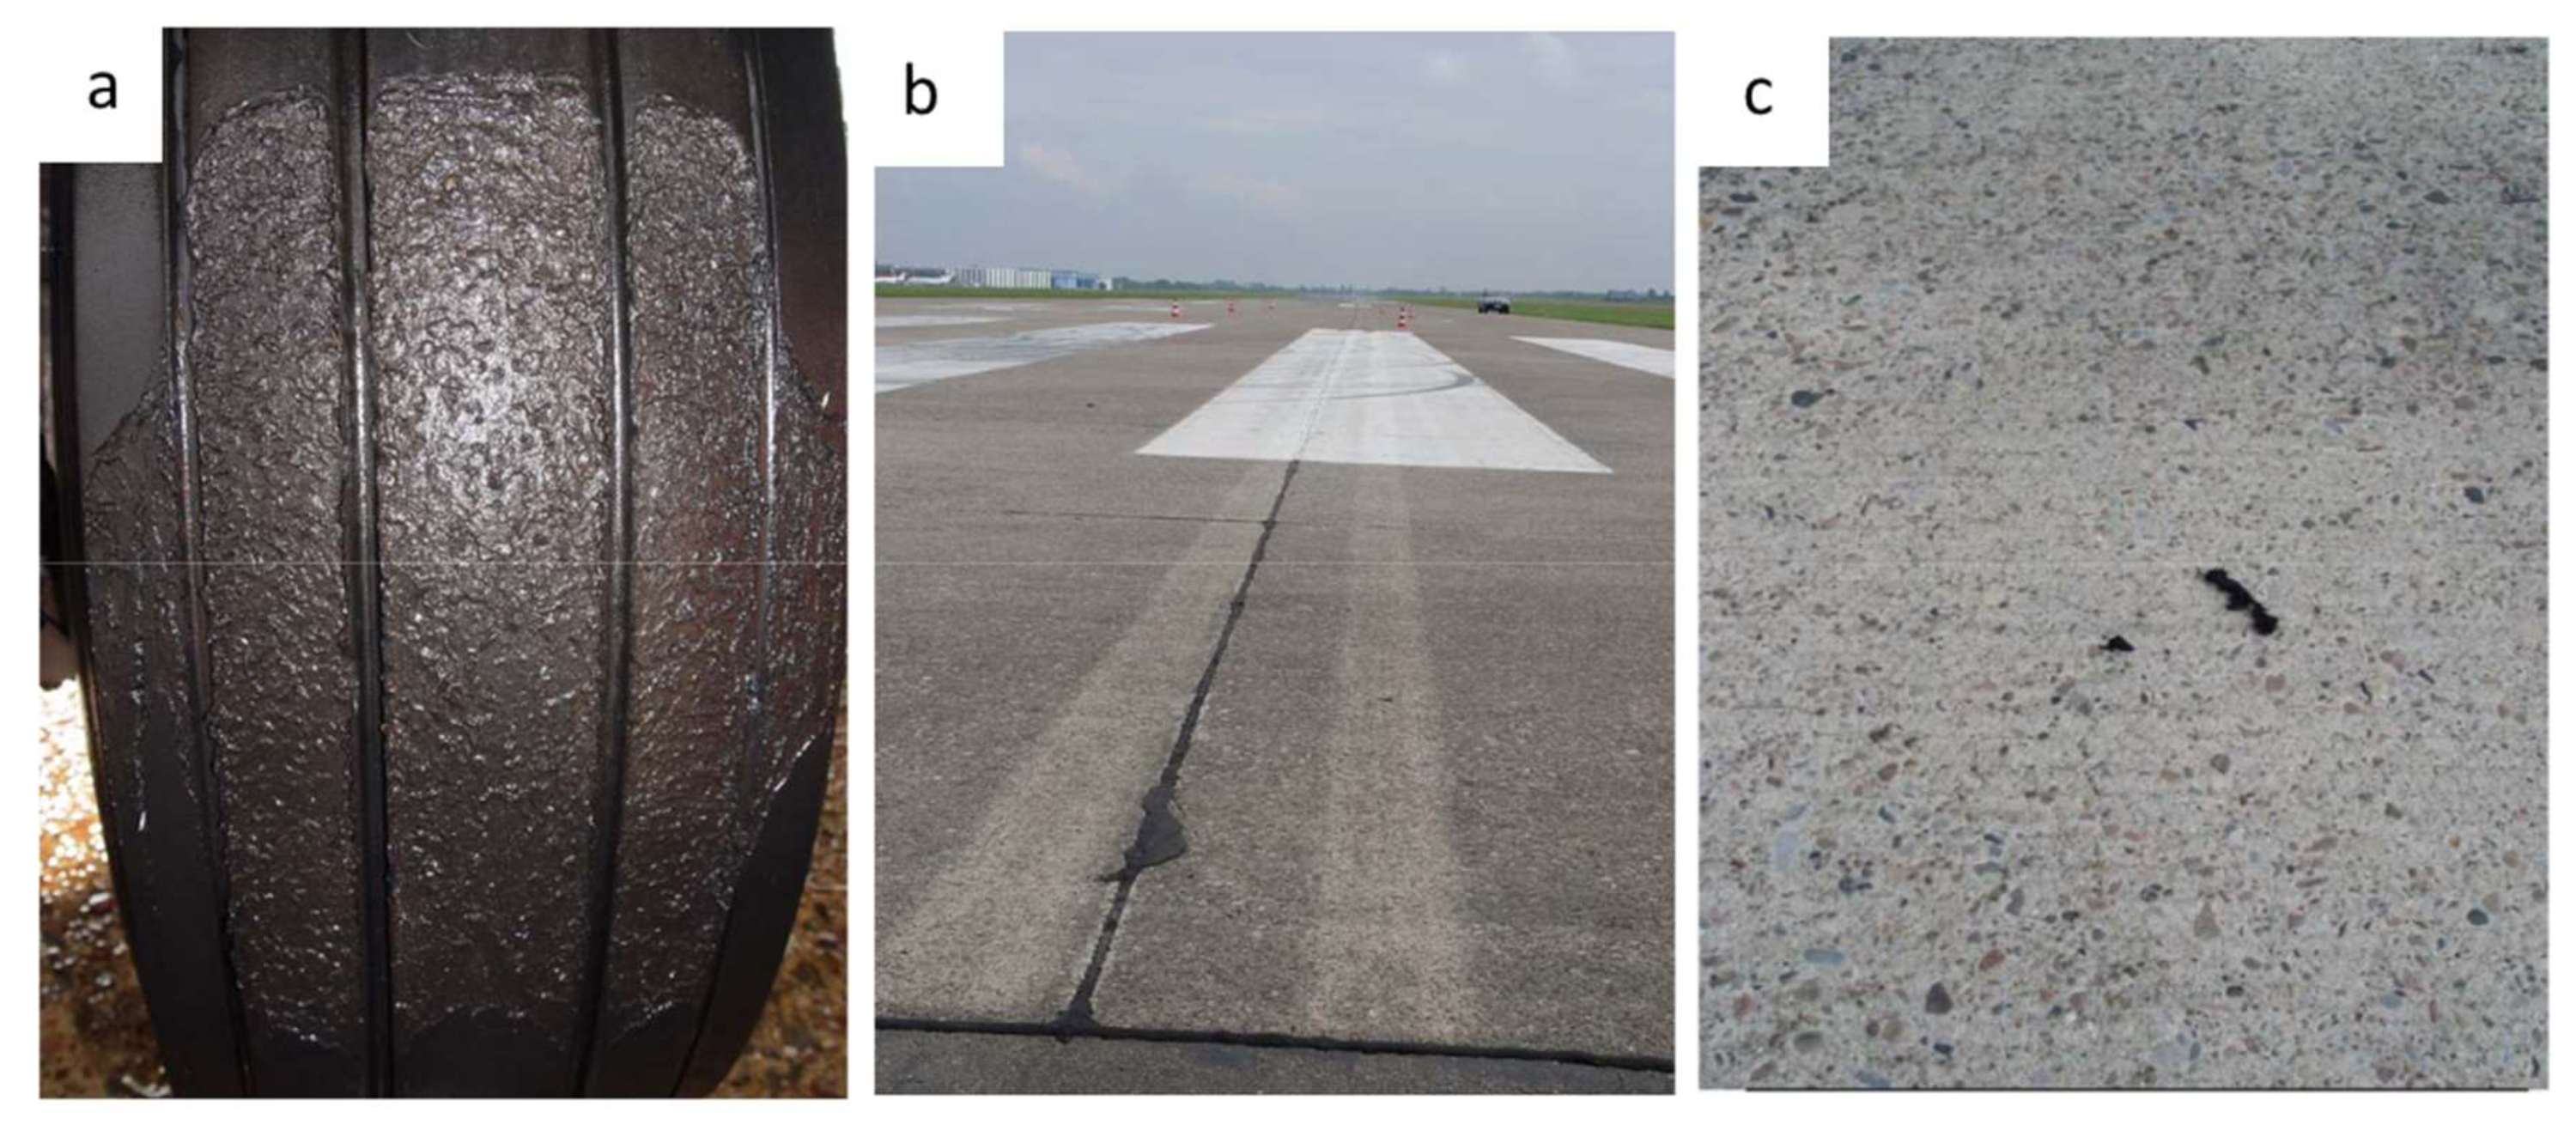
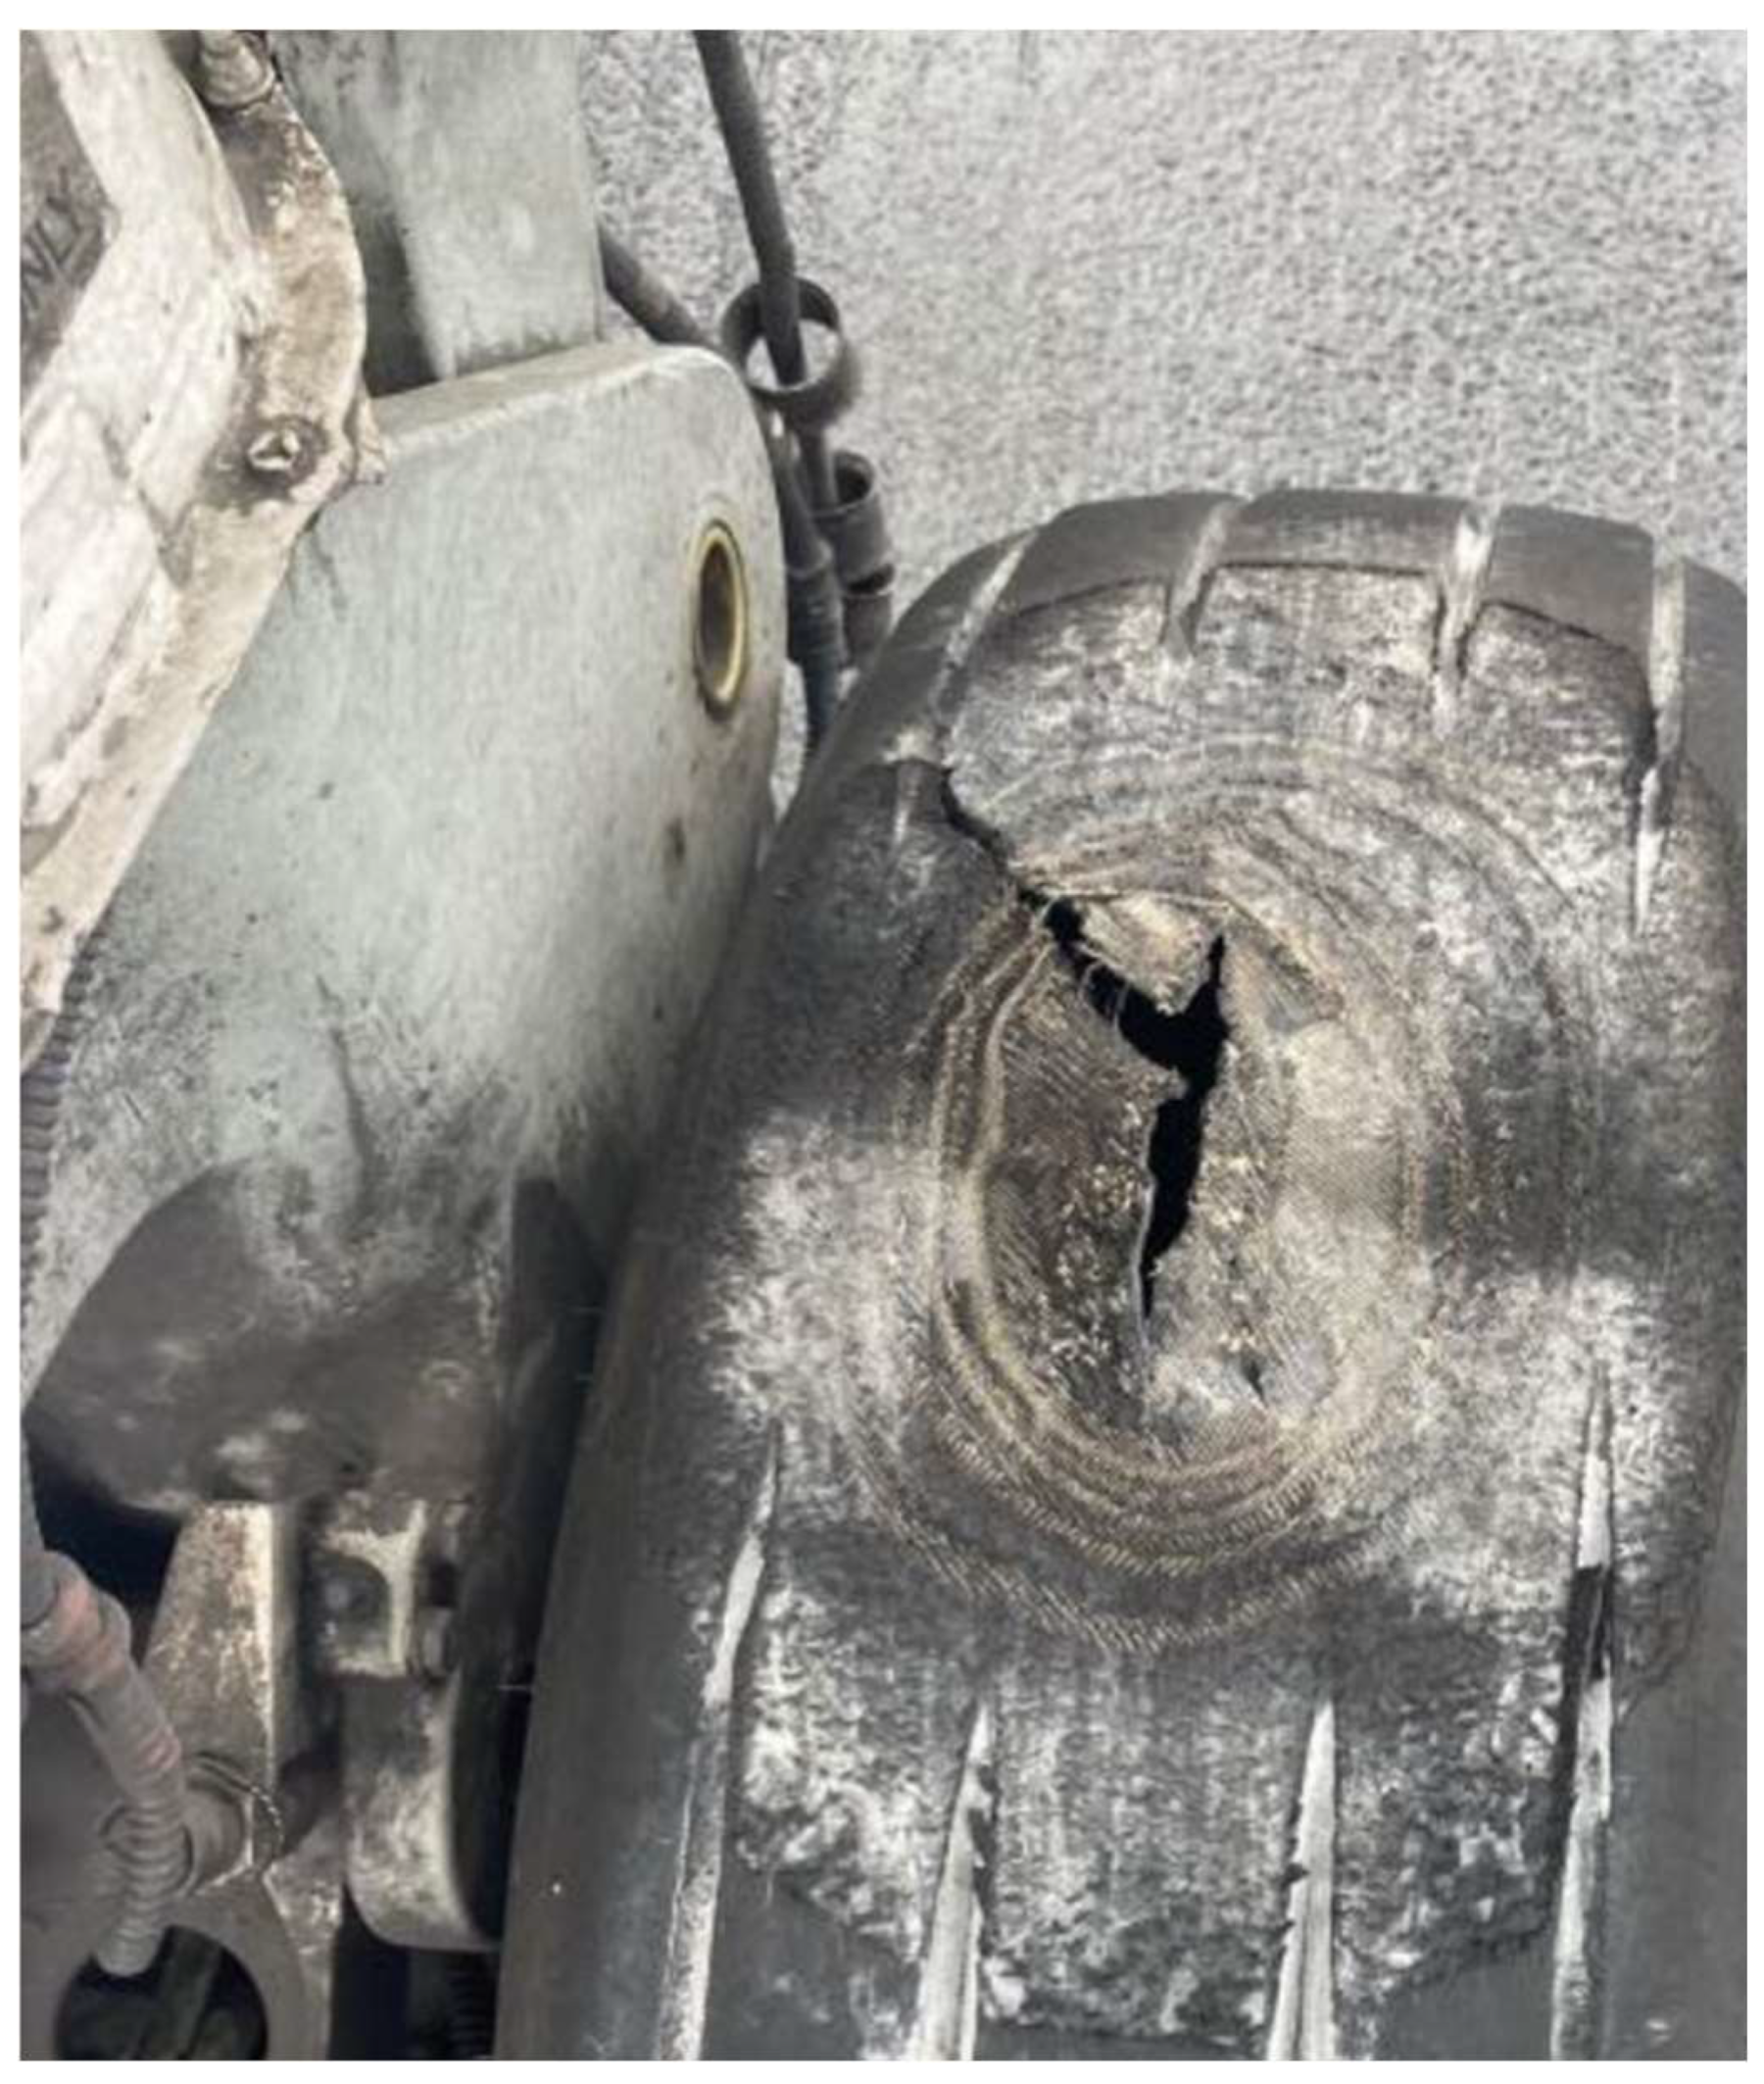
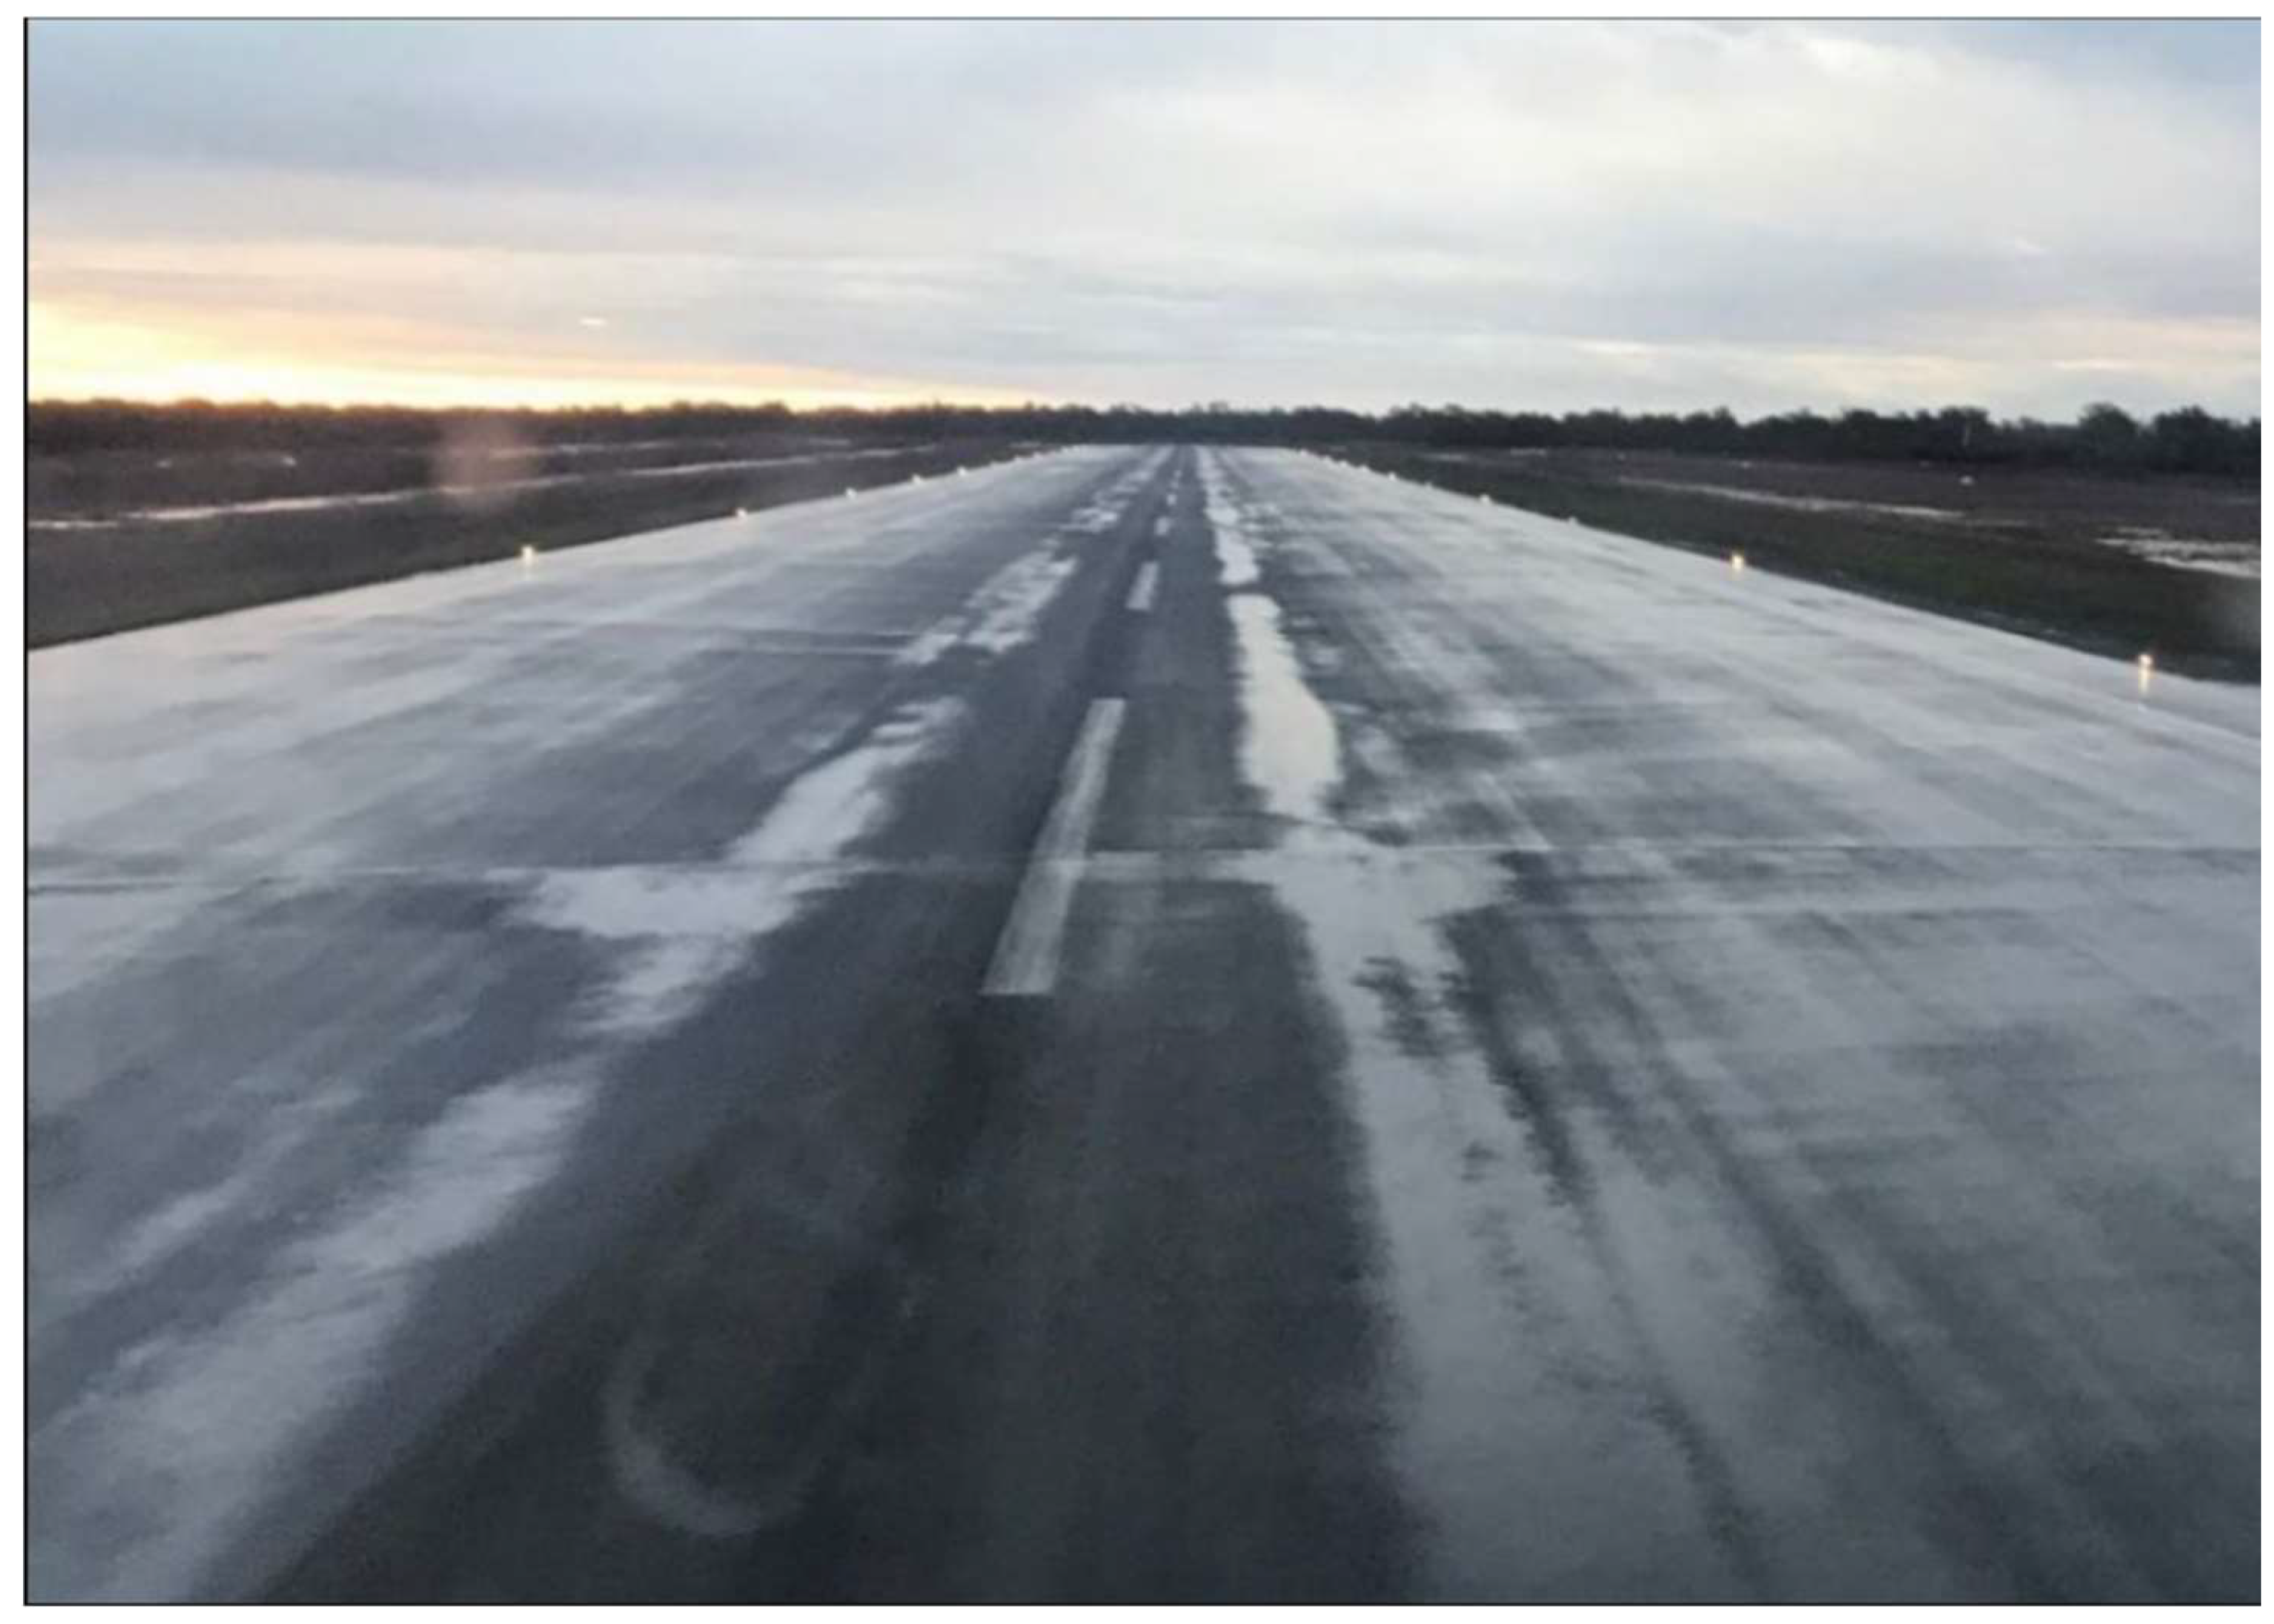
2.2.3. Reverted Rubber Skidding
2.3. Summary
3. Review of Friction Related Accidents on a Runway
3.1. Australian Transport Safety Bureau
- Lack of awareness of actual surface conditions;
- Water contamination of the runway and rains and showers before and during the landing;
- Poor runway maintenance;
- The absence of friction testing results, or inaccurate test results.
- Regular monitoring of the friction coefficient of pavement;
- Regular runway maintenance, including rubber removal, regrooving, and resurfacing;
- Constant monitoring of surface and weather conditions.
3.2. National Transportation Safety Board (USA)
3.3. Chinese Civil Aviation Administration
3.4. Related Research
3.5. Summary
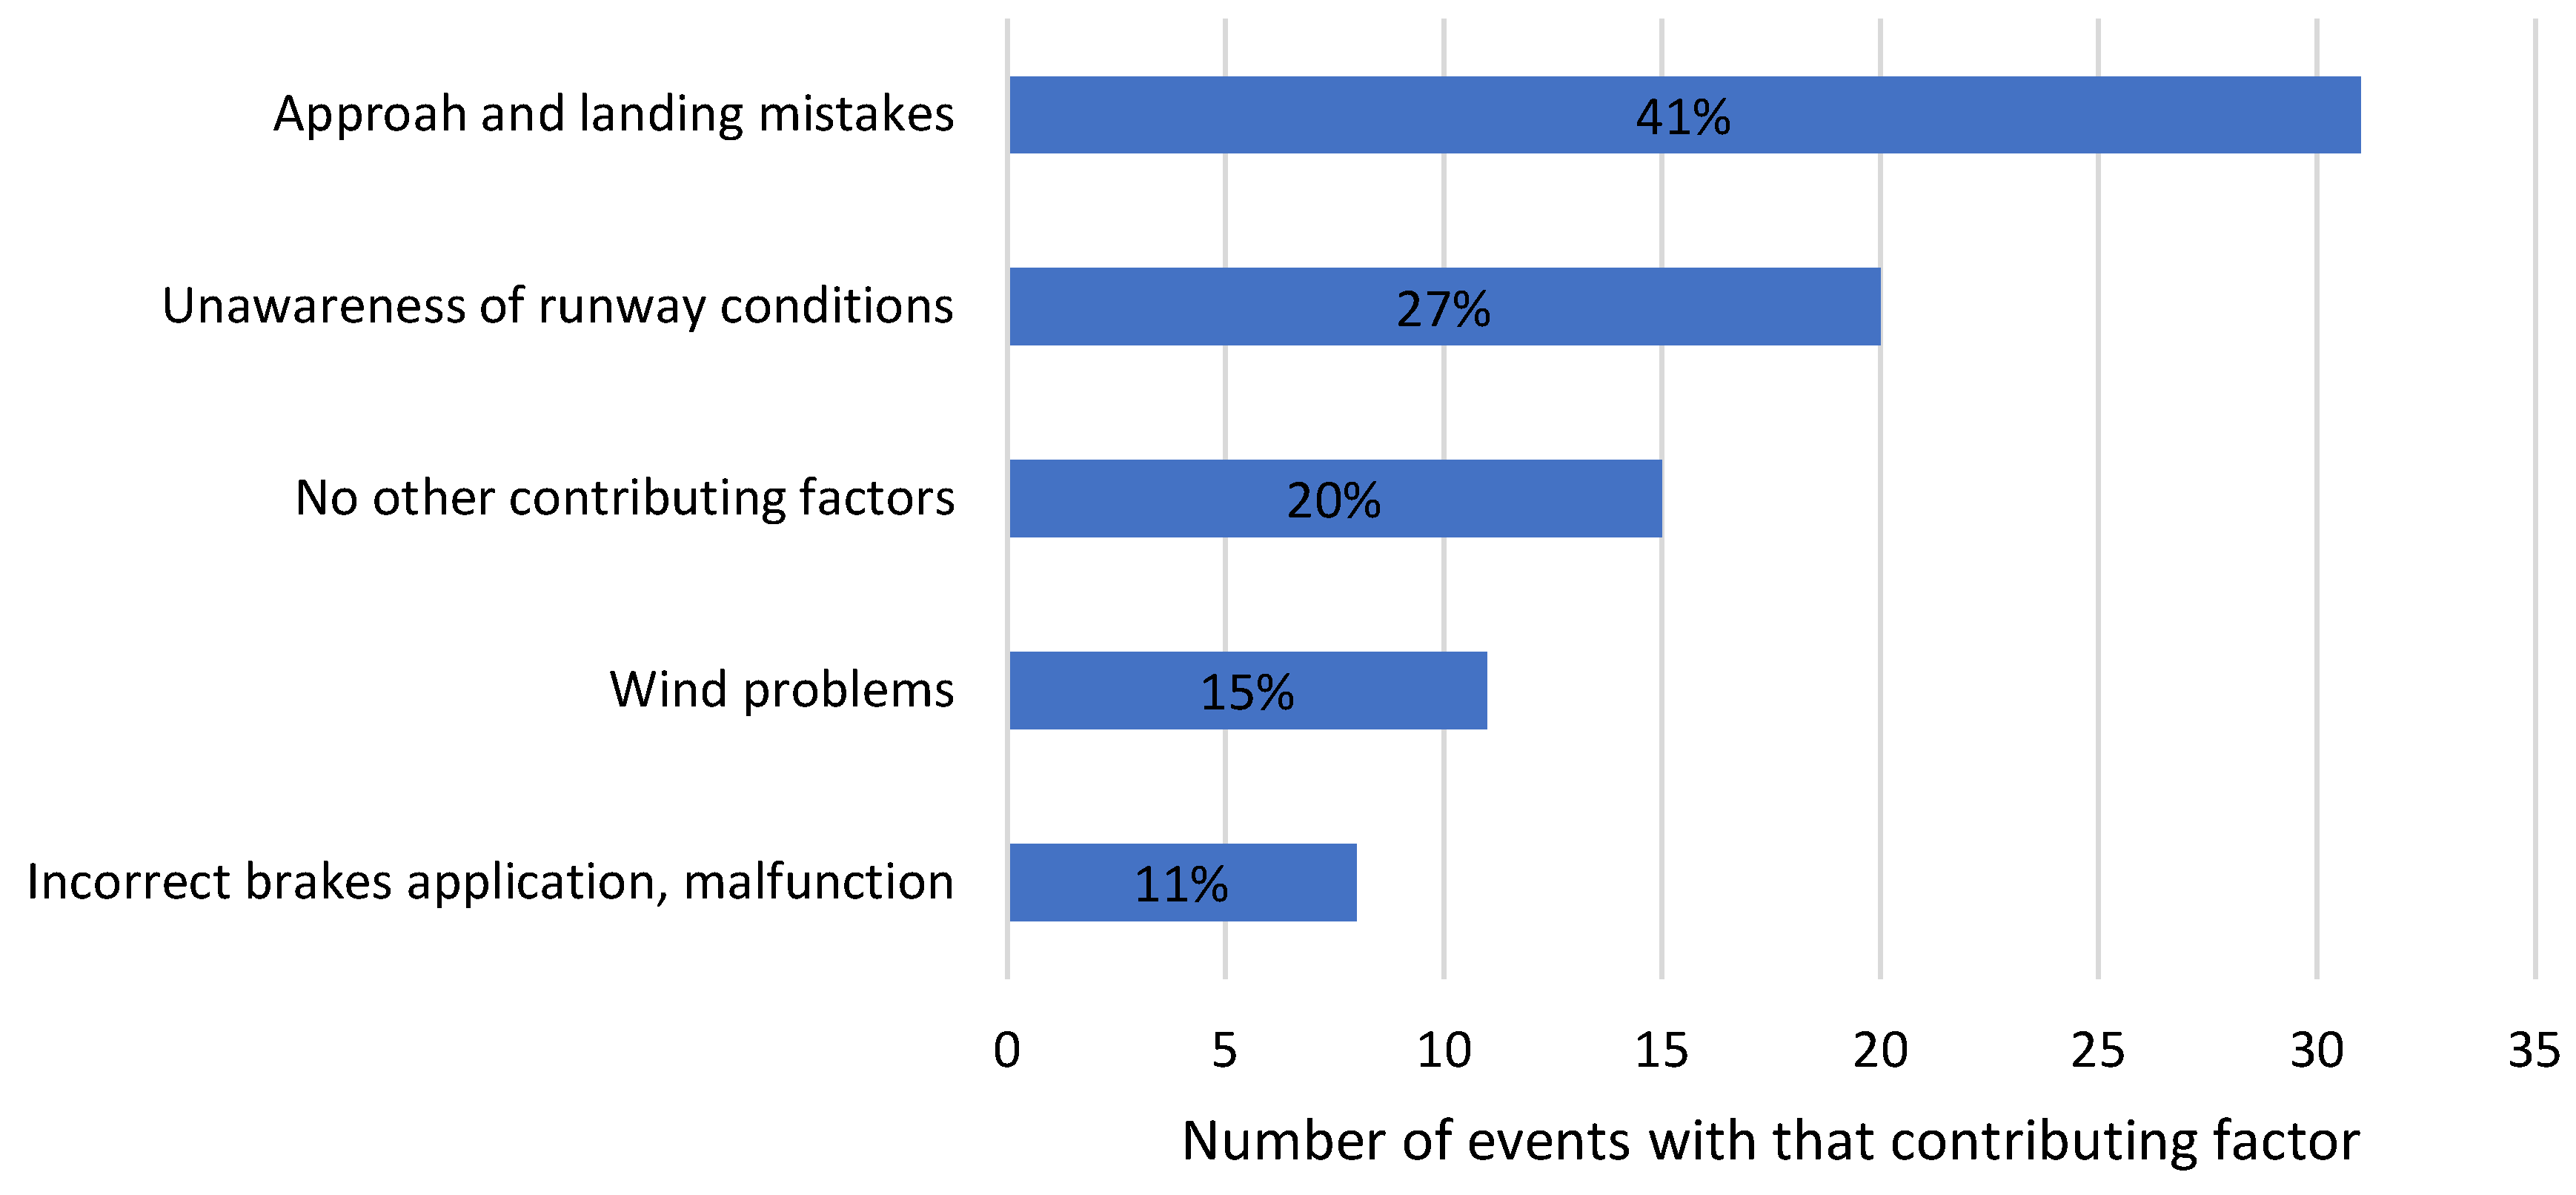
- Approach and landing mistakes;
- Unawareness of runway conditions;
- Poor condition of the runway surface, which includes wear, rubber build-up etc.;
- Contamination of a runway with water, snow, ice, dew, etc.;
- Wind gusts, crosswind, and tailwind;
- Incorrect brake application and/or brake or anti-skid system malfunction.
- Regular monitoring of the friction coefficient of the pavement;
- Regular runway maintenance, including rubber removal, regrooving, and resurfacing;
- Constant monitoring of surface and weather conditions to increase the awareness of pilots.
4. International Runway Skid Resistance Standards and Regulations
4.1. Wet Friction Measurement Results
- Operator: anyone involved in the measurement process;
- Methods: specific requirements for performing the measurement;
- Means: any means (computer, software, device, and parts) used to perform the measurement;
- Materials: raw materials, such as tires, used to produce the final results;
- Environment: environmental conditions, such as temperature, location, and weather.
4.2. Micro and Macro Surface Texture
4.3. Impact on Runway Length
4.4. Summary
- Friction assessment consistency and reliability cannot be ensured by the current requirements;
- Recommended friction levels are outdated;
- GRF does not allow adjustment of the RWYCC to intermediate friction levels based on the CFME tests;
- The influence of speed on friction is not reflected in the standards;
- There is no method for the calculation of a characteristic value based on the CFME results;
- There is no methodology for the assessment of the reliability of results for both texture measurement and friction measurement;
- Some of the values reflected in the standards do not include nominated test methods, for example, microtexture measurement, which is complicated and challenging.
5. Aircraft Performance Regulations
5.1. Contaminated Runway Regulations
5.2. High-Friction Surface Treatment
5.3. Summary
- Currently, there is no reliable method for the assessment of aircraft landing distance based on friction measurements and aircraft parameters;
- International standards do not provide a unified landing distance assessment methodology;
- It is important to upgrade the current landing distance assessment methodology to avoid risks of runway excursion.
6. Surface Characteristics Assessment
6.1. Fixed and Braking Test Methods
- Performing the test during naturally dry surface conditions.
- Ensuring the self-wetting system accurately provides a reliable 1 mm water film immediately in front of the test tire.
- Performing testing at three test speeds, when assessing aquaplaning potential.
- Omitting the first two runs because these are often outliers to the rest of the results.
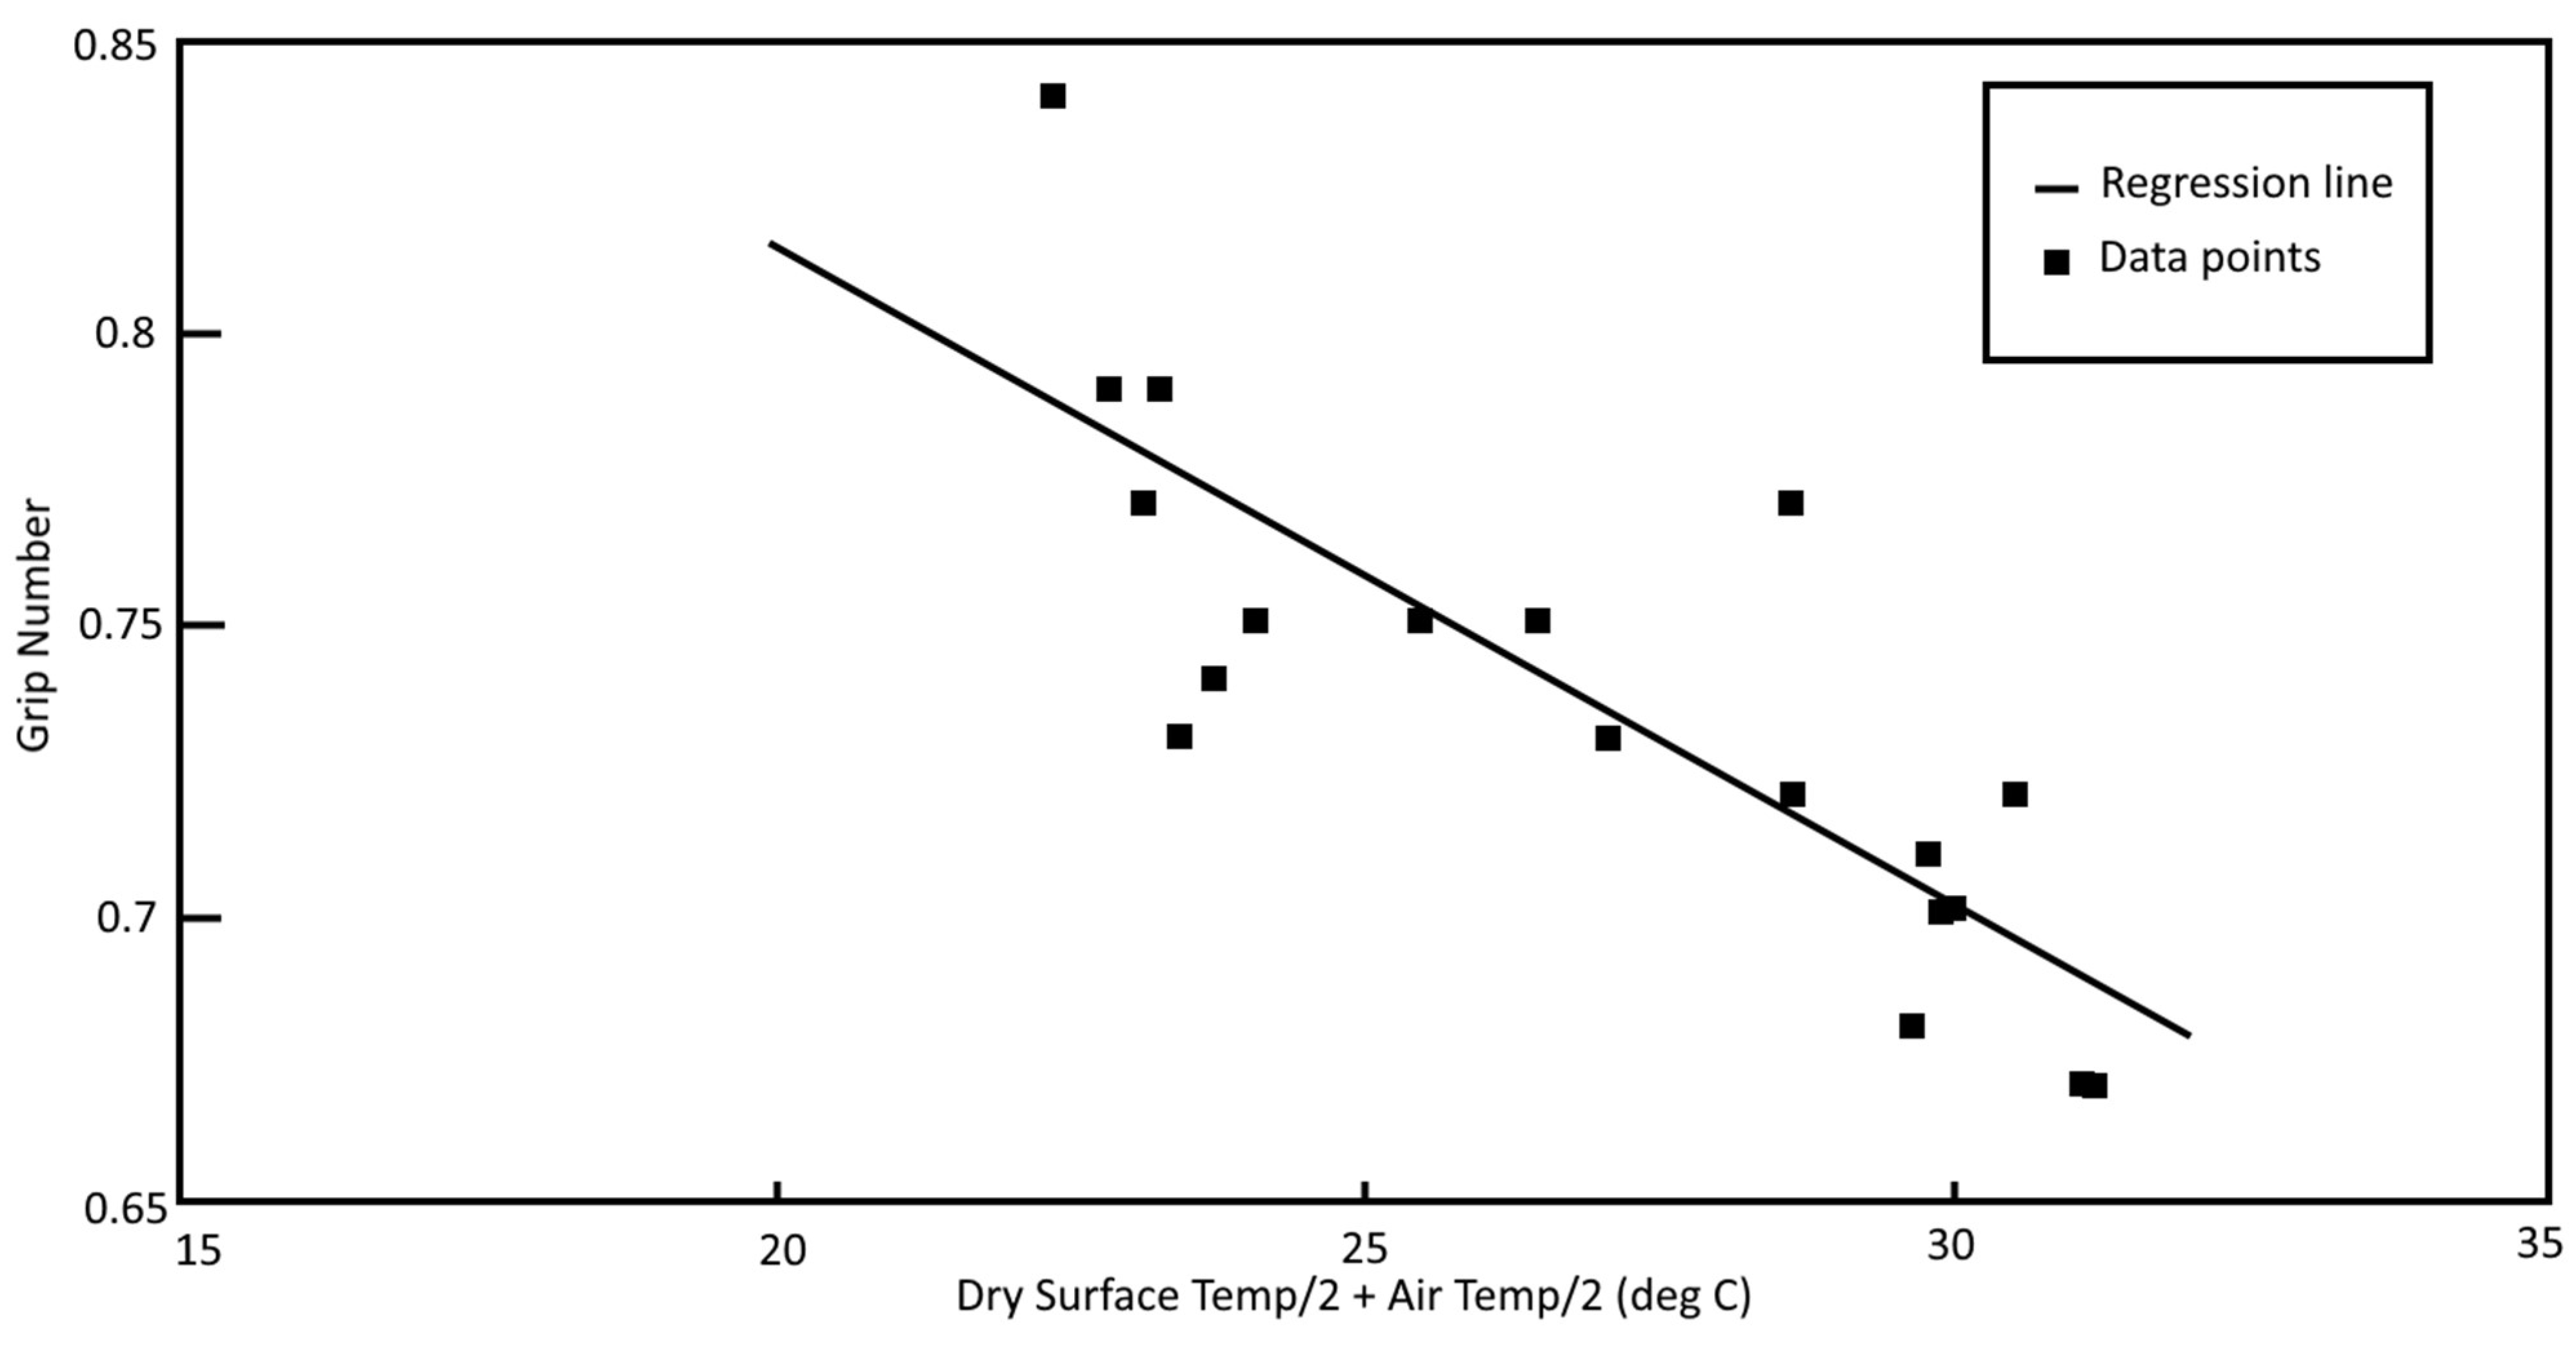
Influence of Weather Conditions on Friction Measurements
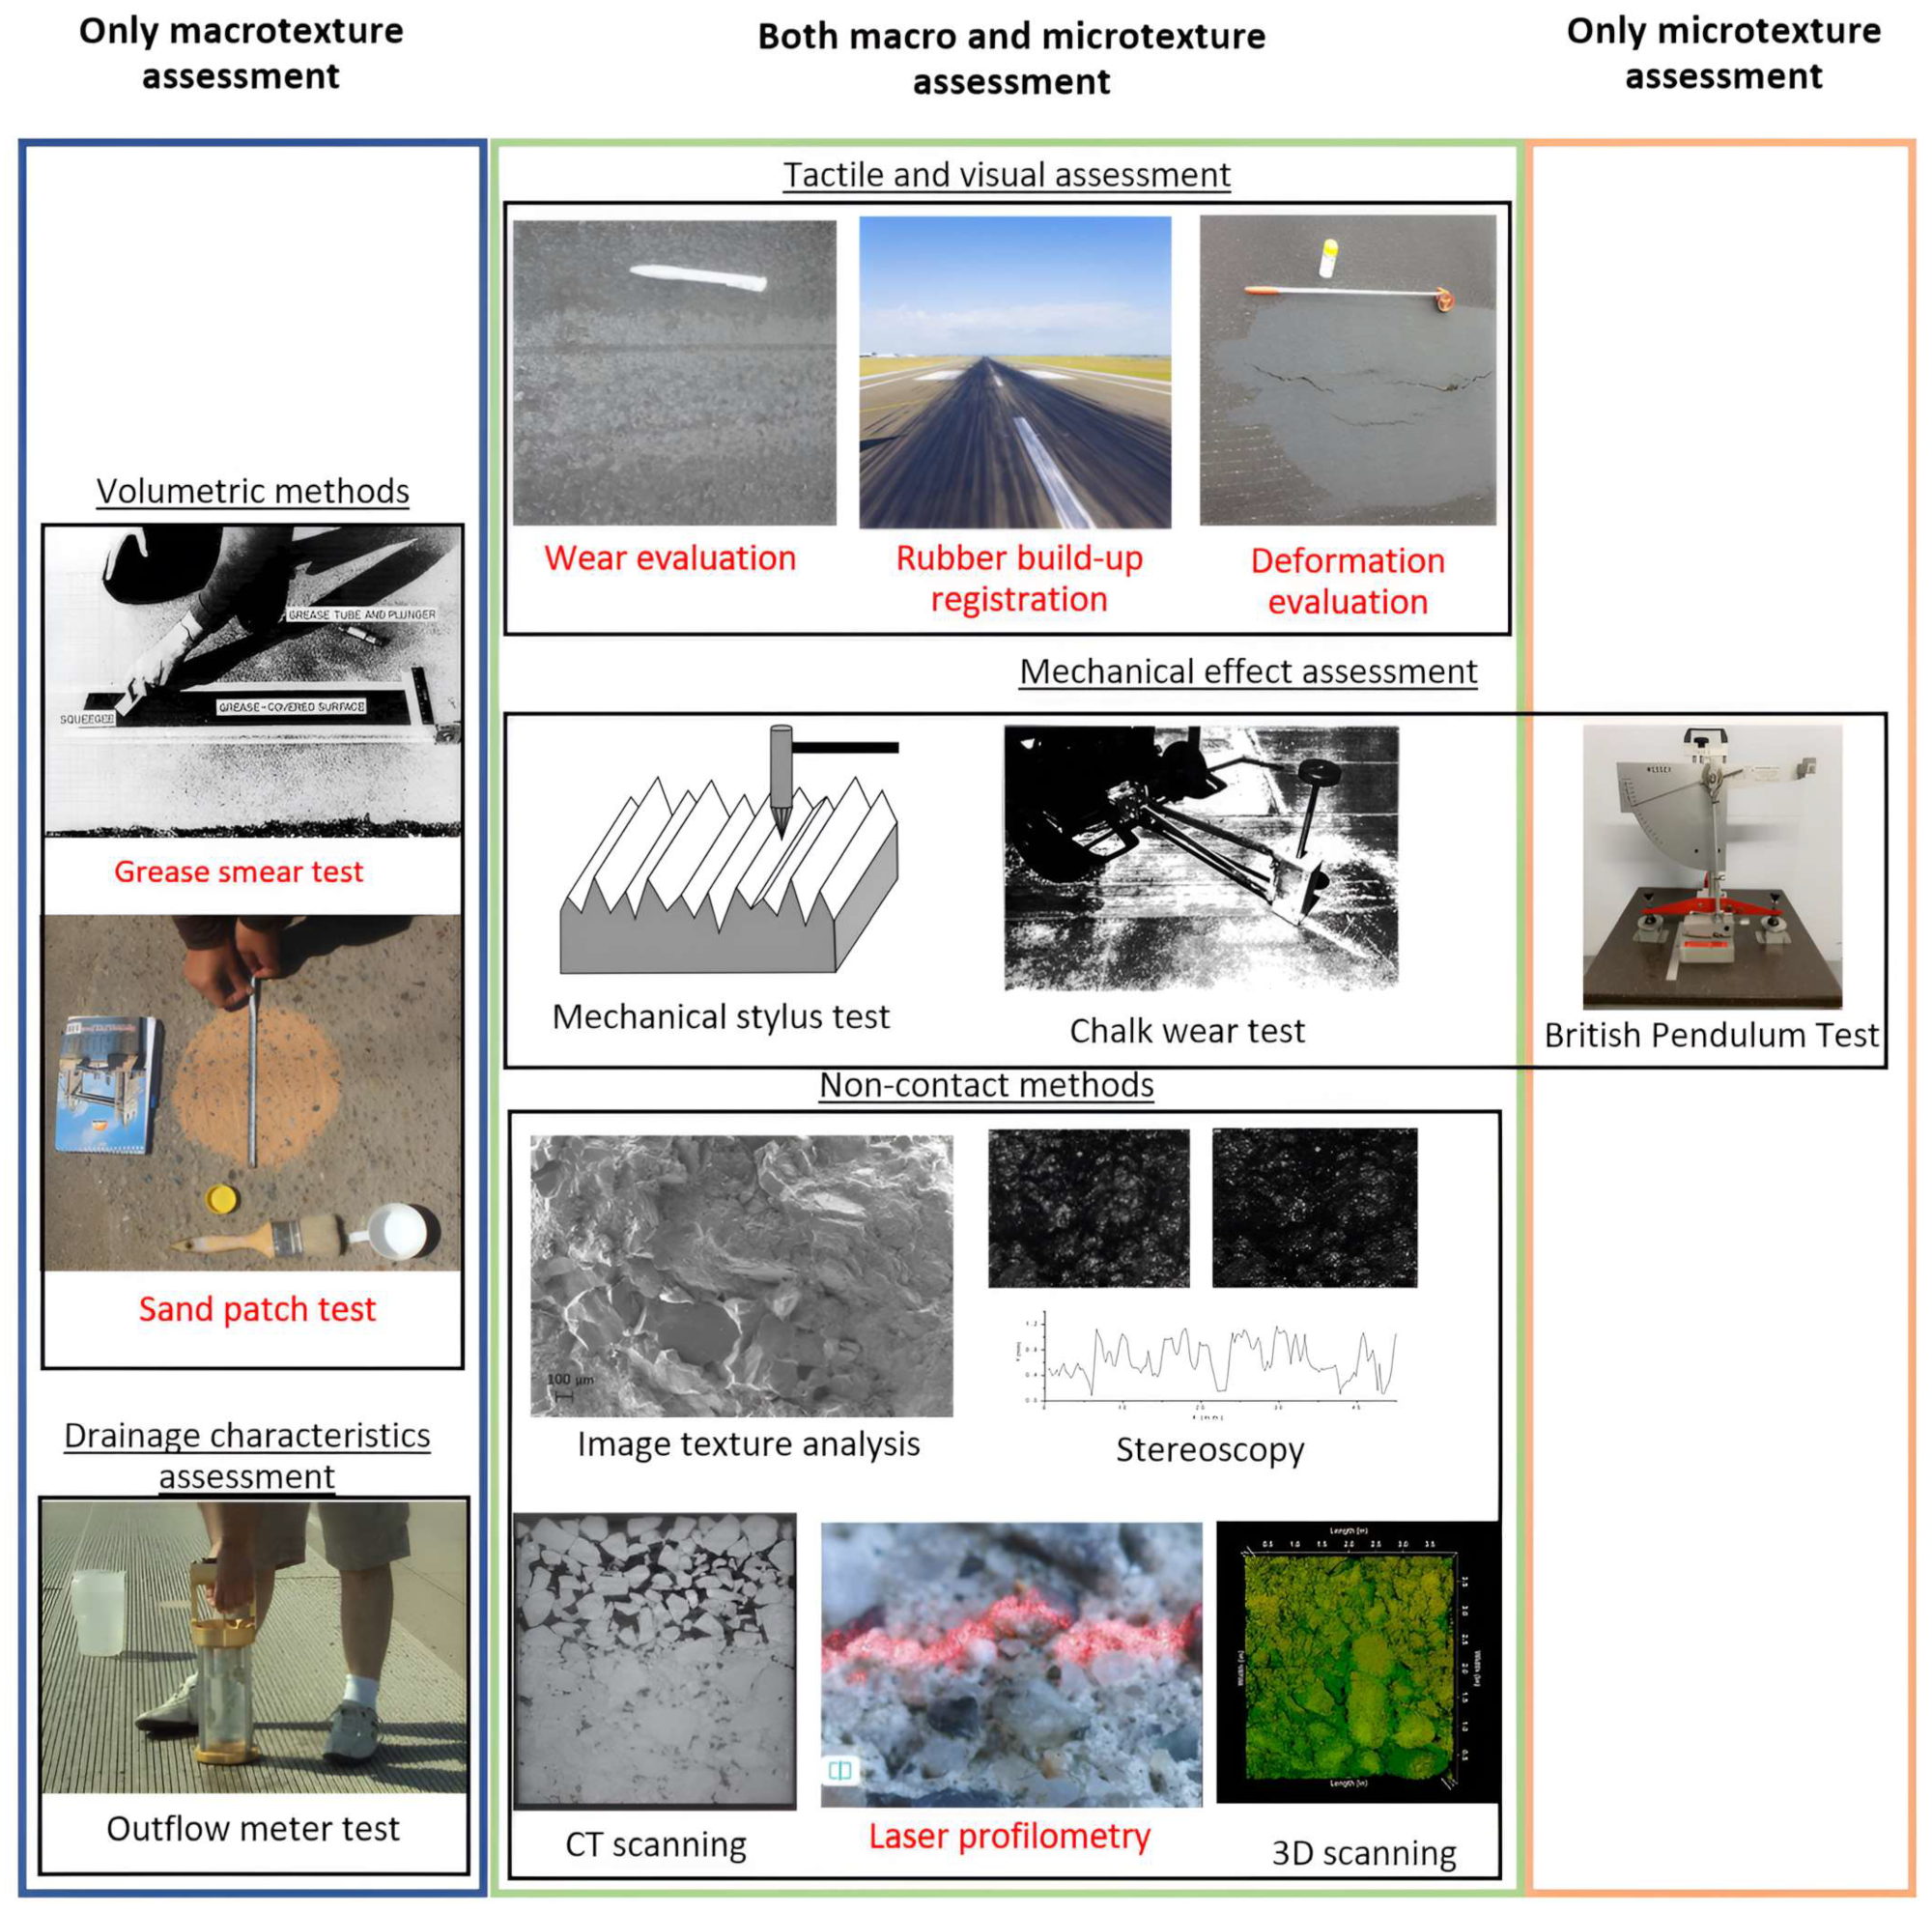
6.2. Surface Texture Assessment
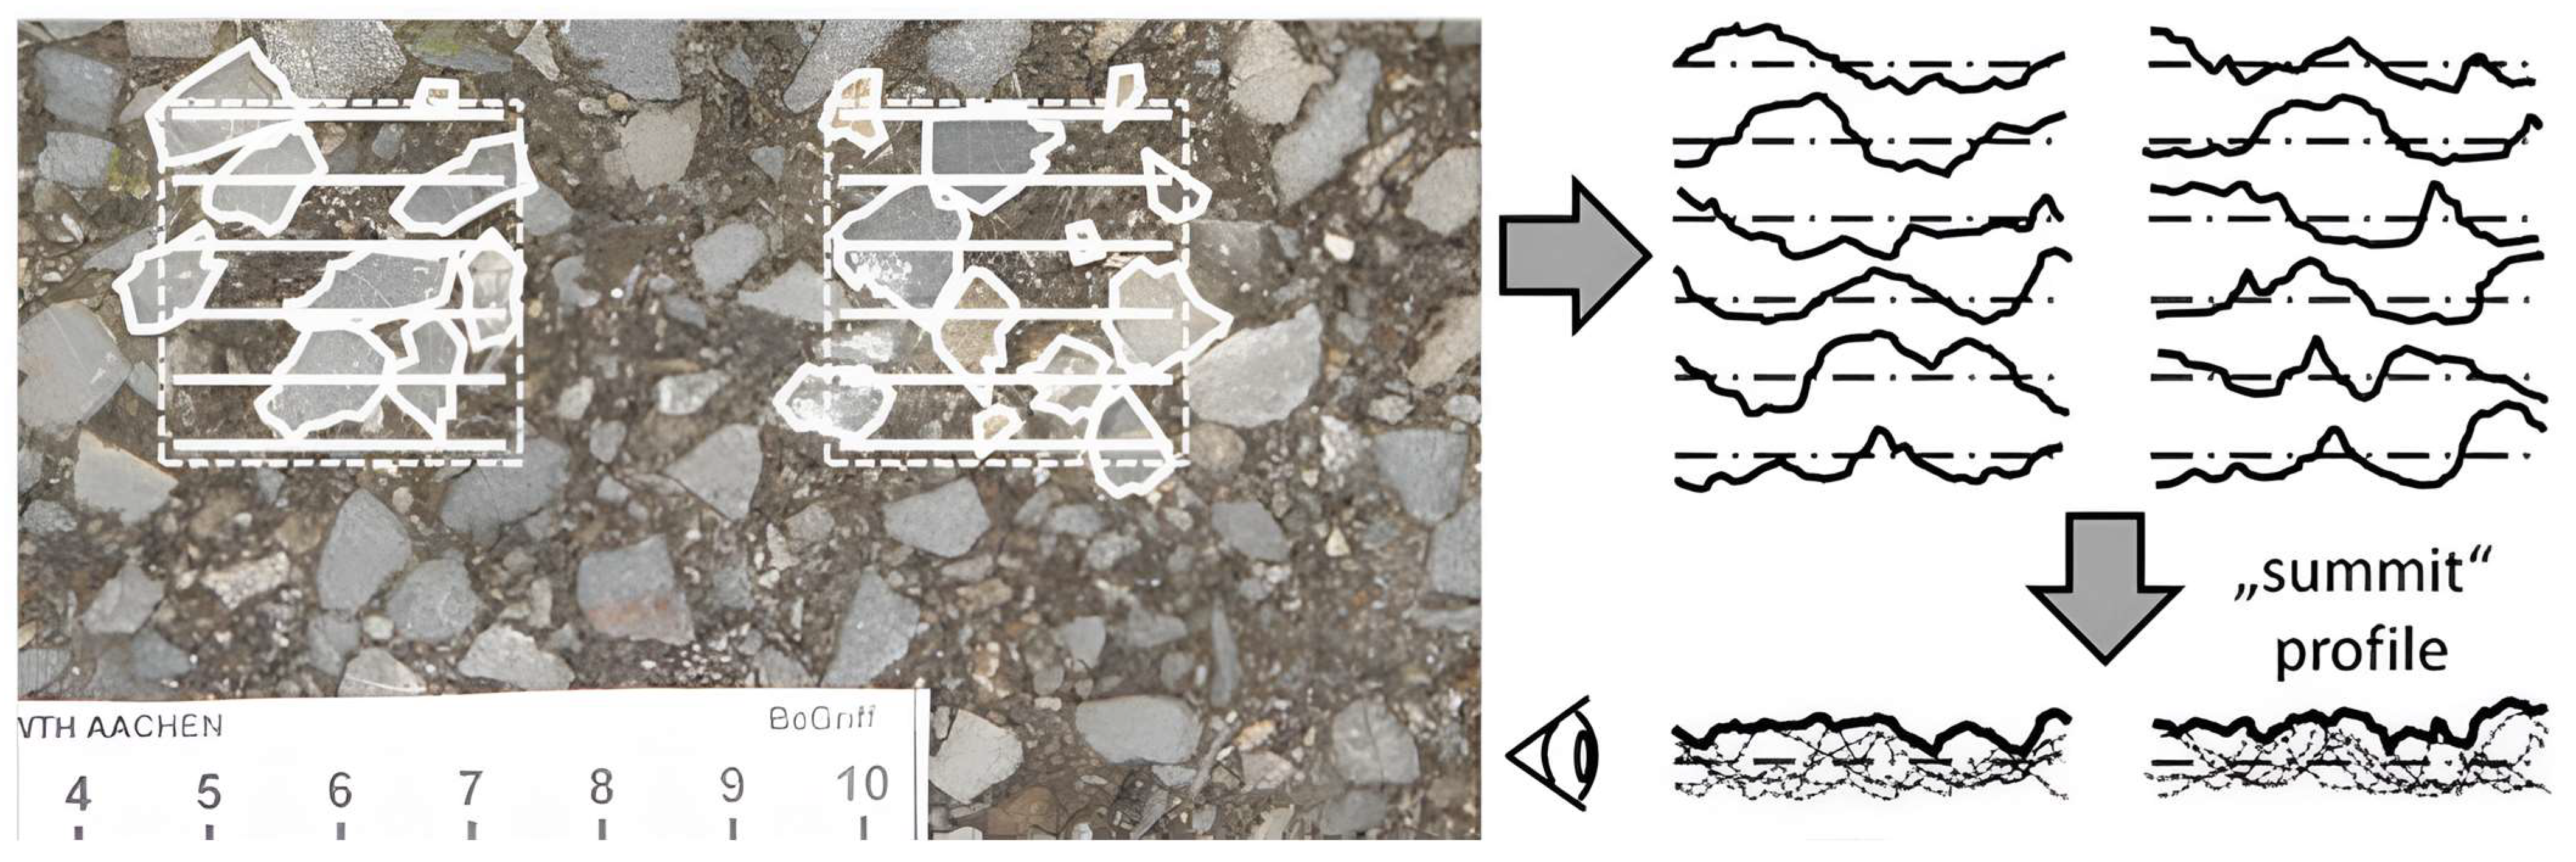
6.2.1. Volumetric Methods
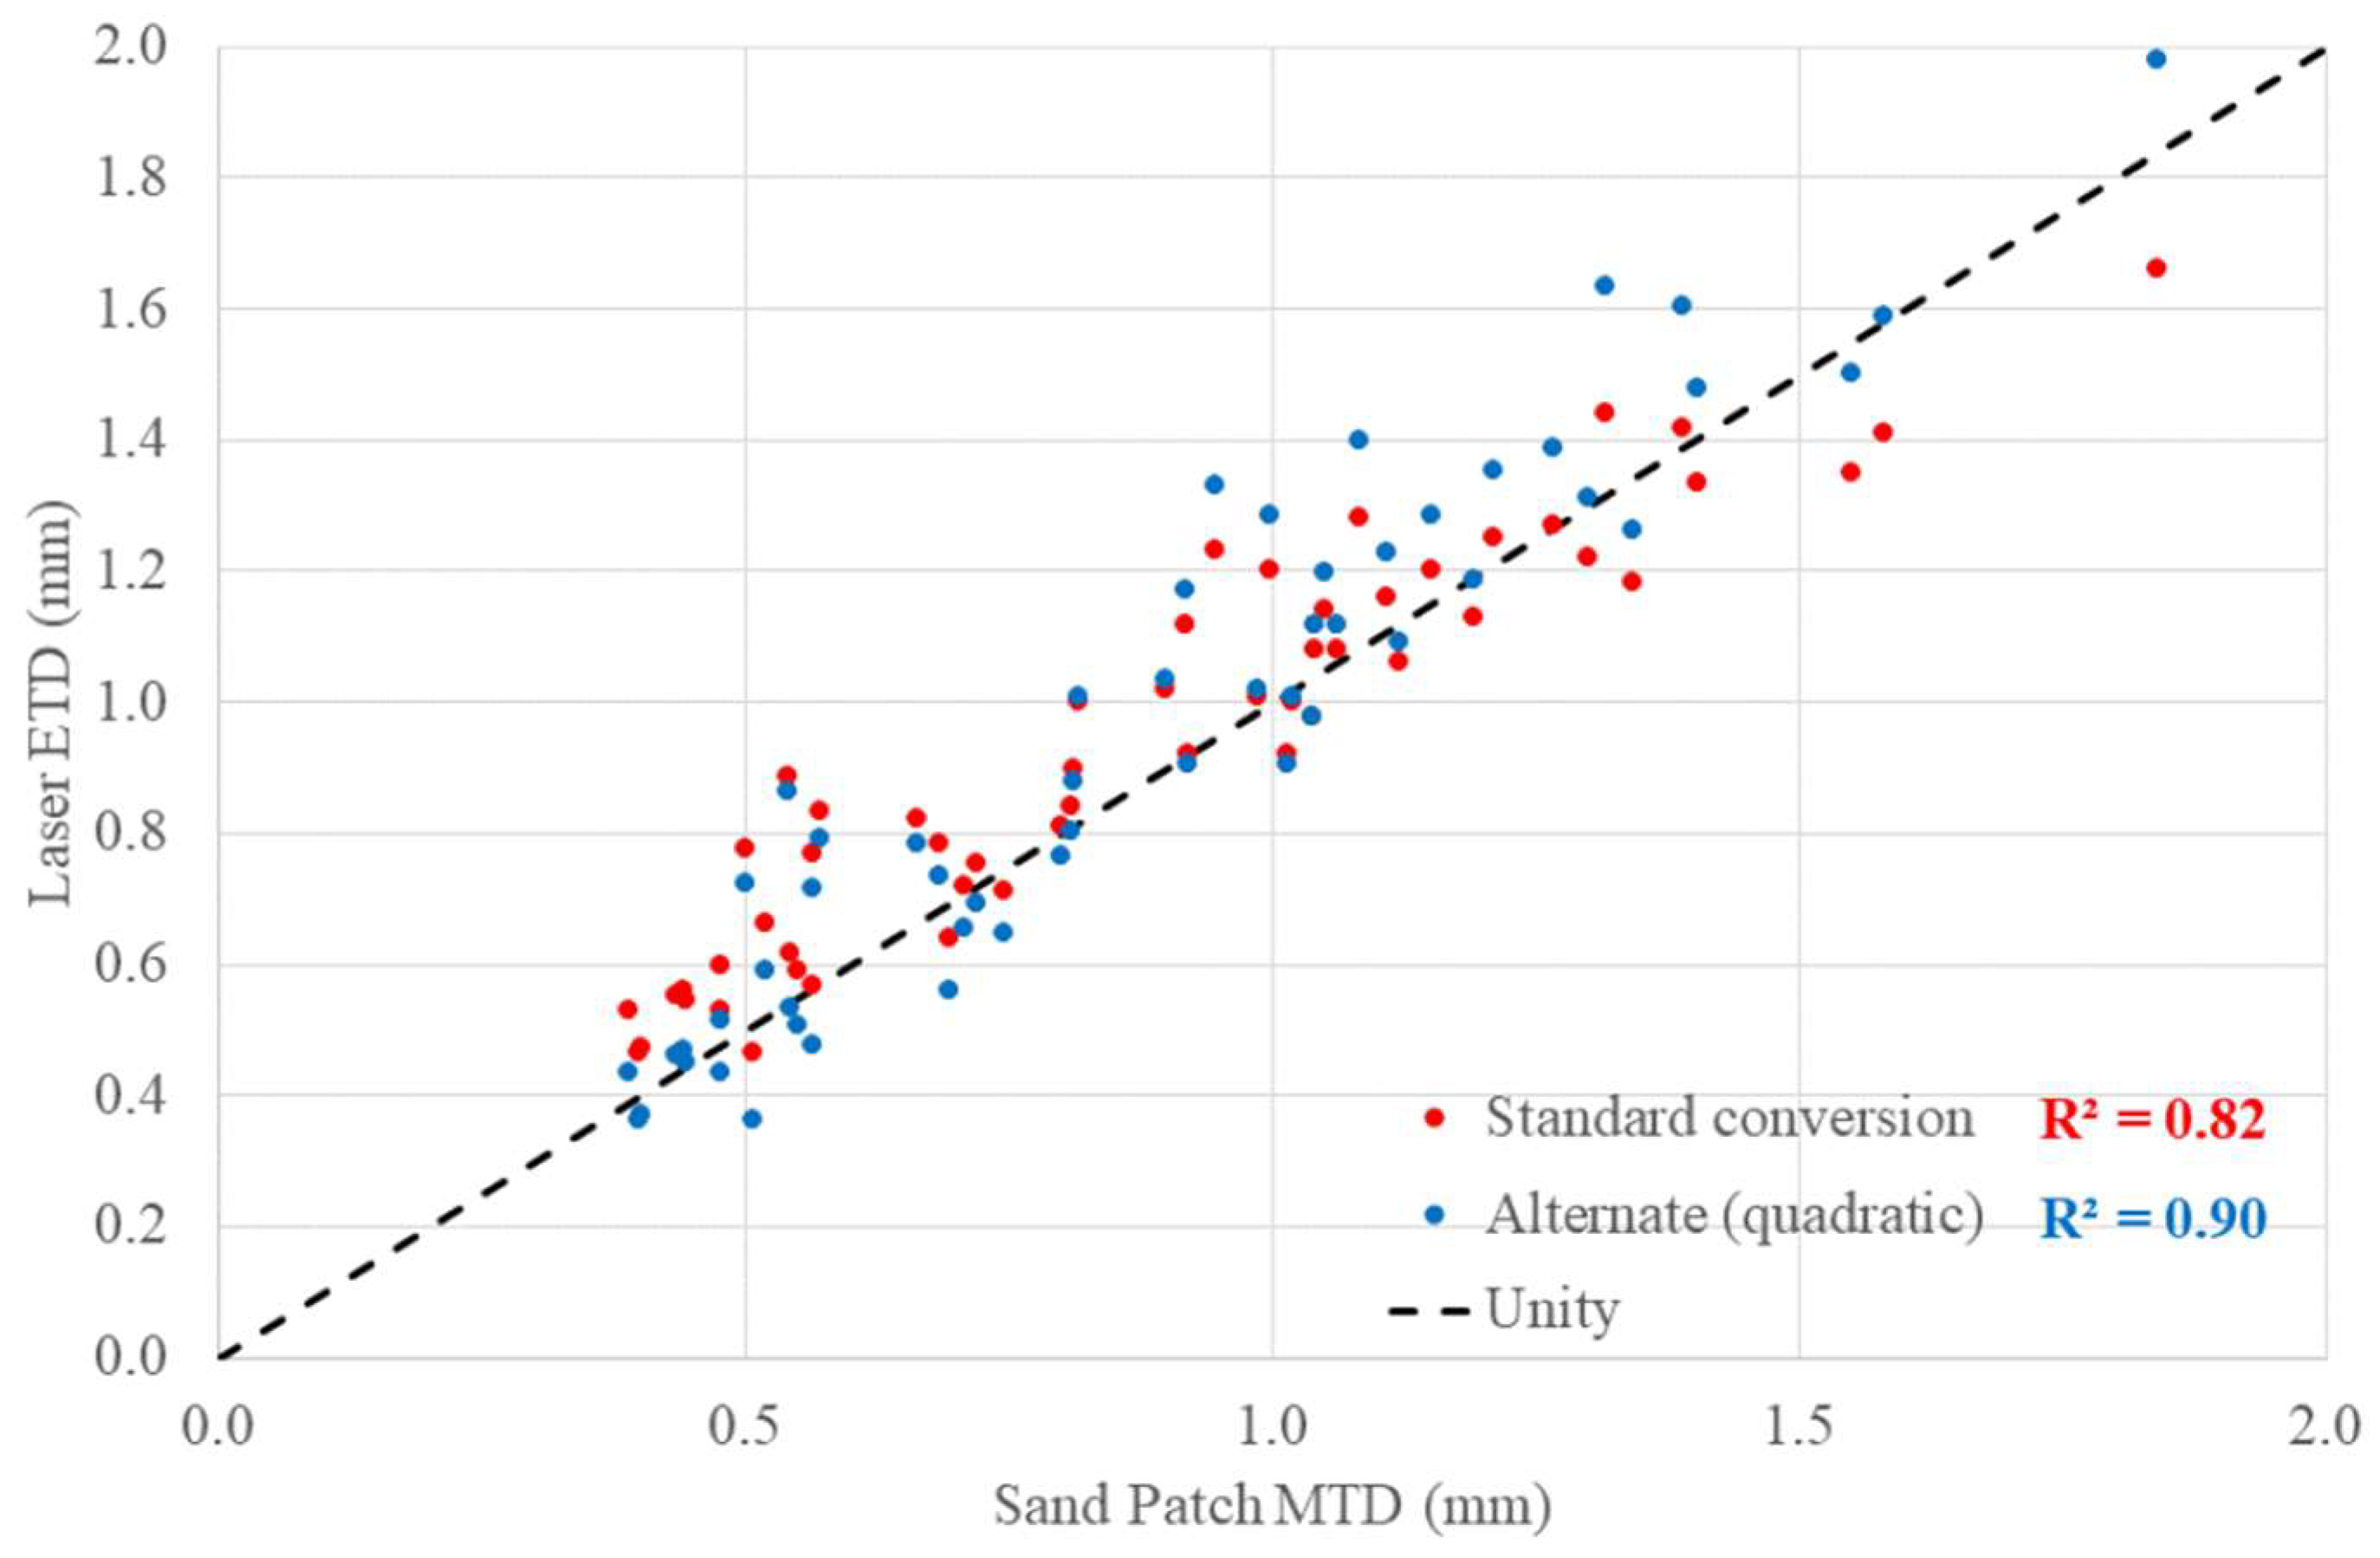
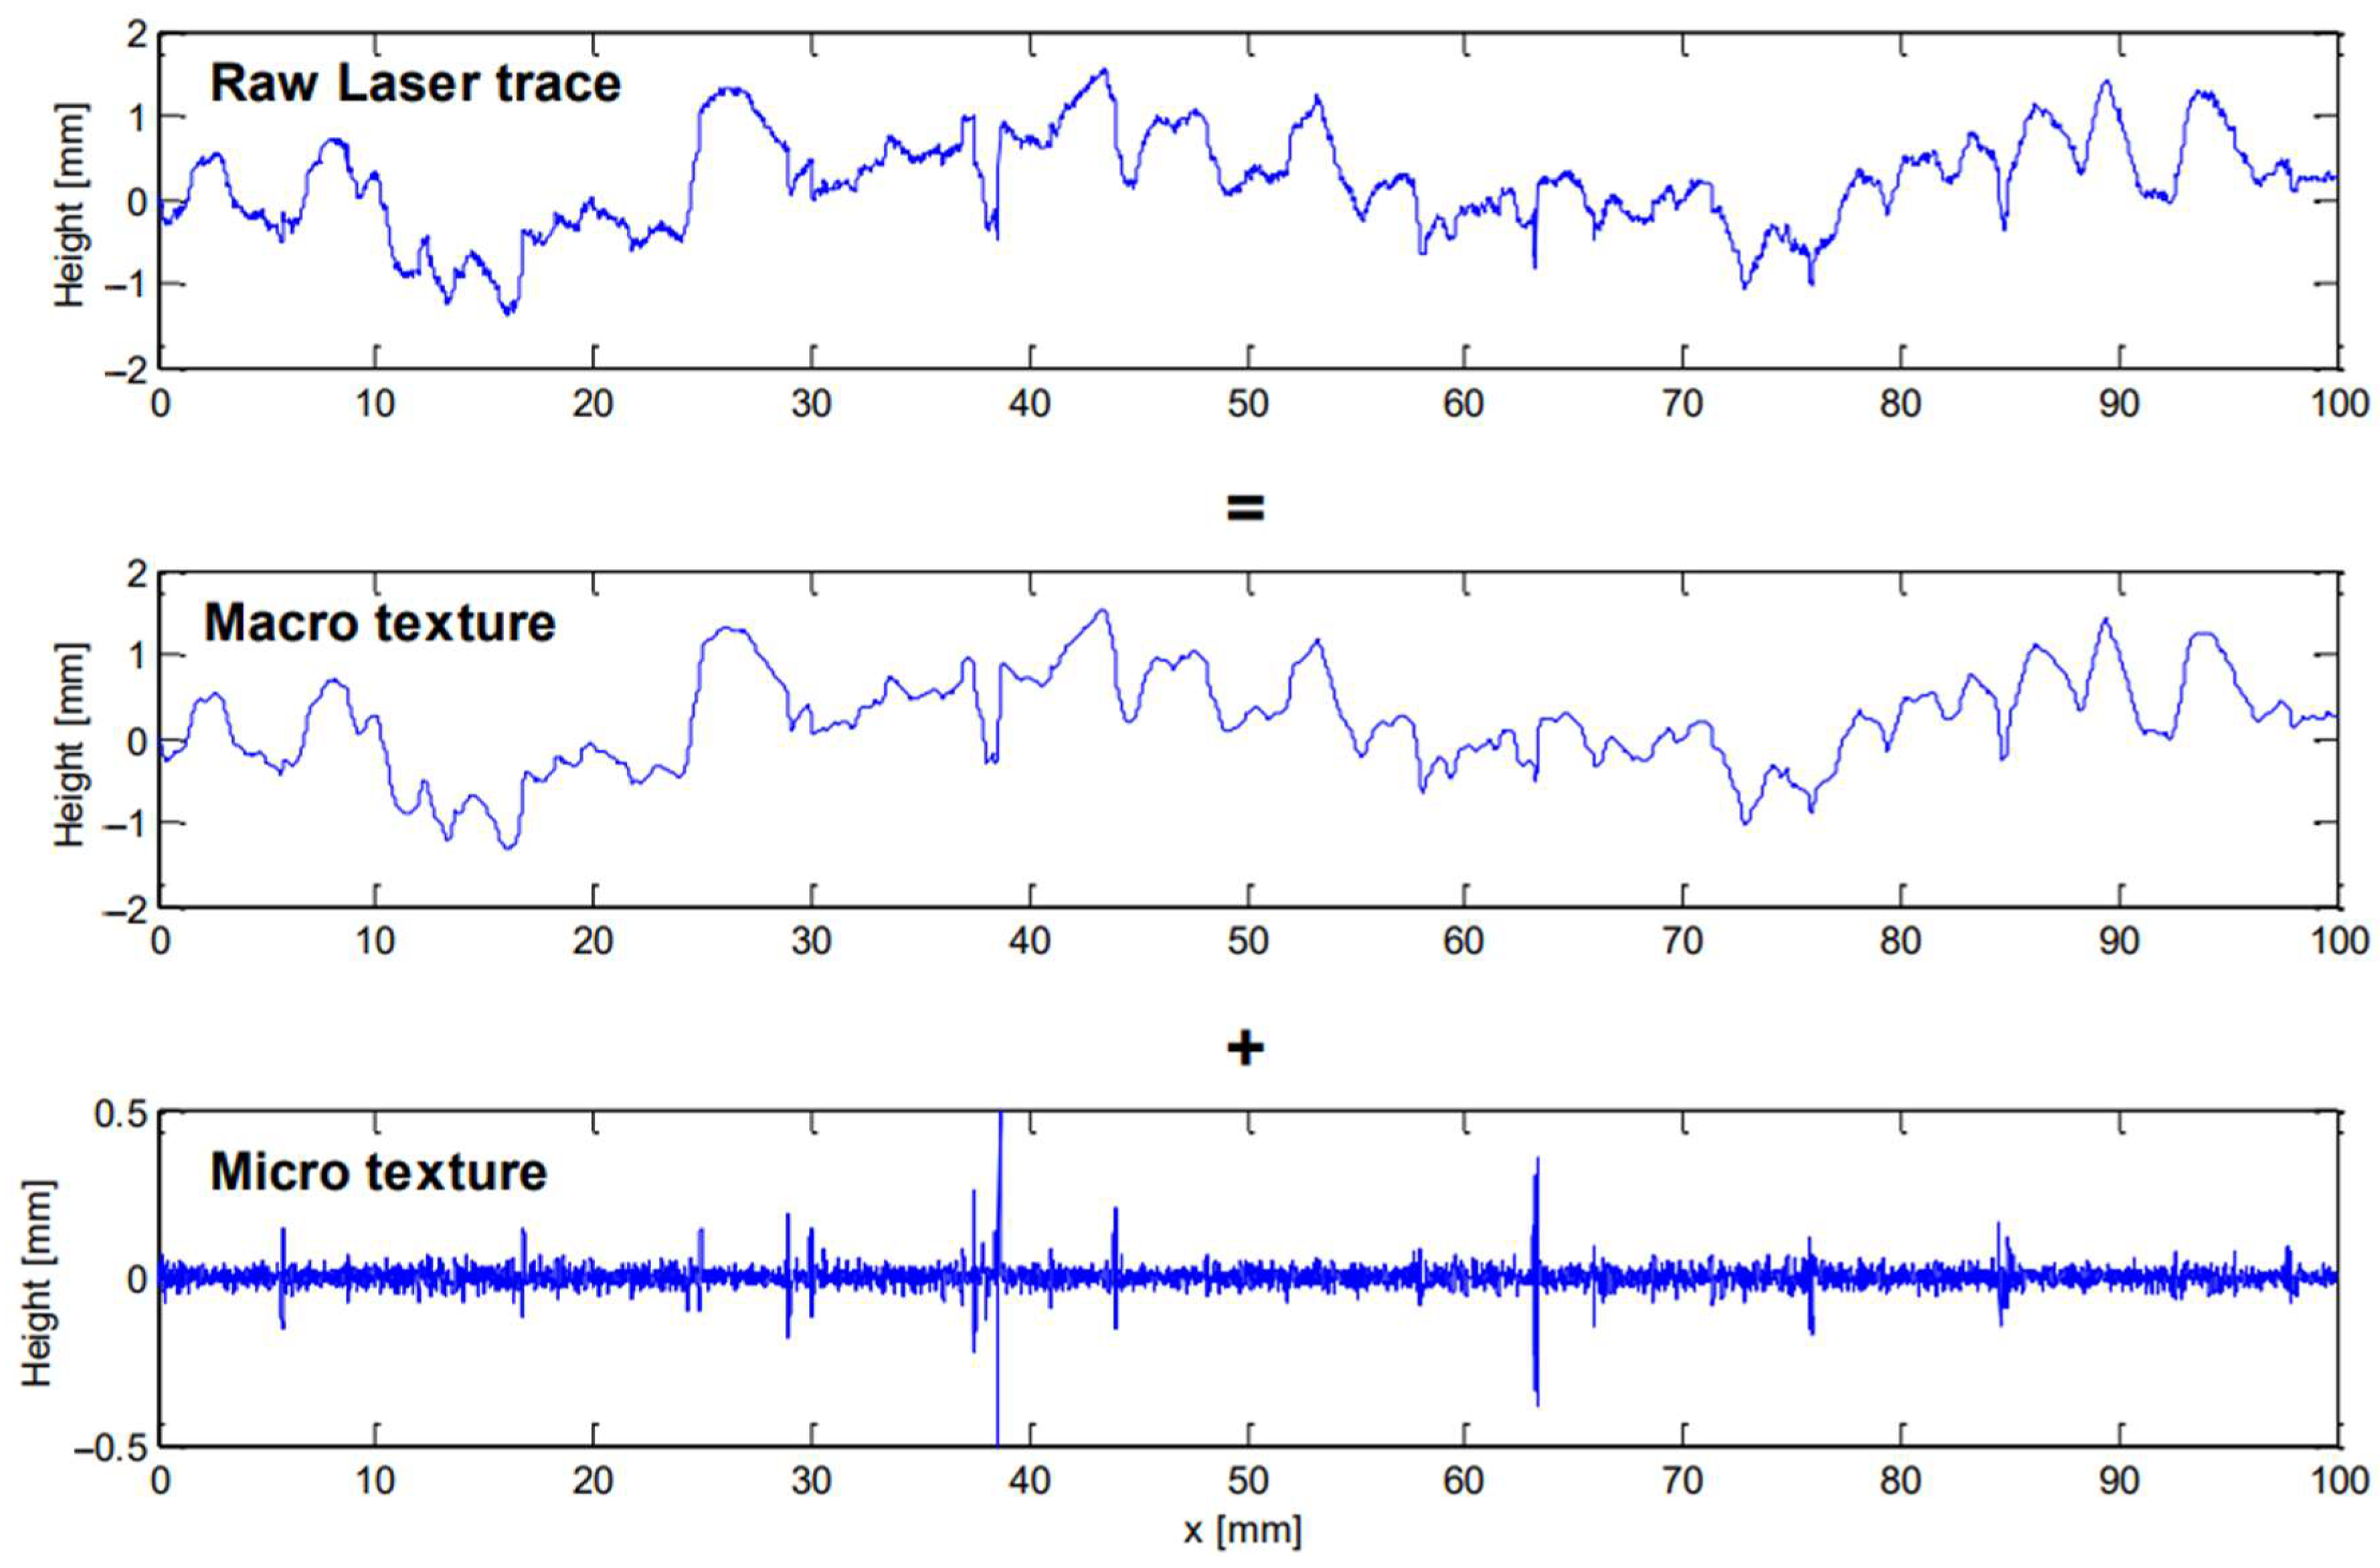
6.2.2. Non-Contact Methods
6.2.3. Microtexture Assessment Using Non-Contact Methods
6.2.4. Other Methods
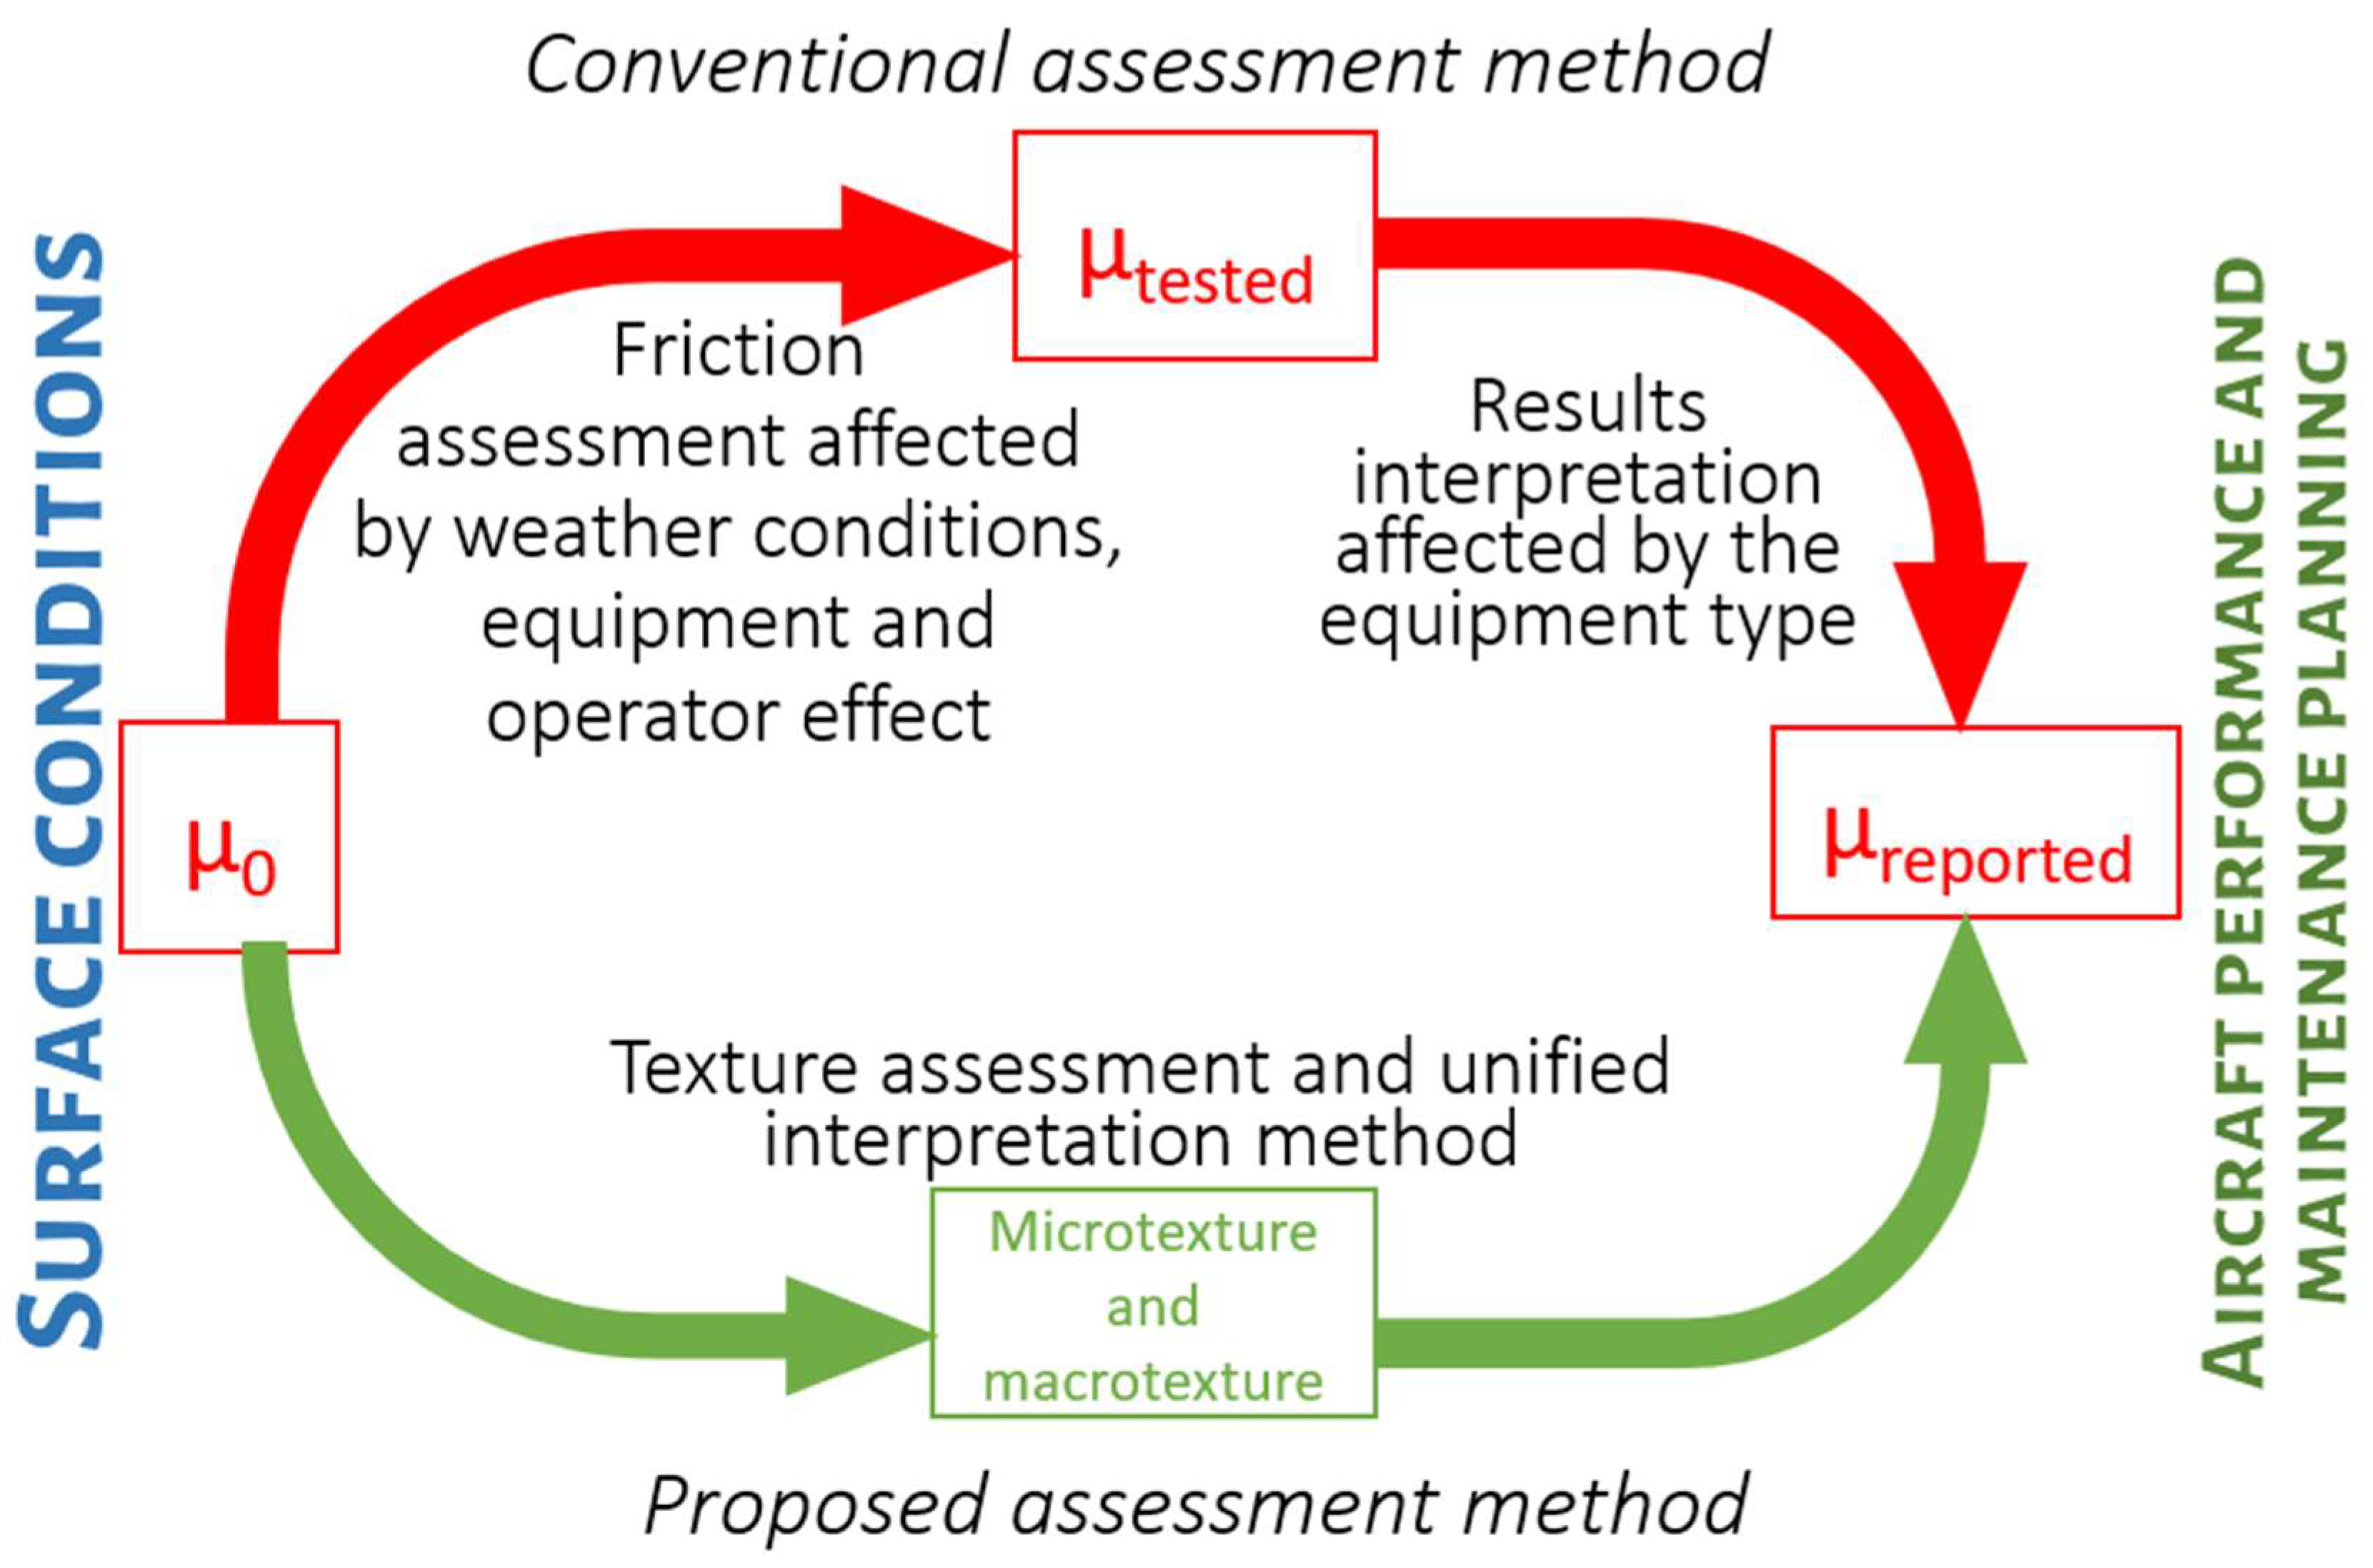
6.3. Interaction Between Surface Texture, Runway Friction and Aircraft Skid Resistance
6.4. Summary
7. Improvement of the Runway Management System
- There is no standard method or protocol for the determination of a characteristic value of macrotexture from multiple sand patch of other macrotexture measurements;
- There is no standard method or protocol for the determination of characteristic values of CFME wet friction from a CFME survey;
- The frequency of CFME surveys does not include a minimum frequency for regional airports with a low frequency of jet aircraft or airports with turboprop aircraft operations only, with many tested annually or when rubber contamination is visually identified;
- CFME-measured friction is significantly affected by temperature, meaning annual measurements are not necessarily representative of the annual cycle of friction;
- CFME measurements are not directly relatable to aircraft braking performance calculations because of the significant differences in vehicle speed, test wheel normal load and tire pressure of the CFME, compared to a typical aircraft;
- GRF does not allow adjustment of the RWYCC to intermediate friction levels;
- Microtexture is important, in combination with macrotexture, for aircraft skid resistance on wet runways, but microtexture is not routinely measured, due to historical equipment limitations, although new equipment and methods are now available, albeit some of these are time consuming and limited to laboratory use;
- Volumetric texture can be measured by contact methods (including deep pores and interconnected voids) and non-contact methods (excluding deep pores and interconnected voids) providing two important, but distinctly different, characteristics, making attempts to identify a universal conversion between the two impossible.
8. Conclusions
Author Contributions
Funding
Data Availability Statement
Conflicts of Interest
Appendix A

| Number | Occurrence Date | Location | Aircraft | Occurrence Category | Highest Injury Level | Summary | Reference |
|---|---|---|---|---|---|---|---|
| 1 | 6 April 2023 | Abrolhos Rat Island | GA-8 | Accident | None | During the landing, the aircraft floated significantly more than the pilot expected, with the aircraft touching down about 247 m beyond the threshold of a non-paved runway. The pilot recalled braking as soon as they touched down and then realized that the aircraft could not be stopped before the runway ended. The pilot overestimated the braking capability of the aircraft, probably due to fatigue. Overestimation of the braking capability of an aircraft on the pavement was not a contributing factor but increased the risk. | [176] |
| 2 | 26 December 2021 | East Wallabi Island | GA-8 | Serious Incident | None | During the flare, the aircraft floated more than the pilot expected and touched down near the parking area about midway along the non-paved runway (about 350 m from the end of the runway). After touchdown, the pilot followed the operator’s normal practice of retracting the flaps and then applied normal braking. As the aircraft approached the end of the runway, the pilot realized an overrun was imminent and applied maximum braking. Despite this, the aircraft overran the runway by about 15 m. Overestimation of the braking capability of an aircraft on the pavement was not a contributing factor but increased the risk. | [177] |
| 3 | 30 April 2014 | 13 km SW of Launceston | Cessna 172 | Accident | Minor | The pilot was performing a landing on the ground runway and estimated the landing distance to be 440 m. Despite the fact that it was sufficient for the aircraft, the surface did not provide the deceleration he had expected. The surface was dumped due to rain, as it had rained the previous day. | [178] |
| 4 | 19 February 2014 | Lilydale (ALA) | Beech A36 | Accident | None | During the landing, the approach was a bit unstable; however, the instructor suggested landing. The aircraft touched down about 200–300 m along the non-paved runway, and the aircraft did not decelerate after applying brakes. The wet runway did not provide sufficient braking performance, and the pilot underestimated the landing distance. | [179] |
| 5 | 26 October 2012 | Innamincka Township (ALA) | Piper PA-39 | Accident | None | During the landing, the aircraft touched down about a quarter of the way along the runway. A gravel runway with loose stones did not provide sufficient braking capability, which resulted in an overrun. | [180] |
| 6 | 25 July 2005 | Nhill | Piper PA-31-350 | Accident | Serious | During the take-off, the pilot experienced resistance to rearward movement of the control column of the aircraft and decided to abort take-off. However, despite the fact that this was an appropriate decision, the actual braking distance was longer, which resulted in an overrun. | [181] |
| 7 | 23 May 2022 | Chinchilla Airport | DHC-8 | Incident | None | The DHC-8 aircraft experienced one engine failure and was unable to use the engines for stopping assistance. The pilots estimated the landing distance on a wet runway to be appropriate; however, the anti-skid system failed, which resulted in reduced braking effectiveness. The pilots decided to use reverse thrust; as a result, aircraft veered off the narrow runway. | [49] |
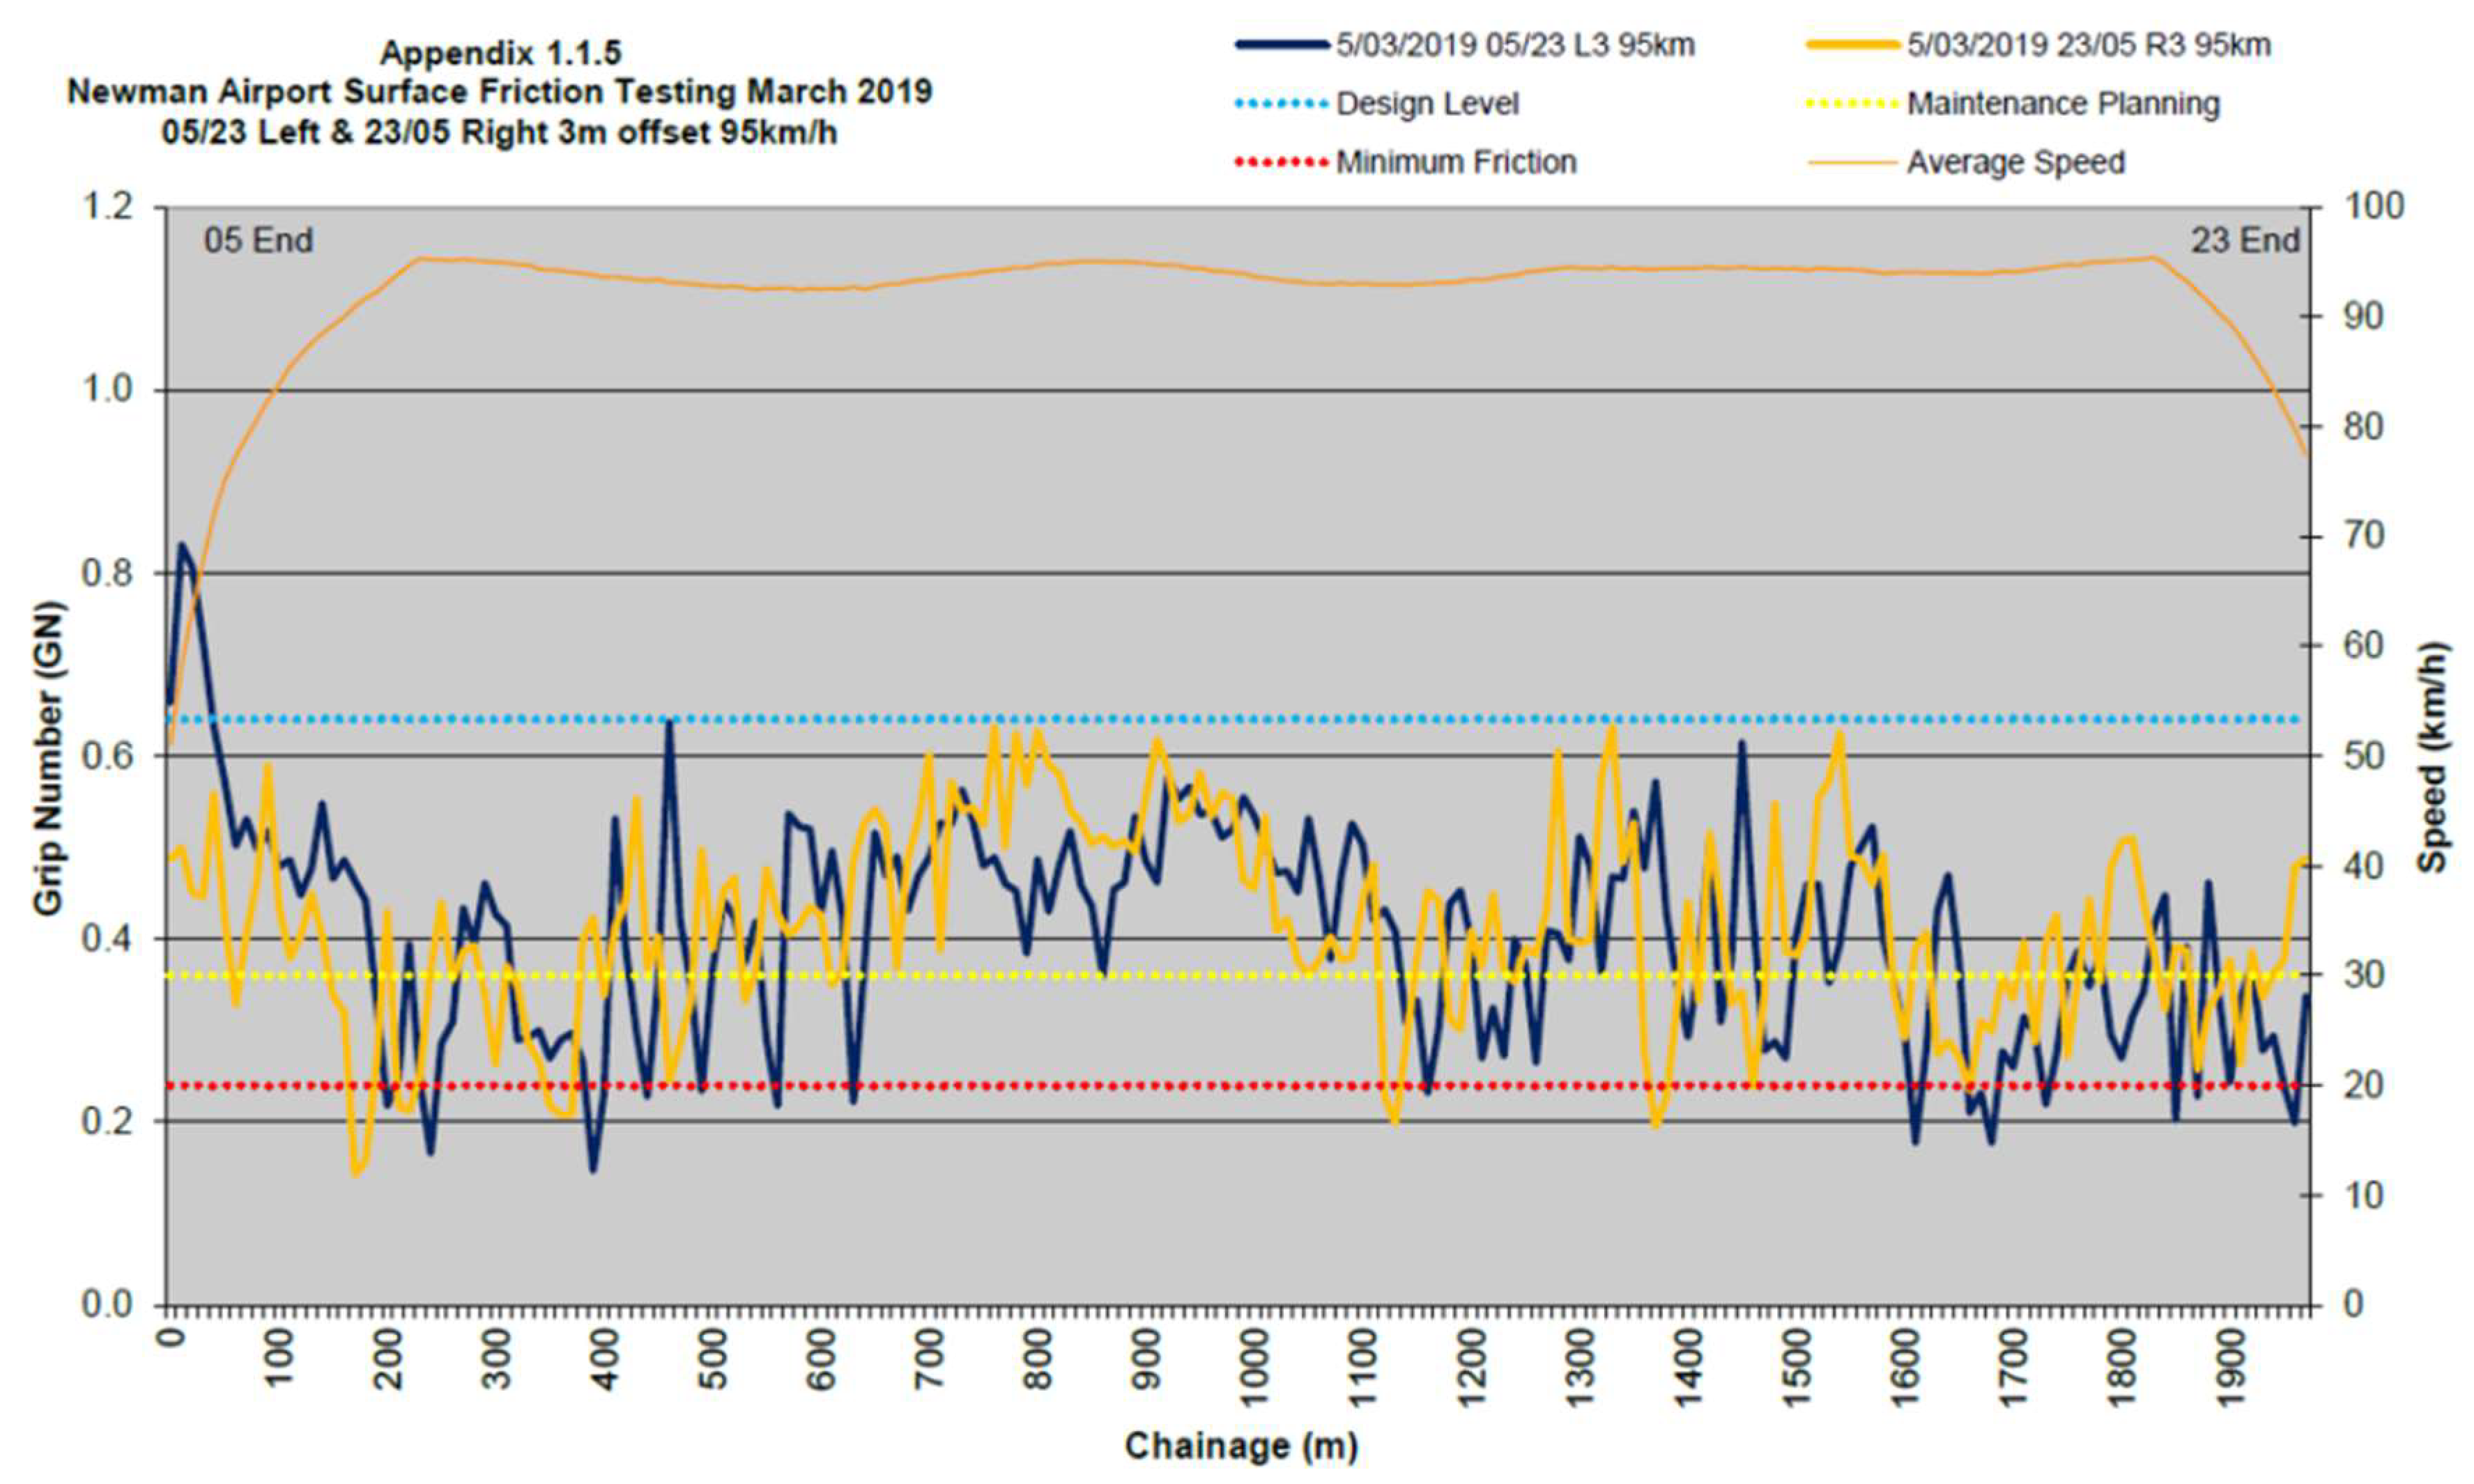
| 8 | 9 January 2020 | Newman Airport | Fokker F100 | Incident | None | During the normal landing on a paved runway in wet conditions, the aircraft experienced aquaplaning, which resulted in a runway overrun. CFME results obtained during the airport testing showed a low friction level below the maintenance level and partially below the minimum friction level. However, the friction level for 100 m averages is above the minimum level. | [54] |
| 9 | 23 January 2014 | Archerfield Airport | Fairchild SA226 | Serious Incident | None | During the landing in heavy rain, aircraft pilots attempted to stop the aircraft; however, due to aquaplaning, the aircraft veered off the runway, which resulted in the runway excursion. No information about the friction coefficient on the runway is available. | [182] |
| 10 | 24 November 2010 | Hobart Aerodrome | Boeing 737-8FE | Incident | None | During the normal landing in wet conditions, the aircraft experienced normal braking in the first half of the runway; however, in the last 1000 m of the runway, aircraft deceleration was low. During the inspection of the runway, rubber build-up was found. On the day of the incident, the crew of another aircraft also reported slipperiness on the runway. | [175] |
Appendix B
| No. | Occurrence Date | Location | Aircraft | Occurrence Category | Highest Injury Level | Summary |
|---|---|---|---|---|---|---|
| 1 | 18 October 2023 | Bandera, WA, USA | Cessna 172N | Accident | None | The pilot’s decision to land at a closed water-soaked grass runway which resulted in a runway excursion. |
| 2 | 12 January 2023 | Yelm, WA, USA | Beech 95-C55 | Accident | None | The pilot’s failure to attain a proper touchdown point during landing with a tailwind which resulted in a runway over run. Contributing to the accident was a wet runway. |
| 3 | 27 December 2022 | Hawthorne, CA, USA | Embraer EMB-505 | Accident | None | A runway overrun due to the pilot’s failure to stop the airplane as a result of diminished braking action due to a water-contaminated runway surface. |
| 4 | 29 November 2022 | Batesville, AR, USA | Learjet Inc. 45 | Accident | Minor | The crew’s failure to execute a go-around during the unstable approach and long landing which resulted in a runway excursion. |
| 5 | 9 September 2022 | San Diego, CA, USA | Gates Lear Jet Corp. 36 | Accident | Minor | A runway excursion due to hydroplaning on a contaminated runway. |
| 6 | 20 August 2022 | Donnelly, ID, USA | Cessna 182Q | Accident | None | The pilot’s improper decision to take-off from a wet grass runway which did not allow for adequate braking traction when the pilot aborted the take-off which resulted in a runway excursion. |
| 7 | 6 June 2022 | Nashville, AR, USA | Cirrus Design Corp. SR22 | Accident | None | The pilot was not able to stop the airplane on a wet runway due to hydroplaning. |
| 8 | 29 April 2022 | Portland, OR, USA | Cessna 180K | Accident | None | The pilot’s failure to maintain directional control during landing on a wet surface with a tailwind which resulted in a runway excursion. |
| 9 | 9 March 2022 | Pittsburgh, PA, USA | Honda Jet HA-420 | Accident | None | The flight crew’s continuation of an unstable approach which resulted in a long landing on a contaminated runway. Contributing to the outcome was the captain’s full application of the emergency brake which resulted in hydroplaning and a runway excursion. |
| 10 | 18 February 2022 | Detroit, MI, USA | Embraer EMB-500 | Accident | None | The pilot’s decision to land on the contaminated runway with previous reports of unfavorable braking action. |
| 11 | 7 February 2022 | Crane Island, WA, USA | Cessna T207 | Accident | None | The pilot’s failure to obtain a proper touch down location on a wet grass runway resulting in a runway overrun and impact with terrain. |
| 12 | 3 September 2022 | Naples, FL, USA | Raytheon 390 | Accident | None | The pilot was unable to stop the airplane during the landing on a damp runway. |
| 13 | 26 August 2021 | Banner Elk, NC, USA | Embraer EMB-505 | Accident | None | The pilot’s failure to achieve the approach criteria for the available runway landing distances published in the POH likely as a result of the steeper-than-normal approach and the required left turn on short final to avoid the terrain surrounding the airport. Contributing to the accident was a lower runway friction than that assumed by the airframe manufacturer and the tire cornering forces imparted during the landing roll which reduced the airplane’s reduced braking effectiveness which when combined with a high approach speed, increased the required stopping distance beyond the runway distance available. Also contributing to the accident was the operator’s lack of consideration of airport topography in its Destination Airport Analysis Program. |
| 14 | 24 June 2021 | St. Louis, MO, USA | Piper PA 46-350P | Accident | None | The pilot’s failure to maintain directional control during the landing roll with hydroplaning conditions. |
| 15 | 14 March 2021 | Port Aransas, TX, USA | Piper PA 46-350P | Accident | None | The pilot’s failure to maintain proper airspeed on approach and his attempt to land on a wet runway with insufficient runway remaining resulting in an overrun and loss of directional control. |
| 16 | 16 December 2020 | Jacksonville, FL, USA | Embraer EMB-500 | Accident | None | The flight crew’s failure to apply maximum braking immediately upon touchdown which resulted in a runway excursion. Contributing to the accident was (1) the slightly excessive airspeed approach and (2) the flight crew’s decision to land on a wet runway during heavy rain with little margin between the unfactored landing distance required and the landing distance available. |
| 17 | 13 December 2020 | Leadville, CO, USA | Eclipse EA 500 | Accident | None | The pilot’s failure to maintain proper control of the airplane which led to an unstabilized approach and a long landing on a runway contaminated with ice and patchy packed snow resulting in a runway excursion. |
| 18 | 2 December 2020 | Lufkin, TX, USA | Cessna 551 | Accident | None | The pilot’s decision to land on a runway that did not provide enough length to stop the airplane given the wet surface conditions resulting in a runway excursion. |
| 19 | 1 November 2020 | Fernandina Beach, FL, USA | Raytheon 400A | Accident | Minor | The flight crew’s improper decision to land with a tailwind on a wet runway which resulted in a runway overrun. Contributing to the accident was the co-pilot’s early retraction of the speed brakes and the pilot’s decision to turn off the anti-skid system. |
| 20 | 10 October 2020 | Yakataga, AK, USA | Douglas C54 | Accident | None | The pilots’ decision to land on a wet soft runway which resulted in the loss of braking action upon landing and a subsequent runway overrun and nose landing gear collapse. |
| 21 | 3 August 2020 | Kalispell, MT, USA | Cessna A185 | Accident | None | The pilot’s excessive speed while landing on a wet grass runway which resulted in a runway excursion and impact with a fence. |
| 22 | 15 July 2020 | Washington, NC, USA | Air Tractor AT502 | Accident | None | The pilot’s failure to maintain direction during landing on a wet grass runway. |
| 23 | 14 July 2020 | Fuquay Varina, NC, USA | Piper PA 22 | Accident | None | The pilot’s failure to attain a proper approach speed which resulted in an overrun of the wet grass runway. |
| 24 | 14 July 2020 | New Carlisle, OH, USA | Waco YKC | Accident | None | The pilot’s failure to maintain a proper approach speed and descent path to the runway which resulted in excessive speed at touchdown and insufficient runway remaining to safely bring the airplane to a stop before the end of the runway. Contributing to the accident was the airplane’s diminished braking due to the dew-covered grass runway condition. |
| 25 | 26 February 2020 | Farmingdale, NJ, USA | Learjet 55 | Accident | None | The flight crew’s failure to stop the airplane on the available runway which was wet and resulted in the airplane impacting a ditch. |
| 26 | 12 February 2020 | Broomfield, CO, USA | Piaggio P180 | Accident | None | The pilot’s loss of directional control on the snow-covered runway which resulted in a runway excursion. |
| 27 | 24 January 2020 | San Juan, PR, USA | Gulfstream 150 | Accident | None | The pilot’s loss of control during landing on a wet runway after encountering standing water. |
| 28 | 20 January 2020 | Sun River, OR, USA | Cessna 172 | Accident | None | The pilot’s failure to maintain directional control during the landing roll on a runway with icy patches which resulted in impact with a snowbank and a subsequent nose-over. |
| 29 | 4 January 2020 | Morristown, NJ, USA | Beech 200 | Accident | None | The airplane underwent hydroplaning while landing on a wet runway which degraded its braking capability and resulted in a runway overrun onto grass and mud and the nose landing gear collapsing. Contributing to the accident was the pilot’s improper decision to land the airplane until it was near the runway midpoint due to fog over the approach end of the runway. |
| 30 | 11 November 2019 | Chicago, IL, USA | Embraer EMB145 | Accident | None | The flight crew’s inability to maintain the airplane on the runway centerline after touchdown due to the reduced braking action resulting from the deteriorating weather conditions which caused the airplane’s departure from the runway surface. Contributing to the accident was the delay in performing the runway assessment for undetermined reasons and failure to close the runway. Also contributing to the accident was the controller’s failure to advise the accident flight crew that braking action was no longer consistent with the previously published notice to air mission which described braking action as good across all three runway zones. |
| 31 | 6 June 2019 | Weiner, AR, USA | Piper PA24 | Accident | None | The pilot’s failure to maintain directional control during the landing roll on a wet runway which resulted in a runway overrun and collision with a pole. |
| 32 | 4 June 2019 | Robertsdale, AL, USA | Cessna 182 | Accident | Minor | The pilot’s failure to obtain the proper touchdown point while landing on a wet turf runway which resulted in a runway overrun. |
| 33 | 3 May 2019 | Jacksonville, FL, USA | Boeing 737 | Accident | Minor | An extreme loss of braking friction due to heavy rain and the water depth on the ungrooved runway which resulted in viscous hydroplaning. Contributing to the accident was the operator’s inadequate guidance for evaluating runway braking conditions and conducting en route landing distance assessments. Contributing to the continuation of an unstabilized approach was (1) the captain’s plan continuation bias, increased workload due to the weather and performing check airman duties and (2) the first officer’s lack of experience. |
| 34 | 15 February 2019 | Montague, CA, USA | Cessna 402 | Accident | None | The pilot’s failure to maintain directional control while landing on a wet/icy runway. |
| 35 | 11 February 2019 | Richmond, IN, USA | Beech 400 | Accident | None | The flight crew’s decision to continue an unstable approach under conditions that exceeded the airplane’s landing performance capabilities which resulted in a runway overrun and impact with terrain. |
| 36 | 1 February 2019 | Appleton, MN, USA | Cessna 172 | Accident | None | The student pilot’s loss of directional control while landing on an ice-covered runway which resulted in a loss of directional control and his failure to attain sufficient airspeed during a subsequent aborted landing which resulted in a nose-over. |
| 37 | 6 December 2018 | Burbank, CA, USA | Boeing 737 | Incident | None | The flight crewmembers’ decision due to plan continuation bias to continue the approach despite indications of windshear and a higher-than-expected tailwind and the flight crew’s misperception of the airplane’s touchdown point which was farther down the runway than the crew assumed because of the faster-than-expected groundspeed. Contributing to the accident was Southwest Airlines’ lack of guidance to prompt flight crews to reassess operator-provided landing data when arrival weather conditions differ from those used in the original landing data calculation. |
| 38 | 10 August 2018 | Waynesville, OH, USA | Cessna U206 | Accident | None | The pilot’s inability to stop the airplane on the wet runway after an aborted go-around which resulted in a runway overrun and impact with terrain. |
| 39 | 3 August 2018 | Greenville, SC, USA | Beech 58 | Accident | None | The pilot’s failure to attain the proper touchdown point on a wet runway which resulted in insufficient runway remaining to safely stop the airplane. |
| 40 | 19 July 2018 | Oregon, WI, USA | Piper PA28 | Accident | None | The pilot’s improper decision to take off with a known brake malfunction which resulted in a collision with a barn during landing on a wet runway. |
| 41 | 20 May 2018 | Marlborough, MA, USA | Diamond DA 40 | Accident | None | The pilot’s improper decision to land on a runway that was too short for a safe landing and his subsequent failure to maintain directional control in tailwind conditions. |
| 42 | 6 May 2018 | Clarksville, TN, USA | Cessna182 | Accident | None | The pilot’s decision to land with a tailwind in variable crosswind and downdraft and updraft conditions on a wet runway which resulted in a runway overrun. |
| 43 | 5 May 2018 | Bayou La Batre, AL, USA | Yakovlev YAK 52 | Accident | None | The pilot’s improper planning for landing on a wet grass airstrip which resulted in a runway overrun. |
| 44 | 12 March 2018 | Madison, SD, USA | Cessna140 | Accident | None | The flight instructor’s delayed aborted take-off on a soft wet grass runway which resulted in a runway overrun. |
| 45 | 17 February 2018 | Mount Sterling, KY, USA | Cessna402 | Accident | None | The pilot’s failure to maintain directional control during the landing roll on a wet surface with reduced braking capability. |
| 46 | 4 February 2018 | Cleveland, OH, USA | Raytheon Aircraft Company 400A | Accident | None | The airplane’s reduced braking performance due to an ice-covered runway which resulted in a runway excursion. Contributing to the accident was the crew’s selection of a runway with a tailwind. |
| 47 | 27 December 2017 | Michigan City, IN, USA | Cessna 525A | Accident | Minor | The flight crew’s improper decision to land on a snow-covered runway that had insufficient runway distance for the airplane to land with the contamination which resulted in a runway overrun and impact with obstacles. |
| 48 | 16 November 2017 | Melborne, FL, USA | Piper PA 28R | Accident | None | The pilot’s loss of directional control during the landing roll on the wet runway with reduced braking capability. |
| 49 | 4 September 2017 | Lockwood, MO, USA | Cessna 182 | Accident | None | The pilot’s unstabilized approach and failure to go around which resulted in a runway overrun on a wet grass runway. |
| 50 | 23 July 2017 | Wichita Falls, TX, USA | Beech G35 | Accident | Serious | The flight’s encounter with adverse weather conditions at night which resulted in the pilot’s loss of airplane control upon landing due to standing water and a subsequent runway overrun. |
| 51 | 17 April 2017 | Indianola, IA, USA | Cheung David S Vans RV6 | Accident | None | The pilot’s failure to maintain an adequate approach path which resulted in a long landing and subsequent runway overrun. |
| 52 | 23 January 2017 | Durango, CO, USA | Beech C 99 | Accident | None | The pilot’s inability to maintain directional control during take-off in crosswind conditions on a contaminated runway which resulted in a runway excursion. |
| 53 | 16 January 2017 | Howell, MI, USA | Textron 525C | Accident | Serious | The pilot’s attempted landing on the ice-covered runway which resulted in a runway excursion and impact with terrain. Contributing to the accident was the airport personnel’s lack of training regarding issuance of NOTAMs. |
| 54 | 23 December 2016 | Warren, MN, USA | Cessna150 | Accident | None | The noncertificated pilot’s failure to maintain directional control during the landing which resulted in a runway excursion. |
| 55 | 4 October 2016 | Portsmouth, NH, USA | Chaudoin George S RV 10 | Accident | None | The pilot’s failure to go around after recognizing that the airplane was high and fast which resulted in a long landing on a wet runway and a runway excursion. |
| 56 | 22 September 2016 | San Juan, PR, USA | Learjet 25 | Accident | None | The pilot’s improper decision to land the airplane on a wet runway in heavy rain with tires worn beyond safe limits which resulted in a hydroplaning condition and subsequent loss of directional control. |
| 57 | 24 August 2016 | Fallbrook, CA, USA | Cessna 182 | Accident | Minor | The flight instructor’s failure to go-around and the subsequent long landing and his failure to maintain directional control which resulted in a runway excursion. |
| 58 | 26 July 2016 | Sugar Land, TX, USA | Embraer EMB-505 | Accident | Minor | The airplane’s hydroplaning during the landing roll which resulted in a runway excursion. Contributing to the accident was the pilot’s continuation of an unstabilized approach, his decision to land in heavy rain conditions and his improper use of the main and emergency brake systems. Also contributing was the air traffic controller’s failure to disseminate current airport weather conditions to the flight crew in a timely manner. |
| 59 | 21 July 2016 | Baldwin, WI, USA | Cessna 208B | Accident | None | The pilot’s decision to land the fully loaded parachutist drop airplane on a wet grass runway that had insufficient length for the landing in high temperature conditions which resulted in a runway overrun when a more suitable longer runway was available at a nearby airport. |
| 60 | 18 July 2016 | Lenoir, NC, USA | Aeronca 7AC | Accident | None | The pilot’s encounter with instrument meteorological conditions which resulted in an emergency descent through fog a runway overrun on a wet grass runway and a collision with a ditch and vegetation. Contributing to the accident was the pilot’s failure to obtain a weather briefing prior to the flight. |
| 61 | 2 July 2016 | Hungry Horse, MT, USA | Cessna 182 | Accident | Minor | The pilot’s decision to land on unsuitable wet terrain and his failure to stop prior to the end of the runway which resulted in a runway overrun and impact with tree(s). |
| 62 | 4 June 2016 | Williamstown, NJ, USA | Mooney M20C | Accident | None | The pilot’s landing area overshoot and failure to maintain surface speed and braking capability which resulted in a runway overrun and a collision with a fence. |
| 63 | 22 May 2016 | Griffin, GA, USA | Beech A36 | Accident | None | The pilot’s decision to land with a tailwind resulting in a runway overrun and collision with a highway road embankment. |
| 64 | 30 March 2016 | Frenchville, ME, USA | Beech C23 | Accident | None | The pilot’s failure to maintain directional control during the takeoff roll on a runway contaminated with ice and snow which resulted in a runway excursion and an impact with a snowbank. |
| 65 | 25 January 2016 | Lodi, CA, USA | Cessna 210 | Accident | None | The pilot’s failure to attain a proper touchdown point which led to a runway excursion. |
| 66 | 21 March 2015 | Woodstock, GA, USA | Piper PA-28-235 | Accident | None | The pilot’s failure to attain the proper touchdown point on the short, wet turf runway. Contributing to the accident was the pilot’s use of a high approach speed. |
| 67 | 5 January 2015 | Marquette, MI, USA | Cessna 172M | Accident | None | The pilot did not maintain directional control during takeoff on the snow- and ice-covered runway in gusting crosswind conditions. |
| 68 | 21 November 2014 | Sugarland, TX, USA | Embraer S.A. EMB-500 | Accident | None | The pilot’s engagement of the emergency parking brake during the landing roll which decreased the airplane’s braking performance and prevented it from stopping on the available runway. Contributing to the pilot’s decision to engage the emergency parking brake was the expectation of a faster rate of deceleration and considerably shorter wet runway landing distance provided by the airplane flight manual than that experienced by the crew upon touchdown and an actual wet runway friction level lower than the assumed runway fiction level used in the calculation of the stopping distances published in the airplane flight manual. |
| 69 | 20 November 2014 | San Antonio, TX, USA | Beech 58P | Accident | Minor | The pilot’s improper decision to land long (past the midpoint) on a wet runway and his failure to conduct a go-around when the airplane did not touch down at the approach end of the runway which resulted in an overrun. |
| 70 | 16 November 2014 | New Buffalo, MN, USA | Cessna 150L | Accident | None | The student pilot’s failure to maintain directional control and the flight instructor’s delayed remedial action during landing. Contributing was the snow on the runway surface. |
| 71 | 26 October 2024 | Monument, OR, USA | Cessna TU206G | Accident | None | The loss of braking action during the landing roll on a gravel runway for reasons that could not be determined based on the available information. |
| 72 | 19 September 2014 | Leesburg, FL, USA | Cessna 172M | Accident | None | The flight instructor’s delayed remedial action and his subsequent loss of directional control during landing on a wet runway for reasons that could not be determined because post-accident examination of the airplane revealed no anomalies. |
| 73 | 19 September 2014 | Conroe, TX, USA | Embraer EMB 505 | Accident | None | The second-in-command’s (SIC) engagement of the emergency parking brake (EPB) which decreased the airplane’s braking performance and prevented it from stopping on the available runway. Contributing to the SIC’s decision to engage the EPB was the lower-than-anticipated deceleration due to a wet-runway friction level that was far lower than the levels used to determine the wet-runway stopping distances in the Airplane Flight Manual (AFM) and it necessitated a landing distance considerably greater than that published in the AFM. |
| 74 | 13 September 2014 | Gaithersburg, MD, USA | Cessna T210N | Accident | None | The pilot’s failure to execute a missed approach after recognizing that the airplane was not aligned with the wet runway which resulted in a long landing with a tailwind and a subsequent runway overrun. |
| 75 | 21 May 2014 | Elkton, MD, USA | Cessna 182 | Accident | None | The pilot’s failure to attain the proper touchdown point during a no-flap landing to a wet down-sloping runway and the airplane’s dynamic hydroplaning after touchdown which resulted in a runway overrun. Contributing to the accident was a total loss of electrical power due to an alternator failure. |
References
- Elkhazindar, A.; Hafez, M.; Ksaibati, K. Incorporating Pavement Friction Management into Pavement Asset Management Systems: State Department of Transportation Experience. CivilEng 2022, 3, 541–561. [Google Scholar] [CrossRef]
- White, G. Comparison of Bituminous Surface Options for Regional Airport Runway Pavements. In Bituminous Mixtures and Pavements VIII; CRC Press: London, UK, 2024; pp. 355–363. [Google Scholar]
- Pasindu, H.R.; Fwa, T.; Ping Ong, G. Analytical Evaluation of Beneficial Effects of Runway Pavement Grooving on Aircraft Braking Distance. In Proceedings of the Transportation Research Board 91st Annual Meeting; Transportation Research Board: Washington, DC, USA, 2011. [Google Scholar]
- White, G.; Anstee, H. Challenges for the Compaction and Proving of Granular Fills and Layers in Airport Pavements. In Road and Airfield Pavement Technology: Proceedings of 12th International Conference on Road and Airfield Pavement Technology, 2021; Springer International Publishing: Cham, Switzerland, 2022; pp. 99–112. [Google Scholar]
- White, G. Managing the Impact of More Demanding Aircraf. In Proceedings of the 10th International Conference on the Bearing Capacity of Roads, Railways and Airfields, Athens, Greece, 28 June 2017; pp. 1–9. [Google Scholar]
- Pasindu, H.R. Analytical Evaluation of Impact of Groove Deterioration on Runway Frictional Performance. Transp. Res. Procedia 2020, 48, 3814–3823. [Google Scholar] [CrossRef]
- ICAO. Annex 14—Aerodromes—Volume I—Aerodromes Design and Operations; ICAO: Montreal, QC, Canada, 2022; pp. 1–352. [Google Scholar]
- Fwa, T.F.; Chan, W.T.; Lim, C.T. Decision Framework for Pavement Friction Management of Airport Runways. J. Transp. Eng. 1997, 123, 429–435. [Google Scholar] [CrossRef]
- Bylica, A.; Pashkevich, A. Introduction of Global Reporting Format: Summary of the First Winter Season in Poland. Sustainability 2023, 15, 167. [Google Scholar] [CrossRef]
- Wetmore, J.W. The Rolling Resistance of Several Airplane Wheels and Tires and The Effect of Rolling Resistance on Take-Off; US Government Printing Office: Washington, DC, USA, 1937.
- Mataei, B.; Zakeri, H.; Zahedi, M.; Nejad, F.M. Pavement Friction and Skid Resistance Measurement Methods: A Literature Review. Open J. Civ. Eng. 2016, 06, 537–565. [Google Scholar] [CrossRef]
- Zavershinskiy, V.V. Method for Determining the Actual Coefficient of Rolling Friction When an Aircraft Moves along a Runway Using Flight Information Data. Nauzhniy Vestn. MGTU GA 2009, 149, 62–68. [Google Scholar]
- Nakajima, Y. Rolling Resistance of Tires. In Advanced Tire Mechanics; Springer Singapore: Singapore, 2019; pp. 931–1017. [Google Scholar]
- Ding, Y.; Wang, H.; Qian, J.; Zhou, H. Evaluation of Tire Rolling Resistance from Tire-Deformable Pavement Interaction Modeling. J. Transp. Eng. Part B Pavements 2021, 147, 04021041. [Google Scholar] [CrossRef]
- Zhu, C.; Yan, J. Experimental Investigation on Rolling Resistance and Temperature of the Heavy-Duty Vehicle Tires. SAE Tech. Paper 2023. [Google Scholar] [CrossRef]
- Levesque, W.; Bégin-Drolet, A.; Lépine, J. Effects of Pavement Characteristics on Rolling Resistance of Heavy Vehicles: A Literature Review. Transp. Res. Rec. J. Transp. Res. Board 2023, 2677, 296–309. [Google Scholar] [CrossRef]
- Van Es, G. Method for Predicting the Rolling Resistance of Aircraft Tires in Dry Snow. J. Aircr. 1999, 36, 762–768. [Google Scholar] [CrossRef]
- McCallum, A.B.; White, G. Estimating Bearing Capacity of Polar Snow Using the Cone Penetration Test (CPT). In Cone Penetration Testing 2022; CRC Press: London, UK, 2022; pp. 1010–1015. [Google Scholar]
- Pytka, J.A. Identification of Rolling Resistance Coefficients for Aircraft Tires on Unsurfaced Airfields. J. Aircr. 2014, 51, 353–360. [Google Scholar] [CrossRef]
- Tiwari, A.; Tolpekina, T.; van Benthem, H.; Gunnewiek, M.K.; Persson, B.N.J. Rubber Adhesion and Friction: Role of Surface Energy and Contamination Films. Front. Mech. Eng. 2021, 6, 620233. [Google Scholar] [CrossRef]
- Ueckermann, A.; Wang, D.; Oeser, M.; Steinauer, B. Calculation of Skid Resistance from Texture Measurements. J. Traffic Transp. Eng. 2015, 2, 3–16. [Google Scholar] [CrossRef]
- Persson, B.N.J. Theory of Rubber Friction and Contact Mechanics. J. Chem. Phys. 2001, 115, 3840–3861. [Google Scholar] [CrossRef]
- Vilsan, A.; Sandu, C. Hydroplaning of Tires: A Review of Numerical Modeling and Novel Sensing Methods. J. Auton. Veh. Syst. 2023, 3, 031001. [Google Scholar]
- Moore, D.F. A Theory of Viscous Hydroplaning. Int. J. Mech. Sci. 1967, 9, 797–810. [Google Scholar] [CrossRef]
- Van Es, G. How to Assess Runway Micro Texture in Overruns on Wet Runways? In Proceedings of the ISASI 2021 Annual Seminar, Virtual, 3 August–2 September 2021. [Google Scholar]
- Meethum, P.; Suvanjumrad, C. Numerical Study of Dynamic Hydroplaning Effects on Motorcycle Tires. Int. J. Automot. Mech. Eng. 2023, 20, 10192–10210. [Google Scholar] [CrossRef]
- Ong, G.P.; Fwa, T.F. Transverse Pavement Grooving against Hydroplaning. I: Simulation Model. J. Transp. Eng. 2006, 132, 441–448. [Google Scholar] [CrossRef]
- Jiang, B.; Chen, X.; Wang, H. Computational Analysis of Skid Resistance of Aircraft Tire on Wet Runway Pavement with Different Groove Depths. Road Mater. Pavement Des. 2023, 24, 1651–1668. [Google Scholar] [CrossRef]
- Liu, Y.; Chu, L.; Peng, J.; Fwa, T.F. Critical Groove Depth and Width for Maintenance Management of Runway Pavements. Int. J. Pavement Eng. 2023, 24, 2052875. [Google Scholar] [CrossRef]
- FAA. Measurement, Construction, and Maintenance of Skid Resistant Airport Pavement Surfaces; Advisory Circular 150/5320-12C; Federal Aviation Administration: Washington, DC, USA, 1997; pp. 1–69.
- Kumar, A.; Fwa, T.F.; Kumar, S.S. Analyzing Effect of Tire Groove Patterns on Hydroplaning Speed. J. East. Asia Soc. Transp. Stud. 2009, 8, 2018–2031. [Google Scholar]
- Ong, G.P.; Fwa, T.F. Effectiveness of Transverse and Longitudinal Pavement Grooving in Wet-Skidding Control. Transp. Res. Rec. J. Transp. Res. Board 2007, 2005, 172–182. [Google Scholar] [CrossRef]
- Leland, T.J.W.; Taylor, G.R. Effects of Tread Wear on the Wet Runway Braking Effectiveness of Aircraft Tires. J. Aircr. 1965, 2, 72–78. [Google Scholar] [CrossRef]
- ICAO. Doc 9137 AN/898. Airport Services Manual. Part 2. Pavement Surface Conditions; ICAO: Montreal, QC, Canada, 2002; pp. 1–174. [Google Scholar]
- Horne, W.B. Elements Affecting Runway Traction. SAE Trans. 1974, 83, 1886–1898. [Google Scholar]
- Horne, W.B.; Joiner, U. Determining Causation of Aircraft Skidding Accidents or Incidents. In Proceedings of the 23rd Annual International Air Safety Seminar, Washington, DC, USA, 19–20 April 1970. [Google Scholar]
- Kumar, S.S.; Anupam, K.; Scarpas, T.; Kasbergen, C. Study of Hydroplaning Risk on Rolling and Sliding Passenger Car. Procedia Soc. Behav. Sci. 2012, 53, 1019–1027. [Google Scholar] [CrossRef]
- Xiao, K.; Hui, B.; Qu, X.; Wang, H.; Diab, A.; Cao, M. Asphalt Pavement Water Film Thickness Detection and Prediction Model: A Review. J. Traffic Transp. Eng. 2023, 10, 349–367. [Google Scholar] [CrossRef]
- Lottes, S.; Sitek, M.; Sinha, N. Computational Analysis of Water Film Thickness During Rain Events for Assessing Hydroplaning Risk, Part 1: Nearly Smooth Road Surfaces; U.S. Department of Energy (DOE): Argonne, IL, USA, 2020; pp. 1–59.
- Moore, D.F. Prediction of Skid-Resistance Gradient and Drainage Characteristics for Pavements. Highw. Res. Rec. 1966, 131, 181–203. [Google Scholar]
- Thomas, P.; Turner, M.S. Flying Lessons for August 4. 2011. Available online: https://www.faasafety.gov/files/gslac/library/documents/2011/Sep/57624/110804%20FLYING%20LESSONS.pdf (accessed on 12 September 2024).
- Machado, F.M.; Martinez, C.E.B. Investigating Runway Overruns—A Manufacturer’s Perspective. In Proceedings of the International Society of Air Safety Investigators (ISASI), Vancouver, BC, Canada, 11–13 November 2013; International Society of Air Safety Investigators (ISASI) Technical Papers. pp. 1–22. [Google Scholar]
- Nybakken, G.H.; Staples, R.J.; Clark, S.K. Laboratory Experiments on Reverted Rubber Friction; NASA: Washington, DC, USA, 1969.
- Horne, W.B.; Yager, T.J.; Taylor, G.R. Review of Causes and Alleviation of Low Tire Traction on Wet Runways; Langley Research Center: Hampton, VA, USA, 1968. [Google Scholar]
- Horne, W.B. Status of Runway Slipperiness Research. In Proceedings of the Second International Skid Prevention Conference, Columbus, OH, USA, 2–6 May 1977; pp. 95–121. [Google Scholar]
- German Federal Bureau of Aircraft Accident. Investigation Report EX006-0/05. German Federal Bureau of Aircraft Accidents: Braunschweig, Germany, 2007; pp. 1–13. [Google Scholar]
- Accident Investigation Board Norway. Report on Aircraft Accident on 10 October at Stord Airport, Sørstokken (Enso) Norway Involving a BAE 146-200, OY-CRG, Operated by Atlantic Airways. Accident Investigation Board Norway: Lillestrøm, Norway, 2012; pp. 1–151. [Google Scholar]
- Van Es, G. Aircraft Tyre Hydroplaning and How to Analyse It in Runway Excursion Events. In Proceedings of the ISASI 2018 Seminar, Dubai, United Arab Emirates, 30 October–1 November 2018; pp. 1–18. [Google Scholar]
- ATSB. Runway Excursion Involving De Havilland Canada DHC-8, VH-QQB at Chinchilla Airport, Queensland on 23 May 2022; ATSB: Canberra, Australia, 2023.
- IATA. Runway Safety Accident Analysis Report 2010–2014; IATA: Montreal, QC, Canada, 2015. [Google Scholar]
- Distefano, N.; Leonardi, S. Investigation of the Causes of Runway Excursions. In Proceedings of the Proceedings of the AIIT International Congress on Transport Infrastructure and Systems (TIS 2017), Rome, Italy, 10–12 April 2017; pp. 127–134. [Google Scholar]
- Winter, S.R.; Leib, S.M.; Geske, R.C.; Spence, T.B.; Lauren, A.S.; Rudary, L.; Cestary, C.D. Comparing Runway Excursion Factors. In Proceedings of the 66th Annual International Air Safety Summit, Washington DC, USA, 29–31 October 2013; pp. 138–156. [Google Scholar]
- ATSB. Aviation Investigations. Available online: https://www.atsb.gov.au/aviation-investigation-reports (accessed on 16 April 2024).
- ATSB. Runway Overrun Involving Fokker 100, VH-NHY Newman Airport, Western Australia, on 9 January 2020; ATSB: Canberra, Australia, 2021.
- NTSB. Investigation Reports. Available online: https://www.ntsb.gov/investigations/AccidentReports/Pages/Reports.aspx (accessed on 28 June 2024).
- Wang, L.; Wu, C.; Sun, R. Pilot Operating Characteristics Analysis of Long Landing Based on Flight QAR Data. In Engineering Psychology and Cognitive Ergonomics. Applications and Services. EPCE 2013. Lecture Notes in Computer Science 2013; Springer: Berlin/Heidelberg, Germany, 2013; pp. 157–166. [Google Scholar] [CrossRef]
- NOAA. Climate Data Online. Available online: https://www.ncdc.noaa.gov/cdo-web/ (accessed on 5 July 2024).
- Si, Q.; Zhao, Y.; Li, J.; Wang, H.; Zhai, K. Risk Cause Analysis of Runway Excursion Accidents in the Aircraft Landing Stage through Integrated FTA-BN Method. J. Eng. Sci. Technol. Rev. 2024, 17, 178–186. [Google Scholar] [CrossRef]
- Ketabdari, M.; Toraldo, E.; Crispino, M. Numerical Risk Analyses of the Impact of Meteorological Conditions on Probability of Airport Runway Excursion Accidents. In Proceedings of the 20th International Conference on Computational Science and Its Applications, Cagliari, Italy, 1–4 July 2020; pp. 177–190. [Google Scholar]
- Càmara, P.F. Runway Excursion Risk Assessment Diagram. In Proceedings of the International Air Safety Seminar Proceedings, Singapore, 1–3 November 2011; pp. 131–169. [Google Scholar]
- Barry, D.J. Estimating Runway Veer-off Risk Using a Bayesian Network with Flight Data. Transp. Res. Part C Emerg. Technol. 2021, 128, 103180. [Google Scholar] [CrossRef]
- Safety Management Specialties. Report on the Design and Analysis of a Runway Excursions Database; Safety Management Specialties: Hillsboro, OR, USA, 2009; pp. 1–93. [Google Scholar]
- Vorobjev, V.V.; Kharlamov, A.S.; Ianchugin, S.J.; Ganiev, S.F. Influence Of Surface Condition Of Taxiways And Runways On Time Of Aircraft Departure. Civ. Aviat. High Technol. 2019, 22, 8–15. [Google Scholar] [CrossRef]
- ICAO. ICAO E-Library. Available online: https://elibrary.icao.int/home (accessed on 10 September 2024).
- ICAO. Airport Services Manual—Part VIII—Airport Operational Services (Doc 9137-P8); ICAO: Montreal, QC, Canada, 1983; pp. 1–64. [Google Scholar]
- ICAO. Procedures for Air Navigation Services—Aerodromes (Doc 9981); ICAO: Montreal, QC, Canada, 2020; pp. 1–268. [Google Scholar]
- ICAO. Manual on Certification of Aerodromes (Doc 9774); ICAO: Montreal, QC, Canada, 2001; pp. 1–48. [Google Scholar]
- ICAO. Assessment, Measurement and Reporting of Runway Surface Conditions (CIR 355); ICAO: Montreal, QC, Canada, 2019; pp. 1–110. [Google Scholar]
- Niu, Y.; Jiang, X.; Meng, F.; Wang, R.; Ju, G.; Zhang, S.; Meng, Z. Techniques and Methods for Runway Friction Measurement: A Review of State of the Art. IEEE Trans. Instrum. Meas. 2021, 70, 1–17. [Google Scholar] [CrossRef]
- Cenek, P.D.; Alabaster, D.J.; Davies, R.B. Seasonal and Weather Normalisation of Skid Resistance Measurements; Transfund New Zealand: Wellington, New Zealand, 1999; pp. 1–103.
- CAA. AC 139-13; Aerodrome Maintenance—Runway Surface Friction Characteristics and Friction Testing; CAA: Wellington, New Zealand, 2015; pp. 1–28. [Google Scholar]
- CASA. MOS Part 139, Aerodromes; CASA: Canberra, Australia, 2024; pp. 1–470.
- Comfort, G.; Rado, Z.; Townshend, T.; Mazur, A. Runway Friction Characteristics Measurement and Aircraft Braking, Final Report; Volume 3—Functional Friction; EASA: Cologne, Germany, 2010; pp. 1–151.
- Widyatmoko, D.; Fergusson, C. Early Life and in Service Friction Characteristics of Runway Surface. In Proceedings of the 7th Symposium on Pavement Surface Characteristics, Norfolk, VA, USA, 19–22 September 2012; pp. 1–24. [Google Scholar]
- ICAO. Airport Services Manual—Part IX—Airport Maintenance Practices (Doc 9137P9); ICAO: Montreal, QC, Canada, 1984; pp. 1–56. [Google Scholar]
- ICAO. Aerodrome Design Manual—Part 3—Pavements (Doc 9157—Part 3); ICAO: Montreal, QC, Canada, 2022; pp. 1–146. [Google Scholar]
- Kim, Y.-U.; You, K.-H.; Cho, N.-H. Development of the Rubber Removal Primer to Reduce Pavement Damage for Removal of Rubber Deposits in Runways. J. Korean Soc. Civ. Eng. 2016, 36, 695–704. [Google Scholar] [CrossRef]
- Yang, Y.; Zhu, X.; Jelagin, D.; Guarin, A.; JvdM Steyn, W. Numerical Analysis Concerning the Skid Resistance of Rubber-Contaminated Runway Grooves. Tribol. Int. 2021, 163, 107157. [Google Scholar] [CrossRef]
- ACRP. Impact of Airport Rubber Removal Techniques on Runways A Synthesis of Airport Practice Sponsored by the Federal Aviation Administration (Synthesis 11); ACRP: Washington, DC, USA, 2008. [Google Scholar]
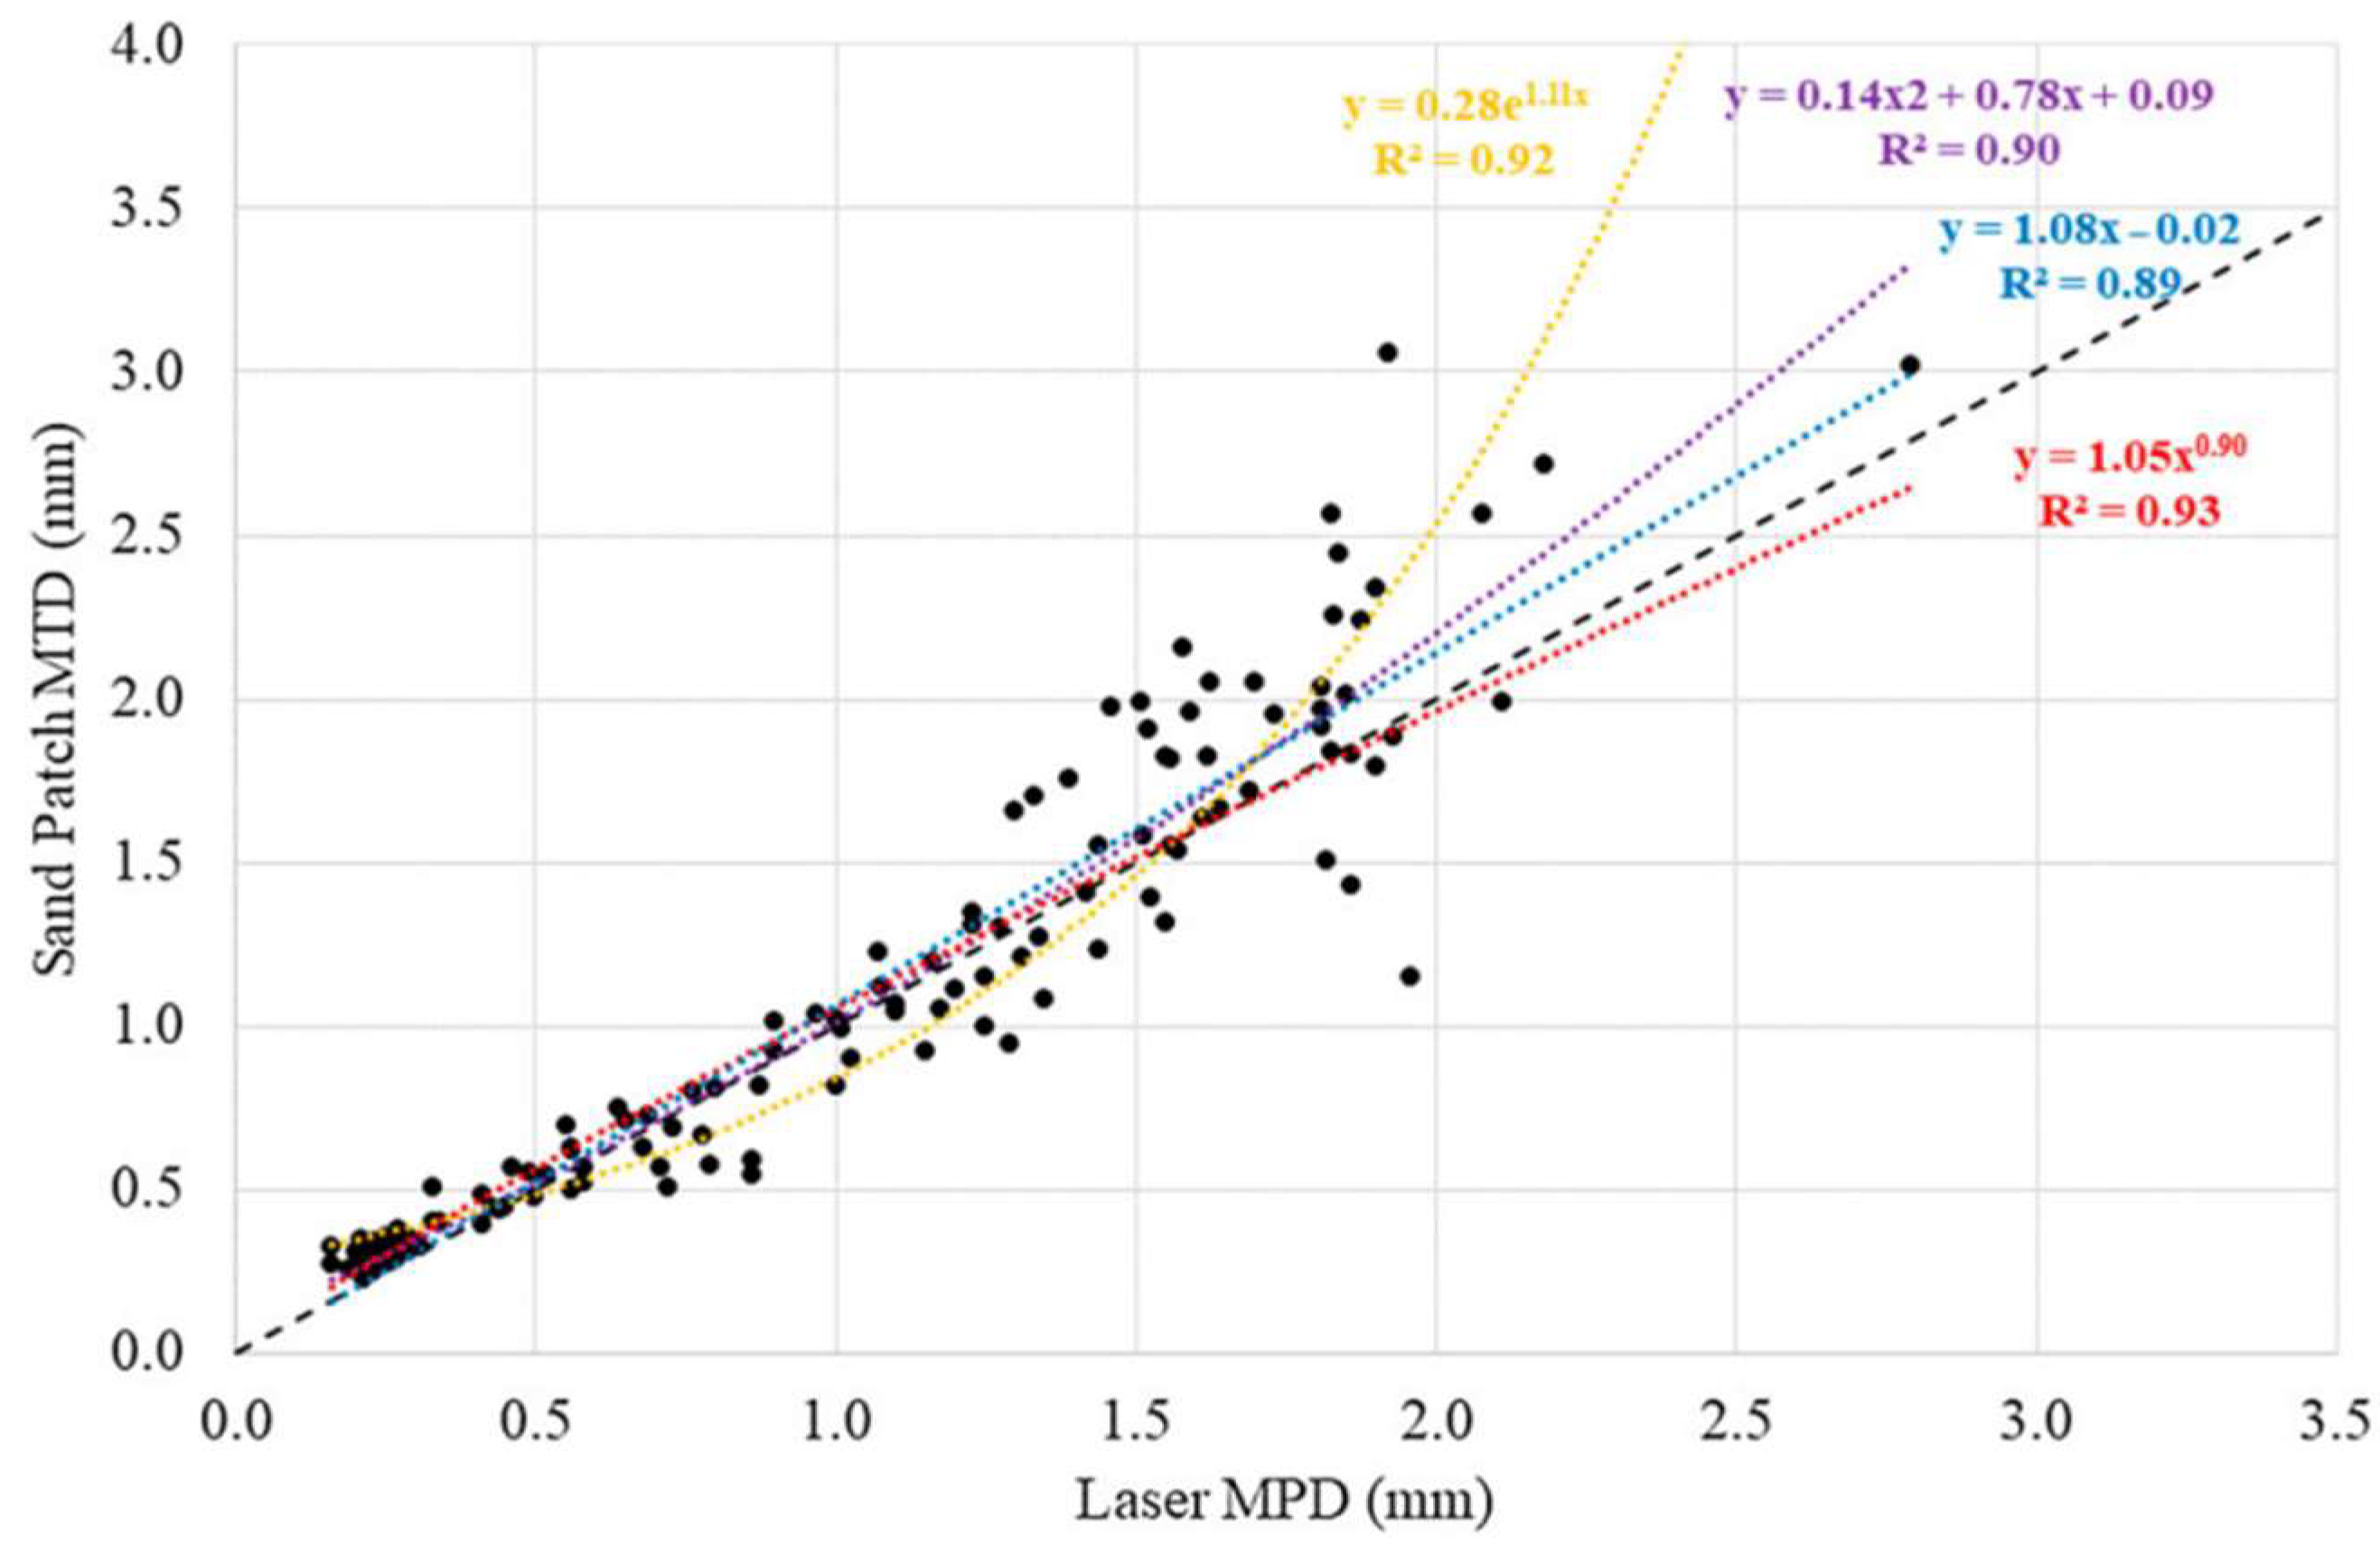
- White, G.; Ward, C.; Jamieson, S. Field Evaluation of a Handheld Laser Meter for Pavement Surface Macro Texture Measurement. Int. J. Pavement Eng. 2021, 22, 950–959. [Google Scholar] [CrossRef]
- ICAO. Aerodrome Design Manual—Runways (Doc 9157—Part 1); ICAO: Montreal, QC, Canada, 2020; pp. 1–98. [Google Scholar]
- Deja, J.; Dayyani, I.; Skote, M. Modeling and Performance Evaluation of Sustainable Arresting Gear Energy Recovery System for Commercial Aircraft. Int. J. Green Energy 2023, 20, 1086–1100. [Google Scholar] [CrossRef]
- Ketabdari, M.; Toraldo, E.; Crispino, M.; Lunkar, V. Evaluating the Interaction between Engineered Materials and Aircraft Tyres as Arresting Systems in Landing Overrun Events. Case Stud. Constr. Mater. 2020, 13, e00446. [Google Scholar] [CrossRef]
- ICAO. Annex 6—Operation Of Aircraft—Part I—International Commercial Air Transport—Aeroplanes; ICAO: Montreal, QC, Canada, 2022; pp. 1–242. [Google Scholar]
- ICAO. Annex 6—Operation Of Aircraft—Part II—International General Aviation—Aeroplanes; ICAO: Montreal, QC, Canada, 2022; pp. 1–182. [Google Scholar]
- ICAO. Annex 8—Airworthiness of Aircraft; ICAO: Montreal, QC, Canada, 2022; pp. 1–346. [Google Scholar]
- ICAO. Aeroplane Performance Manual (Doc 10064); ICAO: Montreal, QC, Canada, 2020; pp. 1–98. [Google Scholar]
- EASA. Certification Specifications and Acceptable Means of Compliance for Large Aeroplanes, CS-25. Amendment 14; EASA: Cologne, Germany, 2023; pp. 1–919.
- FAA. AC 25-7D; Flight Test Guide for Certification of Transport Category Airplanes; FAA: Washington, DC, USA, 2018; pp. 1–481.
- FAA. Aircraft Landing Performance and Runway Excursion Mitigation; Advisory Circular 91-79B; FAA: Washington, DC, USA, 2023; pp. 1–42.
- Leland, T.J.W.; Yager, T.J.; Joyner, U.T. Effects of Pavement Texture on Wet-Runway Braking Performance; National Aeronautics and Space Administration: Washington, DC, USA, 1968; pp. 1–40.
- Kummer, H.W.; Meyer, W.E. The Penn State Road Friction Tester as Adapted to Routine Measurement of Pavement Skid Resistance. Highw. Res. Rec. 1963, 28, 1–31. [Google Scholar]
- Domandt, H.; Meyer, W.E. Measuring Tire Friction Under Slip with the Penn State Road Friction Tester. Highw. Res. Rec. 1968, 214, 34–41. [Google Scholar]
- Yager, T.J.; Vogler, V.A.; Baldasare, P. Evaluation of Two Transport Aircraft and Several Ground Test Vehicle Friction Measurements Obtained for Various Runway Surface Types and Conditions: A Summary of Test Results from Joint FAA/NASA Runway Friction Program; National Aeronautics and Space Administration: Washington, DC, USA, 1990; pp. 1–308.
- Li, Q.J.; Wang, K.; Yu, W.; Liu, W. Continuous Friction Measurement Equipment (CFME) for Highway Safety Management in Oklahoma; Oklahoma State University: Stillwater, OK, USA, 2020; pp. 1–137. [Google Scholar]
- Najafi, S.; Flintsch, G.W.; de Leon Izeppi, E.D.; McGhee, K.; Katicha, S. Evaluation of Repeatability and Reproducibility of Continuous Friction Measuring Equipment (CFME) Using Cross-Correlation. Int. J. Pavement Eng. 2017, 18, 521–529. [Google Scholar] [CrossRef]
- Dardano, J.; Wickham, G. Australia’s National Friction Testing Programme; Sydney Airport: Sydney, Australia, 2005; pp. 1–15. [Google Scholar]
- Cenek, P.D. Review of Instruments for Measuring the Texture Profile of Road Surfaces. NZ Transport Agency Waka Kotahi: Wellington, New Zealand, 1996. [Google Scholar]
- Cenek, P.D.; Carpenter, P.; Jamieson, N.J.; Stewart, P.F. Lessons Learnt from Conducting Friction Surveys of Runways and Roads. In Proceedings of the 1st Annual Australian Runway and Roads Fricton Testing Workshop, Sydney, Australia, 5 August 2003. [Google Scholar]
- Comfort, G.; Rado, Z.; Townshend, T.; Mazur, A. Runway Friction Characteristics Measurement and Aircraft Braking, Final Report; Volume 1—Summary and Recommendations; EASA: Cologne, Germany, 2010; pp. 1–151.
- Yager, T.J. An Overview of the Annual NASA Tire/Runway Friction Workshop and Lessons Learned. In Proceedings of the International Surface Friction Conference on Roads and Runways, Christchurch, New Zealand, 1–4 May 2005. [Google Scholar]
- FAA. AC 150/5320-12D; Measurement, Construction, and Maintenance of Skid-Resistant Airport Pavement Surfaces; FAA: Washington, DC, USA, 2016; pp. 1–40.
- CASA. AC 139.C-06 v1.0; Skid Resistance of Aerodrome Pavements; CASA: Canberra, Australia, 2021; pp. 1–26.
- Wambold, J.C.; Antie, C.E.; Henry, J.J.; Rado, Z.; Descornet, G.; Sandberg, U.; Gothie, M.; Huschek, S. International PIARC Experiment to Compare and Harmonize Texture and Skid Resistance Measurements; PIARC: Paris, France, 1995; pp. 1–346. [Google Scholar]
- Flintsch, G.W.; Izeppi, E.d.L.; McGhee, K.K.; Roa, J.A. Evaluation of International Friction Index Coefficients for Various Devices. Transp. Res. Rec. J. Transp. Res. Board 2009, 2094, 136–143. [Google Scholar] [CrossRef]
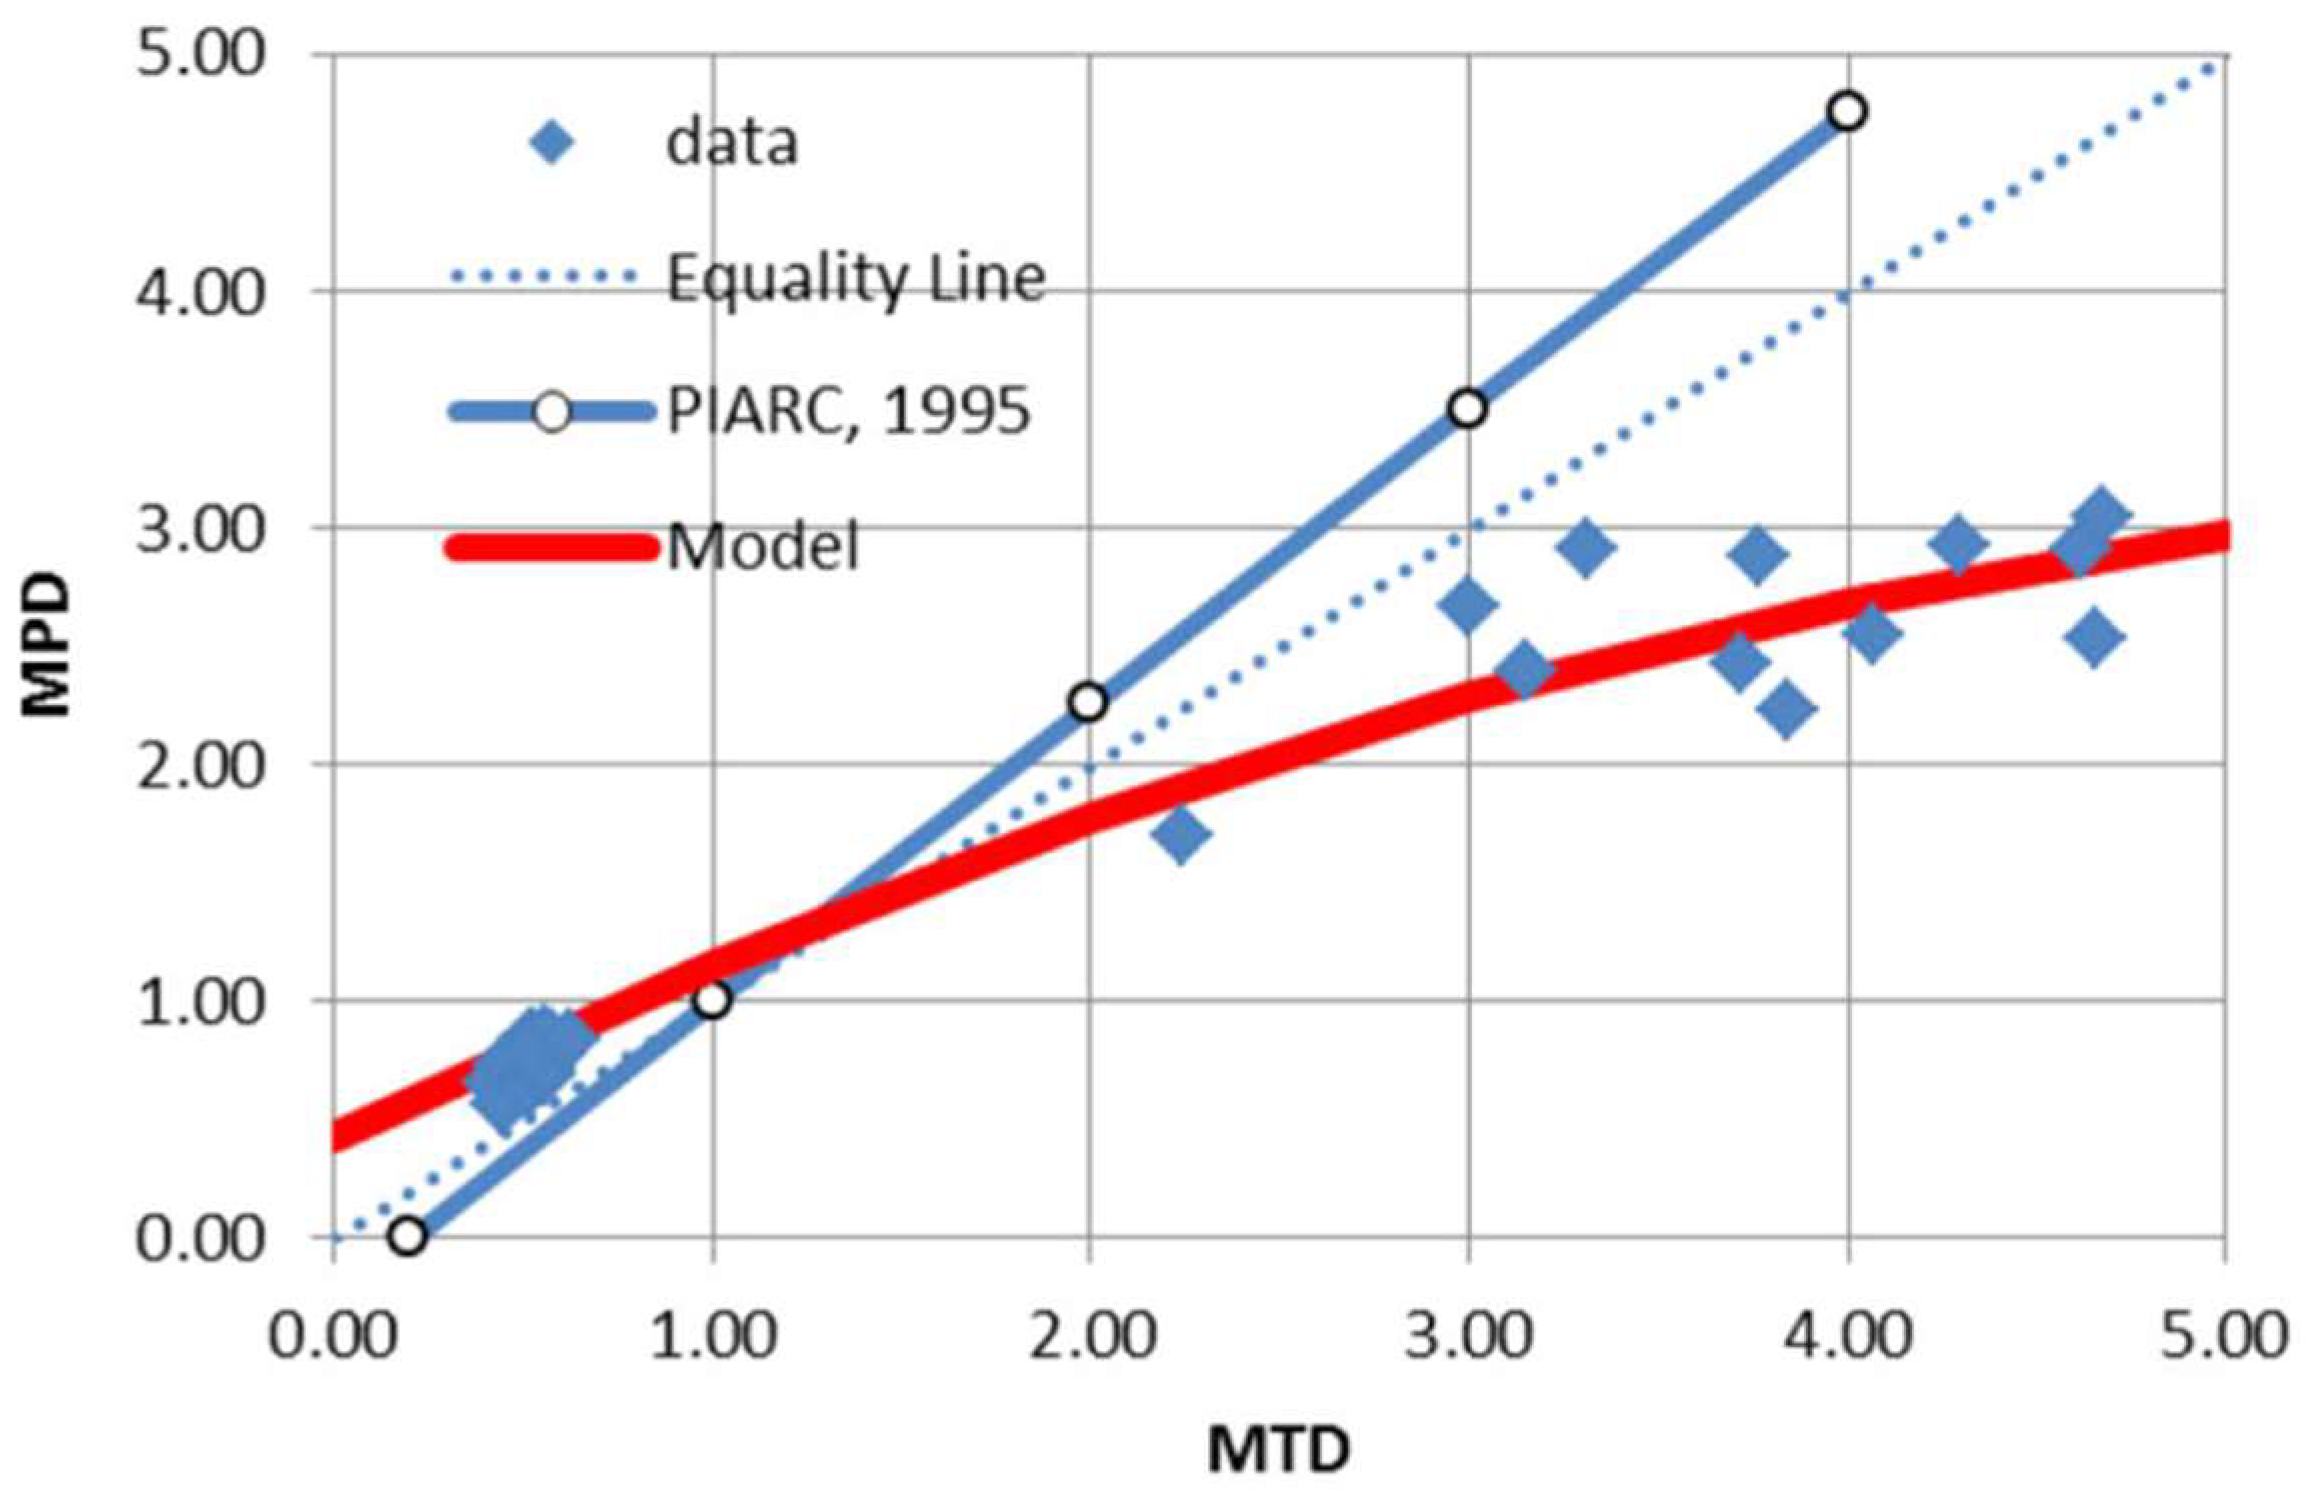
- Praticò, F.G.; Vaiana, R. A Study on the Relationship between Mean Texture Depth and Mean Profile Depth of Asphalt Pavements. Constr. Build. Mater. 2015, 101, 72–79. [Google Scholar] [CrossRef]
- Henry, J.J.; Abe, H.; Kameyama, S.; Tamai, A.; Kasahara, A.; Saito, K. Determination of the International Friction Index (IFI) Using the Circular Texture Meter (CTM) and the Dynamic Friction Tester (DFT). In Proceedings of the SURF 2000: Fourth International Symposium on Pavement Surface Characteristics on Roads and Airfields, Nantes, France, 22–24 May 2000; pp. 109–121. [Google Scholar]
- Rasol, M.; Schmidt, F.; Ientile, S. Weather Condition Effect on the Road Surface Friction: A Preliminary Assessment Based on Sensor Data. In Life-Cycle of Structures and Infrastructure Systems; CRC Press: London, UK, 2023; pp. 2187–2194. [Google Scholar]
- Kennedy, C.; Young, A.; Butler, I. Measurement of Skidding Resistance and Surface Texture and the Use of Results in the United Kingdom. In Surface Characteristics of Roadways: International Research and Technologies; ASTM International: West Conshohocken, PA, USA, 1990; pp. 87–102. [Google Scholar]
- Fuentes, L.G. Investigation of the Factors Influencing Skid Resistance and the International Friction Index; University of South Florida: Tempa, FL, USA, 2009. [Google Scholar]
- Sarsam, S. Field Assessment of Runway Pavement Surface Texture for Baghdad International Airport. Int. J. Transp. Eng. Traffic Syst. 2019, 5, 6–21. [Google Scholar]
- Chen, S.; Liu, X.; Luo, H.; Yu, J.; Chen, F.; Zhang, Y.; Ma, T.; Huang, X. A State-of-the-Art Review of Asphalt Pavement Surface Texture and Its Measurement Techniques. J. Road Eng. 2022, 2, 156–180. [Google Scholar] [CrossRef]
- Edjeou, W.; Cerezo, V.; Zahouani, H.; Salvatore, F. Multiscale Analyses of Pavement Texture during Polishing. Surf. Topogr. 2020, 8, 024008. [Google Scholar] [CrossRef]
- Zou, Y.; Yang, G.; Cao, M. Neural Network-Based Prediction of Sideway Force Coefficient for Asphalt Pavement Using High-Resolution 3D Texture Data. Int. J. Pavement Eng. 2022, 23, 3157–3166. [Google Scholar] [CrossRef]
- Zelelew, H.; Khasawneh, M.; Abbas, A. Wavelet-Based Characterisation of Asphalt Pavement Surface Macro-Texture. Road Mater. Pavement Des. 2014, 15, 622–641. [Google Scholar] [CrossRef]
- Torbruegge, S.; Wies, B. Characterization of Pavement Texture by Means of Height Difference Correlation and Relation to Wet Skid Resistance. J. Traffic Transp. Eng. 2015, 2, 59–67. [Google Scholar] [CrossRef]
- Kokkalis, A.G.; Tsohos, G.H.; Panagouli, O.K. Consideration of Fractals Potential in Pavement Skid Resistance Evaluation. J. Transp. Eng. 2002, 128, 591–595. [Google Scholar] [CrossRef]
- Emery, S.; Norheim, A.; Mihaljevic, I. Slippery Asphalt Runways After Rejuvenation. In Proceedings of the Airfield Pavements Seminar, XXIVth World Road Congress, Mexico City, Mexico, 28–29 September 2011; pp. 1–16. [Google Scholar]
- Abduljabbar, A.S.; Salman, N.D.; Jaleel, Z.T. Design of an Expert System for Airport Rubber Removal. IOP Conf. Ser. Mater. Sci. Eng. 2020, 737, 012135. [Google Scholar] [CrossRef]
- White, G.; Embleton, K. Validation of a New Generation Bitumen for Airport Asphalt. In Proceedings of the 17th AAPA International Flexible Pavements Conference, Melbourne, Australia, 13–16 August 2017; pp. 1–13. [Google Scholar]
- Sarsam, S.; Ali, A. Assessing Pavement Surface Macrotexture Using Sand Patch Test and Close Range Photogrammetric Approaches. Int. J. Mater. Chem. Phys. 2015, 1, 124–131. [Google Scholar]
- Wesołowski, M.; Blacha, K. Evaluation of Airfield Pavement Micro and Macrotexture in the Light of Skid Resistance (Friction Coefficient) Measurements. MATEC Web Conf. 2019, 262, 05017. [Google Scholar] [CrossRef]
- Roy, N.; Kuna, K.K. Image Texture Analysis to Evaluate the Microtexture of Coarse Aggregates for Pavement Surface Courses. Int. J. Pavement Eng. 2023, 24, 2099854. [Google Scholar] [CrossRef]
- Kim, K. Development of a Machine Vision System for the Average Roughness Measurement of Shot- and Sand-Blasted Surfaces. Lubricants 2024, 12, 339. [Google Scholar] [CrossRef]
- Xie, L.; Chu, X.; Wang, W.; Chen, C. A Stereoscopic Imaging Arithmetic for 3D Measurement of Road Surface Micro-Texture. In Proceedings of the International Conference on Transportation Engineering, Chengdu, China, 25–27 July 2009; American Society of Civil Engineers: Reston, VA, USA, 2009; pp. 4228–4233. [Google Scholar]
- Gao, L.; Liu, M.; Wang, Z.; Xie, J.; Jia, S. Correction of Texture Depth of Porous Asphalt Pavement Based on CT Scanning Technique. Constr. Build. Mater. 2019, 200, 514–520. [Google Scholar] [CrossRef]
- Lin, Y.; Dong, C.; Wu, D.; Jiang, S.; Xiang, H.; Weng, Z. Study of Pavement Macro- and Micro-Texture Evolution Law during Compaction Using 3D Laser Scanning Technology. Appl. Sci. 2023, 13, 5736. [Google Scholar] [CrossRef]
- Meegoda, J.; Rowe, G.; Jumikis, A.; Hettiarachchi, C.; Bandara, N.; Gephart, N. Estimation of Surface Macrotexture in Hot Mix Asphalt Concrete Pavements Using Laser Texture Data. J. Test. Eval. 2005, 33, 305–315. [Google Scholar] [CrossRef]
- ASTM E1845; Standard Practice for Calculating Pavement Macrotexture Mean Profile Depth. ASTM: West Conshohocken, PA, USA, 2001.
- ASTM E1960; Standard Practice for Calculating International Friction Index of a Pavement Surface. ASTM: West Conshohocken, PA, USA, 1998.
- Yang, G.; Wang, K.C.P.; Li, J.Q.; Wang, G. A Novel 0.1 Mm 3D Laser Imaging Technology for Pavement Safety Measurement. Sensors 2022, 22, 8038. [Google Scholar] [CrossRef]
- Chen, B.; Xiong, C.; Li, W.; He, J.; Zhang, X. Assessing Surface Texture Features of Asphalt Pavement Based on Three-Dimensional Laser Scanning Technology. Buildings 2021, 11, 623. [Google Scholar] [CrossRef]
- Kováč, M.; Brna, M.; Decký, M. Pavement Friction Prediction Using 3D Texture Parameters. Coatings 2021, 11, 1180. [Google Scholar] [CrossRef]
- Gayfutdinov, R.F.; Bajmukhametov, G.F.; Gusmanova, T.F.; Hafizov, E.R. Wear Resistance Control System of Coarse Aggregate of Asphalt Concrete Mixtures and Assesment of Factors Affecting Abrasive Resistance of Crushed Stone. Roads Bridges 2020, 44, 231–253. [Google Scholar]
- Gayfutdinov, R.F.; Khafizov, E.R. Research of Abrasive Wear of Crushed Stone for Highways. News KGASU 2020, 51, 128–137. [Google Scholar]
- Forster, S.W. Pavement Microtexture and Its Relation to Skid Resistance. Transp. Res. Rec. 1989, 1215, 151–164. [Google Scholar]
- Ueckermann, A.; Wang, D.; Oeser, M.; Steinauer, B. A Contribution to Non-Contact Skid Resistance Measurement. Int. J. Pavement Eng. 2015, 16, 646–659. [Google Scholar] [CrossRef]
- Aktaş, B.; Gransberg, D.D.; Riemer, C.; Pittenger, D. Comparative Analysis of Macrotexture Measurement Tests for Pavement Preservation Treatments. Transp. Res. Rec. J. Transp. Res. Board 2011, 2209, 34–40. [Google Scholar] [CrossRef]
- Yager, T.J.; Bühlmann, F. Macrotexture and Drainage Measurements on a Variety of Concrete and Asphalt Surfaces. In Pavement Surface Characteristics and Materials; ASTM International: West Conshohocken, PA, USA, 1982; pp. 16–30. [Google Scholar]
- Mataei, B.; Moghadas Nejad, F.; Zahedi, M.; Zakeri, H. Evaluation of Pavement Surface Drainage Using an Automated Image Acquisition and Processing System. Autom. Constr. 2018, 86, 240–255. [Google Scholar] [CrossRef]
- Vorburger, T.V.; Rhee, H.-G.; Renegar, T.B.; Song, J.-F.; Zheng, A. Comparison of Optical and Stylus Methods for Measurement of Surface Texture. Int. J. Adv. Manuf. Technol. 2007, 33, 110–118. [Google Scholar] [CrossRef]
- Gallaway, B.M.; Tomita, H. Microtexture Measurements of Pavement Surfaces; Interim Report Research Report Number 138-1, Vehicle-Pavement Interaction Study; Texas Transportation Institute: College Station, TX, USA, 1970; pp. 1–26.
- McKeen, R.G.; Lenke, L.R.; Graul, R.A. Runway Rubber Removal Specification Development: Field Evaluation Procedures Development; National Technical Information Service: Albuquerque, NW, USA, 1984. [Google Scholar]
- Peng, N.C.; Khairuddin, F.H.; Wan Mohamed Sabri, W.M.S.; Mohd Yusof, Z.; Yee, Y.H.; Ramli, M. Estimating the Potential of Skid Incident at Airport Runway—A Case Study. J. Kejuruter. 2021, si4, 77–85. [Google Scholar] [CrossRef]
- Brassard, J.-D.; Beaulieu, A.; Tremblay, M.M.; Momen, G. Assessment of Runway Surface Conditions by British Pendulum Testing under the Global Reporting Format Winter Conditions. Appl. Sci. 2022, 12, 9646. [Google Scholar] [CrossRef]
- Chu, L.; Guo, W.; Fwa, T.F. Theoretical and Practical Engineering Significance of British Pendulum Test. Int. J. Pavement Eng. 2022, 23, 1–8. [Google Scholar] [CrossRef]
- White, G. A Standardised Sprayed Sealing Specification for Australian Airports. In Proceedings of the 12th Conference on Asphalt Pavements for Southern Africa, Sun City, South Africa, 13 October 2019; pp. 806–821. [Google Scholar]
- White, G.; Dutney, H. Stone Mastic Asphalt as an Ungrooved Runway Surface: Case Study on Emerald Airport. In Eleventh International Conference on the Bearing Capacity of Roads, Railways and Airfields, Volume 1; CRC Press: London, UK, 2021; pp. 367–386. [Google Scholar]
- Liu, Y.; Fwa, T.F.; Choo, Y.S. Effect of Surface Macrotexture on Skid Resistance Measurements by the British Pendulum Test. J. Test. Eval. 2004, 32, 11428. [Google Scholar] [CrossRef]
- Zhu, X.; Yang, Y.; Zhao, H.; Jelagin, D.; Chen, F.; Gilabert, F.A.; Guarin, A. Effects of Surface Texture Deterioration and Wet Surface Conditions on Asphalt Runway Skid Resistance. Tribol. Int. 2021, 153, 106589. [Google Scholar] [CrossRef]
- White, G.; Almutairi, H. Laboratory and Field Performance Comparison of Dense Graded and Stone Mastic Asphalt as a Runway Surface. Int. J. Pavement Eng. 2022, 23, 937–949. [Google Scholar] [CrossRef]
- White, G.; McLachlan, F.; Wallace, S. Comparing Asphalt Preservation Products on a Grooved Runway. In Bituminous Mixtures and Pavements VII; CRC Press: Boca Raton, FL, USA, 2019; pp. 375–384. [Google Scholar]
- Kumar, A.; Gupta, A. Review of Factors Controlling Skid Resistance at Tire-Pavement Interface. Adv. Civ. Eng. 2021, 2021, 2733054. [Google Scholar] [CrossRef]
- Leu, M.C.; Henry, J.J. Prediction of Skid Resistance as a Function of Speed From Pavement Texture Measurements. Transp. Res. Rec. 1978, 666, 7–13. [Google Scholar]
- Cerezo, V.; Rado, Z.; Kane, M. Encouraging Results of International Friction Measurement Harmonization through Quality Assurance and Calibration. In Proceedings of the 98th Annual Meeting Transportation Research Board, Washington, DC, USA, 13–17 January 2019; pp. 1–21. [Google Scholar]
- Fuentes, L.G.; Gunaratne, M. Revised Methodology for Computing International Friction Index. Transp. Res. Rec. J. Transp. Res. Board 2011, 2227, 129–137. [Google Scholar] [CrossRef]
- Descornet, G.; Schmidt, B.; Boulet, M.; Gothie, M.; Do, M.T.; Fafie, J.; Alonso, M.; Roe, P.; Viner, H. HERMES Project (Harmonization of European Routine and Research Measuring Equipment for Skid Resistance); French Institute of Science and Technology for Transport, Development and Networks: Champs sur Marne, France, 2006; pp. 1–329. [Google Scholar]
- Britton, S.; Ledbetter, W.; Gallaway, B. Estimation of Skid Numbers from Surface Texture Parameters in the Rational Design of Standard Reference Pavements for Test Equipment Calibration. In Surface Texture Versus Skidding: Measurements, Frictional Aspects, and Safety Features of Tire-Pavement Interactions; ASTM International: West Conshohocken, PA, USA, 1975; pp. 112–115. [Google Scholar]
- Saito, K.; Henry, J.J. Development of the Relationships Between Skid Resistance and Pavement Surface Texture. Mem. Muroran Inst. Technol. 1987, 37, 293–307. [Google Scholar]
- Kargah-Ostadi, N.; Howard, A. Monitoring Pavement Surface Macrotexture and Friction. Transp. Res. Rec. J. Transp. Res. Board 2015, 2525, 111–117. [Google Scholar] [CrossRef]
- Kouchaki, S.; Roshani, H.; Prozzi, J.A.; Garcia, N.Z.; Hernandez, J.B. Field Investigation of Relationship between Pavement Surface Texture and Friction. Transp. Res. Rec. J. Transp. Res. Board 2018, 2672, 395–407. [Google Scholar] [CrossRef]
- Yang, G.; Li, Q.J.; Zhan, Y.; Fei, Y.; Zhang, A. Convolutional Neural Network–Based Friction Model Using Pavement Texture Data. J. Comput. Civ. Eng. 2018, 32, 04018052. [Google Scholar] [CrossRef]
- Zuniga-Garcia, N.; Prozzi, J.A. High-Definition Field Texture Measurements for Predicting Pavement Friction. Transp. Res. Rec. J. Transp. Res. Board 2019, 2673, 246–260. [Google Scholar] [CrossRef]
- Li, Q.J.; Zhan, Y.; Yang, G.; Wang, K.C.P. Pavement Skid Resistance as a Function of Pavement Surface and Aggregate Texture Properties. Int. J. Pavement Eng. 2020, 21, 1159–1169. [Google Scholar] [CrossRef]
- Deng, Q.; Zhan, Y.; Liu, C.; Qiu, Y.; Zhang, A. Multiscale Power Spectrum Analysis of 3D Surface Texture for Prediction of Asphalt Pavement Friction. Constr. Build Mater 2021, 293, 123506. [Google Scholar] [CrossRef]
- Apaza, F.R.A.; Jurado-Piña, R.; Díaz-Torrealba, R.; Gulisano, F.; Boada-Parra, G.; Gallego, J. Texture and Skid Resistance of Asphalt Mixtures with Crumb Rubber: Laboratory Assessment. Int. J. Pavement Eng. 2024, 25, 2378335. [Google Scholar] [CrossRef]
- Niu, Y.; Yu, X.; Zhu, H.; Zhou, W. Research on Estimation Method for Airport Runway Friction Coefficient Based on Numerical Analysis. IEEE Access 2024, 12, 37615–37630. [Google Scholar] [CrossRef]
- Paul, A.K.; Prasad, A.; Kumar, A. Review on Artificial Neural Network and Its Application in the Field of Engineering. J. Mech. Eng. Prakash 2022, 1, 53–61. [Google Scholar] [CrossRef]
- Dunford, A. Friction and the Texture of Aggregate Particles Used in the Road Surface Course; University of Nottingham: Nottingham, UK, 2013. [Google Scholar]
- Do, M.T.; Zahouani, H. Influence of the Road-Surface Texture on the Speed Dependency of Tire/Road Friction. In Proceedings of the 10th International Conference Metrology and Properties of Engineering Surfaces, Saint-Etienne, France, 4–7 July 2013; pp. 1–12. [Google Scholar]
- Do, M. Relationship between Microtexture and Skid Resistance. Bull. Des Lab. Ponts Chaussees 2005, 255, 117–136. [Google Scholar]
- Chou, C.; Chu, Y.-C. Application of Friction–Speed Model to Evaluate Runway Surface Microtexture and Macrotexture: A Case Study. Int. J. Pavement Eng. 2023, 24, 2044034. [Google Scholar] [CrossRef]
- Pranjić, I.; Deluka-Tibljaš, A.; Cuculić, M.; Šurdonja, S. Influence of Pavement Surface Macrotexture on Pavement Skid Resistance. Transp. Res. Procedia 2020, 45, 747–754. [Google Scholar] [CrossRef]
- Ergun, M.; Iyinam, S.; Iyinam, A.F. Prediction of Road Surface Friction Coefficient Using Only Macro- and Microtexture Measurements. J. Transp. Eng. 2005, 131, 311–319. [Google Scholar] [CrossRef]
- ATSB. Aviation Short Investigation Bulletin: First Quarter 2011 Issue 5; ATSB: Canberra, Australia, 2011.
- ATSB. Runway Excursion Involving GippsAero GA8, Registration VH-TBU Rat Island, Western Australia on 6 April 2023; ATSB: Canberra, Australia, 2023.
- ATSB. Runway Overrun Involving Gippsland Aeronautics GA-8, VH-WSB East Wallabi Island, Western Australia on 26 December 2021; ATSB: Canberra, Australia, 2022.
- ATSB. Runway Excursion Involving a Cessna 172, VH-MKQ 13 Km SW of Launceston, Tasmania, 30 April 2014; ATSB: Canberra, Australia, 2014.
- ATSB. Runway Excursion Involving a Beech A36, VH-EUB Lilydale (ALA), Victoria, 19 February 2014; ATSB: Canberra, Australia, 2014.
- ATSB. Runway Excursion Involving Piper PA 39, VH-MMN Innamincka Township (ALA), South Australia, 26 October 2012; ATSB: Canberra, Australia, 2012.
- ATSB. Rejected Take off Piper Aircraft Corp PA-31-350, VH-PRJ; ATSB: Canberra, Australia, 2006.
- ATSB. Runway Excursion Involving a Fairchild SA226, VH-OGX Archerfield Airport, Queensland, 23 January 2014; ATSB: Canberra, Australia, 2014.


| Description | Landing | Take-Off |
|---|---|---|
| Occurrences related to poor braking | 70 (4.9%) | 5 (1.3%) |
| Number of occurrences | 1424 | 376 |
| Number of Daily Minimum Turbojet Aircraft Landings per Runway End | Minimum Friction Survey Frequency |
|---|---|
| Less than 15 | 1 year |
| 16 to 30 | 6 months |
| 31 to 90 | 3 months |
| 91 to 150 | 1 month |
| 151 to 210 | 2 weeks |
| Greater than 210 | 1 week |
| Test Equipment | Test Speed, km/h | Design Objective for New Surface | Maintenance Planning Level | Minimum Friction Level |
|---|---|---|---|---|
| Mu-meter Trailer | 65 | 0.72 | 0.52 | 0.42 |
| 95 | 0.66 | 0.38 | 0.26 | |
| Skiddometer Trailer | 65 | 0.82 | 0.60 | 0.50 |
| 95 | 0.74 | 0.47 | 0.34 | |
| Surface Friction Tester Vehicle | 65 | 0.82 | 0.60 | 0.50 |
| 95 | 0.74 | 0.47 | 0.34 | |
| Runway Friction Tester Vehicle | 65 | 0.82 | 0.60 | 0.50 |
| 95 | 0.74 | 0.54 | 0.41 | |
| TATRA Friction Tester Vehicle | 65 | 0.76 | 0.57 | 0.48 |
| 95 | 0.67 | 0.52 | 0.42 | |
| RUNAR Trailer | 65 | 0.69 | 0.52 | 0.45 |
| 95 | 0.63 | 0.42 | 0.32 | |
| GRIPTESTER Trailer | 65 | 0.74 | 0.53 | 0.43 |
| 95 | 0.64 | 0.36 | 0.24 |
| Runway Condition Code (RWYCC) | Runway Condition Description | Pilot Report of Runway Braking Action | Description of a Braking Action |
|---|---|---|---|
| 6 | Dry | N/A | N/A |
| 5 | Frost. Wet (≤3 mm) Slush (≤3 mm) Dry snow (≤3 mm) Wet snow (≤3 mm) | Good | Braking deceleration is normal for the wheel braking effort applied and directional control is normal |
| 4 | Compacted snow (outside air temperature below −15 °C) | Good to medium | Braking deceleration or directional control is between good and medium |
| 3 | Wet (slippery then wet due to poor micro or macrotexture) Dry snow (>3 mm) Wet snow (>3 mm) Dry snow on top of compacted snow Wet snow on top of compacted snow Compacted snow (outside air temperature above −15 °C) | Medium | Braking deceleration is noticeably reduced for the wheel braking effort applied or directional control is noticeably reduced |
| 2 | Standing water (>3 mm) Slush (>3 mm) | Medium to poor | Braking deceleration or directional control is between medium and poor |
| 1 | Ice | Poor | Braking deceleration is significantly reduced for the wheel braking effort applied or directional control is significantly reduced |
| 0 | Wet ice Water on top of compacted snow Dry or wet snow on top of ice | Less than poor | Braking deceleration is minimal to non-existent for the wheel braking effort applied or directional control is uncertain |
| RWYCC | Wheel Braking Coefficient |
|---|---|
| 6 | 90 per cent of certified value |
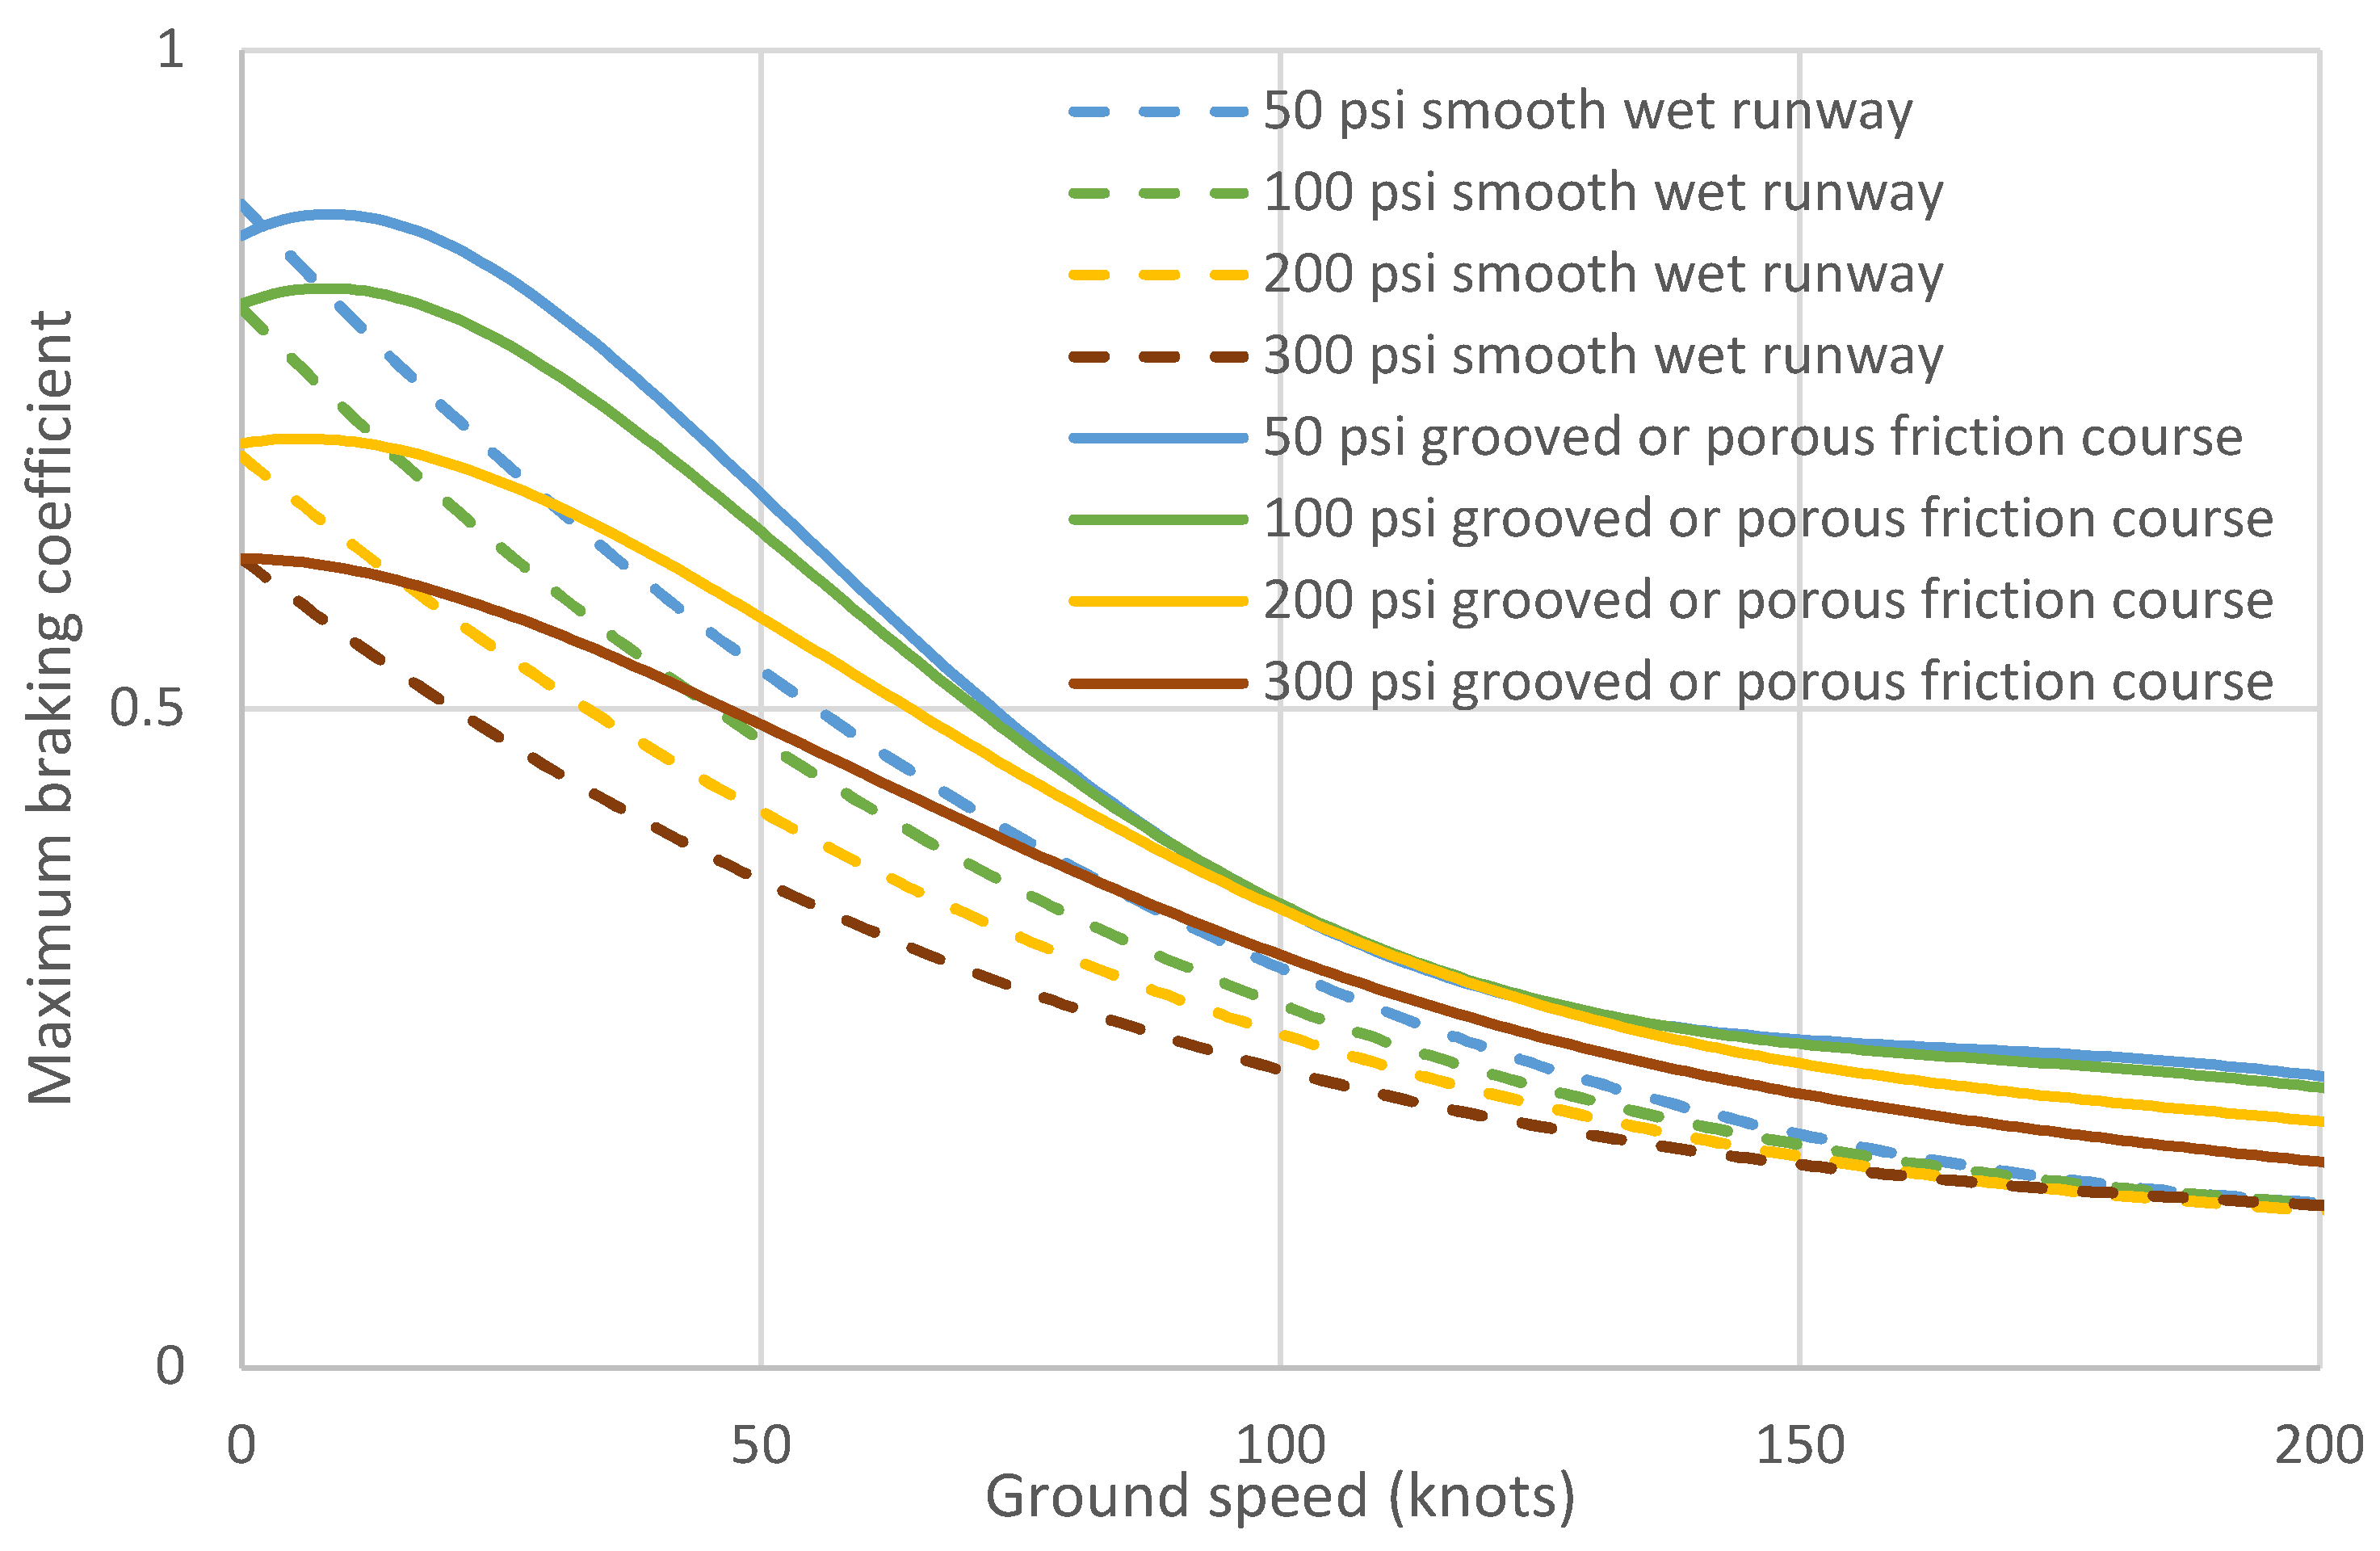
| 5 | According to Figure 16 for a smooth (ungrooved and not textured) wet runway |
| 4 | 0.20 |
| 3 | 0.16 |
| 2 | 50 per cent of the value obtained for RWYCC 5 for speeds below 85 per cent of the aquaplaning speed and 0.05 for speeds above 85 per cent of the aquaplaning speed |
| 1 | 0.07 |
| 0 | Not applicable |
| Type of Anti-Skid System | Efficiency Value |
|---|---|
| On-off | 0.30 |
| Quasi-modulating | 0.50 |
| Fully modulating | 0.80 |
| RWYCC | 6 | 5 | 4 | 3 | 2 | 1 |
|---|---|---|---|---|---|---|
| Turbojet, no reverse | 1.67 | 2.6 | 2.8 | 3.2 | 4.0 | 5.1 |
| Turbojet, with reverse | 1.67 | 2.2 | 2.3 | 2.5 | 2.9 | 3.4 |
| Turboprop | 1.67 | 2.0 | 2.2 | 2.4 | 2.7 | 2.9 |
| No. | Model | R2 | Friction Assessment | Texture Assessment | Reference |
|---|---|---|---|---|---|
| 1 | 0.86 | Difference between BPN value of flat surface and surface with macrotexture | Macrotexture depth and spacing between texture peaks | [158] | |
| 2 | 0.84 | Skid Number according to ASTM E 274-70 | Sand patch test and British Pendulum Test | [154] | |
| 3 | 0.92 | Skid Number according to ASTM E 274-70 with ribbed and blank tire | Sand patch test and British Pendulum Test | [159] | |
| 4 | 0.70 | Skid Number according to ASTM E 274-70 | Microtexture shape factor and contact area based on macrotexture | [136] | |
| 5 | Rubber friction theoretical model [22] with modified data from optical measurement | 0.91 and 0.97 | ViaTech and Wehner/Schulze machine | Optical measuring system data | [21,137] |
| 6 | 0.10 to 0.73 | Locked-wheel trailer (speed higher than 45 mph) | Mean profile depth | [160] | |
| 7 | Linear correlation models for different testing speeds and testing devices | 0.56 to 0.79 | Grip Tester | Mean profile depth | [161] |
| 8 | Artificial neural network model | 0.88 | Grip Tester | Laser profilometry (macro-textural parameters) | [162] |
| 9 | 0.43 to 0.82 | British Pendulum Number, Grip Number, Dynamic Friction Test | Macrotexture and microtexture parameters, obtained by profilometry | [163] | |
| 10 | 0.78 | Grip Tester | Texture parameters, obtained by 3D scanning data | [164] | |
| 11 | Rubber friction theoretical model [22] with modified data from 3D scanning | 0.60 | British Pendulum Number | 3D scanning data | [165] |
| 12 | 0.84 | British Pendulum Number | Microtexture index obtained by 3D scanning | [132] | |
| 13 | 0.82 | British Pendulum Number | Texture parameters, obtained by 3D scanning | [133] | |
| 14 | Artificial neural network model | 0.77 to 0.95 | Dynamic Friction Tester | 3D scanning data | [131] |
| 15 | Artificial neural network model | 0.85 | Sideway-Force Coefficient Routine Investigation Machine (SCRIM) | Sand patch test and 3D scanning | [114] |
| 16 | 0.82 to 0.95 | British Pendulum Number | Microtexture and macrotexture average roughness and rubber content for different mixes | [166] |
Disclaimer/Publisher’s Note: The statements, opinions and data contained in all publications are solely those of the individual author(s) and contributor(s) and not of MDPI and/or the editor(s). MDPI and/or the editor(s) disclaim responsibility for any injury to people or property resulting from any ideas, methods, instructions or products referred to in the content. |
© 2025 by the authors. Licensee MDPI, Basel, Switzerland. This article is an open access article distributed under the terms and conditions of the Creative Commons Attribution (CC BY) license (https://creativecommons.org/licenses/by/4.0/).
Share and Cite
Baimukhametov, G.; White, G. Review and Improvement of Runway Friction and Aircraft Skid Resistance Regulation, Assessment and Management. Appl. Sci. 2025, 15, 548. https://doi.org/10.3390/app15020548
Baimukhametov G, White G. Review and Improvement of Runway Friction and Aircraft Skid Resistance Regulation, Assessment and Management. Applied Sciences. 2025; 15(2):548. https://doi.org/10.3390/app15020548
Chicago/Turabian StyleBaimukhametov, Gadel, and Greg White. 2025. "Review and Improvement of Runway Friction and Aircraft Skid Resistance Regulation, Assessment and Management" Applied Sciences 15, no. 2: 548. https://doi.org/10.3390/app15020548
APA StyleBaimukhametov, G., & White, G. (2025). Review and Improvement of Runway Friction and Aircraft Skid Resistance Regulation, Assessment and Management. Applied Sciences, 15(2), 548. https://doi.org/10.3390/app15020548