Article

Parametric Analysis of Control Techniques for 15 MW Semi-Submersible Floating Wind Turbine

1
Department of Integrated Energy and Infra System, Kangwon National University, Chuncheon-si 24341, Republic of Korea
2
Korea Research Institute of Ships and Ocean Engineering, 32, 1312 Beon-gil, Yuseong-daero, Yuseong-gu, Daejeon 34103, Republic of Korea
3
Department of Mechatronics Engineering, Kangwon National University, Chuncheon-si 24341, Republic of Korea
*
Authors to whom correspondence should be addressed.
Appl. Sci. 2025, 15(2), 519; https://doi.org/10.3390/app15020519
Submission received: 29 November 2024 / Revised: 27 December 2024 / Accepted: 6 January 2025 / Published: 8 January 2025
(This article belongs to the Topic Advances in Wind Energy Technology)

Abstract

:
In this study, a composite control algorithm based on classical control methods is developed to achieve all control objectives, such as power production, load reduction, and motion reduction, for the floating wind turbine. In previous studies, peak shaving and nacelle feedback were used together to reduce both platform motion and the tower-base loads of floating wind turbines. The new approach presented in this study not only addresses the platform motion and tower loads but also aims to mitigate the rotor speed fluctuations and the blade loads by additionally introducing feedforward control and individual pitch control. This expansion enhances the applicability and control performance of classical control algorithms. To achieve this, parametric simulations were conducted using OpenFAST to assess the effects of control parameter variations for each control technique. The simulation results showed that the proposed control algorithm significantly reduced the rotor speed fluctuations, tower loads, blade loads, and platform motion compared with the baseline controller.

1. Introduction

The power production of a variable-speed variable-pitch (VSVP) type wind turbine can be achieved by controlling the blade pitch angle and the generator reaction torque [1]. However, since wind turbines are continuously exposed to wind, additional control techniques are required beyond the basic control for power production to mitigate fatigue loads and power fluctuations, both of which can cause instability in the control system [2]. The fatigue load on the drivetrain of the geared type of wind turbines can be mitigated using a drivetrain damper that filters drivetrain torsional vibration mode components from the measured generator speed and adds the phase-opposite component to the generator torque command. Fateh et al. demonstrated that the drivetrain damper can significantly reduce the torque variations in the gearbox [3]. The fatigue load on the tower can be reduced by a tower damper that controls the nacelle acceleration filtered through an integrator and a phase compensator and adds it to the blade pitch command. Pascu et al. showed that the active tower damper significantly reduced the fore-aft fatigue load at the tower base [4]. The fatigue load on the blade can be mitigated using the individual pitch control (IPC), which controls each blade individually to address the blade-root load feedback. Mohammadi et al. showed that IPC was able to reduce oscillations on the blade root by 40% [5]. The fatigue load caused by the rotor thrust can be reduced using peak shaving, which adjusts the blade pitch angle proactively in regions with wind speeds lower than the rated wind speed. Kim et al. found that peak shaving reduced the fore-aft fatigue load on the tower base and the flap-wise fatigue load on the blade root by up to 9% and 14%, respectively [6]. The rotor speed fluctuations can be mitigated by adding a feedforward term to the blade pitch control loop, utilizing wind speed estimated by a wind speed estimator. Meng et al. demonstrated that the feedforward control reduced the standard deviations of the rotor speed by 20% [7].
However, in the case of floating wind turbines, which are continuously exposed not only to wind but also to waves, damping techniques are required not only to mitigate fatigue loads and power fluctuations but also to reduce the platform motion. Structural damping techniques include reducing platform motion by integrating a tuned mass damper (TMD) into the tower. Zhang et al. demonstrated through experiments that using the TMD can reduce the peak amplitude of the acceleration and the tower bending moment by 7.8% and 8.8%, respectively [8]. Chapain et al. showed that a pounding TMD (PTMD) could achieve approximately 10% greater reduction in peak acceleration amplitude compared with the conventional TMD [9]. Han et al. improved the performance of the conventional TMD by employing multiple TMDs (MTMD) [10]. Regarding damping techniques through active control, the platform resonance can be avoided by adjusting the control gain so that the blade pitch control frequency is lower than the resonant frequency of the platform. In the study by Stockhouse et al., the detuning technique could increase the damping of platform motion by up to 13% [11]. The fluctuation of the platform pitch motion can be reduced using tower damper structures that were originally developed for fixed wind turbines. According to Lenfest et al., the feedback control of the tower-top velocity, known as nacelle feedback, could significantly reduce the platform pitch motion [12]. Oh et al. showed that the feedback control of the nacelle angular acceleration was able to reduce the standard deviation of the platform pitch motion and the fore-aft fatigue load at the tower base by approximately 80% and 30%, respectively [13]. The feedforward control, originally developed for fixed wind turbines, could also be used to reduce the power fluctuations in the floating wind turbines. In the study by Schlipf et al., the feedforward control reduced both the rotor speed and the generator power fluctuations of the floating wind turbines by 81% under gust conditions [14].
As the reasons for achieving a better system performance of floating wind turbines have become more important, studies based on modern control theories have also been conducted. Using state observers and a linear quadratic regulator (LQR), the root mean square error (RMSE) of the platform pitch motion and the generator speed were able to be reduced by 16% and 32%, respectively [15]. Additionally, state control of floating platforms using a model predictive control (MPC) demonstrated a significant reduction in the platform motions [16]. However, the modern control algorithms proposed in the literature required a complete replacement of the classical multiple SISO (Single Input Single Output) loop-based blade pitch and generator torque control structures with a full-state feedback control structure to address multiple inputs. Accordingly, replacing the conventional classical control algorithms, which have demonstrated stable performance over long periods, with modern control algorithms remains challenging for the industry to readily accept, due to the costs, time for field testing, and compatibility issues with existing control systems.
Accordingly, composite control algorithms combining classical control-based techniques with various objectives have been recently proposed for floating offshore wind turbines. In the study by Fleming et al., adding the tower damper, nacelle feedback, and peak shaving to the baseline controller resulted in a 22% reduction in the fore-aft tower fatigue loads, while the blade pitch rate was reduced by 4% [17]. In the study by Abbas et al., adding the nacelle feedback and the peak shaving to the baseline controller reduced the platform pitch motion by 15.4% and 29.1%, respectively, and also reduced the tower-base load by 24.4% and 48.2%, respectively [18]. However, despite the superior performance of the feedforward control in reducing the rotor speed and power fluctuations and the IPC in reducing the blade loads in previous studies, composite control algorithms based on the classical control methods proposed in the literature have primarily focused on reducing the platform motion or tower loads. Additionally, the effect of changes in control parameters on the performance of power production, load reduction, and motion reduction has not been sufficiently addressed.
Therefore, the objectives of this study are to develop an optimal controller based on the classical control method that incorporates feedforward, IPC, peak shaving, and nacelle feedback to achieve all the control goals—power production, load reduction, and motion reduction—of the target FOWT. A performance comparison is then conducted according to the control parameters. By achieving control objectives for FOWTs, such as power production, load reduction, and motion mitigation, it is expected that operational and maintenance costs for the target FOWT will decrease, the lifespan of critical components will extend, and the levelized cost of energy (LCoE) could be reduced. Analogously, Rodríguez-Pérez et al. demonstrated that the integration of advanced technologies can improve energy efficiency and sustainability while evaluating the viability of microturbines in water networks [19].
The structure of the paper is as follows. Section 2 provides an overview of the target floating wind turbine. Section 3 describes the proposed composite control algorithm. Section 4 analyzes the results of the parametric study. Section 5 discusses control techniques that can be further considered for the target floating wind turbine. Section 6 wraps up the study.

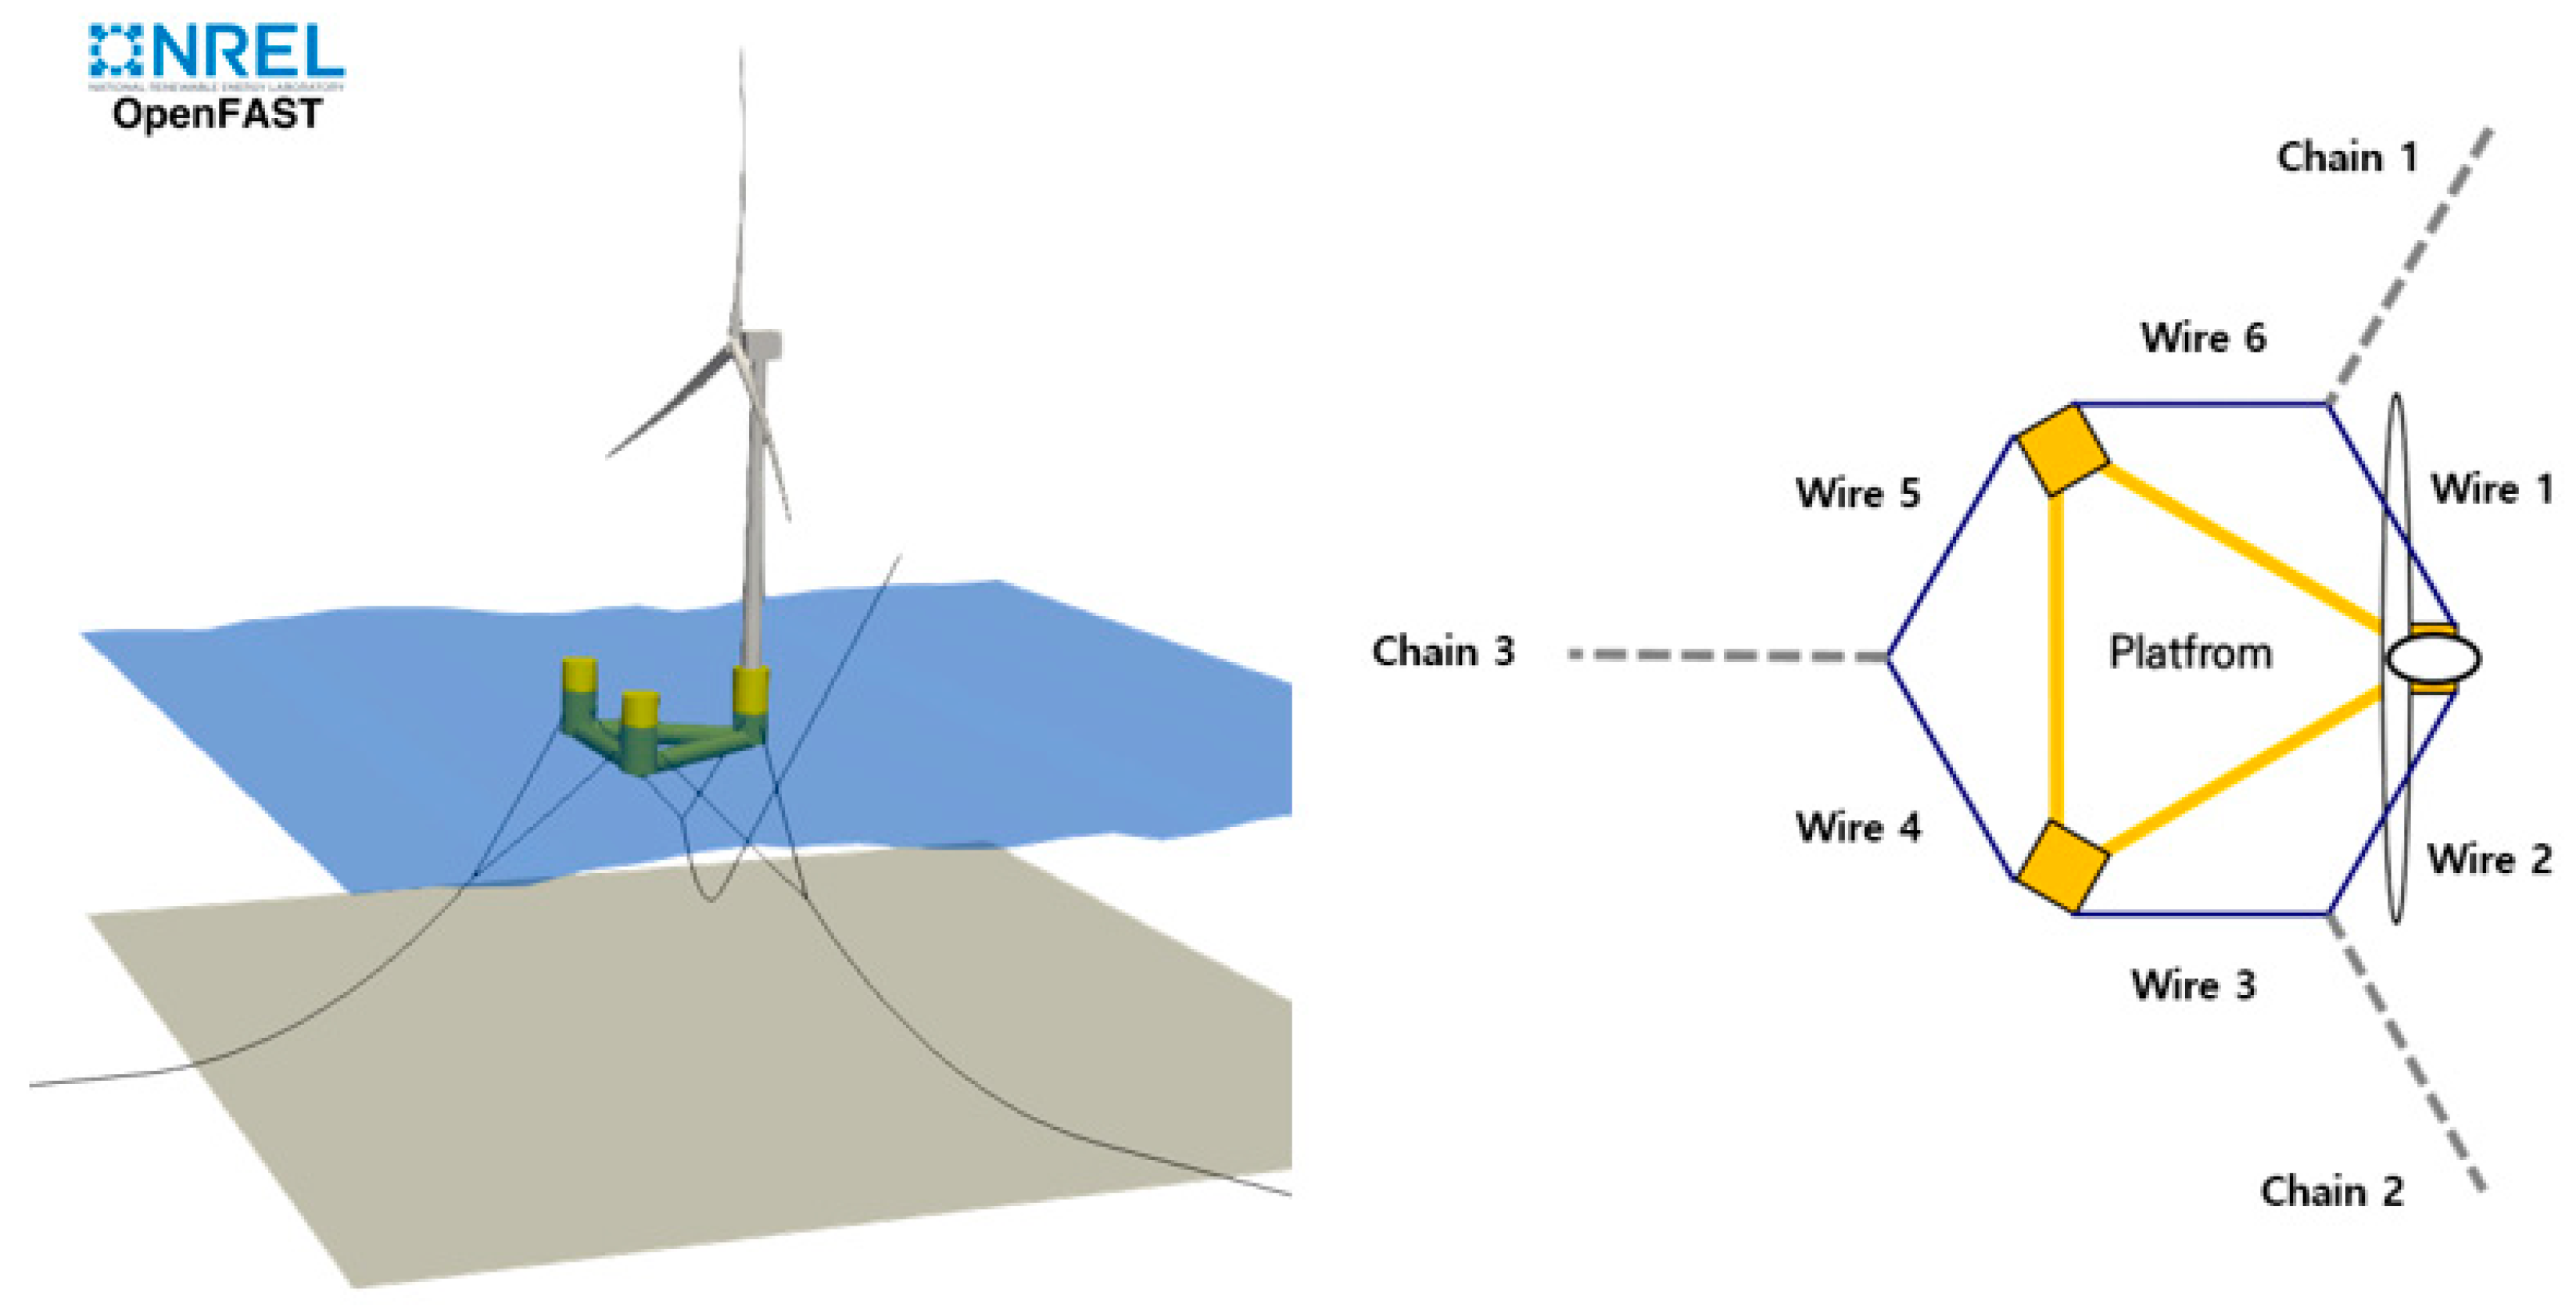
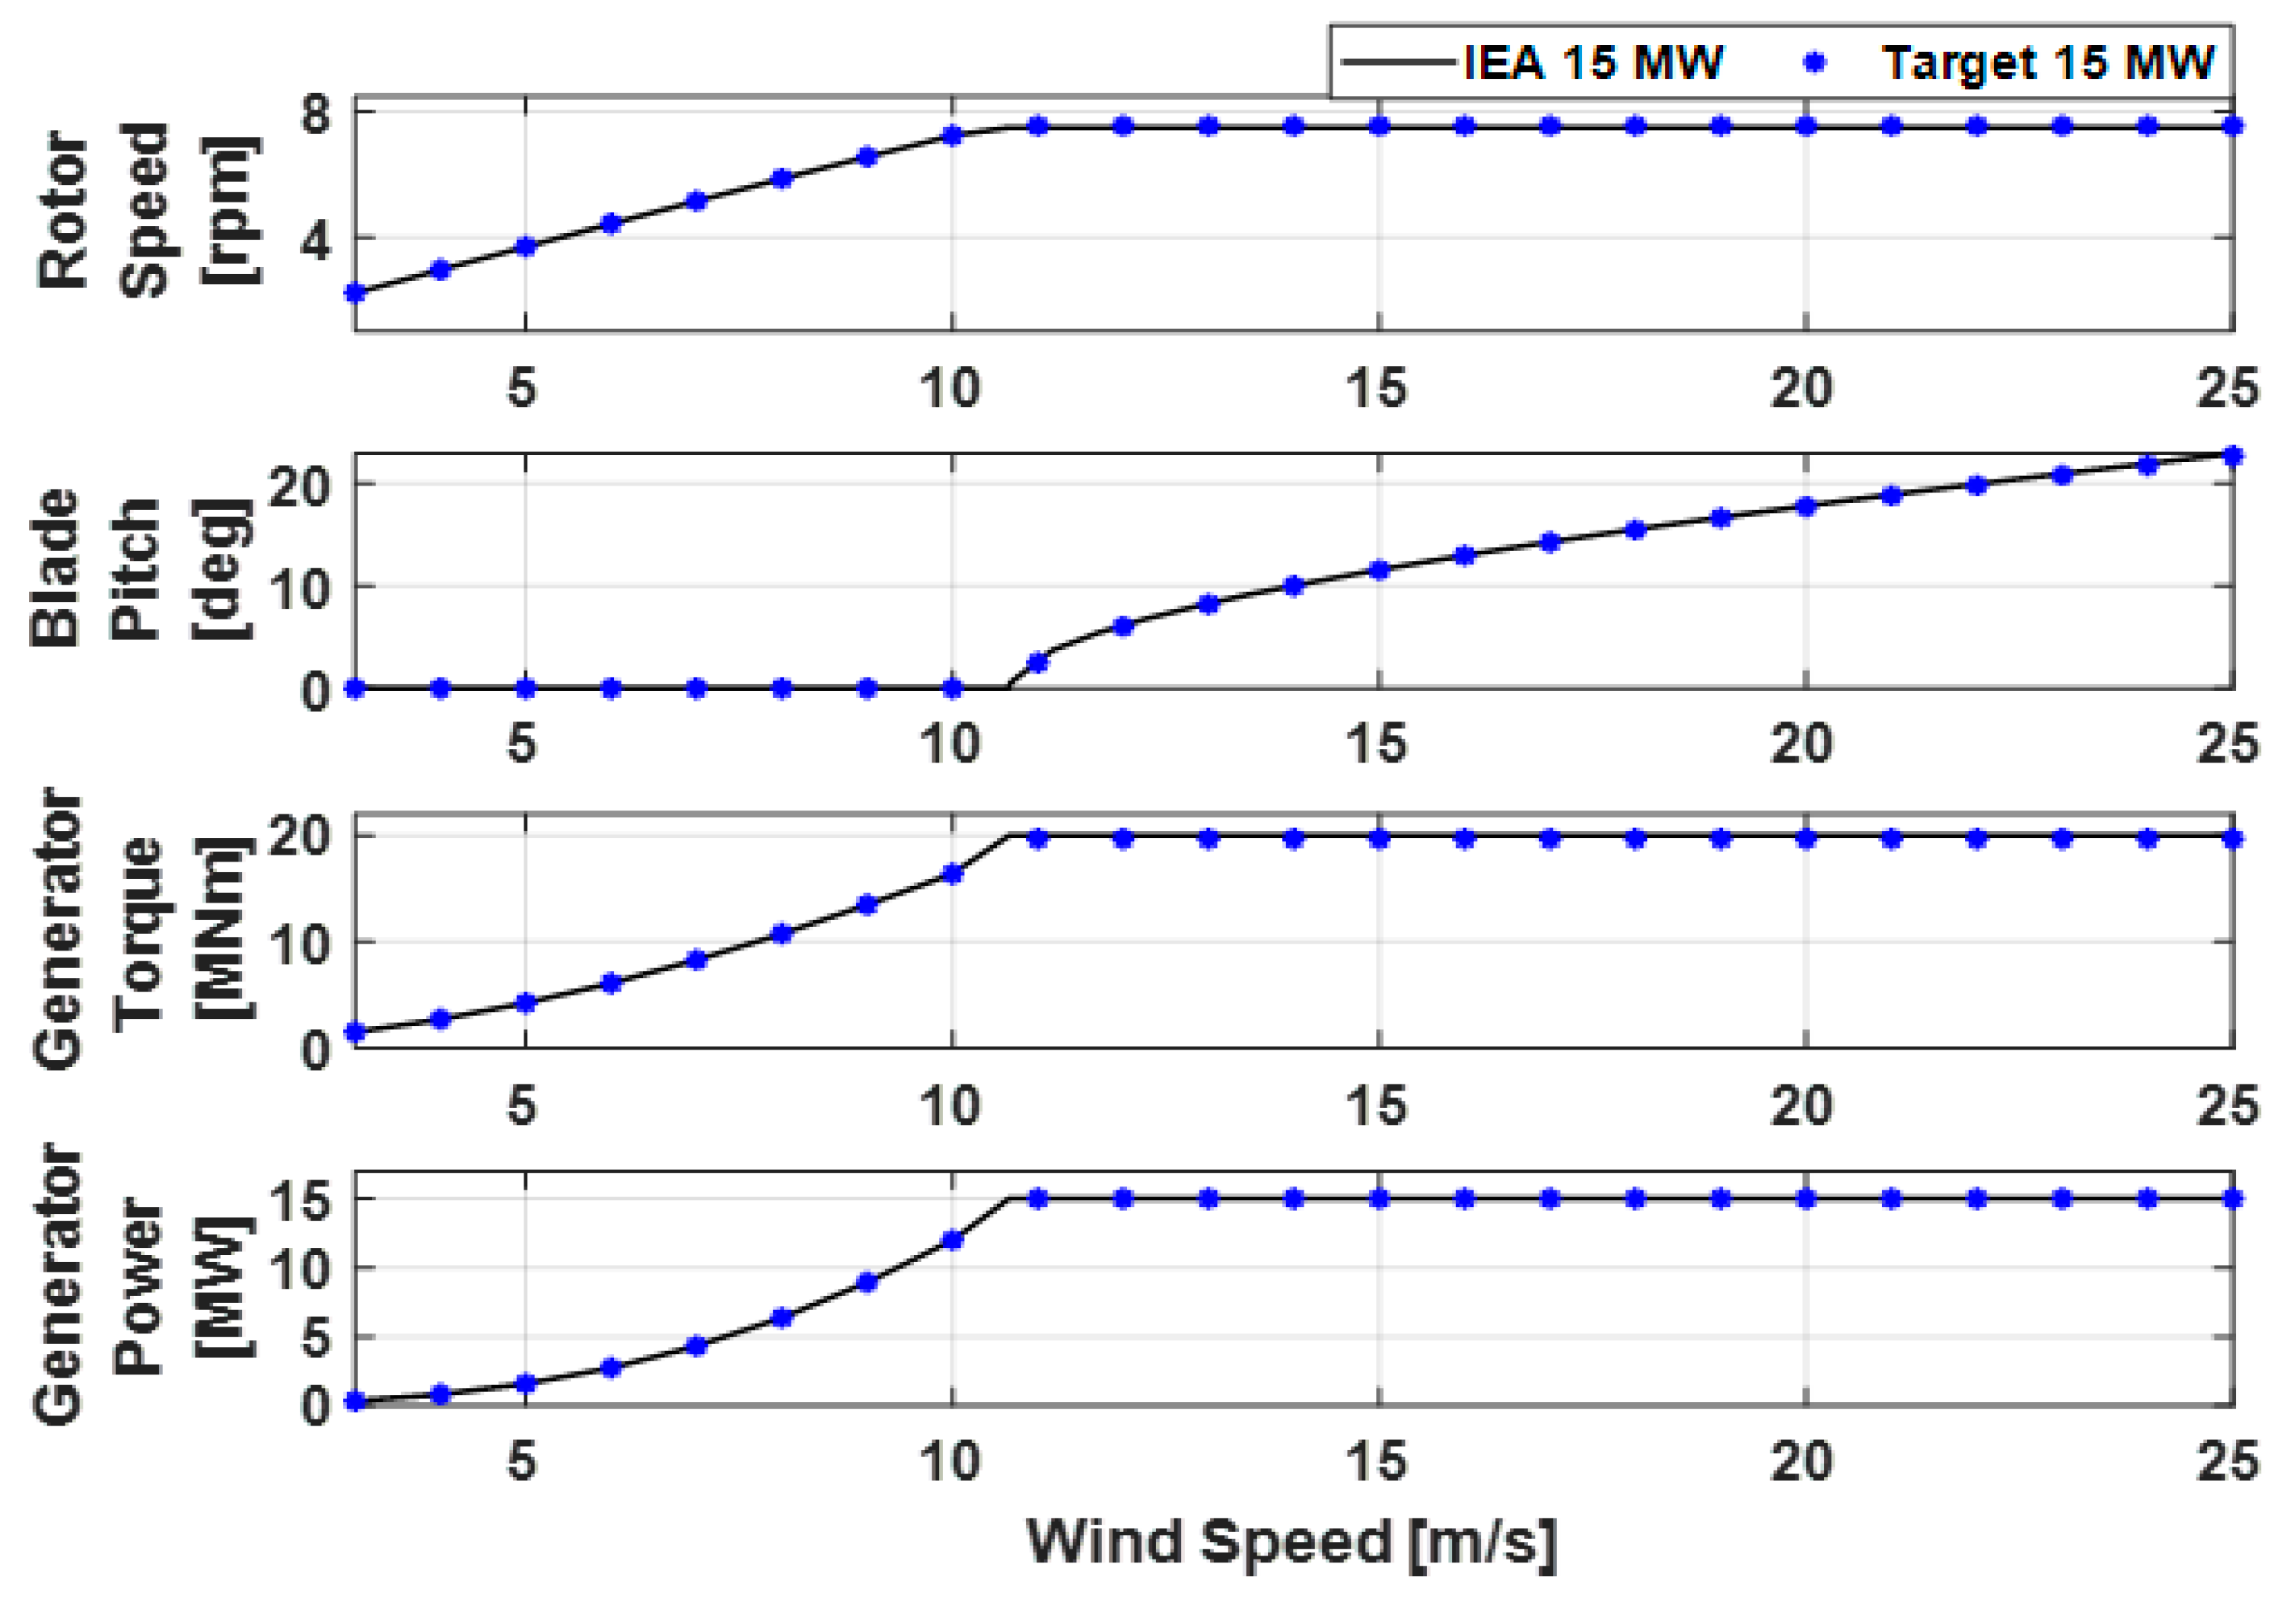
2. Target Floating Wind Turbine

2.1. Numerical Modeling

The target FOWT is a model in which the IEA 15 MW wind turbine, proposed by NREL for research purposes, is combined with a semi-submersible floating platform developed by Korea Research Institute of Ships and Ocean Engineering (KRISO). Figure 1 shows the numerical model and schematic depictions of the target FOWT. The mooring lines consist of three chains and six wires. Table 1 provides the specifications of the target FOWT. The target FOWT features a rotor diameter of 240 m, a hub height of 150 m, and a rated rotor speed of 7.55 rpm. The numerical modeling of the target FOWT was conducted using the open-source wind turbine simulation tool OpenFAST (Version 3.5.2, 2024).

2.2. Verification of OWT Numerical Modeling

To verify the operational performance of the numerically modeled offshore wind turbine (OWT) in OpenFAST, steady-state simulation was conducted. Figure 2 presents the comparison of steady-state simulation results between the IEA 15 MW numerical model provided as open source by NREL and the numerical model implemented in this study [20]. The results showed that the two models exhibited identical operational performance in terms of the rotor speed, blade pitch, generator torque, and generator power across the range from cut-in wind speed to cut-out wind speed.

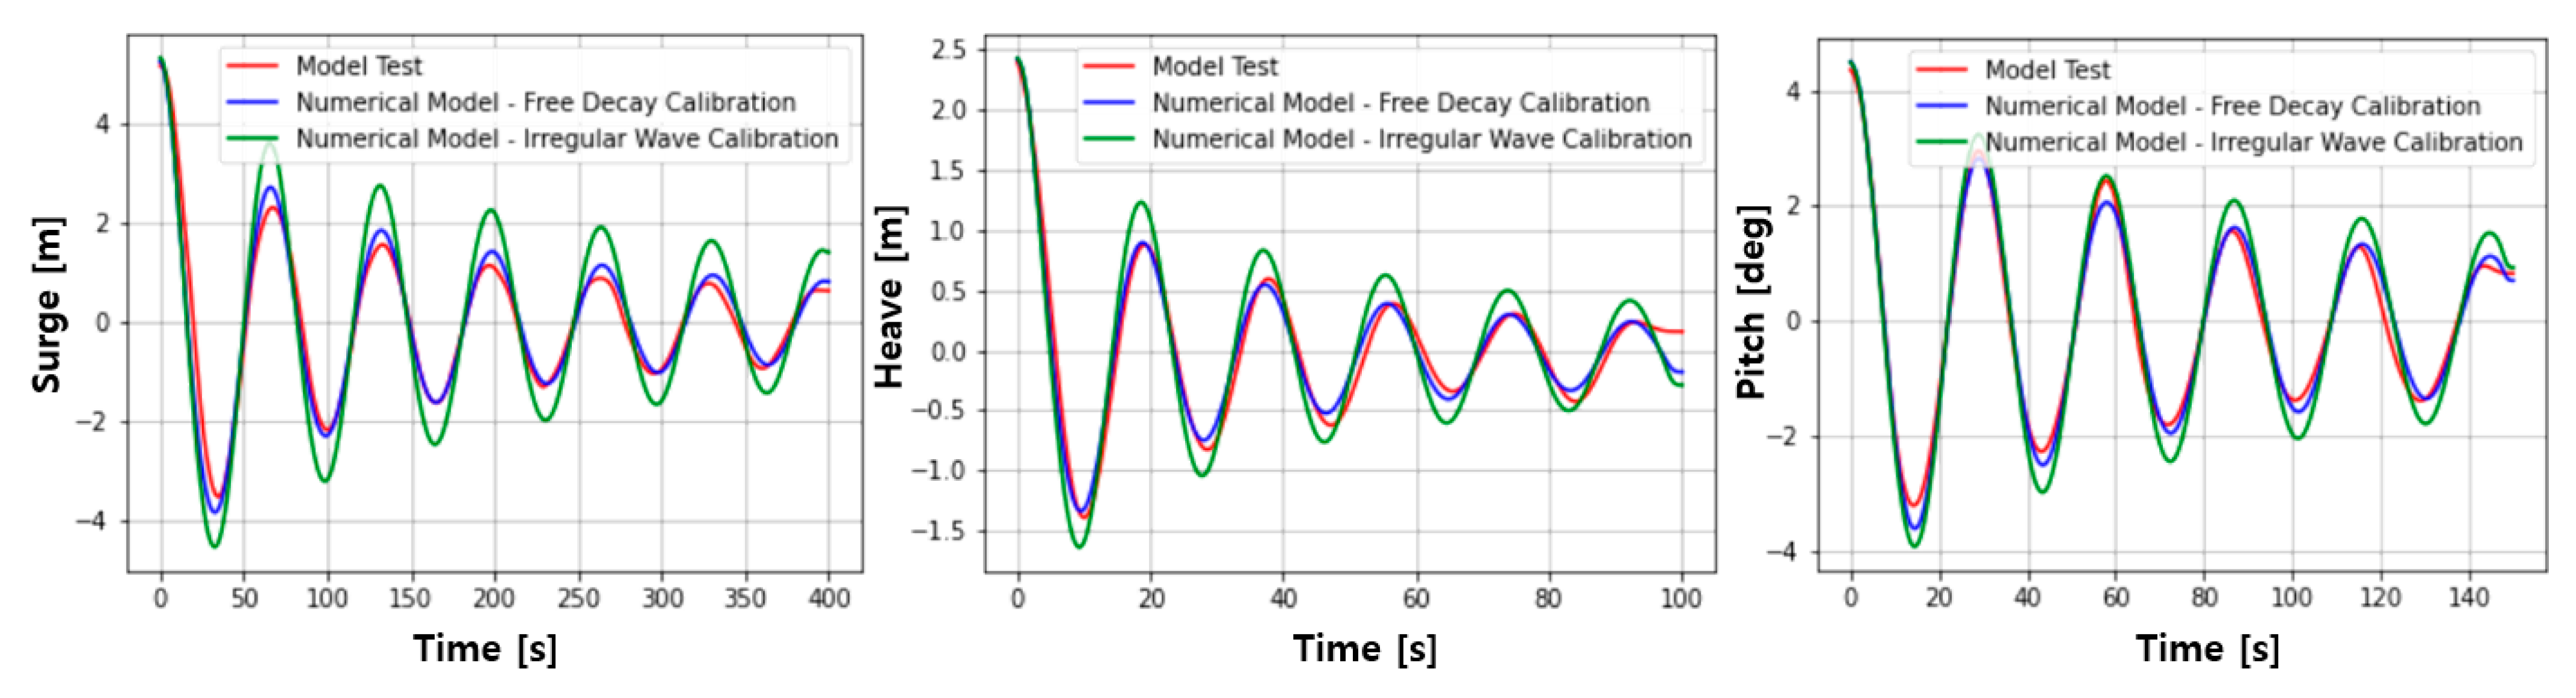
2.3. Verification of FOWT Numerical Modeling

OpenFAST was developed to allow the integration of WAMIT analysis results, a hydrodynamic analysis tool, to model the complex interactions among the floating platform, moorings, and hydrodynamic forces of floating offshore wind turbines [21]. In this study, hydrodynamics associated with the floating motion were implemented in OpenFAST by applying WAMIT analysis results, which were matched to the experimental results from model testing, including free decay and response amplitude operator (RAO). Figure 3 shows the results of the free decay analysis comparing the experimental and simulation data.
Through the free decay calibration and the irregular wave calibration, the simulation results were found to have very similar frequencies and amplitudes to the experimental results. The RAO is suitable for evaluating whether the dynamic response of the floating platform is accurately modeled numerically, as it allows for the identification of the dynamic characteristics of the floater in the frequency domain, including the natural frequencies. Figure 4 presents the RAO analysis results comparing experimental and simulation data. The numerical model showed a close match with the experimental results in terms of the natural frequency responses of the surge, heave, and pitch motions observed in the low-frequency range.

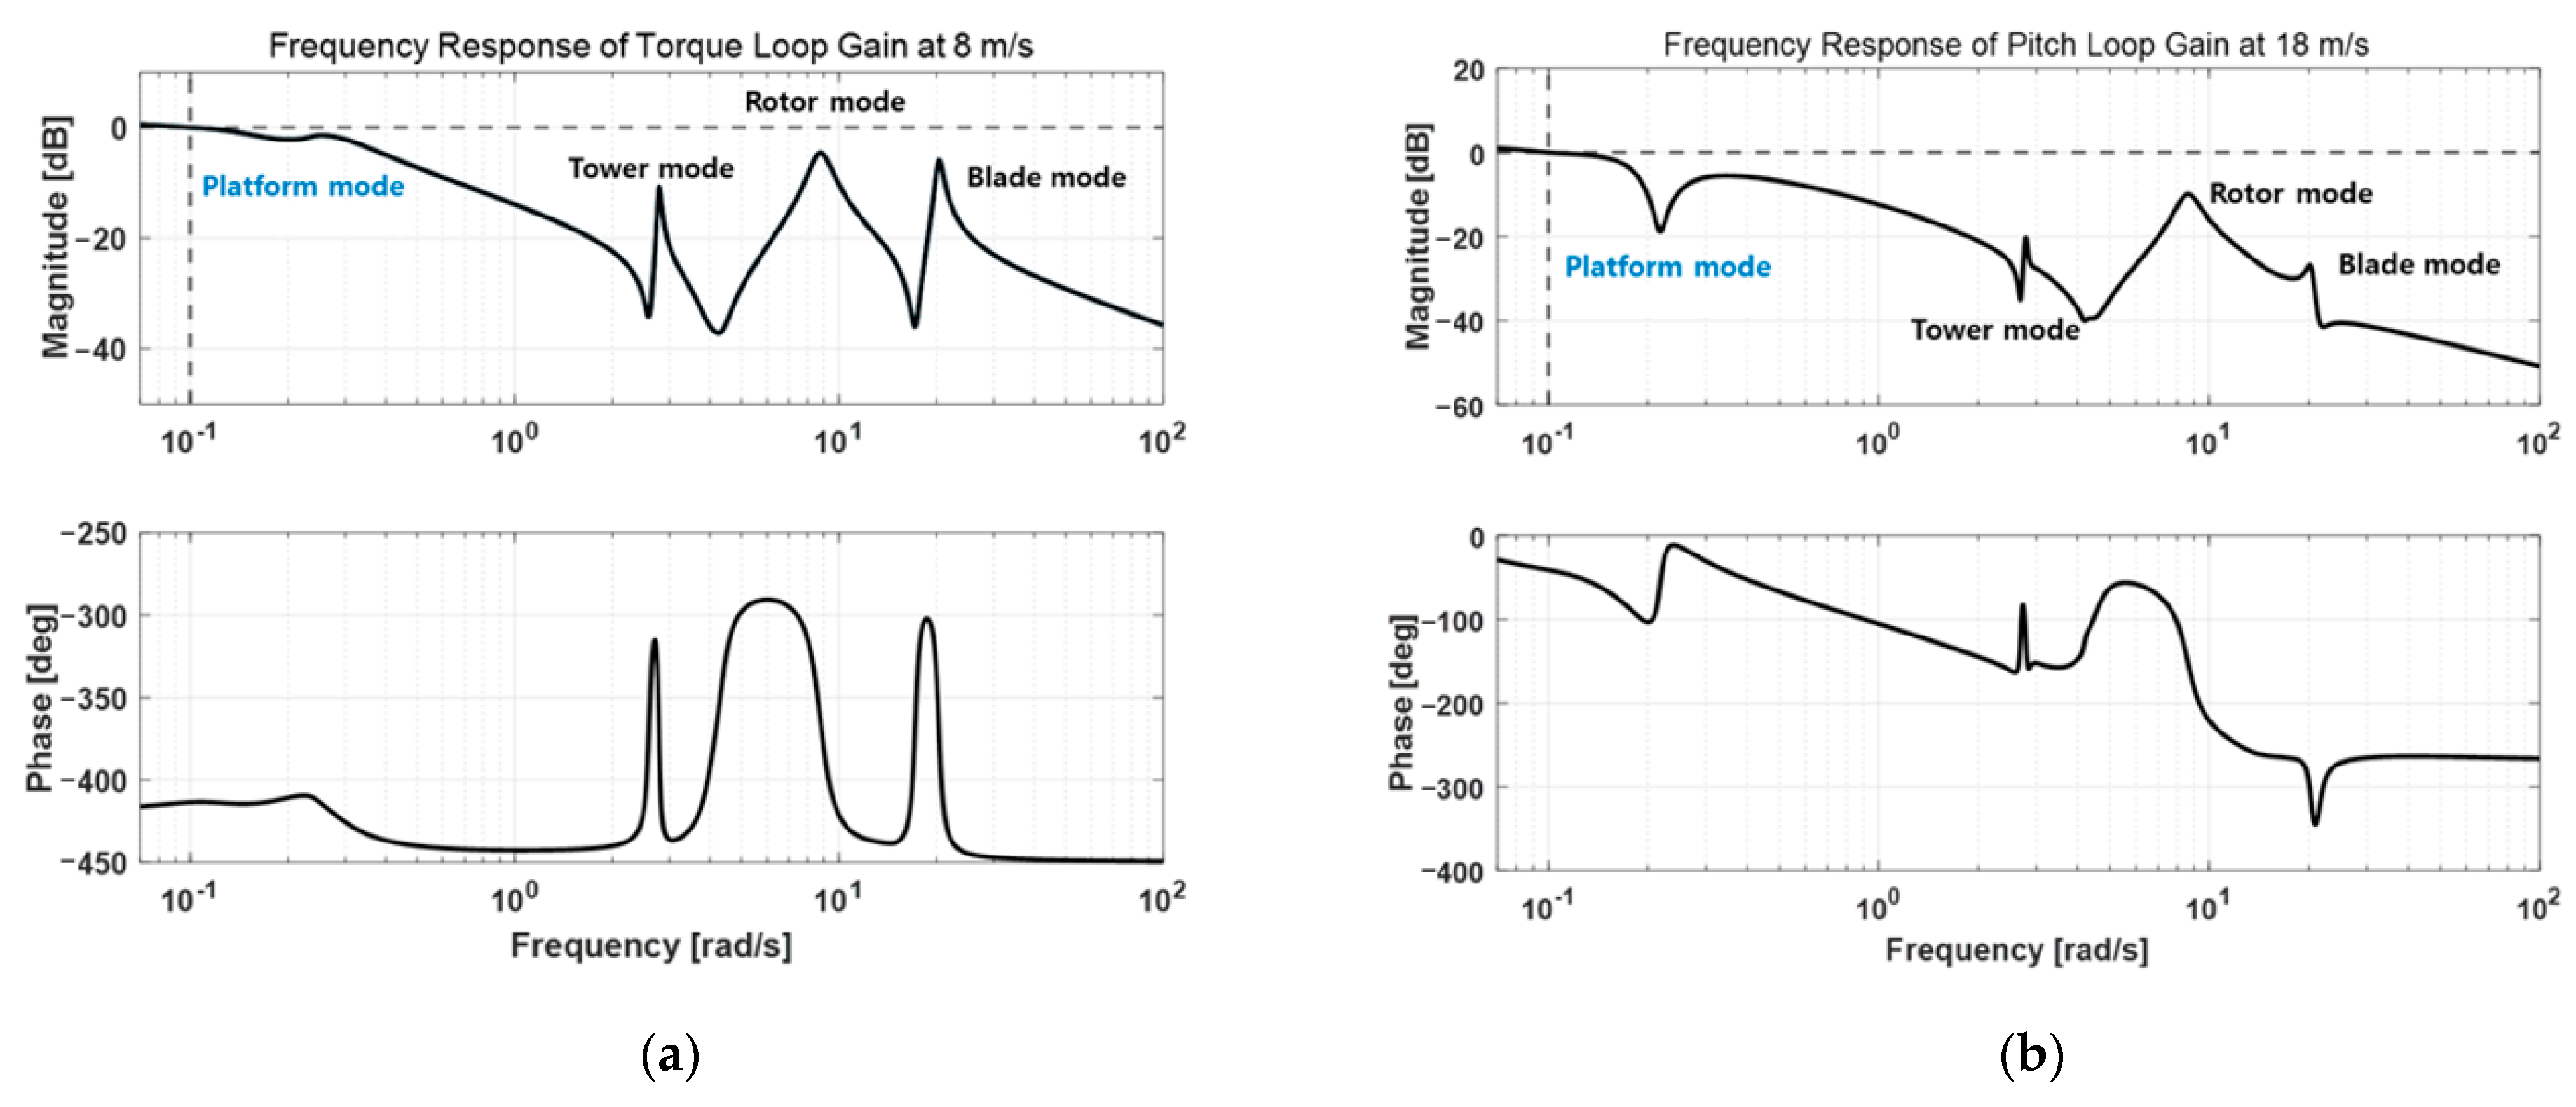
3. Control Algorithms

3.1. Baseline Control

In this study, the baseline controller consists of the classical PI control-based blade pitch controller and the generator torque controller. To avoid the resonance in the platform motions of the target FOWT, detuning techniques were applied [22]. Detuning can be achieved by selecting lower pitch and torque control frequencies than the platform’s natural frequency. To achieve this, the linearization analysis and frequency response analysis were conducted using the OpenFAST linearization tool. Figure 5 shows the frequency response functions of the blade pitch control loop and the generator torque control loop with respect to the generator speed. The resonance modes of the target floating offshore wind turbine—such as those of the platform, tower, rotor, and blade—were dominantly observed in both control loops. For detuning, the control gain was selected such that the magnitude of the frequency response crosses 0 dB at 0.1 rad/s, which is lower than the platform’s natural frequency.
Figure 6 shows the time-domain wind turbine simulation data without and with the detuning. It can be seen that the platform pitch motion, which was severe without detuning because the platform pitch mode is excited by blade pitching, is significantly mitigated when detuning is applied.

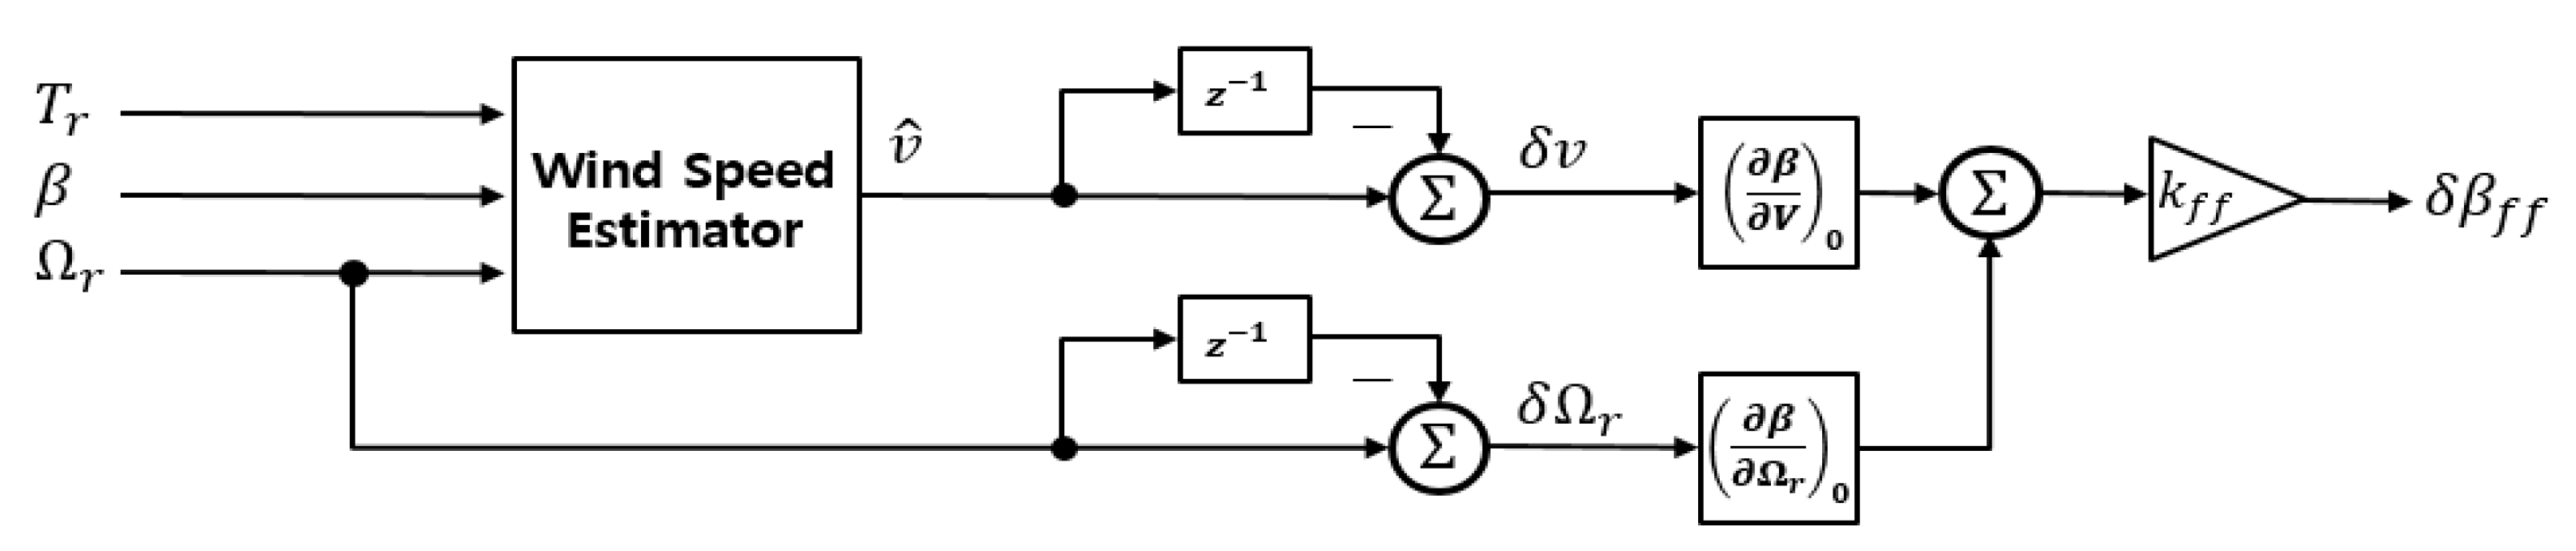
3.2. Feedforward Control

The feedforward control algorithm was designed to mitigate the rotor speed fluctuations of the target FOWT in regions where the wind speed is higher than the rated wind speed. The block diagram of the feedforward control algorithm is shown in Figure 7.
The required blade pitch angle increment δ β F F to reduce the rotor speed and the power fluctuations is calculated based on the variation in the estimated wind speed δ v and the variation in the measured rotor speed δ Ω r , utilizing each of the precomputed pitch control sensitivities in the algorithm [7he classicalST β V , β Ω r xh ofn] obtained offline through a function minimization algorithm [23]. The obtained blade pitch angle increment is adjusted by the feedforward control gain k f f as the control parameter. The wind speed estimator estimates the wind speed by using the relationship between the aerodynamic torque T r derived from the equation of motion for the generator and that from the aerodynamic coefficients [24,25].

3.3. Individual Pitch Control
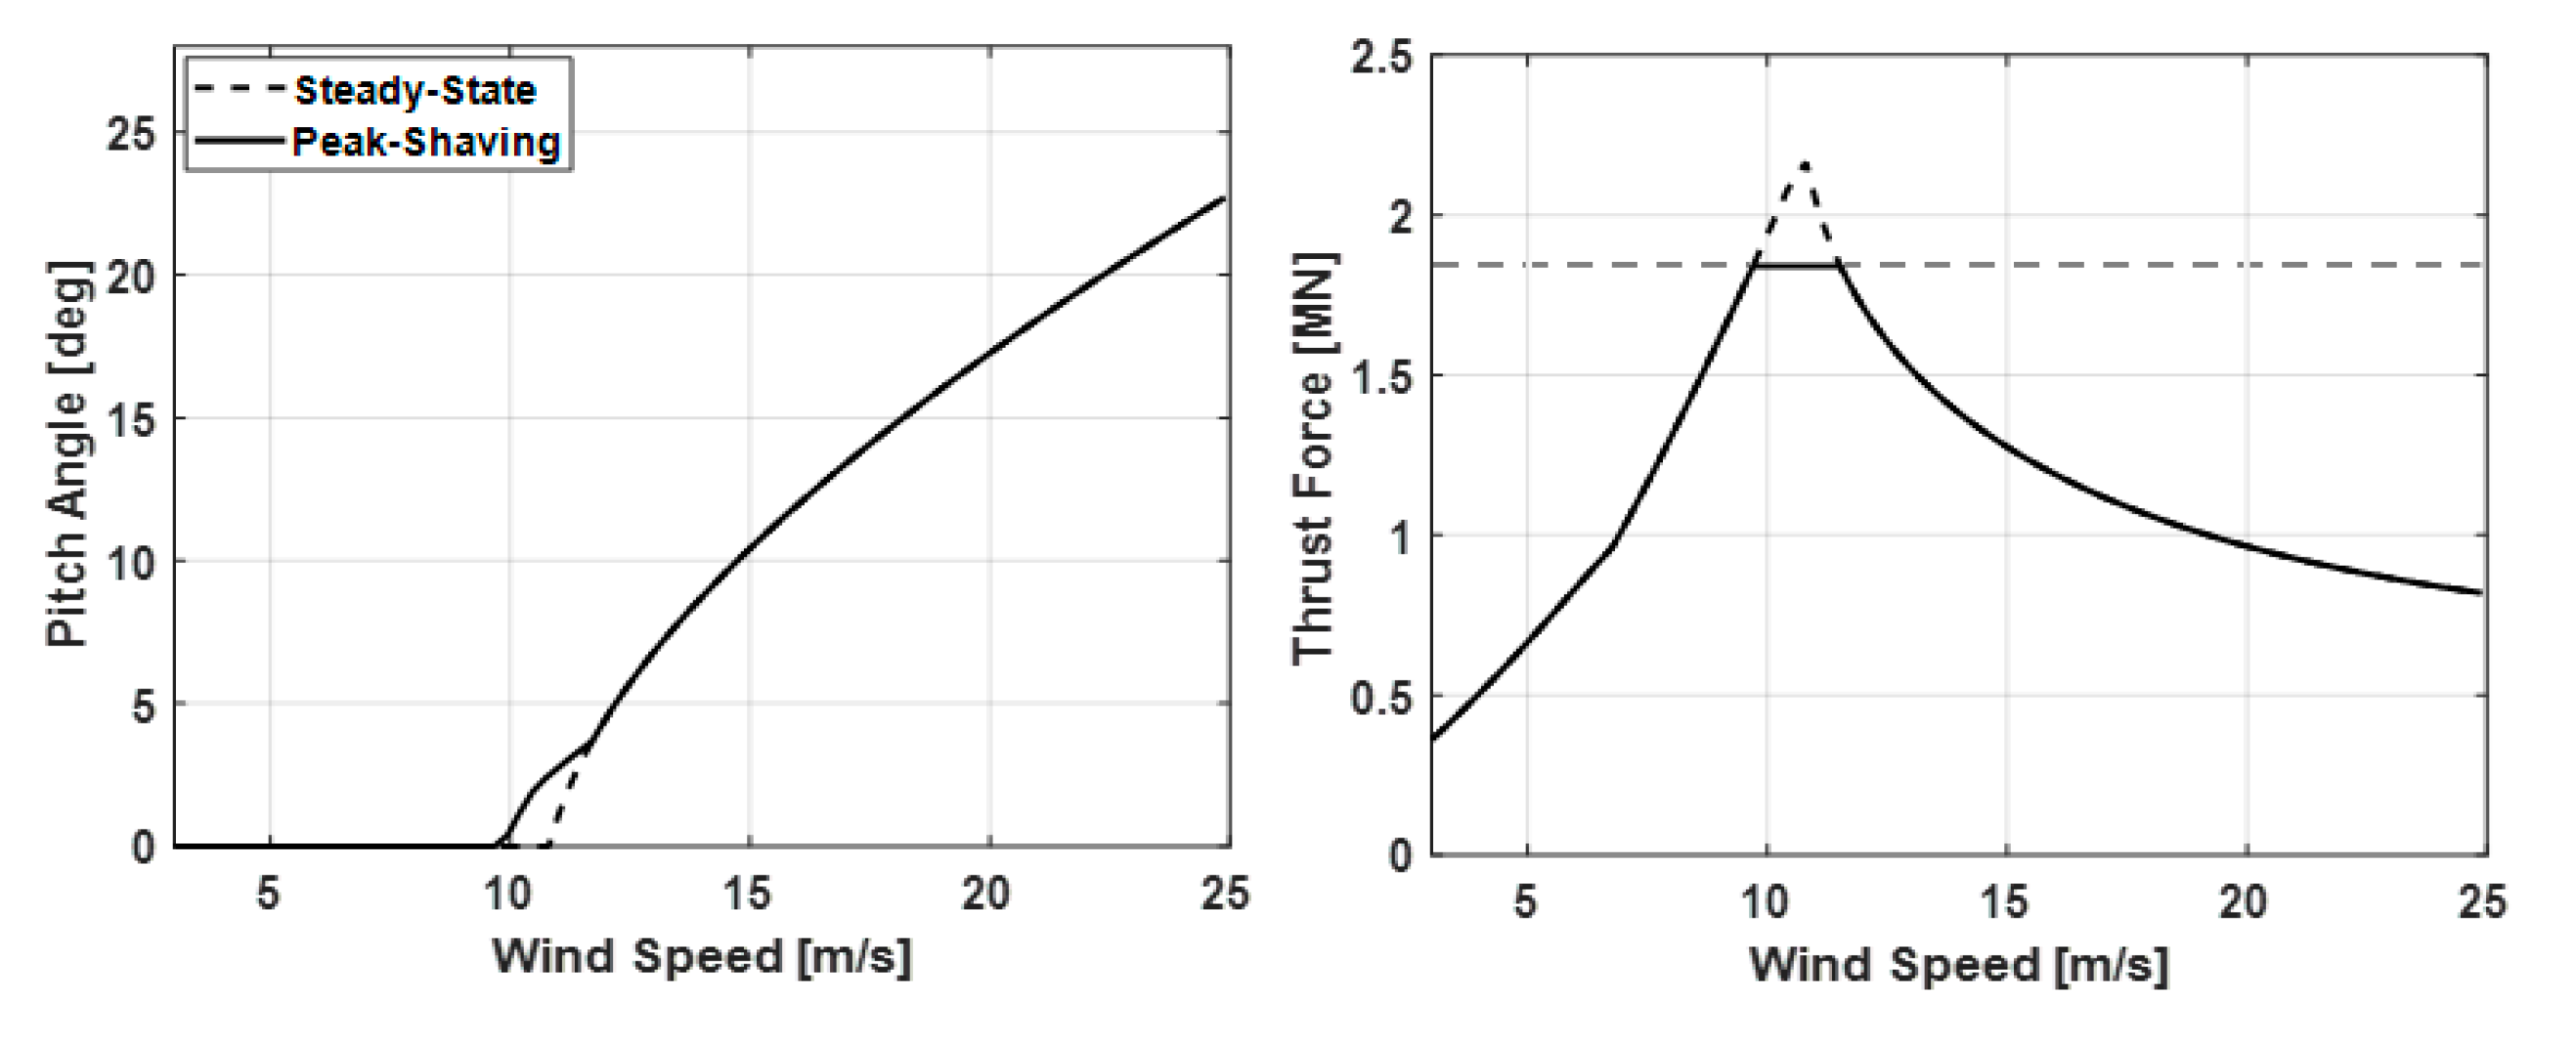
The individual pitch control algorithm was designed to reduce the blade loads of the target FOWT in regions where the wind speed is higher than the rated value. The block diagram of the individual pitch control algorithm is shown in Figure 8. To reduce the blade loads, the individual blade pitch angles θ B 1 i p c C M D ,   θ B 2 i p c C M D ,   θ B 3 i p c C M D in the rotating frame are calculated through the feedback control that minimizes the tilt and yaw moments M H _ t i l t ,   M H _ y a w in the fixed frame to zero [26]. However, it is challenging to control the loads in the fixed frame using control inputs in the rotating frame, so a multi-blade coordination (MBC) technique known as the Coleman transformation is used [27]. The feedback control is performed on the loads M H _ t i l t ,   M H _ y a w in the fixed frame obtained from the Coleman transformation of the rotating frame loads M B 1 _ o o p ,   M B 2 _ o o p , M B 3 _ o o p , and the IPC commands θ B 1 i p c C M D ,   θ B 2 i p c C M D ,   θ B 3 i p c C M D in the rotating frame are calculated through the inverse Coleman transformation. The control gain applied during the feedback control is adjusted as the control parameter.

3.4. Peak Shaving

The peak shaving algorithm was designed to reduce the platform pitch motion and the tower-base loads of the target FOWT in the rated wind speed region. The peak shaving is applied by pre-scheduling a minimum blade pitch angle limit to restrict the maximum allowable thrust to a specific level [18]. Figure 9 shows the steady-state simulation results of the blade pitch angle and the rotor thrust with the peak shaving applied. It can be seen that the blade pitch angle, which shaves the thrust peak in the rated wind speed region, has started to be used at slightly lower wind speeds than the rated wind speed. The percentage of the maximum allowable thrust was applied as the control parameter for the peak shaving.

3.5. Nacelle Feedback Control

The nacelle feedback control algorithm was designed to reduce the platform pitch motion of the target FOWT in regions where the wind speed is higher than the rated wind speed. To increase the damping ratio of the platform motion, the nacelle angular acceleration ψ ¨ n a c e l l e is converted to the nacelle angular velocity ψ ˙ n a c e l l e through the integrator with the filter required for signal processing, and the feedback control is conducted [13,18]. Figure 10 shows the block diagram of the nacelle feedback control algorithm. In the nacelle feedback control, the nacelle feedback control gain k n f is adjusted as the control parameter.

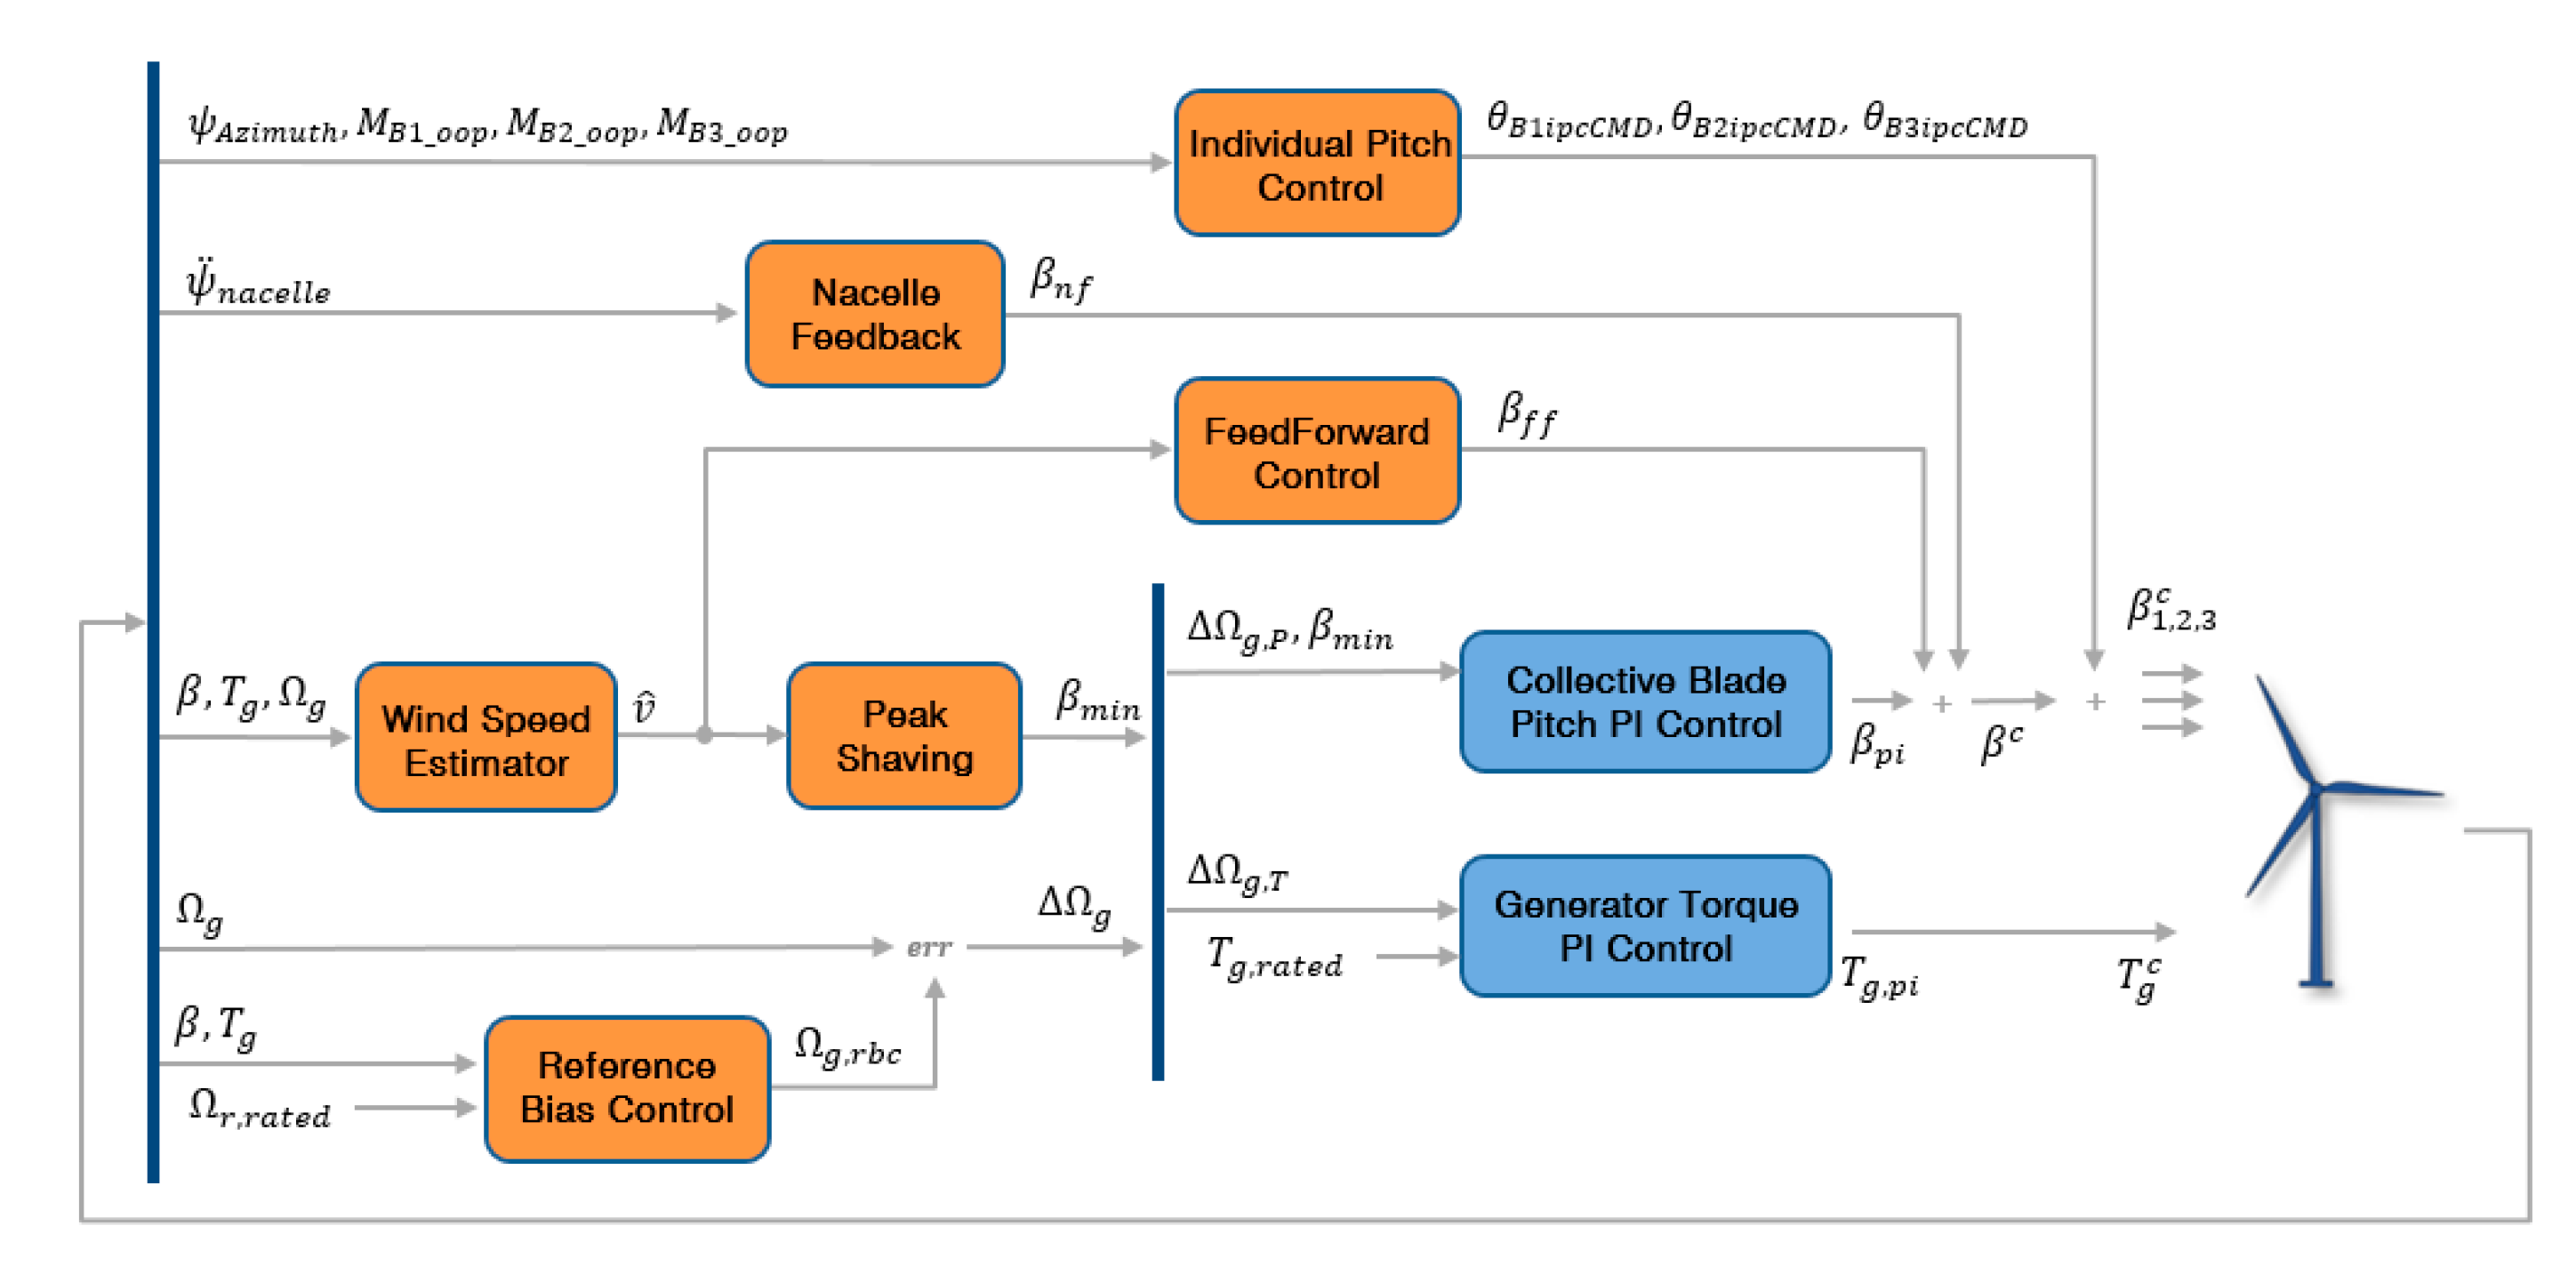
3.6. Whole Control Algorithm and Its Implementation

The whole control algorithm proposed in this study has a structure where the feedforward control, IPC, peak shaving, and nacelle feedback control algorithms are merged into the blade pitch control loop of the baseline controller. The block diagram of the whole control algorithm is shown in Figure 11. The reference bias control (RBC) was implemented to mitigate the transient response between the pitch control and torque control in the rated wind speed region, while the drivetrain damper was not applied to the torque control loop because the target FOWT is a direct-drive type wind turbine [28].
The proposed control algorithm was designed as an in-house code using MATLAB/Simulink (Version R2023b, 2023) and Visual Studio (Version 16.11.22, 2019) for implementation in OpenFAST. The control algorithm designed in MATLAB/Simulink is converted into C++-based source code through the ‘Code Generation’ tool in MATLAB and is then integrated into the source code for creating the controller file, which is compiled in Visual Studio. To facilitate parametric studies, coding was carried out to generalize the required control parameters in the controller file (DLL: dynamic link library file) so that they could be modified through the in-house developed controller input file (IN: input file).
The flowchart for the controller implementation is shown in Figure 12. The controller file and the control input file are input into the ServoDyn module in OpenFAST. These files output blade pitch control commands and generator torque control commands, interfacing with other dynamic modules in OpenFAST. Although the proposed control algorithm was designed using in-house code, the process for implementing the controller files in OpenFAST followed the methods verified and suggested by NREL, the provider of OpenFAST [18]. The proposed control algorithm, in the form of the C++ source code prior to the creation of the controller files as shown in Figure 12, can be included and uploaded to the commercial Programmable Logic Controller (PLC). This facilitates the link between simulation-based verification and the experimental validation of the proposed control algorithm. Therefore, the results presented in this study hold significant industrial applicability and practical value. In fact, the same approach has been adopted in other studies, where it was used to implement wind tunnel experiments or field tests utilizing commercial Bachmann PLC [28,29].

4. Controller Evaluation

4.1. Parametric Study

To improve the control performance of the proposed control algorithm and analyze its trend with respect to the control parameters, parametric simulations were conducted for the feedforward control, IPC, peak shaving, and the nacelle feedback control techniques. For each control algorithm added to reduce the fatigue loads and the platform motion, the control performance was compared with the baseline control algorithm. Each simulation was conducted for 600 s under the normal turbulence model (NTM) and normal sea state (NSS) conditions, which are recommended as normal operating conditions in the international guidelines for the floating offshore wind turbine development by the International Electrotechnical Commission (IEC) [30,31]. The NTM and NSS conditions define turbulence intensity, wave height, and wave period for a given wind speed based on their respective spectrum models. These conditions have been employed in numerous studies as standard environmental conditions for verifying control performance [12,13,18,20].
Figure 13 shows the simulation results of the feedforward control and the IPC compared with the baseline control for the wind speed, wave elevation, rotor speed, blade pitch angle, generator torque, generator power, platform pitch motion, tower-base fore-aft bending moment, and the blade-root flap-wise bending moment, respectively.
Since both feedforward control and IPC were designed for operation in the above-rated wind speed region, the NTM and NSS conditions corresponding to the mean wind speed of 20 m/s were applied. These conditions include the turbulence intensity of 14.4%, the significant wave height of 3.62 m, and the peak spectral wave period of 8.52 s. In the case of Figure 13a, it was observed that the feedforward control mitigated the rotor speed and the power fluctuations compared with the baseline control, primarily in situations where the wave fluctuations increased, around 20, 100, 300, and 550 s. This indicates that the pitch control sensitivity, which varies with the wave fluctuations, is adequately managed by the feedforward controller and that it has also been shown to slightly reduce the platform pitch motion. In Figure 13b, the IPC resulted in a reduction in the blade-root flap-wise loads compared with the baseline control. The reduced loads were observed at the 1-revolution frequency component of the individual blade loads, and the blade fatigue loads were significantly reduced throughout the entire time span.
Figure 14 shows the simulation results of the peak shaving and the nacelle feedback control compared with the baseline control. Since peak shaving was designed for the rated wind speed region, the NTM and NSS conditions corresponding to the mean wind speed of 12 m/s were applied. These conditions include the turbulence intensity of 20.0%, the significant wave height of 1.84 m, and the peak spectral wave period of 7.44 s. In the case of the nacelle feedback control, which is designed for the control in the above-rated wind speed region, the same conditions as the simulation in Figure 13 were applied. In Figure 14a, the peak shaving was able to reduce the maximum platform pitch motion and the tower load compared with the baseline control. This was mainly observed around 20 and 500 s when the minimum blade pitch angle near the rated wind speed was limited by peak shaving. It was found that as the thrust peak was shaved, the maximum platform pitch motion and tower load were also reduced. In Figure 14b, nacelle feedback control showed a reduction in the platform pitch motion compared with the baseline control. The reduction in the pitch motion was primarily observed around 50 and 400 s, where the platform pitch fluctuations were relatively larger, and as a result, the tower loads were also reduced.
Table 2 quantitatively compares the control performance resulting from changes in control parameters for the feedforward, IPC, peak shaving, and nacelle feedback controls, compared with the baseline control. The control parameters include the feedforward gain, IPC gain, maximum allowable thrust percentage, and the nacelle feedback gain, each normalized into four levels with similar intervals. Since the objective of this parametric study is to identify performance trends based on the control parameters, the control parameters were selected through a trial-and-error process aimed at achieving reasonable control performance. However, to ensure justification, the control parameters were, where possible, selected based on previously established values that had been used for the IEA 15 MW wind turbine [18]. For example, in the case of peak shaving, studies have applied 75% as the maximum allowable thrust percentage; thus, the range of control parameters was chosen around this value, covering four cases. To compare the performance of each control technique, primary performance indicators such as the mean power, standard deviation of the rotor speed, and the platform pitch motion, as well as the damage equivalent load (DEL) for the tower base fore-aft load and the blade-root flap-wise load, are presented.
As the control parameters increase, the feedforward controller reduces the variations in the rotor speed and platform pitch motion, but the tower and blade loads are slightly increased. When the feedforward control parameters are at their highest level among the four levels, all loads become unstable. For the IPC, as the control parameters increase, blade loads are gradually reduced, but the variations in the rotor speed, platform pitch motion, and tower-base loads are slightly increased. When the control parameters for the individual pitch control are at their highest level, the platform pitch motion and the tower loads worsen. The peak shaving results in a gradual reduction in the platform pitch motion and the tower loads as the control parameters increase, but there is a slight decrease in the mean power. The nacelle feedback control significantly reduces the platform pitch motion as the control parameters increase. However, if the control parameters reach the highest level, the rotor speed deviation and blade loads worsen. Therefore, the control parameters of level 2 were selected for each part of the overall control algorithm with a focus on preventing the deterioration of other performance indicators.

4.2. DLC Simulation

Additional simulations based on the design load cases (DLCs) were performed to verify the control performance of the overall control algorithm with the feedforward, IPC, peak shaving, and the nacelle feedback control, along with the selected control parameters from the parametric study. These DLC simulation conditions include the environmental conditions that maximize the platform motion and mooring line tension of the target FOWT under operation with the proposed control algorithm. The conditions cover the rated wind speed range, where maximum thrust occurs, the cut-out wind speed range, where the highest wind speed is reached, and severe sea states (SSS). By comparing the control performance under these severe simulation conditions, the control performance and dynamic characteristics of the proposed control algorithm can be easily observed, thus ensuring the reliability of the control system. The presented DLCs are divided into three specific scenarios and summarized in Table 3.
Table 4 summarizes the performance of the proposed overall control algorithm with optimized control parameters, compared with the ROSCO controller to which the platform motion control has been applied, based on the DLC simulations in Table 3 [18].
To more thoroughly analyze the signals related to the stability of the floater, additional comparisons were made for the x-directional (fore-aft) acceleration of the rotor–nacelle assembly (RNA) and the mooring line tensions, in addition to the fatigue loads and platform motions. The mooring line numbers are indicated in Figure 1. As a result, the rotor speed variations were reduced by up to 49% through the feedforward control. The platform pitch motion and tower loads were mitigated by up to 20% and 15%, respectively, due to the peak shaving and nacelle feedback controls. The blade loads were alleviated by up to 23% via the IPC, and the platform yaw motion was also reduced by up to 13% as the tower-top yaw moment in the fixed frame is reduced. Regarding the mean power, there was up to a 5% reduction in cases near the rated wind speed due to the blade pitching by the peak shaving. However, due to the combined load and motion reduction effects, it is found that the RNA acceleration and mooring line tensions were also mitigated by up to 22% and 38%, respectively.

5. Discussion

This section discusses additional control techniques that can be considered for the target FOWT beyond power production and load and motion reduction. Large horizontal-axis floating wind turbines are typically not installed individually but are grouped to form wind farms. Consequently, it is necessary to consider techniques related to the Demanded Power Point Tracking (DPPT) control, which aims to mitigate wake effects caused by upstream wind turbines [29,32,33]. The DPPT control can be achieved by adjusting the set-points of the blade pitch controller and the generator torque controller according to the demanded power command. Figure 15 shows the block diagram of the proposed control algorithm incorporating the DPPT control. The set-points are extracted from steady-state curves as the target rotor speed and the target generator torque trajectories corresponding to the demanded power command. In the control algorithm depicted in Figure 11, the target rotor speed inputted into RBC and the target generator torque inputted into the baseline torque controller are replaced by these extracted set-points.
To verify the DPPT control algorithm, steady-state and dynamic simulations were performed for the target FOWT under power curtailment conditions. The dynamic simulation was conducted over 1800 s under below-rated wind speed conditions with a mean wind speed of 8 m/s, considering a power curtailment scenario at 70% starting around 900 s. The steady-state and dynamic simulation results under the DPPT control for the power curtailment are presented in Figure 16. In the steady-state simulations, it was observed that the blade pitch control and the generator torque control were successfully carried out based on the rotor speed and generator torque set-points, enabling the FOWT to track the demanded power command. In the dynamic simulation, prior to the initiation of the power curtailment at 900 s, the blade pitch control and the generator torque control operated normally, resulting in a mean power production of 6.967 MW. After 900 s, when the demanded power command was set to 70%, the power output had a mean value of 4.925 MW. Consequently, during the period when the power curtailment was active, it was found that the difference between the mean produced power (4.925 MW) and 70% of the mean available power (4.877 MW) was within 1%.

6. Conclusions

In this study, the composite control algorithm based on the classical control methods was proposed to achieve all control objectives for the target FOWT, including the power production, and the loads and motion reductions. The control performance was verified following the approach outlined below:
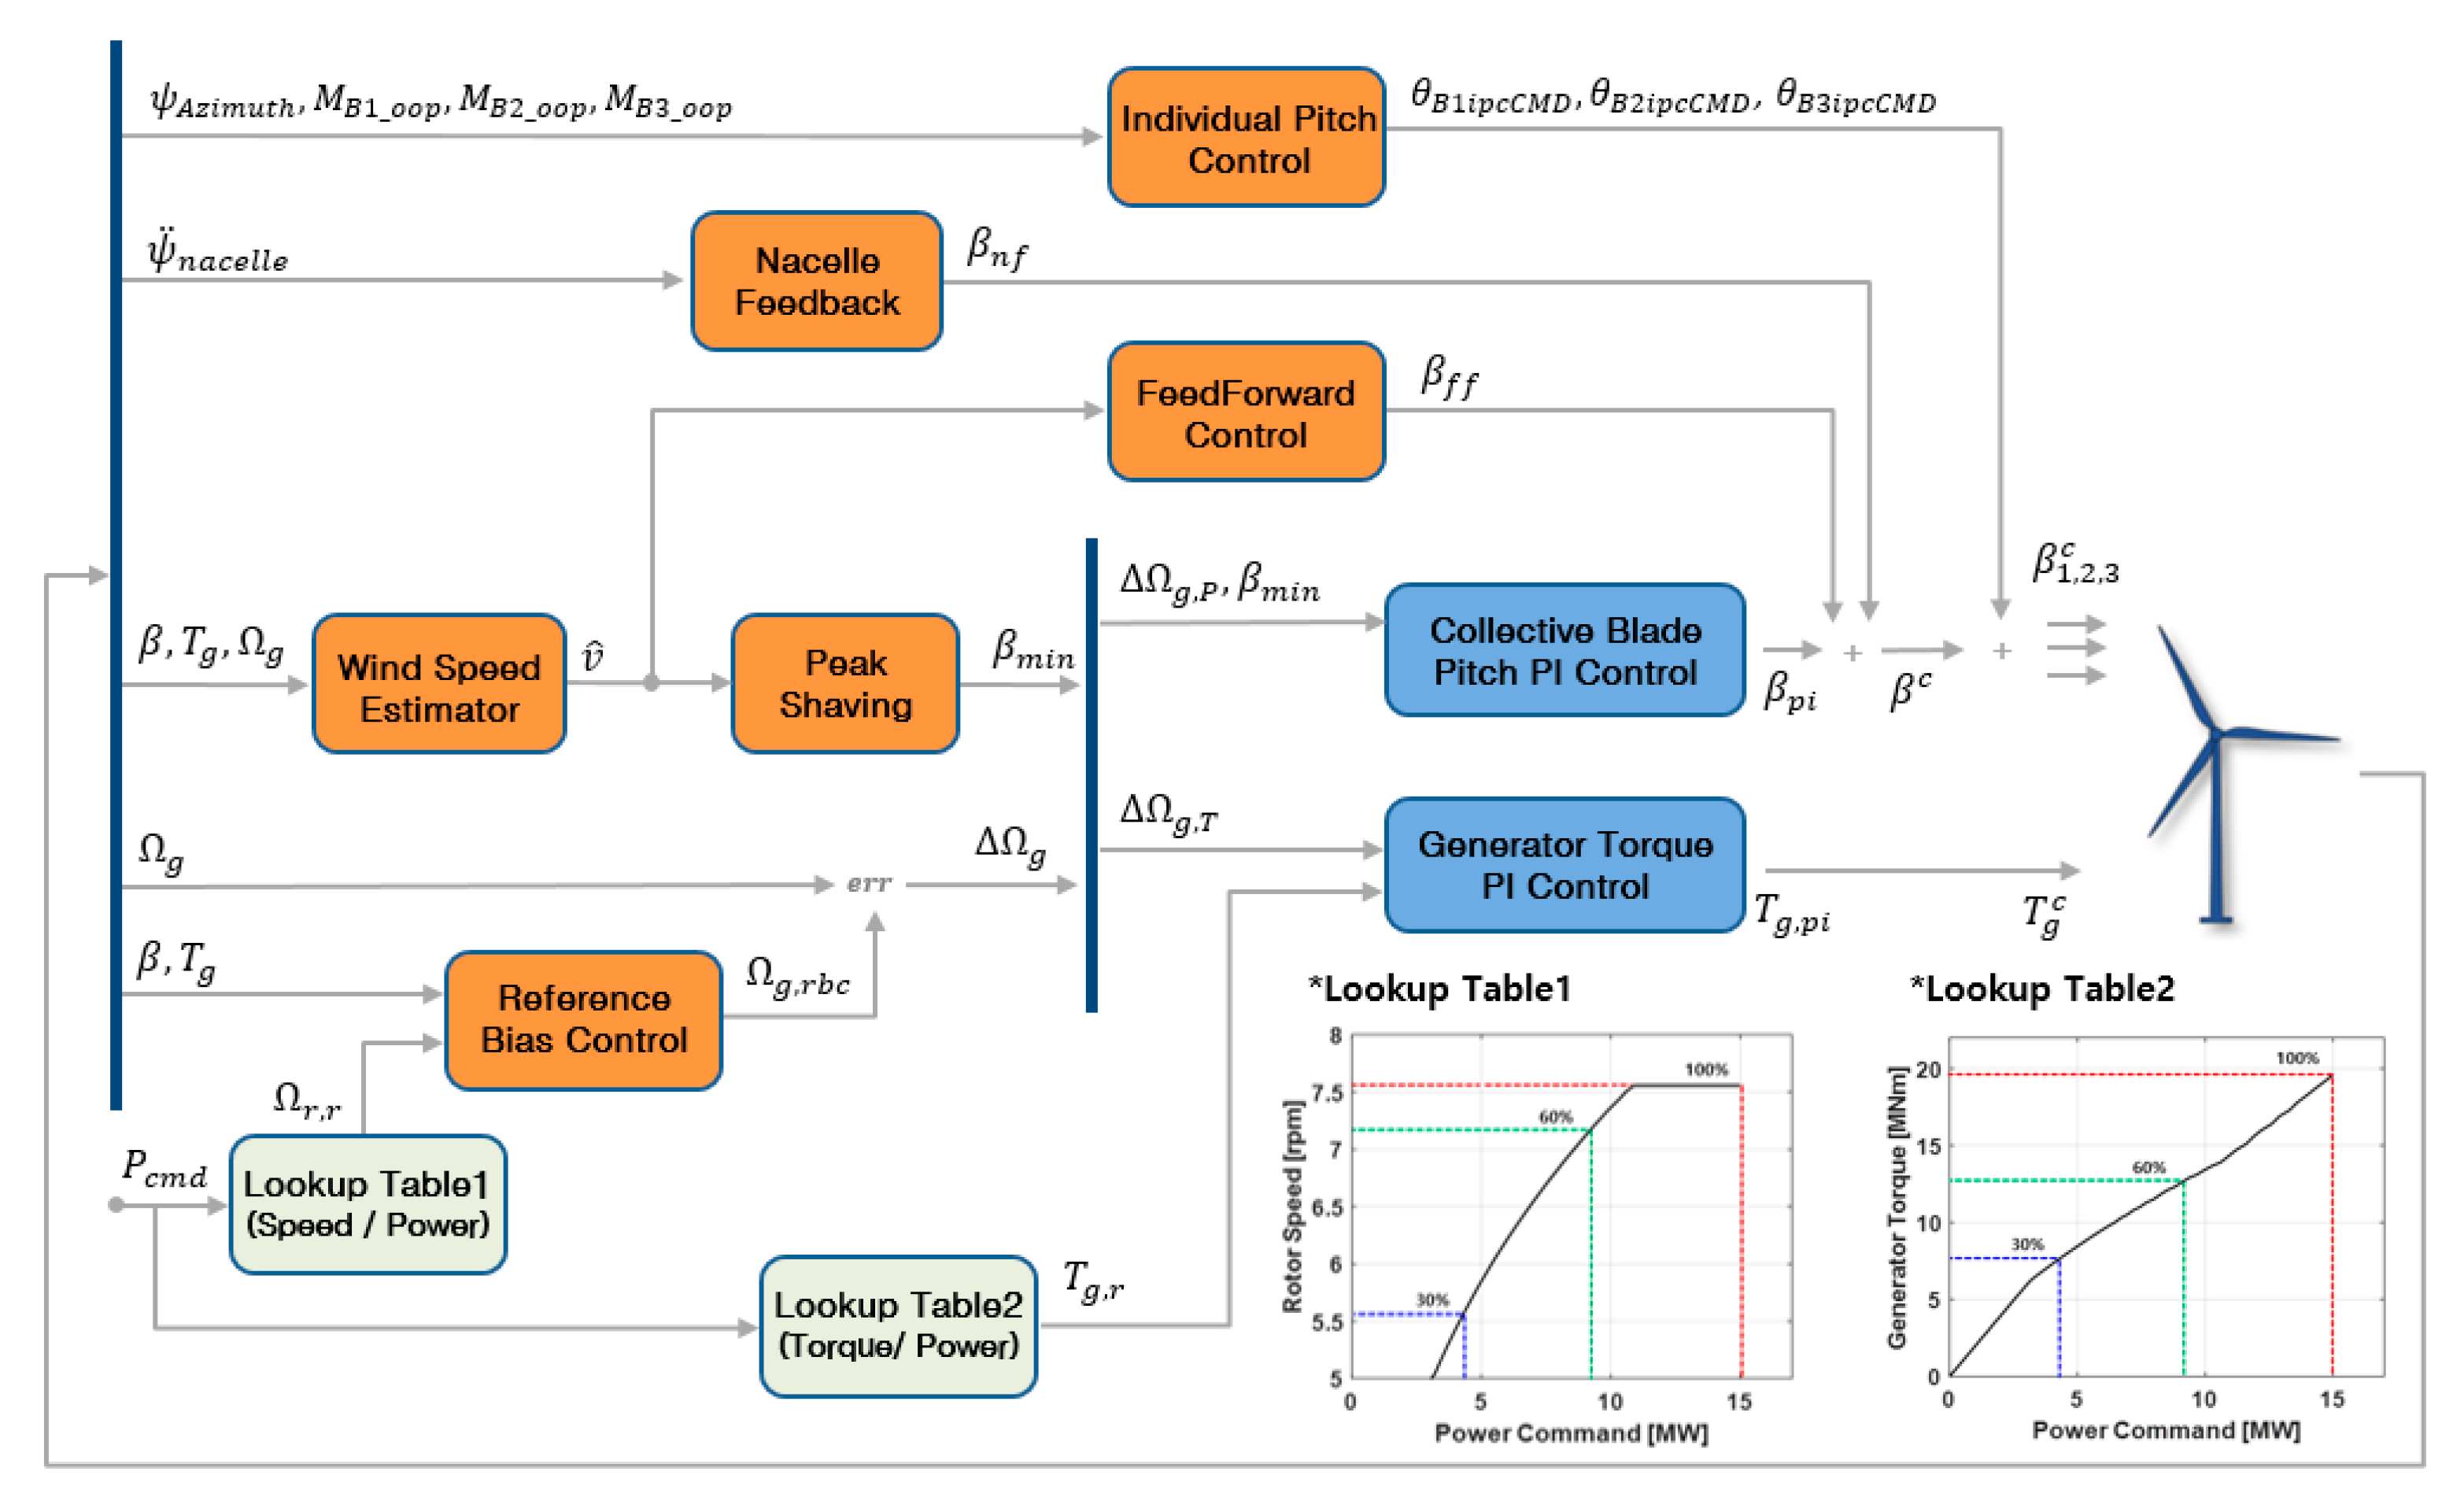
  • To meet these control objectives, the feedforward, IPC, peak shaving, and nacelle feedback control algorithms were incorporated into the detuned baseline controller.
  • The parametric simulations using the wind turbine simulation tool OpenFAST were conducted to analyze the performance changes with control parameters and determine the optimal parameters. The parametric simulations were performed under the NTM and NSS conditions, using four levels of control parameter cases for each control technique. Control performance indicators, including the mean power, the standard deviation of the rotor speed, platform motion, and the tower and the blade loads, were compared. The results showed that, while increasing the control parameters improved control performance, excessively high values led to degradation in aspects unrelated to the primary control objectives. Consequently, the control parameters for each control technique were selected to avoid adversely affecting other performance indicators.
  • To verify the performance of the overall control algorithm with the selected control parameters from the parametric study, simulations under DLC 1.2 and DLC 1.6 were carried out. The results demonstrated that the proposed control algorithm achieved significant load and motion reductions compared with the ROSCO controller. Specifically, while the mean power was decreased by 5%, the rotor speed deviation was reduced by 49%, platform pitch motion by 20%, tower loads by 15%, blade loads by 17%, RNA acceleration by 22%, and the mooring line tension by 38%.
  • In addition to the power production and the load and motion reductions, the DPPT control algorithm was implemented to consider the additional control objective. The simulation results under power curtailment showed that the difference between the demanded power command and the produced power was within 1%.
In this study, the control performance of the proposed control algorithm was verified solely through dynamic simulations. Therefore, future research will focus on experimentally validating the performance of the proposed control algorithm. The proposed control algorithm is based on C source code, which allows the proposed algorithm to be uploaded to commercial PLCs in source code form, enabling its direct application in PLC-based experiments. The PLC, with the proposed control algorithm uploaded, can be connected to the scaled model of the FOWT and used for wind tunnel tests or water tank experiments [34,35]. Alternatively, a hardware-in-the-loop simulator (HILS) study, integrating the commercial PLC with the numerical model in the simulation, could also be considered [28]. Although experimental validation was not conducted in this study, it is expected to contribute to the industry as a foundational study for the future experimental validation of the proposed control algorithm.

Author Contributions

Conceptualization, T.J.; methodology, T.J.; software, T.J. and J.K.; supervision, I.P.; project administration, C.-H.L. and B.-S.K.; validation, T.J.; resources, C.-H.L. and B.-S.K.; writing—original draft preparation, T.J.; writing—review and editing, I.P. All authors have read and agreed to the published version of the manuscript.

Funding

This research was supported by the Korea Research Institute of Ships and Ocean Engineering, a grant from the Endowment Project “Development of Core Technology for Offshore Green Hydrogen to Realize a Carbon-Neutral Society” funded by the Ministry of Oceans and Fisheries (PES5171).

Institutional Review Board Statement

Not applicable.

Informed Consent Statement

Not applicable.

Data Availability Statement

The original contributions presented in this study are included in the article. Further inquiries can be directed to the corresponding author.

Conflicts of Interest

The authors declare no conflicts of interest.

Nomenclature

T r Aerodynamic torque
β Blade pitch angle
Ω r Rotor speed
v ^ Estimated wind speed
k f f Feedforward control gain
β f f Blade pitch angle increment by feedforward control
ψ a z i m u t h Azimuth angle
M B 1 _ o o p Blade1-root flap-wase bending moment
M H _ t i l t Rotor tilt moment
M H _ y a w Rotor yaw moment
θ H _ t i l t Rotor tilt angle for rotor tilt control
θ H _ y a w Rotor yaw angle for rotor yaw control
θ B 1 i p c C M D IPC command for Blade1
ψ ¨ n a c e l l e Nacelle angular acceleration
ψ ˙ n a c e l l e Nacelle angular velocity
k n f Nacelle feedback control gain
β n f Blade pitch angle increment by nacelle feedback control
T g Generator torque
Ω g Generator speed
Ω r , r a t e d Rated rotor speed
Ω g , r b c Rotor speed reference by RBC
β m i n Minimum blade pitch angle limit
T g , r a t e d Rated generator torque
β p i Blade pitch command by PI control
T g , p i Generator toqrue command by PI control
β 1,2 , 3 c Individual blade pitch command
T g c Generator torque command
P c m d Demanded power command
Ω r , r Rotor speed reference by DPPT contorl
T g , r Generator torque reference by DPPT contorl

References

  1. Manwell, J.F.; Mcgowan, J.G.; Rogers, A.L. Wind Energy Explained, 2nd ed.; John Wiley & Sons Ltd.: Hoboken, NJ, USA, 2009. [Google Scholar]
  2. Bossanyi, E.A. The design of closed loop controllers for wind turbines. Wind Energy 2000, 3, 149–163. [Google Scholar] [CrossRef]
  3. Fateh, F.; White, W.N.; Gruenbacher, D. Torsional vibrations mitigation in the drivetrain of DFIG-based grid-connected wind turbine. IEEE Trans. Ind. Appl. 2017, 53, 5760–5767. [Google Scholar] [CrossRef]
  4. Pascu, V.; Kanev, S.; Van Wingerden, J.-W. Adaptive tower damping control for offshore wind turbines. Wind Energy 2016, 20, 765–781. [Google Scholar] [CrossRef]
  5. Mohammadi, E.; Fadaeinedjad, R.; Moschopoulos, G. Implementation of internal model based control and individual pitch control to reduce fatigue loads and tower vibrations in wind turbines. J. Sound Vib. 2018, 421, 132–152. [Google Scholar] [CrossRef]
  6. Kim, K.; Kim, H.-G.; Paek, I. Application and Validation of Peak Shaving to Improve Performance of a 100 KW Wind Turbine. Int. J. Precis. Eng. Manuf. Green Technol. 2020, 7, 411–421. [Google Scholar] [CrossRef]
  7. Meng, F.; Wenske, J.; Gambier, A. Wind turbine loads reduction using feedforward feedback collective pitch control based on the estimated effective wind speed. In Proceedings of the American Control Conference, Boston, MA, USA, 6–8 July 2016. [Google Scholar]
  8. Zhang, H.; Wen, B.; Tian, X.; Li, X.; Dong, Y.; Wang, M.; Peng, Z. Experimental study on mitigating vibration of floating offshore wind turbine using tuned mass damper. Ocean Eng. 2023, 288, 115974. [Google Scholar] [CrossRef]
  9. Chapain, S.; Aly, A.M. Vibration Attenuation in Wind Turbines: A Proposed Robust Pendulum Pounding TMD. Eng. Struct. 2021, 233, 111891. [Google Scholar] [CrossRef]
  10. Han, D.; Wang, W.; Li, X.; Su, X. Optimization Design of Multiple Tuned Mass Dampers for Semi-Submersible Floating Wind Turbine. Ocean Eng. 2022, 264, 112536. [Google Scholar] [CrossRef]
  11. Stockhouse, D.; Phadnis, M.; Grant, E.; Johnson, K.; Damiani, R.; Pao, L. Control of a floating wind turbine on a novel actuated platform. In Proceedings of the 2022 American Control Conference (ACC), Atlanta, GA, USA, 8–10 June 2022. [Google Scholar]
  12. Lenfest, E.; Goupee, A.J.; Wright, A.; Abbas, N. Tuning of nacelle feedback gains for floating wind turbine controllers using a two-DOF model. In Proceedings of the ASME 2020 39th International Conference on Offshore Mechanics and Arctic Engineering, Virtual, 3–7 August 2020. [Google Scholar]
  13. Oh, Y.; Kim, K.; Kim, H.; Paek, I. Control Algorithm of a Floating Wind Turbine for Reduction of Tower Loads and Power Fluctuation. Int. J. Precis. Eng. Manuf. 2015, 16, 2041–2048. [Google Scholar] [CrossRef]
  14. Schipf, D.; Simley, E.; Lemmer, F.; Pao, L.; Cheng, P.W. Collective Pitch Feedforward Control of Floating Wind Turbines Using Lidar. In Proceedings of the Twenty-Fifth International Ocean and Polar Engineering Conference, Kona, HI, USA, 21 June 2015. [Google Scholar]
  15. Hawari, Q.; Kim, T.; Ward, C.; Fleming, J. LQG control for hydrodynamic compensation on large floating wind turbines. Renew. Energy 2023, 205, 1–9. [Google Scholar] [CrossRef]
  16. Shah, K.; Li, Y.; Nagamune, R.; Zhou, Y.; Rehman, W. Platform motion minimization using model predictive control of a floating offshore wind turbine. Theor. Appl. Mech. Lett. 2021, 11, 100295. [Google Scholar] [CrossRef]
  17. Fleming, P.A.; Peiffer, A.; Schlipf, D. Wind turbine controller to mitigate structural loads on a floating wind turbine platform. J. Offshore Mech. Arct. Eng. 2019, 141, 061901. [Google Scholar] [CrossRef]
  18. Abbas, N.J.; Zalkind, D.S.; Pao, L.; Wright, A. A reference open-source controller for fixed and floating offshore wind turbines. Wind Energy Sci. 2022, 7, 53–73. [Google Scholar] [CrossRef]
  19. Rodríguez-Pérez, Á.M.; Pulido-Calvo, I. Analysis and Viability of Microturbines in Hydraulic Networks: A Case Study. J. Water Supply Res. Technol. Aqua. 2019, 68, 474–482. [Google Scholar] [CrossRef]
  20. Allen, C.; Viscelli, A.; Dagher, H.; Goupee, A.; Gaertner, E.; Abbas, N.; Hall, M.; Barter, G. Definition of the UMaine VolturnUSS Reference Platform Developed for the IEA Wind 15Megawatt Offshore Reference Wind Turbine; 2020 Technical Report; National Renewable Energy Lab. (NREL): Golden, CO, USA, 2020. [Google Scholar]
  21. Ramachandran, G.K.V.; Robertson, A.; Jonkman, J.M.; Masciola, M.D. Investigation of Response Amplitude Operators for Floating Offshore Wind Turbines (No. NREL/CP-5000-58098); National Renewable Energy Lab. (NREL): Golden, CO, USA, 2013. [Google Scholar]
  22. Larsen, T.J.; Hanson, T.D. A method to avoid negative damped low frequent tower vibrations for a floating, pitch controlled wind turbine. J. Phys. Conf. Ser. 2007, 75, 012073. [Google Scholar] [CrossRef]
  23. van Hooft, E.L.; van Engelen, T.G. Feed Forward Control of Estimated Wind Speed; Technical Report ECN-C–03-137; ECN Wind Energy: Kreilerood, The Netherlands, 2003. [Google Scholar]
  24. Jeon, T.; Paek, I. Design and verification of the LQR controller based on fuzzy logic for large wind turbine. Energies 2021, 14, 230. [Google Scholar] [CrossRef]
  25. Jeon, T.; Song, Y.; Paek, I. A Study on H-infinity Controller for a Non-Linear Wind Turbine with Uncertainty. Appl. Sci. 2023, 13, 11930. [Google Scholar] [CrossRef]
  26. Bossanyi, E.A. Individual Blade Pitch Control for Load Reduction. Wind Energy 2003, 6, 119–128. [Google Scholar] [CrossRef]
  27. Coleman, R.P.; Feingold, A.M. Theory of Self-Excited Mechanical Oscillations of Helicopter Rotors with Hinged Blades; National Advisory Committee for Aeronautics (NACA): Washington, DC, USA, 1957. [Google Scholar]
  28. Jeon, T.; Kim, D.; Paek, I. Improvements to and Experimental Validation of PI Controllers Using a Reference Bias Control Algorithm for Wind Turbines. Energies 2022, 15, 8298. [Google Scholar] [CrossRef]
  29. Kim, K.; Kim, H.; Paek, I.; Kim, H.-G.; Son, J. Field Validation of Demanded Power Point Tracking Control Algorithm for Medium-Capacity Wind Turbine. Int. J. Precis. Eng. Manuf. Green Technol. 2019, 6, 875–881. [Google Scholar] [CrossRef]
  30. International Electrotechnical Commission. Wind Energy Generation Systems—Part 3-1: Design Requirements for Fixed Offshore Wind Turbines, IEC 61400-3-1, 1st ed.; International Electrotechnical Commission: Geneva, Switzerland, 2019. [Google Scholar]
  31. International Electrotechnical Commission. Wind Energy Generation Systems—Part 3-2: Design Requirements for Floating Offshore Wind Turbines, IEC 61400-3-2, 1st ed.; International Electrotechnical Commission: Geneva, Switzerland, 2019. [Google Scholar]
  32. van Wingerden, J.W.; Pao, L.; Aho, J.; Fleming, P. Active power control of waked wind farms. IFAC-PapersOnLine 2017, 50, 4484–4491. [Google Scholar] [CrossRef]
  33. Jeon, T.; Kim, D.; Song, Y.; Paek, I. Design and Validation of Demanded Power Point Tracking Control Algorithm for MIMO Cpontrollers in Wind Turbines. Energies 2021, 14, 5818. [Google Scholar] [CrossRef]
  34. Bottasso, C.L.; Campagnolo, F.; Petrovi’c, V. Wind tunnel testing of scaled wind turbine models: Beyond aerodynamics. Wind. Eng. Ind. Aerodyn. 2014, 127, 11–28. [Google Scholar] [CrossRef]
  35. Fontanella, A.; Facchinetti, A.; Di Carlo, S.; Belloli, M. Wind Tunnel Investigation of the Aerodynamic Response of Two 15 MW Floating Wind Turbines. Wind Energy Sci. 2022, 7, 1711–1729. [Google Scholar] [CrossRef]
Figure 1. Numerical model and schematic depictions of the target floating offshore wind turbine established in OpenFAST.
Applsci 15 00519 g001
Figure 2. Comparison of the steady-state simulation results.
Applsci 15 00519 g002
Figure 3. Comparison of the free decay test results between experimental and simulation data.
Applsci 15 00519 g003
Figure 4. Comparison of the RAO results between experimental and simulation data.
Applsci 15 00519 g004
Figure 5. Frequency response function of (a) torque loop gain at 8 m/s and (b) pitch loop gain at 18 m/s.
Applsci 15 00519 g005
Figure 6. Comparison of time-domain data without and with detuning. The black line represents the wind speed input used in the simulation. The red and blue lines indicate the cases without and with detuning applied, respectively.
Applsci 15 00519 g006
Figure 7. Block diagram of the feedforward control algorithm.
Applsci 15 00519 g007
Figure 8. Block diagram of the IPC algorithm.
Applsci 15 00519 g008
Figure 9. Steady-state curve of the blade pitch angle and rotor thrust with the peak shaving.
Applsci 15 00519 g009
Figure 10. Block diagram of the nacelle feedback control algorithm.
Applsci 15 00519 g010
Figure 11. Block diagram of the whole control algorithm for the target FOWT.
Applsci 15 00519 g011
Figure 12. Flowchart for the controller implementation in OpenFAST.
Applsci 15 00519 g012
Figure 13. The simulation results of the target FOWT (a) for the baseline controller (red solid lines) and the feedforward controller (blue solid lines); (b) for the baseline controller (red solid lines) and the IPC controller (blue solid lines). The black line represents the wind speed and wave elevation inputs used in the simulation.
Applsci 15 00519 g013
Figure 14. The simulation results of the target FOWT (a) for the baseline controller (red solid lines) and the peak shaving controller (blue solid lines); (b) for the baseline controller (red solid lines) and the nacelle feedback controller (blue solid lines). The black line represents the wind speed and wave elevation inputs used in the simulation.
Applsci 15 00519 g014
Figure 15. Block diagram of the proposed control algorithm with DPPT control. *Lookup Table1 and *Lookup Table2 represent the target trajectories of the rotor speed and the generator torque, respectively.
Applsci 15 00519 g015
Figure 16. The power curtailment simulation results of the target FOWT: (a) under steady-state conditions; (b) under turbulence conditions. The black solid line represents the wind speed and wave elevation inputs used in the simulation.
Applsci 15 00519 g016
Table 1. Specifications of the target FOWT.
SpecificationsUnitsValues
Rated PowerMW15
Rated Rotor Speedrpm7.55
Rated Generator TorqueMNm19.63
Gear Ratio-1
Rotor Diameterm240
Hub Heightm150
Cut-in/Rated/Cut-out Wind Speedm/s3, 10.59, 25
Table 2. Quantitative results from the parametric simulations of the target FOWT for the feedforward, IPC, peak shaving, and nacelle feedback controllers compared with the baseline controller.
ControllersControl
Parameters
Control Performance in Dynamic Simulation [%]
(Controllers − Baseline)/Baseline * 100
MeanStandard DeviationDamage Equivalent Load
Generator
Power
Rotor
Speed
Platform
Pitch
Tower-Base
FA Bending
Blade-Root
FW Bending
Feed
Forward
10.0−4.4−5.8−0.8−1.5
20.0−7.3−11.1−0.4−1.8
30.0−11.2−20.13.61.8
4−1.03.8−31.484.2200.1
IPC10.00.10.6−0.1−5.5
20.01.16.70.8−27.2
30.04.628.54.9−38.9
4−69.9−15.417.792.2−20.8
Peak
Shaving
1−1.2−18.4−9.8−6.9−3.4
2−1.8−9.8−15.2−9.1−1.3
3−2.8−4.2−20.9−14.4−4.2
4−4.42.9−25.5−18.3−3.6
Nacelle
Feedback
10.0−2.5−30.9−4.2−0.8
20.0−2.9−41.5−5.3−1.3
30.01.9−50.2−8.8−1.2
40.169.2−38.7−8.523.3
Table 3. Design load cases for the dynamic simulation of the target FOWT.
DLCNo.Wind
[m/s]
WaveCurrent
[m/s]
Hs [m]Tp [s]Duration [min]Gamma [-]
1.219.01.508.0060.01.000.00
211.01.758.2560.01.000.00
313.02.008.2560.01.000.00
1.6411.010.7214.08180.02.500.00
511.04.509.00180.02.500.00
625.010.7214.08180.02.500.00
Table 4. Quantitative comparison of the DLC simulation results for the whole control algorithm.
Control Performance [%]
(Proposed Control − ROSCO)/ROSCO * 100
DLC 1.2DLC 1.6
No. 1No. 2No. 3No. 4No. 5No. 6
Power
Production
MeanGen. Power−1.38−4.40−2.69−4.95−4.060.17
Std.Dev.Rot. Speed−9.93−23.64−9.97−11.32−24.68−49.37
RNA Acc.Max.X-Direction4.41−17.15−22.10−4.14−15.87−8.15
Platform
Motion
Std.Dev.Pitch−12.94−19.76−9.69−9.31−20.28−8.23
Yaw−4.56−5.95−10.18−10.83−9.10−13.50
Mooring
Tension
Std.Dev.Chain 30.27−3.45−1.28−1.29−1.220.47
Wire 4−12.35−29.25−36.34−11.18−28.82−2.73
Wire 5−7.21−27.34−38.75−8.63−27.801.73
Fatigue
Load
DELBlade My−12.34−17.61−17.48−17.73−23.38−14.43
Tower My−2.45−15.7−8.61−0.25−6.30−2.47
Disclaimer/Publisher’s Note: The statements, opinions and data contained in all publications are solely those of the individual author(s) and contributor(s) and not of MDPI and/or the editor(s). MDPI and/or the editor(s) disclaim responsibility for any injury to people or property resulting from any ideas, methods, instructions or products referred to in the content.

