Article

Research on Rotary Kiln Rotation Center Offset Fault Identification Based on ISBOA-VMD

1
School of Mechanical and Electrical Engineering, Henan University of Science and Technology, Luoyang 471003, China
2
Collaborative Innovation Center of Henan Province for High-End Bearing, Luoyang 471003, China
3
Luoyang Mining Machinery Engineering Design & Research Institute Co., Ltd., Luoyang 471003, China
4
National Key Laboratory of Intelligent Mining Heavy Equipment, Luoyang 471003, China
*
Authors to whom correspondence should be addressed.
Appl. Sci. 2025, 15(19), 10806; https://doi.org/10.3390/app151910806
Submission received: 18 August 2025 / Revised: 28 September 2025 / Accepted: 4 October 2025 / Published: 8 October 2025

Abstract

To address the difficulty of extracting thermal bending failure and centerline horizontal displacement fault feature signals when judging the operating status of cement rotary kilns, we propose a method for extracting fault features based on improved secretary bird optimization algorithm (ISBOA) and variational modal decomposition (VMD). First, a strategy of randomly consuming prey with inertial weights is proposed to enhance the randomness of search results and avoid local optima. Then, the whale algorithm’s encirclement strategy is introduced into the secretary bird’s camouflage strategy to coordinate the capabilities of local search and global exploration. Finally, ISBOA demonstrated superior performance to other optimization algorithms in VMD parameter selection, achieving a 75% improvement in convergence speed compared to pre-optimization. Through validation with experimental and simulation data, this method demonstrates good feasibility. By decomposing actual signals and comparing the mean energy of their characteristic signals, the severity of thermal bending faults in the cylinder and centerline horizontal displacement faults in cement rotary kilns is diagnosed. Verified against actual measurement results, the accuracy reached 96.7%.

1. Introduction

Rotary kilns are high-temperature devices widely used in industrial production, such as in the chemical, lime, and cement industries, primarily for processes such as solid decomposition, calcination, and heat treatment [1,2]. In the cement industry, rotary kilns account for the largest share of use and are a critical piece of equipment in cement production [3], directly impacting cement quality, output, and production efficiency. They are primarily composed of a cylinder, a drive system, and a support system [4]. Real-time monitoring of the operational status of rotary kilns to ensure their normal operation is an important means of improving industrial production efficiency.
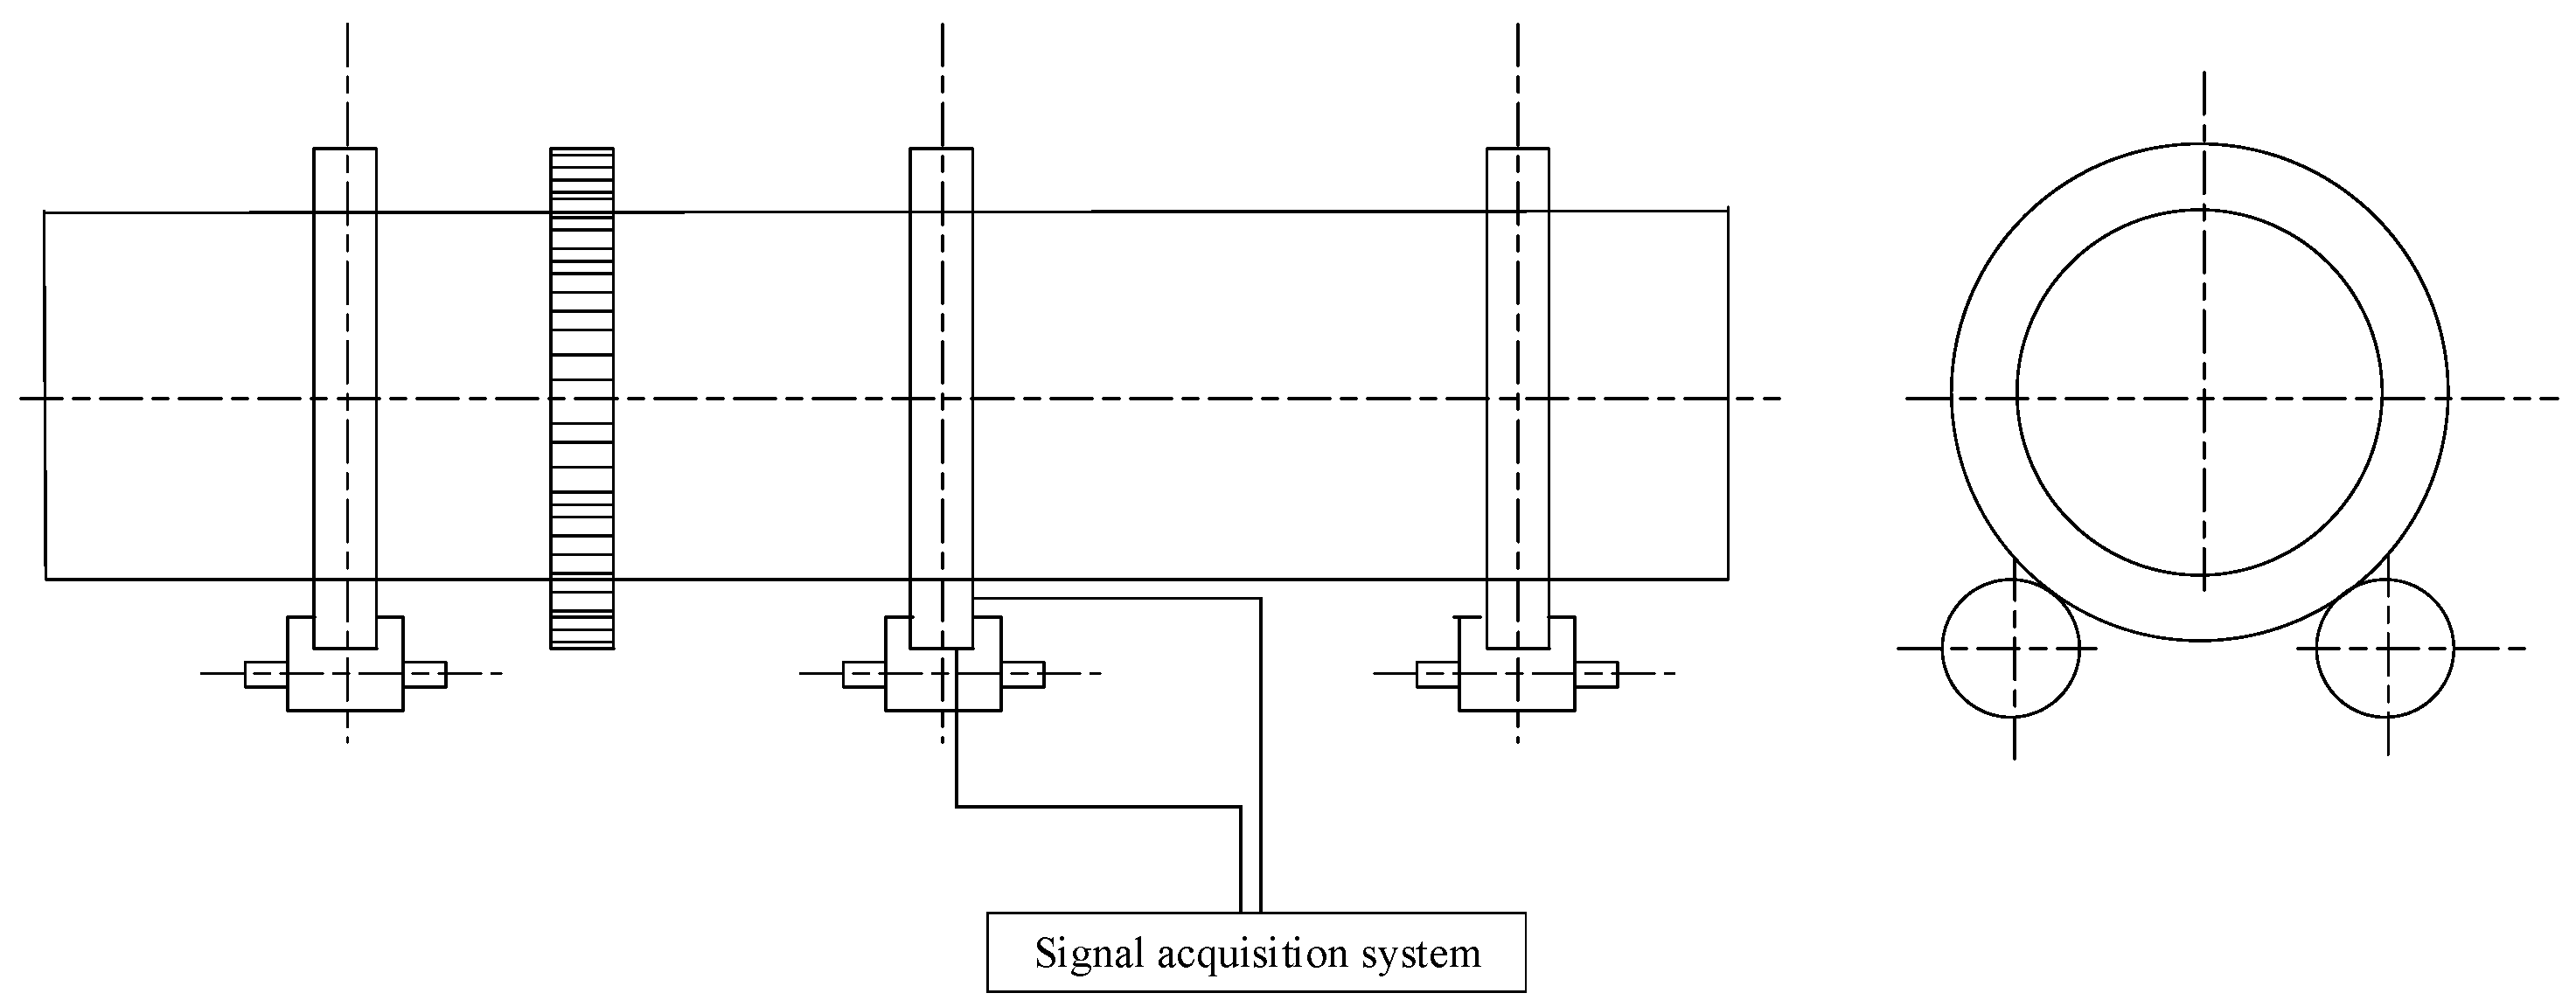
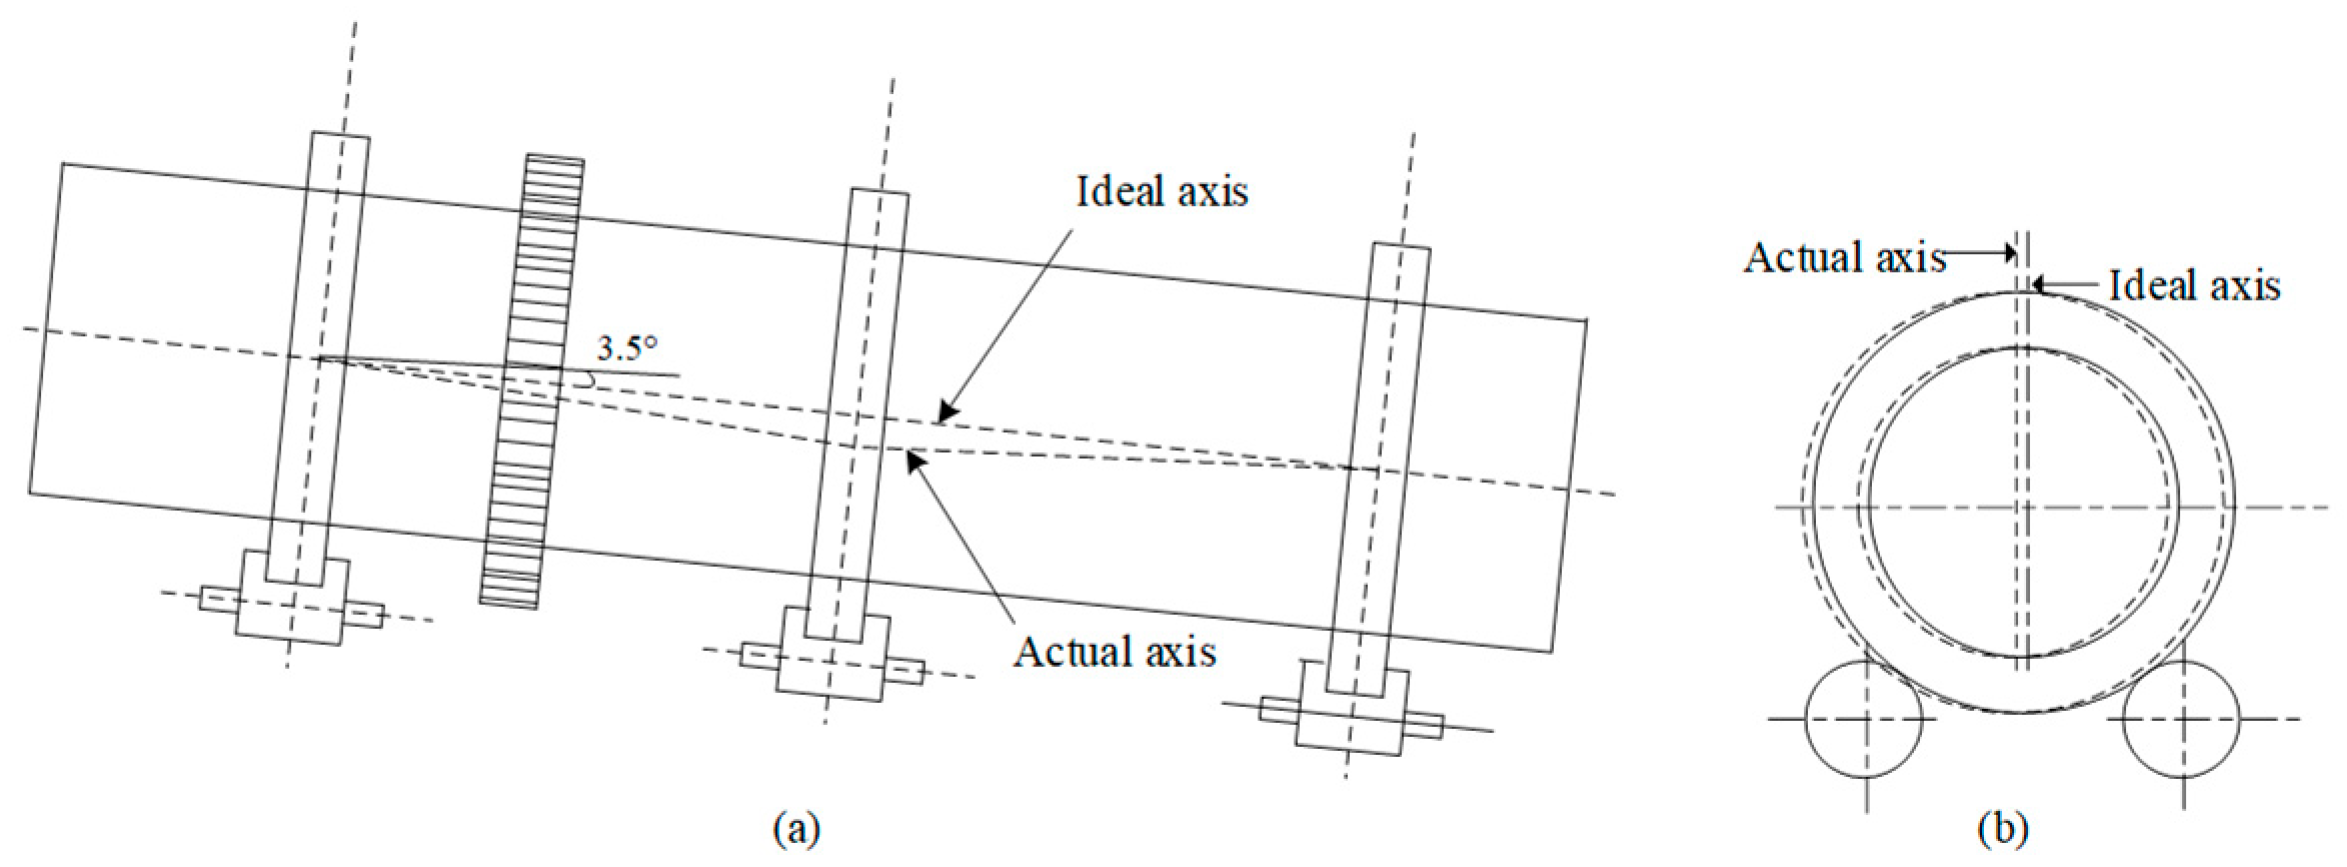
In actual operation, the centerline deviation fault of the rotary kiln, as shown in Figure 1, primarily manifests as abnormal load on the support rollers, high temperatures in the bearing shells, and equipment damage. The main influencing factors include deformation of the kiln cylinder, uneven wear of the support rollers, and installation deviations. These issues require timely resolution through dynamic monitoring and process adjustments. The vibration signals of the rotary kiln contain operational characteristics, fault characteristics, and other operational status information. However, due to operational noise, it is challenging to extract fault characteristic signals. Researchers worldwide have conducted extensive studies on fault feature extraction. Commonly used techniques include Empirical Mode Decomposition (EMD) [5], Integrated Empirical Mode Decomposition (EEMD) [6], Wavelet Transform (WT) [7], Empirical Wavelet Transform (EWT) [8], and Local Mean Decomposition (LMD) [9]. Meng et al. used EMD to process vibration signals and analyzed their characteristic signals to obtain fault patterns [10]. Shah used EMD to extract modal components from nonlinear, non-stationary vibration signals [11]. Shifat combined EEMD and similarity coefficients for fault diagnosis of motor vibration signals [12]. Li combined EWT with soft threshold denoising methods to process vibration signals [13]. Yan summarized the application of WT in fault diagnosis from the perspectives of intelligent fault diagnosis and traditional fault diagnosis [14]. Han M proposed a new method for fault feature extraction by combining multi-scale symbol dynamic information entropy (MSDE) with LMD [15]. Although the above methods can extract fault feature signals to some extent, the EMD method suffers from end-point effects and modal overlap issues. EEMD can address this issue, but it introduces white noise, requiring an increase in the number of averaging operations. WT is limited by the selection of the mother wavelet, resulting in insufficient applicability when processing non-stationary signals. EWT lacks adaptability and robustness in signal decomposition, and LMD still exhibits endpoint effects in signal decomposition.
Dragomiretskiy K and other scholars have proposed that the VMD method can effectively address modal overlap and end-point effects, and it is supported by theoretical foundations [16,17]. Currently, this method has been widely applied in the field of fault diagnosis. Liu used the VMD method to extract fault features from vibration signals in a high-noise environment [18], so the VMD method was selected as the approach for processing rotary kiln vibration signals. However, the VMD method is influenced by the number of modal functions (IMFS) and the quadratic penalty term α . If the parameters are not appropriately set, modal overlap may still occur [19]. To address this issue, many researchers have employed meta-heuristic algorithms to optimize VMD parameters.
Although existing PCA-based methods are widely applied in fluid leakage detection, they typically rely on fixed training data and parameter settings, which may lack the flexibility to adapt to varying operating conditions when applied to complex and dynamic rotary kiln systems [20]. Heuristic algorithms are characterized by their fast computation speed, simple logic, and high flexibility, making them an increasingly popular choice for fault diagnosis and parameter optimization. Based on their principles, they can be categorized into four types: swarm-based, evolution-based, human-based, and physics-based. Swarm-based representatives include Ant Colony Optimization (ACO) [21] and Whale Optimization Algorithm (WOA) [22]. Evolution-based representatives include Evolutionary Strategy (ES) [23] and Genetic Algorithm (GA) [24]. Human-based representatives include Social Group Optimization (SGO) [25] and Cognitive Behavioral Optimization Algorithm (COA) [26]. Physically based representatives include Atomic Search Optimization (SVO) [27] and Multiverse Evolver (MVO) [28]. Given the flexibility of meta-heuristic algorithms, numerous scholars have proposed employing various optimization algorithms to search for VMD parameters, such as Sparrow Search Algorithm (SSA) [29], Gray Wolf Optimization (GWO) [16], Whale Optimization Algorithm (WOA) [30], Grasshopper Optimization Algorithm (GOA) [31], and others. Each possesses distinct advantages but also faces challenges such as susceptibility to local optima or excessive computational complexity. In contrast, the Secretary Bird Optimization Algorithm (SBOA) demonstrates superior global search capabilities and rapid convergence. It exhibits enhanced stability and robustness in solution accuracy, making it particularly well-suited for parameter optimization of nonlinear complex signals like those from cement rotary kiln vibration. Fu Y et al. compared SBOA with 15 other advanced algorithms and concluded that SBOA performs excellently in terms of convergence speed, solution quality, and stability [32]. The essence of SBOA in parameter optimization is a mathematical model comprising two stages of intelligent optimization algorithms based on biomimetic mechanisms, which can precisely adapt to VMD parameter optimization problems. The algorithm has the advantages of being easy to implement, and having few parameters and a simple structure, but it still suffers from issues such as easily getting stuck in local optima and low convergence accuracy.
Therefore, this paper proposes an improved secretary bird parameter optimization algorithm (ISBOA) based on multiple strategies. By introducing a random inertia weight strategy, the randomness of the search is enhanced. The whale algorithm surrounder strategy is introduced to address the poor balance between global and local exploration capabilities of the algorithm. After improvement, the algorithm achieves higher convergence accuracy and speed, providing optimal parameter combinations for different operating states of cement rotary kilns.

2. Methodologies

2.1. The Principles of VMD

In Variational Modal Decomposition (VMD), modal components are defined as a finite set of amplitude-modulated frequency-modulated (AM-FM) signals with distinct center frequencies. Each modal component possesses unique center frequency and bandwidth characteristics. Consequently, in fault diagnosis applications, VMD can extract modal components distributed across different frequency ranges, providing an effective approach for identifying multiscale fault features within complex signals.
The VMD method decomposes the original signal x(t) into multiple modal components, each of which corresponds to a specific frequency band, as shown in Equation (1):
x ( t ) = k = 1 K u k ( t )
In the equation, x(t) is the original signal, and is the kth modal component. Each modal component can be regarded as an amplitude modulation-frequency modulation representation as shown in Equation (2):
u k ( t ) = A k ( t ) cos ( Φ k ( t ) )
In the equation, A k ( t ) represents the time-varying amplitude of the modal component, Φ k ( t ) represents the instantaneous phase, and t represents time. Each modal component is considered to be a harmonic signal with a definite instantaneous frequency and amplitude within a finite time interval.
VMD converts different modal components u k ( t ) into their analytical signals via the Hilbert transform, thereby obtaining frequency domain information. Subsequently, the negative exponential mixture estimated at the center frequency is shifted to the baseband. Finally, the bandwidth of each component is determined by the square norm of the resolved signal H 1 . This method reveals the frequency characteristics within the signal through frequency domain analysis. It effectively extracts relevant fault modes for diagnosing system states, particularly in complex nonlinear and non-stationary signals, constructing a fully non-recursive variational modal decomposition model as shown in Equation (3).
min u k , ω k k t δ ( t ) + 1 π t u k ( t ) e j ω k t 2 2 s . t . k u k = f
In the equation, δ ( t ) + 1 π t u k ( t ) is the analytical signal of the modal component e j ω k t , u(T) is the complex exponent of the center frequency estimate, and u k and ω k represent the set of all modal components and center frequencies.
To find the optimal solution for u k and ω k in Equation (3), introduce the Lagrange multiplier Y to replace the constraint conditions and quadratic penalty term M in the original model to ensure that the data is reconstructed without distortion, thereby converting the constrained problem into an unconstrained problem. Therefore, introduce the augmented Lagrange L expression as shown in Equation (4).
L u k , ω k , λ k = α k t δ ( t ) + 1 π t u k ( t ) e j ω k t 2 2 + f ( t ) k u k ( t ) 2 2 + λ ( t ) , f ( t ) k u k ( t )
In the equation, λ is the Lagrange multiplier and α is the quadratic penalty term.
VMD uses the alternating multiplier method to find the saddle point of L in Equation (4). To facilitate calculation, the optimal solution problem is optimized by equating the update of the modal component u ( k ) to the minimization problem shown in Equation (5).
u k n + 1 = arg min u k X α t δ ( t ) + 1 π t u k ( t ) e j ω k t 2 2 + f ( t ) i k u i n + 1 ( t ) + λ ( t ) 2 2 2
Solving Equation (5) in the frequency domain yields Equation (6).
u ^ k n + 1 ( ω ) = f ^ ( ω ) i k u ^ i n + 1 ( ω ) + λ ^ ( ω ) 2 1 + 2 α ( ω ω k n ) 2
The problem of minimizing the updated center frequency ω k is shown in Equation (7) below.
ω k n + 1 = arg min ω k t δ ( t ) + j π t u k ( t ) e j ω k t 2 2
Optimize it to solve in the frequency domain as shown in Equation (8).
ω k n + 1 = 0 ω u ^ k n + 1 ( ω ) 2 d ω 0 u ^ k n + 1 ( ω ) 2 d ω
Based on the obtained ω k n + 1 and u ^ k n + 1 , the component u k n + 1 can be reconstructed.
The PCA method is employed to reduce the dimensionality of rotary kiln fault diagnosis, transforming a large set of variables into a smaller one while retaining most of the information from the original set. The specific steps are as follows.
Standardize the raw data as shown in Equation (9).
X * = x i j x ¯ j V a r ( x j )
Calculate the eigenvectors and eigenvalues of the correlation matrix R as shown in Equation (10).
R = X * T X ( n 1 )
The calculated eigenvectors of the correlation matrix are denoted as μ 1 , μ 2 , , μ p , and the eigenvalues are denoted as λ 1 λ 2 λ p .
Calculate the variance contribution rate η i of the characteristic parameters of the correlation matrix R as shown in Equation (11):
η i = λ i i n λ i
The number of principal components is selected based on the cumulative principal component percentage. Typically, when η i ≥ 95%, the first m principal components can represent most of the information.
Calculate the eigenvectors of each principal component in the feature parameters as shown in Equation (12):
U p × m = μ 1 , μ 2 , , μ m
The principal component matrix is shown in Equation (13):
Z n × m = X n × p U p × m
This represents the principal component data after dimensionality reduction to η i dimensions.

2.2. The Principles of SBOA

SBOA is a population-based meta-heuristic optimization algorithm in which the positions of individuals in the population represent the corresponding decision variable values. When dealing with minimization problems, an initial solution set containing N individuals must be generated in the initial stage. The initial positions of each individual are generated using formula (14):
X i = l b + r × ( u b l b ) , 1 i N
In the formula, l b and u b represent the lower and upper bounds of the decision variable search space, respectively. r is a random number in the interval 0 , 1 . The appropriate value X i corresponding to F i = f X i is used to evaluate the quality of the solution.
The VMD parameter optimization process for the secretary bird is divided into hunting strategies and escape strategies. In hunting strategies, the process can be divided into three time stages: searching for prey, consuming prey, and attacking prey.

2.2.1. Search for Prey

At this stage, the secretary bird quickly locates and discovers potential prey. According to formula (15), when time t satisfies t T / 3 , the secretary bird will update its position and search a wider area to find prey. The formula is as follows:
X i n e w ( t ) = X i ( t ) + ( X r 1 ( t ) X r 2 ( t ) ) × R 1
In the formula, t represents the current iteration count, T represents the maximum iteration count, X r 1 ( t ) is the new position of the secretary bird at this stage, and X r 2 ( t ) is the new position randomly generated in the second stage. R 1 is an array of dimension 1 × D generated in the dimension 0 , 1 interval.

2.2.2. Consuming Prey

At this stage, the secretary bird approaches the prey it is consuming. According to Equation (16), when t satisfies T / 3 t 2 T / 3 , the secretary bird will update its position based on its current location to simulate the process of consuming the prey.
X i n e w ( t ) = X b e s t * ( t ) + exp t T 4 ( R B 0.2 ) · ( X b e s t ( t ) X i ( t ) )
In the formula, R B represents the standardized dimension generation step, and X b e s t ( t ) represents the position of the optimal solution. This stage mainly optimizes the accuracy of the solution by gradually approaching the optimal position.

2.2.3. Attack Prey

When time exceeds 2 T / 3 , the secretary bird attacks its prey, at which point the formula is as shown in Equations (17) and (18).
X i n e w ( t ) = X b e s t ( t ) + ( 1 + t T ) 2 / T · X i ( t ) · R L
R L = 0.5 L é v y ( D )
In the equation, L é v y flight is a non-Gaussian random walk strategy that helps individuals make large jumps and avoid getting stuck in local optima. If the new X i n e w ( t ) is better, accept the solution and update the position. Otherwise, keep the current solution and update the rules as shown in Equation (19).
X i ( t + 1 ) = X i n e w ( t ) , i f   X i n e w ( t ) F i X i ( t ) , e l s e
Through continuous adjustment and optimization, the algorithm achieves a good balance between global search and local optimization.

2.2.4. The Secretary Bird’s Escape Strategy

When secretary birds encounter danger, they typically employ strategies such as camouflage or rapid escape to protect themselves. These two mechanisms occur with equal probability, as shown in Equations (20) and (21).
X i n e w ( t ) = C 1 : X b e s t ( t ) + ( 2 × R B 1 ) × ( 1 t / T ) 2 × X i ( t ) , i f   r a n d r i C 2 : X i ( t ) + R 2 × ( x r a n d ( t ) K × X i ( t ) ) , e l s e
X i ( t + 1 ) = X i n e w ( t ) , i f   X i n e w ( t ) F i X i ( t ) , e l s e
In the formula, r i is 0.5, R 2 represents a randomly generated array of dimension 1 × D in the normal distribution, x r a n d is a random candidate solution, and K is a random integer 1 or 2.

2.3. Improved Secretary Bird Optimization Algorithm

2.3.1. Random Weighting Mechanism

During the dynamic optimization process of the secretary bird algorithm, the weight coefficients can be gradually adjusted to improve the balance between global search and local search, and updates can be performed using Equation (22) during the iteration process.
X i ( t + 1 ) = ω × exp X b e s t ( t ) X i ( t ) t 2 ω = ω min + ( ω max ω min ) × r + r a n d n  
In the formula, ω is the inertial weight, r a n d n is the randomly generated standard normal distribution value, ω min is the minimum weight, and ω max is the maximum weight.
The introduced random inertia weight mechanism achieves an adaptive balance between exploration and exploitation by combining iterative dynamic decay with normal random perturbations. During the early search phase, larger inertial weights endow individuals with robust global exploration capabilities, enabling extensive searches across complex signal spaces and preventing premature convergence to local optima. In the later search phase, as inertial weights gradually diminish, the search process converges, thereby enhancing the precision of approximating the global optimum solution. The introduction of random disturbance factors further increases the diversity of individual trajectories, reducing the population’s over-reliance on the current optimal solution. For non-stationary, nonlinear rotary kiln fault signals, this mechanism enhances the algorithm’s robustness and global optimization capability.

2.3.2. Improvements Incorporating WOA Strategies

Since the secretary bird algorithm relies too much on the offset of the current optimal solution for searching, it is easy to get stuck in a local area, which lowers the algorithm’s ability to get out of local optima. The whale optimization algorithm’s prey enclosure strategy effectively balances local and global searches. It also introduces a decreasing factor to gradually reduce the search range, achieving a dynamic balance between exploration and exploitation. Its position update is shown in Equation (23).
X i ( t + 1 ) = X b e s t ( t ) W × 2 × r × X b e s t ( t ) X i ( t ) W = 2 × a × r a   a = 2 ( 2 × t ) / T  
In the formula, a is the convergence factor.
The Whale Optimization Algorithm’s Encirclement Strategy employs a decreasing factor to progressively narrow the search scope, enabling ISBOA to dynamically transition from global exploration to local exploitation during the search process. In early iterations, larger contraction factors guide individuals to disperse across the vast solution space, increasing the probability of escaping local optima. In later iterations, as contraction factors gradually decrease, the population converges near the global optimum, enabling refined searches that enhance convergence speed and accuracy. This mechanism effectively addresses the shortcomings of SBOA’s excessive reliance on the current optimal solution, ensuring that the algorithm can balance escaping local optima with convergence stability when processing complex multi-source interference in rotary kiln fault signals.
Envelope entropy effectively captures signal uncertainty and nonlinear characteristics by analyzing the dynamic changes in the signal’s envelope. In rotary kiln fault signal analysis, it demonstrates nonlinear processing capabilities, noise robustness, multiscale analysis advantages, and global feature capture ability. Compared to traditional metrics such as kurtosis, energy entropy, and correlation coefficients, envelope entropy can more comprehensively and accurately reveal the fault characteristics of complex rotary kiln signals. Therefore, envelope entropy is adopted as the fitness function. The analysis process is shown in Figure 2.

3. Optimization Algorithm Verification Simulation Analysis

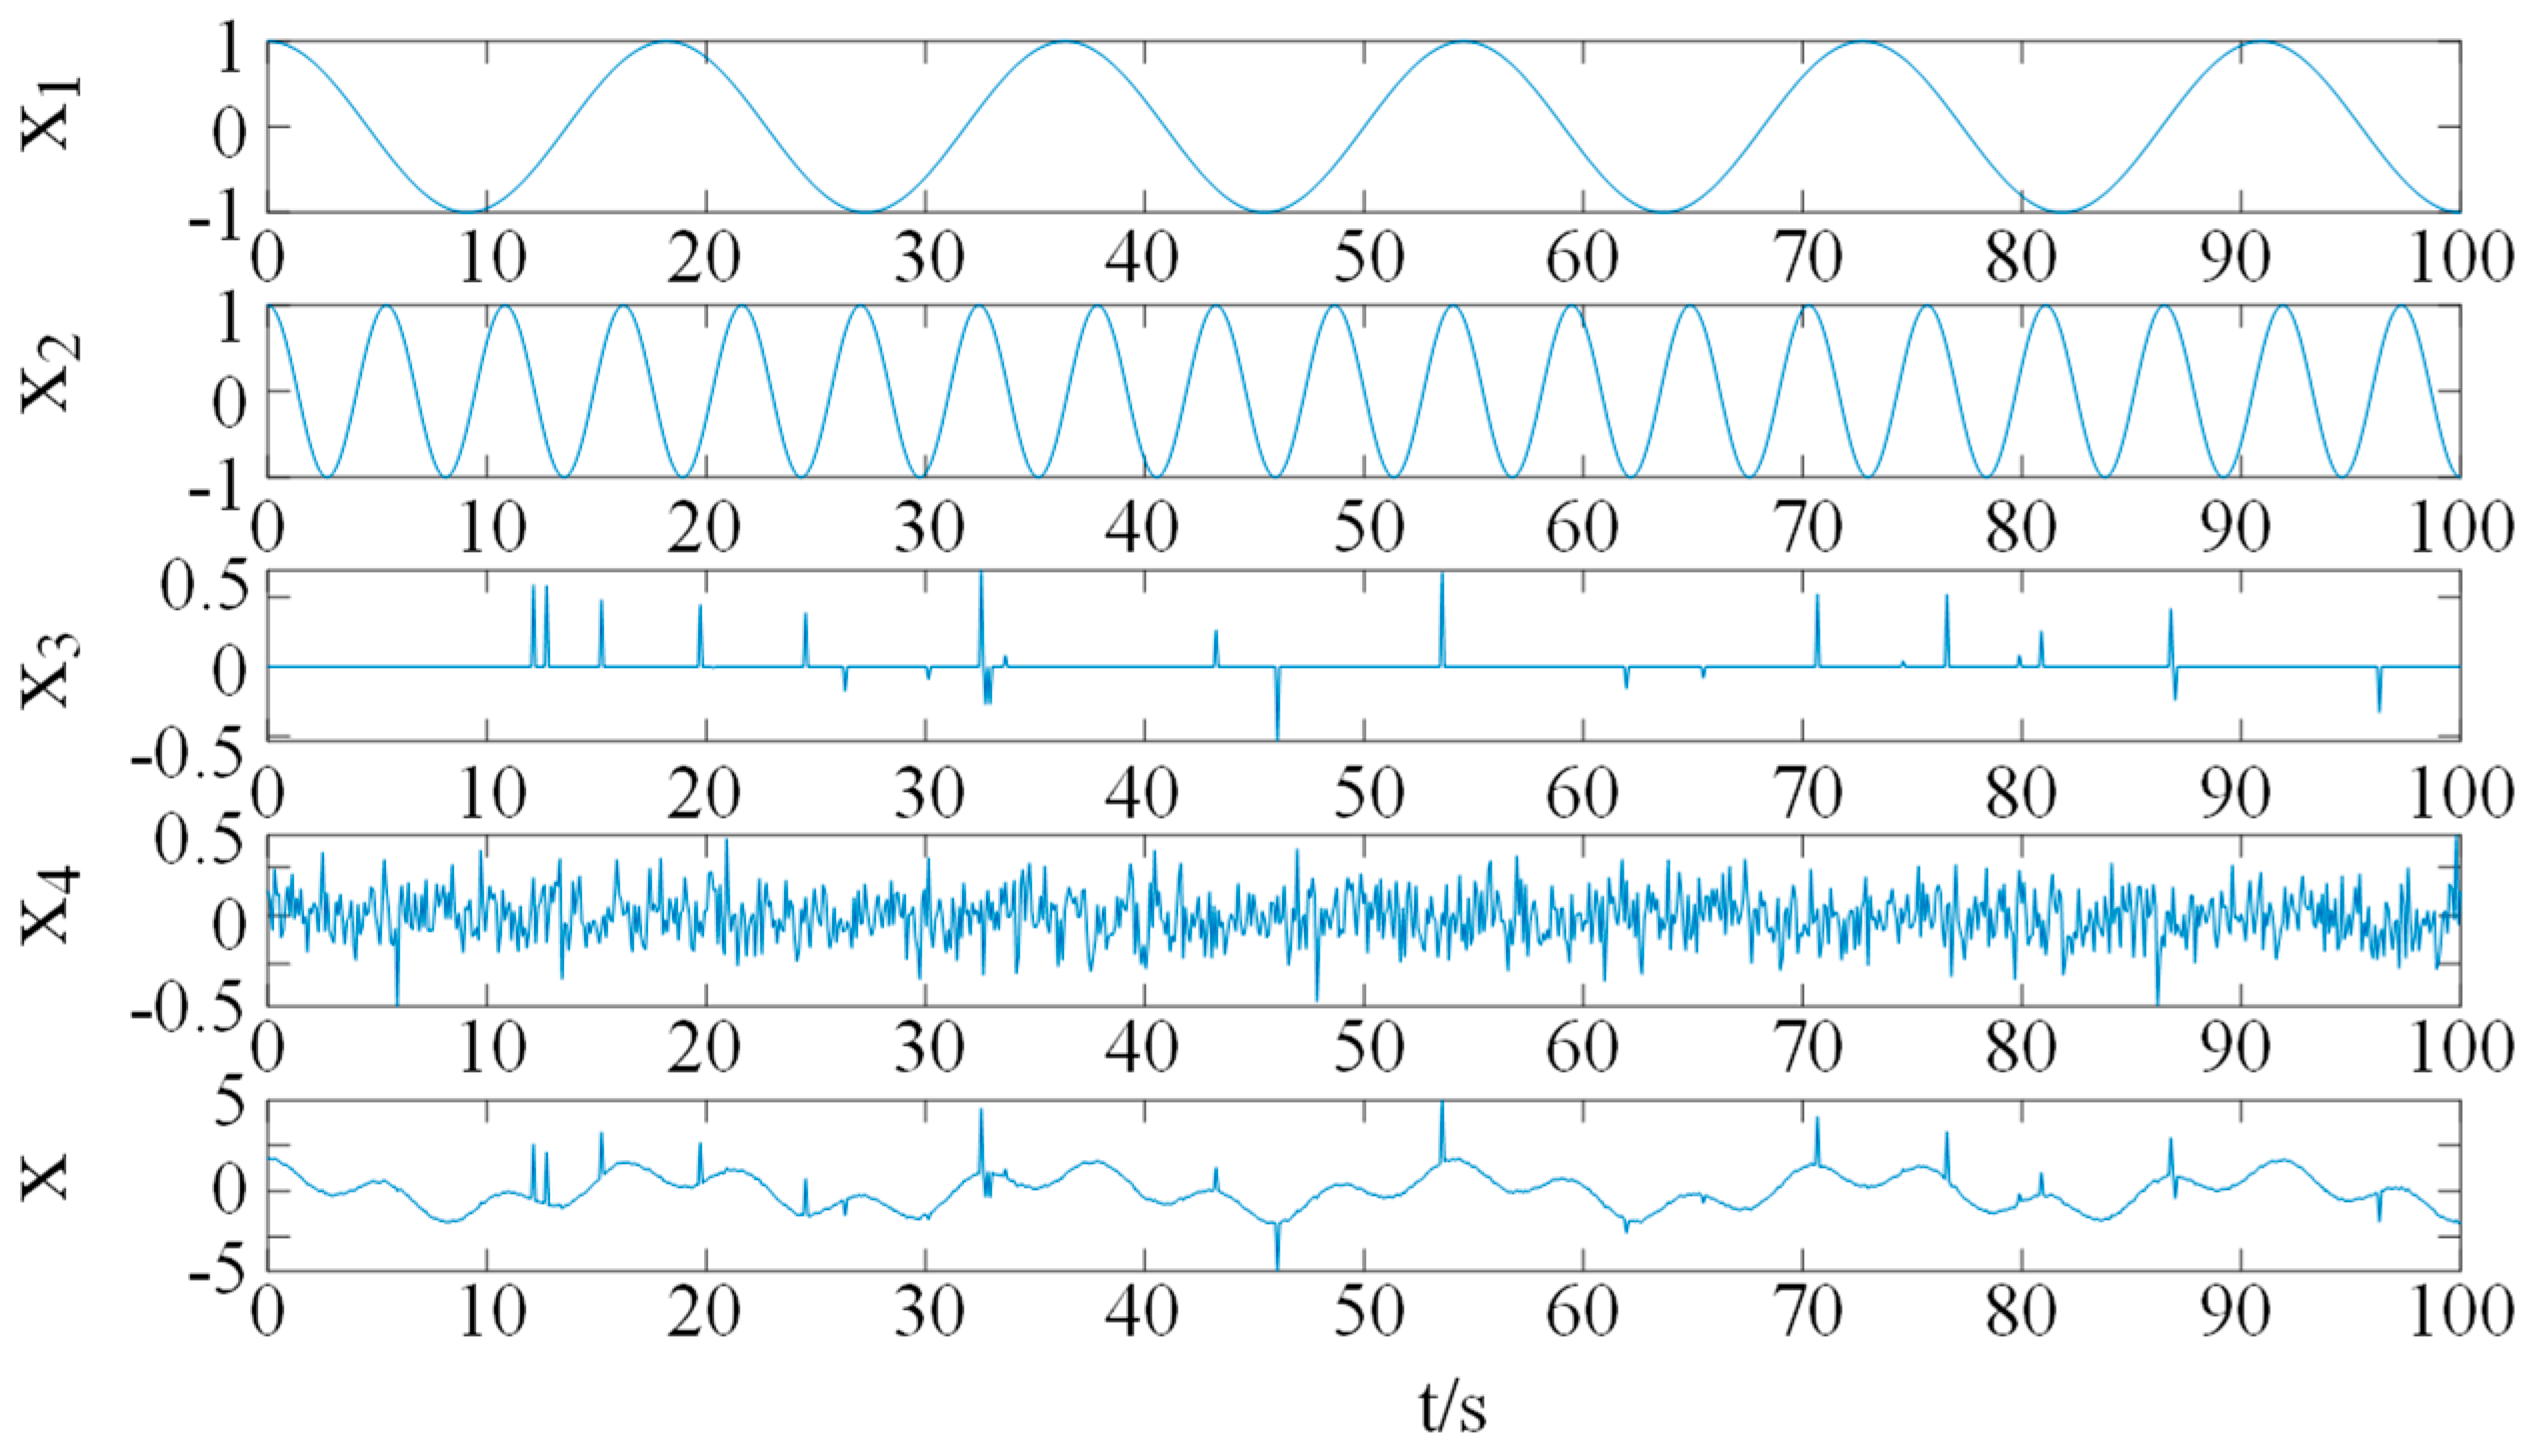
When operating a rotary kiln, the noise level at the site increases significantly, especially under heavy loads and high temperatures, which may cause pitting and spalling of the support rollers and wheel bands. All of the above situations can interfere with the accurate measurement of the rotary kiln displacement signal. Therefore, a multi-component superimposed signal model was constructed as shown in Equation (24), and the simulation signal is shown in Figure 3.
x 1 = cos ( 2 π × 0.055 × t ) x 2 = cos ( 2 π × 0.185 × t ) x 3 = m = + exp ( t m T ) 2 2 σ 2 x 4 = h ( t ) n ( t ) x = x 1 + x 2 + x 3 + x 4
In the equation, T represents the pulse impact, σ denotes Gaussian white noise with a mean of 0 and variance σ 2 , and h ( t ) signifies the filter impulse response.
Among these, x 1 represents a characteristic signal simulating the rotational frequency of the cylinder body, x 2 represents a characteristic signal simulating the rotational frequency of the support rollers, x 3 represents a periodic Gaussian pulse signal simulating the impact of pitting and spalling, and x 4 represents the residual noise interference in the signal after filtering. x 3 and x 4 are random processes implemented in numerical simulations by constructing Gaussian pulse sequences and filtered noise, thereby ensuring the input signals reasonably simulate the operating conditions of the rotary kiln. The number of sampling points is set to 1000. The input signal is shown in Figure 3 above.
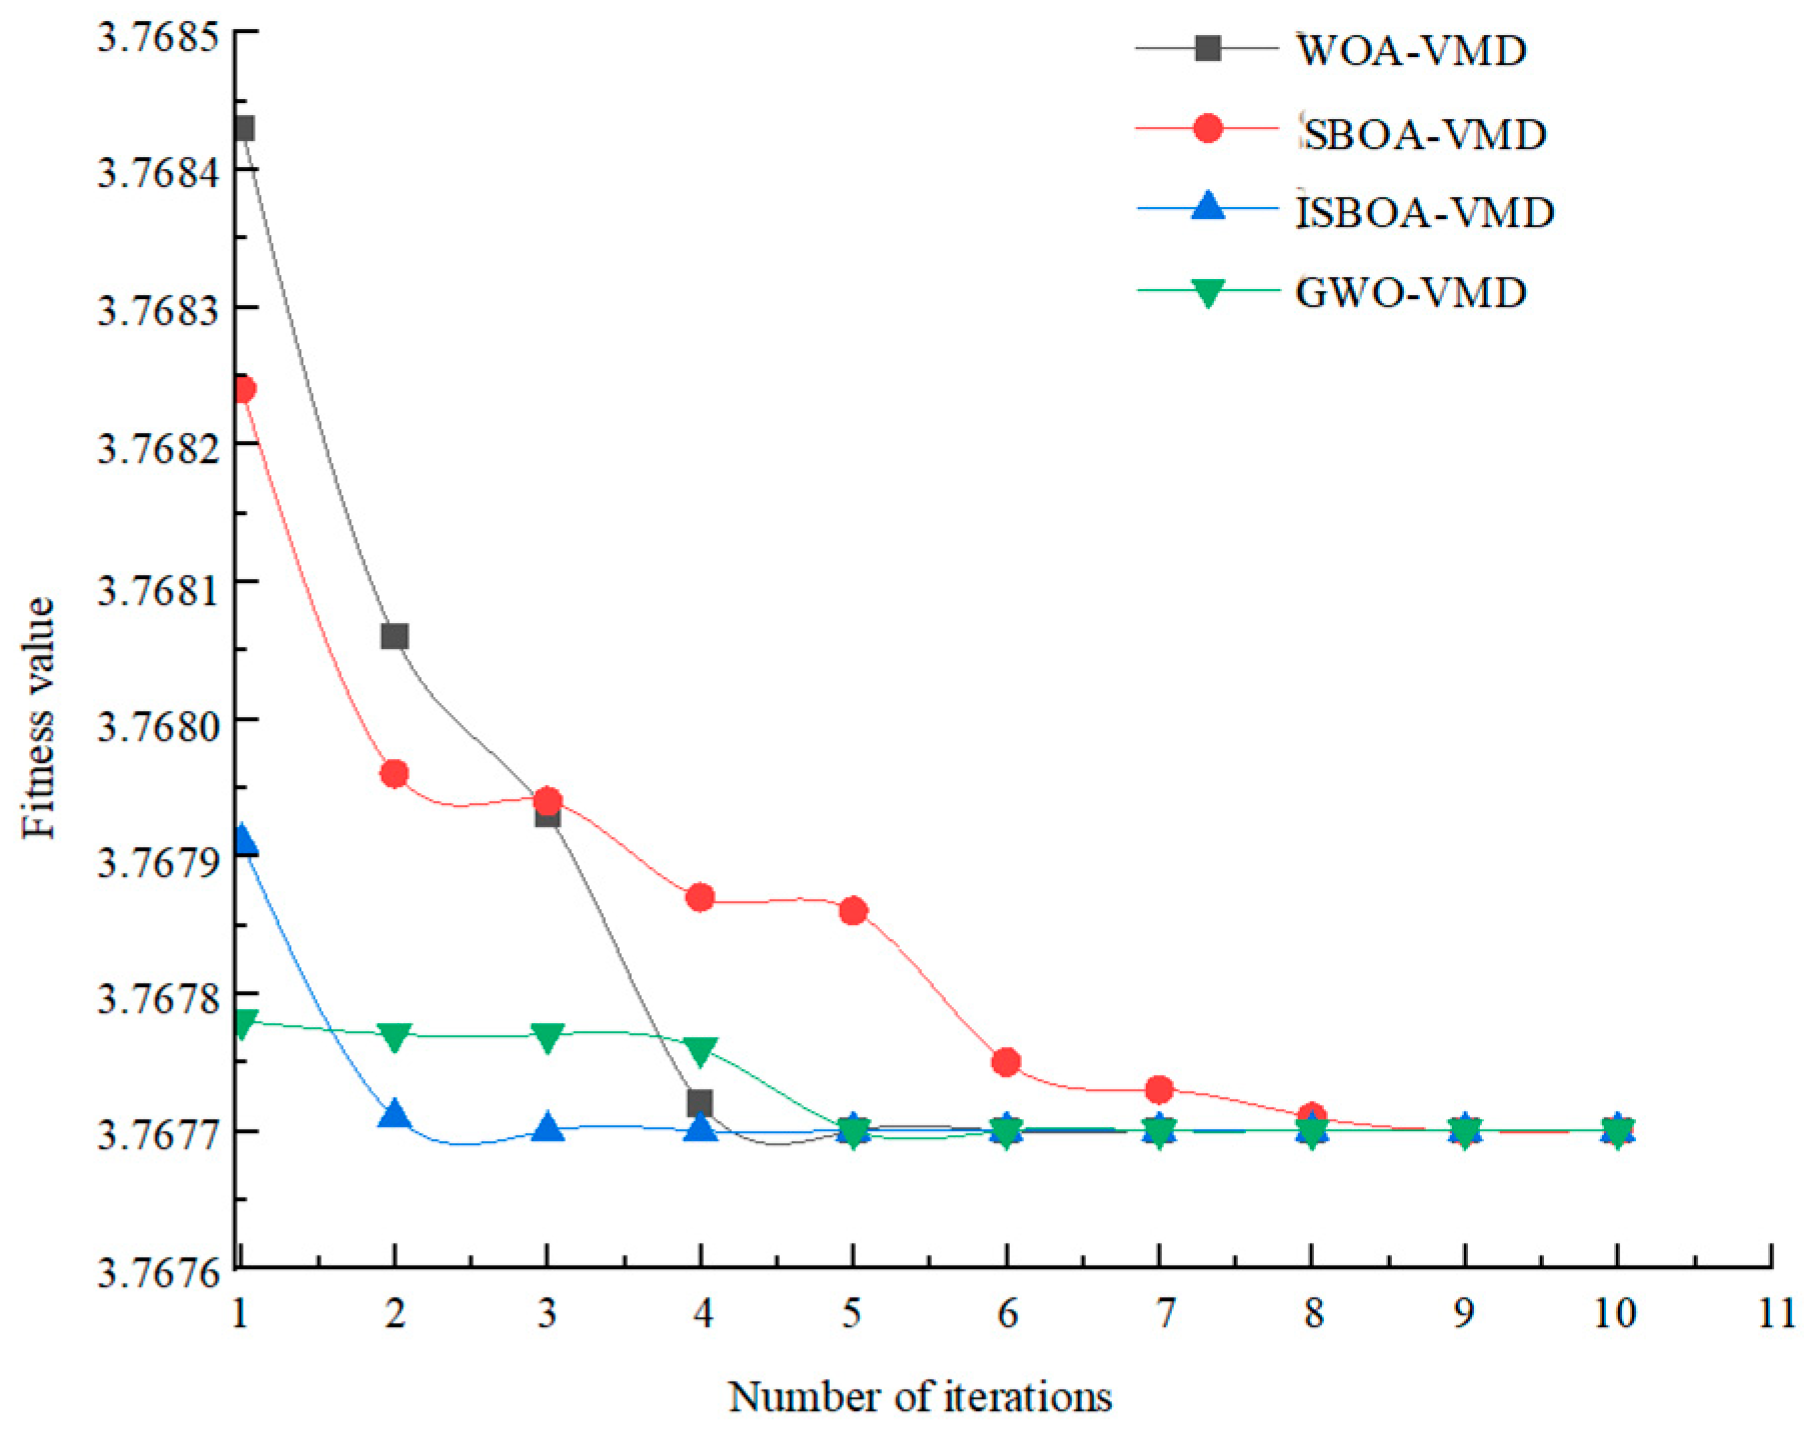
To evaluate the performance of the ISBOA in VMD parameter optimization, the optimization results of ISBOA were compared with those of the gray wolf optimization algorithm (GWO), whale optimization algorithm (WOA), and secretary bird optimization algorithm (SBOA). Figure 4 shows the iterative convergence curves of different optimization algorithms in the VMD parameter optimization process.
As shown in Figure 4, the ISBOA achieves the minimum adaptation value and converges by the second iteration. Compared with the other three algorithms, ISBOA not only exhibits faster convergence speed but also demonstrates better stability and robustness in terms of solution accuracy, effectively avoiding local optima. Therefore, ISBOA demonstrates superior performance to other intelligent optimization algorithms in VMD parameter selection, with a 75% improvement in convergence speed compared to before optimization.
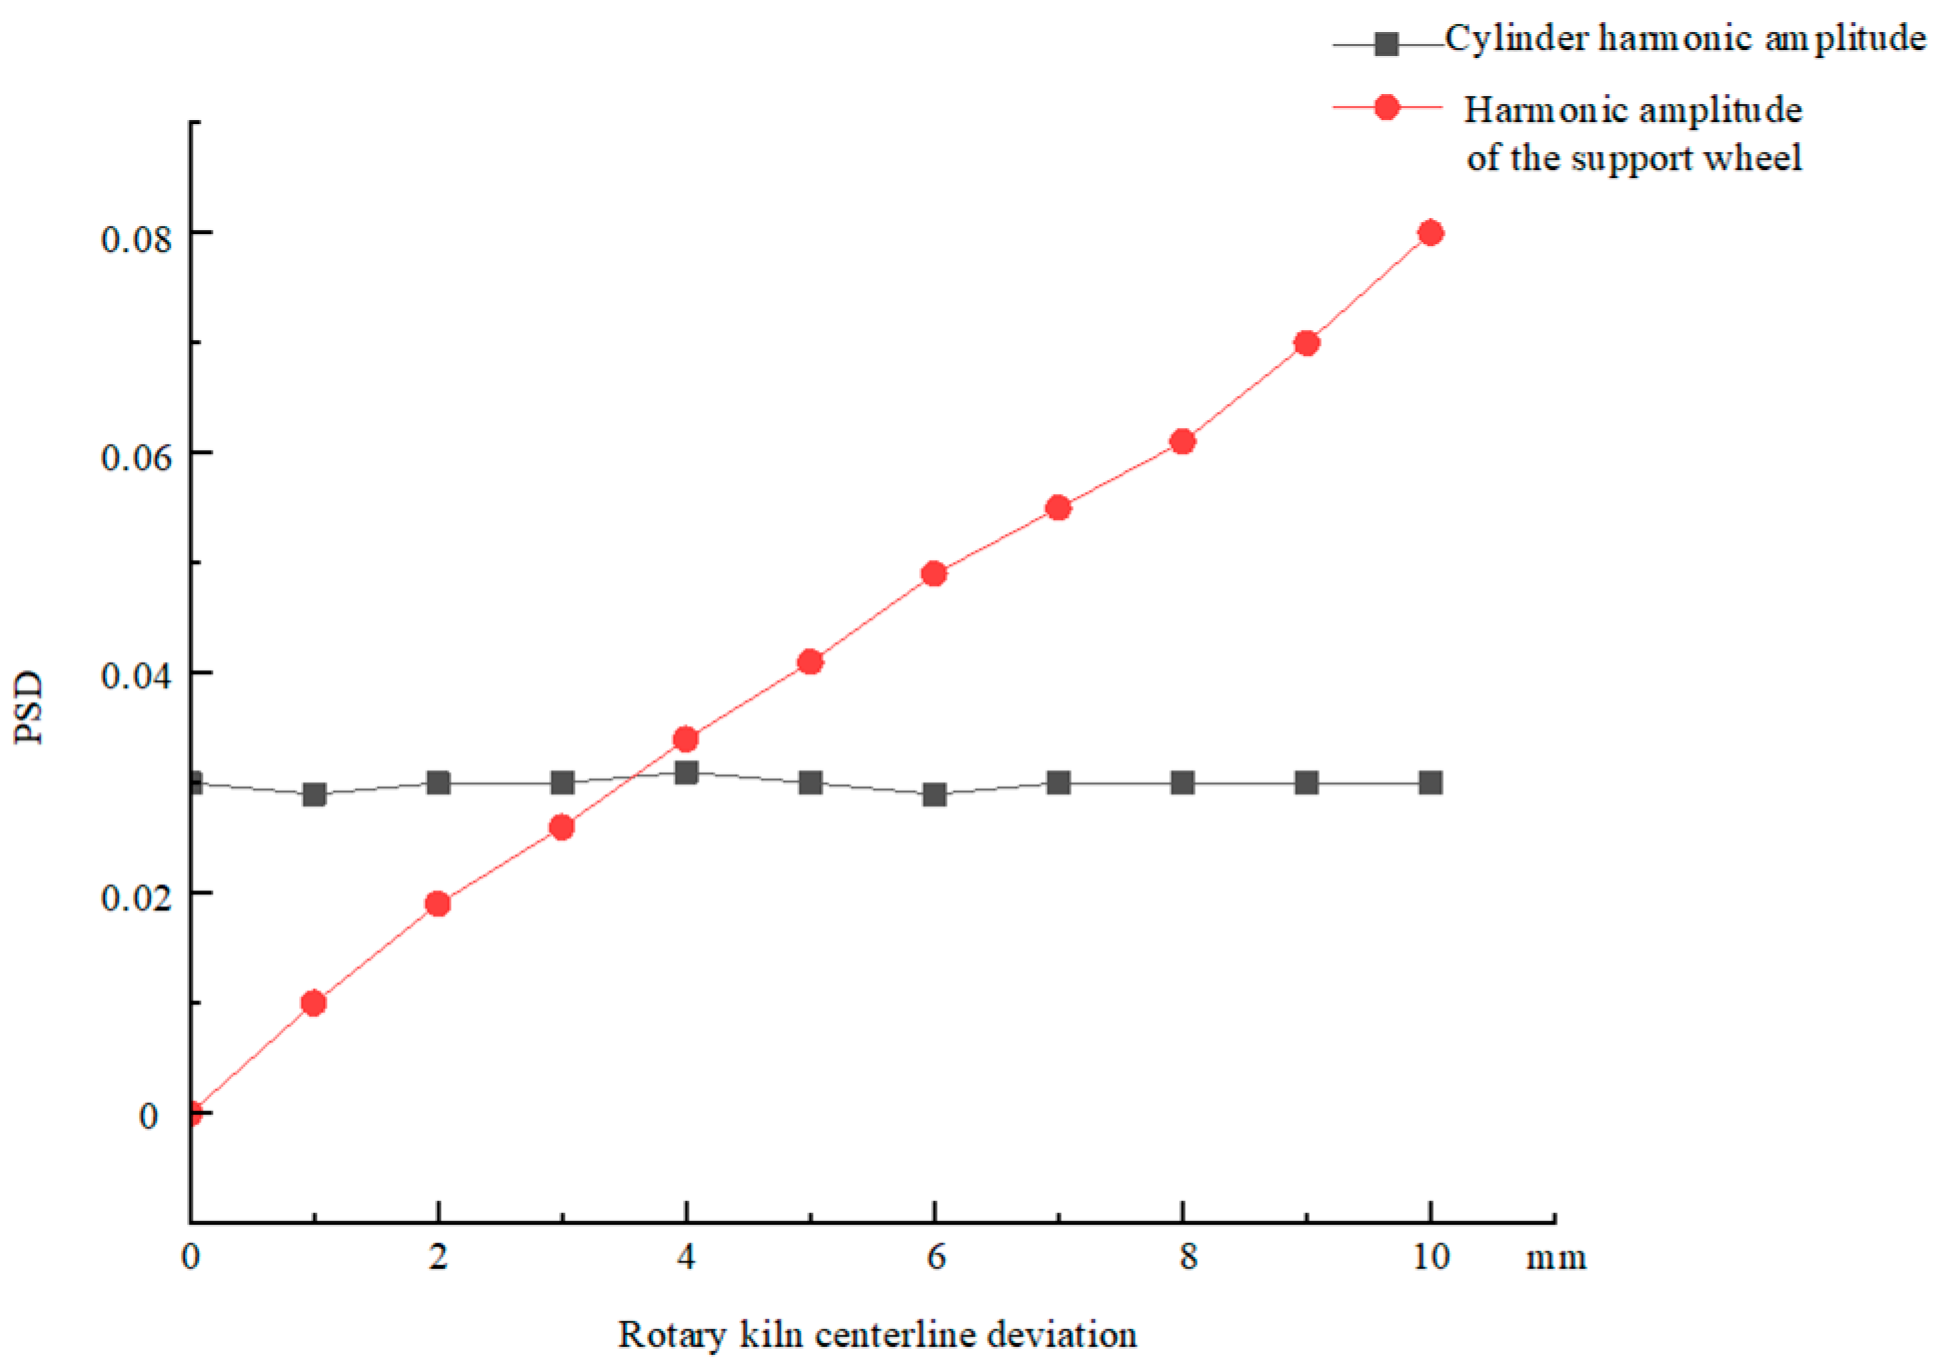
Further analysis of the relationship between rotary kiln faults and the harmonic amplitudes of the rotary kiln cylinder and support rollers is shown in Figure 5 below. The PSD power spectral density is used as a parameter to measure the magnitude of harmonic amplitudes, as shown in Equation (25).
S x x ( f 0 ) = A 2 2 Δ f
In the formula, S x x ( f 0 ) is the PSD value at harmonic frequency f 0 , and Δ f is the frequency resolution.
As shown in Figure 5, when the offset of the cylinder centerline increases, the amplitude of the rotary kiln cylinder harmonic (KH) remains unchanged, while the amplitude of the roller harmonic (RH) increases. When the rotary kiln undergoes thermal bending deformation, the amplitude of RH remains unchanged, while the amplitude of KH increases accordingly. Therefore, the operational status of the rotary kiln can be diagnosed by collecting displacement signals from the rotary kiln.
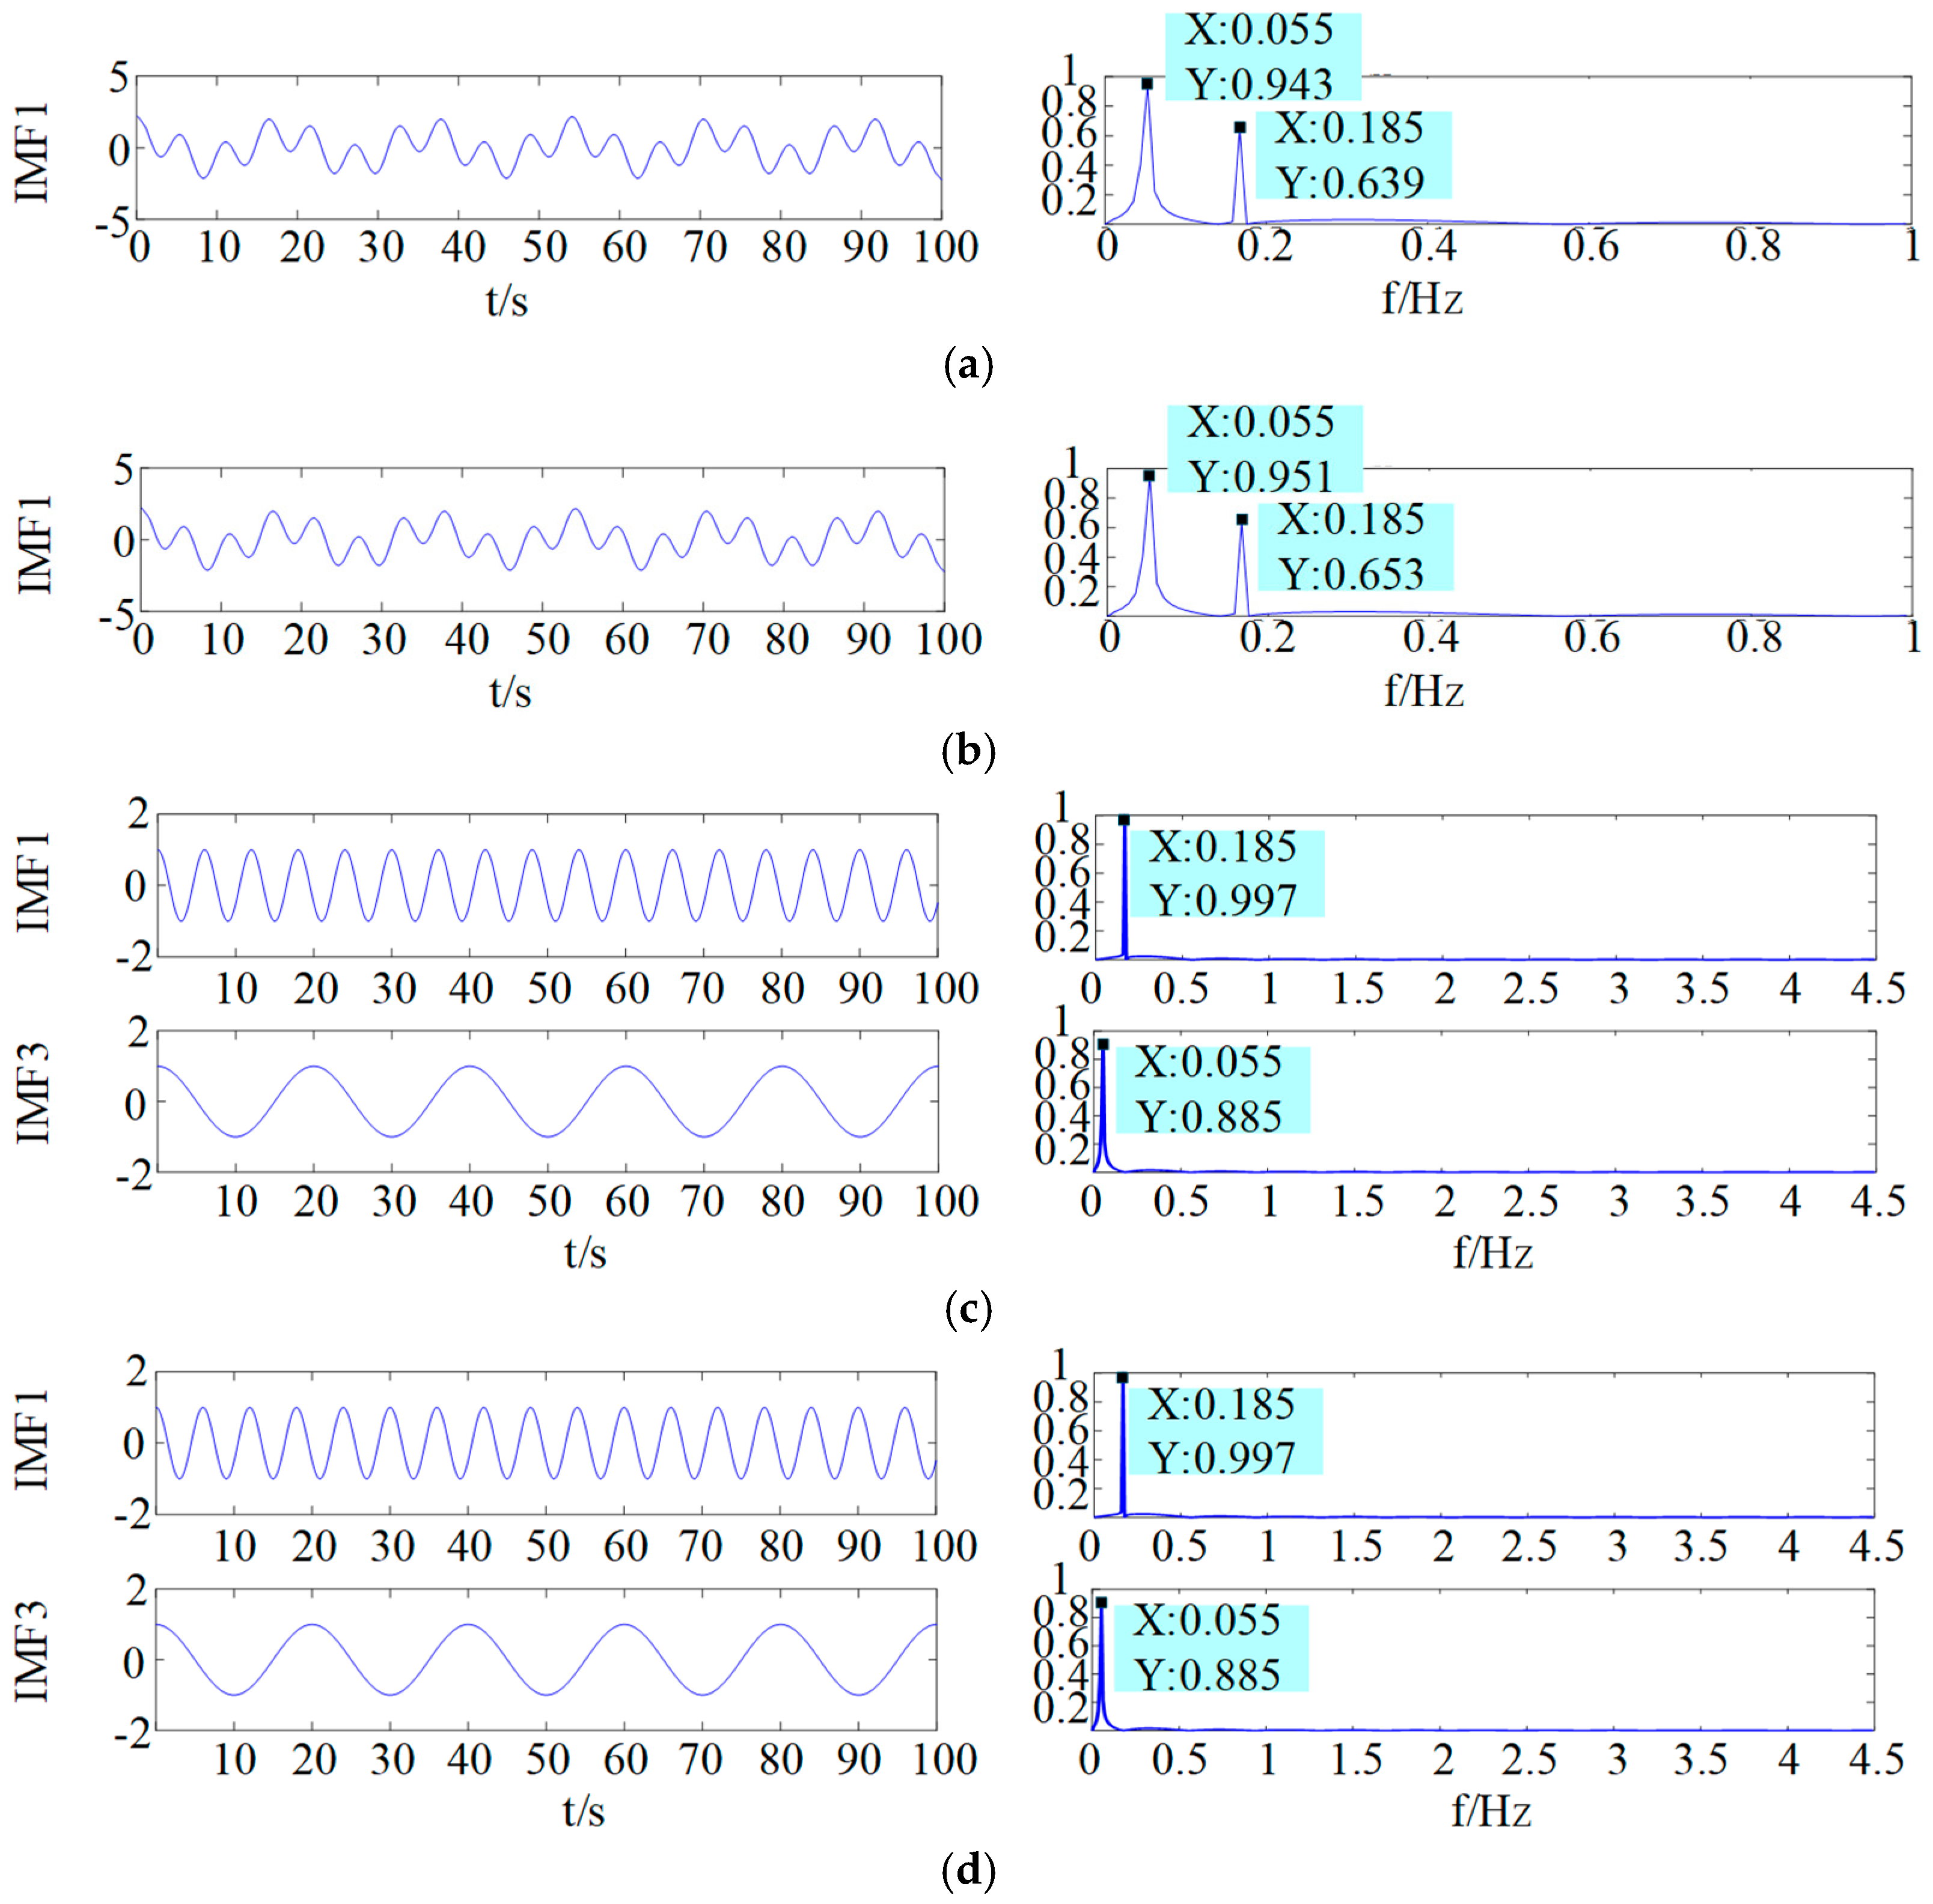
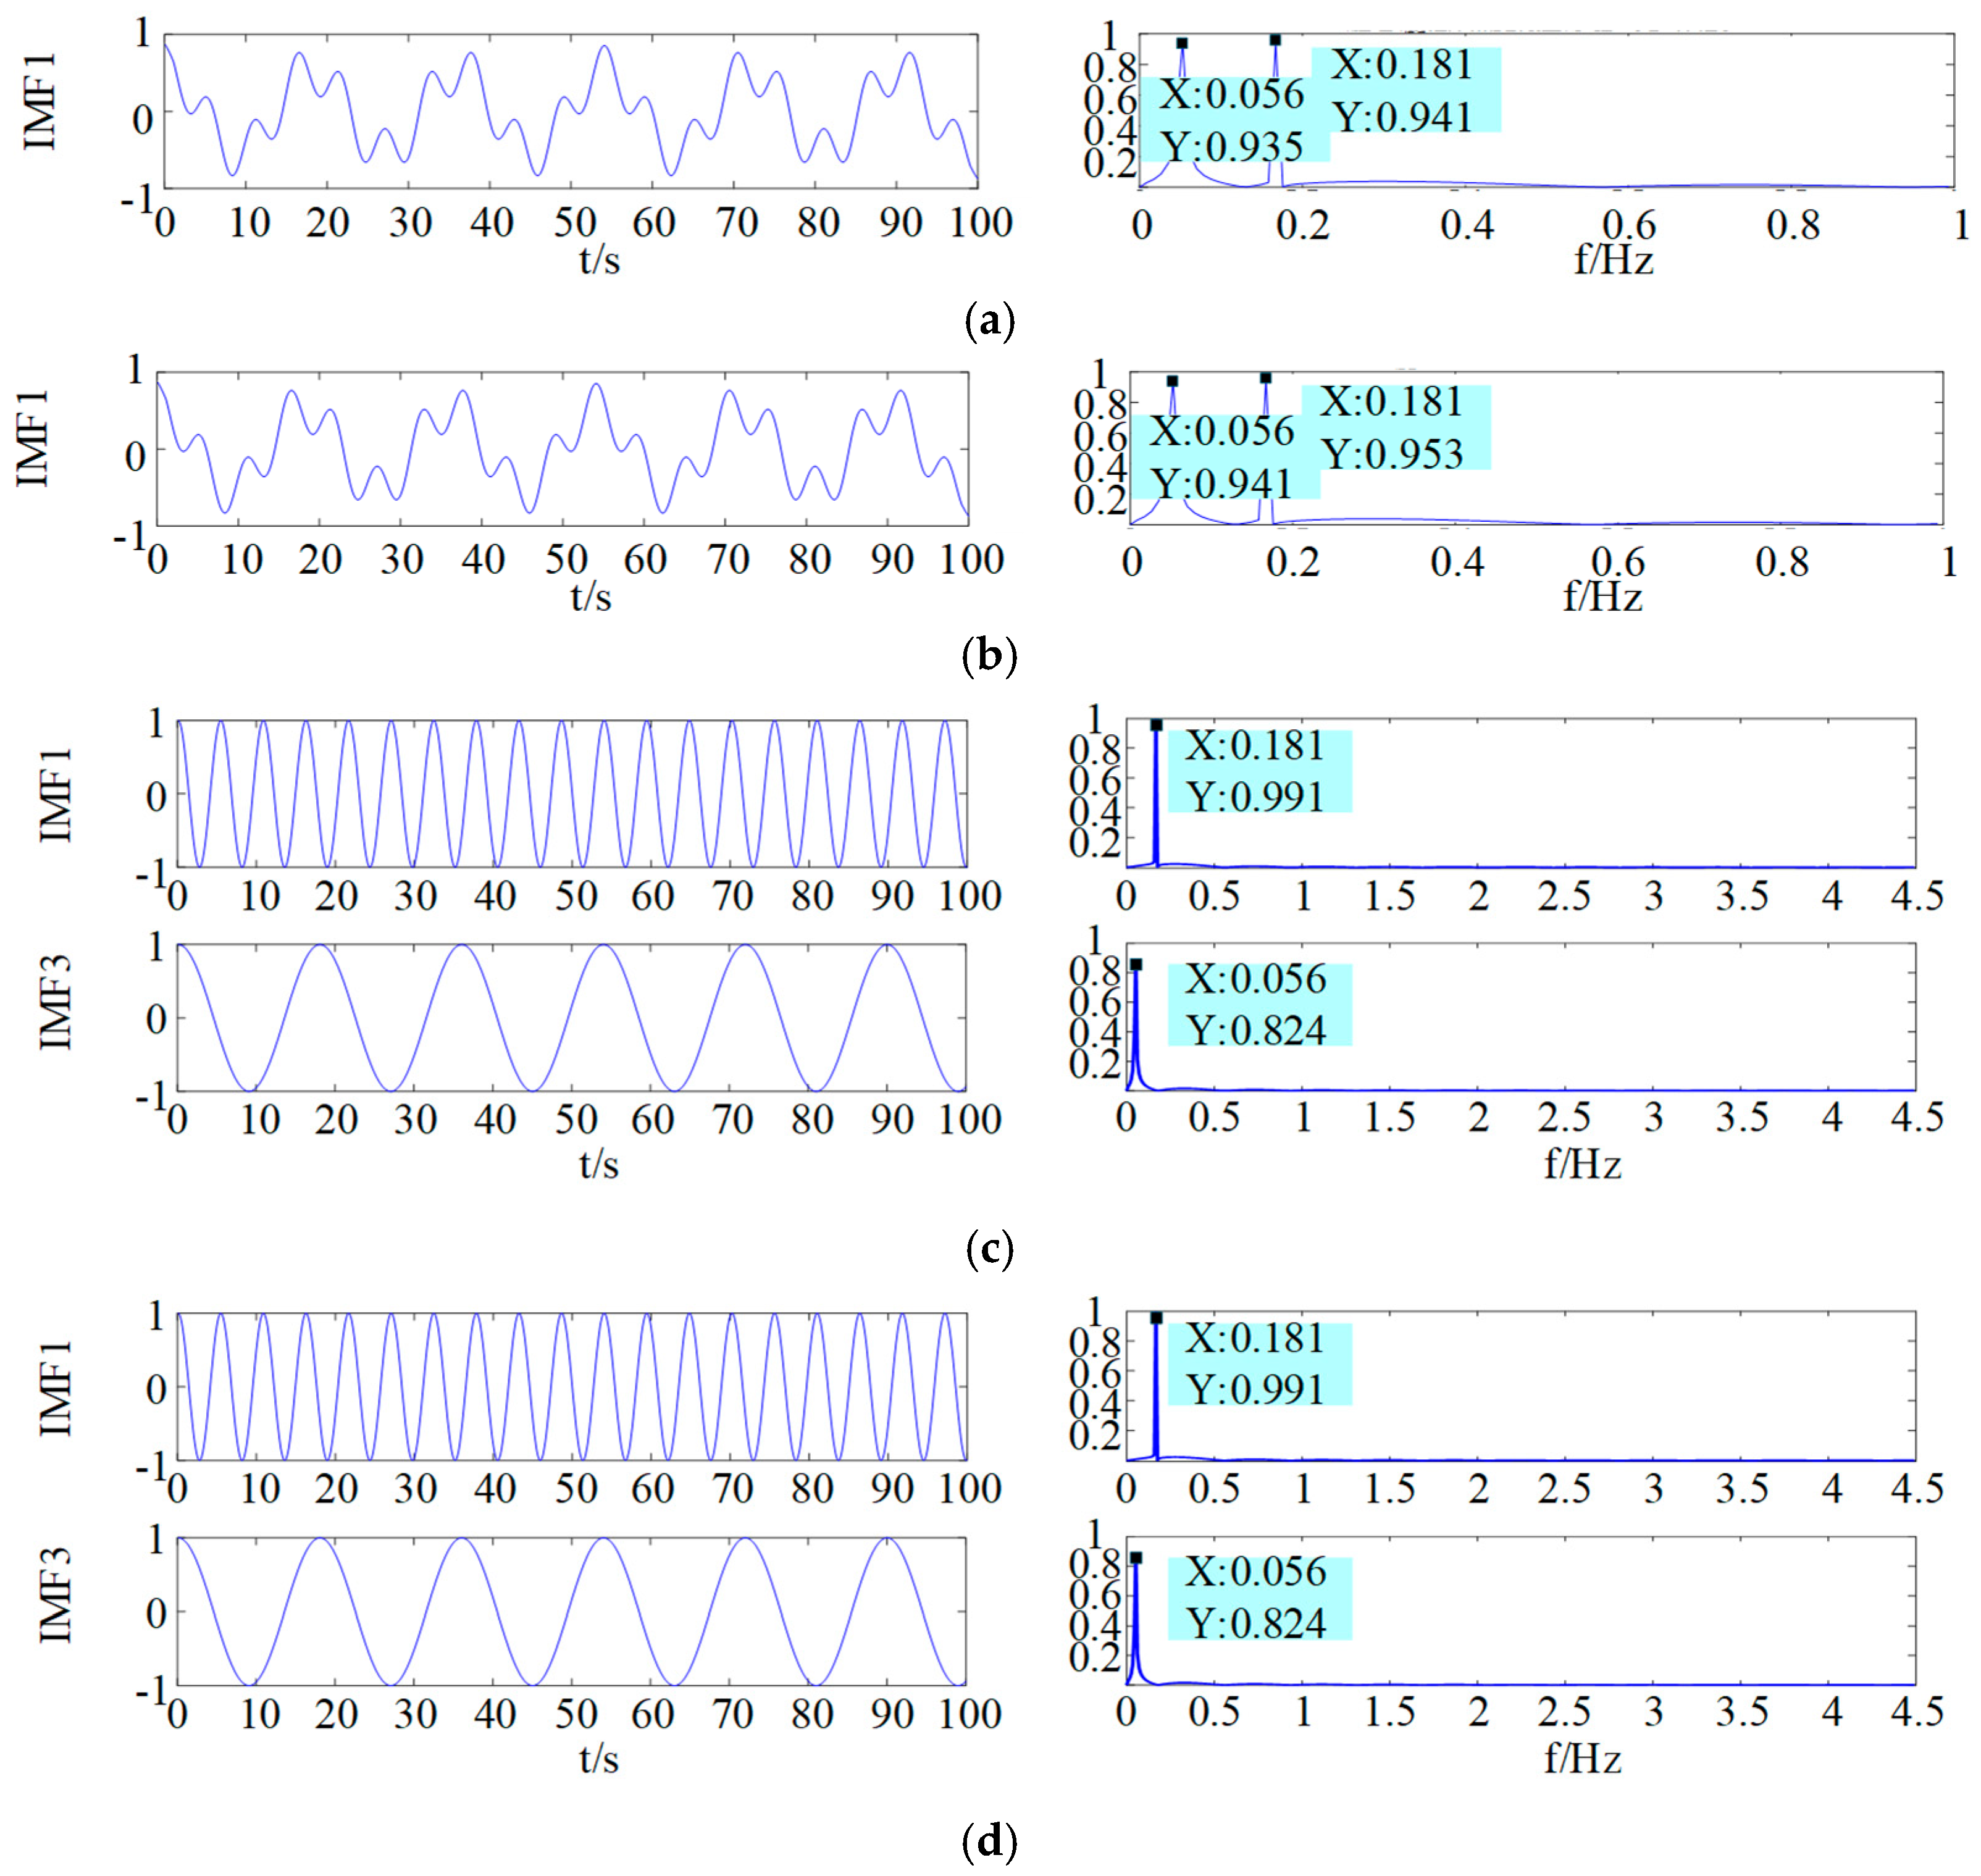
Optimization of VMD was performed using the ISBOA, yielding the optimal combination of decomposition parameters as α = 6 and K = 3000. To validate the effectiveness of the optimized VMD method, the decomposition results under different parameter conditions were extracted and compared. In the experiment, α = 3000 was selected, and K was set to 4, 5, 6, and 7, respectively, to perform feature frequency decomposition of the signal under different K values. The results are shown in Figure 6.
In Figure 6, insufficient decomposition occurs when K = 4 and K = 5, indicating that under these conditions, the signal fails to effectively decompose all signal components, resulting in insufficient decomposition. When K = 6 in Figure 6, the input signal is completely decomposed. As the value of K increases, the decomposition of the signal remains virtually unchanged, indicating that the signal components have been sufficiently decomposed.
Therefore, ISBOA-VMD exhibits good signal retention characteristics during signal decomposition, effectively decomposing the rotary kiln displacement signal according to different frequency bands and retaining key information in the signal. Compared with other signal analysis methods, ISBOA-VMD has higher accuracy and can provide accurate and effective feature signals for the actual fault diagnosis of rotary kilns.

4. Experimental Signal Verification

4.1. Experimental Signal Acquisition

The actual installation positions of the sensors during the experimental measurements are shown in Figure 7. The study focuses on a 5000 t/d rotary kiln at a cement plant in Shaanxi Province. The operating cycle of the rotary kiln is 18.2 s, the cycle of the support rollers is 5.4 s, the length of the rotary kiln is Φ4.8 m × 74 m, and the cycle is 3.3 r/min.
The vibration signal of the rotary kiln at the second gear position is shown in Figure 8. Collect the vibration data of the wheel sleeve of the rotary kiln at the second gear position, collect the wheel sleeve data for 5 revolutions of the rotary kiln. The rotary kiln displacement sensor model is IA15-30GM-I3, featuring a linear range of 15 mm and a sampling rate of 100 Hz. It is magnetically attached to the base via a magnetic base. The NI-6008 data acquisition card converts analog data collected by sensors into digital signals, which are then transmitted via serial port to a host computer for processing and display. Calibration tests conducted during the rotary kiln shutdown period correct the displacement sensor’s zero point and sensitivity, ensuring measurement results meet accuracy requirements. The host computer controls the displacement sensor via an acquisition card to collect displacement signals from the rotary kiln.
By comparing with commonly used signal processing methods, a comparative analysis is conducted on the correlation coefficient ρ between the signal-to-noise ratio (SNR) and the reconstruction quality factor (QRF). The calculation formulas for the signal-to-noise ratio and the reconstruction quality factor are shown in Equations (26) and (27).
S N R = 10 log 1 N i = 1 N y i 2 1 N x i y i 2
Q R F = 10 log 10 x i x i y i 2
In the equation, {xi} and {yi} represent the displacement signal and reconstructed signal of the rotary kiln, respectively, with N denoting the signal length. A higher signal-to-noise ratio indicates less noise in the signal and better quality. A smaller root mean square error indicates superior signal decomposition and reconstruction results.
As shown in Table 1, the signal-to-noise ratio of the VMD method is approximately twice that of the EMD method and wavelet analysis, and its reconstruction quality factor is also significantly higher than both methods. Furthermore, the correlation coefficient of the reconstructed signal is higher than that of the EMD method. This demonstrates that the VMD method exhibits excellent decomposition capability when processing low-frequency signals contaminated with noise interference, while also achieving outstanding separation effects for components with closely spaced frequencies.
Optimize the parameters K and α of VMD using the proposed ISBOA, and then apply it to the denoised acquired signal. The upper and lower limits of the optimization range for K are set to 3 and 10, respectively, and those for α are set to 1500 and 80,000, respectively. When using ISBOA for parameter optimization, a small population size may easily lead to local optima, and excessive iterations may waste computational resources. Therefore, the population size is set to 100 and the maximum number of iterations is set to 100 for optimization. The optimal number of modes K is 10, and the optimal quadratic penalty term α is 9964. Therefore, K is determined to be 10, and the range of α is set to 7964–10,964. Within this interval, the VMD signal decomposition is performed with a step size of 1000, as shown in Figure 9.
By comparing the results, it was found that the characteristic frequencies in (c) and (d) of Figure 10 were completely decomposed, with the first mode component and the third mode component, respectively. According to the decomposition results, the VMD results were most ideal when α = 9964, which is consistent with the value determined by parameter optimization, indicating that the ISBOA-VMD is effective and accurate in determining its parameters. The decomposition results of the actual rotary kiln signal demonstrate that the parameter-optimized VMD method is feasible.
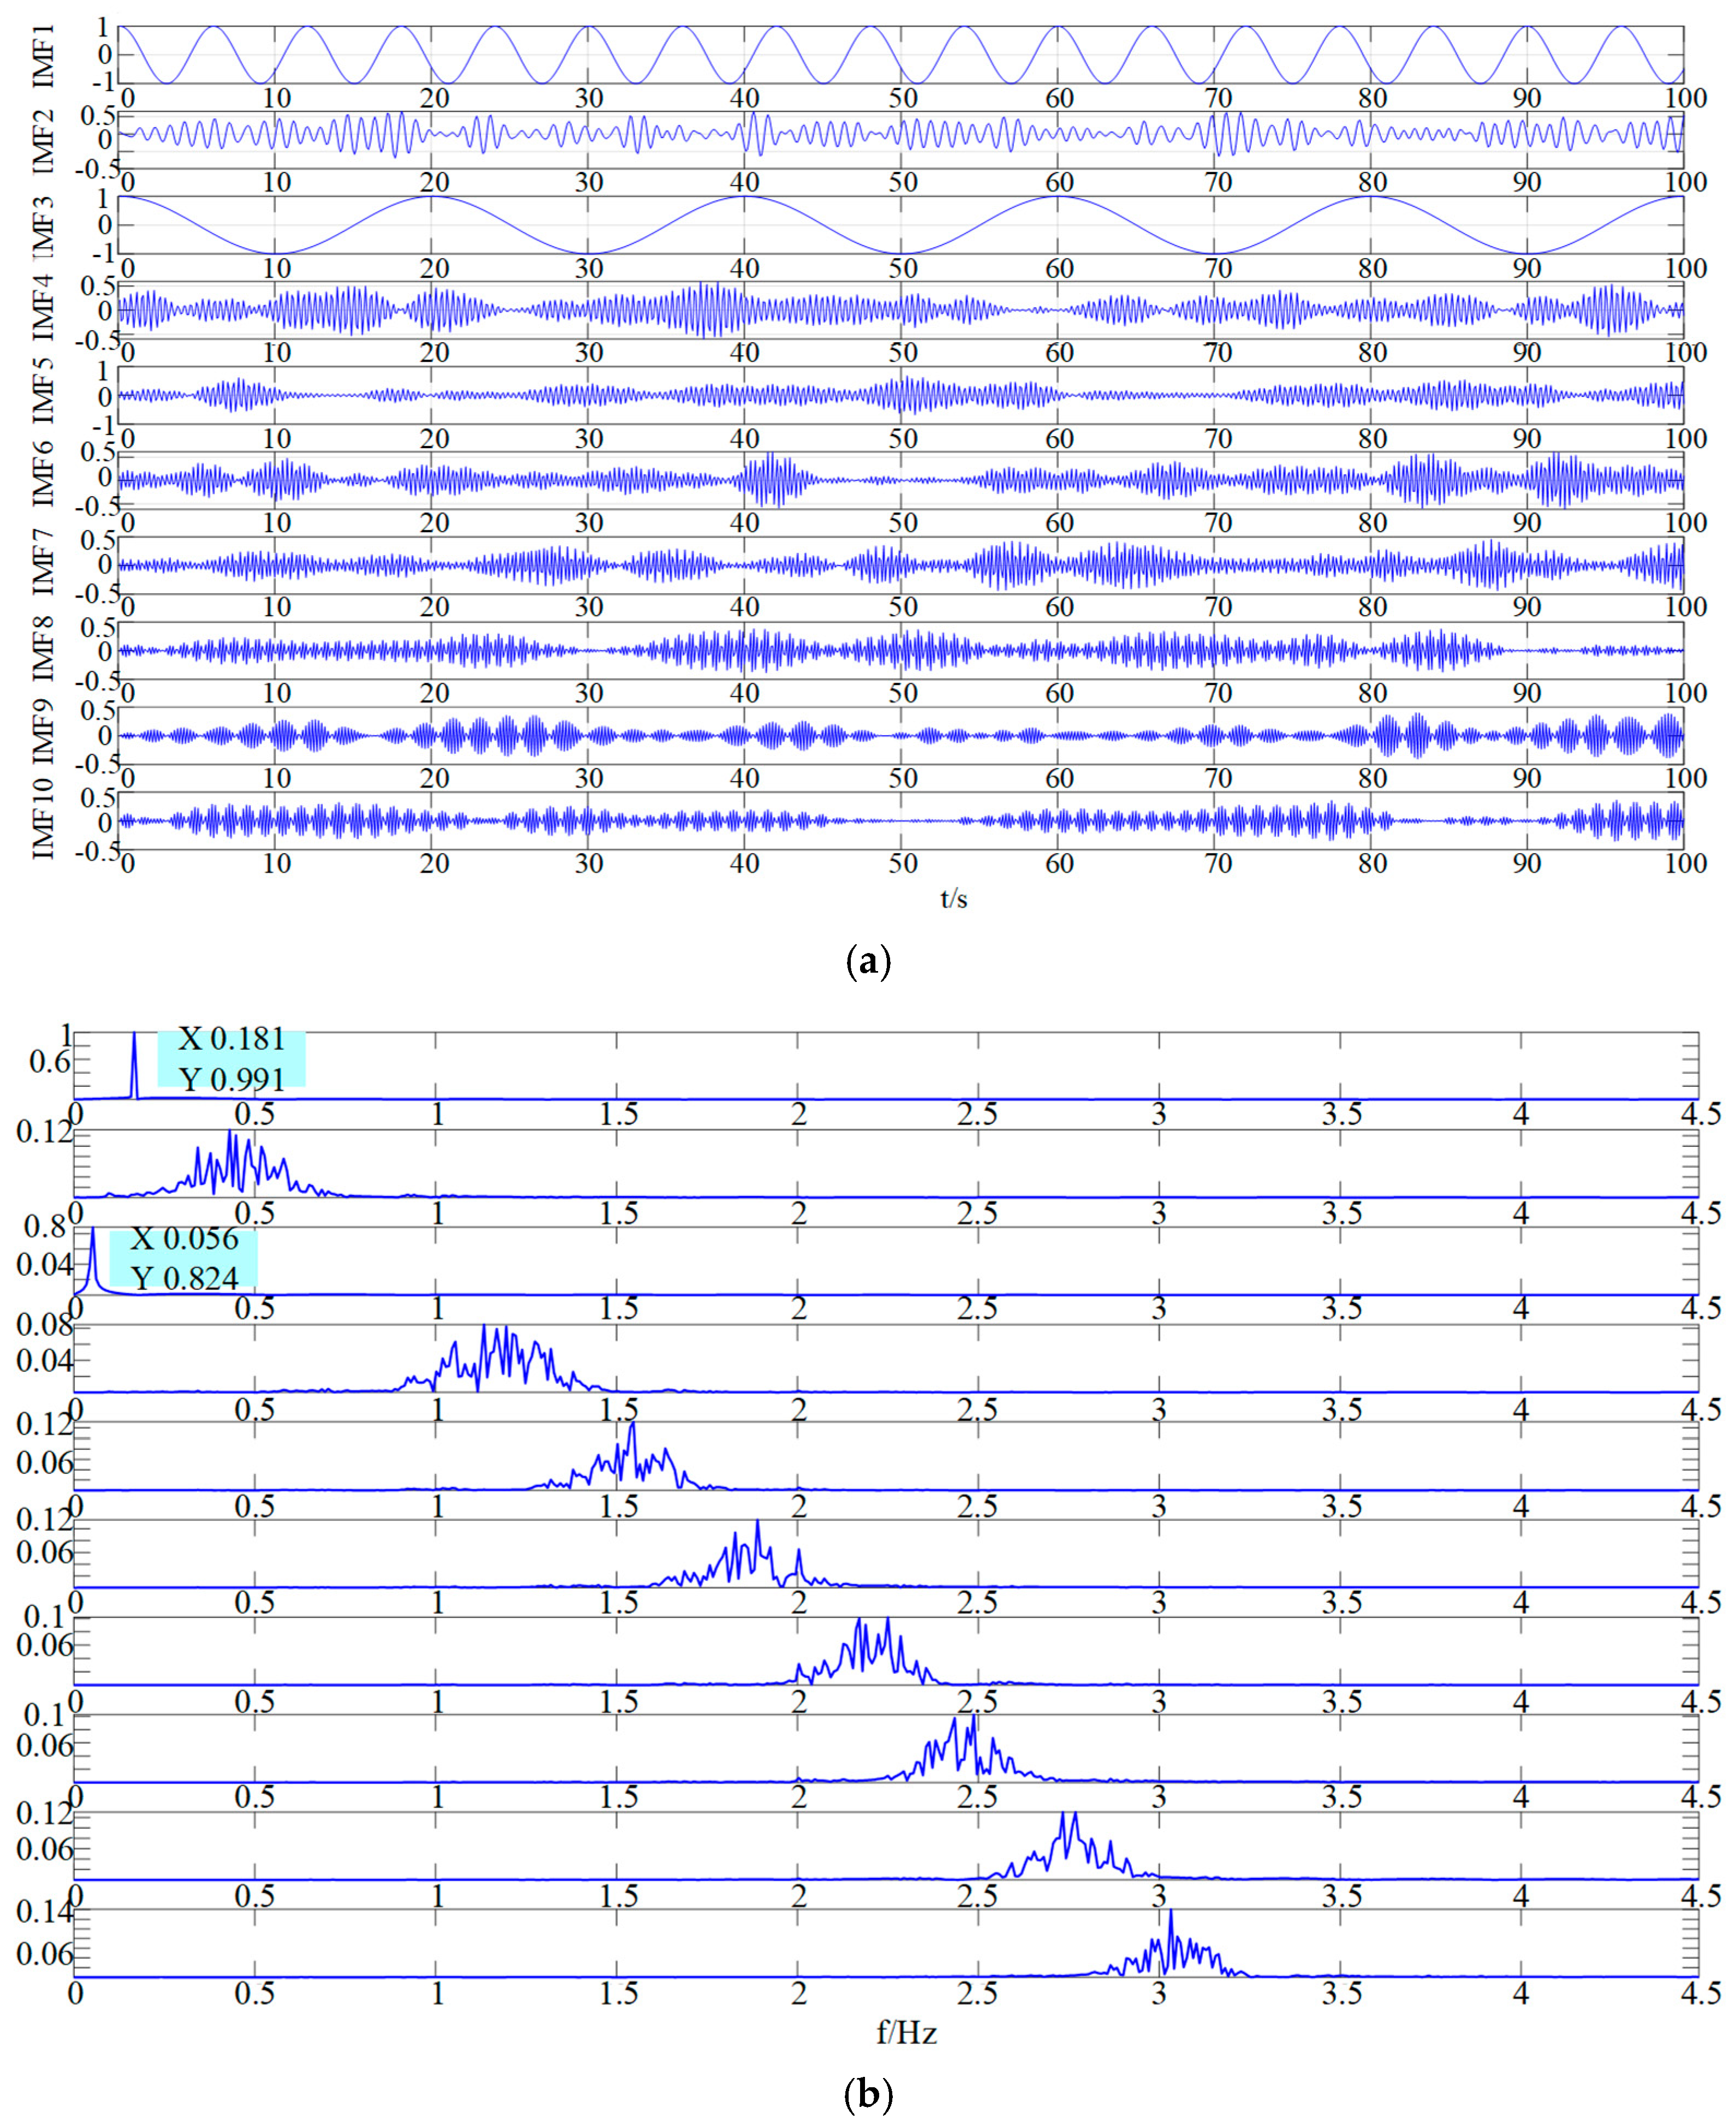
Use this parameter as the K and α parameter values for signal decomposition using ISBOA-VMD. The signal decomposition results using ISBOA-VMD are shown in Figure 10.
As shown in Figure 10a, IMF1 and IMF3 represent the vibration waveforms of the support roller and the cylinder, respectively. The corresponding frequencies in Figure 10b are 0.181 Hz and 0.056 Hz, which are similar to the frequencies of 0.055 Hz for the cylinder and 0.185 Hz for the support roller. This indicates that the ISBOA-VMD method can extract signal components that characterize the information of the cylinder and support roller. The Pearson linear correlation coefficient, as shown in Table 1, can be used to measure the strength of the relationship between two variables. Its value ranges from −1 to 1, where −1 indicates perfect negative correlation, 0 indicates no relationship, and 1 indicates perfect positive correlation.
Table 2 shows that IMF1 and IMF3 have the highest correlation with the original signal, indicating that these two IMF components contain the most information from the original signal and can effectively represent the information of the original signal.

4.2. Rotary Kiln Fault Identification

In variational modal decomposition, the selection of the K value directly determines the quality of the decomposition. Theoretically, the different modal components should maintain good orthogonality to ensure that their linear superposition can approximately reconstruct the original signal in its entirety. Therefore, when the decomposition is sufficient, the sum of the energies of all modal components should be essentially consistent with the total energy of the input signal. The energy expression for a discrete signal is shown in Equation (28) below:
E = i = 1 n x 2 ( i )
In the equation, n represents the signal length, and E denotes the energy of the discrete signal x ( i ) .
To more intuitively express the variation pattern of energy E at different K values, the energy difference parameter ξ is defined as shown in Equation (29):
ξ = E x k = 1 k E k E x
In the equation, E x represents the total energy of the input signal, K denotes the number of modes, and E k signifies the energy of the modal components.
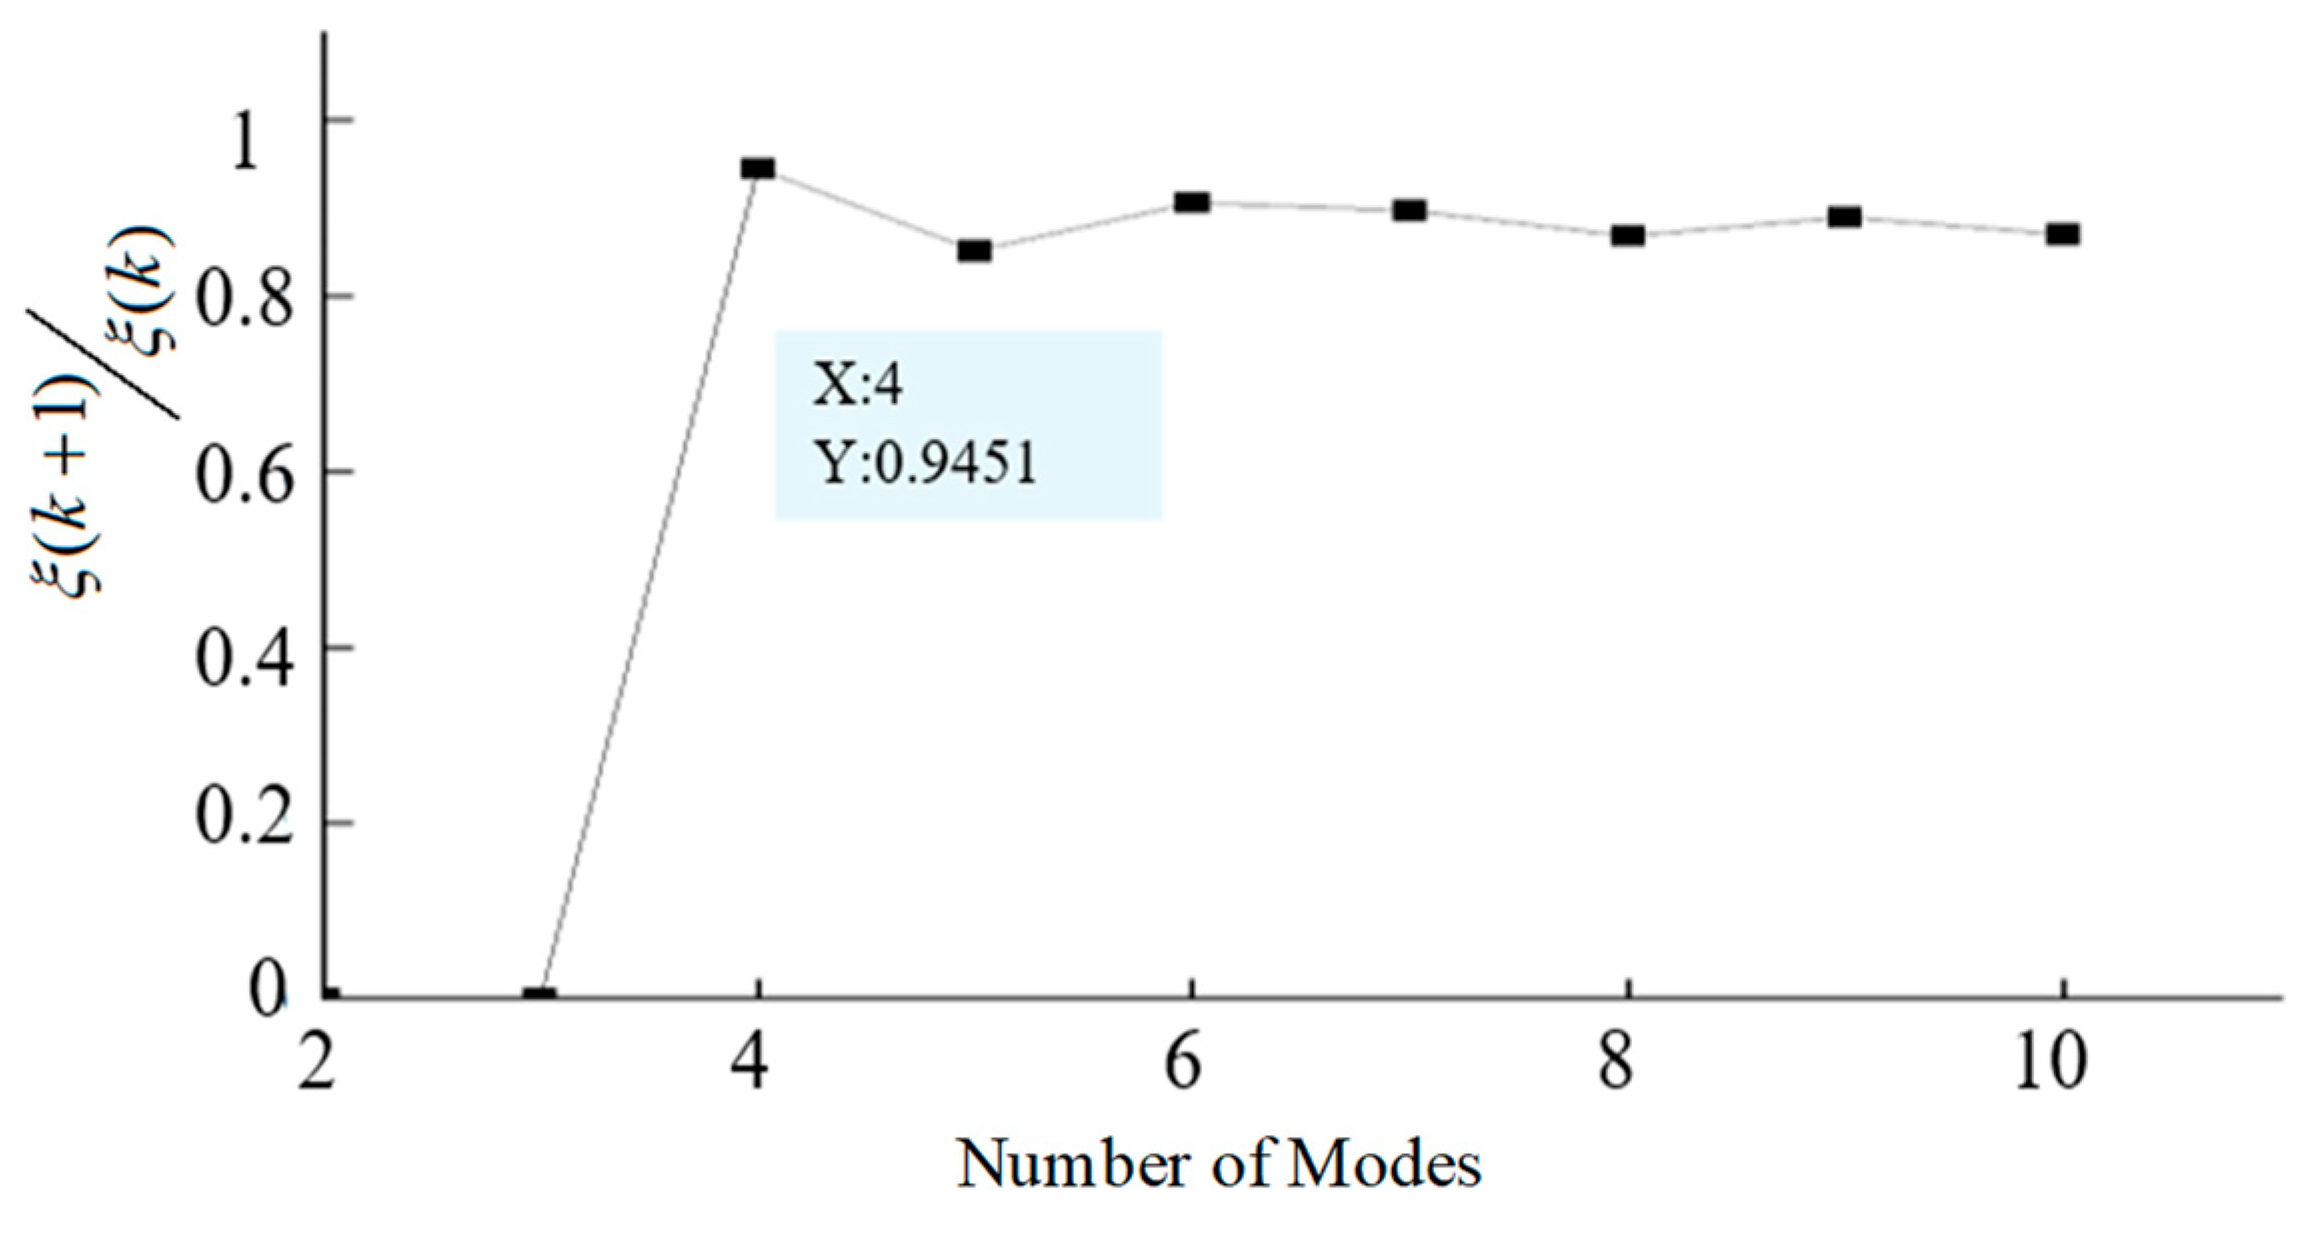
When K is too small, ξ becomes large, failing to fully capture the signal’s frequency characteristics. When K is too large, ξ approaches 0, potentially causing over-decomposition and splitting the signal into numerous modal components. When K is moderate, ξ approaches 0, enabling complete signal decomposition without distortion.
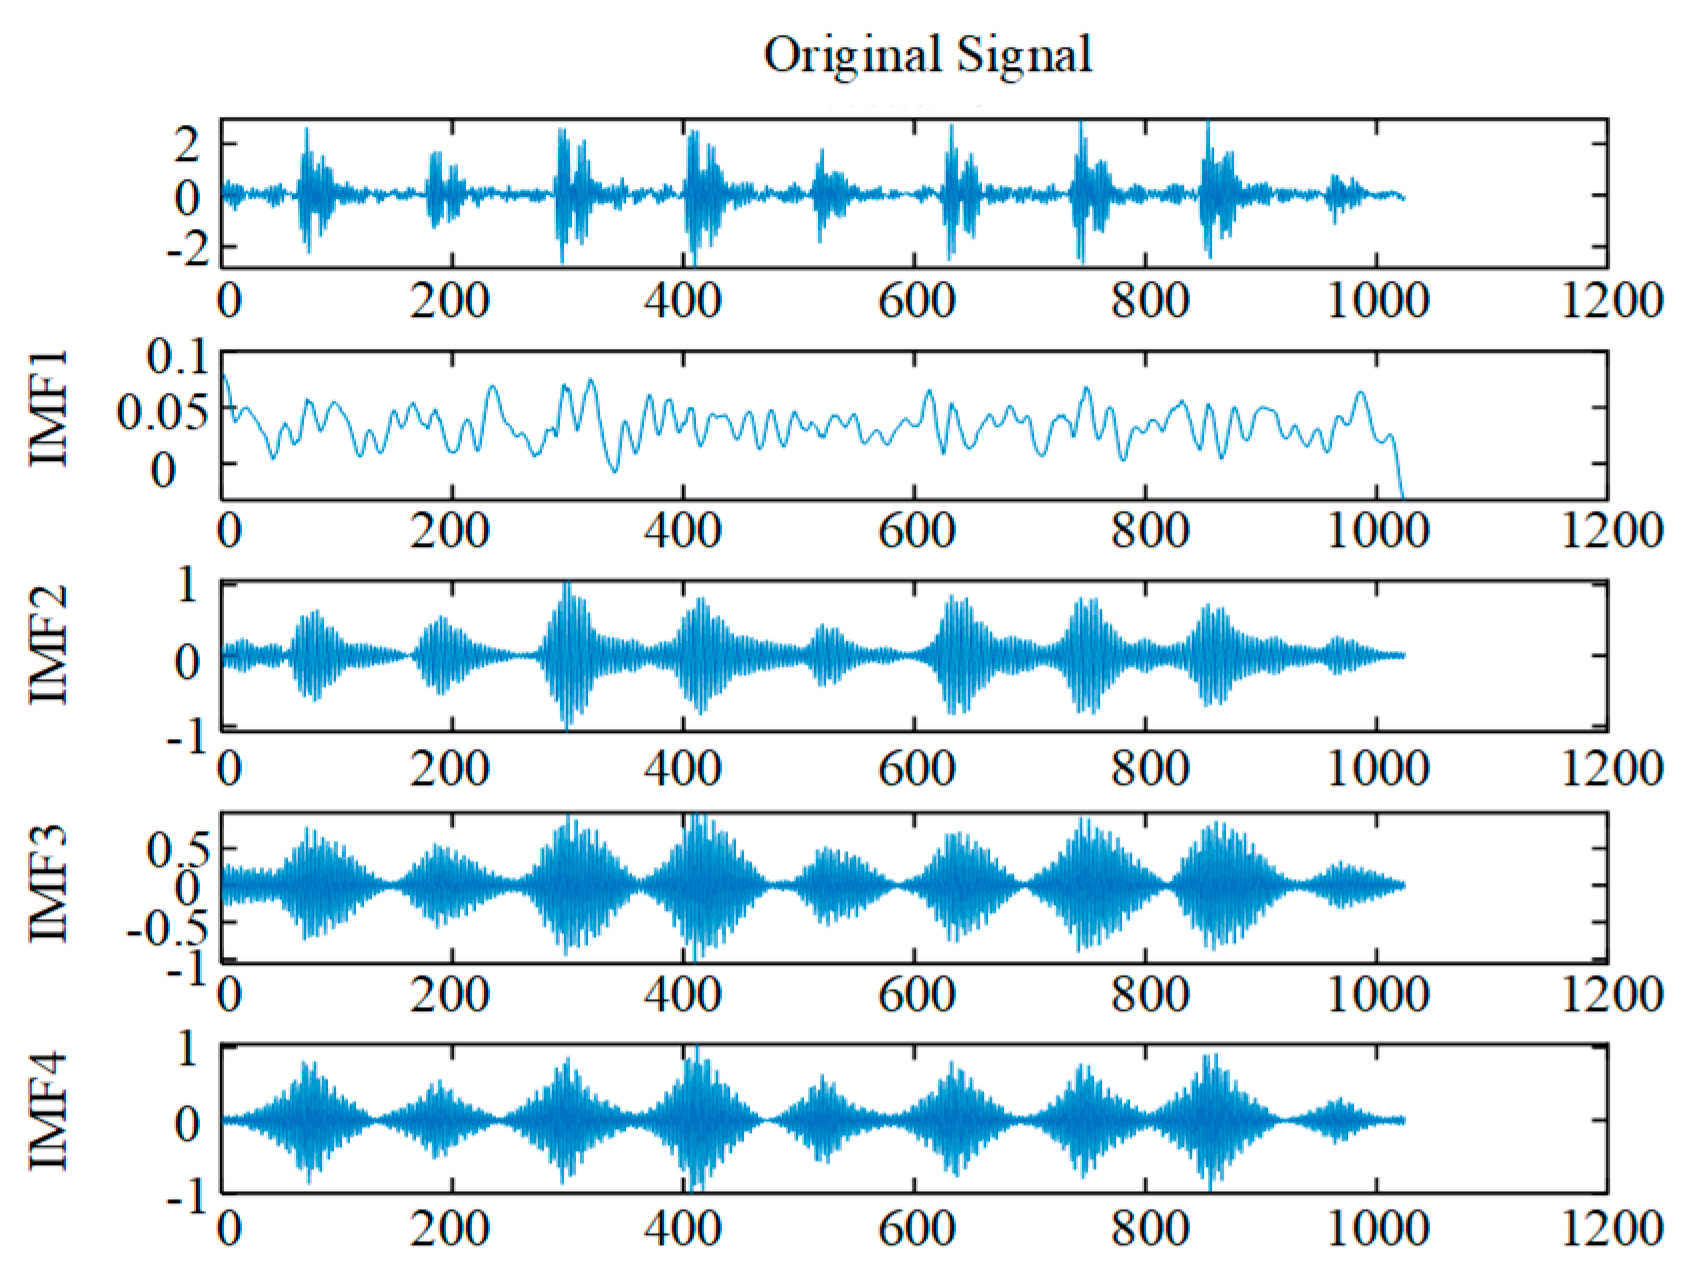
Model accuracy validation was performed using the publicly available dataset from Case Western Reserve University, which includes three fault states—rolling element failure, inner ring failure, and outer ring failure—along with one normal state. The fault diameters measure 0.1778 mm (0.007 inches), 0.3556 mm (0.014 inches), and 0.5334 mm (0.021 inches). The motor speed is 1797 r/min, with a data sampling frequency of 12 kHz. Data was extracted using a sliding window with a fixed length of 1024 raw samples, forming the experimental dataset. The ISBOA-VMD method was applied to decompose the experimental signals, yielding the optimal K , α parameter combination. The corresponding parameter set is [4, 6137], and the decomposed modal components are shown in Figure 11.
In the selection of K values, when K is fully decomposed, the energy of the input signal should be approximately equal to the sum of the energies of each modal component. This allows verification of the analytical effectiveness of K values from an energy perspective [33]. The variation results of the extracted energy difference parameter are shown in Figure 12 below.
As shown in Figure 12, when K equals 4, the energy difference parameter exhibits a marked increase, subsequently maintaining stability at a consistently high level with minimal curve variation. The final K value determined for the energy difference parameter is 4, consistent with that identified by the ISBOA-VMD method, further validating the accuracy and effectiveness of this approach.
The components in the modal components that are close to the power frequency of the rotary kiln and roller are analyzed. Since the signal length has a significant impact on the energy parameters, the mean energy can be used to fairly compare signals of different lengths or different time periods, as shown in Equation (30).
E ¯ = i = 1 n x 2 ( i ) n
In the formula, n is the signal length, and x ( i ) is the input signal.
The signals collected from the cement rotary kiln are first decomposed using VMD, and then the energy averages of the signals consistent with the frequency of the roller and cylinder are calculated, as shown in Table 3.
The measurement of thermal bending faults in rotary kilns is performed by measuring their contours using laser sensors, followed by fitting a circle using the least squares method to determine the offset of the rotary kiln. The displacement at the three positions of the rotary kiln is shown in Table 4. For the centerline displacement fault of the cylinder, an ellipticity measurement method is used, with the center horizontal plane of the kiln body set as the measurement starting point. When the instrument rotates to the horizontal end and directly above, peaks and valleys appear. Since the support rollers are subjected to compression from the cylinder, two troughs appear when rotating to these two positions. The relative sizes of these troughs reflect the relative forces acting on the support rollers on both sides, thereby determining the offset of the rotary kiln’s center point. By comparing the peak-to-peak values R and L of the deformation curve as it passes through the support rollers, the force conditions on the left and right support rollers are determined to assess the offset of the rotary kiln’s centerline. The peak-to-peak values at the three support roller positions are shown in Figure 13. The actual results are analyzed in comparison with the energy average results.
As shown in Figure 13, when R/L is greater than 1 in the first gear, the wave valley at the right support wheel is larger than that at the left support wheel, indicating that the right support wheel is subjected to greater force in this gear, and the cylinder center is relatively shifted to the right. When R/L is less than 1 in the third gear, the wave valley at the left support wheel is larger than that at the right support wheel, indicating that the left support wheel is subjected to greater force in this gear, and the cylinder center is relatively shifted to the left.
Figure 14 shows the harmonic energy average of the rotary kiln cylinder. The average value is taken for observation and comparison. It can be seen that the average value is highest at the second gear of the rotary kiln and lowest at the third gear. This comparison result is consistent with the eccentricity measured in Table 3, indicating that the average energy of the characteristic signal of the rotary kiln cylinder can reflect the degree of thermal bending failure of the rotary kiln.
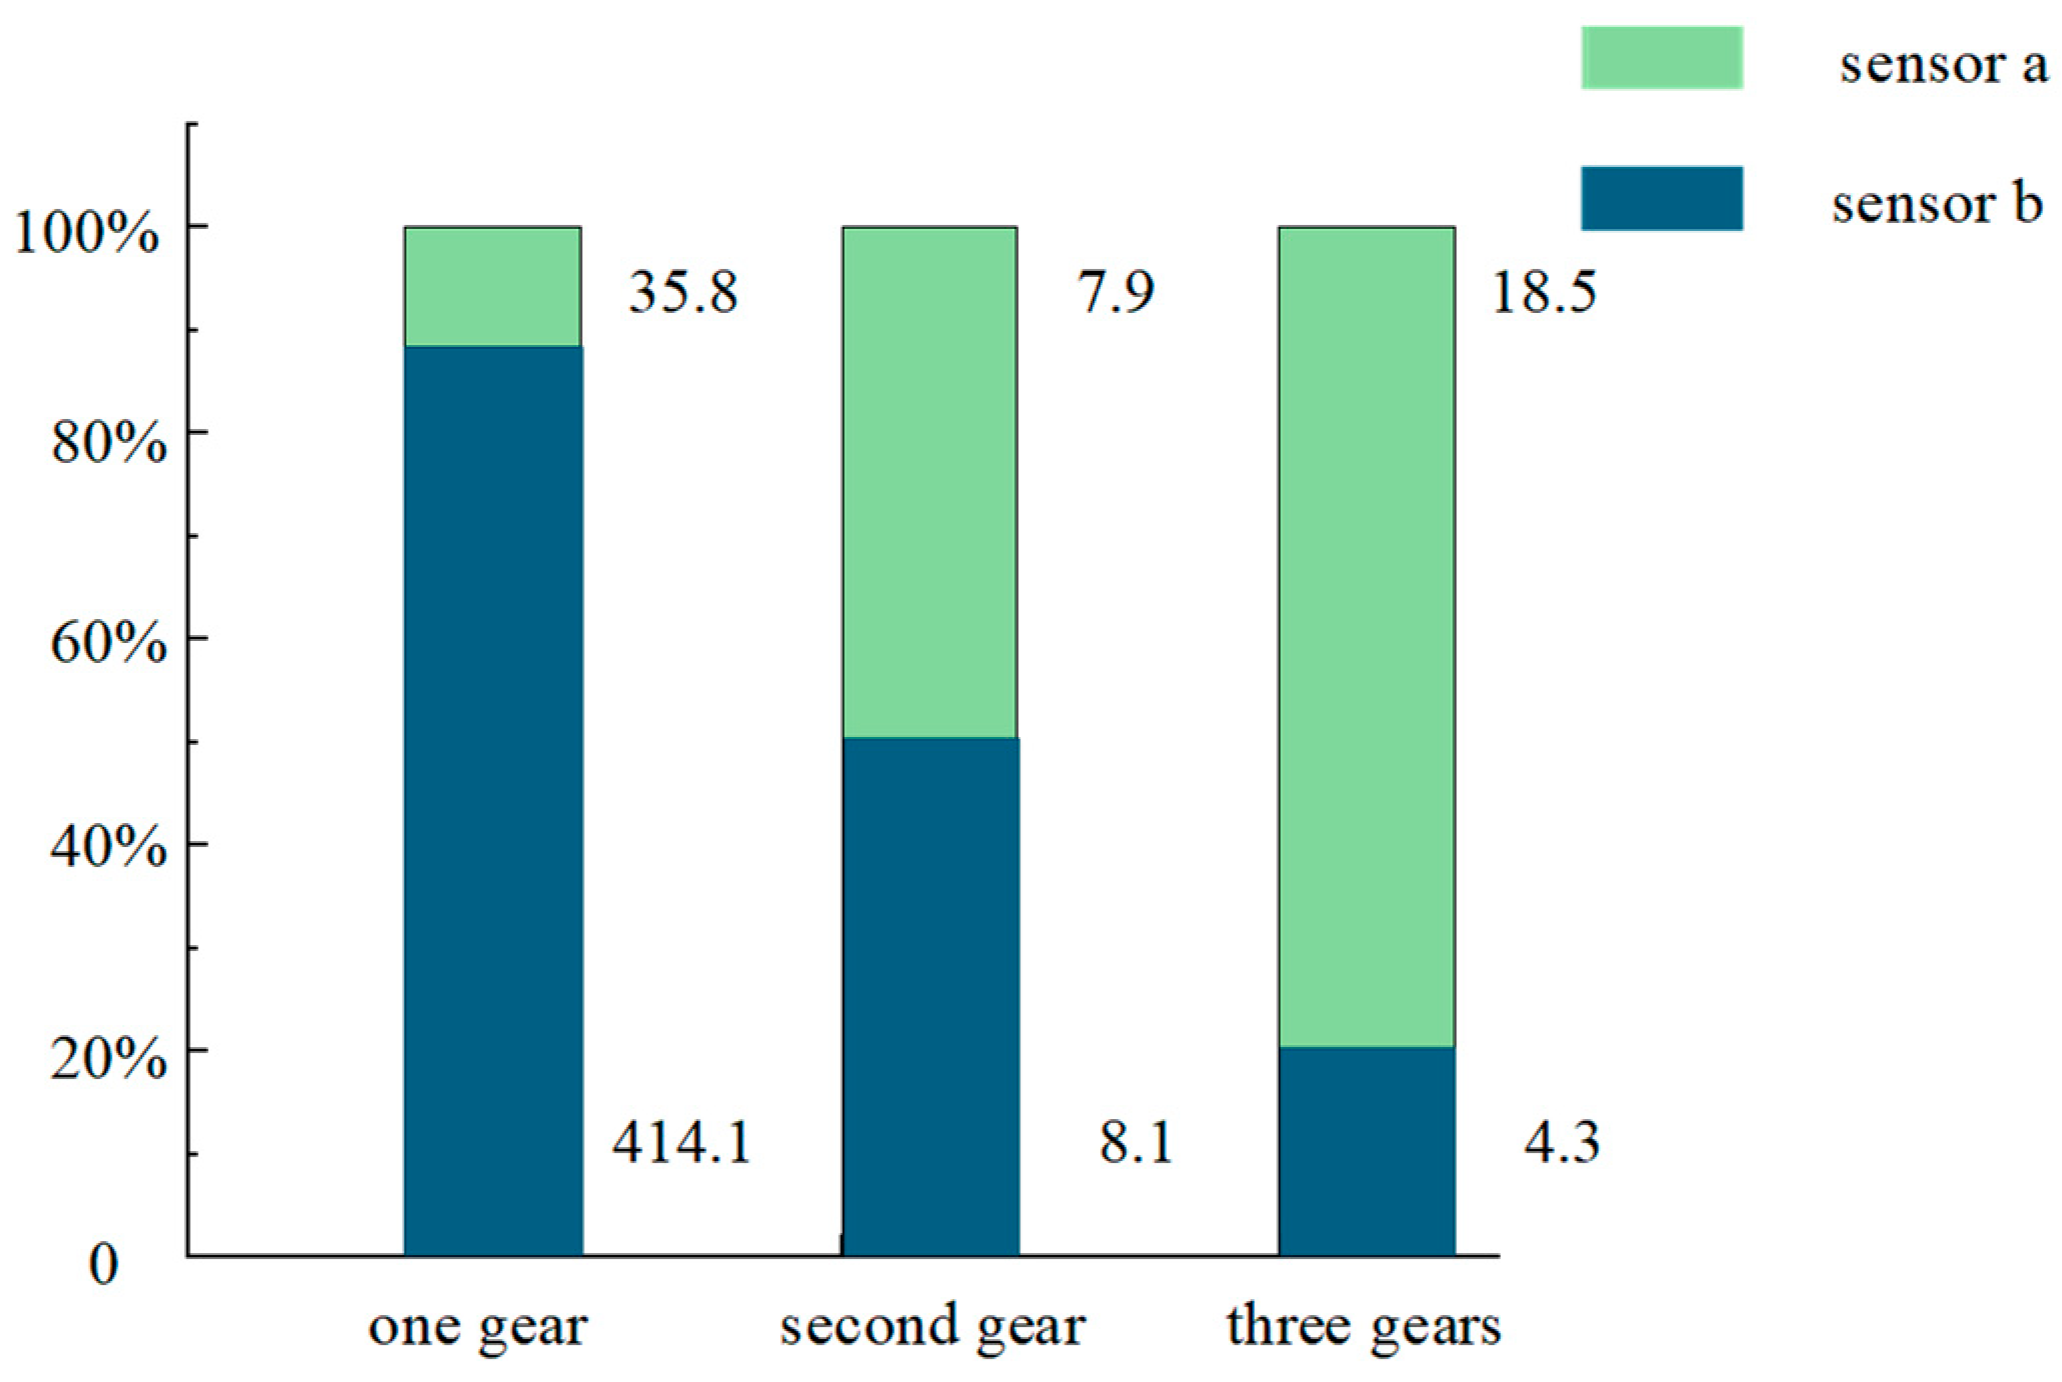
Figure 15 shows the average harmonic energy of the support wheel. From the figure, it can be seen that the energy difference between the characteristic signals of the support wheel collected by sensor a and sensor b is the largest at first gear, the left and right sides are basically the same at second gear, and the energy collected by sensor a is greater than that collected by sensor b at third gear. Comparing Figure 15 with Figure 13, it can be seen that the parameter ratios at each gear position in Figure 15 match the experimental measurement results in Figure 13 with an accuracy of up to 96.7%. Therefore, the offset of the rotary kiln’s centerline can be determined by comparing the harmonic energy of the characteristic signals of the support roll at the same gear position.

5. Conclusions

This paper proposes the ISBOA-VMD method, which combines the improved secretary bird optimization algorithm with VMD. It introduces random inertial weights and the whale algorithm to implement strategies for consuming and surrounding prey, effectively solving the problems of low convergence efficiency and getting stuck in local optima in the secretary bird algorithm.
To address the issue that the selection of modal numbers and quadratic penalty terms for VMD heavily relies on exhaustive search methods, the ISBOA was proposed and validated through simulation tests. The results demonstrated that ISBOA exhibited superior stability and convergence accuracy in the experiments. In experimental signal testing, the results showed that the improved algorithm achieved better convergence accuracy and stability, with a 75% improvement over previous methods, effectively enabling parameter selection for VMD and feature vector extraction for cement rotary kiln signals.
The VMD method, optimized with parameters, was used to decompose the rotary kiln signals and extract signals that reflect centerline deviation and thermal bending faults. Through energy mean comparison, it was found that the accuracy of the results was as high as 96.7% compared with the experimental results, indicating that the feature signals extracted by the VMD after parameter optimization can reflect the operating status of the rotary kiln, providing a strategic method for rotary kiln fault diagnosis.
Author Contributions

Conceptualization, J.P. and C.H.; methodology, J.P.; software, C.H.; validation, B.Q., X.K. and C.H.; formal analysis, B.Q.; investigation, X.K.; resources, B.Q.; data curation, J.P.; writing—original draft preparation, C.H.; writing—review and editing, J.P.; visualization, B.Q.; supervision, X.K.; project administration, B.Q.; funding acquisition, B.Q. All authors have read and agreed to the published version of the manuscript.

Funding

This research was funded by [Henan University of Science and Technology] (Grant No. 13450021) and [Luoyang Mining Machinery Engineering Design and Research Institute] (Grant No. 22010415), with page charges covered by [Henan University of Science and Technology].

Data Availability Statement

The data that support the findings of this study are available upon request from the corresponding author [J.P.].

Conflicts of Interest

Author Bin Qiao is employed by Luoyang Mining Machinery Engineering Design & Research Institute Co., Ltd. The remaining authors declare that this research was completed without any commercial or financial relationships that could constitute a potential conflict of interest.

References

  1. Qu, C.; Li, H.; Huang, X.; Zhang, H.; Zhang, S. Research progress of refractories for cement rotary kilns. Refractories 2025, 59, 87–92. [Google Scholar]
  2. Bisulandu, B.-J.R.M.; Huchet, F. Rotary kiln process: An overview of physical mechanisms, models and applications. Appl. Therm. Eng. 2023, 221, 119637. [Google Scholar] [CrossRef]
  3. Guan, J.; Tian, Y.; Liu, Y.; Li, F.; Ye, J.; Xu, C.; Lu, C.; Wang, W. Multi-physical field coupling simulation study in cement rotary kiln. Chin. J. Process Eng. 2025, 25, 445–458. [Google Scholar]
  4. Huang, Z.; Luo, X.; Zheng, P. Structure Analysis for Rotary Kilns. CFHI Technol. 2021, 5, 30–35+19. [Google Scholar]
  5. Xu, Y.; Cai, Z.; Ding, K. An enhanced bearing fault diagnosis method based on TVF-EMD and a high-order energy operator. Meas. Sci. Technol. 2018, 29, 095108. [Google Scholar] [CrossRef]
  6. Peng, F.; Zhang, J. The broken wires identification of wire rope based on multilevel filtering method using EEMD and wavelet analysis. J. Fail. Anal. Prev. 2021, 21, 280–289. [Google Scholar] [CrossRef]
  7. Wang, X.; Zhou, F.; He, Y.; Wu, Y. Weak fault diagnosis of rolling bearing under variable speed condition using IEWT-based enhanced envelope order spectrum. Meas. Sci. Technol. 2019, 30, 035003. [Google Scholar] [CrossRef]
  8. Chegini, S.N.; Bagheri, A.; Najafi, F. Application of a new EWT-based denoising technique in bearing fault diagnosis. Measurement 2019, 144, 275–297. [Google Scholar] [CrossRef]
  9. Keyhani, A.; Mohammadi, S. Structural Modal Parameter Identification Using Local Mean Decomposition. Meas. Sci. Technol. 2018, 29, 025003. [Google Scholar] [CrossRef]
  10. Meng, D.; Wang, H.; Yang, S.; Lv, Z.; Hu, Z.; Wang, Z. Fault analysis of wind power rolling bearing based on EMD feature extraction. CMES-Comput. Model. Eng. Sci. 2021, 130, 543–558. [Google Scholar] [CrossRef]
  11. Shah, A.K.; Yadav, A.; Malik, H. EMD and ANN based intelligent model for bearing fault diagnosis. J. Intell. Fuzzy Syst. 2018, 35, 5391–5402. [Google Scholar] [CrossRef]
  12. Shifat, T.A.; Hur, J.-W. EEMD assisted supervised learning for the fault diagnosis of BLDC motor using vibration signal. J. Mech. Sci. Technol. 2020, 34, 3981–3990. [Google Scholar] [CrossRef]
  13. Li, B.; Liu, M.; Guo, Z.; Ji, Y. Mechanical fault diagnosis of high voltage circuit breakers utilizing EWT-improved time frequency entropy and optimal GRNN classifier. Entropy 2018, 20, 448. [Google Scholar] [CrossRef] [PubMed]
  14. Yan, R.; Shang, Z.; Xu, H.; Wen, J.; Zhao, Z.; Chen, X.; Gao, R.X. Wavelet transform for rotary machine fault diagnosis: 10 years revisited. Mech. Syst. Signal Process 2023, 200, 110545. [Google Scholar] [CrossRef]
  15. Han, M.; Wu, Y.; Wang, Y.; Liu, W. Roller bearing fault diagnosis based on LMD and multi-scale symbolic dynamic information entropy. J. Mech. Sci. Technol. 2021, 35, 1993–2005. [Google Scholar] [CrossRef]
  16. Jin, Z.; He, D.; Wei, Z. Intelligent fault diagnosis of train axle box bearing based on parameter optimization VMD and improved DBN. Eng. Appl. Artif. Intell. 2022, 110, 104713. [Google Scholar] [CrossRef]
  17. Mansi; Saini, K.; Vanraj; Dhami, S.S. MODWT and VMD based intelligent gearbox early stage fault detection approach. J. Fail. Anal. Prev. 2021, 21, 1821–1837. [Google Scholar] [CrossRef]
  18. Liu, C.; Tan, J. An enhanced variational mode decomposition based on correntropy and a periodicity-assisted log-cycligram for bearing fault diagnosis. Meas. Sci. Technol. 2022, 33, 065108. [Google Scholar] [CrossRef]
  19. HE, Y.; Li, X.; He, J. Method of signal denoising based on parameter-optimized VMD. Mod. Electron. Tech. 2025, 48, 70–76. [Google Scholar] [CrossRef]
  20. Santos-Ruiz, I.; López-Estrada, F.R.; Puig, V.; Pérez-Pérez, E.; Mina-Antonio, J.; Valencia-Palomo, G. Diagnosis of fluid leaks in pipelines using dynamic PCA. IFAC Pap. 2018, 51, 373–380. [Google Scholar] [CrossRef]
  21. Dorigo, M.; Birattari, M.; Stutzle, T. Ant colony optimization. IEEE Comput. Intell. Mag. 2007, 1, 28–39. [Google Scholar] [CrossRef]
  22. Mirjalili, S.; Lewis, A. The whale optimization algorithm. Adv. Eng. Softw. 2016, 95, 51–67. [Google Scholar] [CrossRef]
  23. Beyer, H.-G.; Schwefel, H.-P. Evolution strategies—A comprehensive introduction. Nat. Comput. 2002, 1, 3–52. [Google Scholar] [CrossRef]
  24. Holland, J.H. Genetic algorithms. Sci. Am. 1992, 267, 66–73. [Google Scholar] [CrossRef]
  25. Satapathy, S.; Naik, A. Social group optimization (SGO): A new population evolutionary optimization technique. Complex Intell. Syst. 2016, 2, 173–203. [Google Scholar] [CrossRef]
  26. Li, M.; Zhao, H.; Weng, X.; Han, T. Cognitive behavior optimization algorithm for solving optimization problems. Appl. Soft Comput. 2016, 39, 199–222. [Google Scholar] [CrossRef]
  27. Zhao, W.; Wang, L.; Zhang, Z. Atom search optimization and its application to solve a hydrogeologic parameter estimation problem. Knowl. -Based Syst. 2019, 163, 283–304. [Google Scholar] [CrossRef]
  28. Mirjalili, S.; Mirjalili, S.M.; Hatamlou, A. Multi-verse optimizer: A nature-inspired algorithm for global optimization. Neural Comput. Appl. 2016, 27, 495–513. [Google Scholar] [CrossRef]
  29. Zhang, Z.; Li, K.; Guo, H.; Liang, X. Combined prediction model of joint opening-closing deformation of immersed tube tunnel based on SSA optimized VMD, SVR and GRU. Ocean Eng. 2024, 305, 117933. [Google Scholar] [CrossRef]
  30. Wan, L.; Chen, Z.; Zhang, X.; Wen, D.; Ran, X. A multi-sensor monitoring methodology for grinding wheel wear evaluation based on INFO-SVM. Mech. Syst. Signal Process 2024, 208, 111003. [Google Scholar] [CrossRef]
  31. Malghan, P.G.; Hota, M.K. Grasshopper optimization algorithm based improved variational mode decomposition technique for muscle artifact removal in ECG using dynamic time warping. Biomed. Signal Process Control 2022, 73, 103437. [Google Scholar] [CrossRef]
  32. Fu, Y.; Liu, D.; Chen, J.; He, L. Secretary bird optimization algorithm: A new metaheuristic for solving global optimization problems. Artif. Intell. Rev. 2024, 57, 123. [Google Scholar] [CrossRef]
  33. Wang, F.; Liu, C.; Zhang, T.; Dun, B.; Han, Q.; Li, H. Fault Diagnosis of Rolling Bearing Based on k-Optimized VMD. J. Vib. Meas. Diagn. 2018, 38, 540–547. [Google Scholar]
Figure 1. Rotary kiln centerline deviation fault: (a) Front view; (b) Left view.
Applsci 15 10806 g001
Figure 2. ISBOA Flowchart.
Applsci 15 10806 g002
Figure 3. Simulated signal input.
Applsci 15 10806 g003
Figure 4. Different algorithms optimize VMD convergence curves.
Applsci 15 10806 g004
Figure 5. Relationship between centerline deviation and harmonic amplitude of cylinder and roller.
Applsci 15 10806 g005
Figure 6. Different K-value decomposition results: (a) K = 4 decomposition result; (b) K = 5 decomposition result; (c) K = 6 decomposition result; (d) K = 7 decomposition result.
Applsci 15 10806 g006
Figure 7. Workbench setup: (a) Rotary kiln displacement sensor a; (b) Rotary kiln displacement sensor b; (c) Displacement sensor installation; (d) Signal acquisition.
Applsci 15 10806 g007
Figure 8. Signal acquisition diagram.
Applsci 15 10806 g008
Figure 9. Decomposition results for different α values: (a) Decomposition results for α = 7964; (b) Decomposition results for α = 8964; (c) Decomposition results for α = 9964; (d) Decomposition results for α = 10,964.
Applsci 15 10806 g009
Figure 10. Second gear sensor 1 vibration signal ISBOA-VMD: (a) Time domain diagram; (b) Frequency domain diagram.
Applsci 15 10806 g010
Figure 11. Original signal and decomposed IMF components.
Applsci 15 10806 g011
Figure 12. Results of Variation in Energy Difference Parameter ξ .
Applsci 15 10806 g012
Figure 13. Local peak deformation of the support wheel.
Applsci 15 10806 g013
Figure 14. Energy diagram of characteristic signals of rotary kilns.
Applsci 15 10806 g014
Figure 15. Relationship between the energy ratios of the characteristic signals of the support wheels.
Applsci 15 10806 g015
Table 1. Parameter Comparison Results.
Wavelet AnalysisEMDVMD
Signal-to-noise ratio7.93678.270117.5496
Quality of Reconstruction Factor7.16818.954423.9659
Correlation coefficient0.68260.71800.9912
Table 2. Eccentricity measurement of rotary kiln (mm).
IMF1IMF2IMF3IMF4IMF5IMF6IMF7IMF8IMF9IMF10
0.9010.1530.4800.1510.0870.0610.1390.1150.1360.133
Table 3. Average energy of characteristic signals ×10−3 mm2.
Operating ConditionsRotary Kiln Sensor aRotary Kiln Sensor bSupport Wheel Sensor aSupport Wheel Sensor b
First gear operating conditions5.18.935.8414.1
Second gear operating conditions1410.67.98.1
Third gear operating conditions2.62.318.54.3
Table 4. Rotary kiln eccentricity measurement (mm).
First Gear Operating ConditionsSecond Gear Operating ConditionsThird Gear Operating Conditions
1.241.850.84
Disclaimer/Publisher’s Note: The statements, opinions and data contained in all publications are solely those of the individual author(s) and contributor(s) and not of MDPI and/or the editor(s). MDPI and/or the editor(s) disclaim responsibility for any injury to people or property resulting from any ideas, methods, instructions or products referred to in the content.