1. Introduction
The swift progression of contemporary power grids necessitates enhanced intelligent operation and repair of transmission equipment. Insulators, as the core components of transmission lines, provide mechanical support and electrical insulation, with their operational integrity directly impacting grid stability [
1,
2]. However, due to prolonged exposure to intricate natural surroundings, insulators are particularly vulnerable to a spectrum of faults (including aging, defects, and dirt, etc.) induced by the synergistic effects of wind, ultraviolet radiation, extreme temperature variations, and persistent mechanical stress [
3,
4]. The rapid evolution of UAV aerial photography has replaced manual inspections as the primary detection method, which has made UAV-based insulator anomaly detection a critical research focus [
5].
Current insulator detection methods are categorized into two main types: typical image processing methods and deep learning techniques. Typical approaches generally utilize spatial morphology, texture, and chromatic attributes [
6]. For instance, Liao et al. [
7] proposed a local feature and spatial ordering-based detector, utilizing multi-scale descriptors to represent features and training spatial order features for enhanced robustness. He et al. [
8] designed a non-contact faulty insulator detection method using infrared image matching, combining improved SIFT (scale-invariant feature transformation) and RANSAC (random sampling consistency) for efficient outdoor ceramic insulator string inspection. Wei [
9] devised a hybrid insulator defect identification model utilizing stochastic Hough transform, wherein Canny-derived edge curves are subjected to elliptical fitting, and defects are discerned by contrasting fitted contours with actual contours. While these traditional methods improve detection efficiency, their reliance on manual feature engineering restricts applicability to specific scenarios, limiting generalization in complex real-world conditions.
Advancements in deep learning theory and object detection algorithms have established deep learning-based insulator anomaly detection as the preeminent research focus. These methodologies are classified into two types based on the detection stage, one being the two-stage detection algorithm, exemplified by R-CNN [
10], Fast R-CNN [
11], Faster R-CNN [
12], etc., which have been extensively studied by many scholars. Chen et al. [
13] combined the EfficientNet backbone, depthwise separable convolutions, and transfer learning with lightweight Faster R-CNN, reducing parameters while maintaining accuracy for efficient defect identification. Zhou et al. [
14] augmented Mask R-CNN by incorporating attention mechanisms, rotation augmentation, and hyperparameter optimization via a genetic algorithm to boost small-target identification. Wang et al. [
15] designed multiscale local feature aggregation and global feature alignment modules to boost Faster R-CNN accuracy and mitigate sample scarcity/annotation challenges. Despite the above methods performing excellently in terms of detection accuracy, such methods face computational bottlenecks on UAV edge devices due to structural redundancy and slow inference, hindering real-time deployment.
Another category comprises one-stage detectors dominated by YOLO (You Only Look Once) [
16] and SSD (Single-Shot MultiBox Detector) [
17], valued for faster inference speeds. Akella et al. [
18] integrated deep convolutional generative adversarial networks (DCGAN) and super-resolution generative adversarial networks (SRGAN) with YOLOv3 to enhance low-resolution insulator imagery processing; Zeng et al. [
19] introduced a lightweight Ghost-SSD architecture that substitutes the VGG-16 framework with GhostNet, incorporating the scSE attention mechanism and DIoU-NMS to improve occlusion recognition while integrating pruning and distillation techniques to attain an equilibrium between elevated precision and efficiency. Zhang et al. [
20] augmented YOLOv7 with ECA attention and PConv, employing Normalized Wasserstein Distance to reduce small-target misdetections. Ji et al. [
21] suggested an enhanced YOLO11 technique that integrates detecting heads with adaptively spatial feature fusion to augment feature recognition capabilities. The original Neck was substituted with a Bidirectional Feature Pyramid Network (BiFPN), while ShuffleNetV2 was incorporated to markedly decrease the model’s computational expense. Souza et al. [
22] deployed an image-based power line inspection method with a Hybrid-YOLO improved model and ResNet-18 classifier mounted on a drone to quickly and efficiently identify and inspect faulty components in power systems in hard-to-reach areas. While one-stage detectors better satisfy real-time demands than two-stage approaches, they still face challenges in accuracy, model compression, vulnerability to redundant information, small-target sensitivity, rigid fusion weights, and sample imbalance.
To tackle these issues, we introduce LAI-YOLO, a lightweight insulator anomaly detection model derived from YOLO11, featuring the following primary contributions:
This paper introduces SqueezeGate-C3k2 (SG-C3k2), equipped with an adaptive gating mechanism, to alleviate the influence of ambient noise on feature extraction. The integration of a SqueezeGate (SG) layer facilitates the dynamic selection of essential feature channels, thus mitigating redundant input and enhancing the capacity of the model to identify small target attributes.
To resolve cross-scale information conflicts caused by fixed weights in conventional feature fusion, this paper presents the High-level Screening-Feature Weighted Fusion Pyramid Network (HS-WFPN). The trainable Weighted Select Feature Fusion (WSFF) module enables HS-WFPN to discern the contribution discrepancies of multi-scale features, optimize the fusion of deep semantic and low-level spatial data, and significantly mitigate the challenges associated with detecting small objects.
To better balance model performance and computational complexity, this paper restructures the detection head by replacing standard convolutions with depthwise separable convolutions and embedding an Efficient Channel Attention (ECA) mechanism. Additionally, Slide Weighted Focaler Loss (SWFocalerLoss) aims to alleviate the impact of class imbalance on accuracy and bolster the detection’s robustness.
This paper utilizes layer-adaptive sparsity for magnitude-based pruning (LAMP) to remove superfluous channels, thereby optimizing the model for the constrained hardware resources of edge devices like UAVs.
3. Proposed Method and Experimental Setup
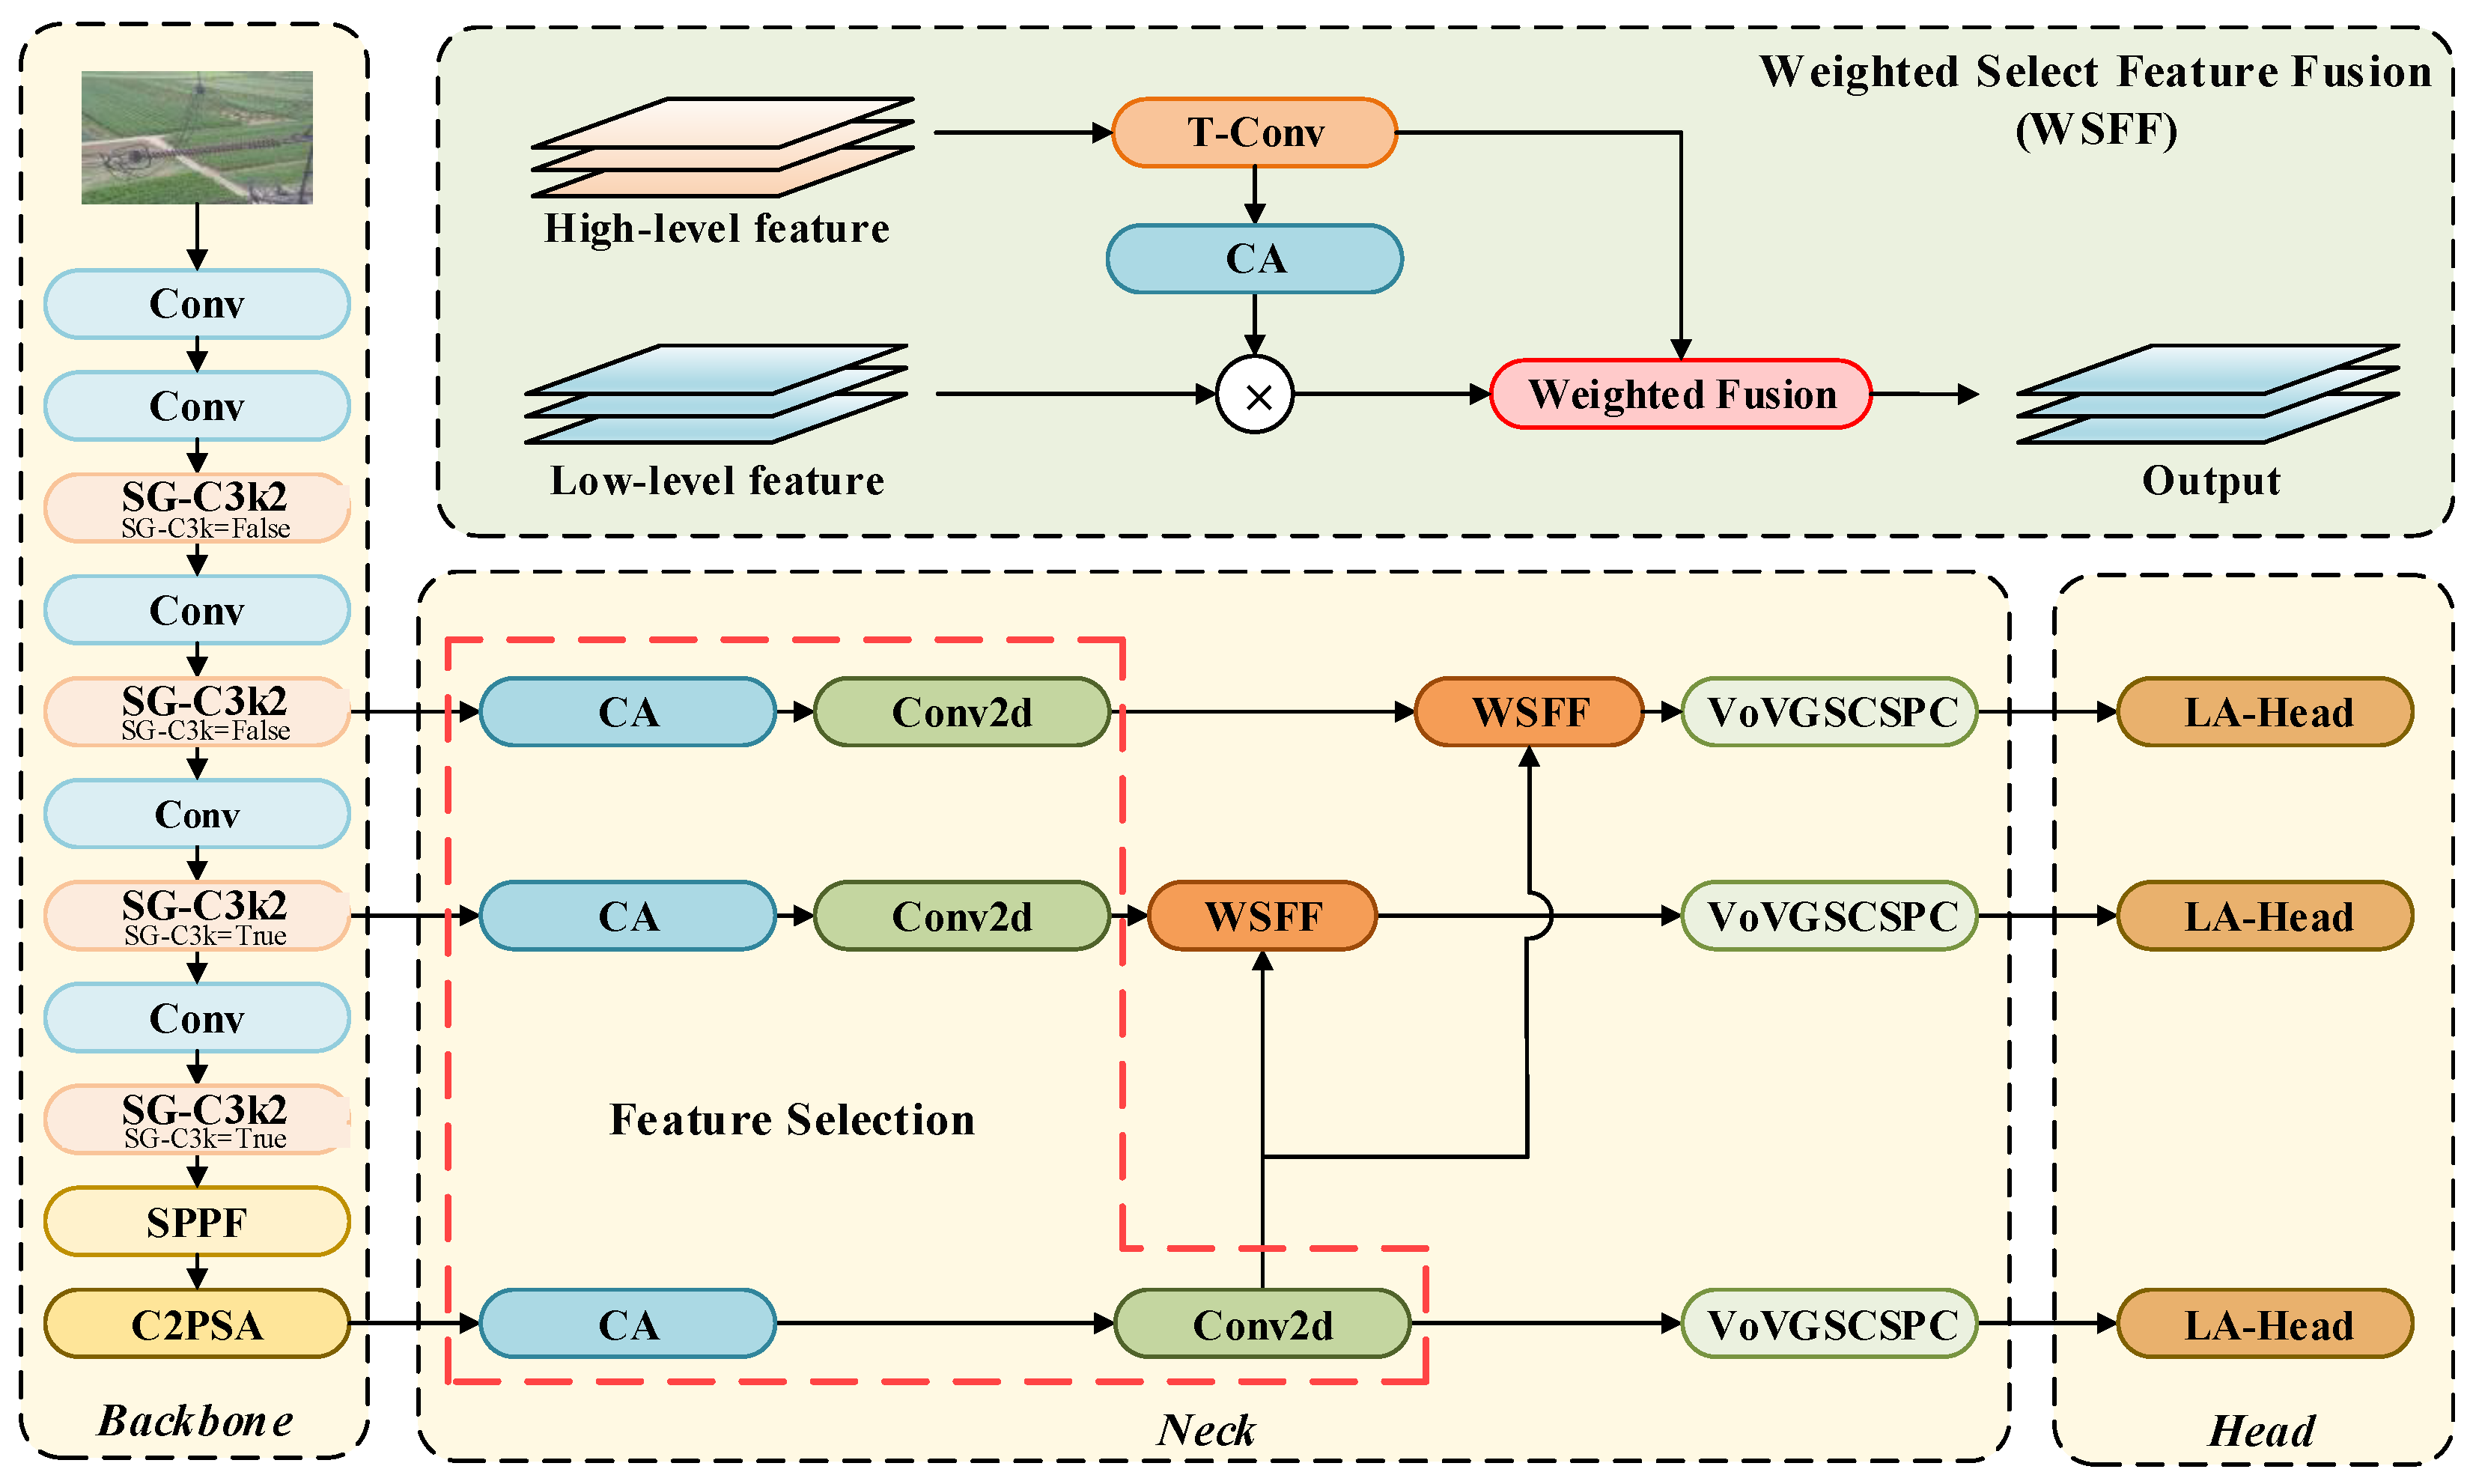
The LAI-YOLO architecture is indicated in
Figure 4. In comparison to the basic YOLO11n, this algorithm incorporates the SqueezeGate-C3k2 (SG-C3k2) module into the Backbone, hence augmenting the model’s capacity to discern feature details via an adaptive gating mechanism. The High-level Screening–Feature Weighted Feature Pyramid Network (HS-WFPN) within the Neck network employs selective weighted feature fusion to facilitate the appropriate integration of cross-scale features, hence circumventing the information conflict problems associated with conventional multiple-scale fusion. The Head is restructured into a more lightweight and efficient LA-Head and coupled with an improved Slide Weighted Focaler Loss (SWFocalerLoss) to achieve synergistic optimization of model performance and complexity while alleviating sample imbalance. Finally, we introduce layer-adaptive sparsity for the magnitude-based pruning (LAMP) [
25] method to eliminate superfluous channels in the model, greatly lowering the parameters and computational complexity. The following sections provide detailed explanations of the aforementioned SG-C3k2 module, HS-WFPN, improvements in the Head, LAMP channel pruning, and experiment-related setup.
3.1. SG-C3k2 Module
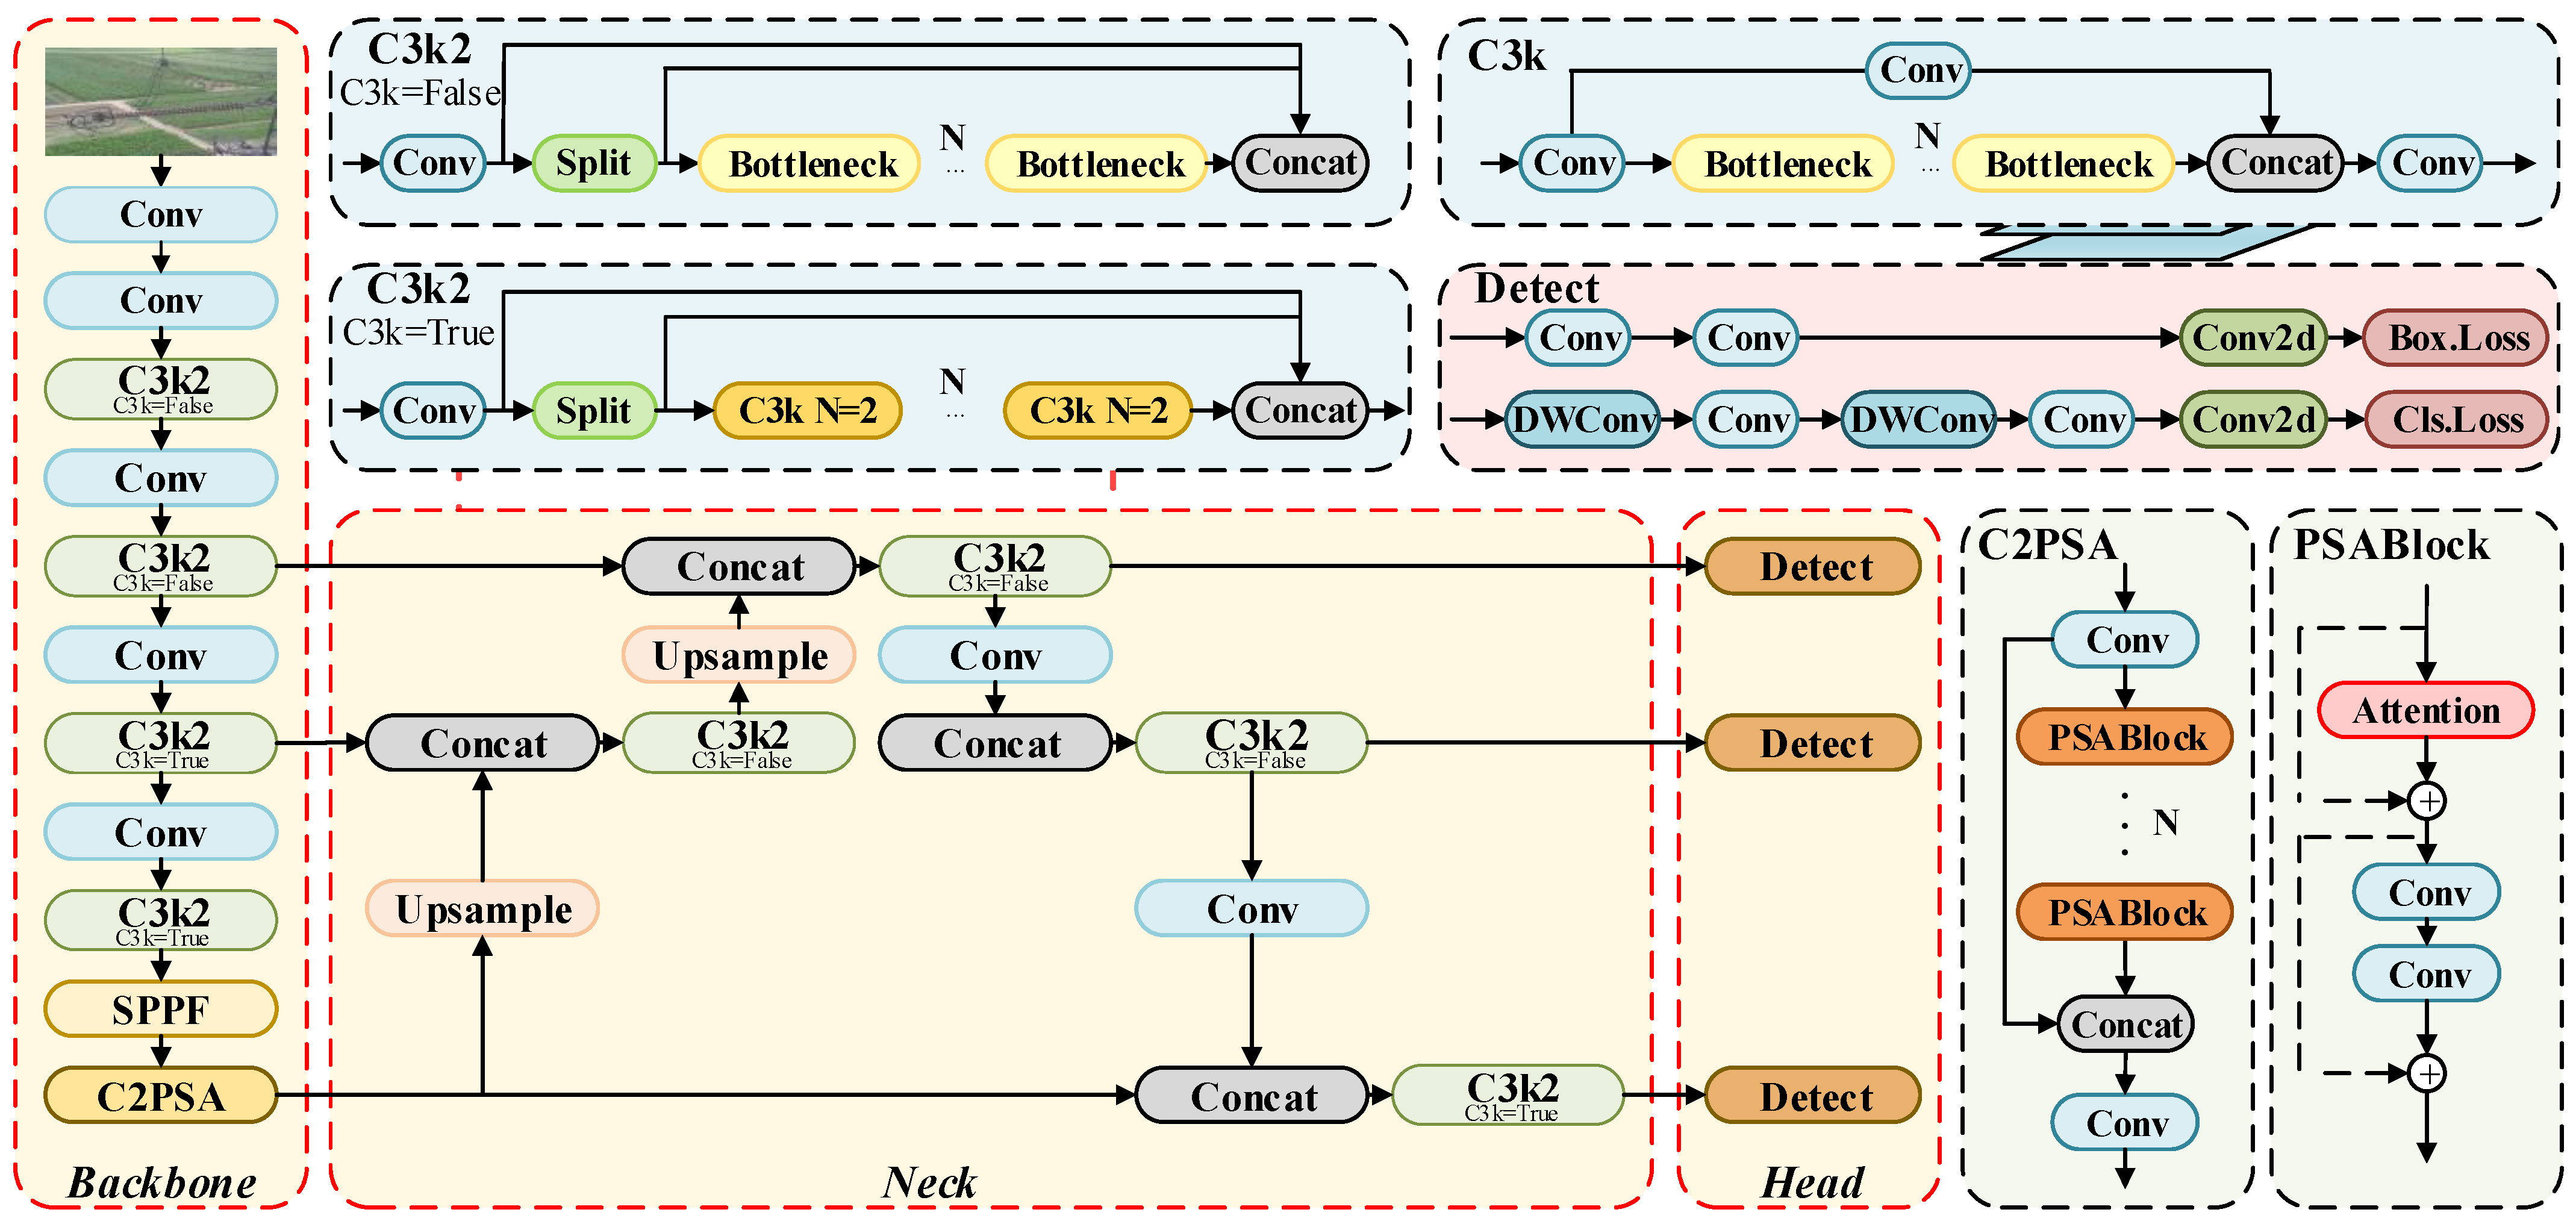
The adaptable and well-considered design of the C3k2 module in YOLOv11 strikes an optimal balance between computational efficiency and model accuracy. However, in complex and variable detection scenarios, such as insulator detection, the fixed channel interaction technique fails to adequately suppress redundant information, obstructing the model’s ability to acquire essential features. This study offers SG-C3k2, which incorporates an adaptive feature selection layer to boost the model’s capacity to distinguish target characteristics.
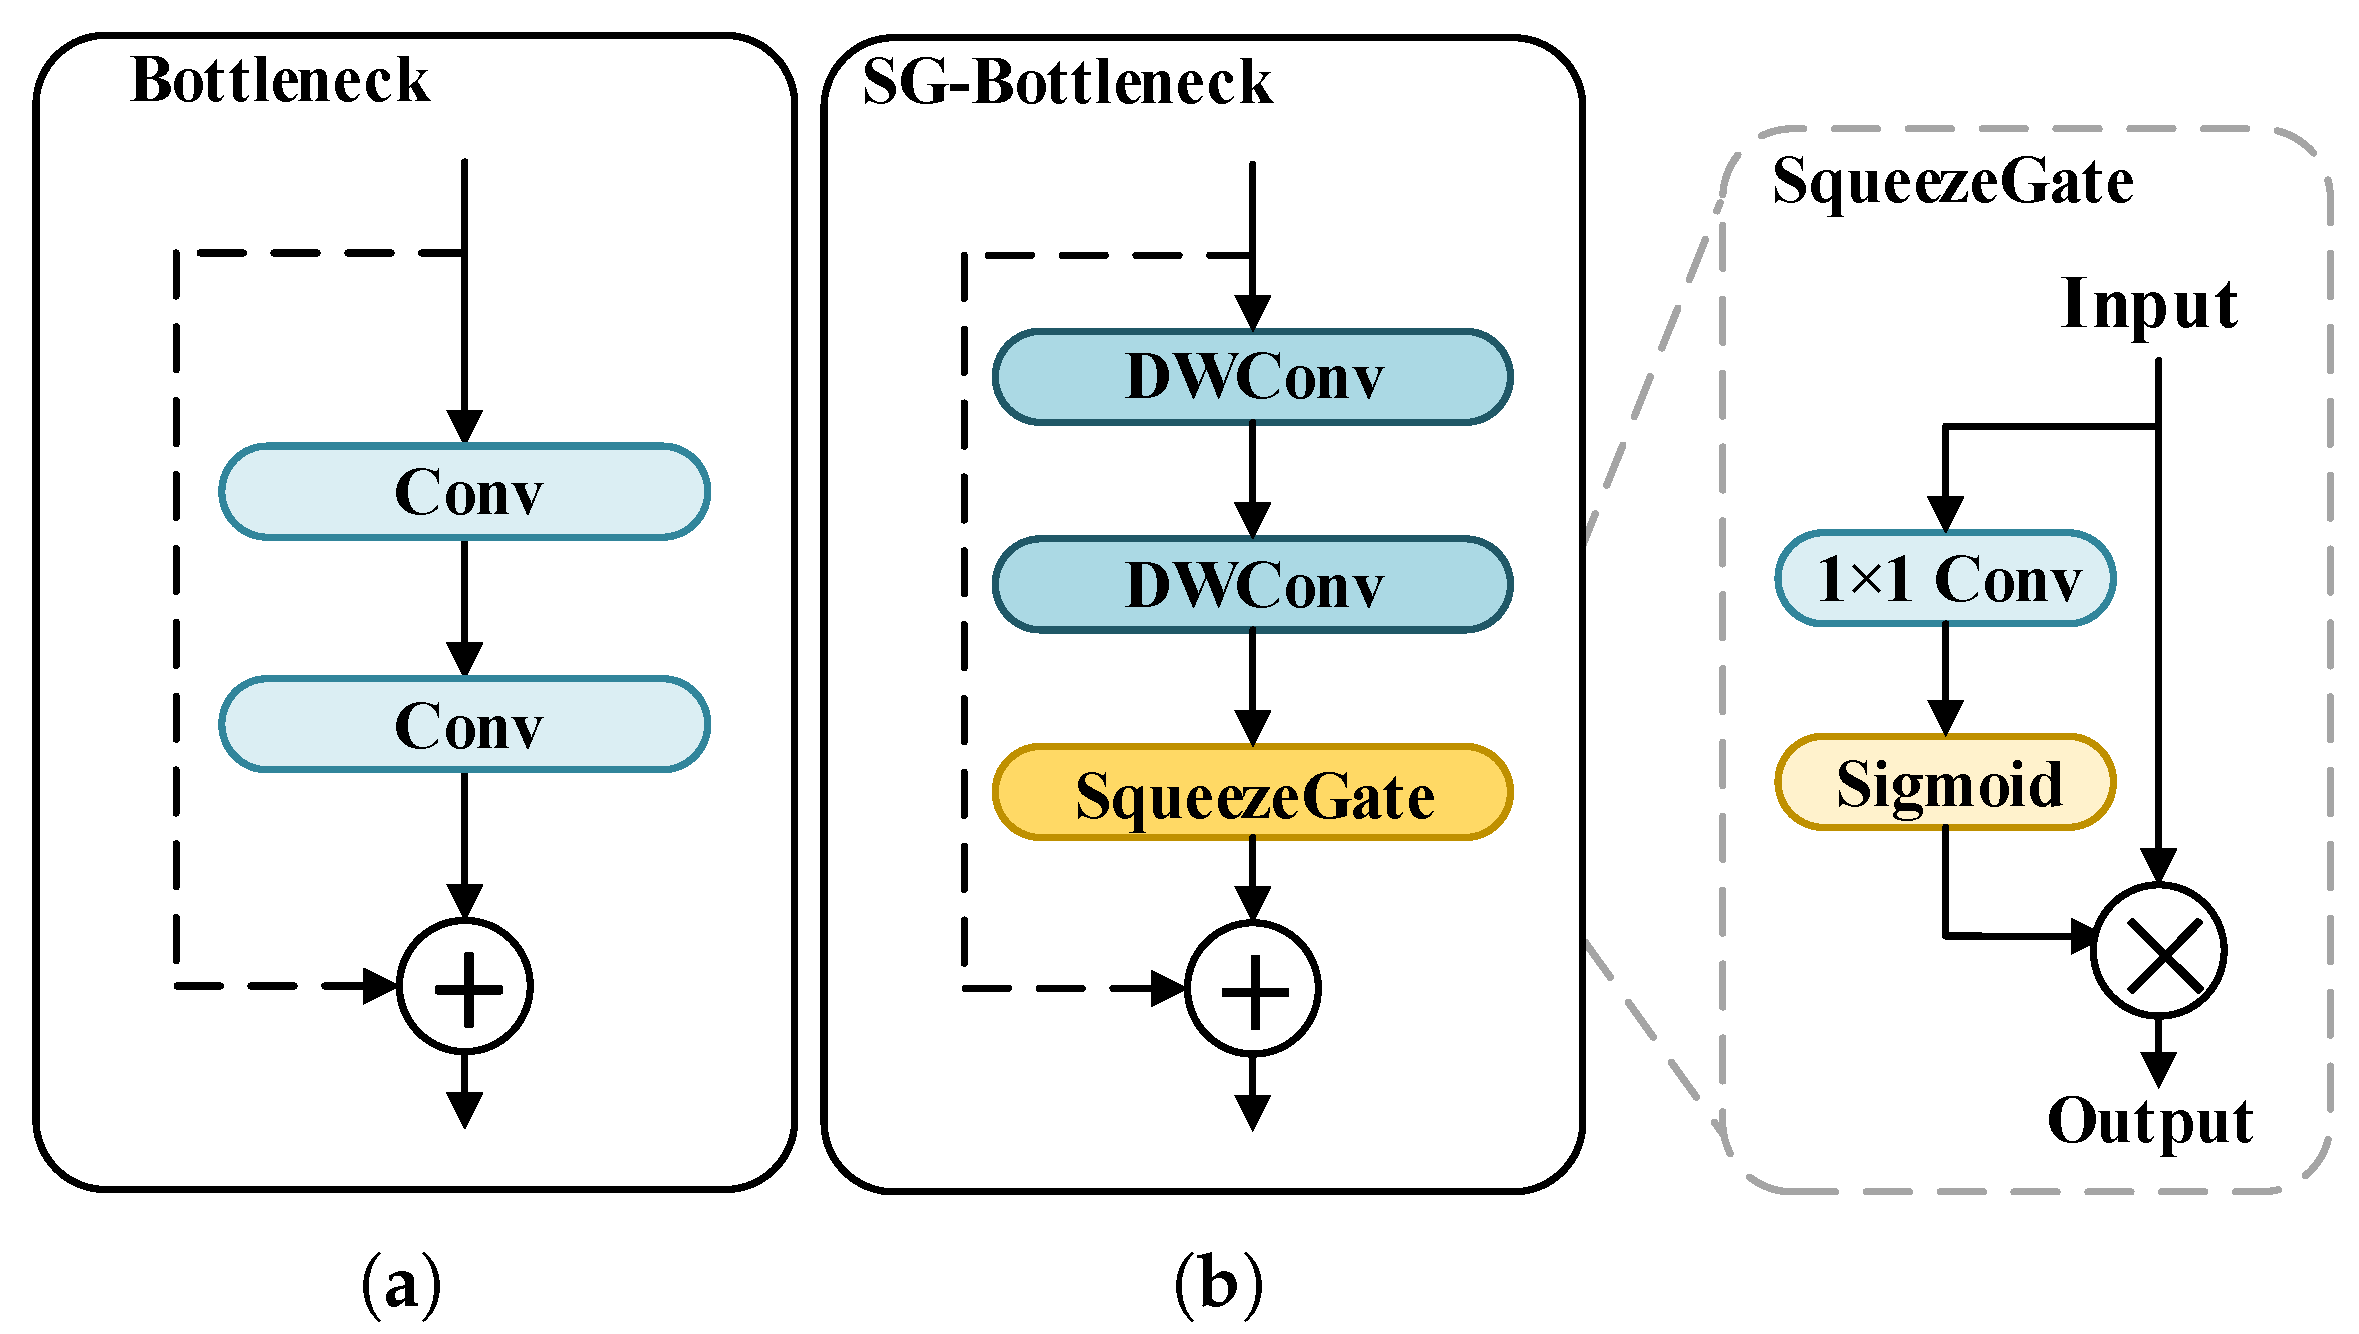
As depicted in
Figure 5, compared to the original Bottleneck, SG-C3k2 embeds a SqueezeGate (SG) layer within its SG-Bottleneck. This layer initially utilizes a 1 × 1 convolution to condense the input into a lower-dimensional representation. The representation is subsequently aggregated spatially into a channel-specific description. A sigmoid function subsequently maps this descriptor into channel-wise gating signals. The signal weights facilitate adaptive channel recalibration of the initial features, allowing the model to prioritize essential feature channels and diminish redundant information, thus enhancing feature extraction efficiency markedly. Functionally, the SqueezeGate mechanism is separate from attention modules like ECA or CA, as it performs channel-wise gating without spatial-aware encoding. To further optimize the SG-Bottleneck structure, we utilize depthwise convolution instead of standard convolution. Research [
26] indicates that depthwise convolution significantly reduces parameters and FLOPs, lowering model complexity. Its channel-independent mechanism focuses on capturing fine-grained spatial information per channel, enhancing feature learning efficiency and preserving detailed features.
3.2. High-Level Screening–Feature Weighted Feature Pyramid Network
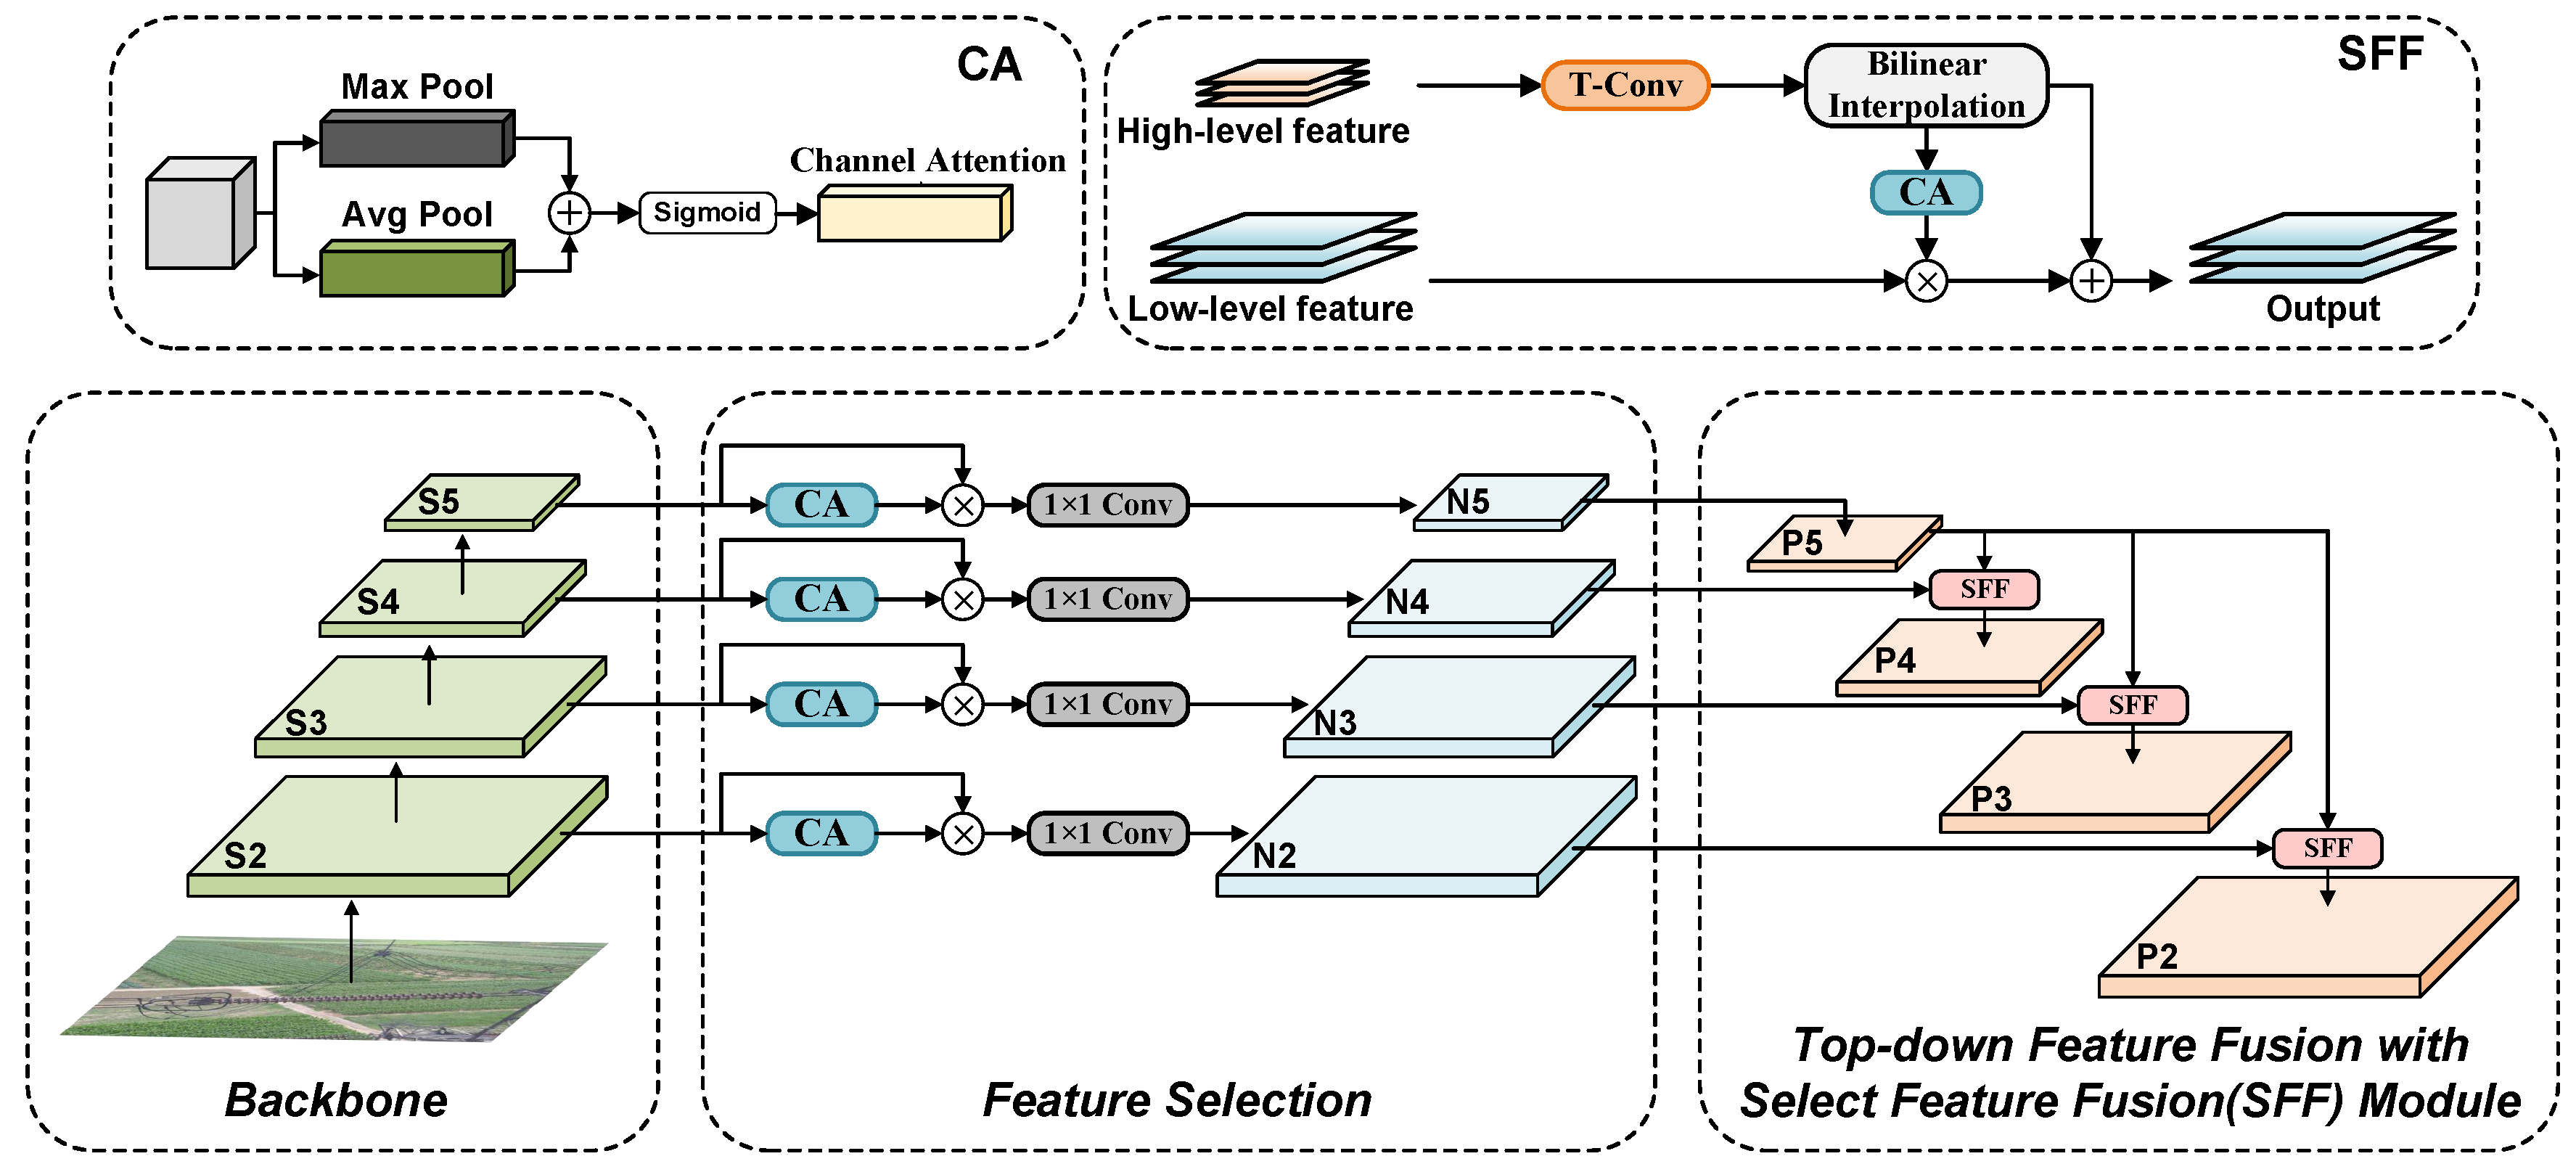
As shown in
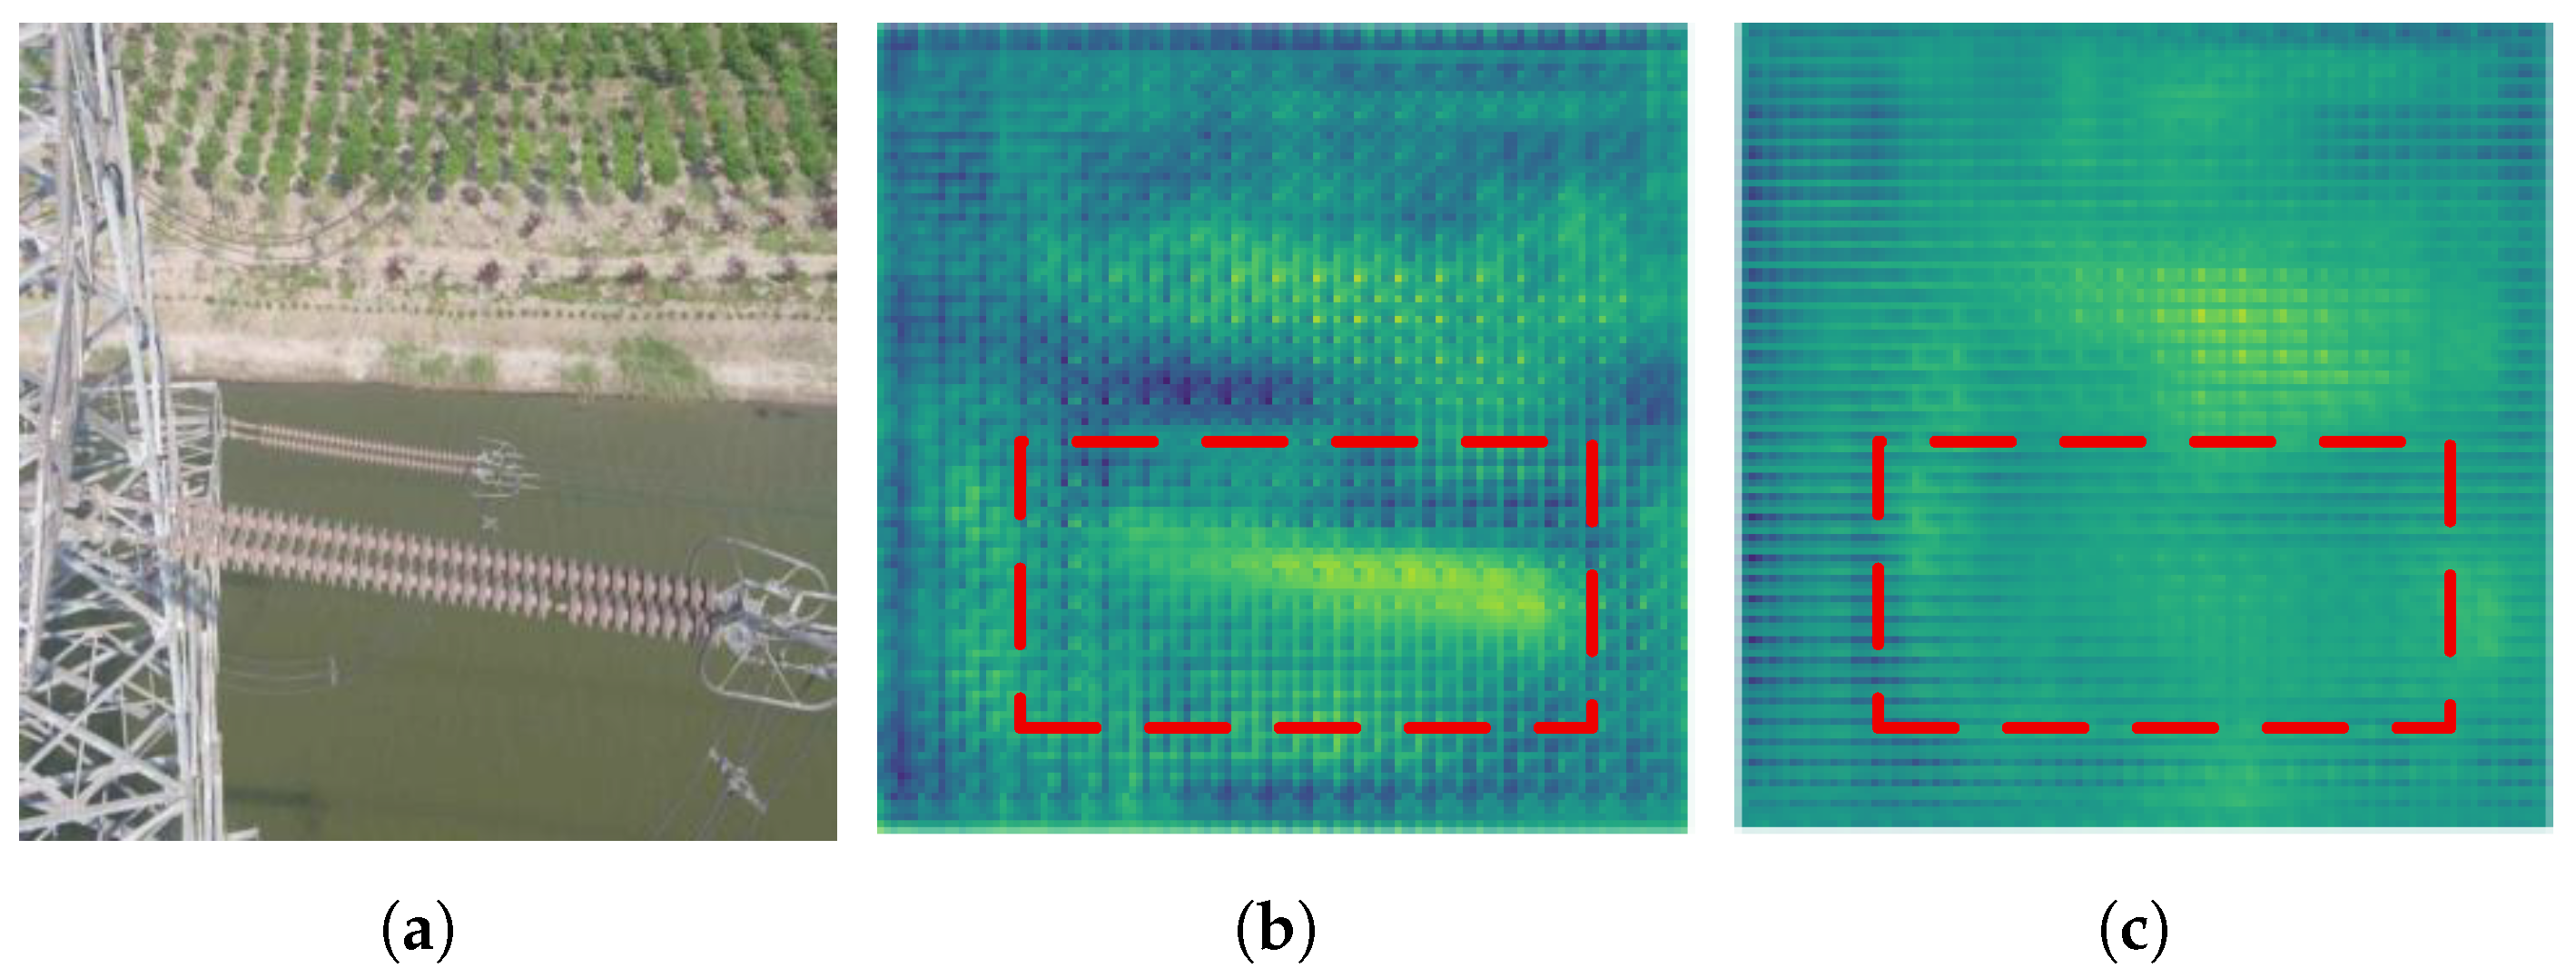
Figure 6a, small-sized abnormal targets often exist in transmission insulator images. In the initial phases of the Backbone, as seen in
Figure 6b, low-level features retain high-resolution spatial information, providing critical support for small target localization. With the augmentation of network depth, the feature maps experience numerous convolution processes. Advanced feature maps augment abstract semantic information while reducing essential location information. The comparison of feature maps in
Figure 6c,d exemplifies this trend.
Specifically, high-level feature maps encompass abundant semantic information yet exhibit low spatial resolution, whereas low-level feature maps preserve intricate local features but lack semantic coherence. The feature fusion module of HS-FPN combines cross-scale features using an attention-guided element-wise addition method; nevertheless, this direct addition operation neglects the differing significance of various features. The disparity in feature weight distribution results in conflicts among features of varying scales, hence impairing performance in small object detection. This study introduces a High-level Screening–Feature Weighted Fusion Pyramid Network (HS-WFPN) to overcome this issue. HS-WFPN builds on the advantages of the HS-FPN framework by introducing a Weighted Select Feature Fusion (WSFF) module. This design strengthens the transmission path of small object features while enabling adaptive weighting for cross-scale feature fusion, effectively alleviating information conflicts arising from multi-scale feature discrepancies.
WSFF has abandoned the original bilinear interpolation design and retained transposed convolution as the sole upsampling method. This change is because bilinear interpolation uses fixed weights to interpolate neighboring pixels, which is computationally efficient but struggles to adapt to the geometric diversity of power transmission insulators. This inflexibility results in blurred edges in the reconstructed features, as illustrated in the red dashed region of
Figure 7c. Furthermore, Coordinate Attention (CA) is employed to refine low-level features with high-level semantic guidance, which are then strategically merged with high-level features via weighted fusion. The particulars are as follows:
Suppose the set of input features is
, which includes both high-level and low-level features calibrated by the CA module. The CA mechanism operates in a channel-wise manner, enhancing or suppressing individual channels based on semantic relevance. Following this, the WSFF module assigns a scalar weight
to each entire feature map
, reflecting its relative importance at the scale level. The trainable weight parameters are denoted as
, with
initialized to 1.0 and optimized by backpropagation. The fusion process can be articulated as follows:
In Equation (
3),
represents the normalized weight coefficient, used to adjust the overall contribution of feature maps at different scales, and
.
is the smoothing factor employed to guarantee a non-zero denominator and maintain gradient stability.
is the Swish activation function, which mitigates weight polarization by refining the nonlinear characteristics. The specific formulation is
where
is the sigmoid function utilized for achieving smooth nonlinear mapping. The output features
are finally obtained by multiplying the corresponding channel weights and accumulating them as shown in Equation (
5).
The scalar nature of weight means it is shared across all channels of its corresponding feature map , thereby applying a uniform scale factor. The channel-wise discrimination is already handled by the preceding CA mechanism, while the WSFF module focuses on adaptively balancing the contributions of different feature scales. WSFF dynamically modifies the fusion process by acquiring the differential significance of features via trainable weights; hence, it successfully alleviates the feature conflicts inherent in conventional fixed-weight fusion.
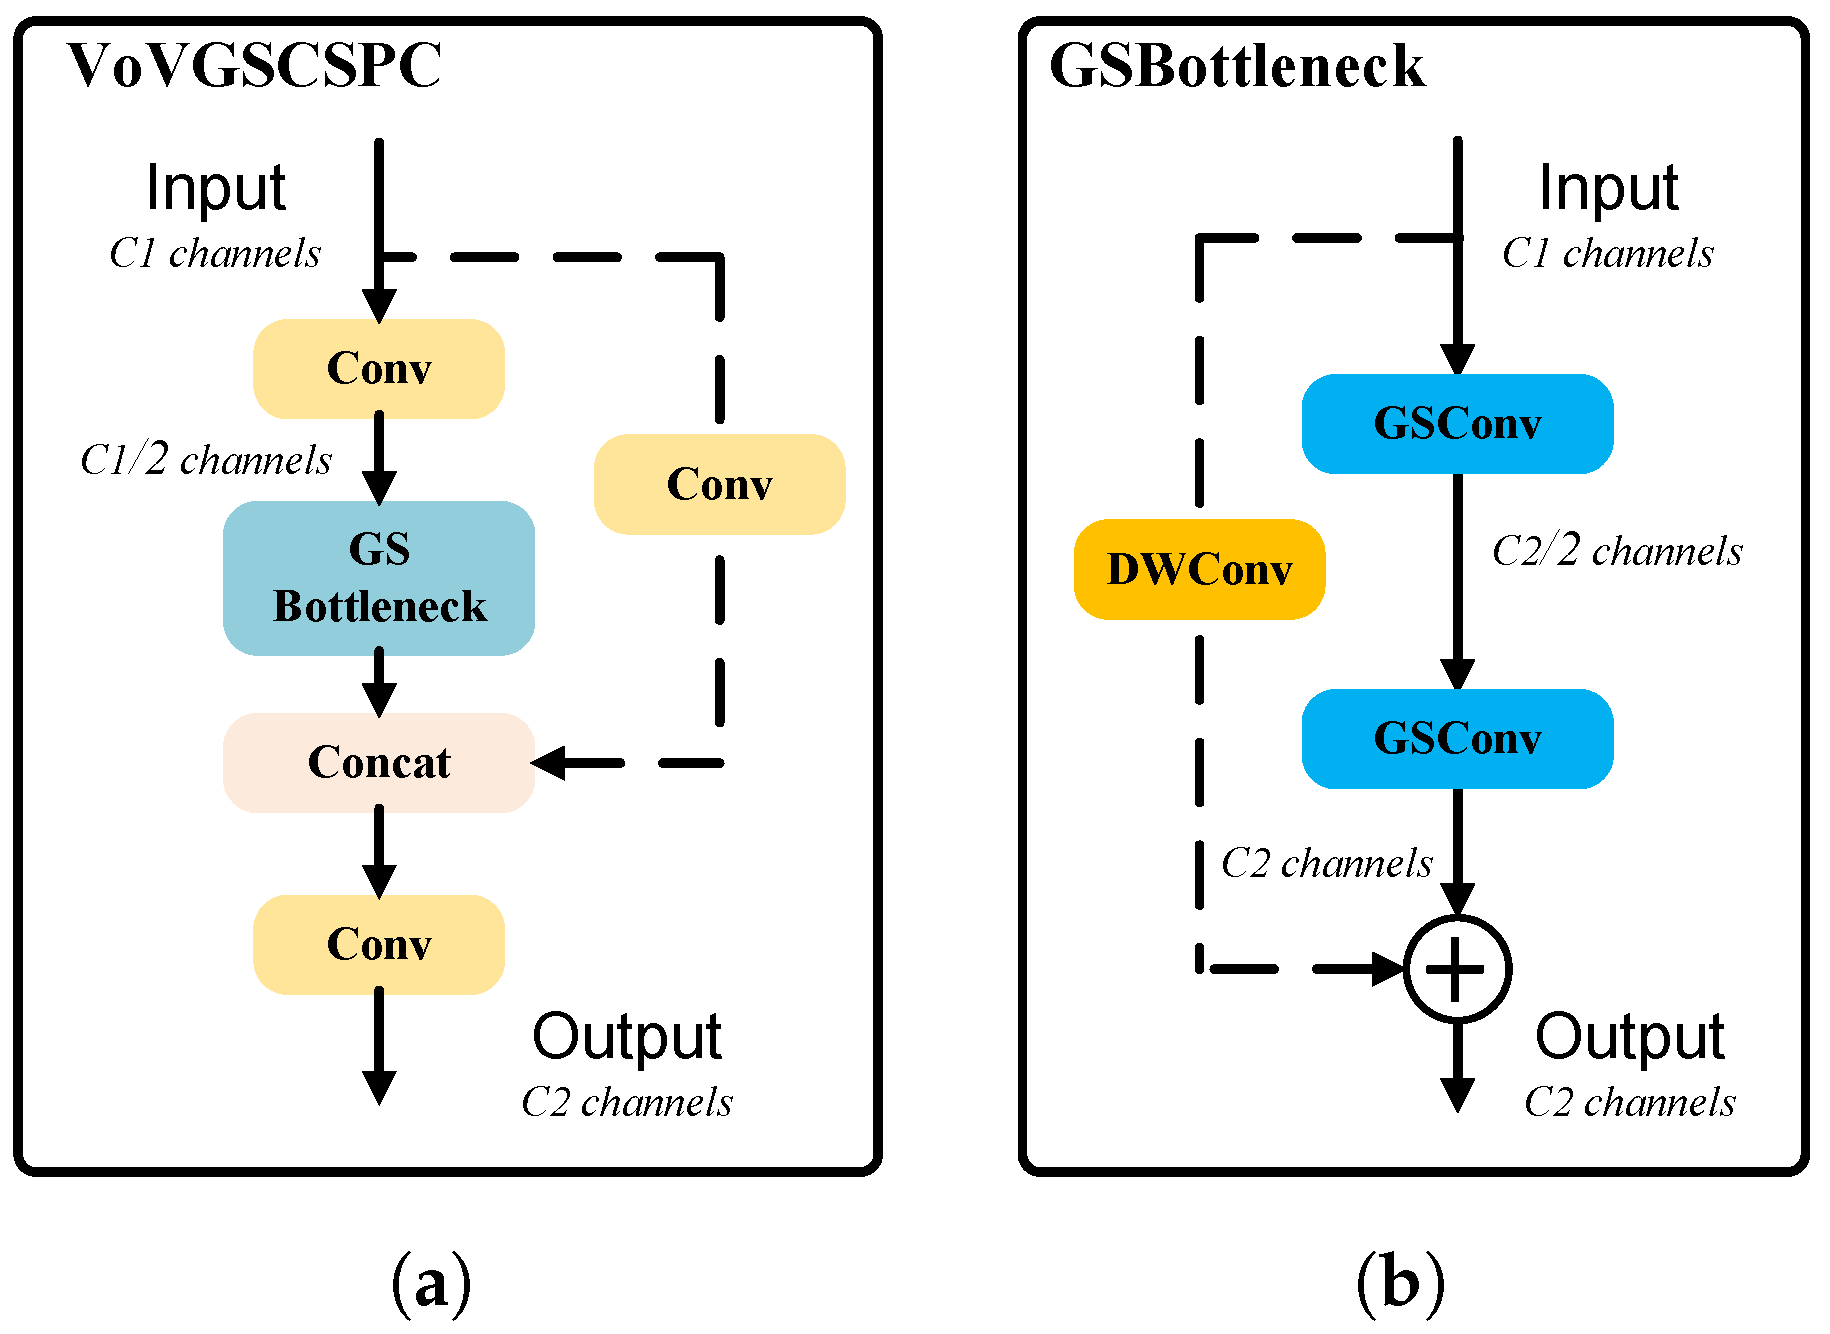
Additionally, to balance model performance and computational efficiency, a lightweight VoVGSCSPC [
24] module based on GSConv constitutes the output stage of the HS-WFPN network, as shown in
Figure 8. By integrating GSConv into the GSBottleneck, the module enhances nonlinear representation capacity and feature information reuse. Depthwise convolution is applied to residual connections, significantly reducing computational costs while improving gradient flow propagation, thereby substantially boosting detection performance.
3.3. Improvements of the Head
3.3.1. LA-Head
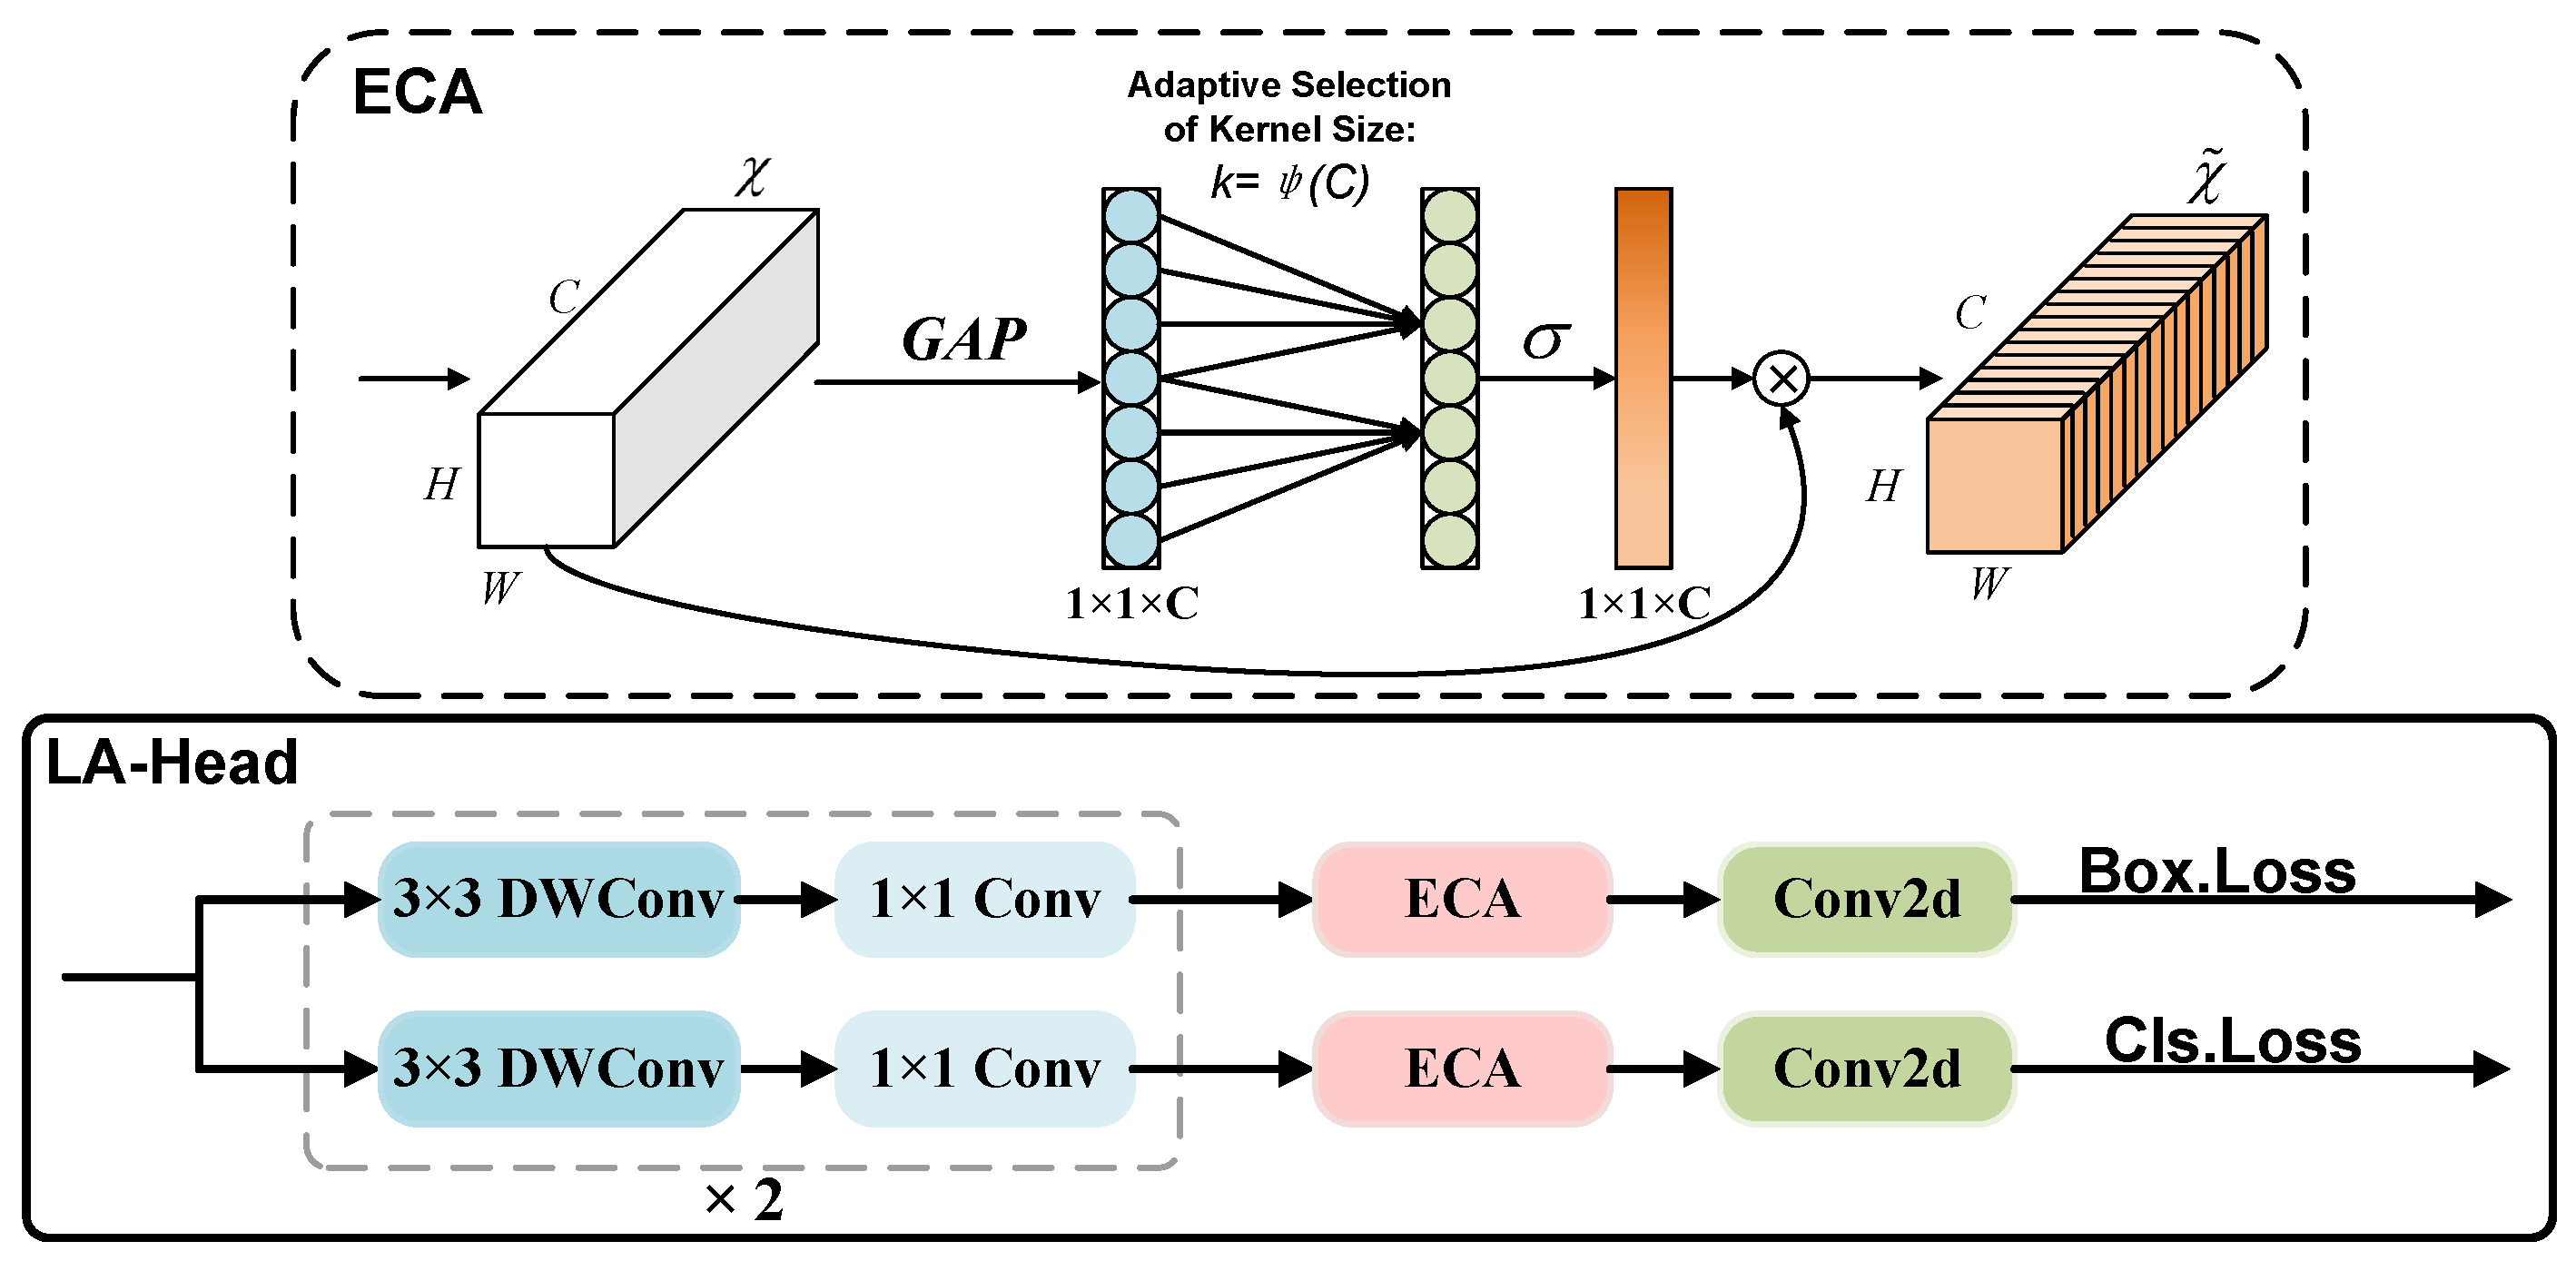
In the insulator anomaly detection task, the detection head utilizes extracted and fused features to predict target locations and anomaly categories. To further reduce model complexity, we design a lightweight detection head named LA-Head, as shown in
Figure 9. By substituting standard convolutions with depthwise convolutions in both the regression and classification branches, computing costs are markedly decreased. An ECA [
27] attention module is integrated in parallel within both branches to mitigate accuracy degradation resulting from the lightweight architecture. This module leverages global average pooling and one-dimensional convolutions to enhance channel-wise interactions, strengthening global feature representation without substantially increasing parameters, thus balancing accuracy and efficiency.
3.3.2. Slide Weighted Focaler Loss
The loss function in YOLOv11 comprises two constituent elements: a classification component utilizing BCEWithLogitsLoss, and a localization component that merges Distributed Focal Loss (DFL) with the CIoU. While current mainstream regression losses focus on geometric relationships between boxes, which improves the regression effect to some extent, they fail to address biases caused by imbalanced sample size distributions. In practical detection tasks, the proportion of differently sized samples varies significantly, leading to imbalanced gradient contributions during training. This imbalance compromises the model’s ability to learn multi-scale representations, consequently leading to missed detections of certain anomalous targets and significantly diminishing recognition accuracy. To address the issue of sample imbalance, we introduce a novel joint loss function named the Slide Weighted Focaler Loss (SWFocalerLoss), which integrates a Focaler-CIoU [
28] regression mechanism with a Slide [
29] weighted classification strategy into a unified loss framework. This design corrects size-related imbalance while refining bounding box predictions, significantly enhancing model robustness and accuracy across varying target sizes.
To rectify sample imbalance resulting from size discrepancies in detecting tasks, SWFocaler-IoU utilizes linear interval mapping to reformulate IoU. This allows the model to selectively prioritize critical sample intervals based on the characteristics of target size distribution, significantly enhancing regression efficiency and detection performance. The reconstruction formula is as follows:
where the term
refers to the reconstructed IoU, and the values of
d and
u are constrained within the interval
. By autonomously adjusting the thresholds for
d and
u to ensure that
concentrates on the regression samples within the core interval, the loss function is defined as follows:
The integration of the SWFocaler-IoU function into CIoU yields the loss function
as follows:
where
is CIoU loss.
To counteract classification bias induced by sample imbalance, SWFocalerLoss implements a Slide weighting strategy. This strategy establishes a weight function that prioritizes hard-to-classify instances during training. The formula for weight can be articulated as follows:
The symbol
represents the mean value of
across all samples, defining the criterion for hard–easy sample separation. Samples whose
values are at the boundary of the
threshold are considered difficult to classify due to the ambiguity in their definition. To encourage the model to learn these samples, SWFocalerLoss exponentially amplifies the weight of such samples, while the remaining easy-to-classify samples are endowed with weights of 1 or close to 1. This reduces the model’s over-concentration on simple cases. The classification weights are applied to the original BCEWithLogitsLoss, expressed as follows:
3.4. LAMP Channel Pruning
Pruning is a widely adopted model compression technique for neural networks. It assesses structural importance and removes redundant components, significantly reducing computational overhead while preserving original model accuracy with near-lossless performance. To further reduce complexity in our improved model, we introduce layer-adaptive sparsity for the magnitude-based pruning (LAMP). This approach quantifies channel significance per layer using a LAMP score, then it prunes less critical channels to achieve efficient model compression.
Specifically, it first computes the LAMP score based on the weights of the channels in each layer to assess their relative importance. The formula is as follows:
where
W is the one-dimensional unfolded weight vector for that layer, with its weights required to be arranged in ascending order based on the index mapping;
represents the channel weight items mapped by index
u;
computes the cumulative sum of squares of weights with indices
;
represents the LAMP score for channel
u in that layer.
After layer-wise computation, channels with lower LAMP scores are pruned against a predefined threshold. Specifically, less important channels have their weights zeroed out, excluding them from model inference. The pruned model then undergoes fine-tuning to mitigate performance degradation. The overall pruning process can dynamically adjust the pruning ratio through the computational compression ratio
, expressed as follows:
where
is the amount of computation before pruning, and
is the amount of computation after pruning.
3.5. Dataset
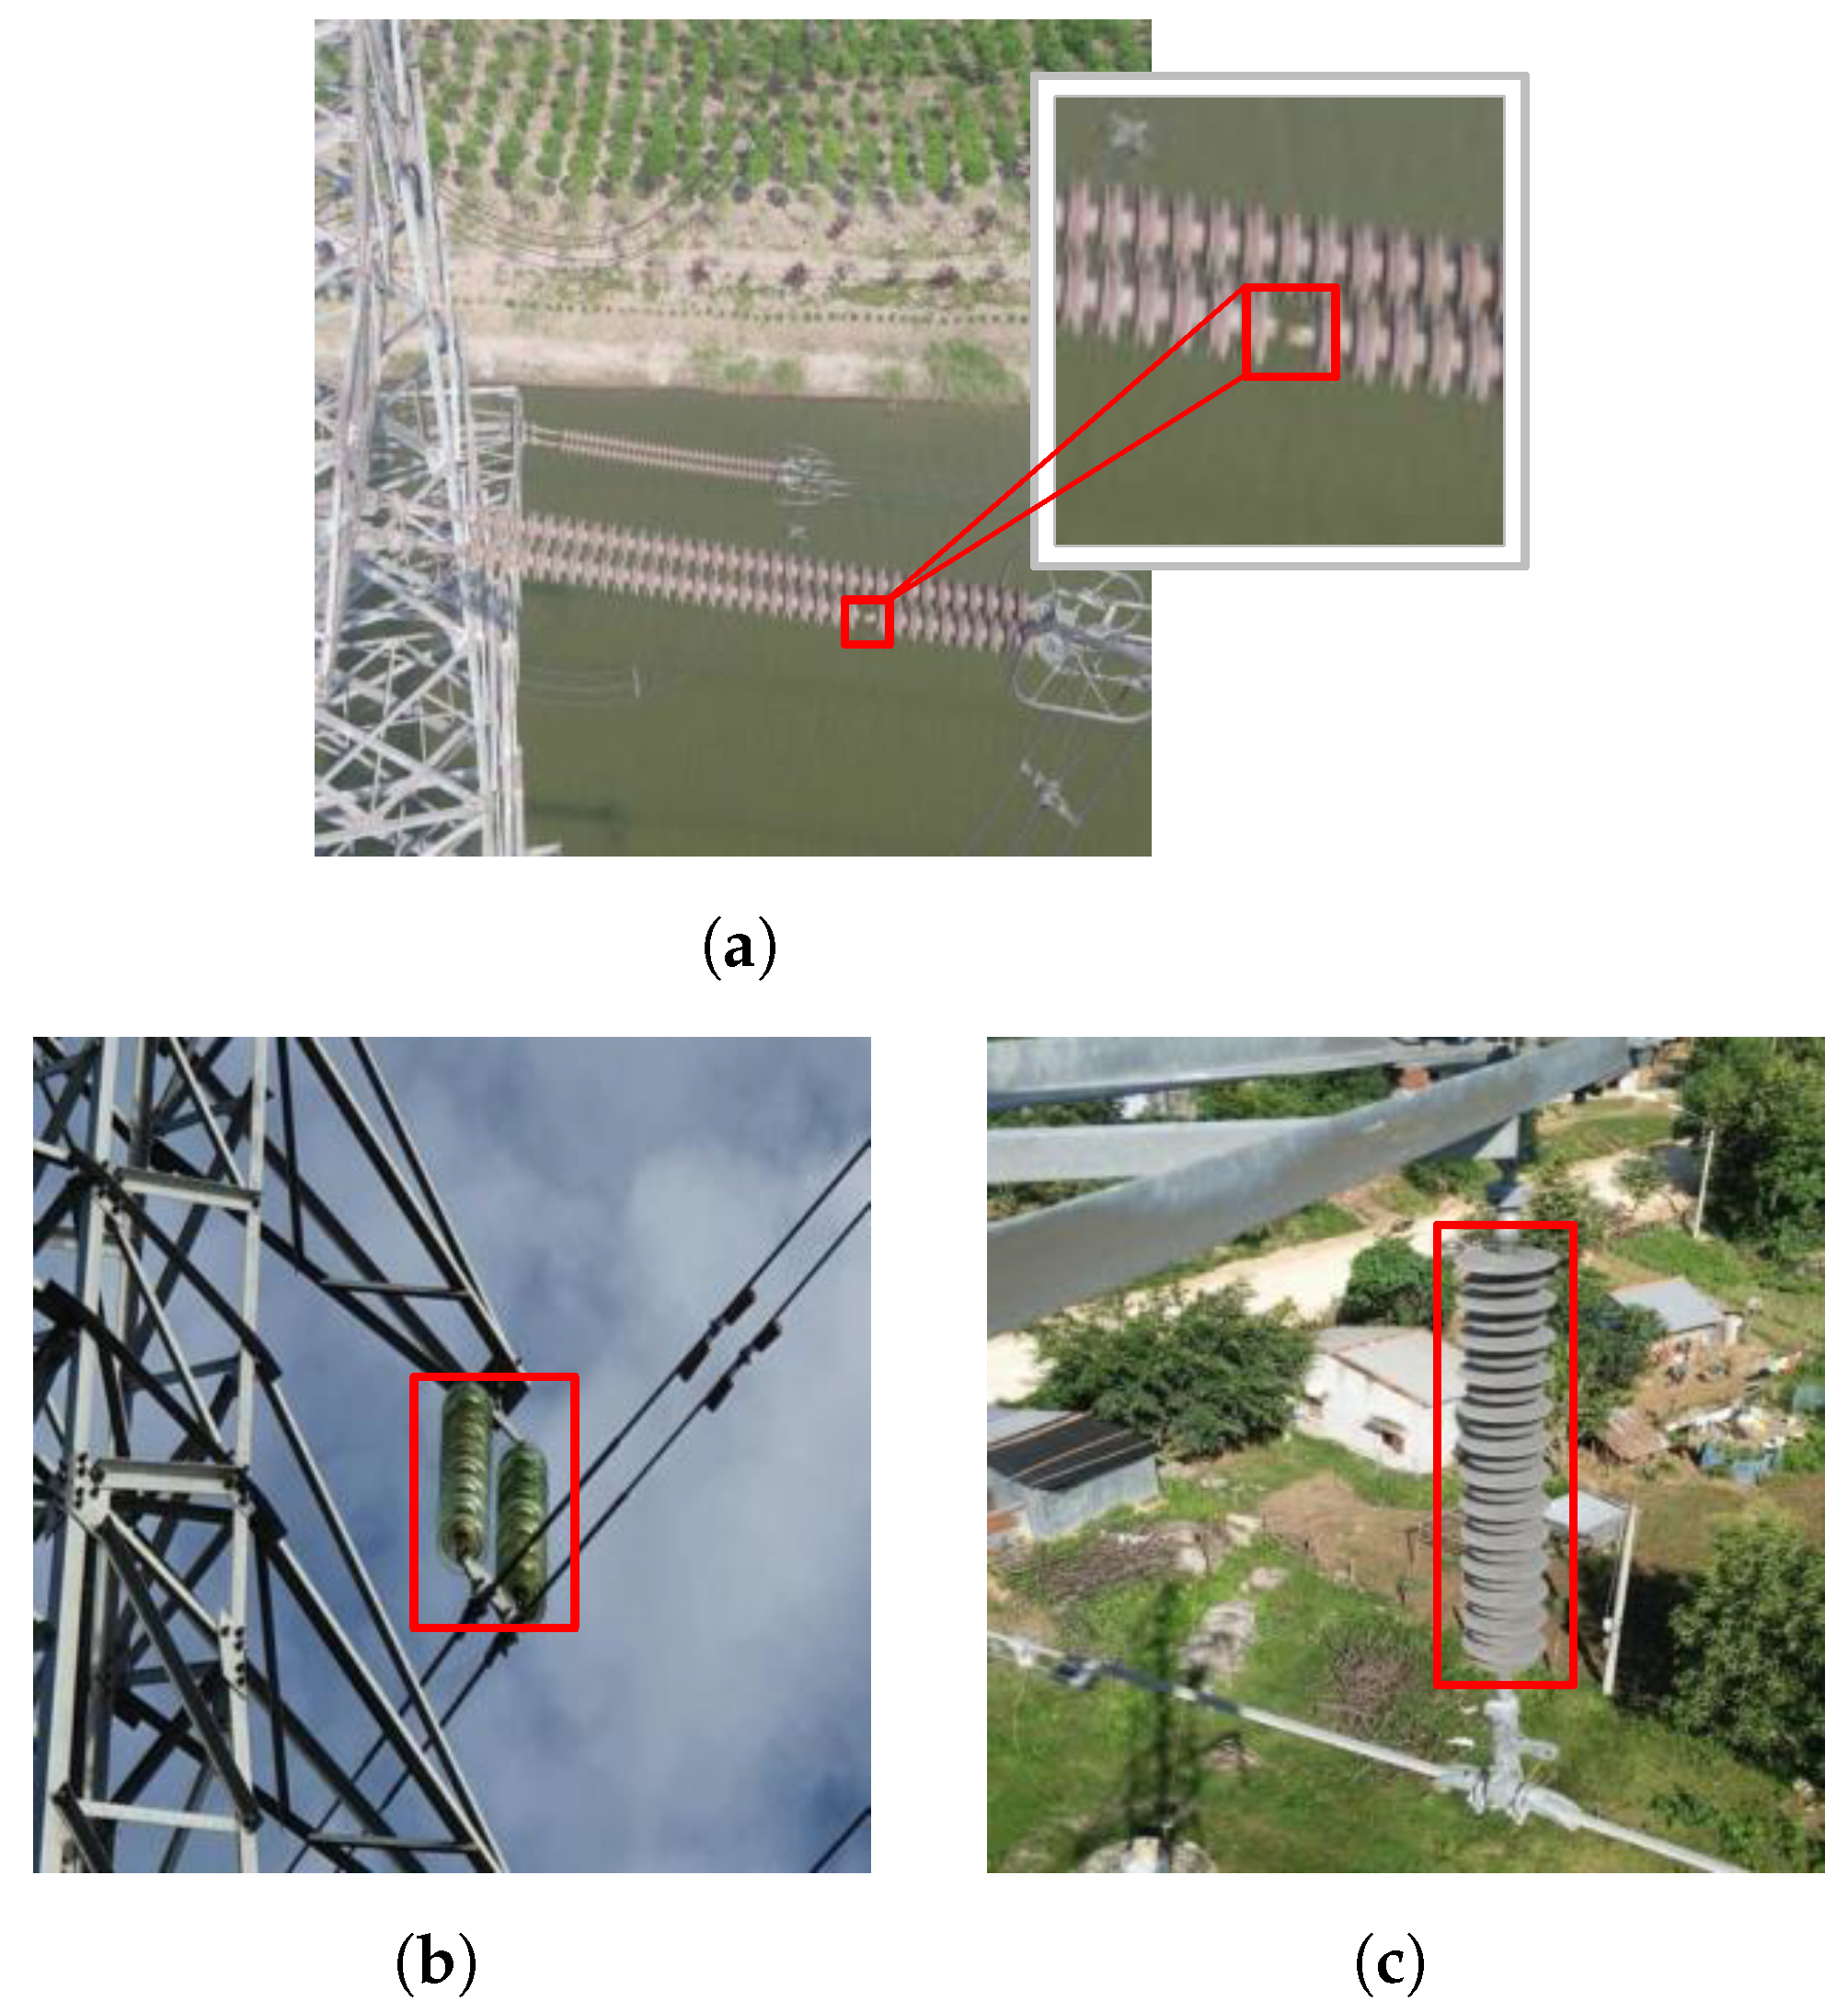
The insulator anomaly dataset consists of photos obtained from the Chinese Power Line Insulator Dataset (CPLID), supplemented by publicly available insulator images gathered from the internet. The dataset covers three anomaly categories, aging insulator, insulator defect, and dirty insulator, with representative samples illustrated in
Figure 10. The original dataset, consisting of 1306 images, was allocated to training, validation, and test sets in a rigorous 7:2:1 ratio to facilitate an unbiased evaluation. Given the scarcity of abnormal insulator samples in real-world scenarios, data augmentation was employed to enhance the model’s robustness and prevent overfitting. Critically, data augmentation procedures were restricted exclusively to the original training set. The augmented training samples were generated using a combination of techniques, including vertical flip (probability of 80%), horizontal flip (probability of 80%), translation (random translation by ±15 pixels on both X and Y axes), scaling (random scaling between 80% and 95% of the original size), rotation (random rotation between −30 and +30 degrees), brightness adjustment (multiply brightness values by a factor between 1.2 and 1.5), and Gaussian blur (apply a Gaussian blur with a fixed sigma of 3.0). The final augmented training set contained 3132 images, while the validation and test sets remained composed of the original images. All images were resized to a resolution of 640 × 640 pixels for model input.
Additionally, we note that the ‘defect’ category (as shown in
Figure 10a), which includes flaws such as cracks and breakages, predominantly consists of small-sized targets relative to the entire insulator. The accurate detection of these small defect instances presents a significant challenge. Therefore, the performance metrics in this category are reported in our ablation and comparative studies.
3.6. Experimental Environment
To guarantee experimental equity, all models utilize a consistent input dimension of 640 × 640 pixels with a batch size of 16. Consistently across all phases, including standard training and fine-tuning, the same hyperparameters were applied. Stochastic Gradient Descent functions as the optimizer, utilizing an initial learning rate of 0.01. The momentum and weight decay parameters are established as 0.937 and 0.0005, respectively. Mosaic augmentation is utilized to improve model generalization. The comprehensive experimental platform environment is presented in
Table 1.
3.7. Evaluation Metrics
This paper evaluates algorithms along two dimensions: model performance and complexity. For performance evaluation, we employ recall, precision, and mean average precision (mAP), calculated as shown in Equations (
13) to (
16).
Here,
signifies the count of positive samples accurately identified as positive;
denotes the count of positive samples erroneously classified as negative;
indicates the count of negative samples mistakenly classified as positive by the model;
represents the average precision for class
i;
n indicates the total number of classes, and mAP is calculated by averaging the AP values across all categories. mAP@0.5 signifies the mAP at IoU threshold of 0.5, whereas mAP@0.5:0.95 indicates the mAP across IoU thresholds from 0.5 to 0.95. A higher mAP number indicates superior model performance. All performance measures utilized in the studies are derived from the test set.
Additionally, this research employs three metrics to evaluate the computational complexity of the model: the number of model parameters (Params), the number of floating-point operations per second (FLOPs), and the model size.
4. Results and Discussion
4.1. LAMP Result Analysis
This research assesses the efficacy of the LAMP technique on the enhanced model by evaluating performance across various
values.
Table 2 summarizes the primary experimental findings.
The table indicates that for the model with = 1.2, the mAP@0.5 exhibits a 0.5% gain relative to the original model, signifying the most substantial enhancement across all experimental groups. Moreover, its mAP@0.5:0.95 rises to 61.2%. Compressions of 19.8%, 17.1%, and 16.5% were achieved in parameters, FLOPs, and model size, respectively. While network pruning is typically associated with a trade-off between performance and efficiency, this slight performance gain could be attributed to a regularization effect. As expands and the computational overhead of the model diminishes, the precision, recall, and mAP measures show a downward trend, suggesting that excessive pruning adversely affects the model’s feature representation. In conclusion, at the optimal pruning ratio, this approach successfully compresses the model while not only preserving but even slightly enhancing the detection performance.
Figure 11 distinctly illustrates the comparison of channel quantities prior to and after model pruning when
= 1.2. The dark blue channels signify the pruned redundant channels, while the light blue channels denote the preserved channels, thereby confirming that the LAMP pruning technique effectively eliminates redundant structures from the model.
4.2. Comparative Analysis of Various Feature Fusion Networks
To provide additional validation for the multi-scale feature aggregation capability of the HS-WFPN, we executed comparative studies in which the Neck is substituted with several representative lightweight feature fusion networks under identical experimental settings. The outcomes are presented in
Table 3.
Crucially, the HS-WFPN exhibits a consistent performance improvement, elevating recall by 0.1%, mAP@0.5 by 0.8%, and mAP@0.5:0.95 by 0.6%. The observed improvements demonstrate that the WSFF module in HS-WFPN significantly augments feature fusion capabilities. When compared with other fusion methods, HS-WFPN substantially outperforms Bi-FPN across all metrics. Despite the model’s complexity being marginally more than that of CCFF, it displays considerable detection benefits, with enhancements of 3.7%, 2.4%, and 1.0% in recall, mAP@0.5, and mAP@0.5:0.95, respectively. The experimental results conclusively confirm that HS-WFPN can effectively enhance model performance while reducing model complexity, achieving superior balance between performance and complexity.
4.3. Comparative Analysis of Various Loss Functions
To benchmark its performance, the proposed SWFocalerLoss is systematically compared with existing state-of-the-art loss functions in
Table 4.
Compared to the original Focaler-CIoU, our loss demonstrates significant advantages across multiple core metrics: recall improved by 2.5%, mAP@0.5 by 1.2%, and mAP@0.5:0.95 by 1.3%, validating that its weighted classification strategy enhances overall model performance. When compared to other mainstream losses, while SWFocalerLoss exhibits marginally lower precision, it achieves superior recall and mAP values, outperforming all baselines. This indicates higher overall accuracy and reduced missed-detection rates in actual detection. Given that recall and mAP are typically prioritized in object detection, and our approach achieves optimal results on both metrics, the comprehensive experimental results confirm that SWFocalerLoss has superior applicability and effectiveness in enhancing detection performance.
4.4. Ablation Experiments
We performed an ablation study on LAI-YOLO to evaluate the contribution of each component, with the results presented in
Table 5.
The individual introduction of SG-C3k2, HS-WFPN, LA-Head, and SWFocalerLoss boosts the mAP@0.5 by 0.6%, 1.1%, 0.5%, and 1.0%, respectively. Notably, SG-C3k2, HS-WFPN, and LA-Head further reduce computational costs, demonstrating their advantages in balancing accuracy and efficiency. When combined, these components significantly improve evaluation metrics compared to the baseline YOLOv11n. Especially under synergistic integration, the model achieves 90.0% mAP@0.5 with substantially reduced parameters and computations, confirming their structural compatibility. Further experimental results indicate that SWFocalerLoss exhibits strong adaptability to the enhanced architecture, elevating mAP@0.5 by 0.6% to 90.6%. Ultimately, the implementation of LAMP channel pruning in this optimized model results in further improvements: mAP@0.5 and mAP@0.5:0.95 increase by 0.5% and 3.0%, respectively. While significantly boosting performance, LAI-YOLO substantially streamlines the model architecture, greatly enhancing its deployability on resource-limited edge devices like UAVs.
4.5. Comparative Analysis of Various Lightweight YOLO Models
To comprehensively assess the efficacy and advancement of the improved model, comparison studies were performed using representative lightweight YOLO models with identical hyperparameters and settings, with the results presented in
Table 6. The table indicates that LAI-YOLO attained a 61.2% mAP50-90 metric, representing a 2.2% improvement over the baseline YOLO11n, with its mAP50 improving by 2.9%, which validates its excellent performance in the insulator anomaly detection scenario. Furthermore, it attains optimal precision and recall among all models, demonstrating high accuracy with reduced missed detections, thereby better satisfying the high-recall requirements of actual insulator anomaly detection tasks.
The architecture also exhibits enhanced lightweight characteristics. Compared to the widely adopted YOLOv8n, parameter count and FLOPs decrease by 56.2% and 50%, respectively, significantly alleviating storage and computational demands on edge devices. By striking an effective balance between detection efficacy and computational demands, LAI-YOLO delivers a robust and efficient solution for automated insulator anomaly detection.
The FPS was benchmarked on an NVIDIA RTX 3090 GPU using a configuration of batch size 1 and a 640 × 640 input resolution to simulate real-time deployment. It is worth noting that real-time testing confirms a frame rate of 49.8 FPS, meeting the inspection requirements of UAVs. It is imperative to analyze the inherent trade-off between the model’s computational complexity and its inference speed. Although LAI-YOLO exhibits significantly lower FLOPs and parameters than several baseline models, its FPS is lower than that of YOLOv6n. This apparent discrepancy stems from the fact that theoretical FLOPs do not perfectly correlate with practical latency on parallel hardware like GPUs. The architectural components introduced in LAI-YOLO, such as the attention mechanisms and the adaptive feature fusion module, enhance representational power at the cost of increased sequential operations, which can reduce parallel efficiency. This design choice reflects a deliberate trade-off: we prioritize extreme parameter efficiency and high accuracy, which are critical for storage- and power-constrained edge devices, while maintaining a frame rate that comfortably makes it suitable for deployment in real-time UAV inspection systems. The significant reductions in model size and FLOPs make LAI-YOLO particularly suitable for embedded deployment.
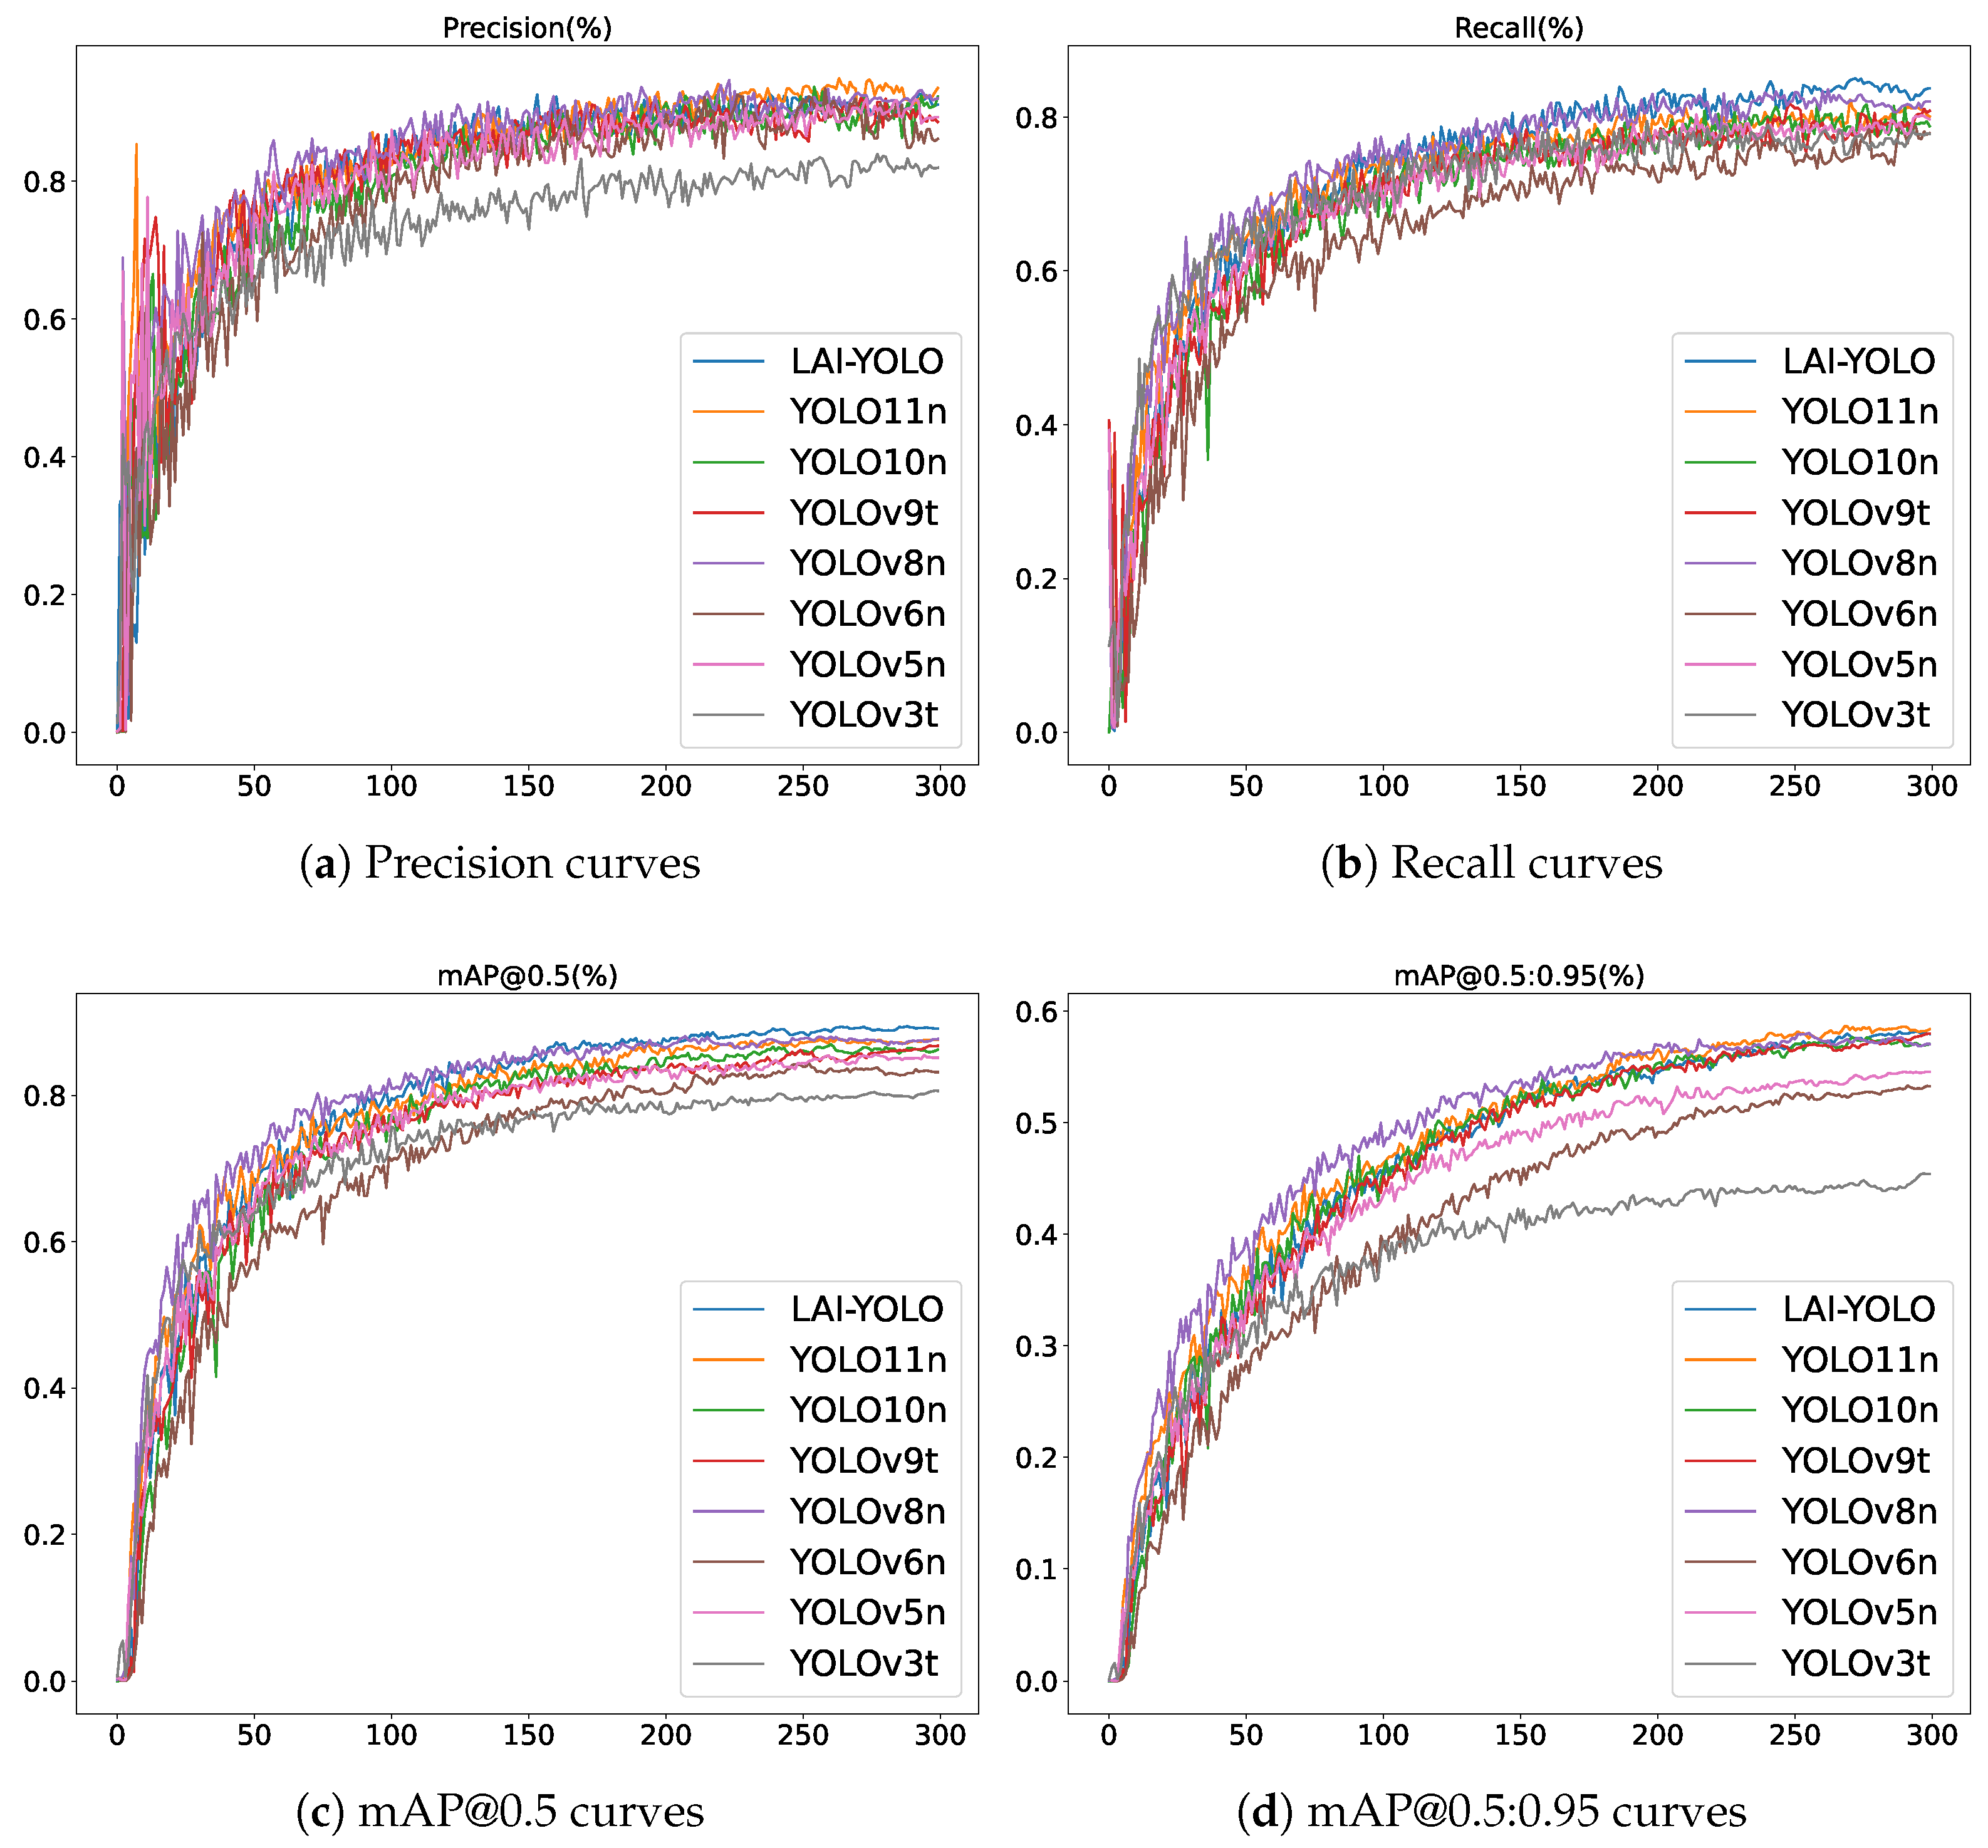
Figure 12 depicts the comparative performance metrics of different YOLO models throughout the training phase. The pre-pruning LAI-YOLO (blue curve) demonstrates accelerated convergence and surpasses other comparative models in multiple key measures, indicating superior training efficiency and detection efficacy.
4.6. Visualization and Heatmap Comparative Experiments
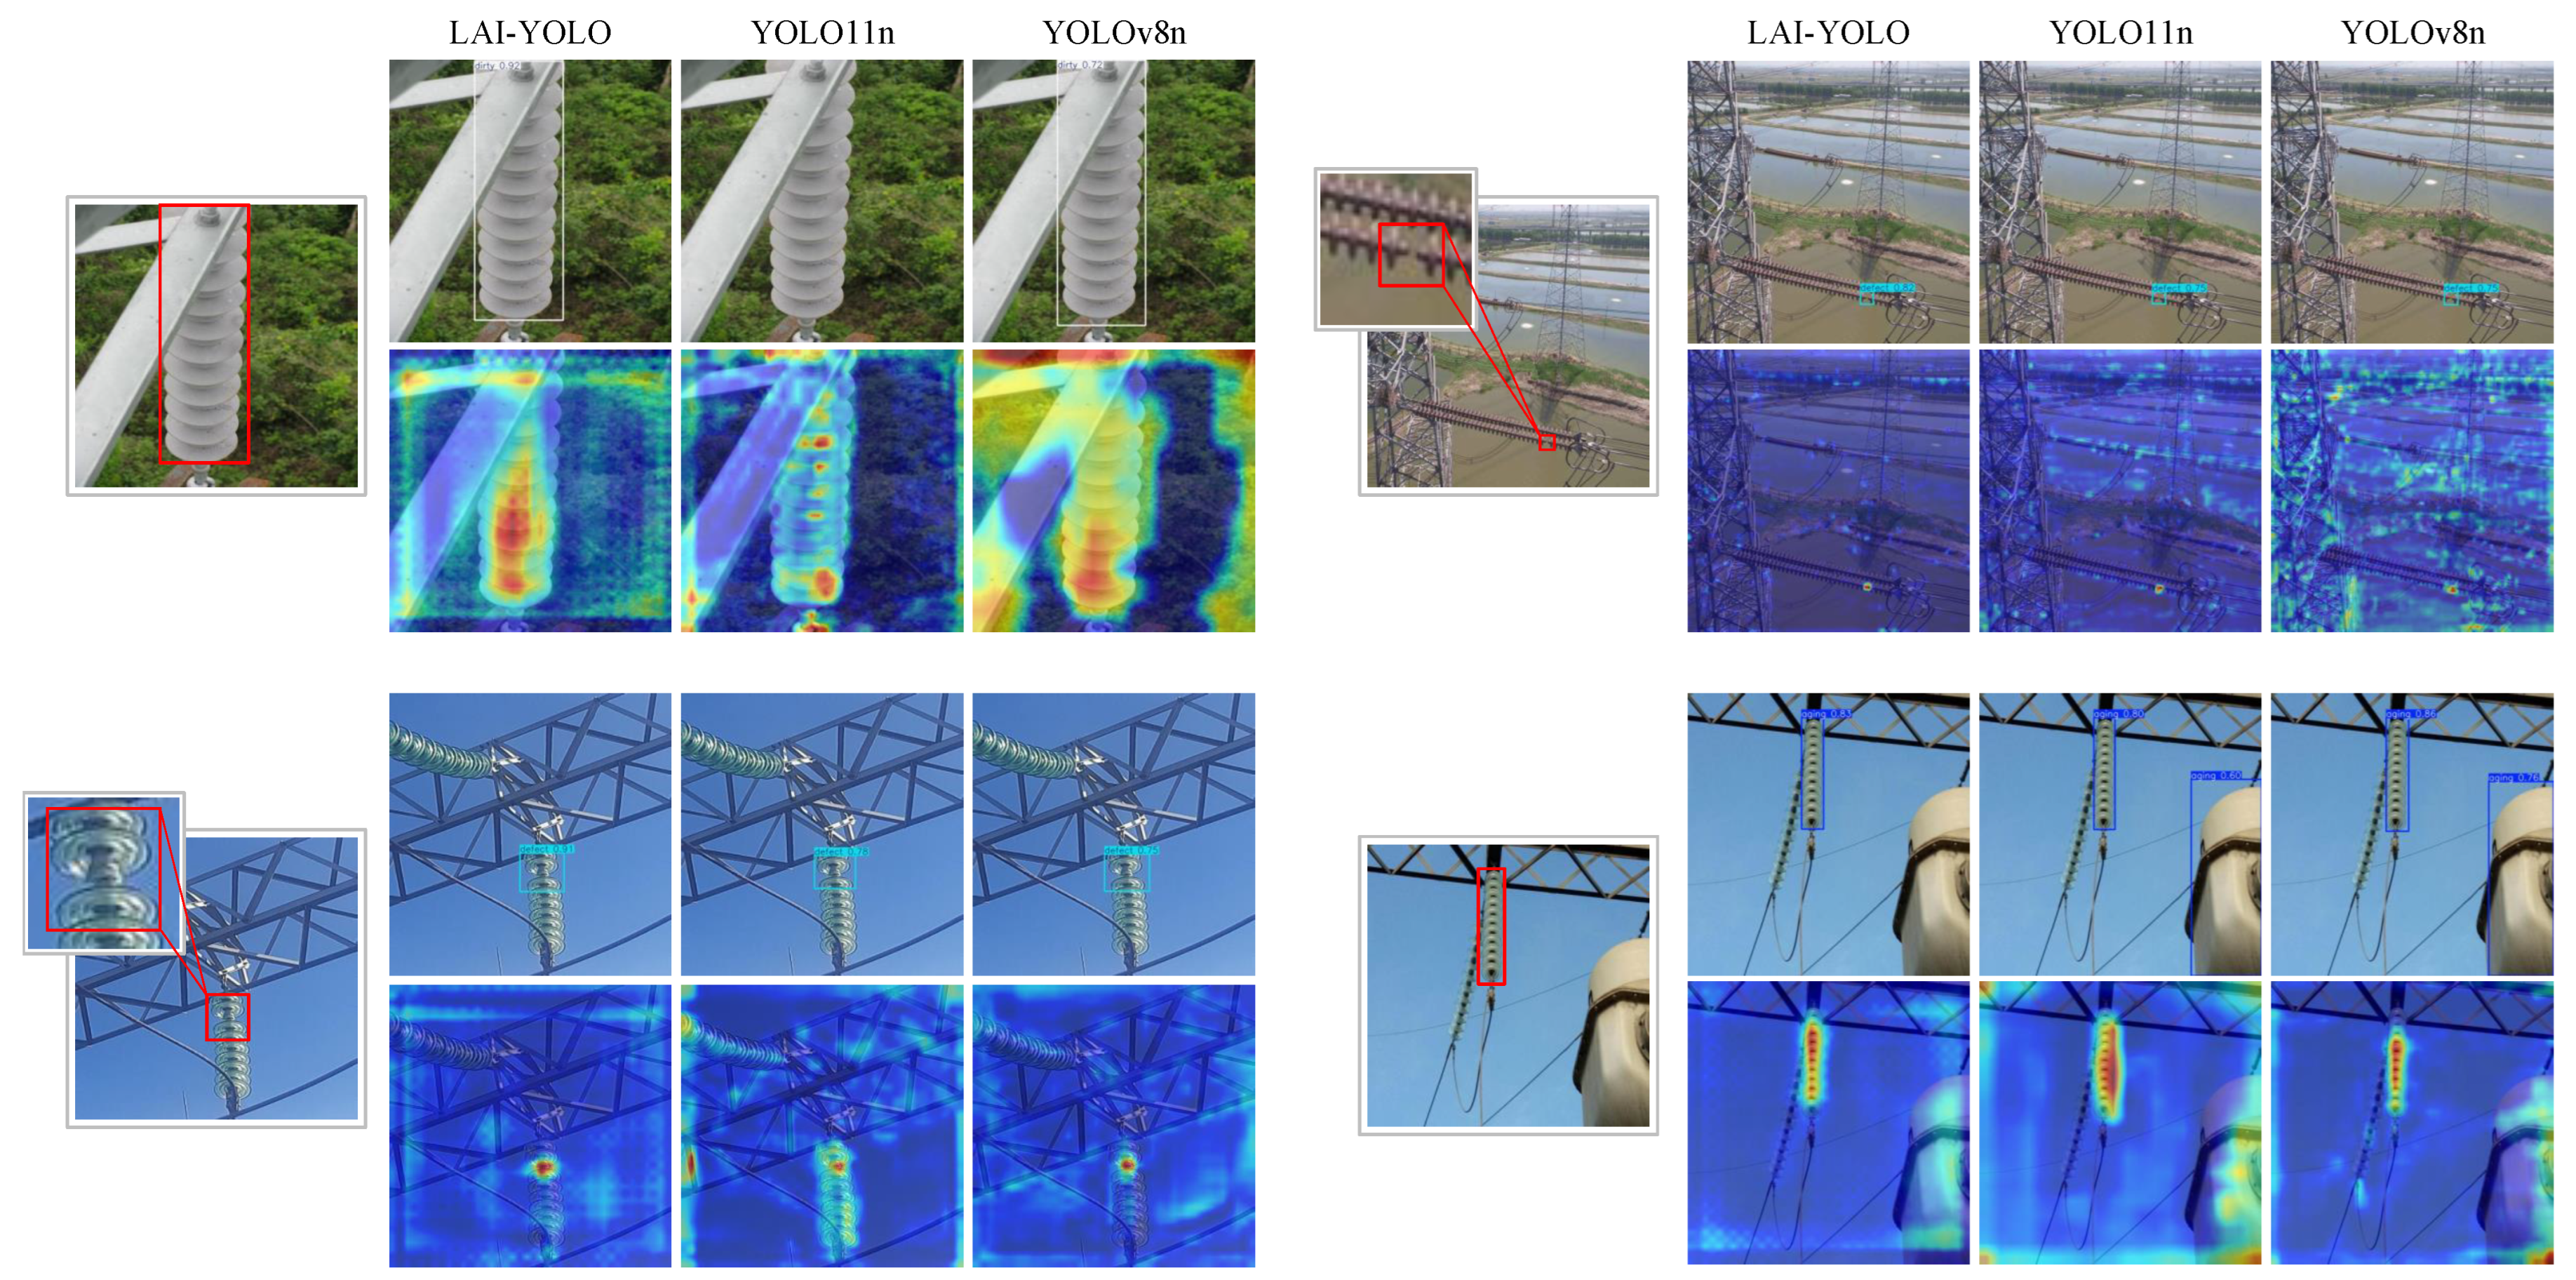
We employed Grad-CAM++ to visually compare the attentional regions of LAI-YOLO with the YOLOv11n and YOLOv8n baselines. The pre-head activation heatmaps revealed distinct behavioral differences, as shown in
Figure 13.
Based on the heatmap performance, YOLO11n exhibits significant heat distribution divergence, failing to comprehensively cover abnormal regions. Meanwhile, YOLOv8n shows susceptibility to background interference, with inadequate feature activation contrast between critical and non-critical areas, indicating insufficient discriminative feature learning during training, resulting in overlooked detections and erroneous positives. In contrast, LAI-YOLO generates concentrated thermal responses precisely localized to insulator anomalies, with more uniform activation intensity distribution. Benefiting from more accurate thermal focusing, LAI-YOLO provides superior detection confidence and stability while detecting abnormal areas, allowing for accurate identification of aging insulators, insulator defects, and dirty insulators.
5. Conclusions
This research presents LAI-YOLO, a lightweight algorithm based on YOLO11, to address the issues in edge-deployed insulator anomaly detection, including computational redundancy, limited sensitivity to small targets, cross-scale feature conflicts, and sample imbalance. The core of our approach lies in a series of synergistic architectural contributions: an adaptive gating mechanism (SG-C3k2) in the Backbone for dynamic feature recalibration; a novel weighted feature fusion neck (HS-WFPN) that enables adaptive cross-scale integration to enhance small-target detection; a reconstructed detection head (LA-Head) coupled with a tailored loss function (SWFocalerLoss) to balance performance and complexity while mitigating sample imbalance; and finally, the application of LAMP pruning for substantial model compression. Comprehensive experimental validation confirms that the proposed LAI-YOLO achieves a superior balance between high accuracy—reaching 91.1% mAP@0.5, a 2.9% improvement over the baseline—and remarkable efficiency, with only 1.18M parameters and 3.4G FLOPs.
The development of LAI-YOLO has direct and significant implications for modern power grid maintenance practices. By providing a highly accurate and computationally efficient anomaly detection model, this work paves the way for the widespread deployment of fully automated UAV-based inspection systems. Such systems can transition grid maintenance from a reactive, schedule-based model to a proactive, condition-based one. The ability to perform frequent, low-cost, and comprehensive inspections without endangering human workers will lead to the earlier detection of faulty insulators, thereby preventing costly power outages, minimizing downtime, and ultimately enhancing the resilience and operational safety of the transmission network.
While the results are positive, it is important to acknowledge the limitations of this research. The inference performance reported in this work is based on desktop GPU benchmarks, which may not fully reflect the real-time capabilities of the model when deployed on a UAV platform. In a complete UAV pipeline, factors such as image acquisition time, data transmission latency, and the computational capacity of embedded hardware could impact the overall frame rate and responsiveness. Future work will focus on integrating LAI-YOLO into a UAV system for end-to-end performance evaluation, including real-time image processing under varying flight altitudes, lighting conditions, and transmission scenarios. In future work, we will extend the comparison to additional representative lightweight detectors (e.g., EfficientDet-Lite) and emerging architectures (e.g., YOLO12) to further verify the generalization ability of LAI-YOLO. Moreover, the generalization performance of the proposed LAI-YOLO under more diverse and challenging conditions, such as fog, night, and significantly different UAV altitudes, requires further investigation due to the limited variability in the current dataset. Finally, the evaluation in this work primarily focused on deployment constraints relevant to edge devices. The scaling behavior of LAI-YOLO on more powerful GPU platforms and its competitive standing against larger, state-of-the-art models when computational resources are less constrained remain an open and interesting question.
