Article

Investigation on Ground Collapse Due to Exfiltration of Shallowly Buried Water-Supply Pipeline

Department of Civil Engineering, Shanghai University, 99 Shangda Road, Shanghai 200444, China
*
Author to whom correspondence should be addressed.
Appl. Sci. 2025, 15(19), 10736; https://doi.org/10.3390/app151910736 (registering DOI)
Submission received: 28 August 2025 / Revised: 24 September 2025 / Accepted: 3 October 2025 / Published: 5 October 2025
(This article belongs to the Section Civil Engineering)

Abstract

Pipeline exfiltration from damaged water-supply systems frequently causes soil erosion and ground subsidence, which jeopardizes the safety of pedestrians and vehicles and even causes casualties. Despite the severe consequences, it is difficult for engineers to give reliable assessments of pipeline exfiltration hazards. In this study, erosion processes were explored using model tests and coupled computational fluid dynamics–discrete element method (CFD-DEM) simulations. It was discovered that the erosion zone can be divided into two zones—the exfiltration zone and the seepage diffusion zone. When water pressure reached 2.412 × 10⁻² MPa, local porosity approached 1.0, indicating there were no soil particles remaining. As pipeline pressure increased from 2.122 × 10⁻³ MPa to 2.412 × 10⁻² MPa, ground failure transitioned from downward settlement to upward bulge, and the ground failure duration of the fractured prototype pipe was reduced by 22–28% (from 125 s to 98 s), with a standard deviation of less than 5. The established exponential decay model ( v ( t ) = v 0 e ( α t ) , R 2 > 0.89 ) enabled prediction of erosion duration. Based on the erosion height curve, the erosion duration and erosion area in similar engineering environments can be estimated, providing a reference for evaluating the risk of ground collapse due to pipe exfiltration.

1. Introduction

The urban water-supply system is an important part of municipal infrastructure. The rapid urbanization of big cities has resulted in an increase in the length and number of pipelines, consequently raising the risk of leakage [1,2,3]. According to the 2023 National Underground Pipeline Accident Report of China [4], 1406 incidents were recorded in a single year, with 80.74% of these being pipeline-related. Water-supply pipelines experienced failures more frequently than other types due to structural vulnerabilities (see Figure 1). Similar conditions have been reported internationally. A 2024 survey of 802 utilities across the United States and Canada reported approximately 260,000 water main breaks annually, corresponding to an average failure rate of 11.1 breaks per 100 miles of pipeline [5]. Ruptured water-supply pipes trigger soil erosion and lead to secondary hazards such as erosion cavities and ground failure. Pressurized leakage erodes the surrounding soil, while subsurface flow accelerates the loss of soil particles, eventually creating erosion cavities [6]. These incidents underscore that pipeline-induced ground failures pose universal challenges to urban infrastructure management [7].
Water-supply pipelines are being subjected to combined stresses from soil weight and traffic loads, which result in structural fractures in the upper section [8]. This vulnerability often leads to erosion in the surrounding soil, resulting in secondary hazards such as erosion cavities and ground collapse. The significance of this issue has attracted the attention of many researchers, who have employed model tests and numerical simulations to explore its underlying mechanisms. Shao et al. [9] found that circular orifices produced the highest leakage rates compared with annular cracks and longitudinal fractures. Yu et al. [10] showed that orifice size significantly affected leakage, with water leakage being controlled by internal pressure and air leakage. Zhang et al. [11] revealed that smaller orifices resulted in higher leakage velocities, where recirculating flow fields intensified erosive wear on pipe walls. Similarly, Ben-Mansour et al. [12] demonstrated that water pressure and hydraulic gradients governed leakage behavior, with the highest flow velocity being at the damage center. Until now, existing studies on pipeline exfiltration have predominantly focused on pressure effects and soil properties, while the influence of pipe diameter on erosion patterns remains relatively understudied [6]. Urban water-supply systems employ diverse pipe diameters (typically 50–600 mm), which may significantly affect hydraulic gradients and subsequent erosion mechanisms.
Despite advancements in leak detection technologies [13,14,15], the complexity of pipe exfiltration often causes difficulties in leak identification and thus relevant prevention and remediation measures cannot be taken [2,16]. While existing studies mainly focus on soil loss rates [17,18,19], erosion cavity size [20,21], and ground surface settlement [22,23,24], less attention has been given to the height and velocity of soil erosion. These dynamic parameters are more critical than static cavity size because erosion velocity determines the available time for emergency response before ground breakthrough, while height progression provides early warning indicators before visible collapse occurs.
In this study, the evolution of evolution caused by the exfiltration of buried defective pipelines was investigated using laboratory model tests combined with digital image analysis [25,26,27,28]. The results provided systematic quantification of erosion height and velocity evolution during pipeline exfiltration, revealed the distinct phenomena between exfiltration zone and seepage diffusion zone, and validated an exponential decay model for erosion velocity prediction. Then, a 3D CFD-DEM-coupled numerical model was set up to investigate erosion mechanics at the microscopic scale [29].

2. Laboratory Model Test

2.1. Similarity Law

Geometric similarity requires that the geometries of systems—including lengths, areas, and volumes—are proportional. Urban underground networks are characterized by lengthy, interconnected pipelines, which render it impractical to apply the same scale ratio to the diameter and length of the pipe. As a result, a model pipe can be independently controlled by the length and diameter scale factors due to distorted similarity [30]:
λ x = λ y λ z   or   λ x = λ z λ y   or   λ y = λ z λ x
where λ x = x p x m ,   λ y = y p y m ,   λ z = z p z m are the scale ratios between the prototype and the model for the cross-section radius x and y and pipe length z of the damaged pipe. The prototype and model are denoted by the subscripts p and m, respectively.
While distorted similarity is necessary for practical experimental implementation, it introduces scaling inconsistencies that must be acknowledged. Given the geometric scale ratio n = 3.2, maintaining Froude similarity ( F r p   =   F r m ) results in Reynolds number distortion where R e p / R e m     5.7 . This distortion is acceptable since both the model and prototype maintain turbulent flow conditions ( R e > 2300 ), ensuring that viscous effects remain secondary to the dominant inertial forces [31]. Furthermore, Froude number similarity is preserved, maintaining correct inertial–gravitational force ratios that govern free-surface erosion processes [32]. The hydraulic gradient similarity is also maintained, ensuring accurate representation of seepage patterns [33].
Kinematic similarity requires that flow velocities, discharge, and time scales in both systems are congruent. In pipe flow, this indicates that the flow of the prototype and model exhibit similar forms, with velocities at corresponding places being proportional in magnitude and the same in direction. The kinematic factors are defined as follows:
λ t = t p t m λ v = v p v m λ Q = Q p Q m
where the erosion time, flow velocity, and discharge of the prototype pipe are t p , v p , and Q p in the formula, and the corresponding values in the model are t m , v m , and Q m .
Dynamic similarity requires that forces of the same type acting at corresponding locations in the prototype and model have the same direction and are scaled by a consistent ratio. These forces include viscous F γ , pressure F P , gravity F G , inertial F I , and elastic F E . Their relationship can be written as follows:
F r p F r m = F p p F p m = F G p F G m = F I p F I m = F E p F E m
To achieve initial-condition similarity, the motion parameters of the model and prototype must match in a defined proportion at the start time ( t = t 0 ). This includes flow velocity and displacement. Boundary-condition similarity requires that geometric, kinematic, and dynamic constraints are consistent between systems.
This study concentrated on soil erosion around damaged water-supply pipes; as no existing differential equation describes this process, dimensional analysis was employed to develop similarity principles [34]. Similarity principles guarantee that mechanical behaviors in both prototype and model systems remain analogous. Similarity criteria, which are derived from these principles, unite mechanical quantities into systems of equations. In complex problems where differential equations have not been formulated, dimensional analysis is the most effective method to create these criteria.
The relationship between the pipe, water, and soil is a decisive factor in exfiltration erosion around a damaged underground water-supply pipe. This process is influenced by eight variables—the pipe diameter d , water density ρ w , flow velocity v , exfiltration duration t , soil density ρ s , permeability coefficient K , elastic modulus E , and cohesion c . Yuan [35] used dimensional analysis to create five equations and derived the similarity rules shown in Equation (4). The time scale for exfiltration erosion is also equivalent to n when the geometric scale ratio (the prototype-to-model pipe diameter ratio) is applied as n . Consequently, the exfiltration velocity of model must be n times the actual velocity.
π 1 = ρ w d 2 c t 2 ,   π 2 = ρ s d 2 c t 2 ,   π 3 = K t d ,   π 4 = v t d ,   π 5 = E c

2.2. Model Setup

Pipe diameters in urban water-supply pipes range from 20 mm to 620 mm. This study simulates the phenomenon of exfiltration in a prototype pipe with an outer diameter of 200 mm. The experimental model uses a geometric scale ratio of n = 3.2, making the outer diameter 63 mm, which meets the similarity rules in Equation (4) and national standards for PVC water-supply pipes. To investigate the impact of pipe diameter, two more model pipes with outer diameters of 50 mm and 40 mm were employed for comparison.
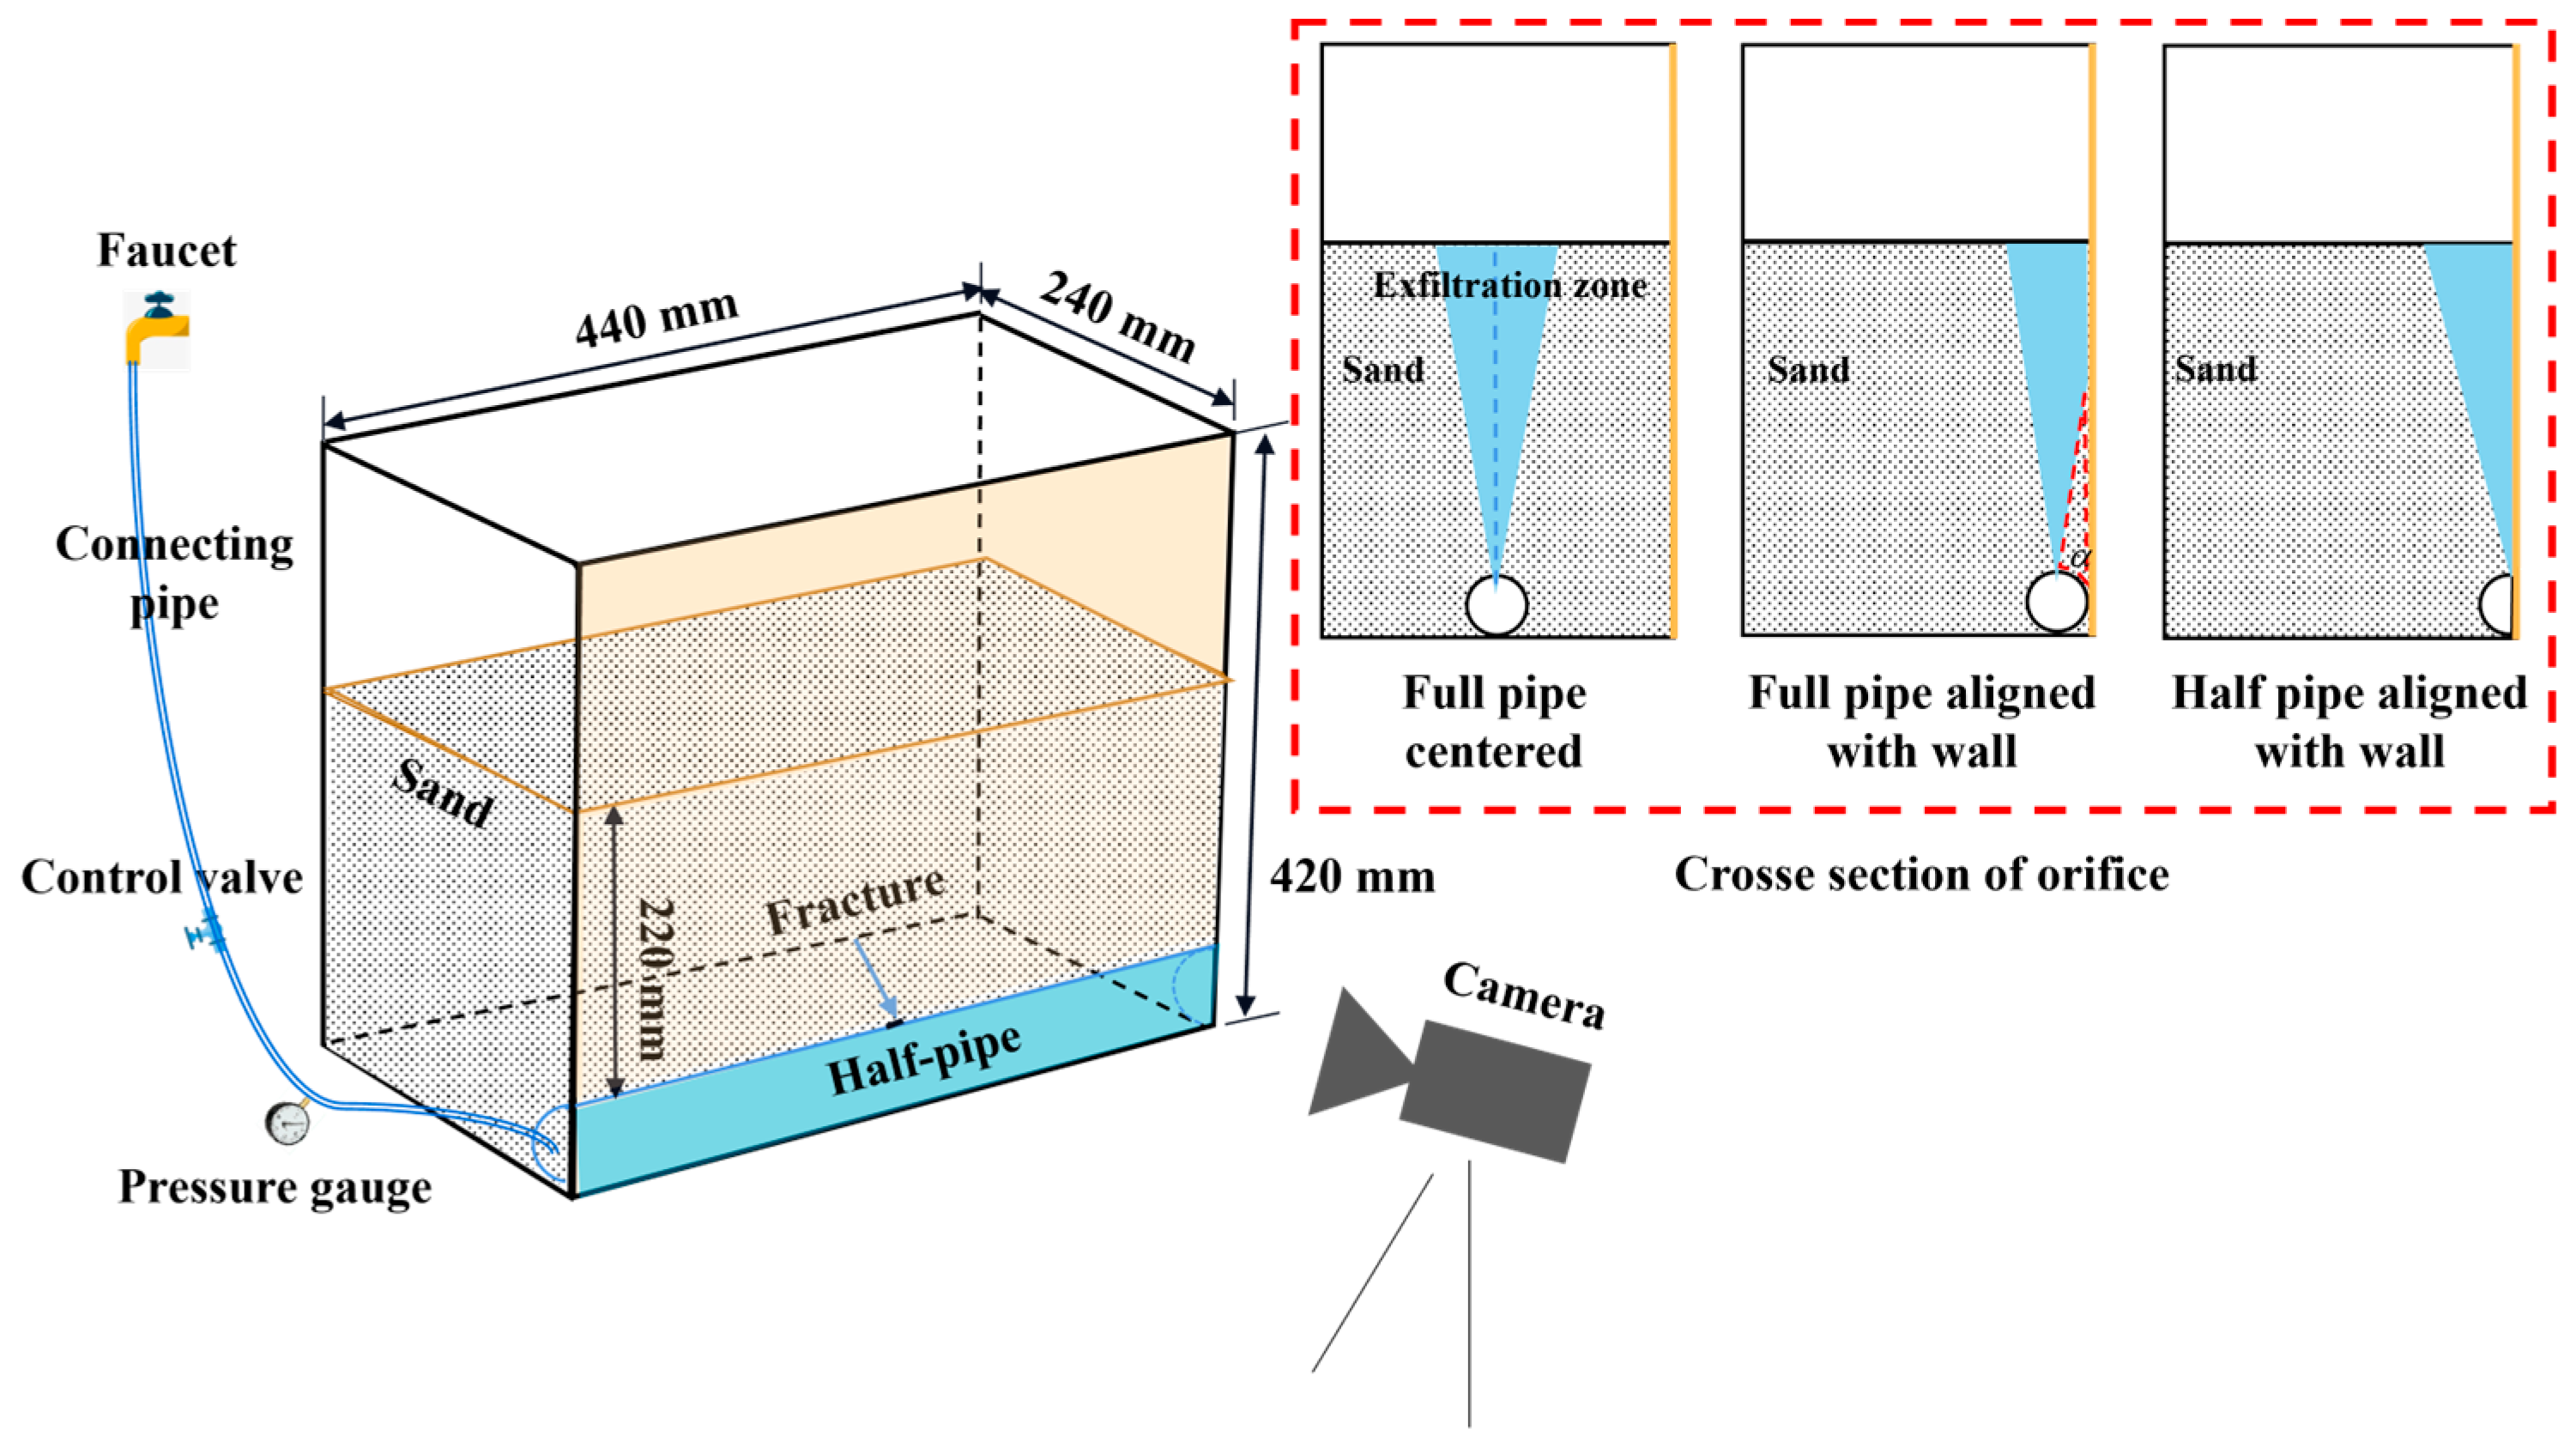
Before the tests, three different ways to bury pipes were studied using Cui’s [36] inverted-cone exfiltration model—full pipe centered, full pipe aligned with wall, and half pipe aligned with wall, as shown in Figure 2. To better observe the process of exfiltration and soil erosion, a half-pipe aligned with the wall was adopted, which at the same time preserved hydraulic similarity with the corresponding centered full pipe.
Exfiltration experiments were conducted in a test chamber made of 20 mm-thick glass. The chamber was 440 mm × 240 mm × 420 mm (length × width × height) in dimension. A camera was positioned outside the chamber to record the soil erosion process. Exfiltration was caused by a PVC (polyvinyl chloride) pipe with a 4 mm diameter circular fracture buried in the chamber. Additionally, there were a control valve and pressure gauge on the connecting pipe to ensure the water pressure in the connecting pipe met the experimental requirements (see Figure 3).
According to the design specification [37], a minimal soil cover thickness of 0.7 m above the pipe is required in motor vehicle lanes and 0.6 m in non-motor vehicle lanes. The cover thickness in the model test was designed as 220 mm, which correlated to a cover depth of 0.7 m with scale ratio n = 3.2. A circular fracture with a 4 mm diameter at the top of the pipe was adopted because fractures with other shapes can be transformed into circular fractures, as referred to in a prior study [38].
Water was supplied to the half-pipe through a connecting pipe which was 12 mm in diameter during the model test (see Figure 4). The interface between these two pipes is known as the hydraulic transition zone, and hydraulic properties change when water flows across the interface.
The pressure in the half-pipe at the initiation of exfiltration was equivalent to the pressure at the fracture, in accordance with the law of energy conservation. To determine flow velocity in the half-pipe under full-flow conditions, a pressure gauge was installed on the connecting pipe to measure the inlet pressure, and the flow velocity was calculated using the following equation:
u 2 = u 1 A 1 A 2
where A1 and A2 are the cross-sectional areas of the connecting pipe and the half-pipe, and u1 and u2 are the corresponding velocities in each pipe. The pressure within the half-pipe was calculated as follows:
P 2 = u 2 2 ρ g L C 2 R
where L is the half-pipe length, ρ is water density, g is gravity, and R is the hydraulic radius. C is the Chezy coefficient and is calculated by the Manning formula [39]:
C = 1 n R 1 6
where n is the roughness coefficient, which is influenced by the condition of the inner surface and the material of the pipe, and ranges between 0.009 and 0.033 for pipes [39]. In this study, n = 0.033 was selected for the half-pipe due to its large surface friction. Using the Manning formula, the Chezy coefficients for half-pipes with diameters of 63 mm, 50 mm, and 40 mm were calculated to be 4.125, 3.968, and 3.821 m / s .
Inlet pressures of 0.10 MPa, 0.14 MPa, and 0.18 MPa were measured using a pressure gauge. These pressures corresponded to connecting pipe flow velocities of 1 m/s, 2 m/s, and 3 m/s. The flow velocities and pressures in three half-pipes with different diameters were determined using Equations (5) and (6). The calculated results are presented in Table 1.

2.3. Test Materials and Parameters

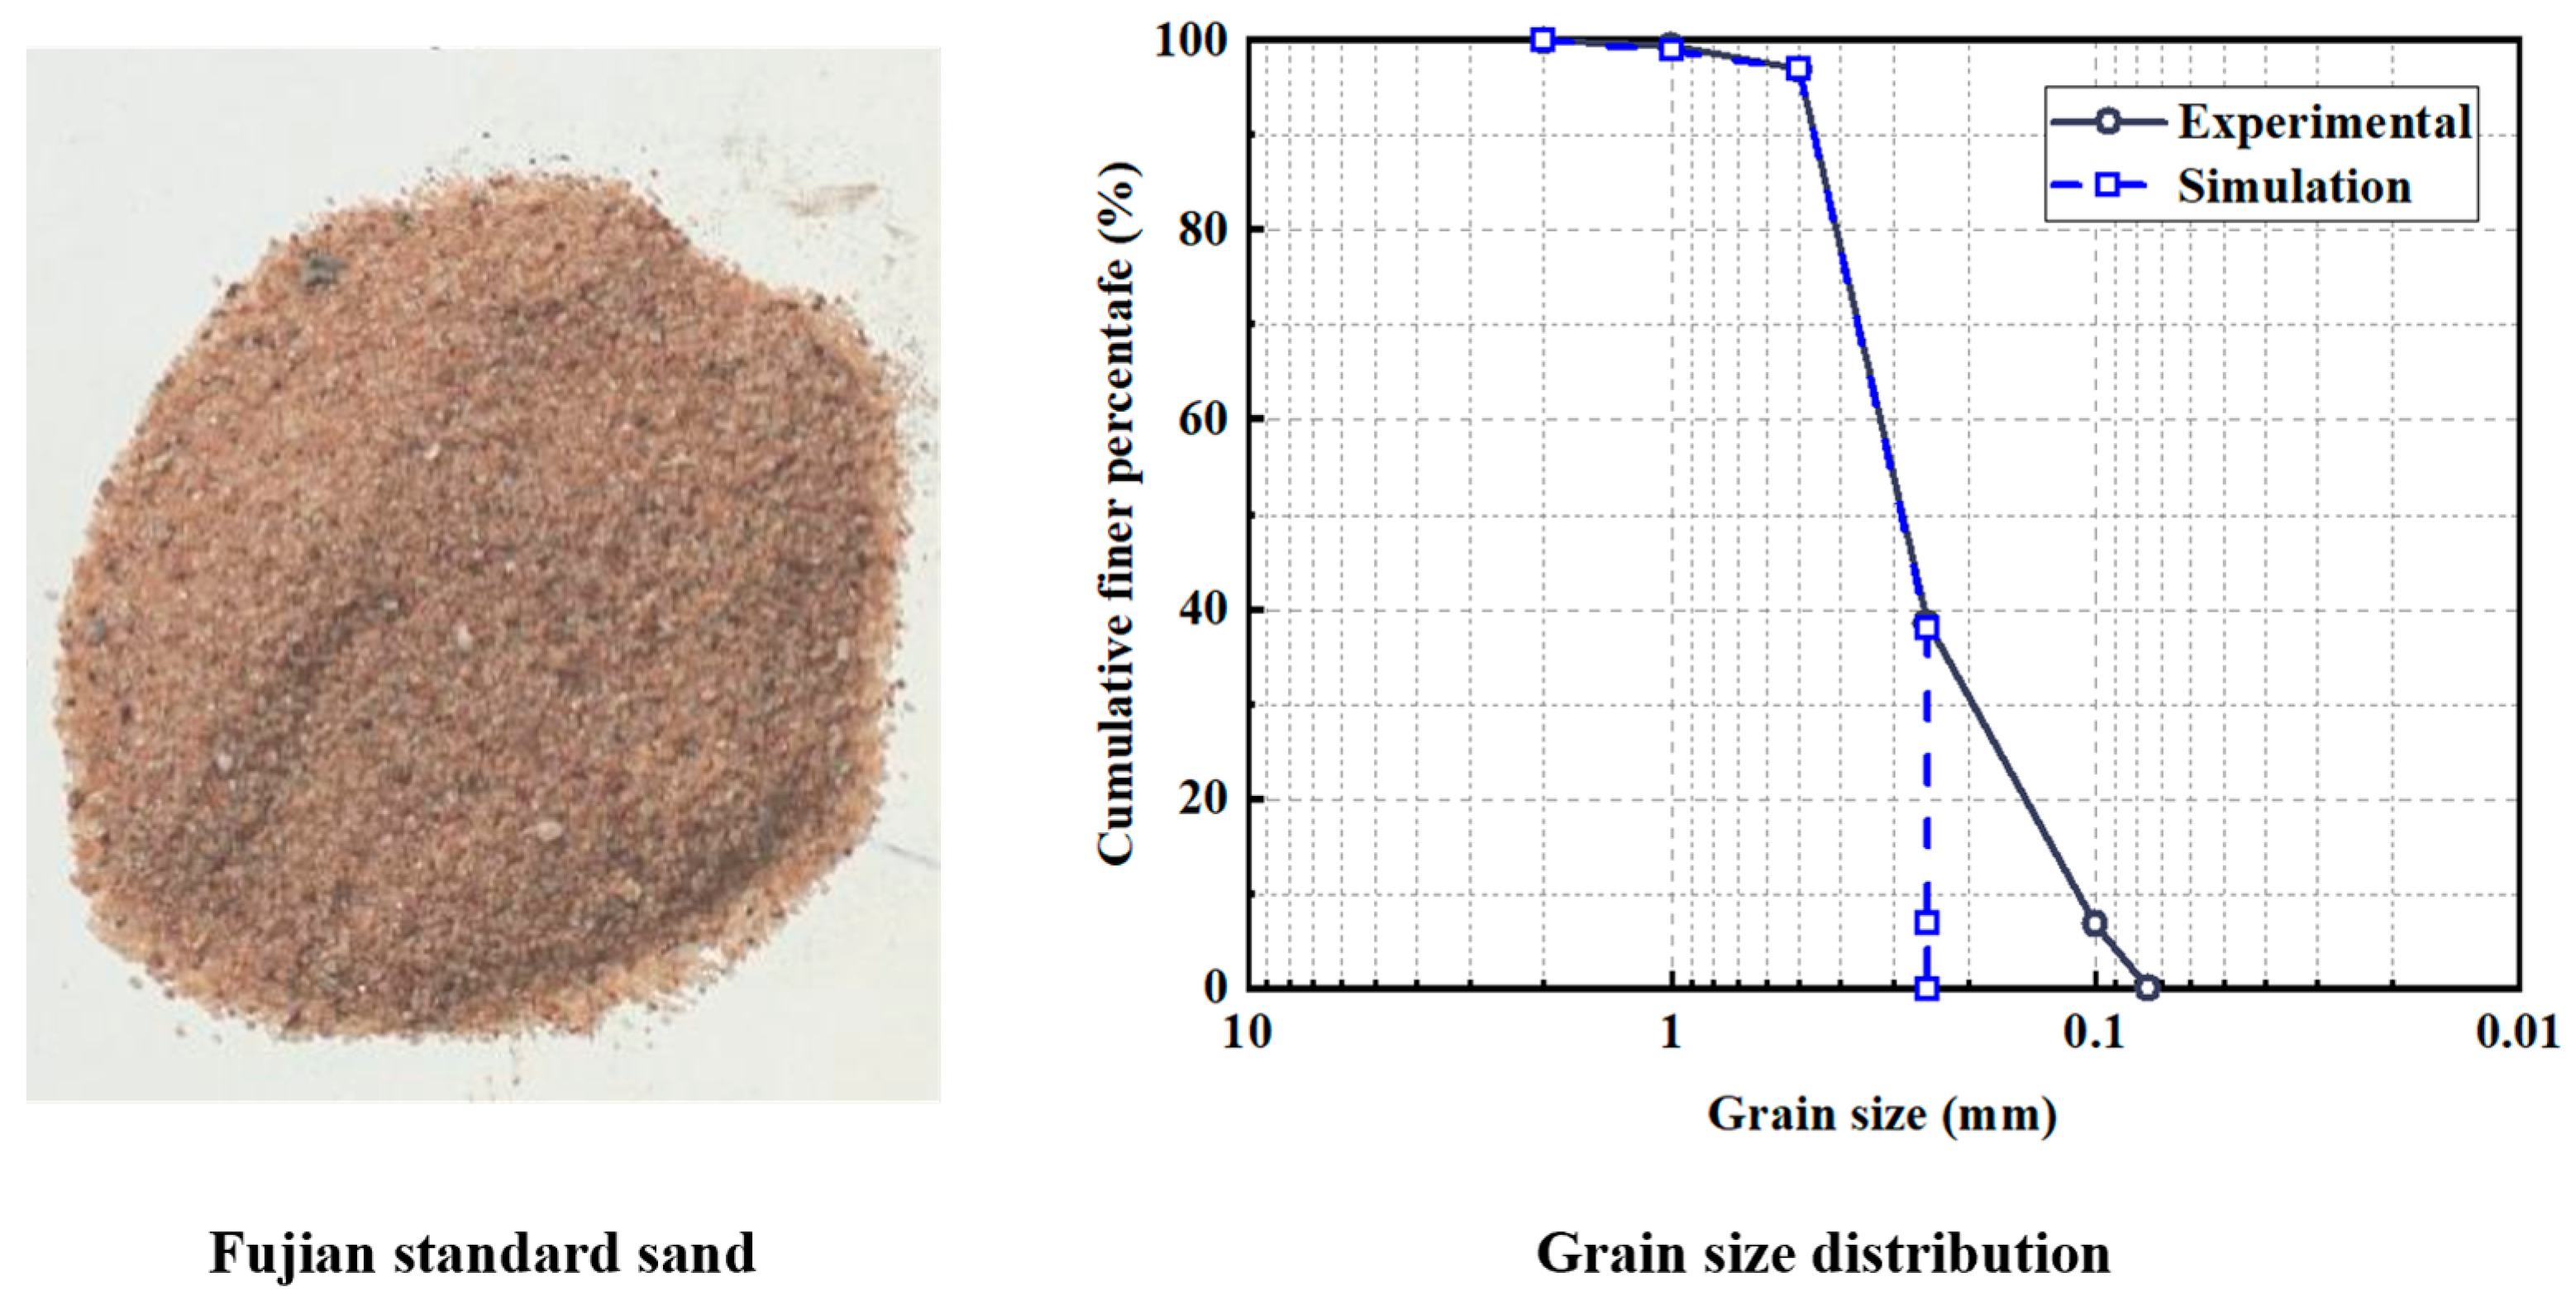
The testing materials were Fujian standard sand, which was classified as poorly graded fine sands via sieve tests (refer to Figure 5) [40]. Grain size distribution parameters were determined from five replicate sieve analyses with standard deviations not exceeding ±0.025 mm for d 60 and ±0.008 mm for d 10 . The hydraulic conductivity was determined by permeability tests, while the internal friction angle and cohesion were determined by shear tests. Table 2 summarized the physical and mechanical properties that resulted.
Before the model tests, the sand was pluviated into the testing chamber in five layers with a pluviation height of 50 cm. Each layer was compacted and leveled (25 blows per layer, 2.5 kg hammer, and a drop distance of 300 mm). The compaction procedure achieved a target relative density of D r   =   65 ± 3 % , representing medium-dense sand conditions with γ   =   19.1 ± 0.3   kN / m 3 . Then, the soils sat for 24 h before testing.
Under the condition of an overlaying soil thickness of 220 mm, the effects of pipe diameter and water pressure on soil erosion were studied, and test parameters are shown in Table 3.

3. Analyses on Test Results

3.1. Influence of Water Pressure

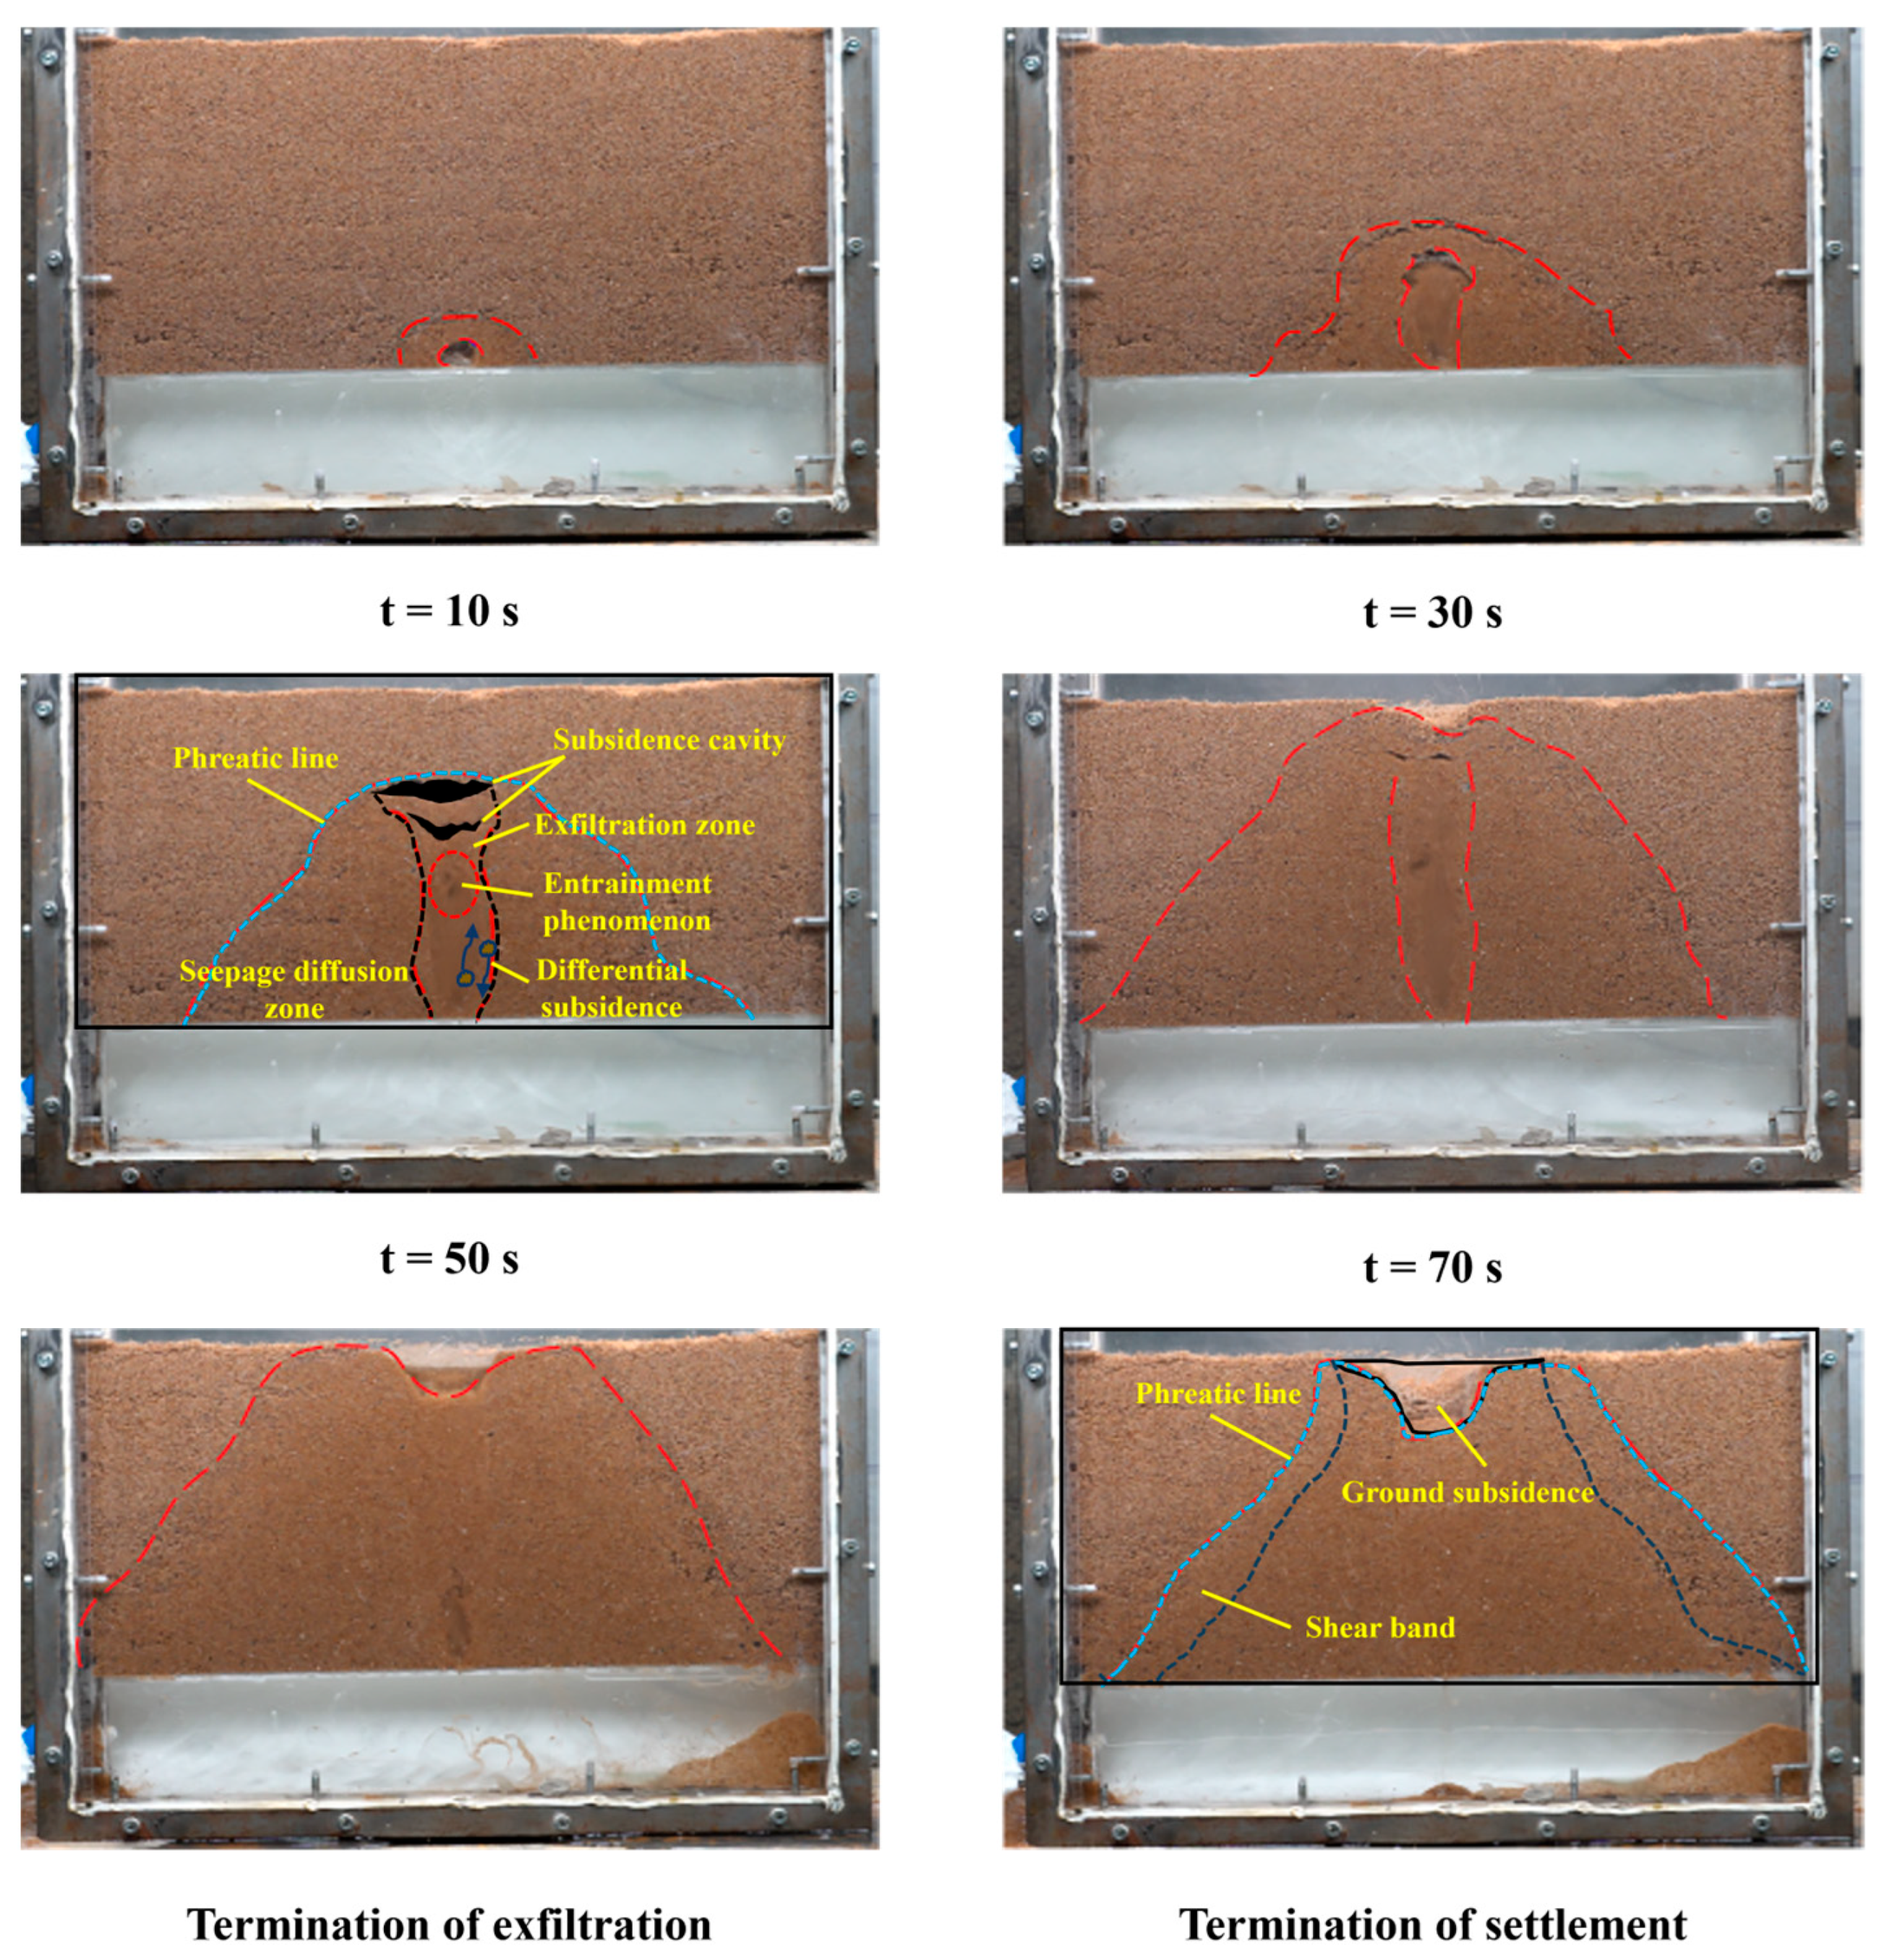
Figure 6 shows the soil erosion process for Test 1. Two distinct zones were observed during the exfiltration process, the exfiltration zone and the seepage diffusion zone. Within the exfiltration zone, an entrainment phenomenon occurred in the lateral section, while a vortex-induced soil–water mixture formed in the middle section due to resistance from the soil During the erosion process, a subsidence cavity formed between exfiltration zone and seepage diffusion zone at t = 50 s. The phreatic line reached the ground surface at t = 70 s, inducing slight ground subsidence. Subsequently, the exfiltration extended to the ground surface, resulting in the disappearance of the subsidence cavity. This phenomenon indicated that the formation of the subsidence cavity was influenced by the erosion height. The cavity manifested at the interface between the exfiltration and seepage diffusion zones and diminished as the exfiltration zone reached the ground surface.
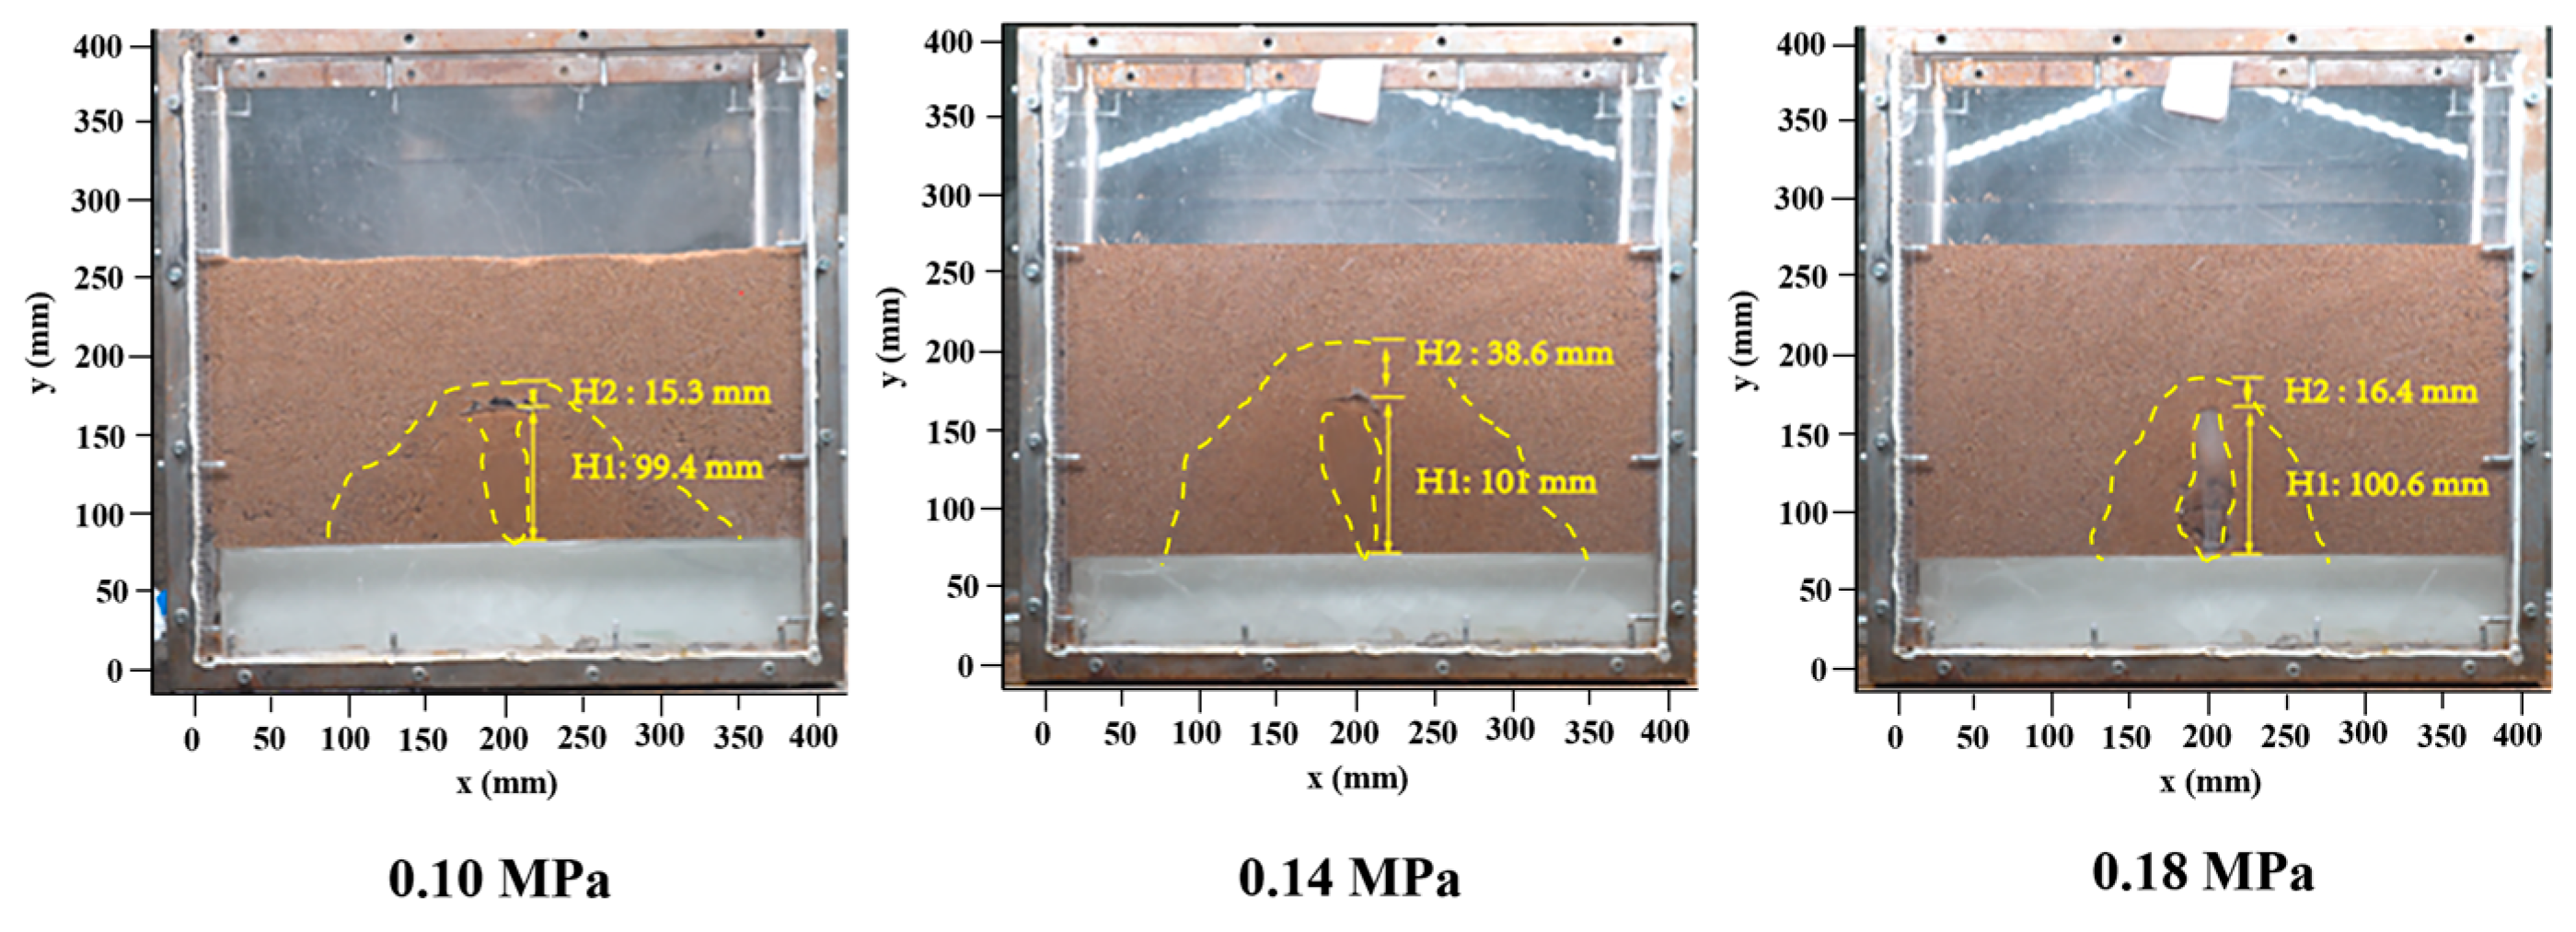
To evaluate the impact of flow pressure on erosion, the pipe diameter was kept at 63 mm and the overlaying thickness was kept at 220 mm during the tests, with different flow pressures of 0.10 MPa, 0.14 MPa, and 0.18 MPa (see Table 1). Soil erosion was influenced by flow pressure at an exfiltration height of approximately 100 mm (see Figure 7). At a flow pressure of 0.18 MPa, the highest erosive energy was observed, creating a slender water column that closely followed the exfiltration line. This resulted in a height difference of 16.4 mm between the exfiltration and seepage diffusion zones. When the pressure decreased to 0.14 MPa, the water column disappeared, and the exfiltration zone developed into a water–soil mixture. Consequently, the height difference increased to 38.6 mm, which enlarged the expansion of the seepage diffusion zone. At 0.10 MPa, the height difference dropped to 15.3 mm because the low pressure was not strong enough to support the weight of the soil, causing the soil particles to settle and blurring the boundary of exfiltration and seepage diffusion zones.
Flow pressure influenced both the timing and mode of ground collapse and soil erosion (refer to Figure 8). The collapse occurred at 70 s under a pressure of 0.10 MPa. At the exfiltration zone, a water–soil mixture formed, leading to a ground collapse at 65 s with a pressure of 0.14 MPa. Lateral seepage pressure was driven by the counter-vertical pressures of soil, which converted exfiltration vertical pressures into horizontal ones. A collapse occurred in just 55 s at 0.18 MPa, which was attributed to increased flow pressure; a larger flow pressure created a slender column, enhanced vertical erosion, and diminished lateral diffusion. The collapse times for a prototype pipe with a 200 mm diameter buried 700 mm deep were approximately 125 s, 116 s, and 98 s, with a standard deviation of less than 5.
The erosion velocity was characterized by an exponential decay model described by the following equation ( R 2 > 0.89 ):
v t = v 0 e α t
where v 0 represents the initial velocity and α denotes the decay constant. The values of v 0 were 5.2 mm/s, 7.8 mm/s, and 9.4 mm/s at inlet pressures of 0.10 MPa, 0.14 MPa, and 0.18 MPa, respectively. The decay rate α remained nearly constant across the experiments, but it varied at different inlet pressures. Initially, the seepage diffusion zone eroded at a higher rate than the exfiltration zone, as illustrated in Figure 9. Despite local fluctuations, all curves gradually decreased over time. These findings suggest that the fundamental erosion process is not influenced by the increase in initial flow pressure, as hydraulic forces diminish uniformly as erosion progresses.

3.2. Influence of Pipe Diameter

The flow pressure distribution and the subsequent erosion patterns were significantly influenced by the pipe diameter. Because of their different cross-sectional areas, smaller diameters resulted in higher flow pressures when subjected to a constant inlet pressure of 0.10 MPa. (refer to Table 1).
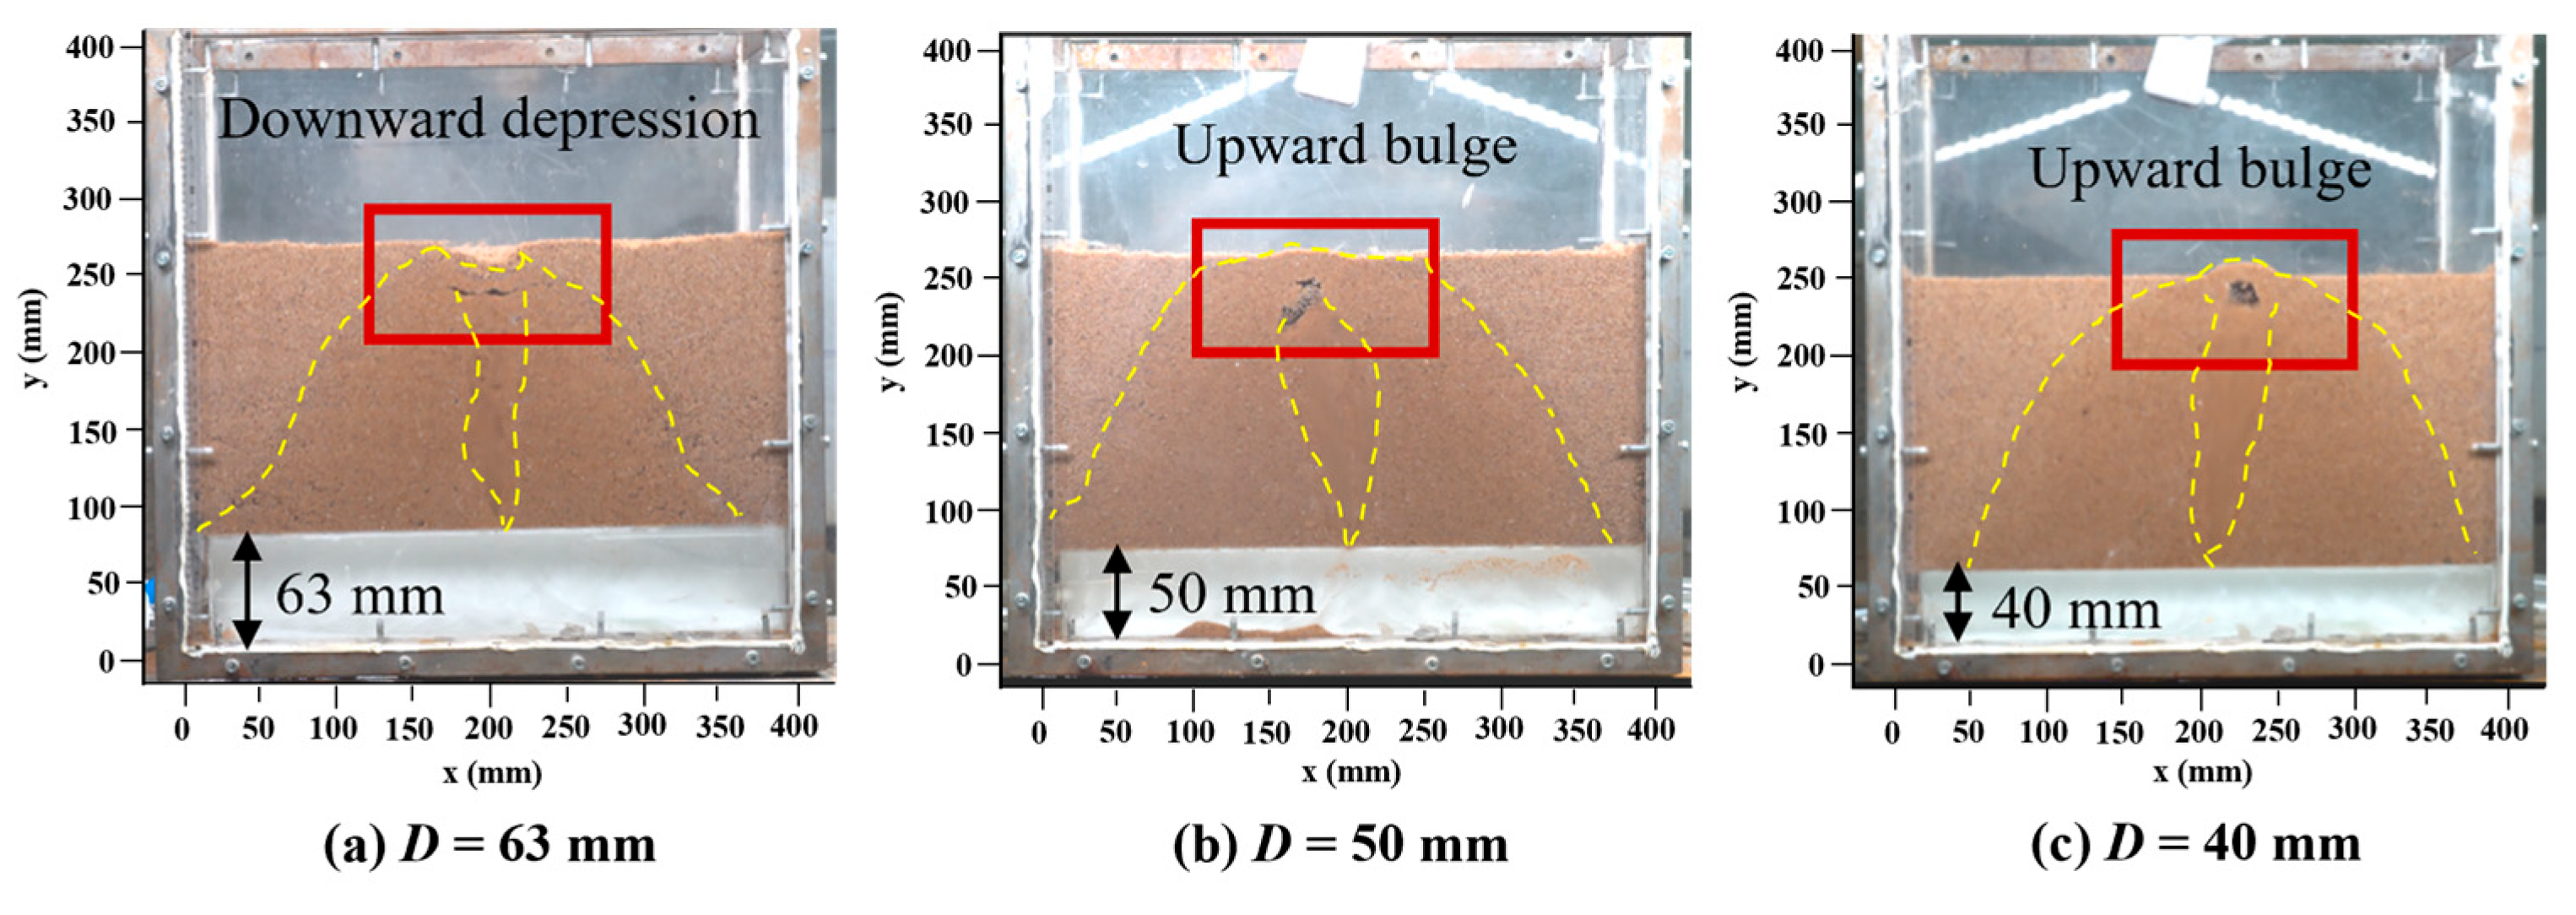
In Figure 10, the flow pressure was not strong enough to lift soil when the pipe diameter was 63 mm, causing the ground to sink and a crack to form at the edge of the exfiltration zone. By reducing the pipe diameter to 50 mm, both the flow pressure and exfiltration force increased, resulting in a different erosion mode that generated an upward arch under balanced conditions. The highest pressure occurred at 40 mm, causing rapid vertical erosion and noticeable ground surface bulging, with breakthrough occurring 30% sooner than at 63 mm. These findings show a shift in how soil erosion happens in different pipe diameters, transitioning from the ground sinking to bulging. This phenomenon is related to the reduction in pipe diameter, which caused increased flow pressure and flow velocity.
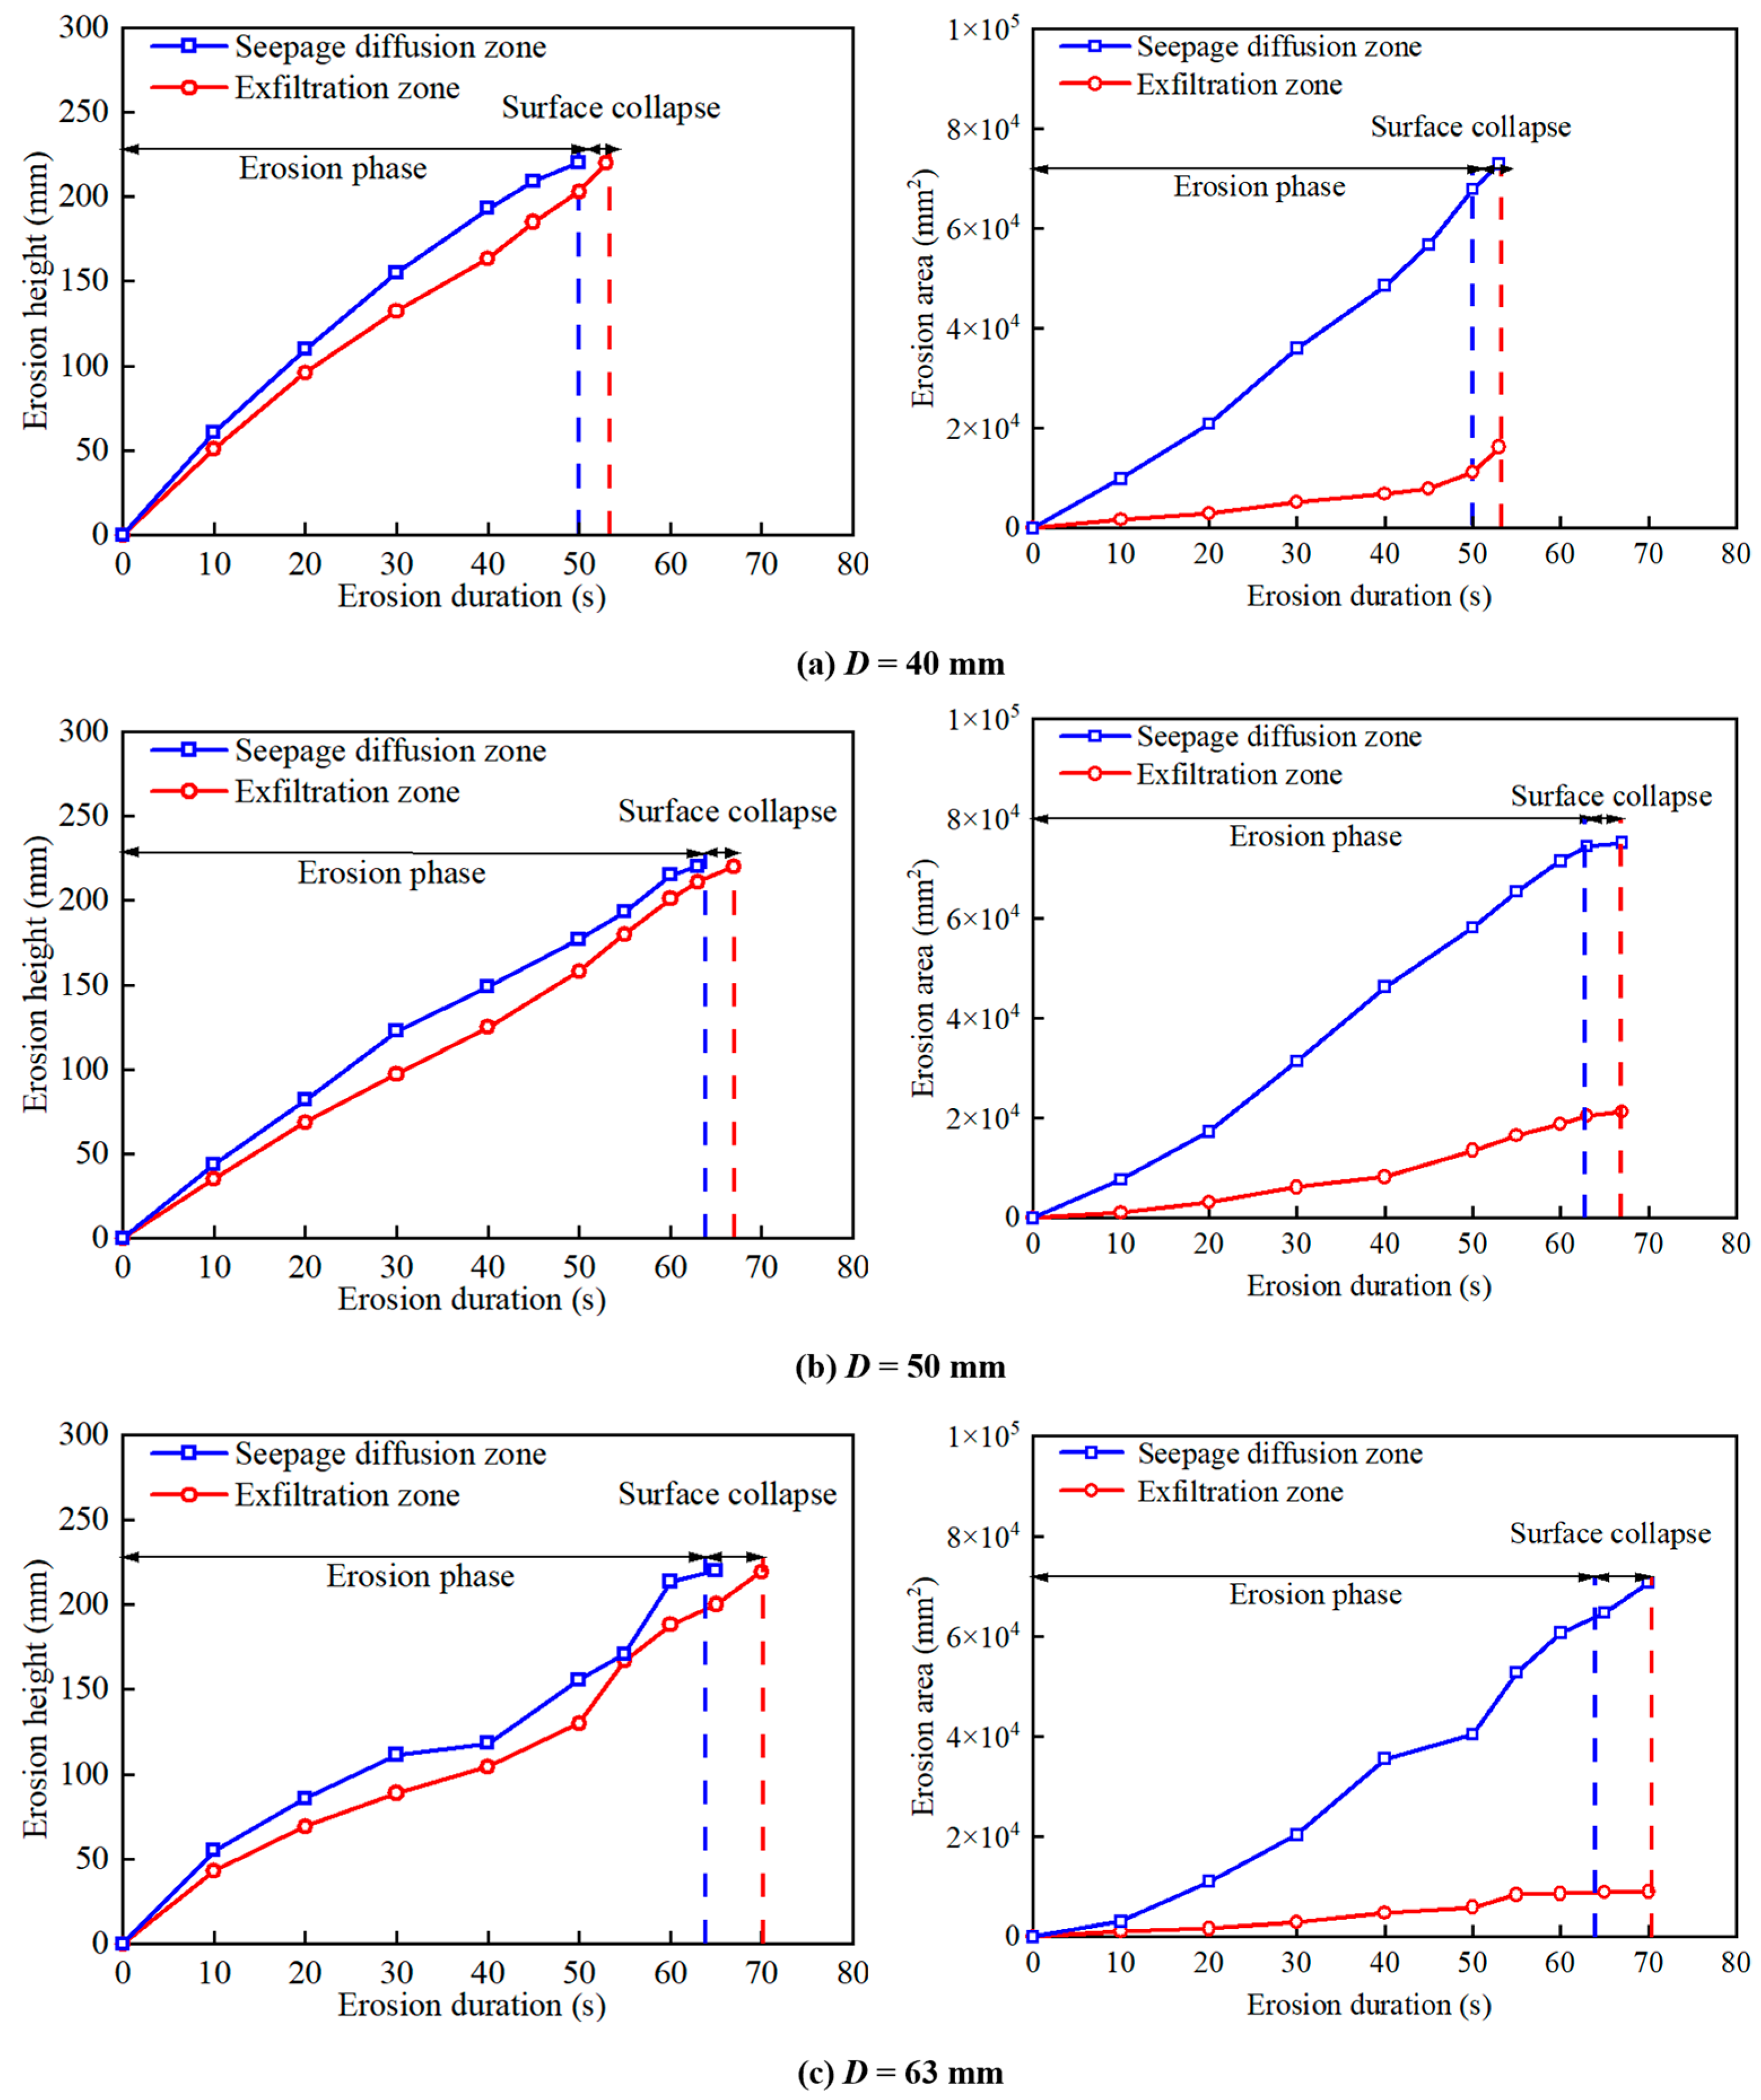
Figure 11 shows that the height and area of erosion in the seepage diffusion and exfiltration zones for all three half-pipe sizes (63 mm, 50 mm, and 40 mm) gradually increase over time. Erosion is accelerated by smaller diameters: the seepage water reached the ground surface at 65 s, 63 s, and 50 s for the 63 mm, 50 mm, and 40 mm pipelines, respectively. Only the exfiltration zone continued to develop until it reached the point of surface collapse. The maximum eroded area remained virtually the same across all pipe diameters, but the erosion area continued to expand during the surface collapse stage. This mode was indicative of the equilibrium between pore-water pressure and soil resistance. Narrower pipes concentrate flow, which increases local seepage forces and accelerates soil displacement. Conversely, the total volume of erosion was determined by the soil property and critical hydraulic gradient.
Figure 12 compares the evolution of erosion rates in two zones across three different pipe diameters. In all instances, the erosion rate decreased steadily over time; however, the seepage diffusion zone eroded slightly faster, and its erosion rate declined more rapidly than that of the exfiltration zone. Initially, the 40 mm pipe produced the highest velocities—approximately 6 mm/s in the exfiltration zone and 7 mm/s in the seepage zone, while the 50 mm pipe showed intermediate velocities and the 63 mm pipe had the lowest velocities, roughly 4 mm/s and 5 mm/s, respectively. This deceleration occurred because, as erosion progressed, the flow path lengthened and the local hydraulic gradient fell.

4. Numerical Simulation

The erosion of soil particles due to exfiltration from a damaged water-supply pipe involves complex interactions between continuous fluid dynamics and discrete soil particles. The erosion process can be examined using the CFD-DEM coupling method, which focuses on fluid flow and particle mechanics. In numerical simulation, soil was represented as discrete particles with defined interparticle contact behaviors, while computational fluid dynamics (CFD) simulates the seepage forces acting on the soil particles. This framework allowed for the exploration of the micro-mechanisms that govern cavity formation and subsequent soil displacement.

4.1. Model Setup

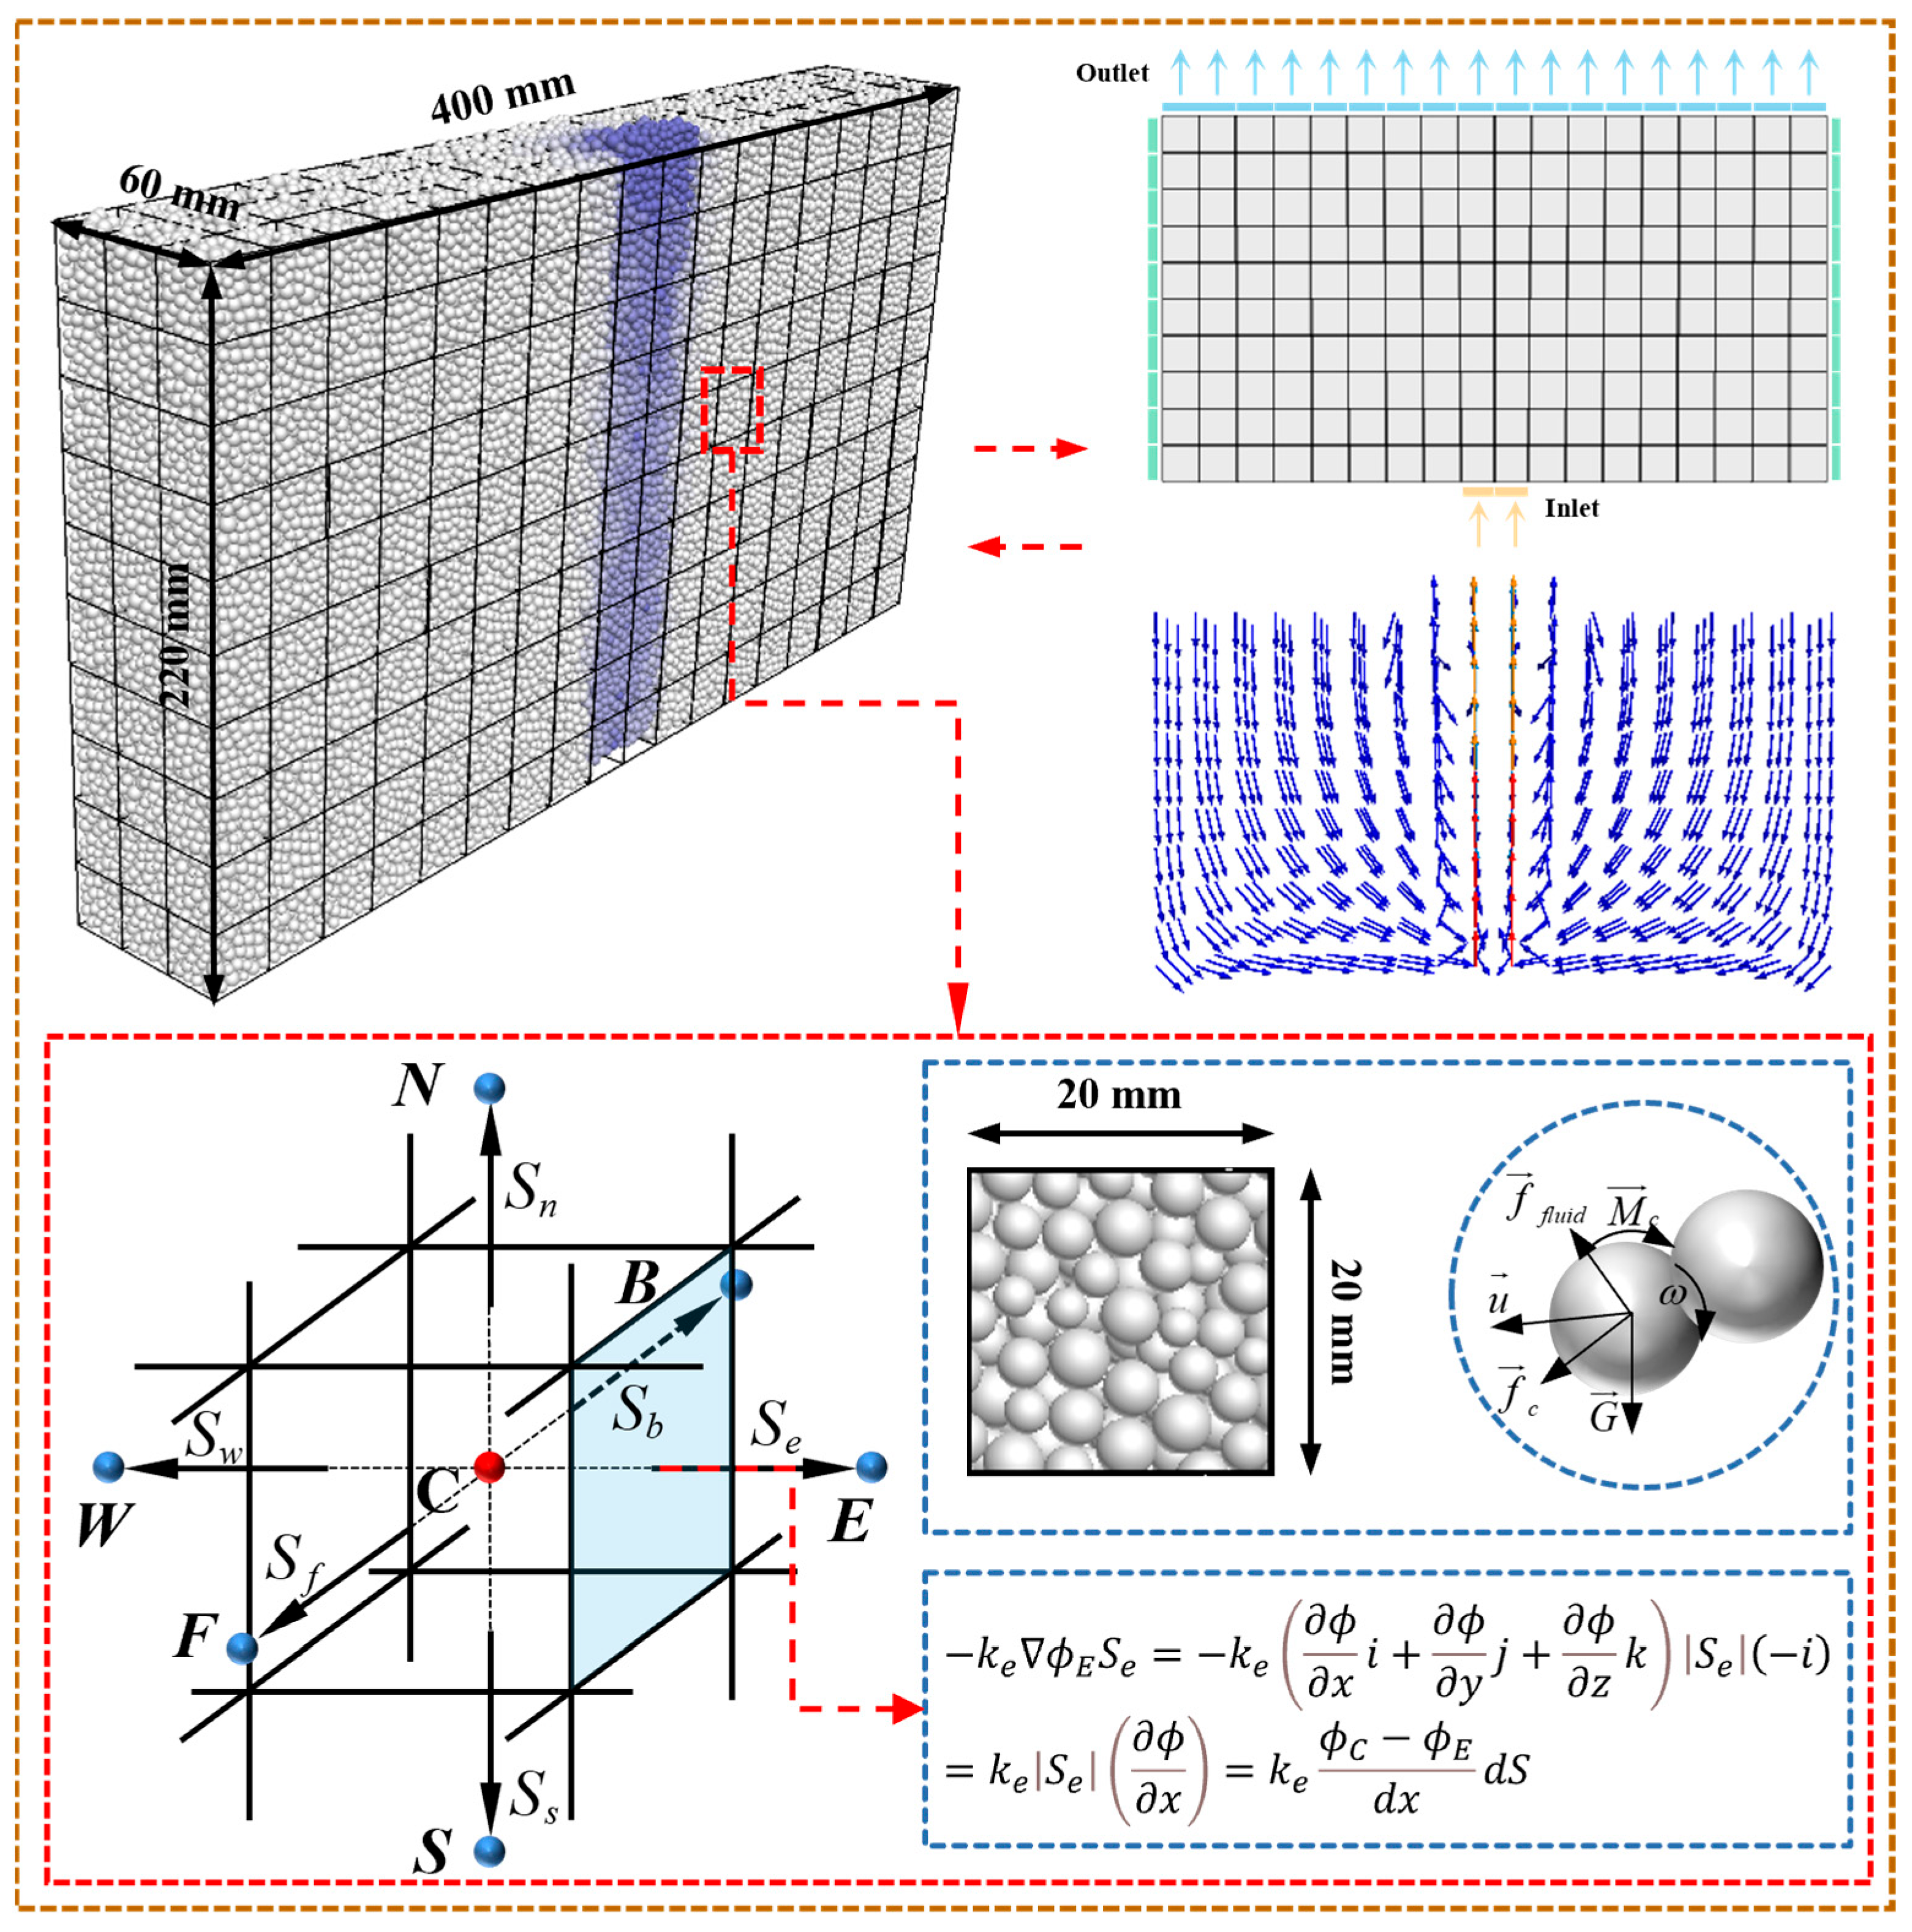
The numerical model incorporated soil-layer dimensions that matched the soil layer thickness used in model tests, measuring 400 mm × 60 mm × 220 mm (see Figure 13). To minimize particle size effects, the diameter of the circular fracture was set to 10 mm. The numerical model featured a sand particle size distribution that aligned with laboratory grain size curves (refer to Figure 5). A minimum particle diameter of 0.25 mm was established to improve computational efficiency while maintaining physical accuracy, as size effects were determined to be negligible when the average particle diameter was less than 1/30 of the model dimensions [41].
The mechanical behavior of sand particles is governed by Newton’s laws of motion, using the rolling resistance linear contact model. The contact model incorporated both translational and rotational resistance mechanisms, which were important for the accurate simulation of sand particle behavior. The numerical models were implemented through the Particle Flow Code (PFC) [42]. The translational motion equation for individual particles was expressed as follows (see Figure 13):
m p d u p d t = f c + f f l u i d + G
where G denoted gravity, u p represented the particle velocity vector, f c indicated the inter-particle contact forces, and f f l u i d represented the exfiltration-induced forces from fluid flow. The rotational motion was governed by the angular momentum equation:
I p d ω d t = M c o n t a c t + M r o l l i n g
where I p represented the moment of inertia about the particle centroid, ω denoted the angular velocity vector, M c o n t a c t indicated the contact torque from particle interactions, and M r o l l i n g represented rolling resistance moments at contact points.
The microparameters of the sand particles were calibrated using consolidated drained triaxial tests to ensure consistent stress–strain behavior and strength parameters between experimental and numerical results [43]. The resulting microparameters are presented in Table 4.
The fluid phase was governed by the continuity equation and the momentum equation:
· ρ v = 0
ρ v t + · ρ v v = p + · τ + ρ g + F p
where ρ is the water density, v is the velocity, p is the flow pressure, τ is the viscous stress tensor, g is gravity, and F p is the interaction force between soil particles and the fluid.
The fluid domain was first solved in ANSYS Fluent 19.2 and subsequently incorporated into the CFD module in PFC. The equations provided in Figure 13 were used to determine the volumetric flux across meshes. The side boundaries of the model were subjected to symmetry conditions, while the circular fracture functioned as a pressure inlet and the ground surface as the outlet. Additionally, all other boundaries were established as impermeable. Water entering from the fracture eroded soil particles during each coupled time step, and the resulting particle motion was transmitted back into the flow field. The seepage force was unable to surpass the self-weight of soil, resulting in the flow beside the fracture turning downward while the flow above the fracture moved upward under the erosion pressure.
Based on energy conservation, we assumed that, at the instant of exfiltration, the pressure in the pipe equaled the exfiltration pressure at the fracture. In tests, we examined how inlet pressure and pipe size affected soil erosion and found that both factors simply changed the pressure in the pipe. Therefore, the numerical model focused on pressure-driven erosion only. Using the hydraulic transition formula, we calculated the exfiltration pressures for the 63 mm half-pipe at inlet pressures of 0.10 MPa and 0.14 MPa; the results were 2.122 × 10⁻³ MPa and 8.320 × 10⁻³ MPa.

4.2. Influence of Water Pressure

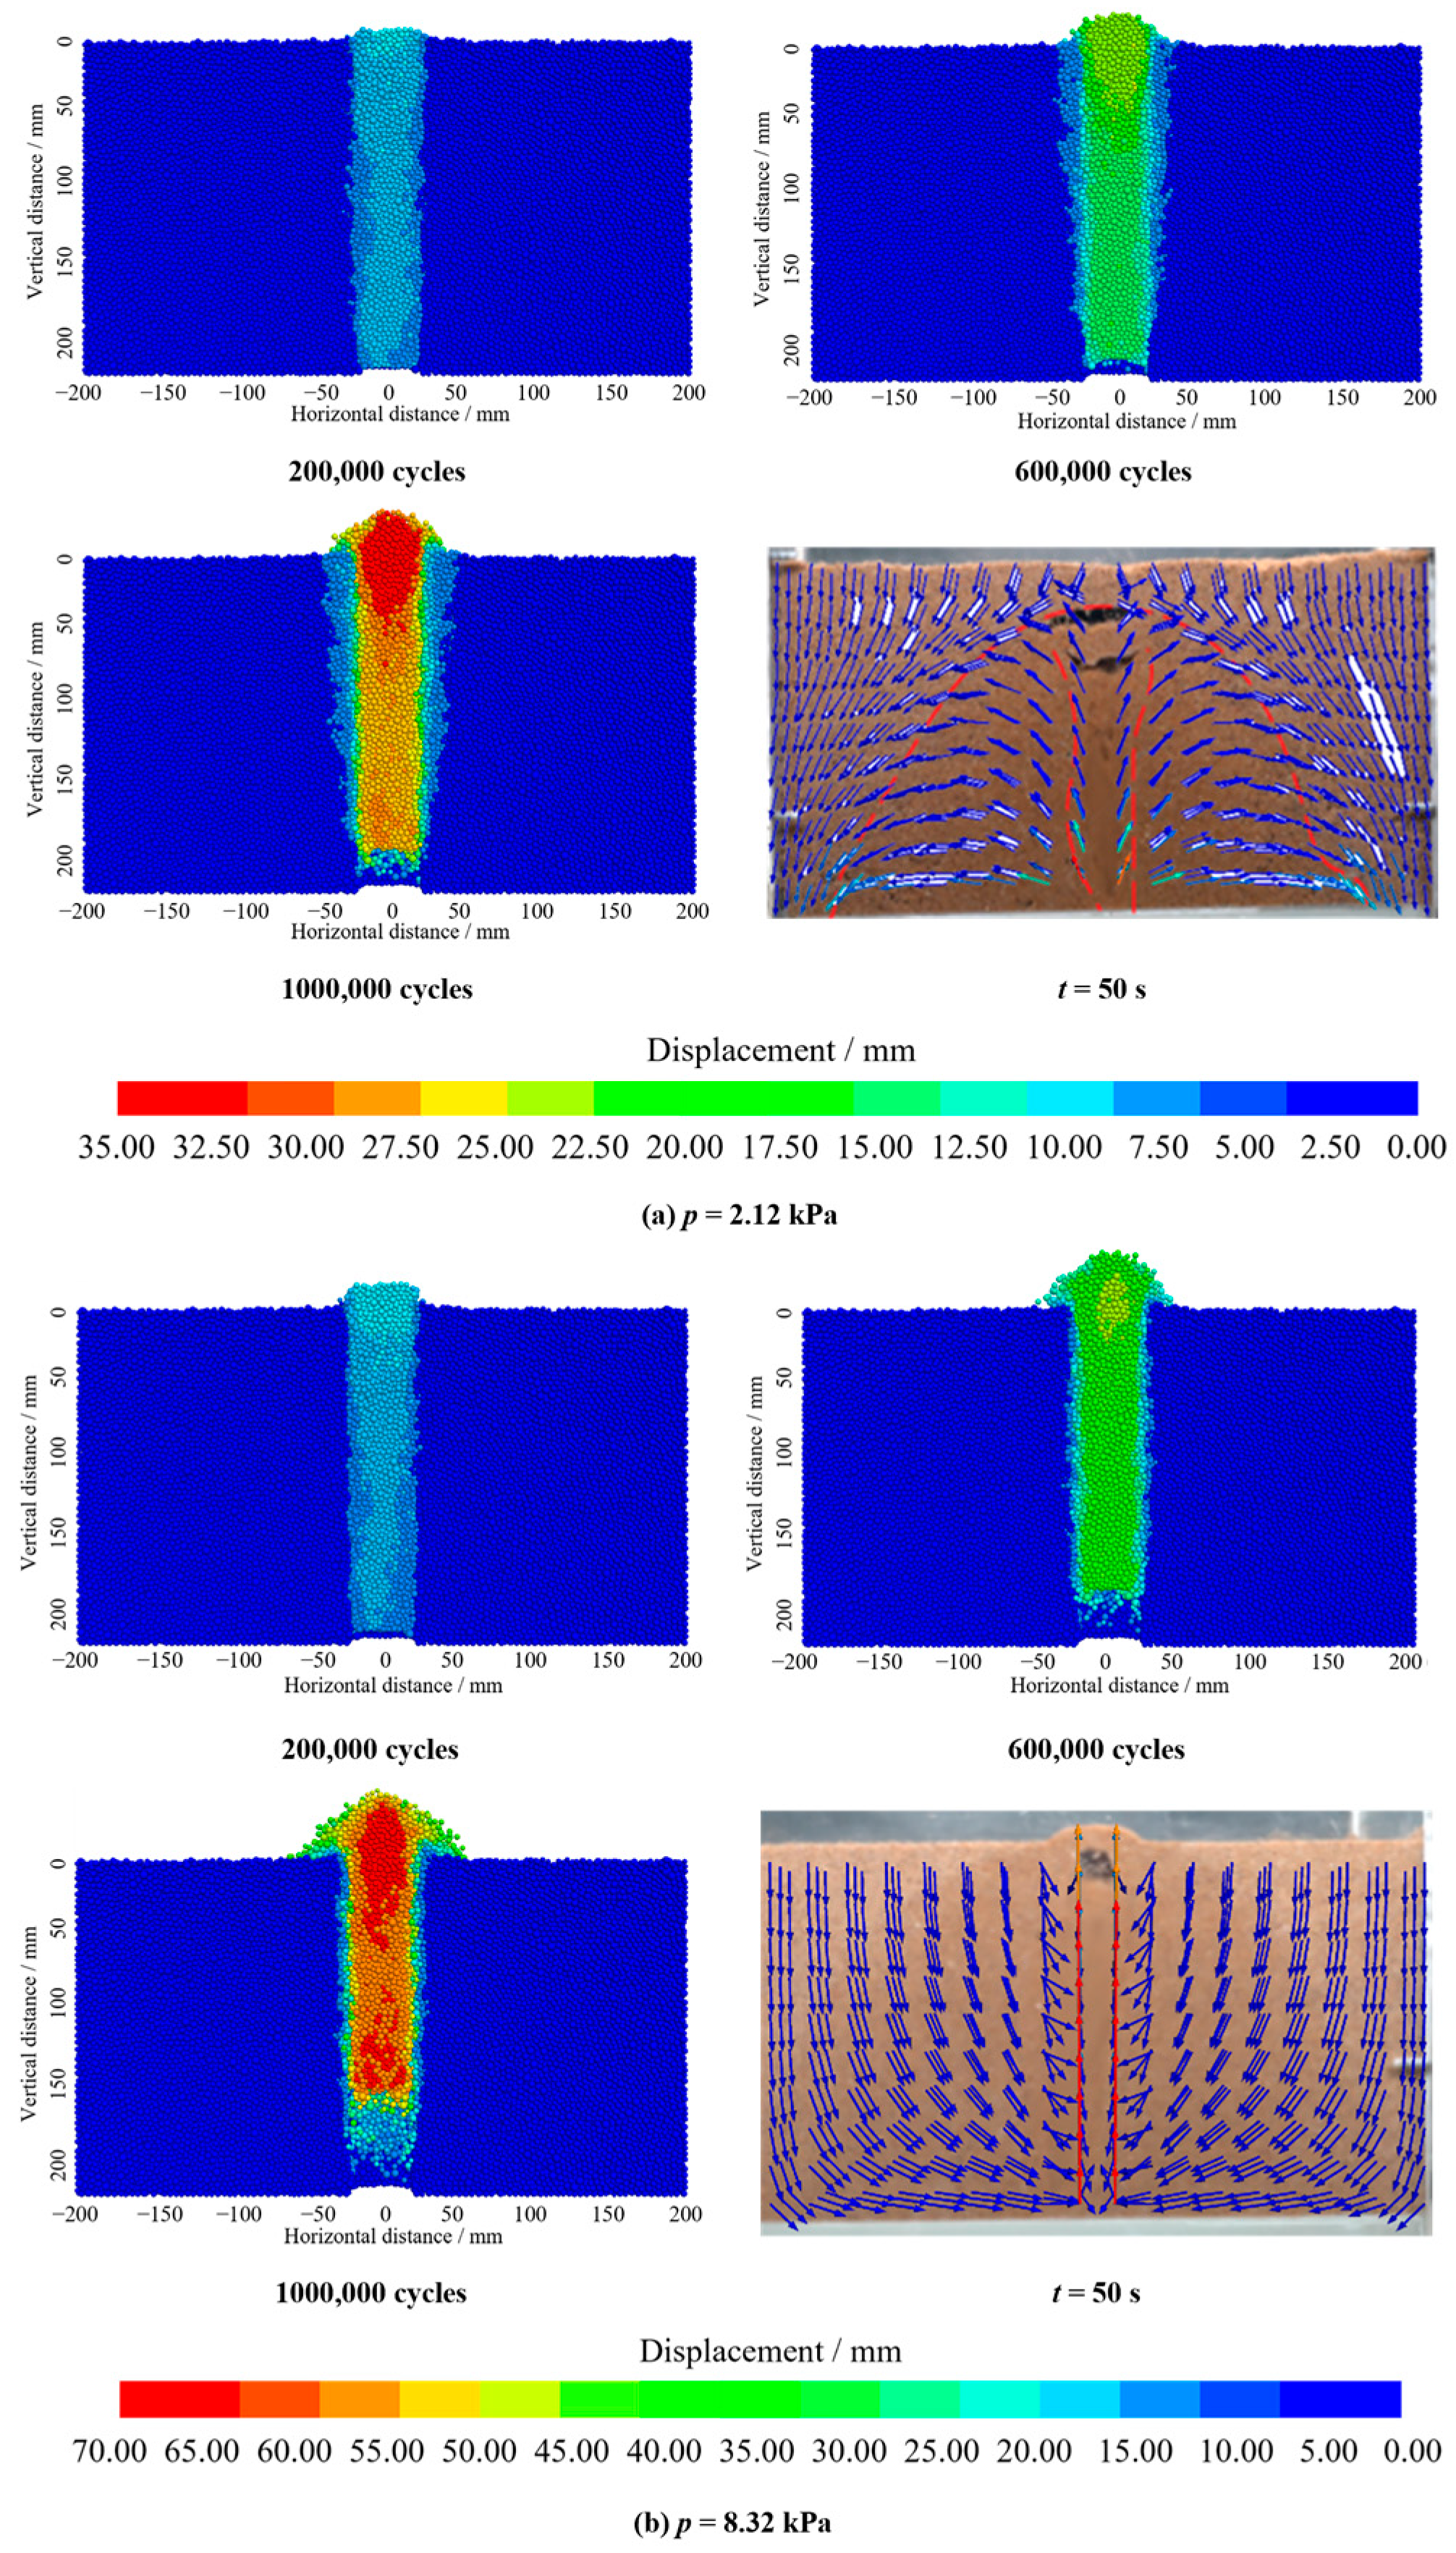
Figure 14 illustrates the differences in soil displacement and flow patterns under low versus high exfiltration pressures. Under 2.12 kPa (Figure 14a), particle movement spread slowly. The cavity deepened primarily due to the exfiltration fracture occurring between 200,000 and 1,000,000 cycles, resulting in a broad, moderately displaced soil zone. The flow vectors at t = 50 s were diffuse, indicating a progression toward a balance between exfiltration force and soil gravity. In contrast, at 8.32 kPa (Figure 14b), a narrow, deep cavity with pronounced vertical soil displacement was observed even at 200,000 cycles. The sharp change in the color of the displacement values between the exfiltration zone and the seepage diffusion zone indicated that the exfiltration flow became more focused under high exfiltration pressures, resulting in a concentrated area of erosion. These phenomena suggested that increased exfiltration pressure accelerated localized erosion, restricted lateral diffusion, and centralized the flow in one area. Additionally, the upward bulging and arching of the ground surface resembled the uplift seen in Figure 10c. This observation implies that the influence of high exfiltration pressure gradually accumulates soil mass at the ground surface.
The simulated results aligned with the experimental exfiltration behavior and flow direction in the seepage zone. However, a bulge observed on the ground surface in the simulation did not correspond with the findings under low-pressure conditions. This discrepancy stemmed from the limitations of the numerical model, which inhibited soil particles from escaping through boundary gaps, resulting in their upward displacement instead. The arrangement and distribution of particle sizes in the simulation restricted smaller soil particles’ ability to navigate through the voids between larger particles. This limitation led to an overall upward movement of particles above the fracture, driven by exfiltration forces. In the experimental setup, soil particles could escape through the pipe fracture and the model boundary gaps, a factor not accounted for in the simulation. The uneven particle distribution and the seepage conditions observed in the model tests caused a redistribution of particles. Smaller particles migrated into the voids between larger ones, which diminished the bulging effect on the ground surface. Additionally, in the simulation, the formation of erosion cavities near the fracture induced lateral particle displacement, filling the voids among larger particles rather than being partially absorbed by the damaged water-supply pipe.
The force-chain patterns observed at 2,000,000 cycles under different pressures are presented in Figure 15. Regions characterized by dense particle contact and high contact force are indicated by dark bands. Under low pressure, the color of force chains gradually spread along the boundary of the cavity and the seepage path, appearing as a lighter color that reflected a more gradual stress transfer. In contrast, high pressure produced darker, more concentrated force chains in the same area, indicating stronger and longer contact force chains.
The strongest force chains were observed at the top boundary of the cavity and along the seepage diffusion path in both cases, suggesting that particle contacts were affected by both the flow direction and soil stress. The cavity expanded during the exfiltration process and contained no force chains within it. However, at the periphery of the cavity, the force chains intensified and darkened, indicating that particles were displaced by flow force and became sufficiently dense to resist further washout by forming frictional contacts and interlocking. The observations confirmed that hydraulic pressure redistributed stress by rearranging soil particles along the flow path.
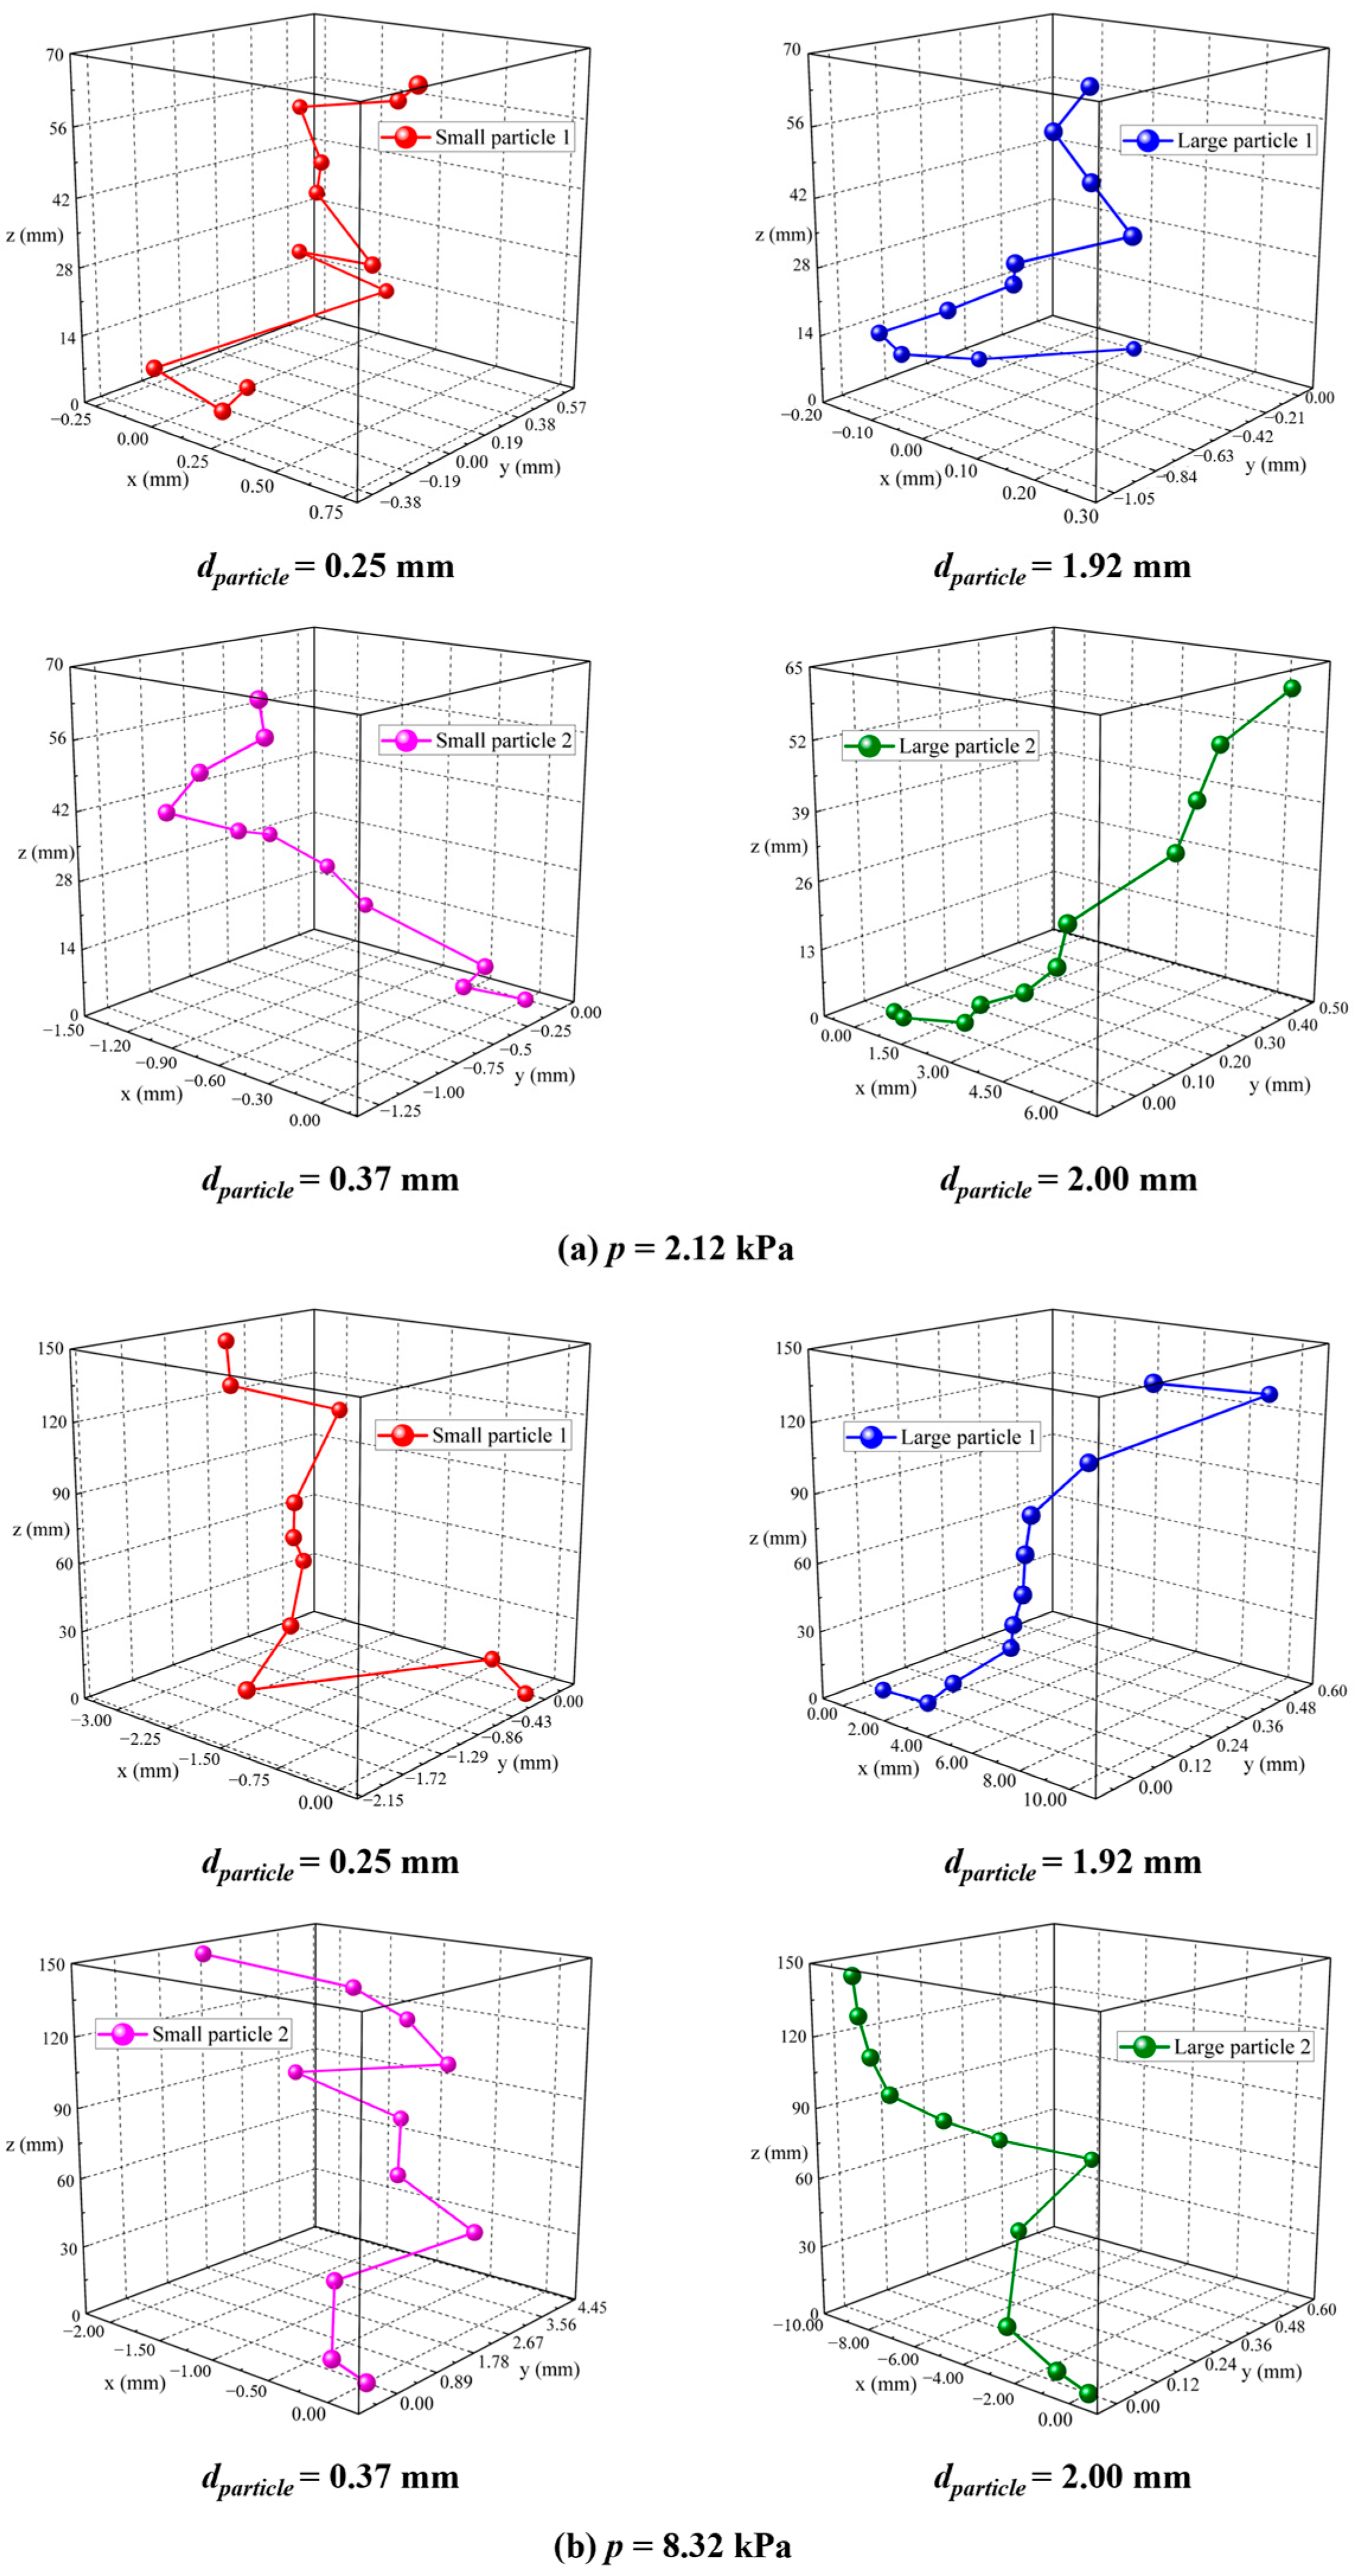
Figure 16 illustrates how flow pressure influences soil-particle trajectories. At a pressure of 2.12 kPa, particles followed complex, curved paths with significant lateral spread. Here, exfiltration forces were partially counteracted by soil gravity and interparticle friction, allowing smaller particles to navigate through voids and disperse widely, particularly near the cavity. Larger particles, owing to their greater inertia and limited ability to move between voids, displayed similar but shorter, smoother paths. When the pressure increased to 8.32 kPa, the trajectories became more vertical and linear, and the maximum uplift rose to approximately 150 mm, compared to 70 mm at the lower pressure. The stronger exfiltration force overcame gravity and boundary effects, leading to reduced path curvature and horizontal diffusion. Particles began to move in a focused stream aligned with the flow path, indicating a shift from distributed to concentrated transport. These findings reflect the balance between exfiltration forces and resisting forces within granular media. At lower pressures, factors such as seepage, gravity, particle friction, interlocking, and boundary interactions collectively influenced erratic particle paths. As the pressure increased, seepage forces became predominant, diminishing the impact of other factors and resulting in more predictable, streamlined motion along the primary flow direction.
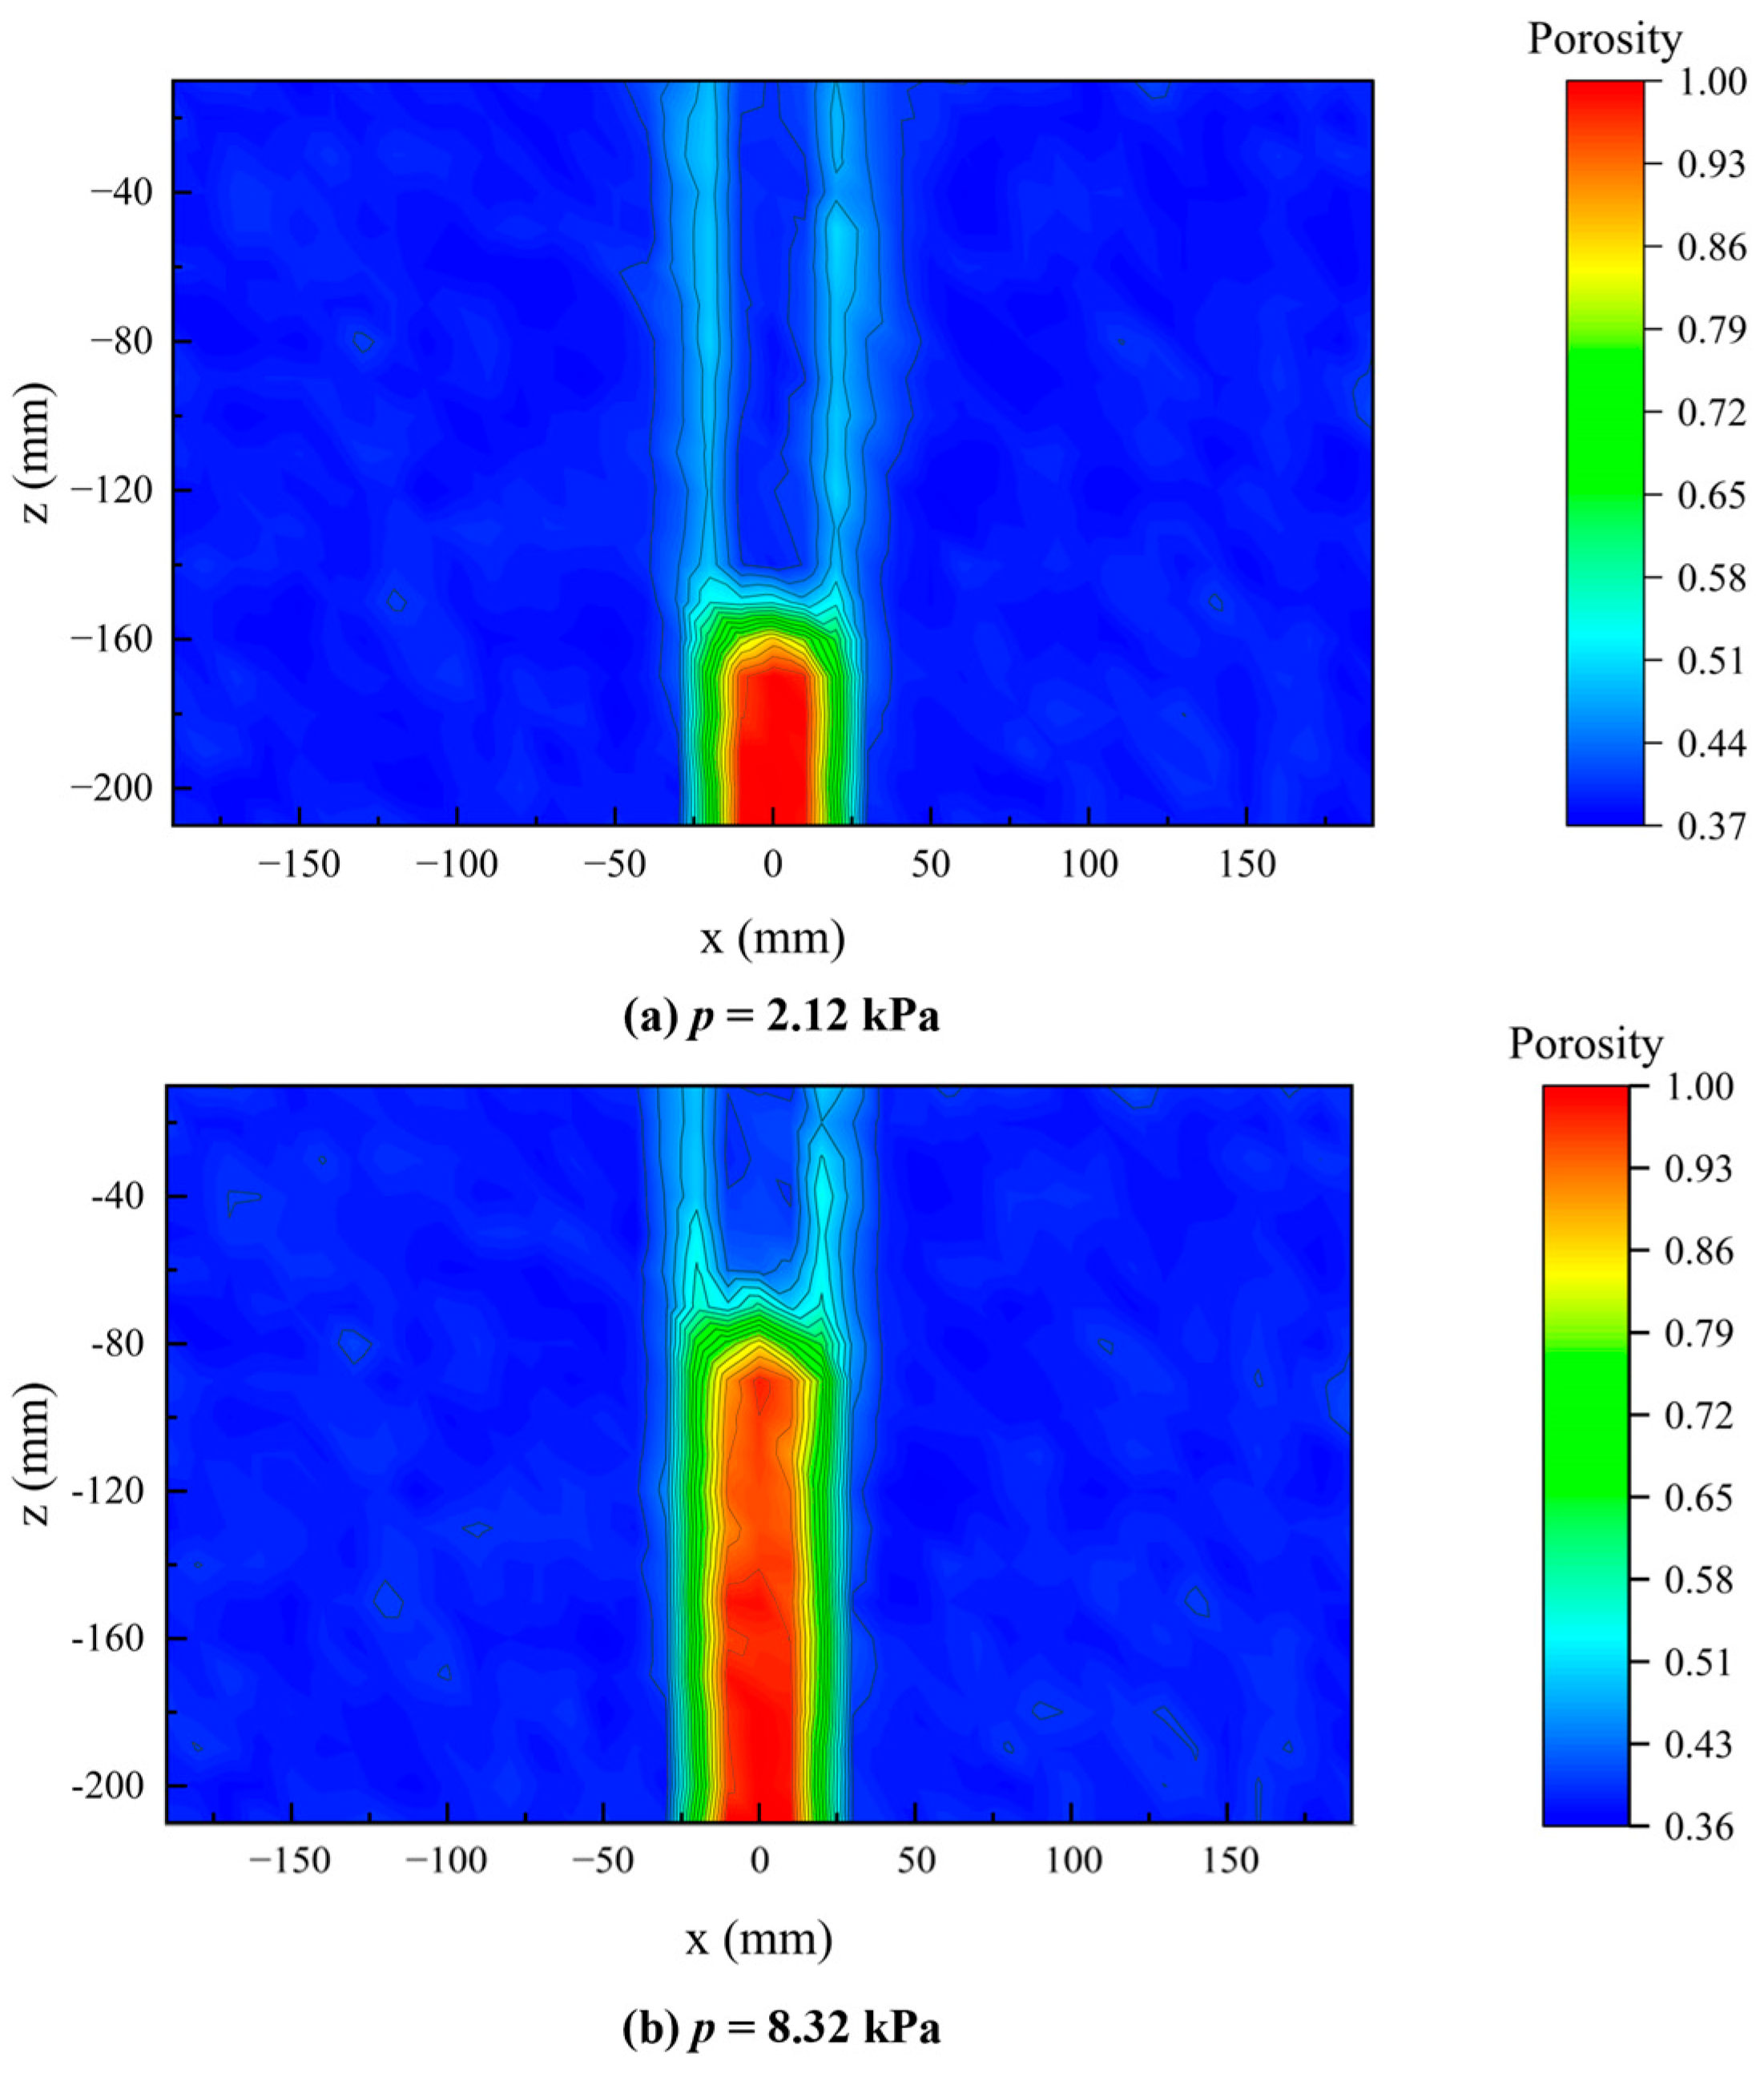
Figure 17 illustrated the comparison of soil porosity after 2,000,000 cycles under low (2.12 kPa) and high (8.32 kPa) exfiltration pressure. The fraction of voids in the soil was measured by porosity, with a value of 1 indicating there was a cavity without soil particles. Porosity gradually increased in the exfiltration zone at 2.12 kPa, leading to the creation of a triangle-shaped cavity at the exfiltration zone. Weaker flow forces removed the soil particles from the triangle-shaped cavity, indicating moderate vertical and lateral particle displacement. The porosity contours extended outward with gentle gradients, suggesting that the soil structure was largely intact and that erosion was occurring at a slow pace beyond the cavity. The remaining grain contacts maintained some resistance against additional runoff.
When the simulated flow pressure was 8.32 kPa, porosity reached 1 along the cavity, forming a vertical red band, showing that all the particles were removed and the cavity was formed. The porosity of the surrounding soil values significantly increased, indicating a large area of weakened structure. In this case, the friction and interlocking between the particles decreased because they quickly lost contact with one another, resulting in a clear water column formed by the strong, focused flow. These events resulted in the formation of a deep, narrow cavity that exhibited precipitous porosity gradients.
The observations showed that as hydraulic pressure increased, the erosion cavity height increased, and the width of the exfiltration zone decreased. The changed width denoted that soil loss was concentrated in the exfiltration zone, and soil weight failed to resist the flow pressure.

5. Conclusions

In China, cases of severe ground subsidence or soil erosion cavity due to exfiltration of shallowly buried water-supply pipeline have been reported in recent decades. Therefore, systematic investigations were carried out in this study to explore the effect of soil erosion mechanisms on defective water-supply pipes. The investigations were achieved by using model tests and CFD-DEM numerical simulations. In addition, the effect of inlet pressure and pipe diameter on the erosion process were investigated. The following conclusions were reached:
(1)
Both the laboratory model tests and numerical simulation show that the erosion zone can be divided into two zones, the exfiltration zone and the seepage diffusion zone. Within the exfiltration zone, an entrainment phenomenon occurred in the lateral section, while a vortex-induced soil–water mixture formed in the middle section due to resistance from the soil weight. Soil erosion was rapid in the exfiltration zone, resulting in a significant increase in local porosity. In some cases, local porosity in exfiltration zone could reach 1.0, meaning there were no soil particles remaining in those regions.
(2)
Under high inlet pressure (pc = 0.18 MPa), pressurized water flow from the fracture strongly inhibited lateral seepage diffusion of water, resulting in a height difference of 16.4 mm between the exfiltration zone and seepage diffusion zone. Under low inlet pressure (pc = 0.10 MPa), there was an extended seepage diffusion zone, and the height difference between the exfiltration zone and seepage diffusion zone increased to 38.6 mm. This phenomenon was related to the balance between hydraulic gradient and critical shear stress of soil.
(3)
The inlet pressure had an effect on the ground collapse process; when the inlet pressure of the laboratory test model increased from 0.10 MPa to 0.18 MPa, the ground collapse duration time of the fractured prototype pipe was reduced by 22–28% (from 125 s to 98 s, and the initial exfiltration velocity increased from 5.2 mm/s to 9.4 mm/s. According to the laboratory test results, the erosion velocity was exponentially related to time. Reducing the pipe diameter was equivalent to increasing the water pressure. Under a small pipe diameter, there was a cavity between the exfiltration zone and the ground surface, which caused ground bulging. Under a large pipe diameter, the cavity diminished and ground subsidence occurred. The formation of the cavity was related to the erosion height and flow pressure of the erosion process.
Generally, the erosion mode of soil in the case of low exfiltration pressure featured behaviors distinctly different from the erosion of soil under high exfiltration pressure, and such differences in erosion mode directly affected the assessment results for foundation stability and subsidence risk. The findings of this study provided practical guidance for the identification of leakage zones and prevention of ground subsidence caused by pipe exfiltration.

Author Contributions

Conceptualization, F.B. and Y.L.; methodology, F.B.; data curation, F.B.; writing—original draft preparation, F.B. and X.L.; writing—review and editing, Y.L. All authors have read and agreed to the published version of the manuscript.

Funding

This research received no external funding.

Institutional Review Board Statement

Not applicable.

Informed Consent Statement

Not applicable.

Data Availability Statement

The original contributions presented in the study are included in the article; further inquiries can be directed to the corresponding author.

Conflicts of Interest

The authors declare no conflicts of interest.

References

  1. Peng, S.; Huang, W.; Luo, G.; Cao, H.; Pan, H.; Mo, N. Failure mechanisms of ground collapse caused by shield tunnelling in water-rich composite sandy stratum: A case study. Eng. Fail. Anal. 2023, 146, 107100. [Google Scholar] [CrossRef]
  2. Zhang, C.P.; Zhang, D.L.; Wang, M.S.; Li, Q.Q. Catastrophe mechanism and control technology of ground collapse induced by urban tunneling. Rock Soil Mech. 2010, 31, 303–309. [Google Scholar]
  3. Alarifi, H.; Mohamad, H.; Nordin, N.F.; Yusoff, M.; Rafindadi, A.D.; Widjaja, B. A large-scale model of lateral pressure on a buried pipeline in medium dense sand. Appl. Sci. 2021, 11, 5554. [Google Scholar] [CrossRef]
  4. China Association of City Planning. Urban Planning Association Statistical Analysis Report of Underground Pipeline Accidents in China in 2023; Underground Pipeline Comprehensive Management Research Center: Beijing, China, 2024. [Google Scholar]
  5. Barfuss, S.L.; Fugal, M. Water main break rates in the United States and Canada. J. Am. Water Work. Assoc. 2025, 117, 22–33. [Google Scholar] [CrossRef]
  6. Dastpak, P.; Sousa, R.L.; Dias, D. Soil erosion due to defective pipes: A hidden hazard beneath our feet. Sustainability 2023, 15, 8931. [Google Scholar] [CrossRef]
  7. Tan, Y.; Long, Y.Y. Review of cave-in failures of urban roadways in China: A database. J. Perform. Constr. Facil. 2021, 35, 4021080. [Google Scholar] [CrossRef]
  8. Liu, C.; Chen, B.; Luo, H.; Ruan, J. Experimental study on seepage erosion induced by pipeline damage under full pipe flow condition. Rock Soil Mech. 2020, 41, 1. [Google Scholar]
  9. Shao, Y.; Yao, T.; Gong, J.; Liu, J.; Zhang, T.; Yu, T. Impact of main pipe flow velocity on leakage and intrusion flow: An experimental study. Water 2019, 11, 118. [Google Scholar] [CrossRef]
  10. Yu, T.; Zhang, X.; Neto, I.E.L.; Zhang, T.; Shao, Y.; Ye, M. Impact of orifice-to-pipe diameter ratio on leakage flow: An experimental study. Water 2019, 11, 2189. [Google Scholar] [CrossRef]
  11. Zhang, T.; Jiang, S.; Wu, F.; Shao, Y.; Chu, S. Experimental Study of External Pipe Wall Erosion due to Water Pipe Leakage. J. Pipeline Syst. Eng. Pract. 2023, 14, 4022071. [Google Scholar] [CrossRef]
  12. Ben-Mansour, R.; Habib, M.; Khalifa, A.; Youcef-Toumi, K.; Chatzigeorgiou, D. Computational fluid dynamic simulation of small leaks in water pipelines for direct leak pressure transduction. Comput. Fluids 2012, 57, 110–123. [Google Scholar] [CrossRef]
  13. Aghda, S.M.F.; GanjaliPour, K.; Nabiollahi, K. Assessing the accuracy of TDR-based water leak detection system. Results Phys. 2018, 8, 939–948. [Google Scholar] [CrossRef]
  14. Ozevin, D.; Harding, J. Novel leak localization in pressurized pipeline networks using acoustic emission and geometric connectivity. Int. J. Press. Vessel. Pip. 2012, 92, 63–69. [Google Scholar] [CrossRef]
  15. Lu, W.; Liang, W.; Zhang, L.; Liu, W. A novel noise reduction method applied in negative pressure wave for pipeline leakage localization. Process Saf. Environ. Prot. 2016, 104, 142–149. [Google Scholar] [CrossRef]
  16. Long, Y.Y.; Tan, Y. Soil arching due to leaking of tunnel buried in water-rich sand. Tunn. Undergr. Space Technol. 2020, 95, 103158. [Google Scholar] [CrossRef]
  17. Tang, Y.; Zhu, D.Z.; Chan, D.H.; Zhang, S. Physical and analytical modeling of soil loss caused by a defective sewer pipe with different defect locations. Acta Geotech. 2023, 18, 2639–2659. [Google Scholar] [CrossRef]
  18. Guo, S.; Zhu, D.Z. Soil and groundwater erosion rates into a sewer pipe crack. J. Hydraul. Eng. 2017, 143, 6017008. [Google Scholar] [CrossRef]
  19. Wang, Z.Y.; Liu, J.C.; Tan, Y.; Long, Y.-Y. Experimental and numerical investigation on internal erosion induced by infiltration of defective buried pipe. Bull. Eng. Geol. Environ. 2025, 84, 38. [Google Scholar] [CrossRef]
  20. Chao, H.; Tan, Y.; Su, Z.K. Ground failure and soil erosion caused by bursting of buried water pipeline: Experimental and numerical investigations. Eng. Fail. Anal. 2025, 167, 108965. [Google Scholar] [CrossRef]
  21. Duan, Y.; Zhang, W.; Liu, H.; Chem, J. Dynamics of soil erosion due to underground pipeline fractures: A transparent soil study under varied hydraulic conditions. J. Comput. Methods Sci. Eng. 2024, 24, 2429–2445. [Google Scholar] [CrossRef]
  22. Chen, B.; Liu, C.; Li, Q.; Onyekwena, C.C. Experimental and theoretical investigations of ground settlement around submerged defective pipelines. Transp. Geotech. 2024, 49, 101395. [Google Scholar] [CrossRef]
  23. Karoui, T.; Jeong, S.-Y.; Jeong, Y.-H.; Kim, D.S. Experimental study of ground subsidence mechanism caused by sewer pipe cracks. Appl. Sci. 2018, 8, 679. [Google Scholar] [CrossRef]
  24. Lee, S.; Kang, J.; Kim, J. A Study on Factors Influencing Ground Subsidence and a Risk Analysis Method Using the Attributes of Sewer Pipes. Appl. Sci. 2023, 13, 9714. [Google Scholar] [CrossRef]
  25. Hall, S.; Bornert, M.; Desrues, J.; Pannier, Y.; Lenoir, N.; Viggiani, G.; Bésuelle, P. Discrete and continuum analysis of localised deformation in sand using X-ray μCT and volumetric digital image correlation. Géotechnique 2010, 60, 315–322. [Google Scholar] [CrossRef]
  26. Lu, Y.; Huang, Y.; Hu, Y. Characterization of initialization and formation of shear zones in sandy slopes. Arab. J. Sci. Eng. 2023, 48, 5019–5035. [Google Scholar] [CrossRef]
  27. Hu, Y.; Lu, Y. Study on soil-rock slope instability at mesoscopic scale using discrete element method. Comput. Geotech. 2023, 157, 105268. [Google Scholar] [CrossRef]
  28. Liu, F. Multi-scale analyses of granular flows for disaster resilience enhancement. Ga. Inst. Technol. 2019. [Google Scholar]
  29. Avci, B.; Gurbuz, A. Modulus of subgrade reaction that varies with magnitude of displacement of cohesionless soil. Arab. J. Geosci. 2018, 11, 351. [Google Scholar] [CrossRef]
  30. Xu, T. Similarity Theory and Model Test; China Agricultural Machinery Press: Beijing, China, 1982. [Google Scholar]
  31. Heller, V. Self-similarity and Reynolds number invariance in Froude modelling. J. Hydraul. Res. 2017, 55, 293–309. [Google Scholar] [CrossRef]
  32. Heller, V. Scale effects in physical hydraulic engineering models. J. Hydraul. Res. 2011, 49, 293–306. [Google Scholar] [CrossRef]
  33. Hughes, S.A. Physical Models and Laboratory Techniques in Coastal Engineering; World Scientific: Singapore, 1993. [Google Scholar]
  34. Guo, S.; Shao, Y.; Zhang, T.; Zhu, D.Z.; Zhang, Y. Physical modeling on sand erosion around defective sewer pipes under the influence of groundwater. J. Hydraul. Eng. 2013, 139, 1247–1257. [Google Scholar] [CrossRef]
  35. Yuan, P. Study on Collapse Mechanism of Soil Subgrade of City Roads by Water Erosion; China University of Mining & Technology: Beijing, China, 2015. [Google Scholar]
  36. Cui, X. Numerical Simulation of Internal Fluidisation and Cavity Evolution Due to a Leaking Pipe Using the Coupled DEM-LBM Technique; University of Birmingham: Birmingham, UK, 2013. [Google Scholar]
  37. GB 50289-2016; Code for Comprehensive Planning of Urban Engineering Pipeline. China Architecture & Building Press: Beijing, China, 2016.
  38. Zhao, Z.Y. The Study About Liquid-Pipeline Specification Small Hole Leakage Law and Pressure Calculation Method After Leakage; China University of Petroleum: Qingdao, China, 2018. [Google Scholar]
  39. Chow, V.T. Open Channel Hydraulics; McGraw-Hill: New York, NY, USA, 1959. [Google Scholar]
  40. GB/T 50145-2007; Standard for Engineering Classification of Soil. Ministry of Housing and Urban-Rural Development of the People’s Republic of China, China Standard Press: Beijing, China, 2007.
  41. Tan, X.; Hu, Z.; Cao, M.; Chen, C. 3D discrete element simulation of a geotextile-encased stone column under uniaxial compression testing. Comput. Geotech. 2020, 126, 103769. [Google Scholar] [CrossRef]
  42. Itasca Consulting Group, INC. PFC3D: Particle Flow Code in 3 Dimensions, Version 9.0; Itasca Consulting Group, Inc.: Minneapolis, MN, USA, 2022; Available online: https://www.itascacg.com/software/pfc (accessed on 15 January 2025).
  43. Hu, Y.; Lu, Y. A novel framework for calibrating DEM parameters: A case study of sand and soil-rock mixture. Comput. Geotech. 2024, 174, 106619. [Google Scholar] [CrossRef]
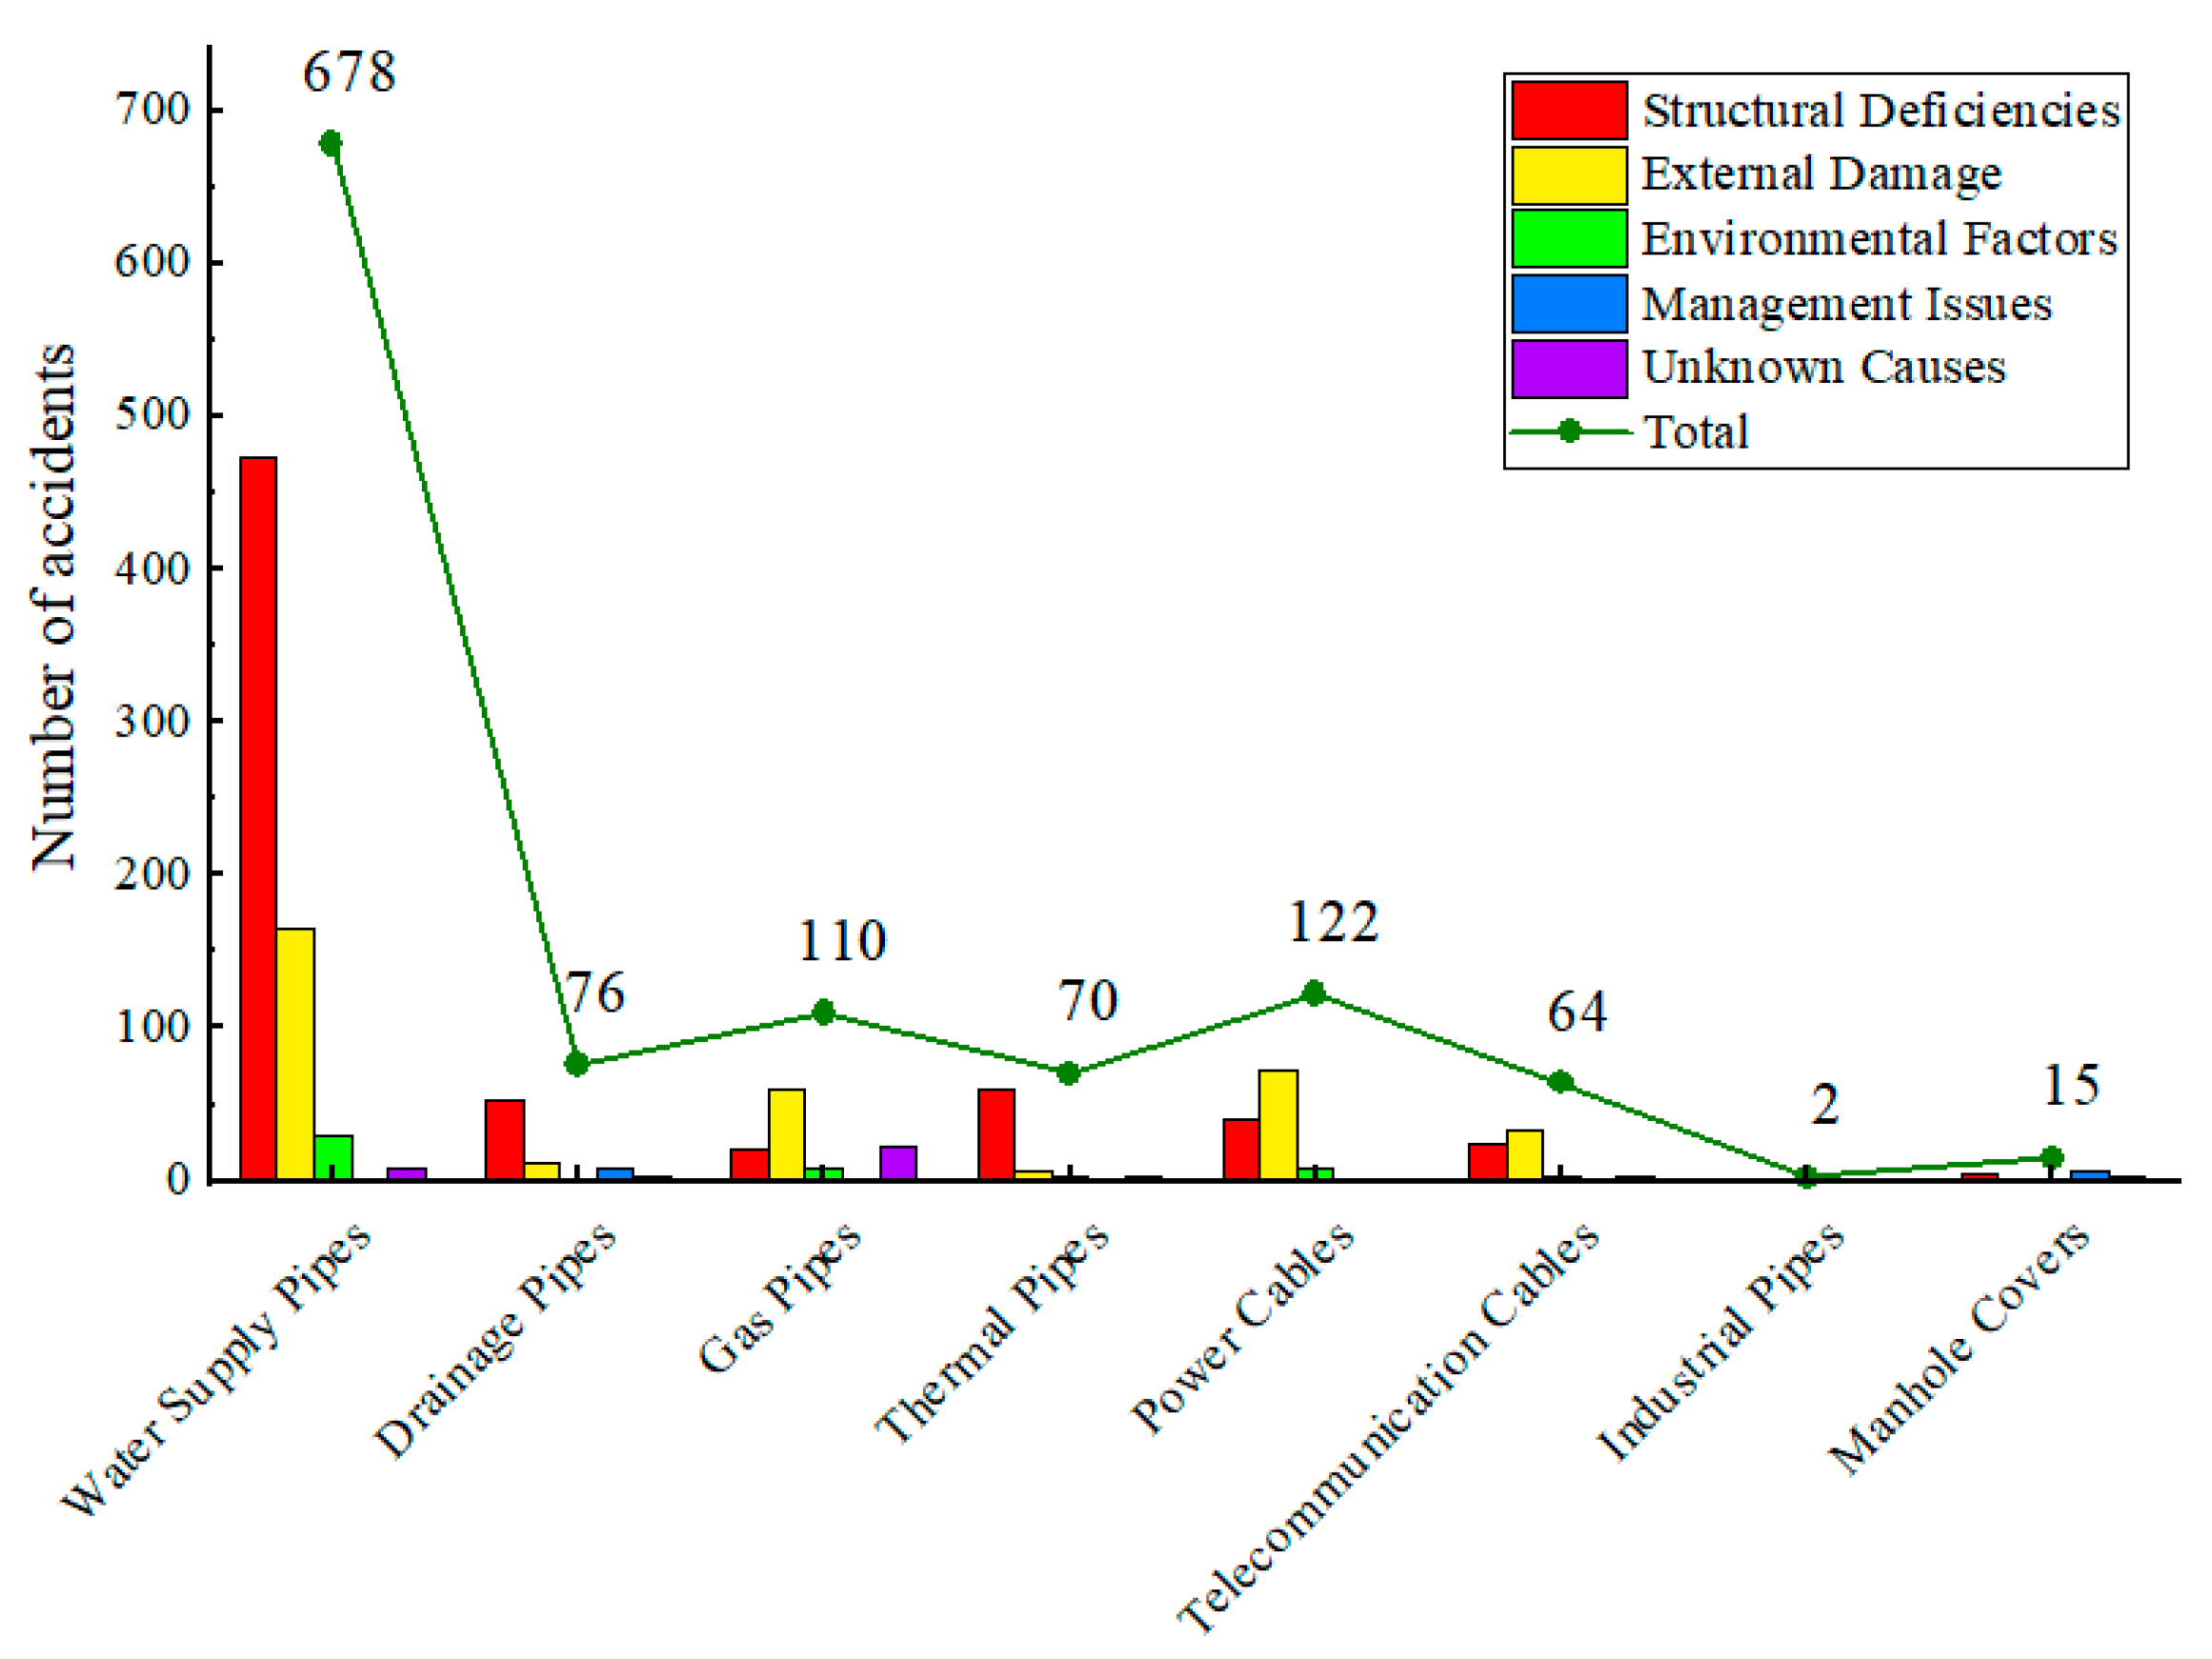
Figure 1. Classification of pipeline-related incidents in China, 2023 (data from [3]).
Applsci 15 10736 g001
Figure 2. Experimental model and water-supply pipe configuration.
Applsci 15 10736 g002
Figure 3. Experimental apparatus.
Applsci 15 10736 g003
Figure 4. Experimental pipe.
Applsci 15 10736 g004
Figure 5. Soil sample and grain diameter distribution.
Applsci 15 10736 g005
Figure 6. Process of soil erosion.
Applsci 15 10736 g006
Figure 7. Erosion patterns at impact height of 100 mm.
Applsci 15 10736 g007
Figure 8. Erosion height and area development curves under different inlet pressures.
Applsci 15 10736 g008
Figure 9. Erosion rates at different inlet pressures.
Applsci 15 10736 g009
Figure 10. Erosion patterns of different pipe diameters.
Applsci 15 10736 g010
Figure 11. Erosion height and area development curves under different pipe diameter.
Applsci 15 10736 g011
Figure 12. Erosion rate in different half-pipe outer diameter.
Applsci 15 10736 g012
Figure 13. Numerical model.
Applsci 15 10736 g013
Figure 14. Soil displacement and flow vector under different flow pressures.
Applsci 15 10736 g014
Figure 15. Contact force chains of soil particles at 2,000,000 cycles.
Applsci 15 10736 g015
Figure 16. Particle displacement under different flow pressures at 2,000,000 cycles.
Applsci 15 10736 g016
Figure 17. Porosity distribution under different erosion pressures at 2,000,000 cycles.
Applsci 15 10736 g017
Table 1. Flow velocity and pressure in water-supply system.
Connecting PipeHalf-Pipe Water-Supply System
Diameter Dc
(12 mm)
Diameter D
(63 mm)
Diameter D
(50 mm)
Diameter D
(40 mm)
Inlet
Pressure pc (MPa)
Flow Velocity vc
(m/s)
Flow
Pressure
p
(MPa)
Flow Velocity v
(m/s)
Flow
Pressure
p
(MPa)
Flow Velocity v
(m/s)
Flow
Pressure
p
(MPa)
Flow Velocity v
(m/s)
0.1012.122 × 10−30.097.166 × 10−30.141.872 × 10−20.22
0.1428.320 × 10−30.18////
0.1832.412 × 10−20.27////
Table 2. Physical and mechanical properties of soil samples.
Soil Typed10 (mm)d30 (mm)d50 (mm)d60 (mm)CuCcγ (kN/m3)c (kPa)φ (°)
Sand0.110.210.280.343.091.0719.1033.5
Table 3. Test parameters for exfiltration model tests.
Test No.Half-Pipe Diameter D (mm)Overlaying Soil Thickness H (mm)Flow Pressure in Connecting Pipe pc (MPa)
1632200.10
22200.14
32200.18
4502200.10
5402200.10
Table 4. Parameters for PFC model.
Micro-ParametersSoil Sample
PFC model objectsBall
Density (kg⋅m−3)2650
Effective modulus (Pa)1 × 10⁶
Stiffness ratio1.214
Ball–ball friction coefficient0.65
Rotational friction coefficient0.1
Disclaimer/Publisher’s Note: The statements, opinions and data contained in all publications are solely those of the individual author(s) and contributor(s) and not of MDPI and/or the editor(s). MDPI and/or the editor(s) disclaim responsibility for any injury to people or property resulting from any ideas, methods, instructions or products referred to in the content.