Article

Layer Thickness Impact on Shock-Accelerated Interfacial Instabilities in Single-Mode Stratifications

by
Salman Saud Alsaeed
1,
Satyvir Singh
2,3,* and
Nouf A. Alrubea
1
1
Department of Mathematics, College of Science, Jouf University, Sakaka P.O. Box 2014, Saudi Arabia
2
Applied and Computational Mathematics, RWTH Aachen University, 52062 Aachen, Germany
3
Department of Mathematics, Graphic Era Deemed to be University, Dehradun 248002, India
*
Author to whom correspondence should be addressed.
Appl. Sci. 2025, 15(19), 10687; https://doi.org/10.3390/app151910687
Submission received: 1 September 2025 / Revised: 25 September 2025 / Accepted: 1 October 2025 / Published: 3 October 2025

Abstract

This study investigates the influence of heavy-layer thickness on shock-accelerated interfacial instabilities in single-mode stratifications using high-order discontinuous Galerkin simulations at a fixed shock Mach number ( M s = 1.22 ). By systematically varying the layer thickness, we quantify how acoustic transit time, shock attenuation, and phase synchronization modulate vorticity deposition, circulation growth, and interface deformation. The results show that thin layers ( d = 2.5 –5 mm) generate strong and early baroclinic vorticity due to frequent reverberations, leading to rapid circulation growth, vigorous Kelvin–Helmholtz roll-up, and early jet pairing. In contrast, thick layers ( d = 20 –40 mm) attenuate and dephase shock returns, producing weaker baroclinic reinforcement, delayed shear-layer growth, and smoother interfaces with reduced small-scale activity, while the intermediate case ( d = 10 mm) exhibits transitional behavior. Integral diagnostics reveal that thin layers amplify dilatational, baroclinic, and viscous vorticity production; sustain stronger circulation and enstrophy growth; and transfer bulk kinetic energy more efficiently into interface deformation and small-scale mixing.

1. Introduction

Shock-accelerated interfacial instabilities are fundamental to a broad class of high-speed flow problems with relevance across science and engineering [1,2]. They occur whenever a shock wave impinges on a perturbed density interface, creating a misalignment between pressure and density gradients that deposits baroclinic vorticity. The resulting circulation drives interface deformation and secondary instabilities that culminate in vigorous mixing [3]. Such processes are central to applications ranging from inertial confinement fusion [4] and astrophysical supernova dynamics [5] to supersonic combustion [6] and many other systems [7,8,9].
The Richtmyer–Meshkov (RM) instability is the canonical manifestation of such shock–interface interactions [10,11]. First identified as the impulsive counterpart of the Rayleigh–Taylor (RT) instability [12,13], the RM instability emerges when a planar shock crosses a perturbed interface between fluids of different densities. The shock-induced baroclinic torque creates a vorticity sheet along the interface, leading to the growth of spikes and bubbles. At later times, the induced shear layers undergo Kelvin–Helmholtz (KH) roll-up, producing complex vortical structures and accelerated mixing [14]. Understanding this chain of events is critical for predictive modeling of multi-fluid interactions in high-speed environments.
Over the past decades, extensive theoretical, experimental, and computational studies have deepened our understanding of RM instability. Impulsive growth models provided scaling laws for early-time perturbation growth, while high-resolution shock tube experiments offered direct observations of interface deformation, vortex pairing, and re-shock amplification [15,16,17,18,19]. Parallel progress in high-fidelity numerical simulations has enabled detailed exploration of flow fields, capturing vorticity deposition, secondary wave interactions, and nonlinear vortex dynamics [20,21,22,23,24,25]. These advances have illuminated the roles of baroclinicity, compressibility, and viscosity in RM instability evolution.
Despite significant progress in understanding RM instability, most prior studies have concentrated on simplified configurations such as sharp single interfaces, shocked bubbles, or wedge-shaped geometries, often emphasizing the effects of shock strength or Atwood number variations [26]. Comparatively fewer investigations have addressed the case of stratified layers with finite thickness, even though the thickness represents a natural and physically important parameter. In practical systems such as gas curtains, ICF capsules, and stratified atmospheres, the interface is rarely infinitesimal but extends across a finite distance. This additional length scale modifies acoustic transit times, shock attenuation, and phase synchronization, exerting a strong influence on instability growth [27,28,29,30,31,32].
The heavy-layer thickness is particularly critical because it regulates the frequency and coherence of shock reverberations between upstream and downstream interfaces. Thin layers enable short transit times, promoting rapid and repeated reverberations that reinforce baroclinic vorticity deposition, thereby accelerating spike growth, enhancing Kelvin–Helmholtz roll-up, and generating early jet pairing [33,34,35]. By contrast, thicker layers increase the transit distance, which attenuates transmitted shocks and dephases their returns relative to interface motion. As a result, the baroclinic forcing becomes weaker and less synchronized, yielding smoother interface evolution, delayed secondary instabilities, and suppressed mixing [36,37,38,39].
Beyond planar and bubble-type configurations, RM and related instabilities have also been investigated in more complex geometries involving bow shocks and cylindrical layers, often in the presence of localized energy release. Recent studies have shown that the interaction of an energy deposition region with a bow shock can generate strong baroclinic torque, secondary instabilities, and transition toward turbulence in cylindrical shock layers [40,41,42,43]. These works emphasize that the coupling between shock curvature, energy release, and interface geometry introduces additional pathways for vorticity generation compared to the single-mode stratifications studied here. While our present work isolates the influence of finite layer thickness in a canonical two-dimensional setup, the mechanisms uncovered are complementary to these more complex cases and contribute to the broader understanding of instability onset and mixing in shock-accelerated flows.
Another open challenge lies in quantitatively connecting these physical mechanisms to integral diagnostics of flow evolution. Circulation provides a measure of the net strength of counter-rotating vortices, enstrophy highlights the buildup of small-scale vortical structures, and kinetic energy reflects the redistribution of bulk shock energy into interfacial motions. While recent studies have begun to explore these aspects for finite-thickness layers, their sensitivity to layer thickness is still not fully understood [44,45,46,47]. Clarifying these dependencies is essential for predictive modeling of stratified RM instability.
Related approaches in high-speed flow control exploit thermally stratified energy deposition and spatially multi-component plasma structures to deliberately manipulate shock–interface interactions. In such systems, localized heating or plasma generation introduces density stratifications that are subsequently accelerated by shock waves, producing RM instabilities that seed turbulence and enhance mixing [48,49,50,51,52]. These works emphasize that controlled energy deposition can be used to tailor instability growth and vortex dynamics in shock layers, extending the role of RM instability beyond passive stratifications to active flow-control strategies. While the present work focuses on canonical single-mode heavy-layer stratifications, the mechanisms identified here—particularly the dependence of baroclinic vorticity deposition on stratification thickness—are directly relevant to interpreting and optimizing these plasma-assisted flow-control scenarios.
In addition to global measures, morphological diagnostics such as interface trajectory, normalized amplitude, and interface length offer complementary insight into the large-scale displacement and fine-scale deformation of shocked layers [53]. Coupled with vorticity-based metrics, these measures form a comprehensive framework to assess how baroclinicity, compressibility, and viscosity jointly control instability growth. However, a unified study that systematically links integral diagnostics with interface morphology across a range of heavy-layer thicknesses remains lacking.
The objective of the present work is to address this gap by performing high-order discontinuous Galerkin simulations of shock-accelerated single-mode heavy-fluid layers with systematically varied thickness. By analyzing vorticity production mechanisms, integral quantities (circulation, enstrophy, kinetic energy), and interface characteristics (trajectories, amplitudes, lengths), we provide a comprehensive evaluation of how the layer modulates instability growth. The results demonstrate that thin layers promote stronger baroclinic vorticity generation, rapid circulation growth, and early KH roll-up, whereas thick layers suppress and delay these processes due to shock attenuation and phase dephasing, consistent with recent experimental and numerical findings. These insights highlight heavy-layer thickness as a key control parameter for instability evolution, with implications for multi-fluid mixing in fusion, astrophysics, and high-speed propulsion systems.
While prior studies have recognized that finite-thickness layers alter shock–interface dynamics, most works have focused on isolated cases or limited diagnostics, leaving open the question of how systematic variations in layer thickness affect the coupled evolution of vorticity generation, circulation, and interface morphology. Our study addresses this gap by employing high-order discontinuous Galerkin simulations to provide, for the first time, a unified and quantitative assessment of how heavy-layer thickness regulates both integral flow measures (circulation, enstrophy, kinetic energy) and morphological descriptors (interface trajectory, amplitude, length). This integrated framework advances current understanding by linking acoustic transit time, shock attenuation, and phase synchronization directly to measurable instability outcomes, thereby clarifying the physical mechanisms through which layer thickness modulates RM instability.
The remainder of this paper is organized as follows. Section 2 introduces the problem formulation and governing equations. Section 3 describes the numerical methodology, including the discontinuous Galerkin solver and validation studies. Section 4 presents the results, covering shock–interface interaction dynamics, vorticity deposition, integral diagnostics, and interface characteristics. Finally, Section 5 summarizes the main conclusions and outlines directions for future work.

2. Problem Formulation and Governing Equations

This section frames a canonical shock–interface problem in which a planar shock interacts with a single-mode perturbation embedded in a finite-thickness heavy–light stratified layer, detailing the geometry, dimensionality, and control parameters (e.g., thickness ratio, density contrast, shock strength, initial amplitude). It then outlines the compressible multi-fluid governing laws adopted and states the initial and boundary conditions—including the pre- and post-shock states and the imposed interface disturbance—used to close and reproducibly simulate the configuration.

2.1. Physical Model and Flow Configuration

Figure 1 depicts the two-dimensional setup used to investigate shock-accelerated interfacial instabilities in single-mode stratifications. The simulations are performed in a rectangular domain [ 0 , 100 ] × [ 0 , 200 ] mm 2 in ( x , y ) . A finite-thickness heavy-gas layer (SF6) of thickness d is embedded in a light ambient gas. The layer is bounded upstream by a single-mode sinusoidal interface I 1 and downstream by a planar interface I 2 . The perturbation at I 1 has initial amplitude a 0 and wavelength λ = 100 mm . A planar incident shock (IS) is initialized in the ambient gas and propagates in the + x direction. At t = 0 , the IS is placed 25 mm from the left boundary, and the leftmost point of I 1 is positioned 5 mm downstream of the IS, ensuring the shock first encounters the wavy interface. The IS strength is characterized by the Mach number M s . To isolate layer-thickness effects, we consider five SF6 layer thicknesses, d = { 2.5 , 5 , 10 , 20 , 40 } mm , while keeping the initial perturbation amplitude fixed at a 0 = 40 mm , the wavelength at λ = 100 mm , and the incident shock at M s = 1.22 . Thermophysical properties for SF6 and the ambient gas used in the calculations are summarized in Table 1. Boundary conditions are as follows: inflow at the left boundary and non-reflecting outflow at the right, top, and bottom boundaries. Unless otherwise noted, the initial thermodynamic state is uniform with pressure P 0 = 101 , 325 Pa and temperature T 0 = 273 K in both gases.

2.2. Governing Equations of Compressible Multi-Fluid Flow

We model the flow as an ideal, non-reacting, multicomponent gas mixture and evolve it with the two-dimensional, unsteady, compressible Navier–Stokes–Fourier (NSF) equations [20,21]. This framework enforces conservation of mass, momentum, and total energy and, with appropriate constitutive relations, accounts for compressibility, viscous dissipation, heat conduction, and species diffusion—ingredients that are essential for a consistent description of shock–interface interactions in multicomponent media.
Let
U = ρ , ρ u , ρ E , ρ Y k T
denote the vector of conserved variables, where ρ is the mixture density, u the velocity, E the specific total energy, and Y k the mass fraction of species k. The NSF system can be written in divergence form as
U t + · F c ( U ) + · F d ( U , Π , Q ) = 0 ,
with convective and diffusive fluxes
F c = ρ u , ρ u u + p I , ( ρ E + p ) u , ρ Y k u T ,
F d = 0 , Π , Π · u + Q , ρ D k Y k T .
Here p is the pressure, I the identity tensor, and D k the mixture-averaged diffusion coefficient of species k. The viscous stress Π and the heat flux Q follow Newton’s and Fourier’s laws, respectively. Introducing the deviatoric strain-rate tensor
S = 1 2 u + ( u ) T 1 3 ( · u ) I ,
we set
Π = 2 μ S , Q = κ T ,
with μ and κ the mixture’s dynamic viscosity and thermal conductivity.

2.2.1. Thermodynamics

Species mass fractions satisfy Y k = ρ k / ρ and k Y k = 1 (for a binary mixture, Y 1 = 1 Y 2 ). The mixture total energy is
ρ E = p γ ¯ 1 + 1 2 ρ | u | 2 ,
where γ ¯ is the effective specific-heat ratio of the mixture. Let the (normalized) mole fractions be
z k = Y k / M k j Y j / M j ,
with M k the molecular weight of species k. Then the mixture heat capacities and γ ¯ are
C ¯ p = k z k C p , k , C ¯ v = k z k C v , k , γ ¯ = C ¯ p C ¯ v .
For ideal gases,
C p , k = γ k R u / M k γ k 1 , C v , k = C p , k R u M k ,
where R u is the universal gas constant and γ k is the species specific-heat ratio. The mixture pressure follows Dalton’s law:
p = ρ R ¯ T , R ¯ = k Y k R u M k .

2.2.2. Transport Properties

Mixture transport coefficients are formed from species values using standard mixing rules. Unless stated otherwise, we employ mass-weighted, inverse-square-root molecular-weight averages:
μ ¯ , κ ¯ = k μ k Y k M k 1 / 2 k Y k M k 1 / 2 , k κ k Y k M k 1 / 2 k Y k M k 1 / 2 .
Species viscosities are obtained from a Chapman–Enskog expression (Wilke-type correlation) [54]:
μ k = C μ M k T σ k 2 Φ μ 1 ( T k ) , C μ = 2.6693 × 10 6 ,
where σ k is the collision diameter, T k = T / ( ϵ / K B ) k is the reduced temperature, and the collision-integral fit is
Φ μ ( T ) = A μ ( T ) B μ + C μ exp ( D μ T ) + E μ exp ( F μ T ) ,
with ( A μ , B μ , C μ , D μ , E μ , F μ ) = ( 1.161 , 0.149 , 0.525 , 0.773 , 2.162 , 2.438 ) . Thermal conductivity for species k is linked to viscosity through a prescribed Prandtl number P r k ,
κ k = C p , k P r k μ k .
Binary mass-diffusion coefficients are evaluated as
D i j = C D T 3 / 2 p M i j σ i j 2 Φ D 1 ( T i j ) , C D = 0.0266 ,
where M i j = 2 M i M j / ( M i + M j ) , σ i j = 1 2 ( σ i + σ j ) , T i j = ( ϵ i / K B ) ( ϵ j / K B ) , and
Φ D ( T ) = A D ( T ) B D + C D exp ( D D T ) + E D exp ( F D T ) + G D exp ( H D T ) ,
with coefficients
( A D , B D , C D , D D , E D , F D , G D , H D ) = ( 1.060 , 0.156 , 0.193 , 0.476 , 1.036 , 1.530 , 1.765 , 3.894 ) .

2.3. Initial and Boundary Conditions

To isolate the influence of layer thickness on the instability dynamics, the flow is initialized from a quiescent ambient state ( P 0 = 101 , 325 Pa , T 0 = 273 K ) with a planar incident shock embedded in the light gas and propagating in the + x direction; at t = 0 the shock front is positioned 25 mm from the left boundary and approximately 5 mm upstream of the leftmost point of the upstream interface I 1 so that the first interaction is with the perturbed interface. The stratification comprises a heavy-gas layer bounded by a single-mode sinusoidal interface I 1 (amplitude a 0 = 40 mm , wavelength λ = 100 mm ) and a downstream planar interface I 2 . The primary control parameter is the layer thickness d, which is varied over { 2.5 , 5 , 10 , 20 , 40 } mm (equivalently d / λ { 0.025 , 0.05 , 0.10 , 0.20 , 0.40 } ), while the gas pair (Table 1) and all other settings are held fixed unless noted. A baseline incident Mach number M s = 1.22 is prescribed; the corresponding post-shock state is obtained from the one-dimensional Rankine–Hugoniot relations and imposed at the left boundary as an inflow to sustain a planar wave of the desired strength. Non-reflecting outflow conditions are applied at the right, top, and bottom boundaries, minimizing spurious reflections so that observed differences in the evolution can be attributed predominantly to changes in d.

3. Numerical Methodology

3.1. High-Order Discontinuous Galerkin Solver

Physical experiments on shock-accelerated interfacial instabilities face intrinsic challenges: the flow evolves on sub-millisecond time scales, the initial interface is difficult to prescribe and reproduce with high fidelity, and obtaining repeatable measurements with well-quantified uncertainties is nontrivial. High-resolution simulations therefore play a pivotal role, offering controlled access to perturbation amplification, interface morphology, and mixing metrics that are often inaccessible in the laboratory [2]. Among available discretizations for hyperbolic systems, discontinuous Galerkin (DG) methods have become prominent because they deliver high-order accuracy with local conservation, remain robust in the presence of discontinuities, adapt to complex geometries, and scale efficiently on parallel architectures [55].
In this study, we employ an in-house modal DG solver [24,25] to advance the two-dimensional, compressible, two-component Euler equations governing a shock-accelerated, single-mode stratified layer. The computational domain is partitioned into non-overlapping rectangular elements, and the solution within each element is expanded in third-order scaled Legendre polynomials. Numerical fluxes at element interfaces are evaluated using an HLLC approximate Riemann solver to capture shocks and material interfaces sharply in the two-component setting. Volume and surface integrals are computed with Gauss–Legendre quadrature, and time advancement uses a third-order strong-stability-preserving Runge–Kutta scheme [56]. To suppress Gibbs-type oscillations near discontinuities, a high-order moment limiter is applied following [57].

3.2. Validation with Benchmark Cases

Before examining layer-thickness effects, we first verify that the numerical framework reproduces the key physics of shock-accelerated interfacial instabilities. To this end, we compare against well-documented two-dimensional shock–interface benchmarks, assessing both qualitative Schlieren morphology and quantitative interface-displacement histories.
We validated this employed solver against the two-dimensional experiments of Luo et al. [58], where a planar shock of strength M s = 1.2 interacts with a chevron-shaped air/SF6 interface of vertex angle θ = 60 . Figure 2a juxtaposes experimental Schlieren images with numerical Schlieren snapshots at matched times t = 64 , 171 , 408 , 531 , and 1011 μ s . Immediately after impact, the transmitted shock refracts and curves within SF6, while a reflected wave travels into air, depositing baroclinic vorticity that deforms the chevron tips. At later times the disturbed tips elongate into jets, followed by vortex roll-up and fine-scale structure driven by successive wave interactions. The DG solution reproduces these features with high fidelity, capturing shock refraction, jet formation, vortex development, and secondary waves. Figure 2b reports the upstream-interface displacement D s ( t ) : symbols denote the measurements and the solid line the simulation. The close agreement across the full time window confirms the accuracy of the present framework for shock-accelerated interfacial instabilities.
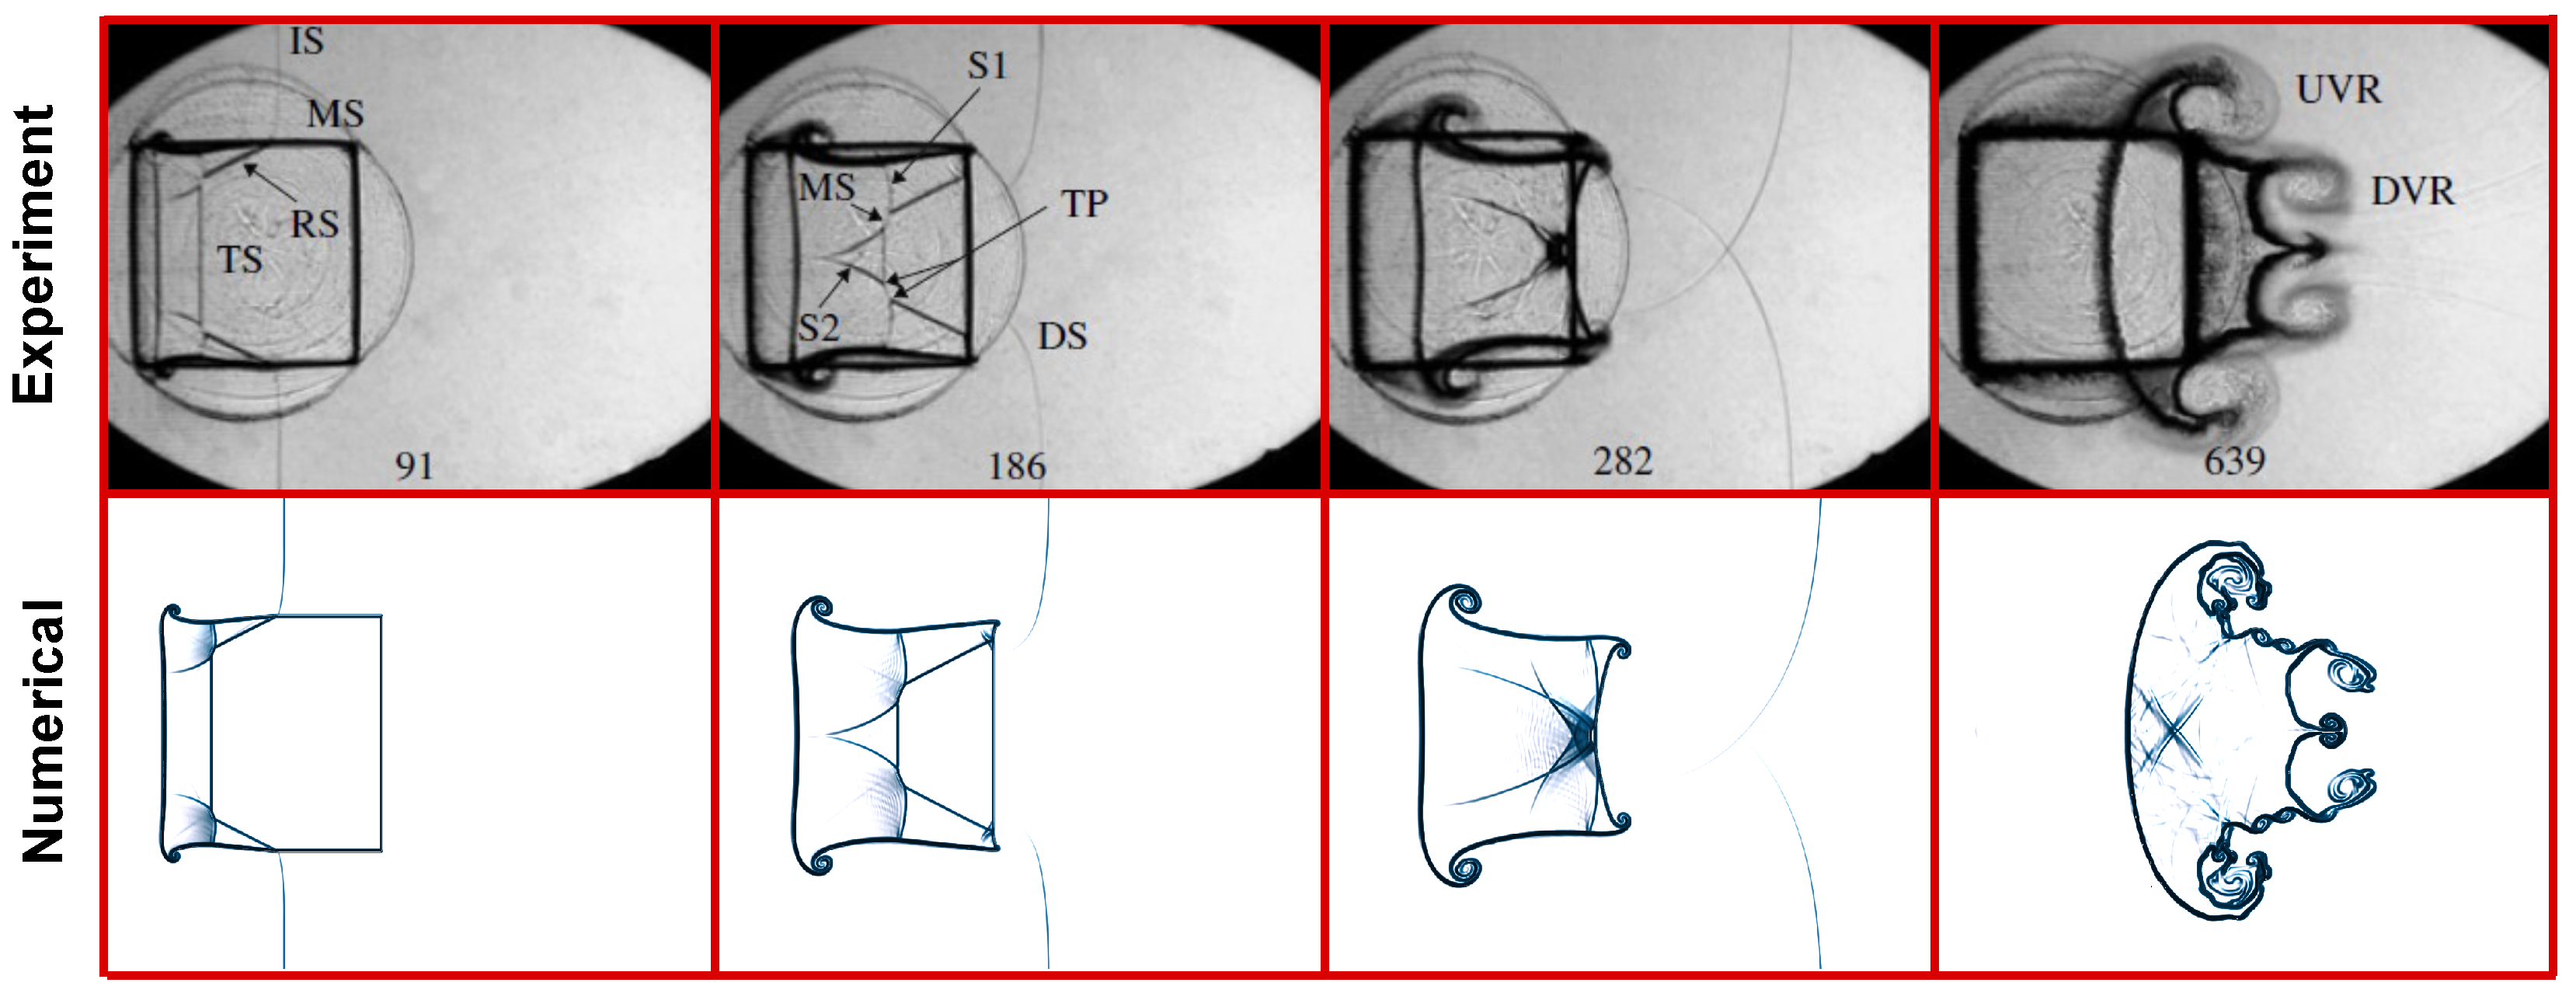
Figure 3 contrasts experimental Schlieren records with our numerical Schlieren fields for a square SF6 bubble embedded in air and impulsively accelerated by a weak planar shock (baseline M s 1.17 ) [59]. At early times the incident shock (IS) refracts at the gas interface, producing a transmitted shock (TS) inside the SF6 and a reflected shock (RS) in air; a Mach stem (MS), slip lines (S1, S2), and a triple point (TP) form and convect along the upstream face. As the waves diffract around the corners, the square interface is progressively distorted and rolls up into paired vortex rings (UVR/DVR), while a diffracted shock (DS) emanates from the downstream edges. The simulated flow reproduces the observed wave topology and interface evolution across the matched time instants.
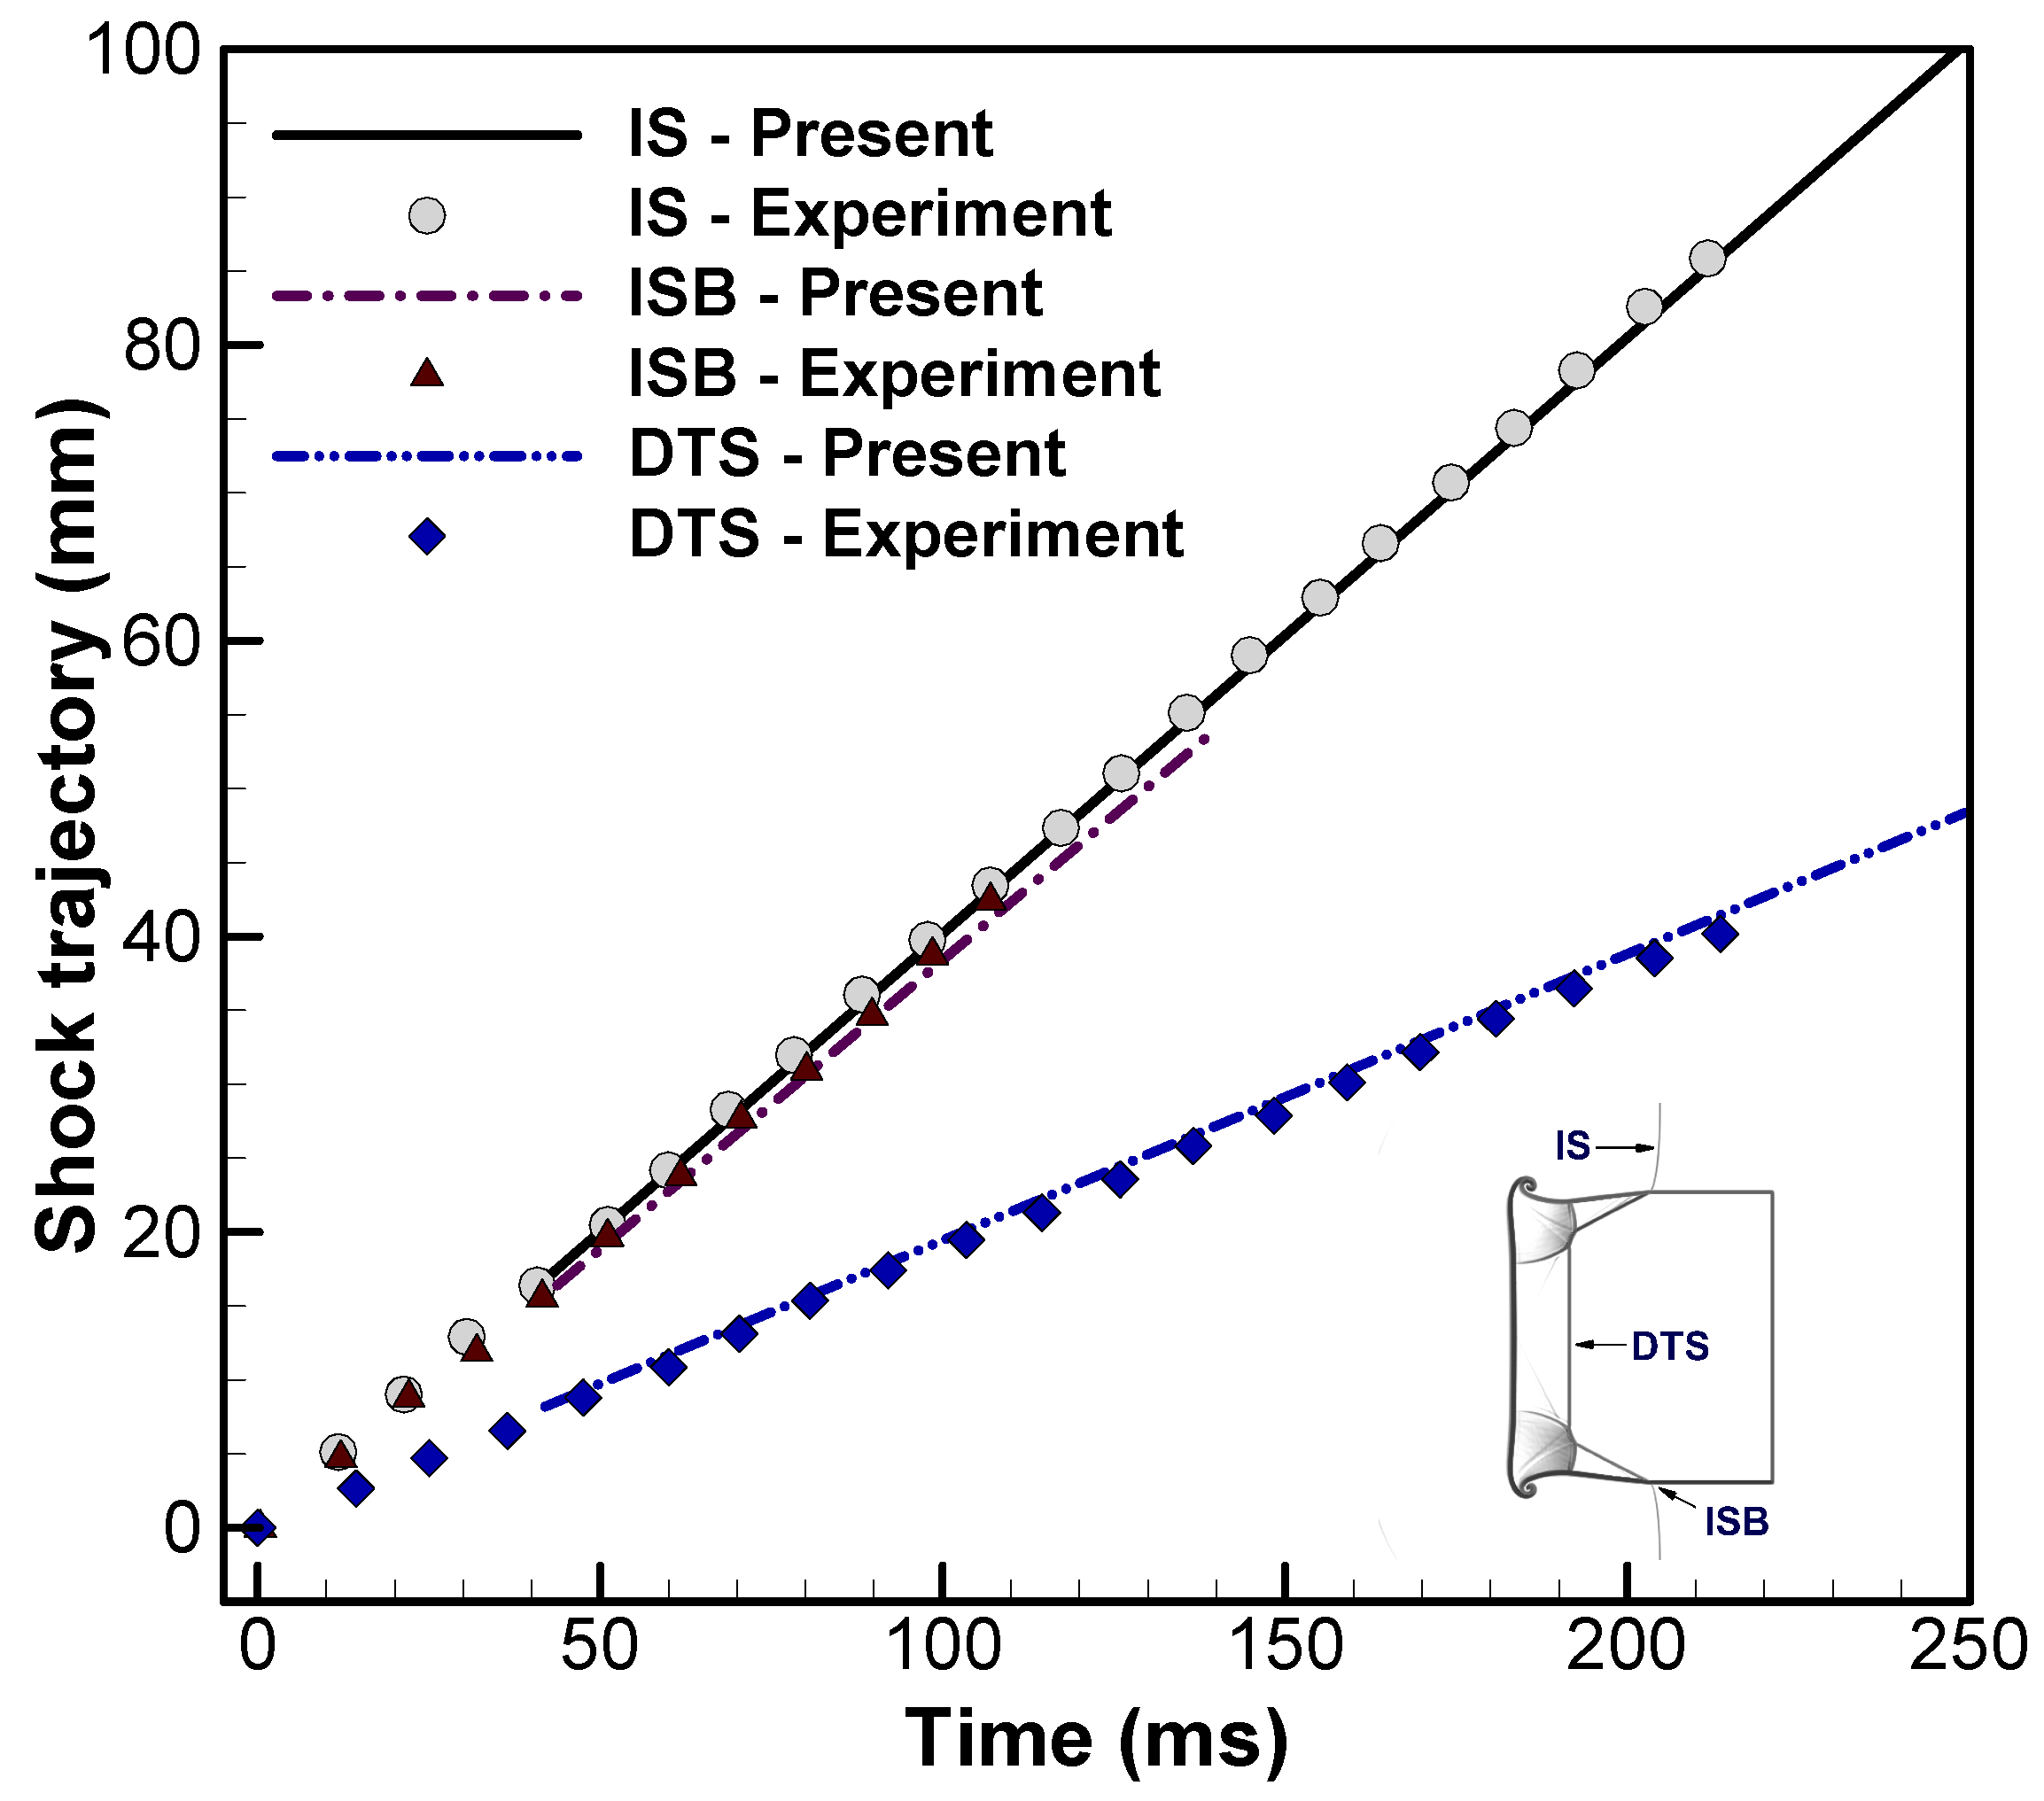
Further validation is provided by a quantitative comparison with the measurements of Luo et al. [59]. Figure 4 reports the trajectories of the principal wave fronts—the incident shock in the free stream (IS), the incident shock as it slides along the bubble face (ISB), and the direct transmitted shock within SF6 (DTS). The close overlay between the numerical and experimental paths confirms that the present framework captures both the global shock kinematics and the detailed interface response. Taken together, these results demonstrate strong qualitative and quantitative agreement, supporting the reliability of the numerical method and modeling choices used throughout this study.

3.3. Mesh Resolution Strategy

Before analyzing layer-thickness effects, we assess mesh convergence because shock-accelerated interfaces, thin shear layers, and small roll-ups are highly resolution-sensitive and can bias growth metrics if under-resolved. For consistency in reporting the temporal evolution, we introduce a nondimensional time based on the interface wavelength L and the incident-shock speed V i . Defining the characteristic time t 0 = L / V i , the normalized time is
τ = t t 0 = t V i L ,
so that τ = 1 corresponds to the shock traversing one wavelength.
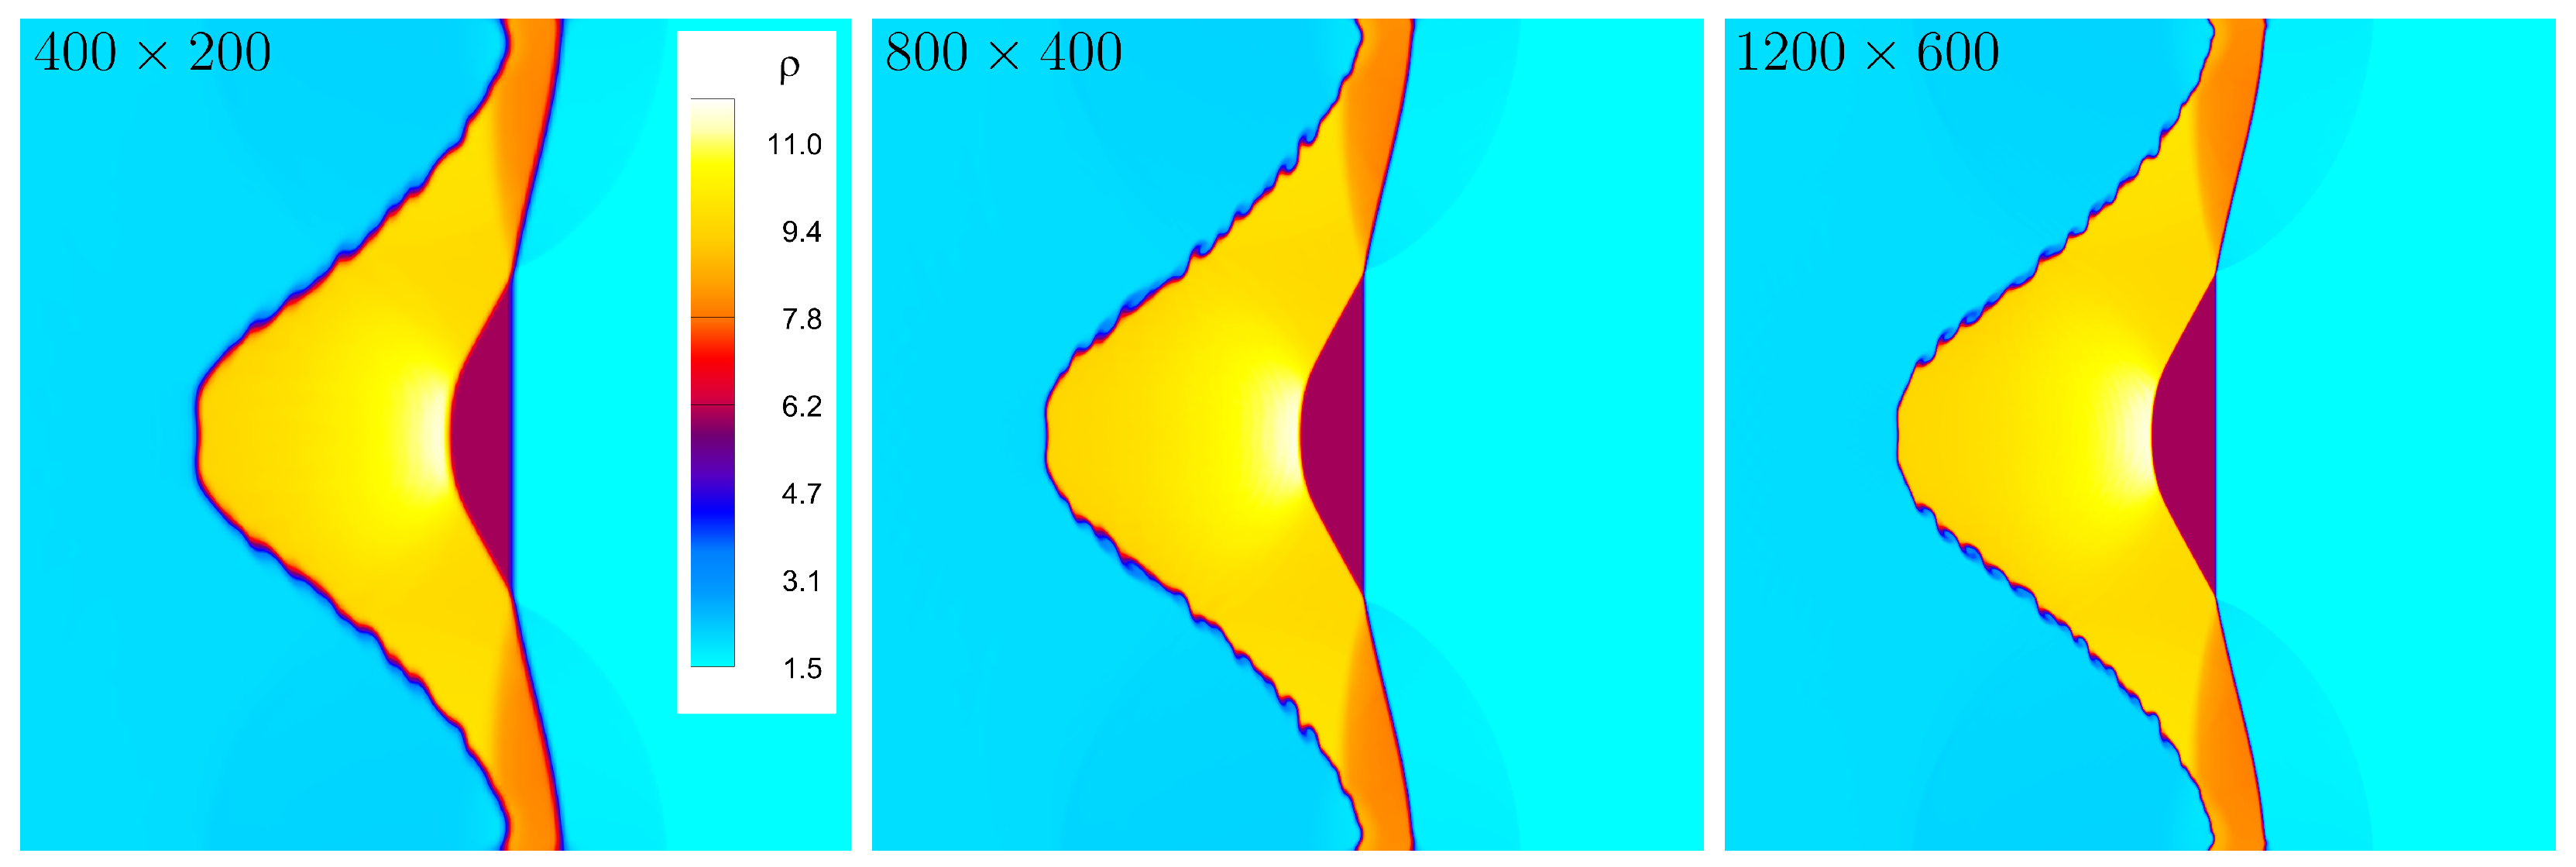
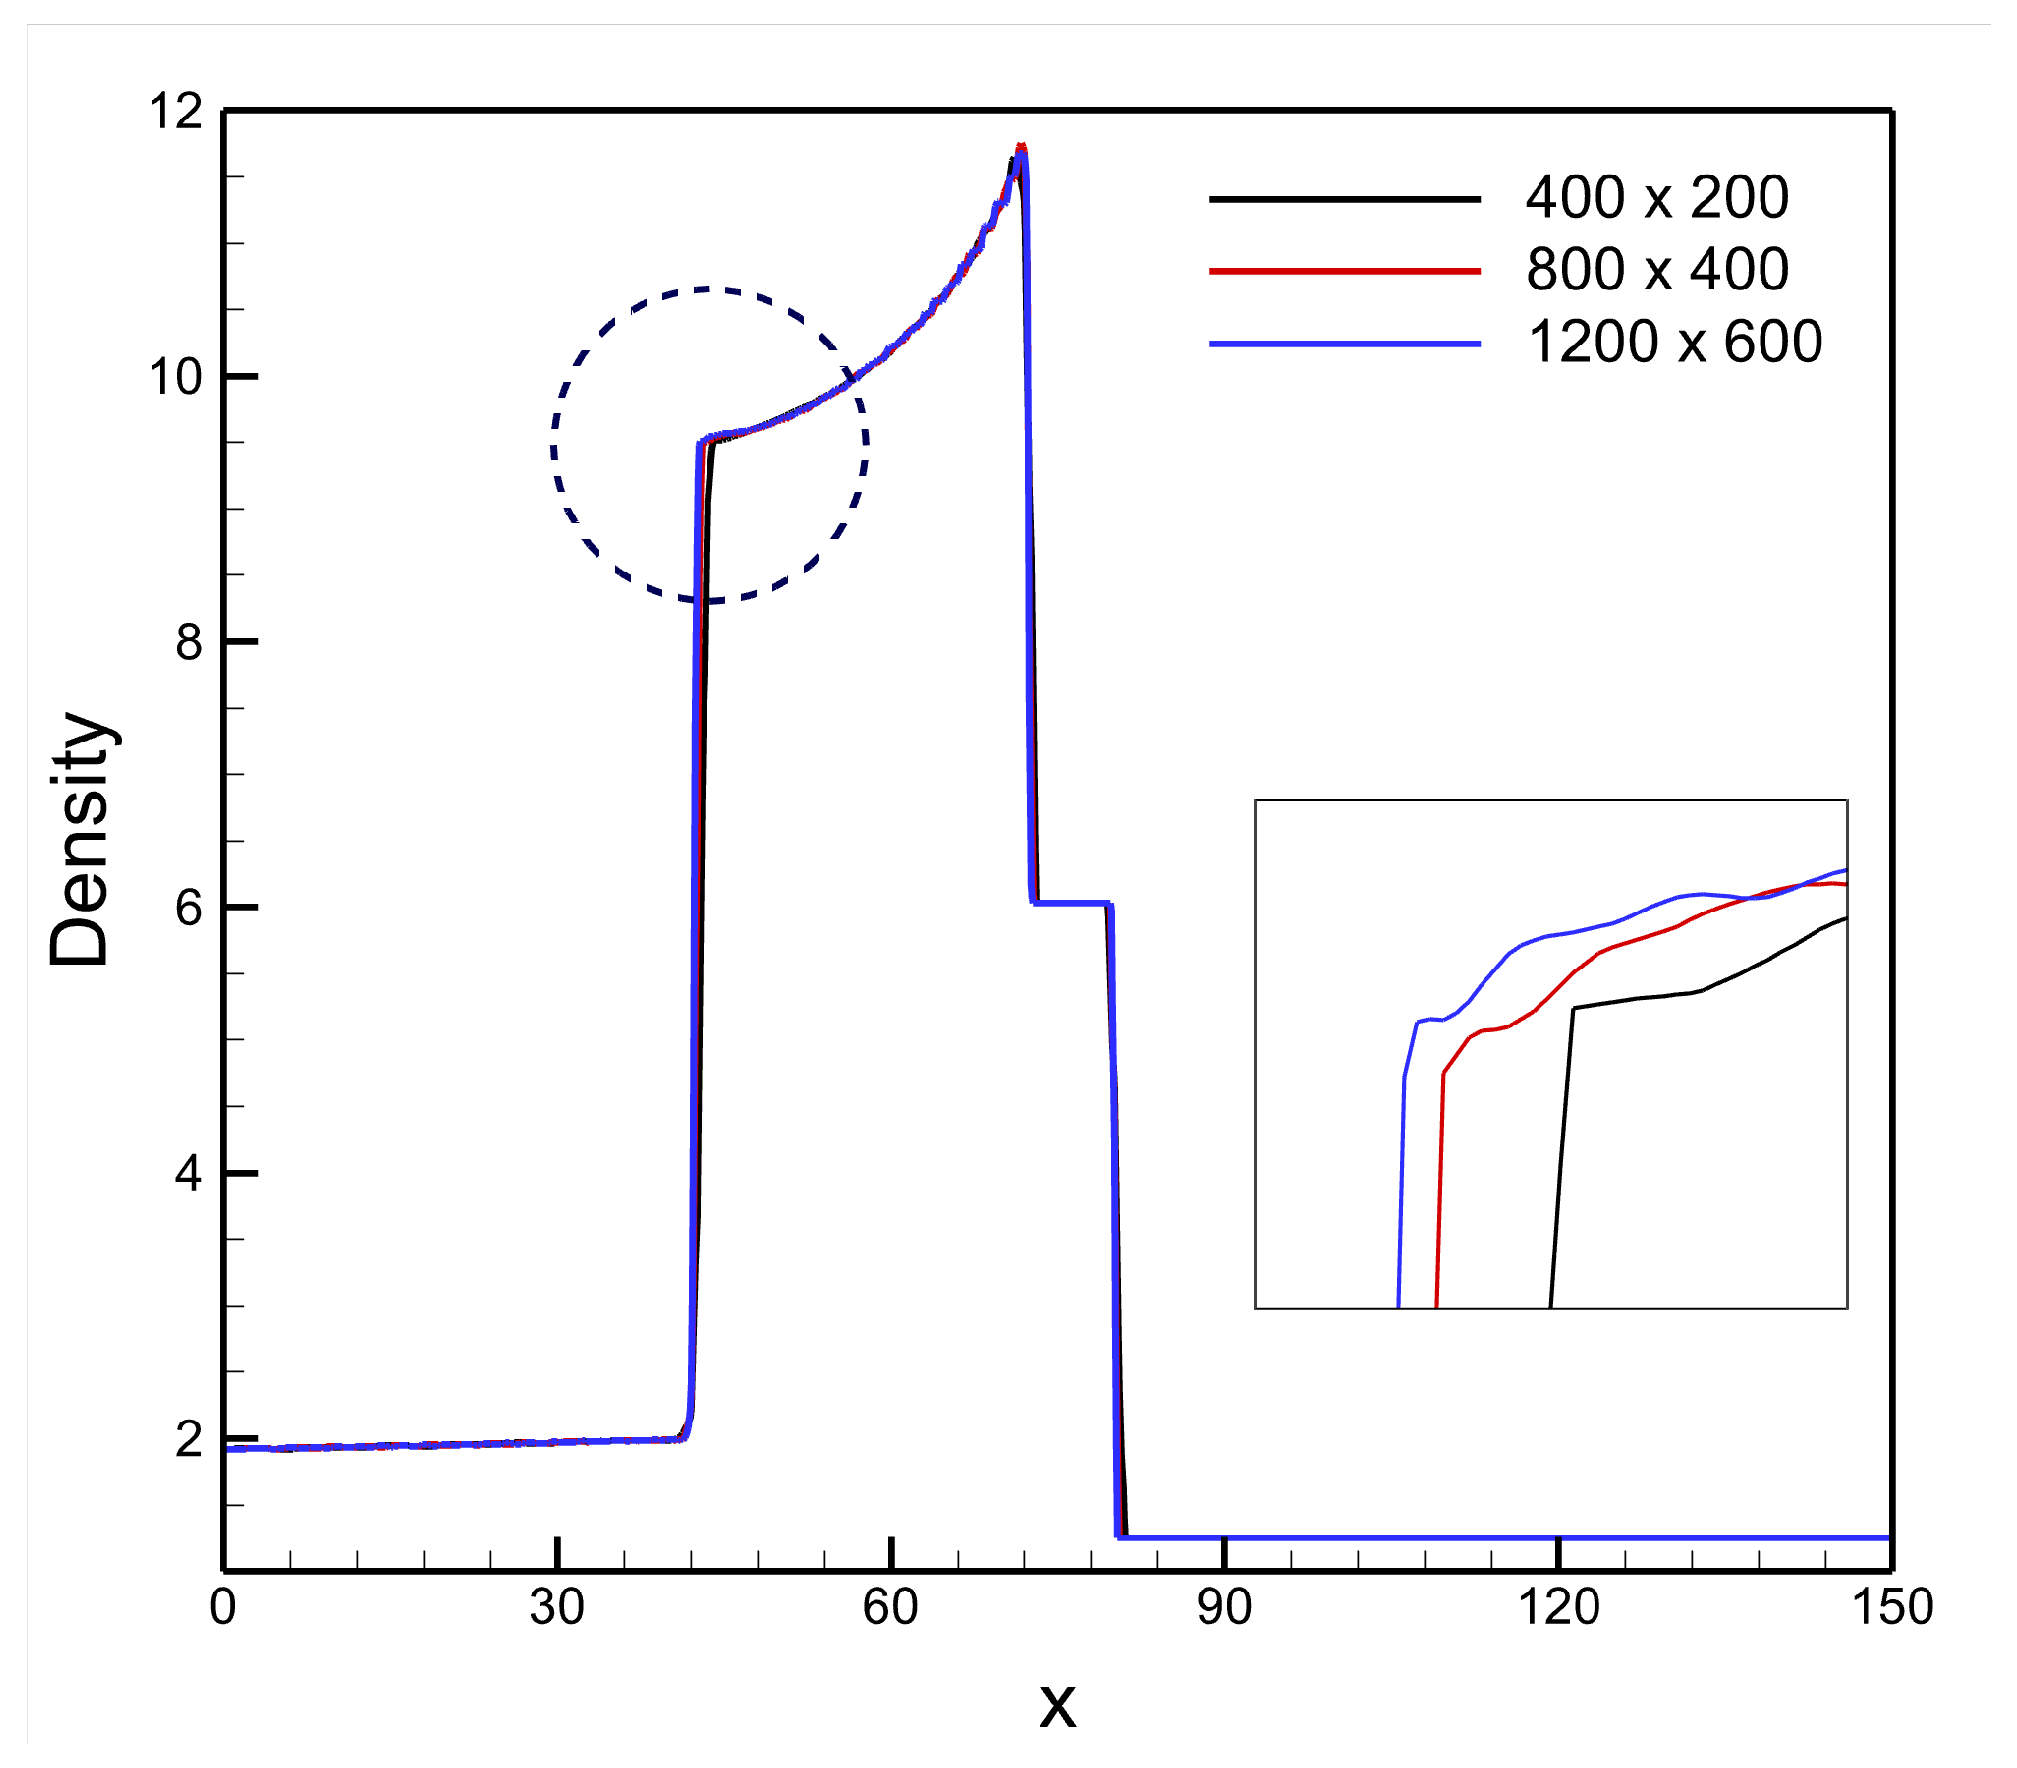
Figure 5 presents density contours at τ = 20 on three uniform grids. Refining the mesh from 400 × 200 to 800 × 400 sharpens the perturbed upstream interface, thins the post-shock shear layer, and reveals the onset of small roll-ups along I 1 . A further increase to 1200 × 600 primarily enhances these fine-scale structures, while the large-scale interface shape and the positions of the incident and transmitted shocks change only marginally relative to the medium grid, indicating near-convergence of the bulk dynamics. Figure 6 quantifies these observations using centerline density profiles at τ = 20 and y = 50 mm . The three curves nearly collapse, and the 800 × 400 and 1200 × 600 profiles overlap across the transmitted-shock plateau and the interface region. The inset highlights a monotonic sharpening of gradients with refinement, consistent with reduced numerical diffusion. Although the medium grid already yields converged global measures, all production simulations in this study employ a 1200 × 800 mesh. This choice more faithfully captures interfacial roll-up and minimizes numerical diffusion in thin shear layers. Spot checks against still finer meshes produced no material changes in integral metrics (e.g., shock locations and bubble/spike amplitudes), confirming that the reported results are insensitive to additional refinement.

4. Results and Discussion

In this section, we analyze the shock-accelerated interfacial instabilities in single-mode stratifications, detailing the shock–interface interaction dynamics and the resulting patterns of vorticity deposition that govern early impulse and subsequent wave-driven modulation. We then quantify the evolution using integral diagnostics and assess interface characteristics to isolate the role of layer thickness.

4.1. Shock–Interface Interaction Dynamics

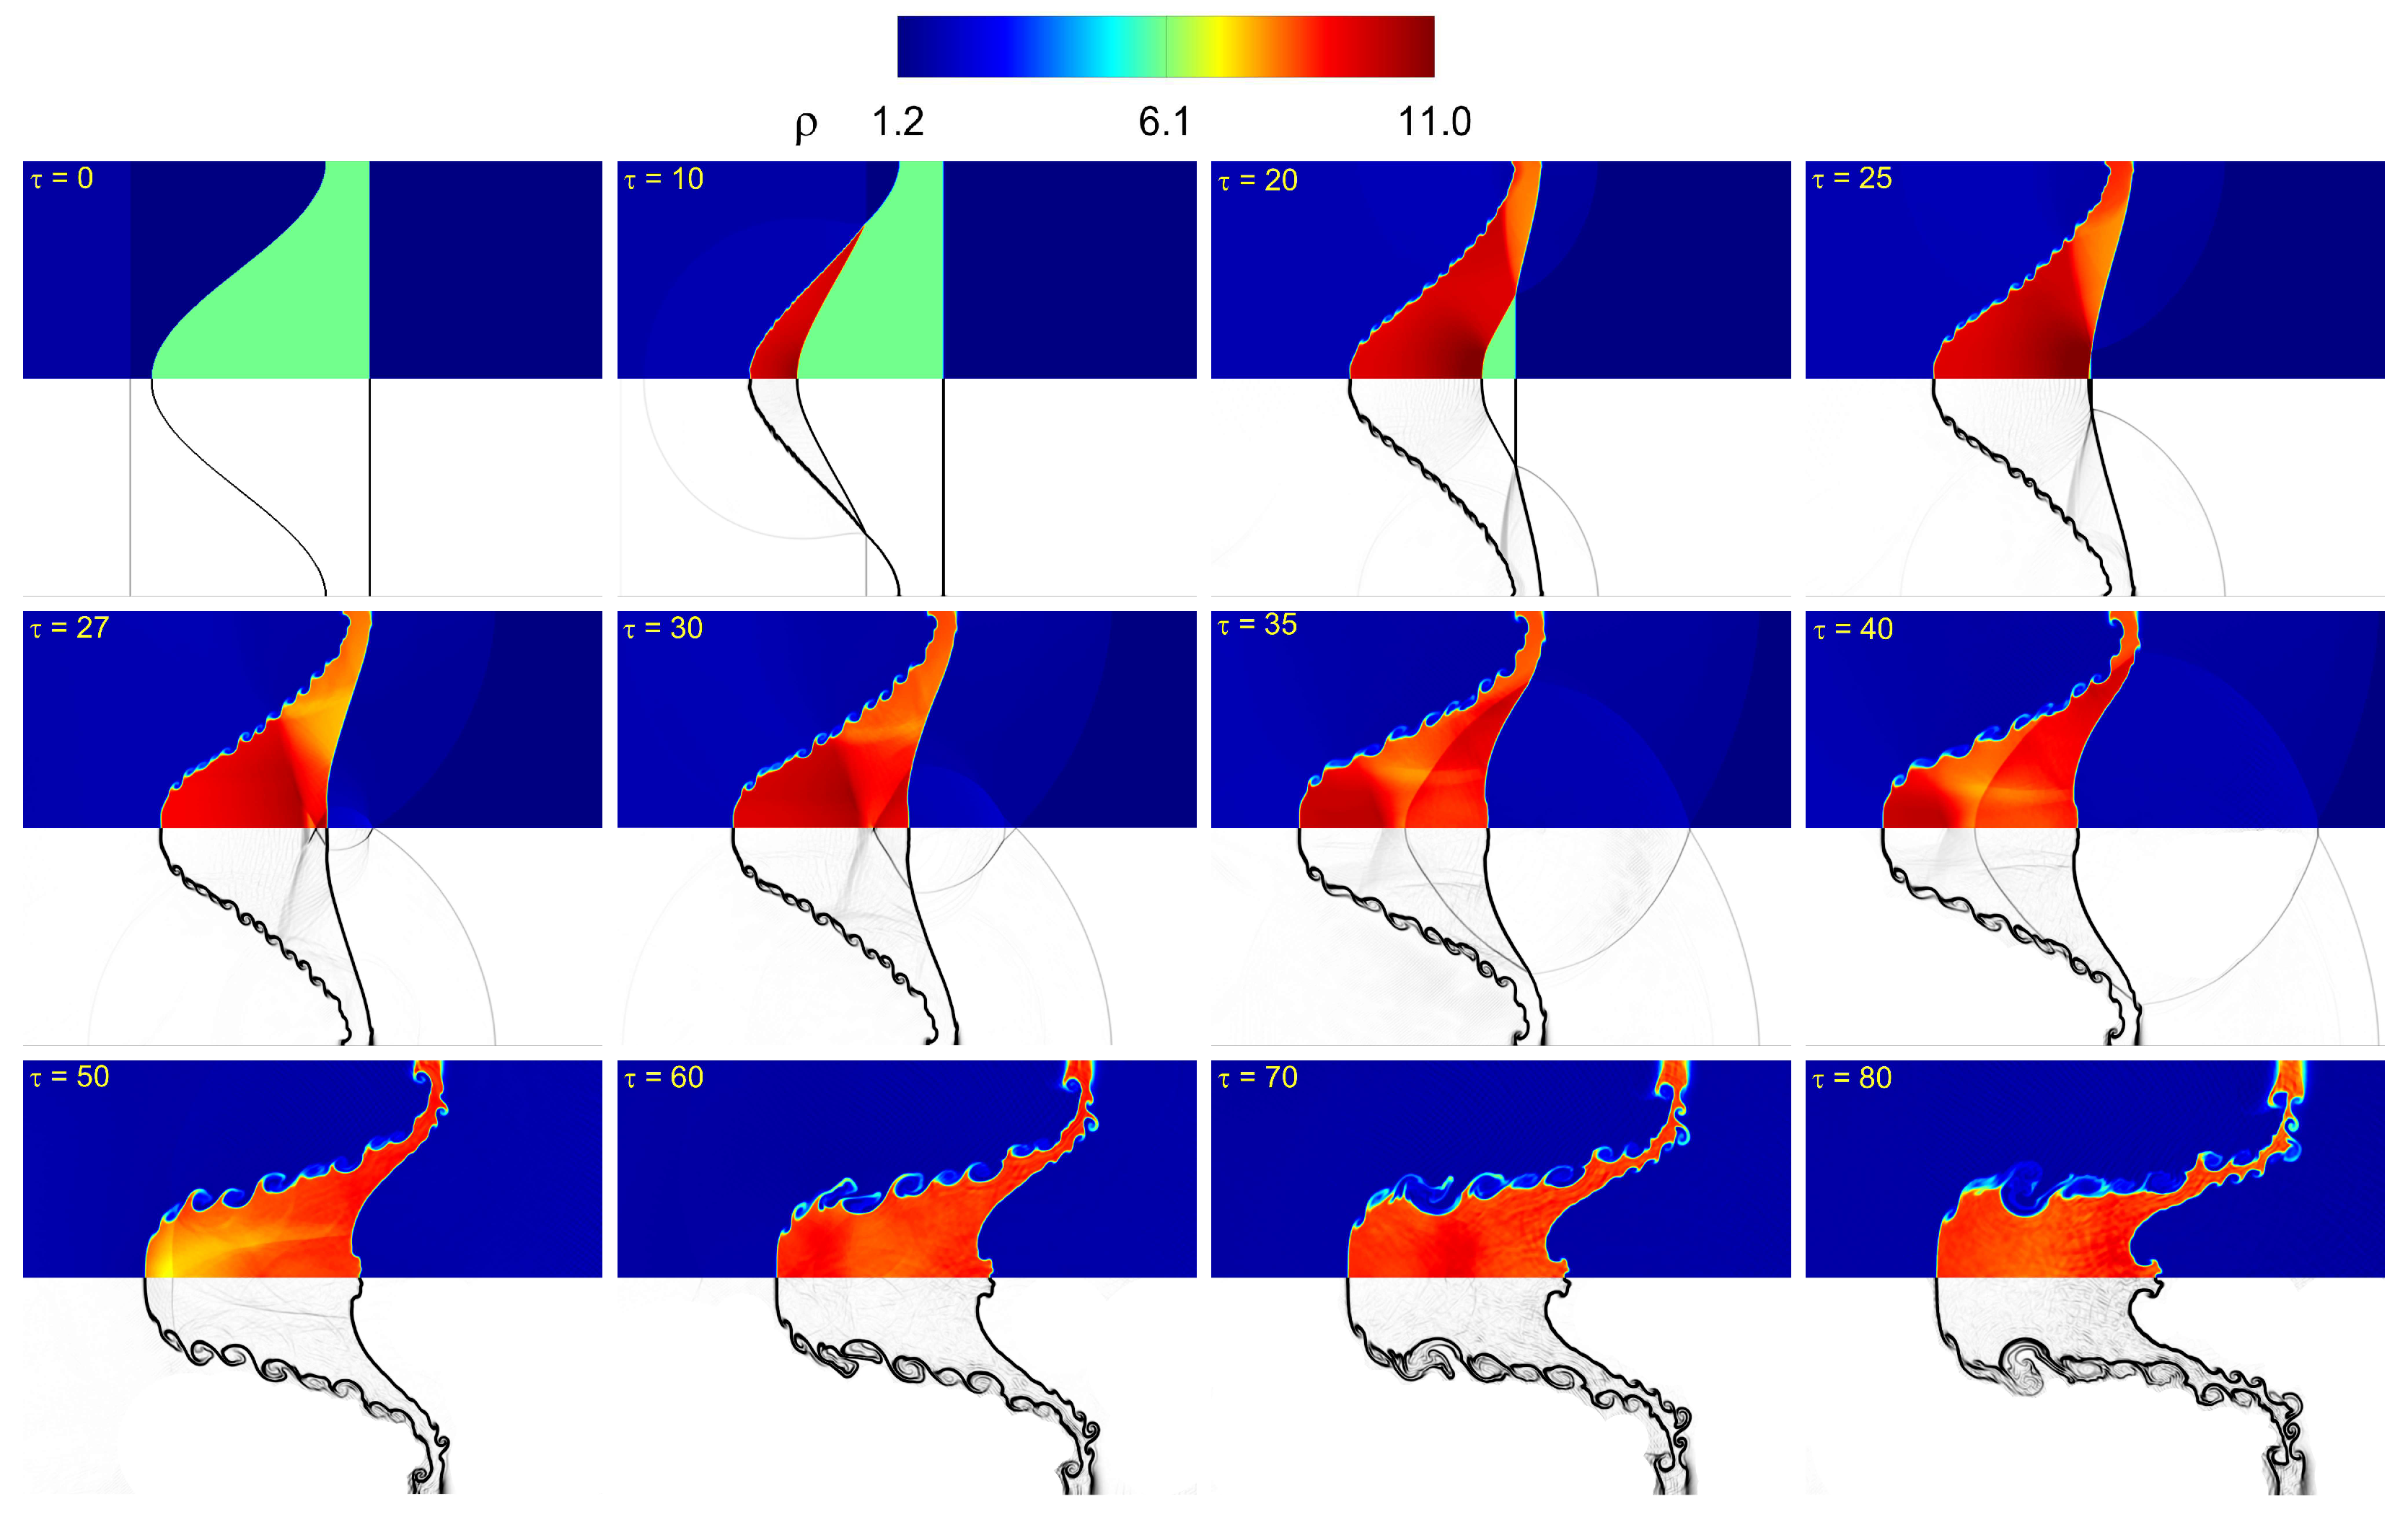
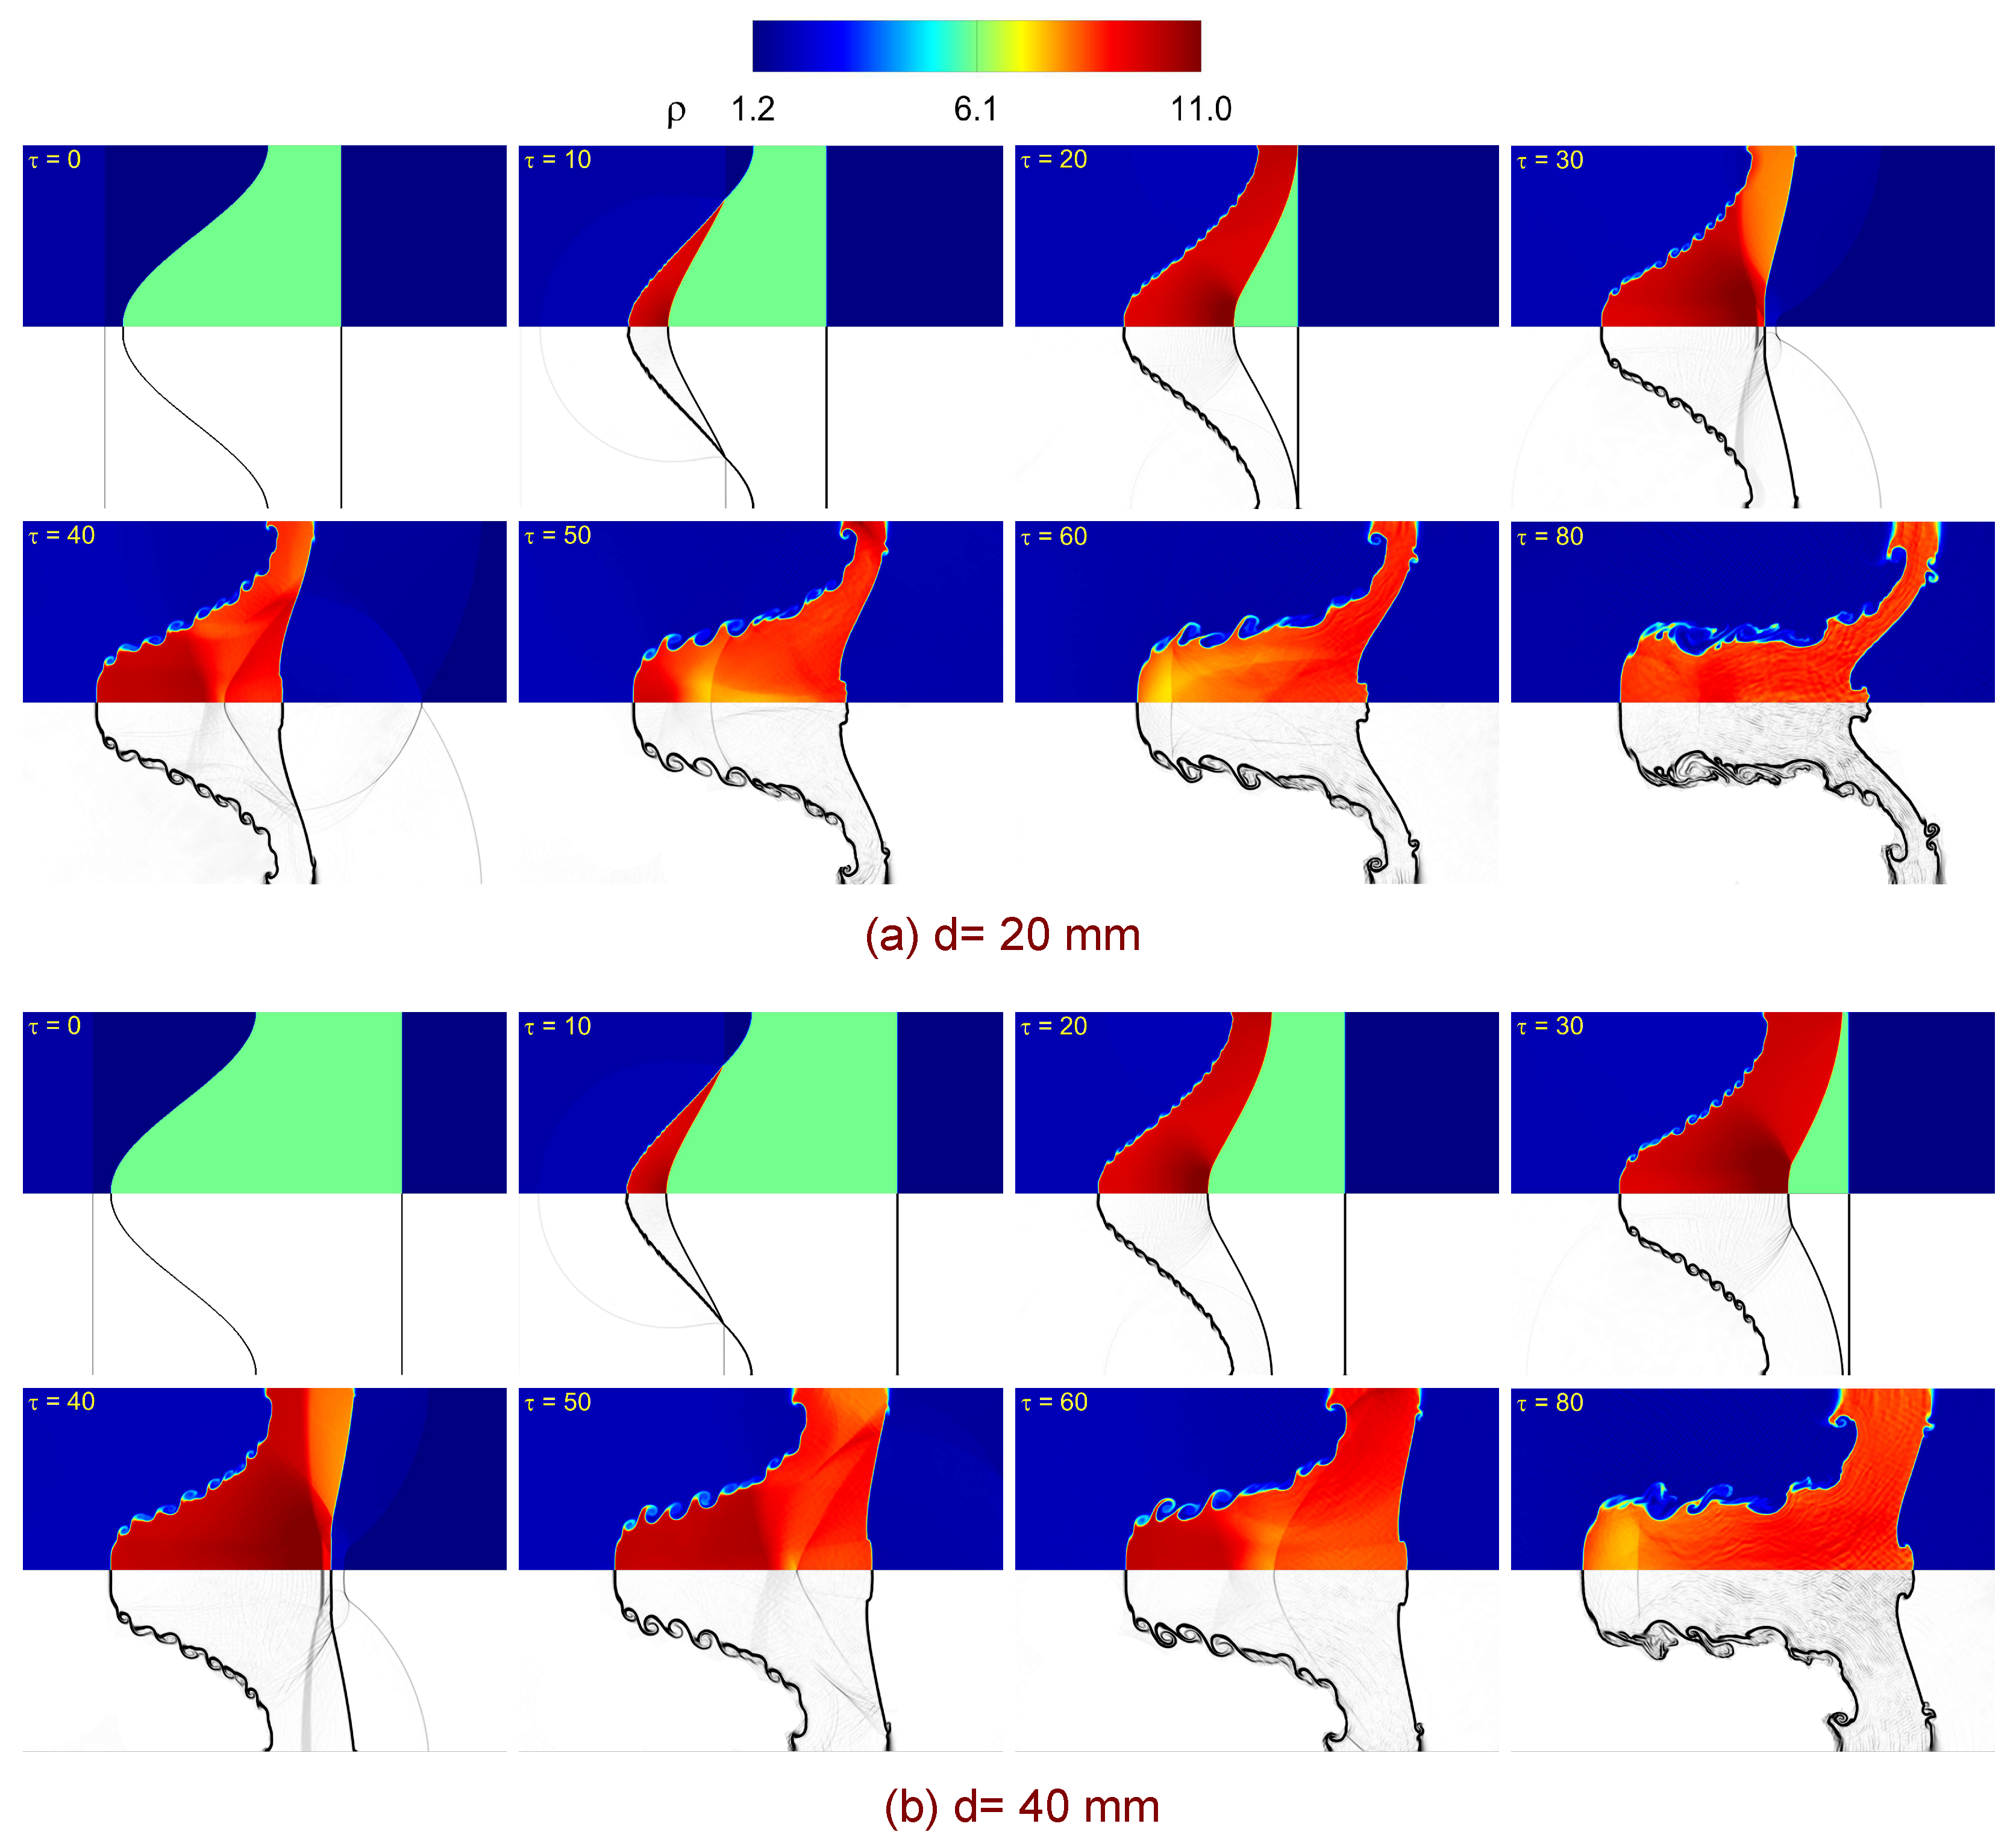
This subsection examines how the heavy-layer thickness d modulates the sequence of wave–interface events and the ensuing small-scale structures in single-mode stratifications, using time-resolved density/Schlieren fields (Figure 7, Figure 8 and Figure 9). Throughout, we use the following notation: IS (incident shock), I 1 (upstream wavy interface) and I 2 (downstream interface), RS (reflected shock in the shocked ambient), TS1 (shock transmitted into the heavy layer after the first impact), DS (diffracted shock emitted into the ambient at I 2 ), RTS/TS2 (reflected/transmitted pair launched at I 2 upon arrival of TS1 or its returns), IRR (interface re-impact generated by reverberations), KH (Kelvin–Helmholtz) shear layers/billows, and SF (local shock focusing near the bulge tip).
For thin layers ( d = 2.5 and 5 mm as illustrated in Figure 7), the IS first impinges on I 1 , splitting into RS and TS1. The baroclinic torque due to p × ρ misalignment deposits a vorticity sheet along I 1 , impulsively accelerating the interface and forming a bulge–spike pair. The post-shock slip initiates KH shear layers that promptly roll up into billows. Because the acoustic path across the layer is short, TS1 reaches I 2 early, launching DS into the ambient and an RTS/TS2 pair that begins to reverberate within the layer. These returns phase-lock with the interface motion, producing frequent IRR events that reinforce the circulation sheet, sharpen SF at the bulge tip, and hasten billow amplification and shedding. The thinner case ( d = 2.5 mm ) exhibits the earliest and strongest reverberation cycle, with accelerated amplitude growth, more intense KH roll-up, and jet pairing already by τ 60 80 . For d = 5 mm , the same mechanisms occur but with slightly delayed timing and somewhat reduced intensity over the same interval.
For the intermediate layer ( d = 10 mm ) as illustrated in Figure 8, the leading front remains comparatively smooth up to τ 30 because TS1 requires a longer acoustic transit to reach I 2 in contrast to Figure 7. When TS1 finally strikes I 2 ( τ 30 40 ), DS is emitted into the ambient, and an RTS/TS2 pair is launched, but the returns arrive less frequently and with reduced strength. Consequently, the added impulses are phase-lagged relative to the interfacial motion, and the cumulative baroclinic deposition proceeds in smaller, temporally separated bursts. The slip layer along I 1 thickens more gradually; KH billows remain short and weak through τ 40 , with larger spacing and later saturation. Attenuation of the transmitted wave across the thicker heavy gas further reduces the circulation injected per re-impact, postponing jet formation and pairing until τ 60 . The SF region at the bulge tip is broader, and its curvature is gentler than in the thinner cases.
For thick layers ( d = 20 and 40 mm as illustrated in Figure 9), the initial IS impact at I 1 again seeds a vorticity sheet and forms a bulge–spike pair, but the much longer transit distance across the heavy gas substantially delays the first I 2 interaction. For d = 20 mm , TS1 reaches I 2 only at τ 40 50 ; for d = 40 mm , this encounter is pushed toward the end of the plotted window. As a result, the RTS/TS2 reverberations are infrequent and weak, their impulses poorly synchronized with the interface motion. The leading front remains smooth for a longer duration, the shock foot broadens, and the slip layer thickens slowly. KH corrugations emerge late and remain short; for d = 20 mm , small billows appear only after τ 60 , whereas for d = 40 mm , they are barely initiated, and no jet pairing is observed within τ 80 .
Relative to the thin layers in Figure 7 ( d = 2.5 , 5 mm ), where early reverberations drive strong, phase-coherent IRR and rapid KH roll-up with jet pairing by τ 60 80 , increasing d (Figure 8 and Figure 9) systematically: (i) lengthens the acoustic transit time across the heavy layer (scaling approximately with d), (ii) increases attenuation of the transmitted wave, (iii) dephases the returns relative to the evolving interface, and (iv) reduces the circulation input per IRR event. Collectively, these effects weaken baroclinic vorticity reinforcement, broaden the SF region, delay KH onset and saturation, and suppress early jet formation. At matched τ , larger d yields smaller bulge amplitudes, smoother leading morphology, larger billow spacing, and fewer/smaller shed structures over the time window considered.
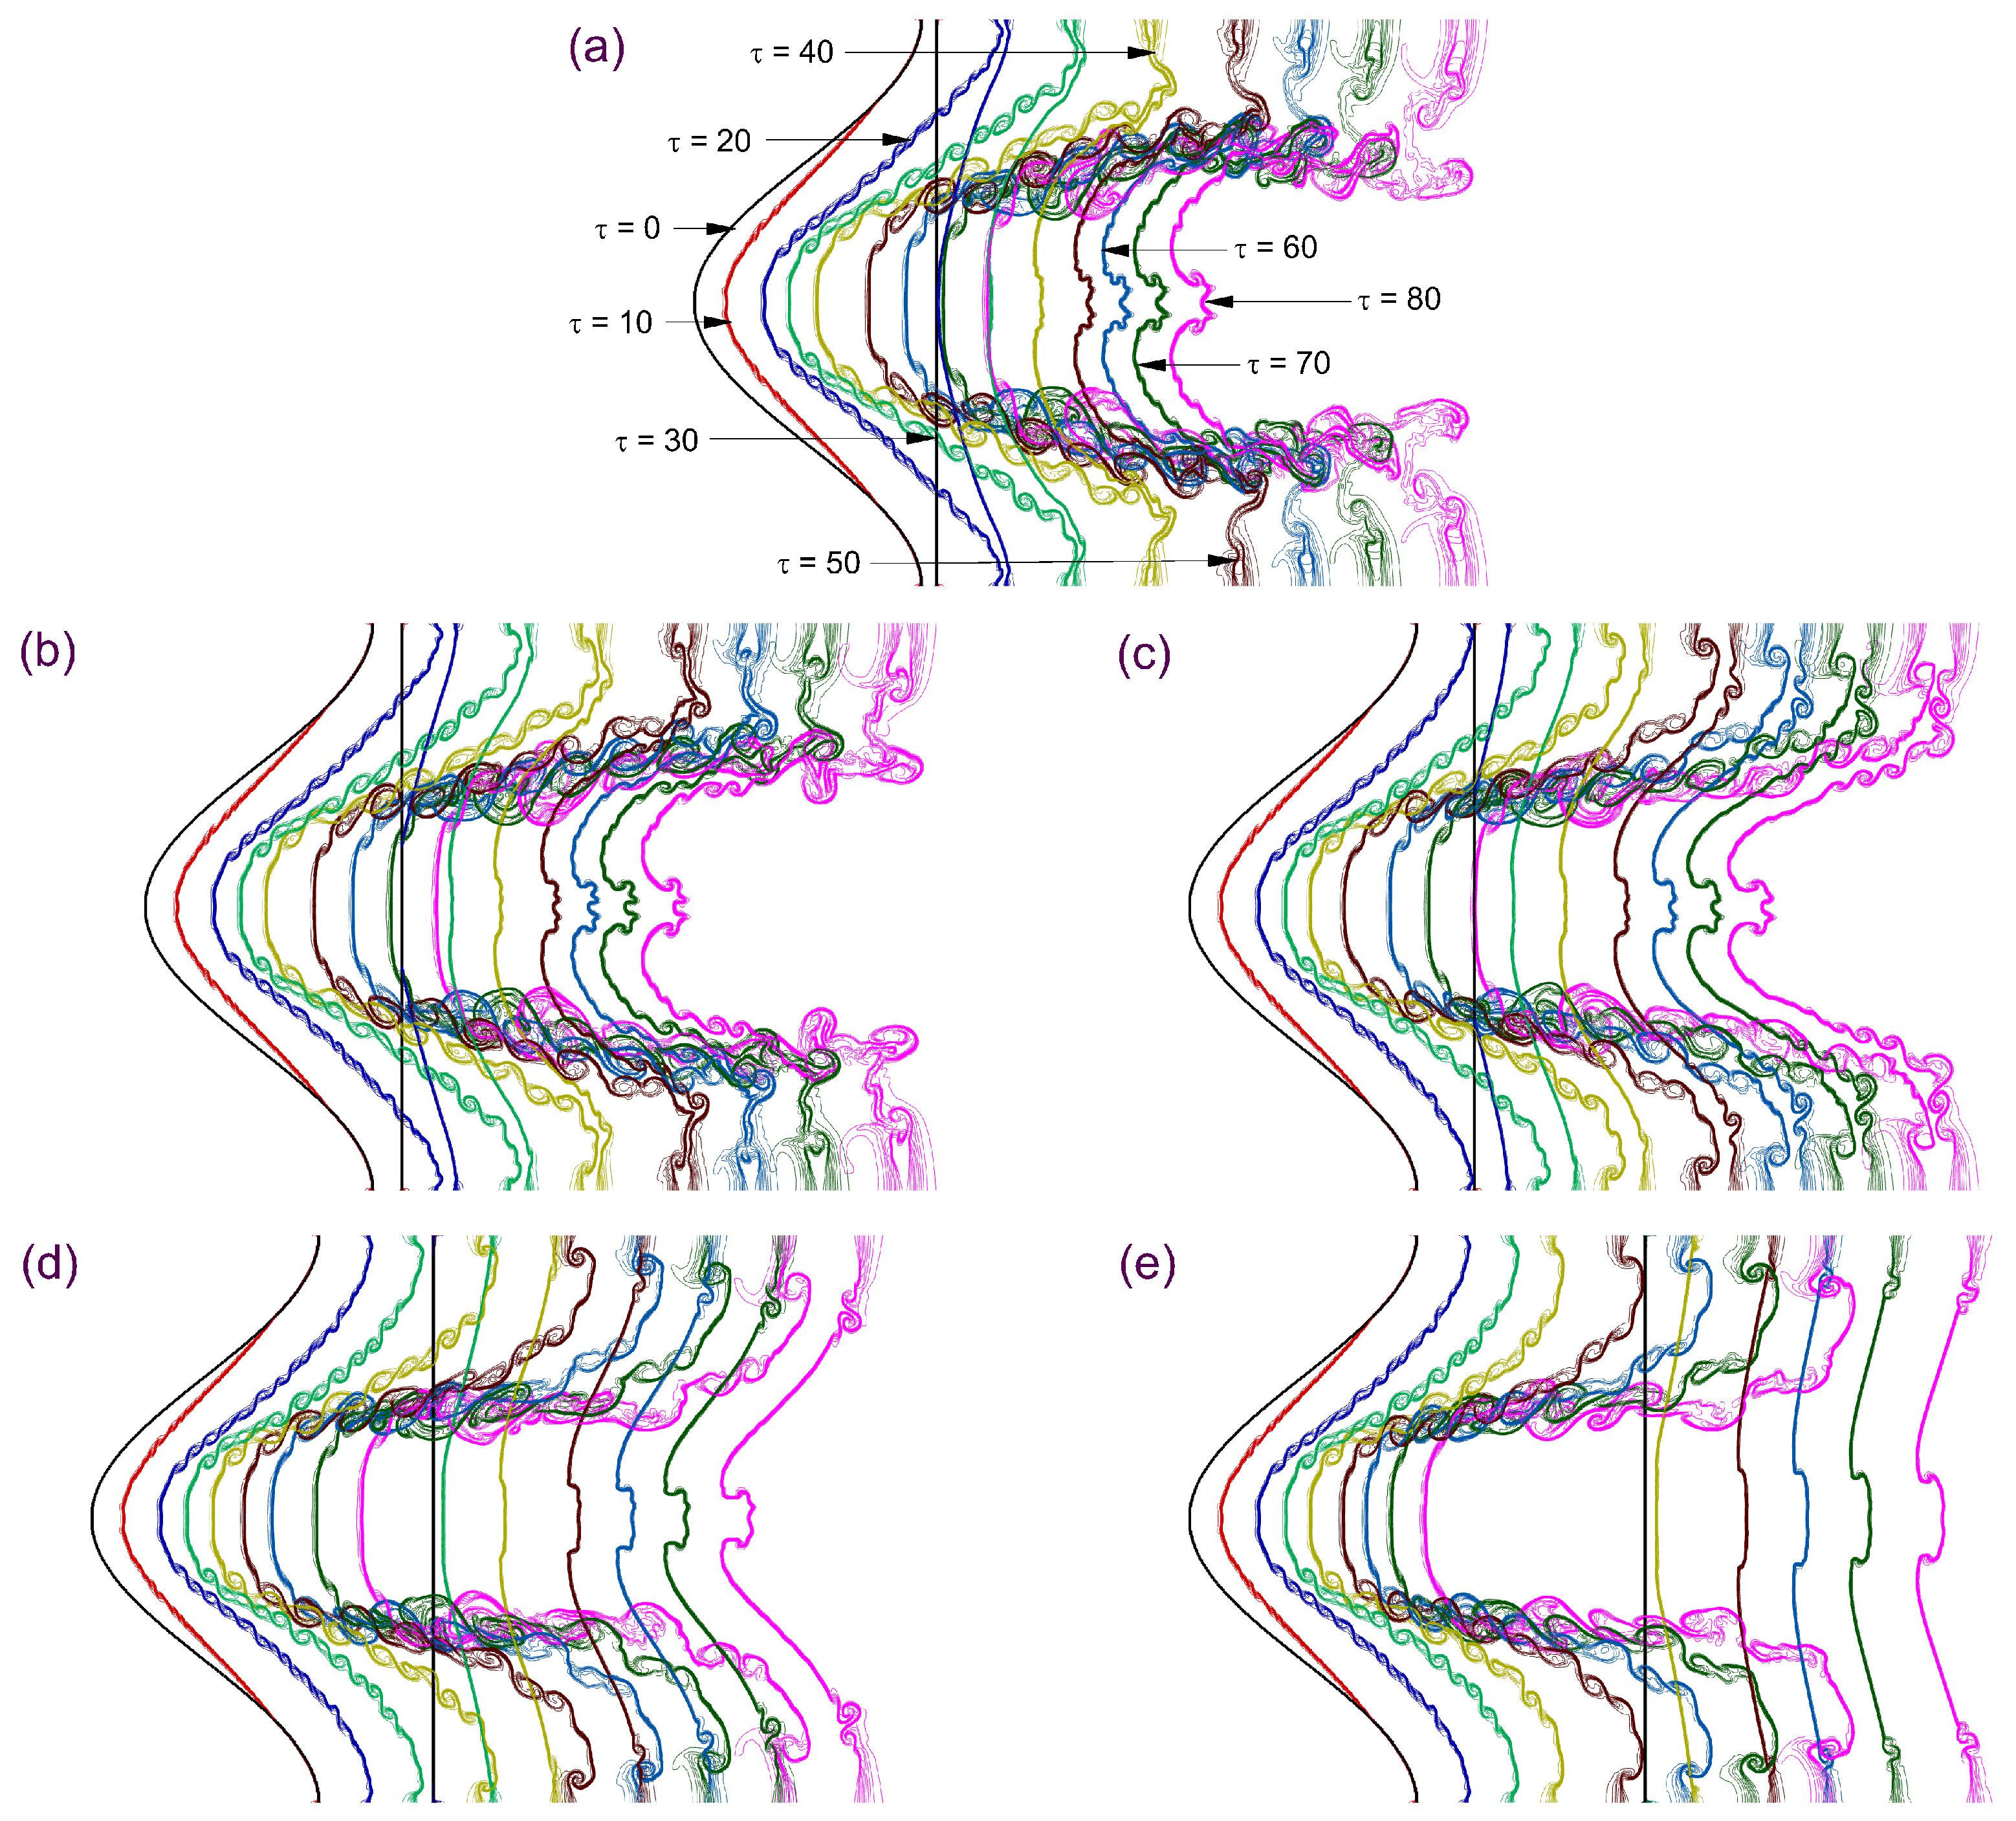
Figure 10 overlays instantaneous interface locations to show how heavy-layer thickness d governs wave–interface coupling and the emergence of small-scale structure: The incident shock (IS) first impacts the upstream interface I 1 , depositing a baroclinic vorticity sheet that forms a bulge–spike pair; the transmitted shock (TS1) then crosses the heavy layer and, upon reaching the downstream interface I 2 , emits a diffracted shock (DS) into the ambient and an RTS/TS2 pair that reverberates between I 1 and I 2 . For thin layers ( d = 2.5 and 5 mm ), the short acoustic path yields early, strong, and phase-coherent returns, producing frequent interface re-impacts (IRR), sharp shock focusing (SF) near the bulge tip, rapid contour spreading with τ , vigorous KH roll-up, and jet pairing by τ 60 80 . At d = 10 mm , longer transit time and attenuation render the returns less frequent and phase-lagged, so the slip layer thickens gradually, KH billows remain short and widely spaced up to τ 40 , and jet pairing is postponed beyond τ 60 with gentler tip curvature. For thicker layers ( d = 20 and 40 mm ), the first I 2 encounter is delayed to τ 40 50 or later, reverberations are sparse and weak, and the interface retains a smooth, slowly advancing envelope with muted KH corrugations and no jet pairing within τ 80 . Overall, increasing d lengthens the acoustic transit, dephases and attenuates the returns, reduces circulation input per IRR, broadens SF, delays KH onset and saturation, and thus suppresses early growth and small-scale shedding at matched τ .

4.2. Dynamics of Vorticity Deposition

The generation and evolution of vorticity in shock-accelerated multi-fluid flows are governed by the complex interplay between baroclinic torque, compressibility, vortex stretching, and viscous diffusion. When a shock wave encounters a perturbed density interface, the misalignment between the shock-induced pressure gradient and the pre-existing density gradient produces a baroclinic torque that deposits a sheet of vorticity along the interface. This initial impulse drives the deformation of the interface into bulge–spike structures and seeds the subsequent development of shear layers.
The evolution of deposited vorticity can be described by the vorticity transport equation (VTE) for compressible viscous fluids:
D ω D t = ( ω · ) u ω ( · u ) + 1 ρ 2 ρ × p + μ ρ 2 ω ,
where the first term represents vortex stretching and tilting, which redistribute vorticity and play a central role in turbulence development. The second term accounts for dilatational effects due to compressibility, which can amplify or attenuate vorticity depending on local flow divergence. The third term embodies baroclinic generation, the dominant source of circulation at shocked density interfaces. Finally, the last term captures viscous diffusion, which acts to smooth sharp gradients and broaden vorticity layers. Together, these mechanisms dictate how circulation is injected, redistributed, and dissipated in shocked stratifications. Baroclinic deposition provides the primary impulse for instability growth, while vortex stretching, compressibility, and viscosity modulate its subsequent evolution, shaping the emergence of secondary shear-layer roll-ups and eventual transition toward mixing.
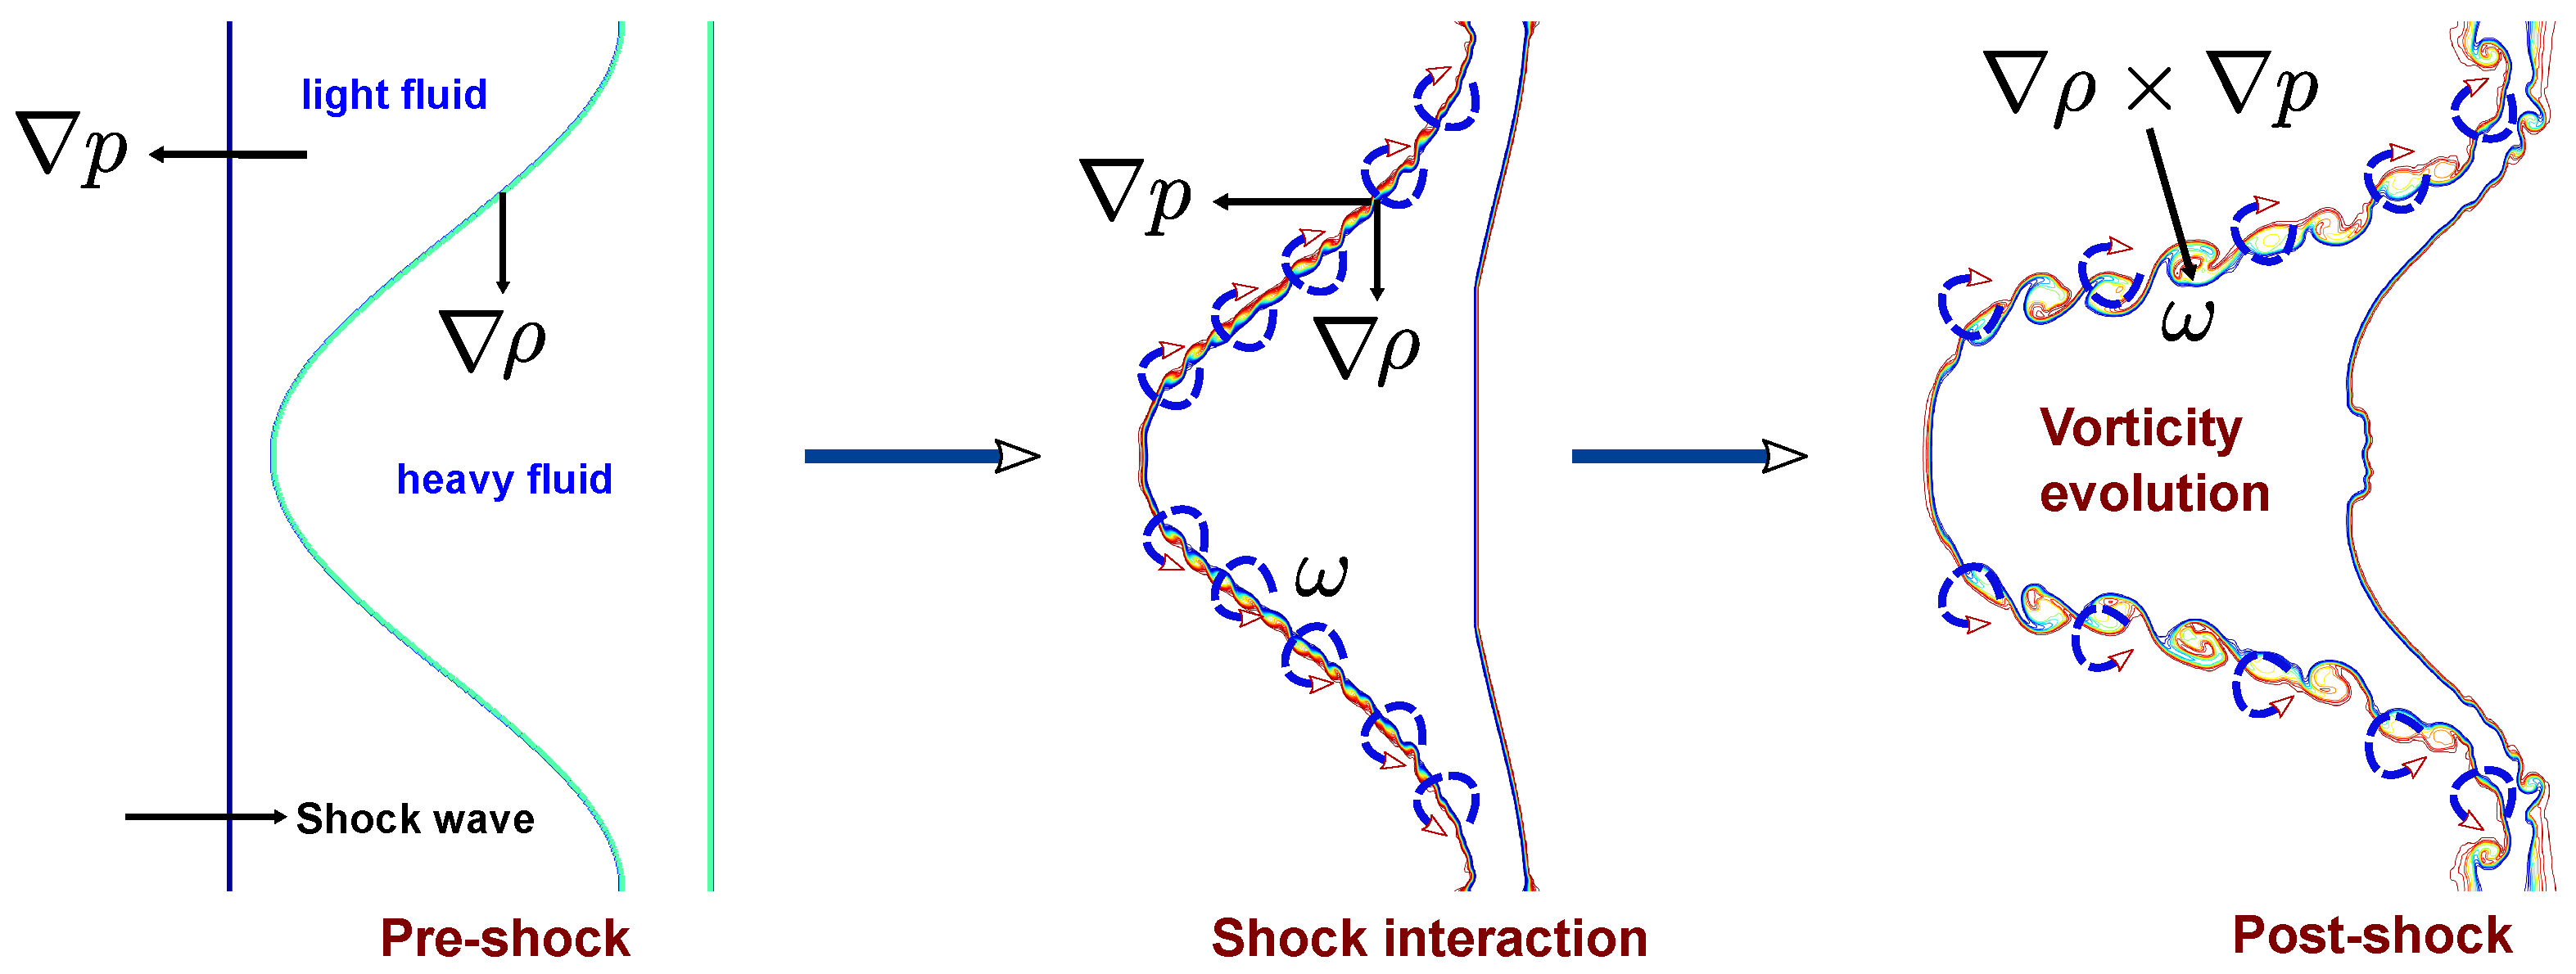
Figure 11 provides a schematic representation of the mechanisms responsible for vorticity deposition in a shock-accelerated heavy–light stratified interface. In the pre-shock state, a density gradient ( ρ ) exists across the perturbed interface between the heavy and light gases, while the pressure gradient ( p ) is aligned with the incident planar shock. During shock interaction, the shock front refracts across the perturbed interface, creating a local misalignment between p and ρ . This misalignment gives rise to a baroclinic torque ( ρ × p ) , which deposits a sheet of vorticity ω along the interface. The deposited vorticity drives the initial bulge–spike morphology and seeds the growth of shear layers. In the post-shock stage, this circulation evolves dynamically: the vorticity sheet rolls up into small-scale vortices, shear layers thicken, and secondary vortical structures emerge along the distorted interface. These processes are central to the subsequent development of RM instability, feeding into KH roll-ups, jet formation, and enhanced interfacial mixing.
For a finite-thickness heavy layer, the strength and coherence of baroclinic deposition are governed by the acoustic transit time
τ ac = d c h ,
where d denotes the heavy-layer thickness and c h is the sound speed in SF6. The efficiency of baroclinic vorticity reinforcement can be interpreted as a competition between the acoustic transit time τ ac and the characteristic KH growth time τ KH . When τ ac τ KH , reverberations occur frequently and remain phase-coherent, leading to enhanced baroclinic amplification. In contrast, when τ ac τ KH , the reverberations become phase-lagged and attenuated, resulting in reduced baroclinic deposition. Accordingly, thin layers ( d = 2.5 –5 mm) generate synchronized baroclinic peaks and rapid KH roll-up, whereas thick layers ( d = 20 –40 mm) delay and suppress these mechanisms due to increased τ ac and shock attenuation.
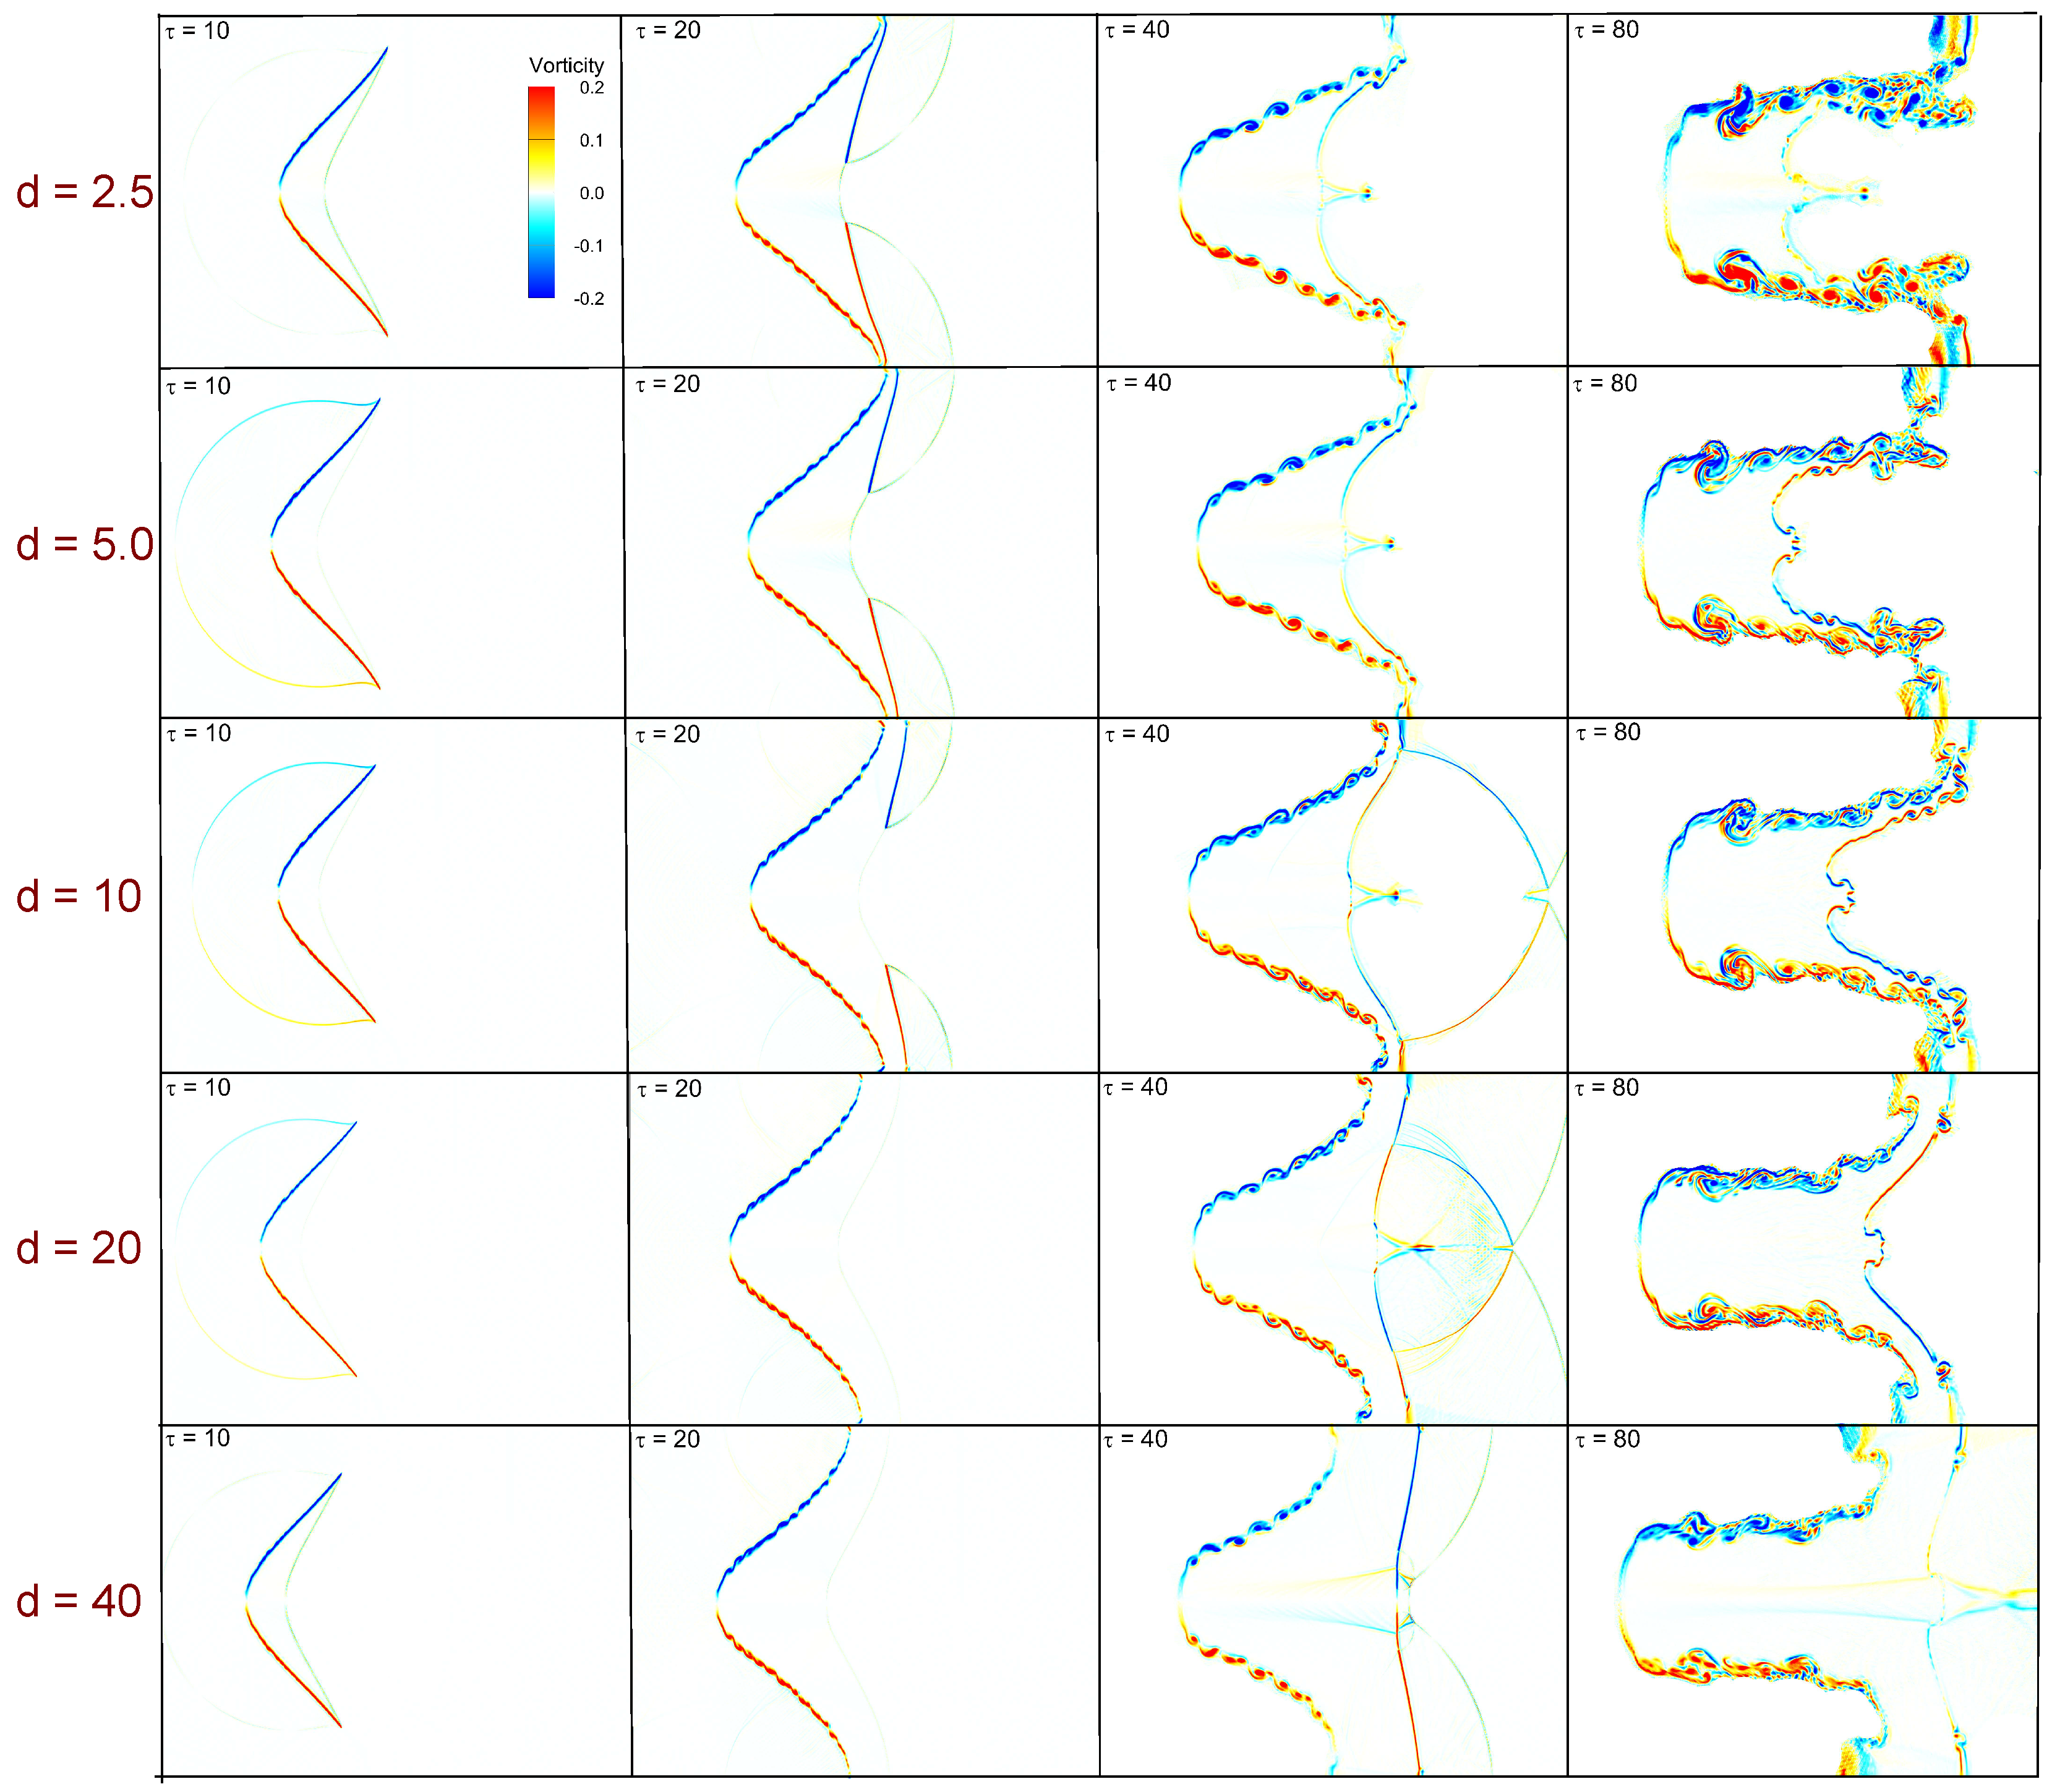
Figure 12 depicts the temporal evolution of vorticity distribution in shock-accelerated single-mode heavy–light stratifications for different heavy-layer thicknesses (d = 2.5, 5, 10, 20, 40 mm). At early times ( τ = 10 , 20 ), baroclinic torque, represented by the ( 1 / ρ 2 ) ( ρ × p ) term in Equation (20), dominates the dynamics by depositing circulation along the perturbed upstream interface, forming a vorticity sheet of alternating sign aligned with interface crests and troughs. As the flow evolves ( τ = 40 ), this sheet amplifies and begins to roll up due to shear instabilities, while the vortex stretching and tilting contribution ( ω · ) u redistributes vorticity around the bulge and spike tips. At later stages ( τ = 80 ), interactions with secondary shock reverberations further intensify the circulation, promoting vortex pairing and the emergence of Kelvin–Helmholtz billows. In parallel, the compressibility term ω ( · u ) modulates vorticity in regions of local expansion and compression, while viscous diffusion ( μ / ρ ) 2 ω acts to broaden shear layers and smooth sharp gradients. Collectively, these mechanisms explain the contrasting structures observed across layer thicknesses: thin layers favor rapid and coherent roll-up driven by strong baroclinic reinforcement, whereas thick layers exhibit attenuated circulation, delayed roll-up, and weaker small-scale vortical structures due to enhanced diffusion and longer acoustic transit times.
To further quantify the intensity of vortical structures generated during shock-accelerated instability, we examine the temporal evolution of the maximum and minimum vorticity within the computational domain. These extrema provide direct measures of the strength of circulation deposited along the perturbed interface and serve as indicators of the subsequent roll-up and amplification of small-scale vortices. Mathematically, the extrema are defined as
ω max ( t ) = max x D ω ( x , t ) , ω min ( t ) = min x D ω ( x , t ) ,
where ω ( x , t ) = ( × u ) ( x , t ) denotes the scalar vorticity field in two dimensions, and D represents the computational domain. In the discrete form used for numerical simulations, the extrema are evaluated at each time step as
ω max ( t n ) = max i , j ω i , j ( t n ) , ω min ( t n ) = min i , j ω i , j ( t n ) ,
with ω i , j ( t n ) denoting the computed vorticity at grid location ( i , j ) and time t n . Tracking ω max ( t ) and ω min ( t ) highlights the asymmetry between positive and negative vortical regions and provides a quantitative measure of how shock-driven baroclinic deposition evolves into nonlinear roll-up and mixing.
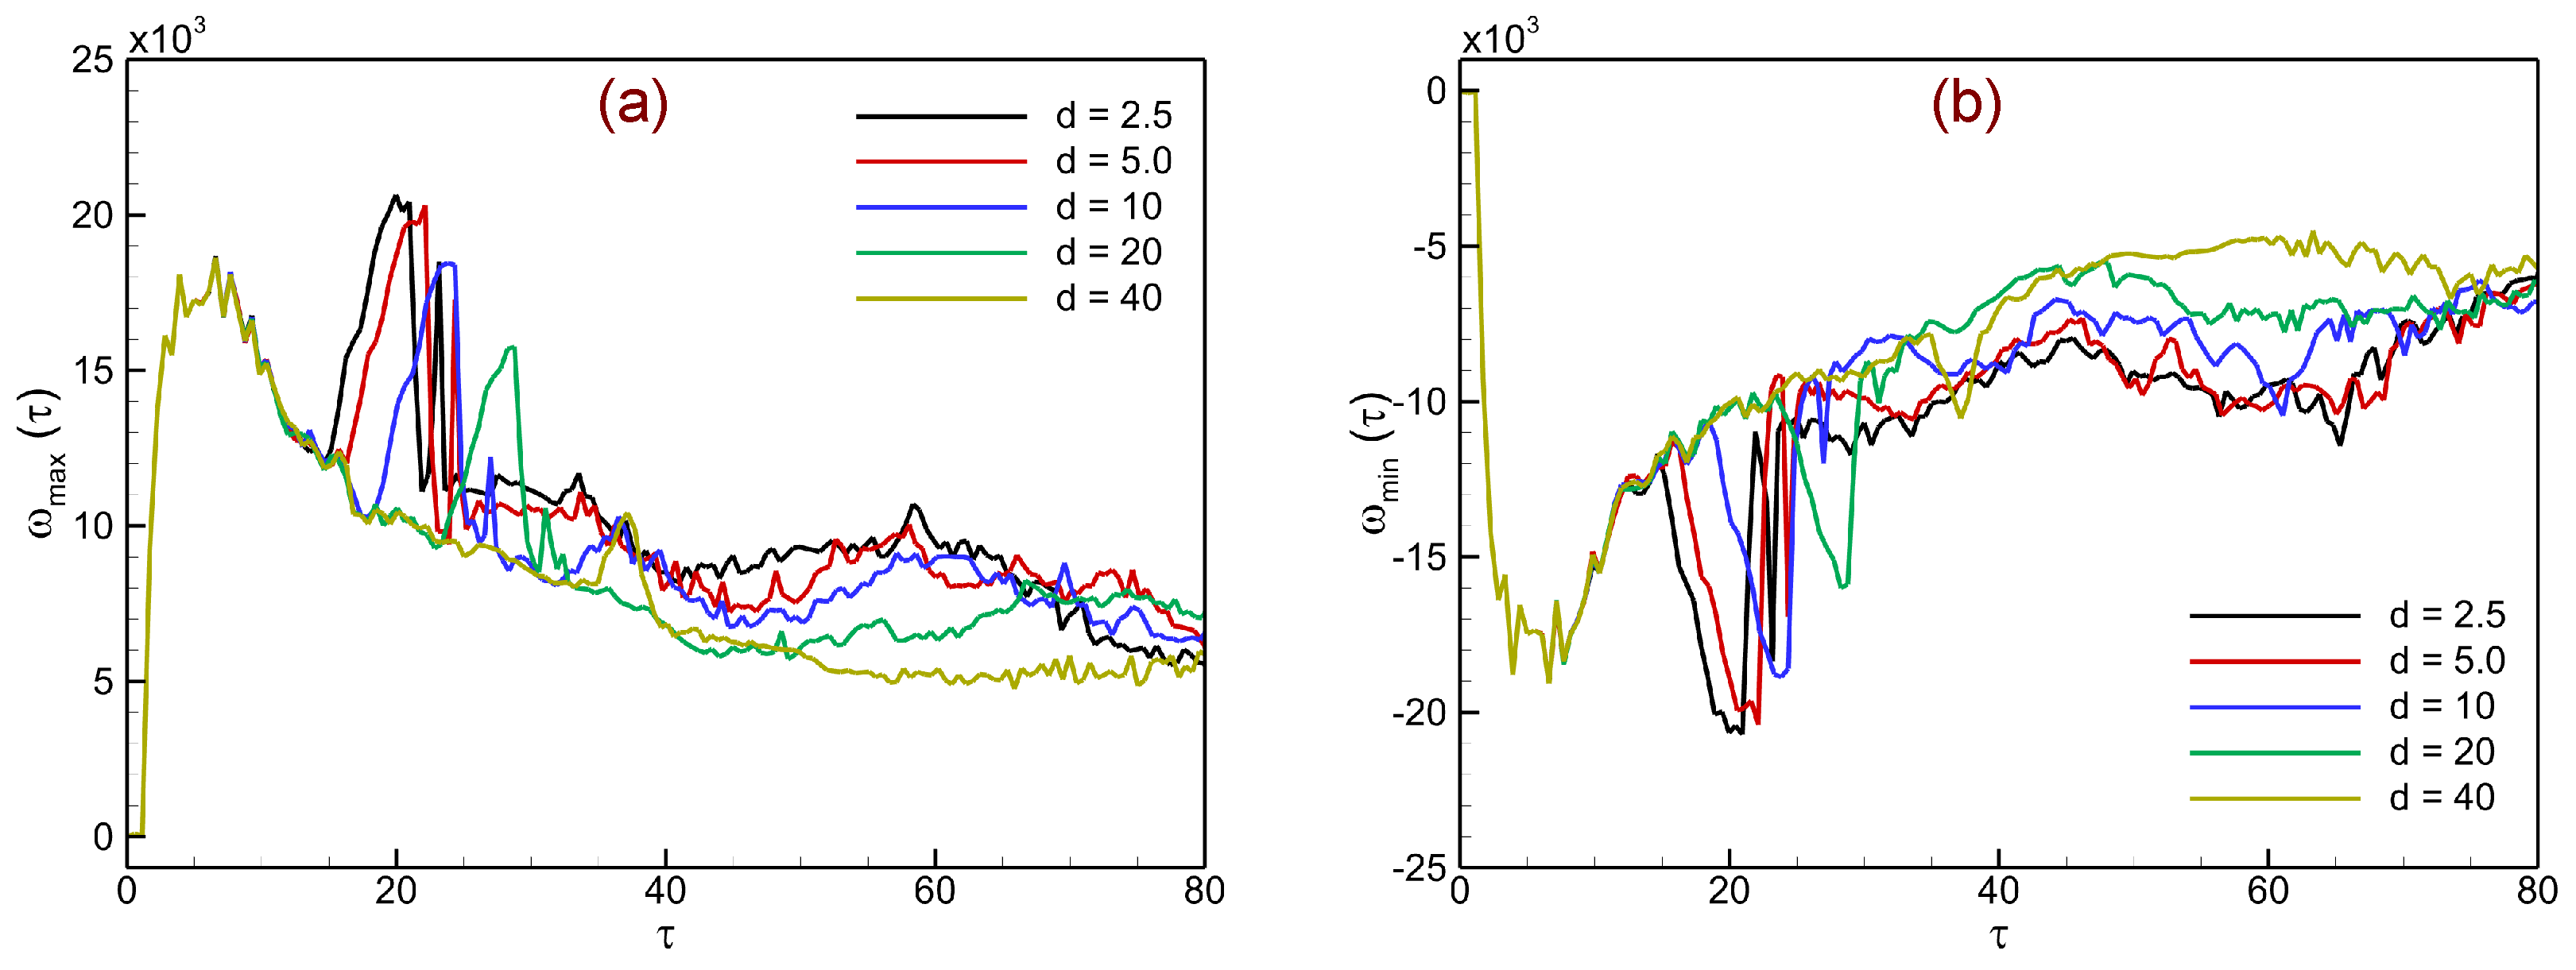
Figure 13 presents the temporal evolution of vorticity extrema in shock-accelerated single-mode light–heavy stratifications for different heavy-layer thicknesses. Figure 13a shows the maximum vorticity ω max ( τ ) , while Figure 13b shows the minimum vorticity ω min ( τ ) . Immediately after shock impact, sharp peaks appear in both ω max and ω min , reflecting the strong baroclinic deposition of circulation at the perturbed upstream interface. Thin layers ( d = 2.5 , 5 mm) exhibit higher initial peaks, indicating stronger and more localized vorticity sheets, consistent with the rapid roll-up and intense shear-layer evolution observed in the corresponding flow fields. For intermediate thickness ( d = 10 mm), the peak values are slightly reduced and spread over a longer time, while for thicker layers ( d = 20 , 40 mm) the extrema are considerably weaker, reflecting attenuated baroclinic input and slower growth of small-scale vortical structures.
As time progresses toward τ 80 , both ω max and ω min gradually decrease in magnitude, indicating a redistribution of circulation into larger-scale structures and dissipation by viscous effects. The asymmetry between the maximum and minimum curves highlights the imbalance between positive and negative vortical regions, which develops as shear instabilities amplify along the spike and bulge tips. To sum up, the vorticity extrema offer a quantifiable indicator of how layer thickness affects baroclinic deposition: bigger layers slow down the commencement of nonlinear roll-up and inhibit vorticity increase, whereas thinner layers maintain higher, early-time circulation amplification.

4.3. Integral Diagnostics

Integral diagnostics provide a global perspective on shock-accelerated instabilities by condensing spatially distributed fields into domain-integrated measures. These quantities capture the cumulative effects of key physical mechanisms and enable direct comparison across cases. In particular, they highlight the roles of dilatational, baroclinic, and viscous sources in vorticity production, as well as the evolution of circulation, enstrophy, and kinetic energy that govern instability growth and mixing efficiency.
To quantify the mechanisms of vorticity generation, we analyze the integral contributions of the principal production terms in the vorticity transport equation (VTE). Specifically, we consider the dilatational ( ω d i l ), baroclinic ( ω b a r o ), and viscous ( ω v i s ) components, each spatially integrated over the computational domain D. This diagnostic framework provides a consistent basis for evaluating how the relative importance of these mechanisms evolves across different layer configurations.
The integrated quantities are defined as
ω d i l ( τ ) = D ω ( · u ) d x d y ,
ω b a r o ( τ ) = D 1 ρ 2 ( ρ × p ) d x d y ,
ω v i s ( τ ) = D μ ρ 2 ω d x d y ,
where ω = ( × u ) z denotes the scalar vorticity, ρ is the density, p the pressure, and μ the dynamic viscosity. The use of absolute values ensures that the contributions reflect the net production magnitude, independent of sign. Collectively, these measures allow for a systematic comparison of compressibility, baroclinic torque, and viscous diffusion in driving the evolution of instability across different layer thicknesses.
Figure 14 illustrates the temporal evolution of the spatially integrated vorticity source terms in shock-accelerated single-mode light–heavy stratifications for varying heavy-layer thicknesses ( d = 2.5 , 5 , 10 , 20 , 40 mm). The dilatational contribution (Figure 14a) remains negligible before shock impact but rises sharply once the shock interacts with the perturbed interface. Thin layers ( d = 2.5 , 5 mm) exhibit the strongest and earliest amplification due to rapid reverberations between interfaces that intensify compressibility-driven vorticity modulation, while thicker layers ( d = 20 , 40 mm) respond more slowly and with smaller magnitudes because of longer acoustic transit times and stronger wave attenuation. The baroclinic contribution (Figure 14b) dominates the early stages, reflecting the misalignment of density and pressure gradients at the shocked interface. Thin layers again produce higher peaks from stronger and more coherent baroclinic torque deposition, whereas intermediate and thick layers ( d = 10 –40 mm) display a gradual rise, indicative of weaker synchronization between reverberated shocks and interface motion. This delayed and attenuated baroclinic input accounts for the slower roll-up and suppressed fine-scale vortex formation observed in the corresponding flow fields. The viscous contribution (Figure 14c) grows steadily throughout the evolution as a diffusive mechanism that broadens shear layers and smooths gradients. Its magnitude follows the same thickness-dependent trend, with larger values in thinner layers where intense small-scale activity enhances vorticity gradients, and weaker contributions in thicker layers where vortical structures remain subdued. Hence, the comparative trends show that thinner layers generate stronger dilatational, baroclinic, and viscous contributions, driving rapid vorticity amplification, vigorous shear roll-up, and early jet pairing, while thicker layers delay the onset and reduce the intensity of instability growth, leading to smoother interfaces and weaker mixing.
Circulation is a key diagnostic for quantifying the strength and evolution of vortical structures in shock-driven flows. In the context of instability evolution, it directly measures the baroclinically generated vortices deposited at the perturbed interface and reveals the balance between counter-rotating motions. The total circulation in the flow field is expressed as the spatial integral of vorticity over the computational domain D:
Γ Tot ( t ) = D ω d x d y .
For a more detailed characterization, circulation can be decomposed into its positive and negative components, corresponding to contributions from oppositely rotating vortical regions:
Γ Pos ( t ) = D , ω > 0 ω d x d y , Γ Neg ( t ) = D , ω < 0 ω d x d y .
These diagnostics quantify the circulation deposited along the interface by baroclinic torque. While Γ Pos and Γ Neg track the evolution of positive and negative vortical structures, their sum yields the net circulation Γ ( t ) , providing an integrated measure of the overall rotational strength in the shocked stratification.
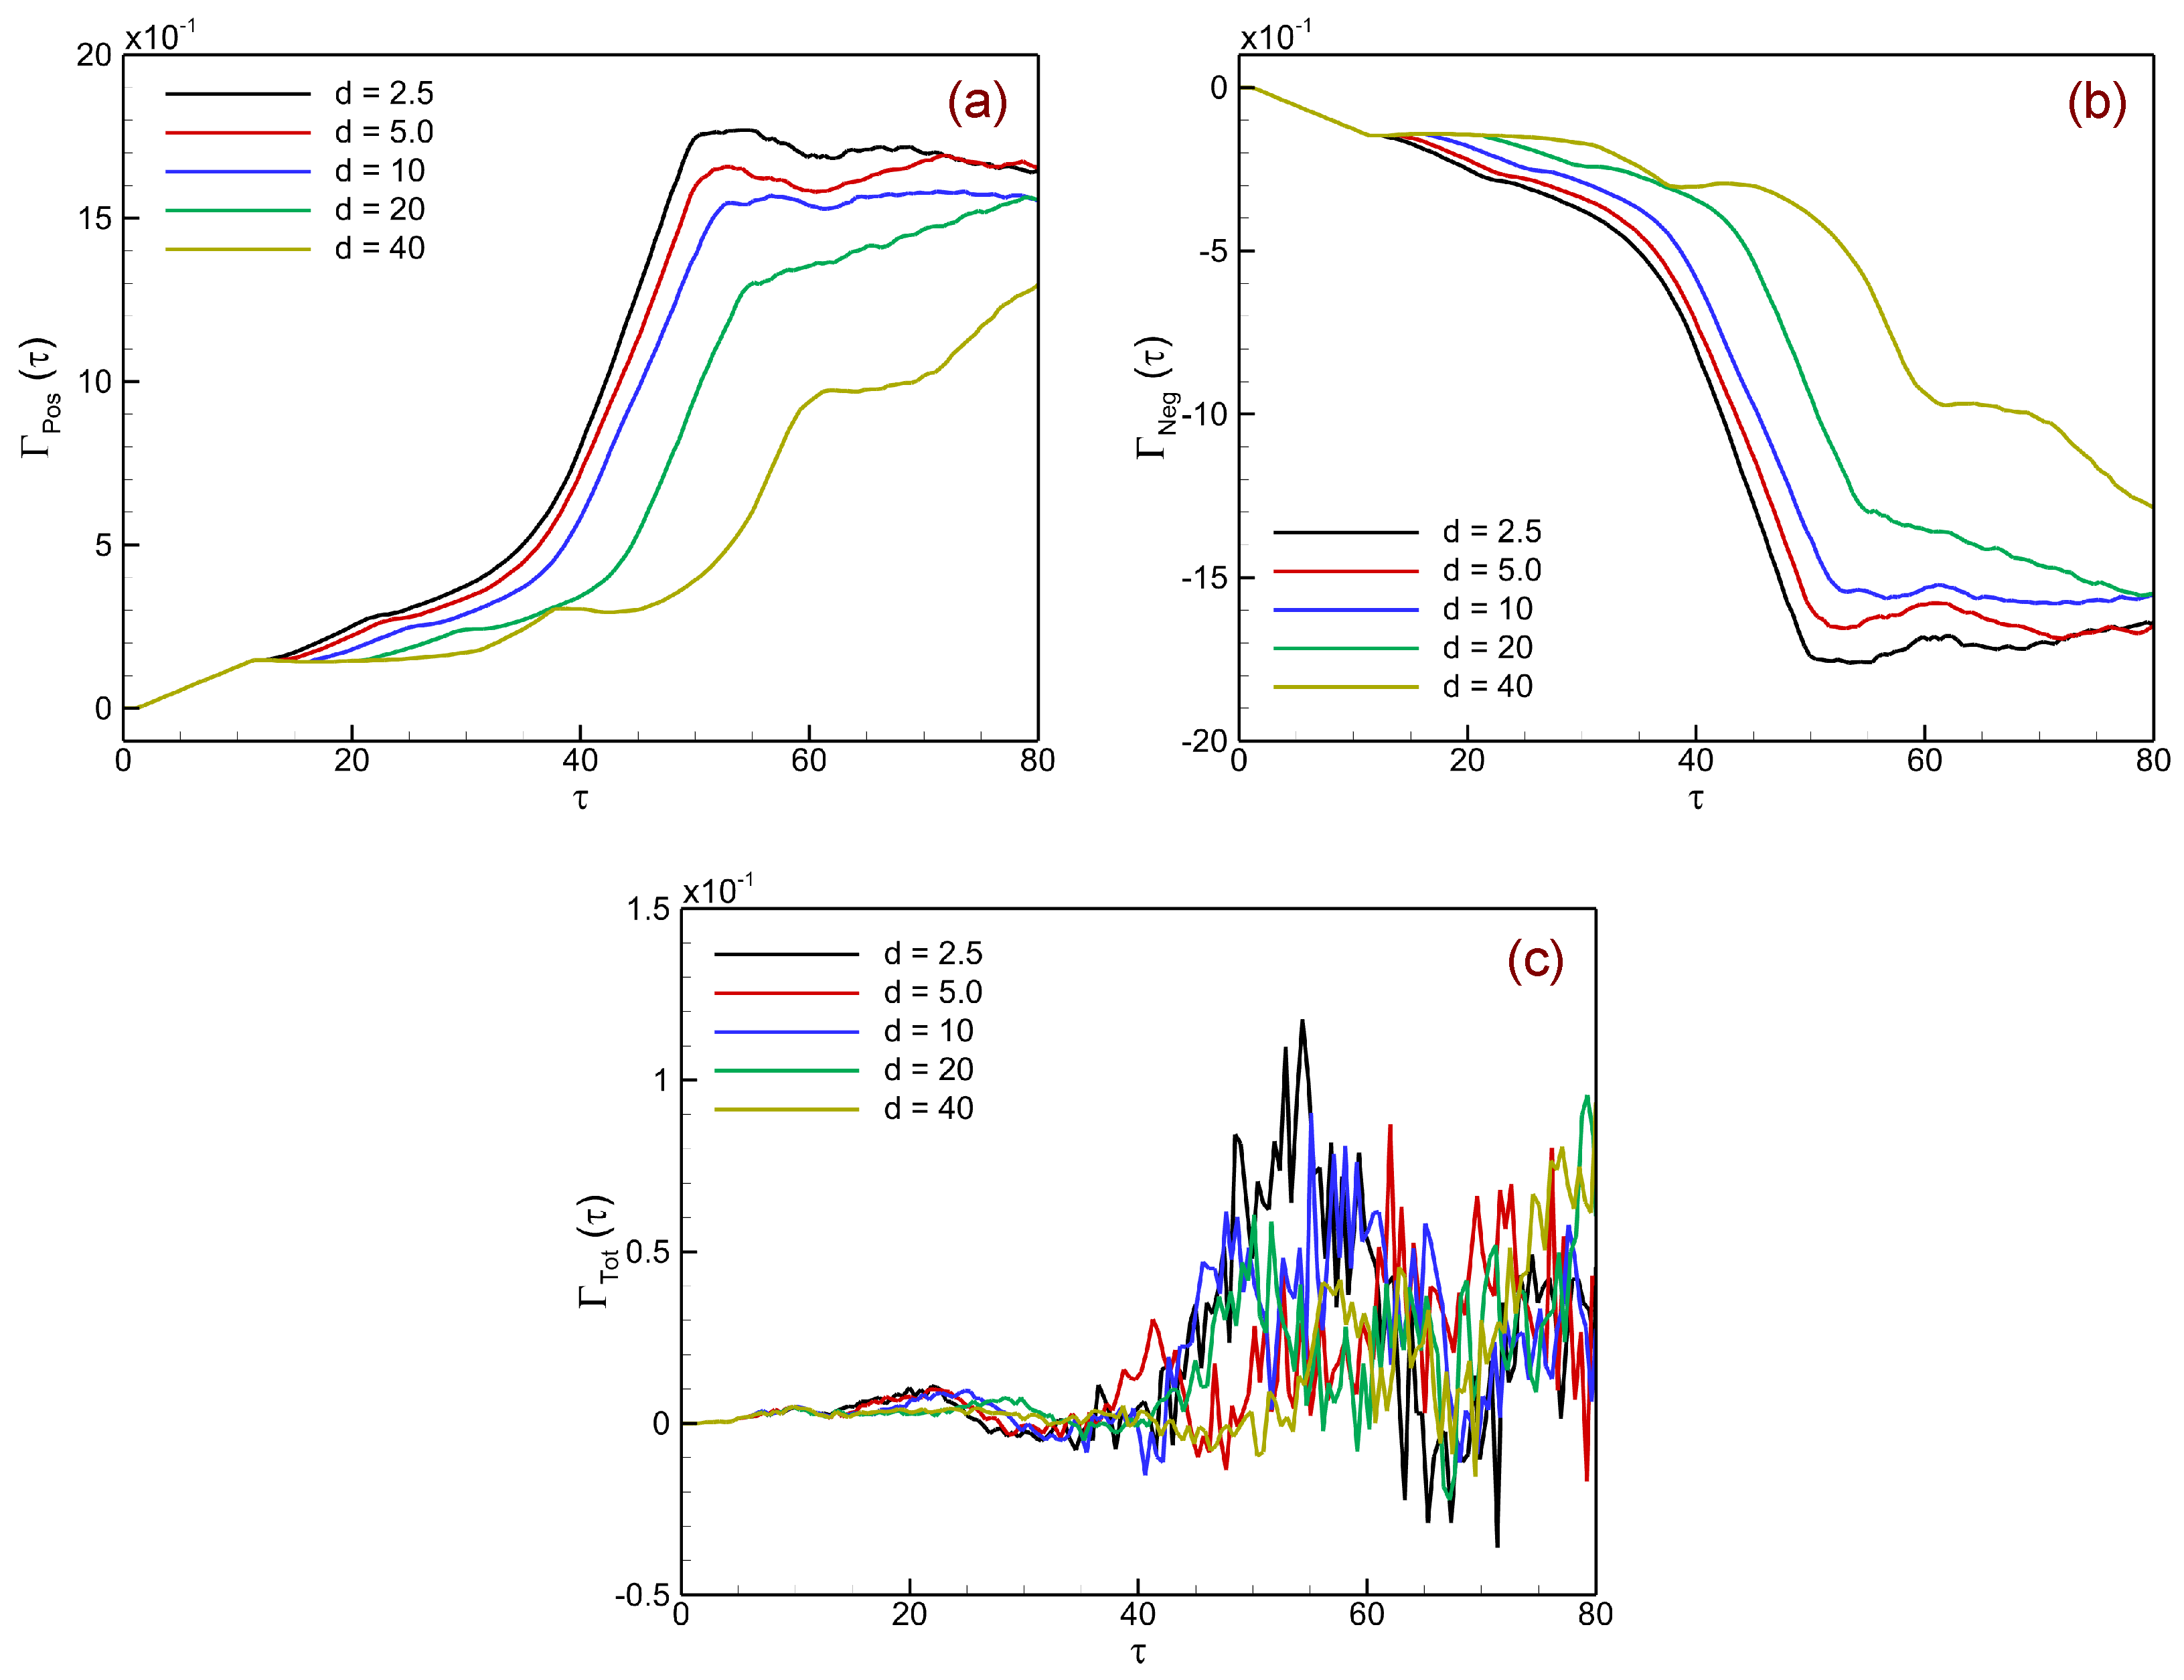
Figure 15 presents the temporal evolution of spatially integrated circulation in shock-accelerated single-mode heavy–light stratifications for different heavy-layer thicknesses ( d = 2.5 , 5 , 10 , 20 , 40 mm). Figure 15a shows the positive circulation Γ Pos , which grows rapidly after shock impact due to baroclinic vorticity deposition along interface crests. Thin layers ( d = 2.5 , 5 mm) reach higher values at earlier times, reflecting strong baroclinic reinforcement from frequent reverberations, while thicker layers ( d = 20 , 40 mm) exhibit delayed and weaker growth because of longer acoustic transit times and wave attenuation. Figure 15b displays the negative circulation Γ Neg , generated along interface troughs, which follows similar trends with thin layers producing stronger counter-rotating vortices and thick layers showing weaker, delayed growth. Figure 15c reports the net circulation Γ Tot , defined as the sum of Γ Pos and Γ Neg . Owing to the near-symmetric production of positive and negative vortices, Γ Tot remains close to zero, with only small fluctuations at later times arising from nonlinear roll-up, vortex pairing, and secondary shock interactions. Hence, thin layers generate stronger circulation and earlier roll-up, while thick layers suppress vorticity deposition and delay instability growth, consistent with the integrated source-term behavior shown in Figure 14.
The integral decomposition of the vorticity source terms further reinforces the mechanistic picture outlined in Section 4.2. As shown in Figure 14, thin layers exhibit sharp and synchronized peaks in the baroclinic contribution, consistent with short acoustic transit times ( τ ac τ KH ) that allow frequent, phase-coherent reverberations. This repeated reinforcement enhances circulation growth and accelerates the onset of secondary Kelvin–Helmholtz instabilities. By contrast, thick layers display weaker and broadened baroclinic peaks, as the longer transit times ( τ ac τ KH ) produce phase-lagged reverberations and attenuated deposition. The dilatational term is also amplified in thin layers, reflecting stronger compressibility effects due to tighter vortex roll-up, whereas the viscous contribution grows steadily with increased small-scale activity. Together, these trends provide a quantitative link between layer thickness, baroclinic forcing, and the subsequent evolution of circulation (Figure 15). In this way, the integral diagnostics confirm that acoustic transit time and phase synchronization are key parameters governing the thickness-dependent dynamics of RM instability.
Enstrophy and kinetic energy are essential diagnostics for shock-accelerated instabilities. Enstrophy quantifies the growth of baroclinically generated vortical structures, while kinetic energy measures the redistribution of bulk flow energy into interface deformation and small-scale motions. For a two-dimensional flow, the enstrophy is defined as the spatial integral of the squared vorticity over the computational domain D:
Ω ( t ) = D ω 2 ( x , y , t ) d x d y ,
which serves as a measure of the cumulative strength of vortical activity throughout the flow field. The total kinetic energy in the domain is expressed as
E k ( t ) = D 1 2 ρ ( x , y , t ) u 2 ( x , y , t ) + v 2 ( x , y , t ) d x d y ,
providing a global measure of the bulk momentum and its progressive transfer into interface deformation, shear layers, and small-scale vortices that emerge during the nonlinear stage of RMI growth.
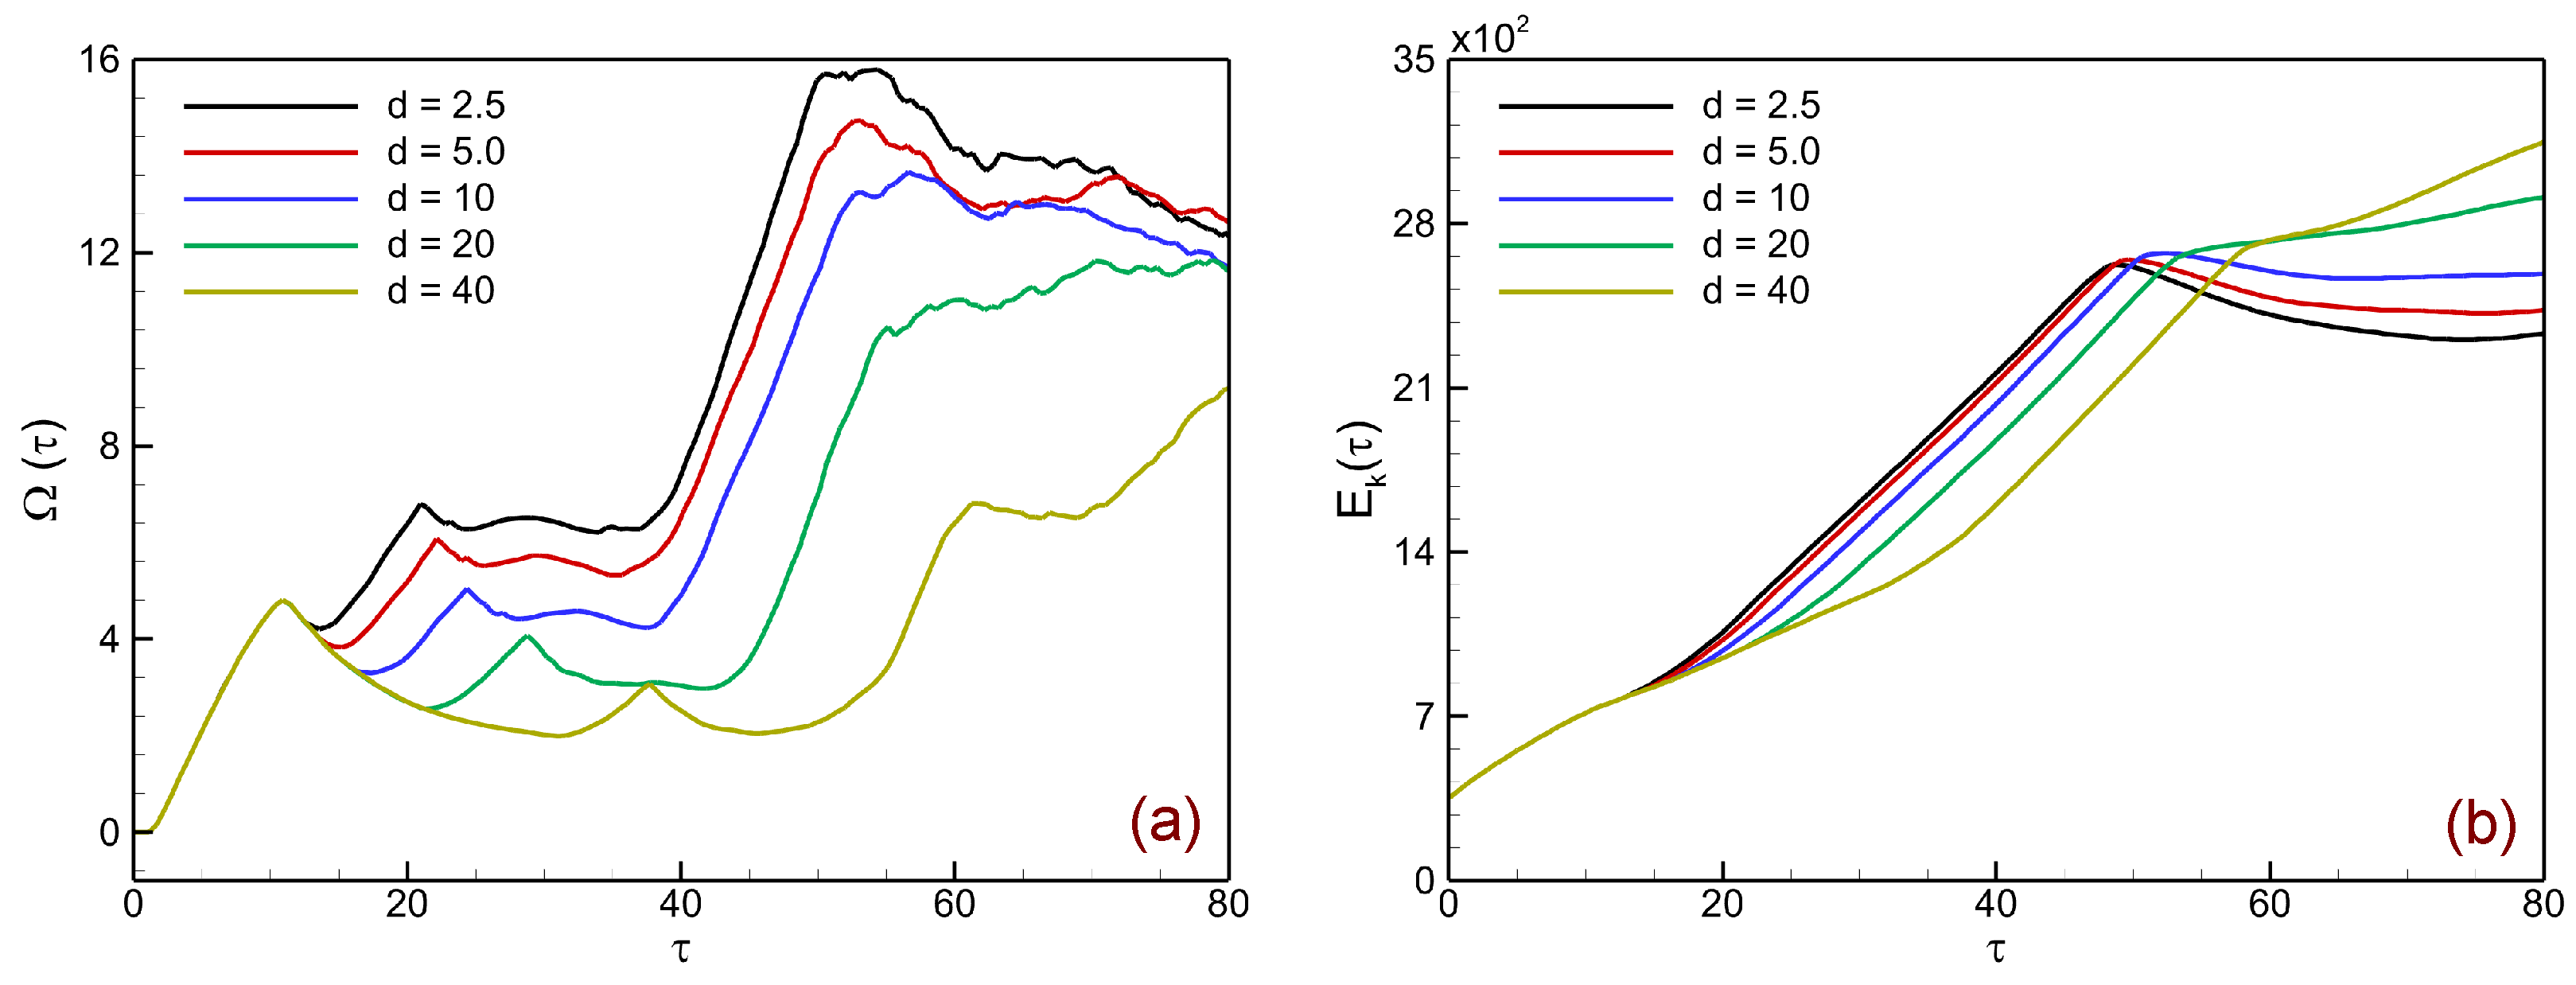
Figure 16 presents the temporal evolution of enstrophy Ω ( τ ) and kinetic energy E k ( τ ) in shock-accelerated single-mode light–heavy stratifications for varying heavy-layer thicknesses ( d = 2.5 , 5 , 10 , 20 , 40 mm). In Figure 16a, the enstrophy evolution reflects the amplification of vortical structures generated at the perturbed interface. Immediately after shock impact, enstrophy rises rapidly due to strong baroclinic deposition and shear-layer formation. Thin layers ( d = 2.5 , 5 mm) exhibit the largest and earliest growth, as frequent shock reverberations reinforce vorticity deposition and trigger rapid Kelvin–Helmholtz roll-up, leading to intense small-scale vortical activity. Intermediate and thick layers (d = 10–40 mm) show progressively delayed and weaker growth, since longer acoustic transit times and stronger attenuation of transmitted shocks reduce the synchronization and strength of baroclinic forcing. At later times ( τ 50 ), enstrophy in thinner layers reaches higher peaks but eventually decays slightly as vortex pairing and viscous diffusion redistribute circulation into larger scales. Figure 16b shows the evolution of total kinetic energy. Unlike enstrophy, the growth of E k is smoother and more gradual across all cases, reflecting the continuous redistribution of bulk shock energy into interface deformation and small-scale motions. Initially, all cases follow similar trends, dominated by the incident shock input. As time progresses, differences emerge: Thinner layers exhibit slightly higher saturation levels due to stronger interface deformation and shear amplification, whereas thicker layers reach lower levels of E k , consistent with their weaker vortex activity and suppressed mixing.

4.4. Interface Characteristics

This subsection analyzes the evolution of interface trajectories, normalized length, and perturbation amplitude in shock-accelerated single-mode stratifications. These measures capture how baroclinic vorticity deposition and shock interactions drive interface displacement, deformation, and the emergence of small-scale structures that govern instability growth and mixing.
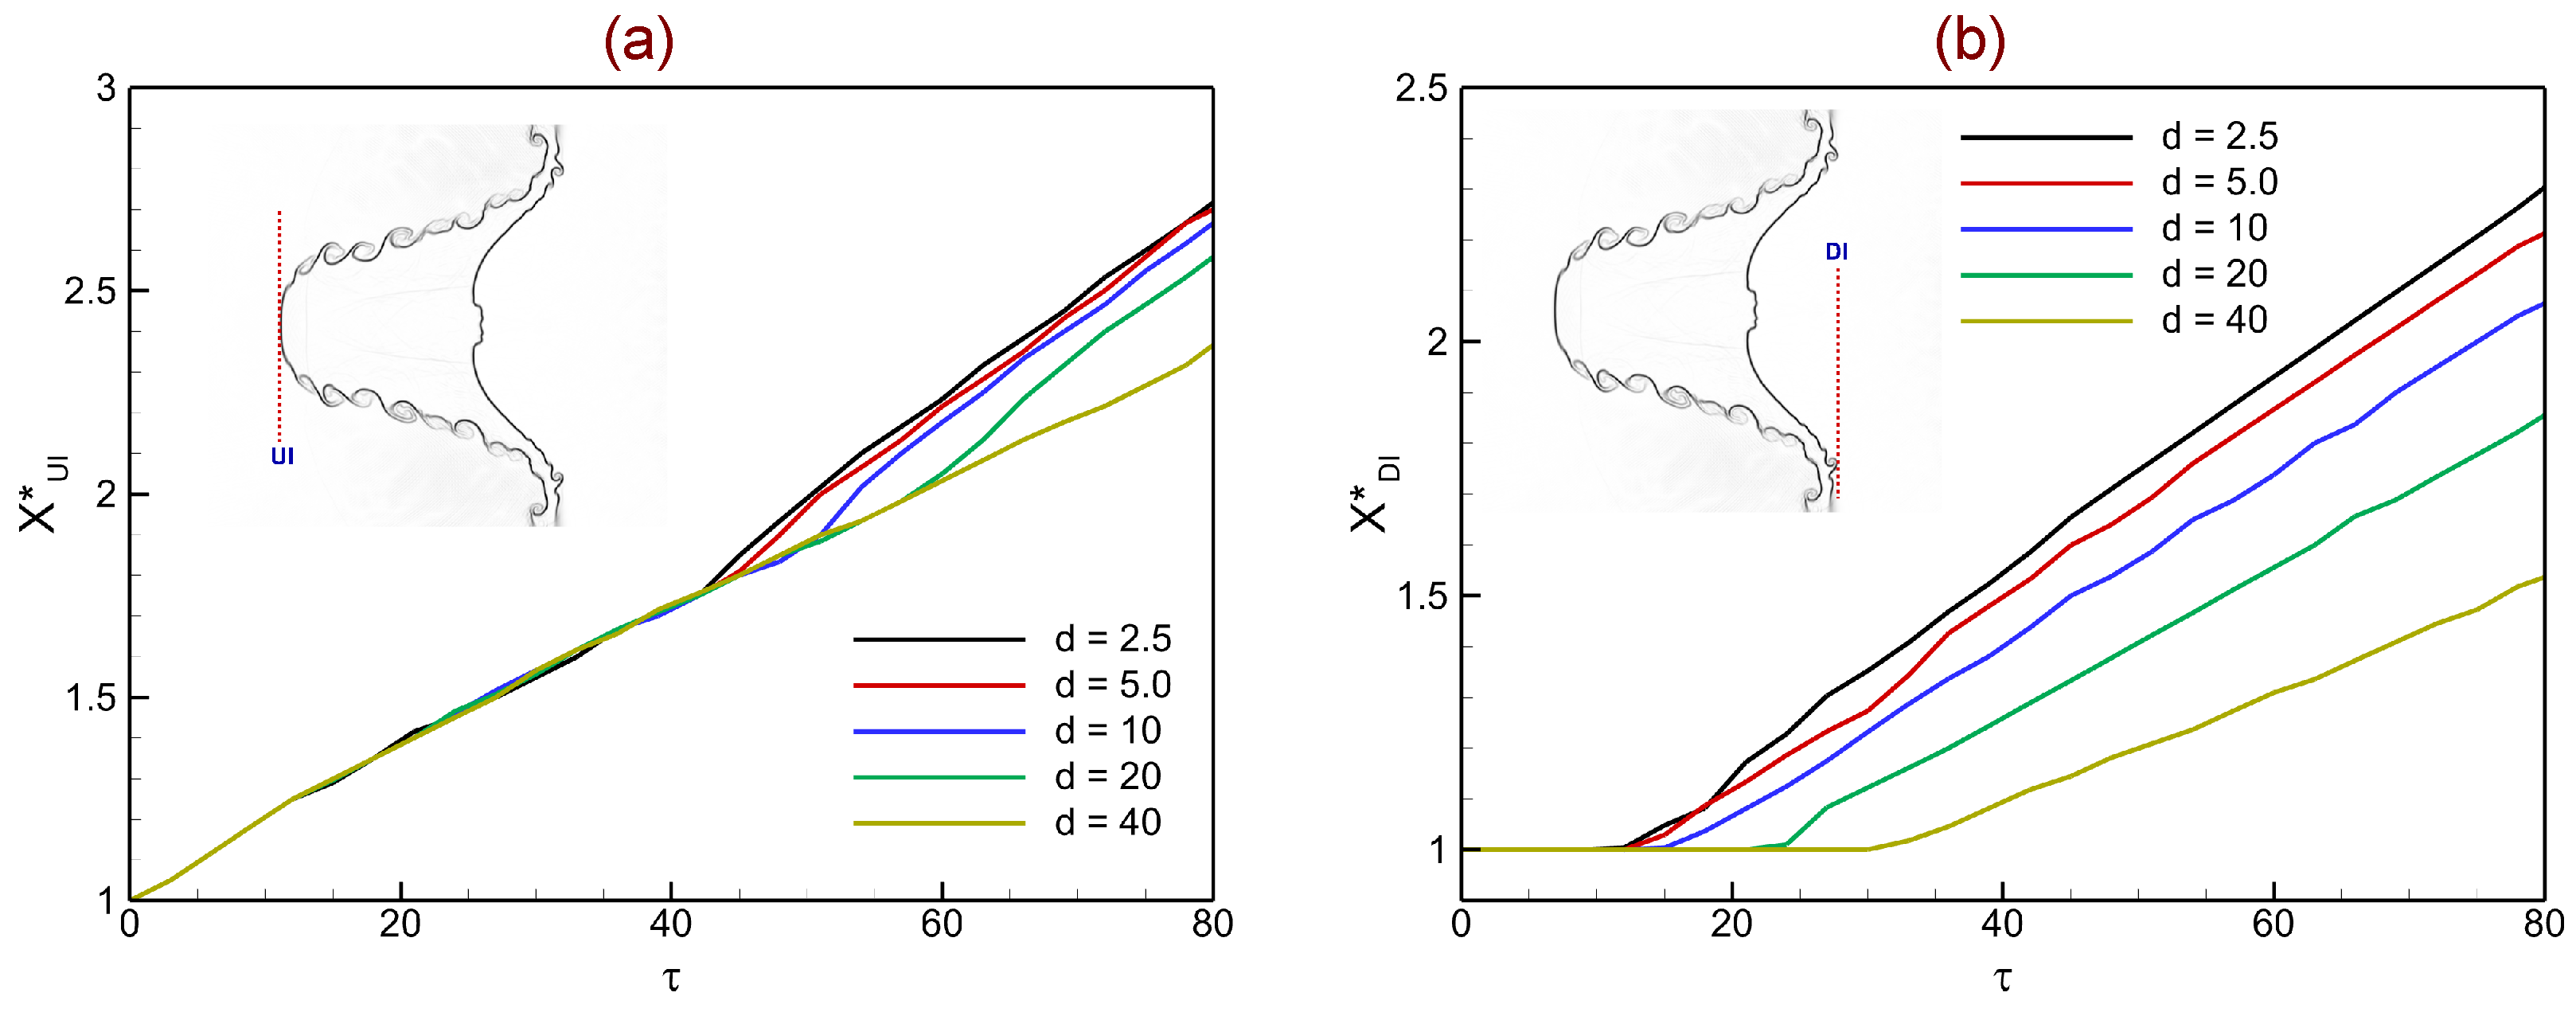
Figure 17 shows the temporal evolution of the normalized upstream ( X U I ) and downstream ( X D I ) interfaces in shock-accelerated single-mode light–heavy stratifications for varying heavy-layer thicknesses ( d = 2.5 , 5 , 10 , 20 , 40 mm). In Figure 17a, the upstream interface displacement X U I initially grows nearly linearly with time for all cases, reflecting the impulsive acceleration imparted by the incident shock. Thin layers ( d = 2.5 , 5 mm) exhibit faster growth after τ 30 due to strong reverberations and repeated shock–interface interactions that reinforce baroclinic vorticity deposition. For thicker layers ( d = 20 , 40 mm), the displacement rate decreases, as transmitted shocks are attenuated and arrive later at the interface, resulting in weaker circulation input and smoother evolution.
Figure 17b shows the normalized downstream interface displacement X D I . Similarly to the upstream case, thin layers undergo rapid displacement driven by strong transmitted and reflected shocks that enhance interfacial acceleration. Thick layers, however, display slower and more gradual displacement because of reduced shock strength and phase-lagged reverberations. The gap between thin and thick cases widens with time, underscoring the role of layer thickness in modulating interface motion. According to the numerical results, thick layers reduce displacement because of delayed and weaker shock–interface coupling, but thin heavy layers promote rapid and sustained interface acceleration, driven by coherent shock reverberations and strong baroclinic forcing.
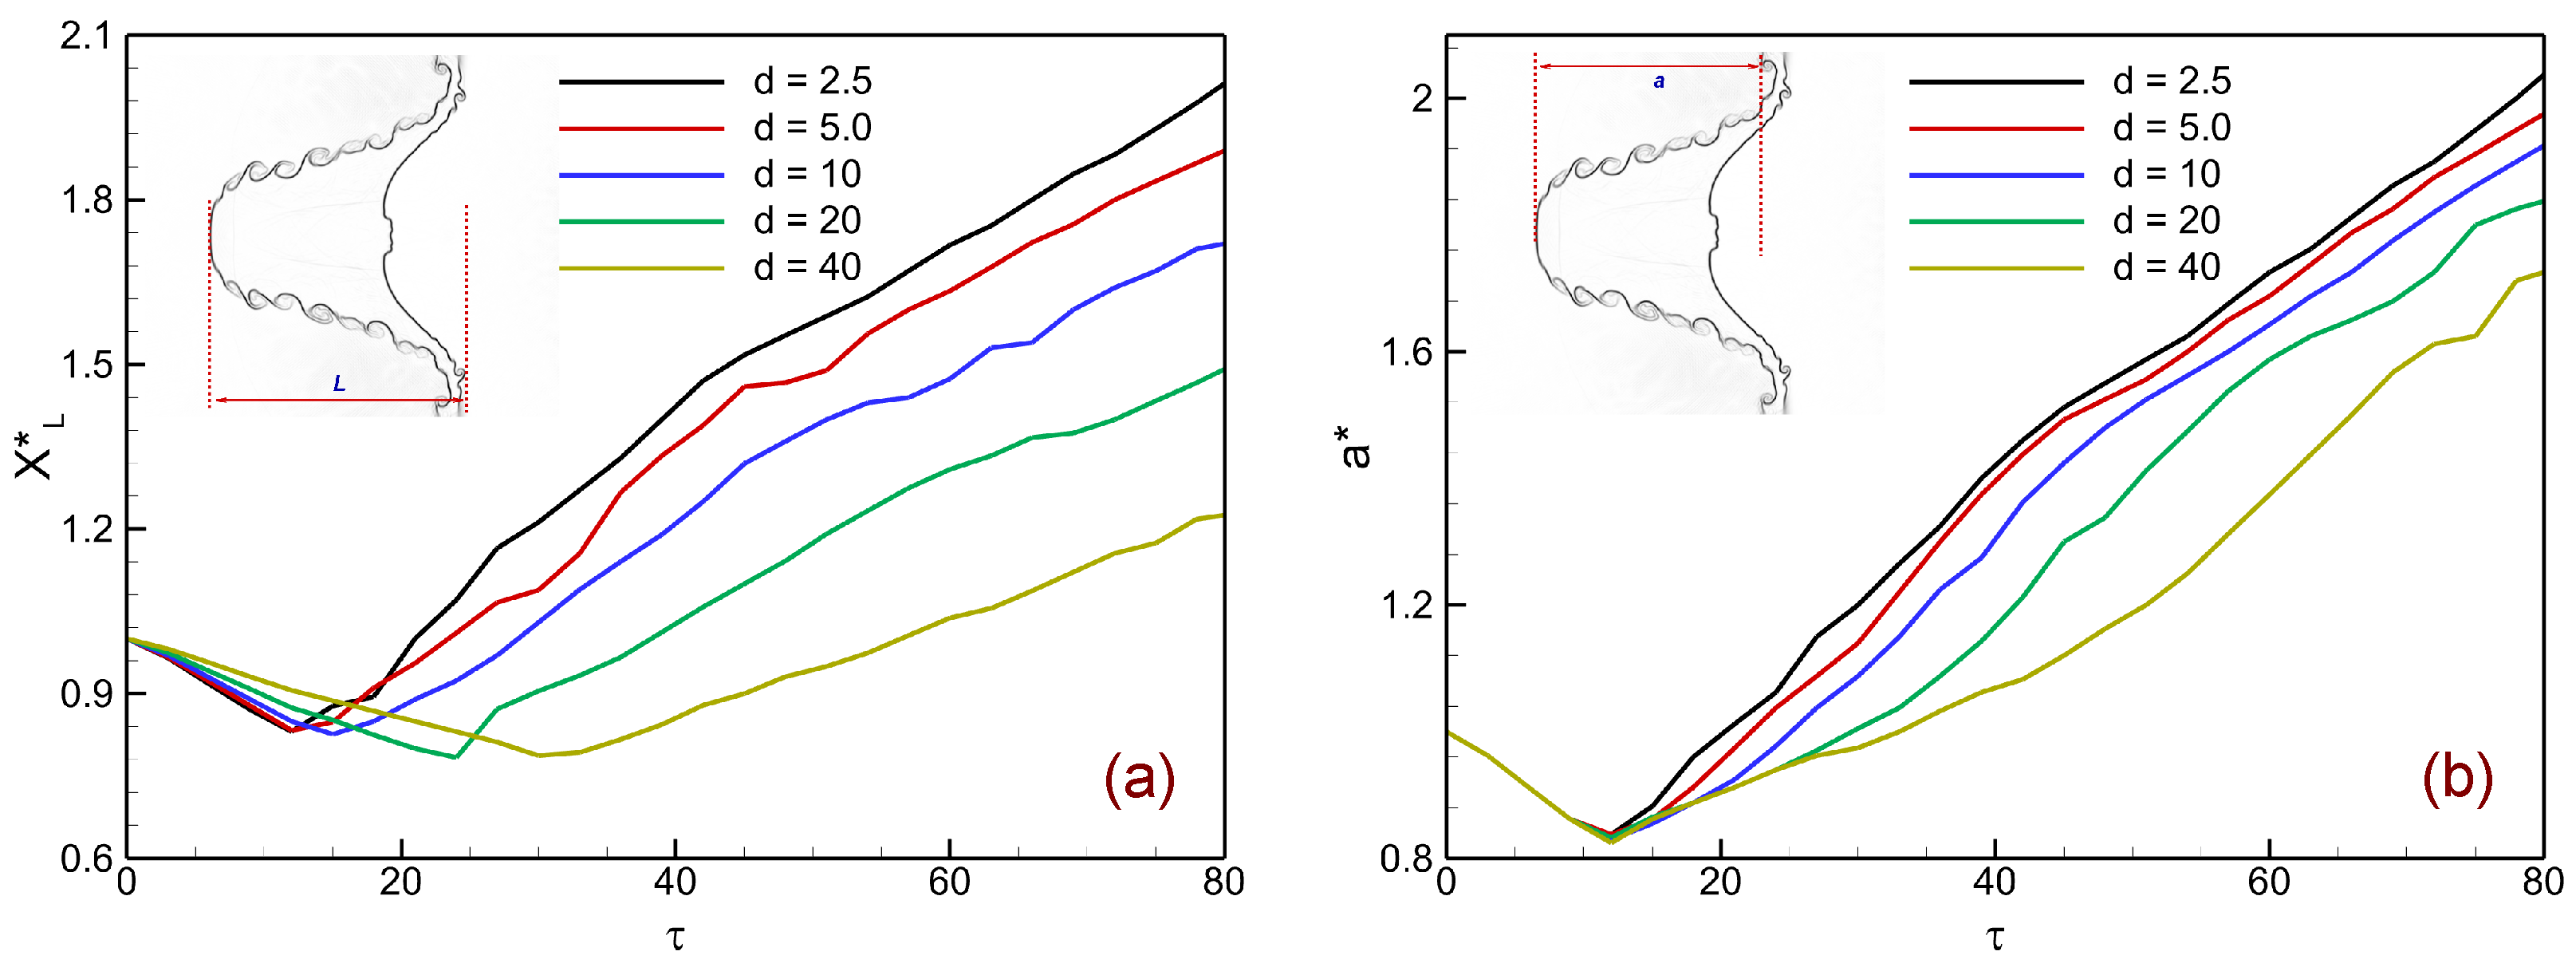
Figure 18 depicts the temporal evolution of the normalized interface length ( L ) and normalized perturbation amplitude ( a ) in shock-accelerated single-mode light–heavy stratifications for varying heavy-layer thicknesses ( d = 2.5 , 5 , 10 , 20 , 40 mm). In Figure 18a, the normalized interface length L characterizes the development of small-scale interfacial structures. After an initial slight decrease immediately following shock impact, L increases steadily due to interface stretching and the growth of Kelvin–Helmholtz roll-ups. Thin layers ( d = 2.5 , 5 mm) exhibit the most rapid growth, reflecting strong baroclinic vorticity reinforcement from repeated reverberations that promote enhanced billow formation and fine-scale deformation. For thicker layers ( d = 20 , 40 mm), the growth of L is delayed and weaker, consistent with suppressed shock–interface coupling and reduced small-scale activity. Figure 18b shows the evolution of the normalized perturbation amplitude a , which measures the large-scale displacement of the perturbed interface. Following an initial dip during shock compression, the amplitude grows rapidly, especially for thinner layers where reverberations drive strong baroclinic torque and accelerated spike-bubble growth. In contrast, thicker layers display slower amplitude growth due to weaker and phase-lagged circulation input from transmitted shocks.

5. Conclusions and Remarks

This study has examined the impact of heavy-layer thickness on the evolution of shock-accelerated interfacial instabilities in single-mode stratifications using high-fidelity discontinuous Galerkin simulations. By systematically varying the layer thickness, we quantified how acoustic transit time, shock attenuation, and phase synchronization govern the mechanisms of vorticity deposition, circulation growth, and interface deformation.
The results demonstrate that thin layers ( d = 2.5 –5 mm) promote strong and early baroclinic vorticity generation due to frequent reverberations, leading to rapid circulation growth, vigorous Kelvin–Helmholtz roll-up, and early jet pairing. In contrast, thick layers ( d = 20 –40 mm) attenuate and dephase shock returns, producing weaker baroclinic reinforcement, delayed shear-layer growth, and smoother interfaces with suppressed small-scale structures. Intermediate thickness ( d = 10 mm) exhibits transitional behavior between these two regimes. Integral diagnostics further revealed that dilatational, baroclinic, and viscous contributions to vorticity production are all amplified in thinner layers, whereas thicker layers limit their magnitude and delay their onset. Circulation analysis confirmed the near-symmetric generation of counter-rotating vortices, while enstrophy highlighted the stronger buildup of vortical activity in thin layers. Kinetic energy evolution showed that thinner layers enable more efficient transfer of bulk shock energy into interface deformation and small-scale mixing compared to thicker layers.
It should be emphasized that the present investigation is limited to a single shock Mach number ( M s = 1.22 ) and a fixed Atwood number, examined through two-dimensional simulations. This restricted parameter space was chosen deliberately to isolate the role of layer thickness in regulating baroclinic vorticity deposition and instability growth. Future work will extend the analysis to a broader range of shock strengths and density ratios, as well as fully three-dimensional configurations that can capture vortex stretching, spanwise instabilities, and turbulence transition. Such studies will be essential to generalize the mechanisms identified here and to assess their relevance in practical high-speed flows.

Author Contributions

Conceptualization, S.S.; software, S.S.; validation, S.S.; formal analysis, S.S.A. and S.S.; investigation, S.S.A., S.S., and N.A.A.; writing—original draft, S.S.A., S.S., and N.A.A.; visualization, S.S.A. and S.S.; funding acquisition, S.S.A. All authors have read and agreed to the published version of the manuscript.

Funding

This work was funded by the Deanship of Graduate Studies and Scientific Research at Jouf University under Grant No. (DGSSR-2025-FC-01034).

Data Availability Statement

The data will be made available by the authors on request.

Conflicts of Interest

The authors declare no conflicts of interest.

References

  1. Jones, M.A.; Jacobs, J.W. A membraneless experiment for the study of Richtmyer–Meshkov instability of a shock-accelerated gas interface. Phys. Fluids 1997, 9, 3078–3085. [Google Scholar] [CrossRef]
  2. Brouillette, M. The Richtmyer-Meshkov instability. Annu. Rev. Fluid Mech. 2002, 34, 445. [Google Scholar] [CrossRef]
  3. Zhou, Y.; Sadler, J.D.; Hurricane, O.A. Rayleigh–Taylor and Richtmyer-Meshkov instabilities: A journey through scales. Annu. Rev. Fluid Mech. 2025, 57, 197–225. [Google Scholar] [CrossRef]
  4. Betti, R.; Hurricane, O.A. Inertial-confinement fusion with lasers. Nat. Phys. 2016, 12, 435–448. [Google Scholar] [CrossRef]
  5. Kuranz, C.C.; Park, H.S.; Huntington, C.M.; Miles, A.R.; Remington, B.A.; Plewa, T.; Trantham, M.R.; Robey, H.F.; Shvarts, D.; Shimony, A.; et al. How high energy fluxes may affect Rayleigh–Taylor instability growth in young supernova remnants. Nat. Commun. 2018, 9, 1564. [Google Scholar] [CrossRef]
  6. Urzay, J. Supersonic combustion in air-breathing propulsion systems for hypersonic flight. Annu. Rev. Fluid Mech. 2018, 50, 593–627. [Google Scholar] [CrossRef]
  7. Zhou, Y. Rayleigh–Taylor and Richtmyer–Meshkov instability induced flow, turbulence, and mixing. I. Phys. Rep. 2017, 720, 1–136. [Google Scholar]
  8. Zhou, Y. Rayleigh–Taylor and Richtmyer–Meshkov instability induced flow, turbulence, and mixing. II. Phys. Rep. 2017, 723, 1–160. [Google Scholar] [CrossRef]
  9. Zhou, Y.; Williams, R.J.; Ramaprabhu, P.; Groom, M.; Thornber, B.; Hillier, A.; Mostert, W.; Rollin, B.; Balachandar, S.; Powell, P.D.; et al. Rayleigh–Taylor and Richtmyer-Meshkov instabilities: A journey through scales. Physica D 2021, 423, 132838. [Google Scholar] [CrossRef]
  10. Richtmyer, R.D. Taylor instability in shock acceleration of compressible fluids. Commun. Pure. Appl. Math. 1960, 13, 297–319. [Google Scholar] [CrossRef]
  11. Meshkov, E.E. Instability of the interface of two gases accelerated by a shock wave. Fluid Dyn. 1969, 4, 101. [Google Scholar] [CrossRef]
  12. Rayleigh, L. Investigation of the character of the equilibrium of an incompressible heavy fluid of variable density. Proc. Lond. Math. Soc. 1882, 14, 170–177. [Google Scholar] [CrossRef]
  13. Taylor, G.I. The instability of liquid surfaces when accelerated in a direction perpendicular to their planes. I. Proc. R. Soc. Lond. A 1950, 201, 192–196. [Google Scholar]
  14. Ranjan, D.; Oakley, J.; Bonazza, R. Shock-bubble interactions. Annu. Rev. Fluid Mech. 2011, 43, 117–140. [Google Scholar] [CrossRef]
  15. Haas, J.F.; Sturtevant, B. Interaction of weak shock waves with cylindrical and spherical gas inhomogeneities. J. Fluid Mech. 1987, 181, 41. [Google Scholar] [CrossRef]
  16. Quirk, J.J.; Karni, S. On the dynamics of a shock-bubble interaction. J. Fluid Mech. 1996, 318, 129. [Google Scholar] [CrossRef]
  17. Ranjan, D.; Niederhaus, J.H.J.; Oakley, J.G.; Anderson, M.H.; Bonazza, R.; Greenough, J.A. Shock-bubble interactions: Features of divergent shock-refraction geometry observed in experiments and simulations. Phys. Fluids 2008, 20, 036101. [Google Scholar] [CrossRef]
  18. Niederhaus, J.H.J.; Greenough, J.A.; Oakley, J.G.; Ranjan, D.; Anderson, M.H.; Bonazza, R.A. A computational parameter study for the three-dimensional shock-bubble interaction. J. Fluid Mech. 2008, 594, 85. [Google Scholar] [CrossRef]
  19. Haehn, N.; Weber, C.; Oakley, J.; Anderson, M.; Ranjan, D.; Bonazza, R. Experimental study of the shock–bubble interaction with reshock. Shock Waves 2012, 22, 47–56. [Google Scholar] [CrossRef]
  20. Shankar, S.K.; Kawai, S.; Lele, S.K. Two-dimensional viscous flow simulation of a shock accelerated heavy gas cylinder. Phys. Fluids 2011, 23, 024102. [Google Scholar] [CrossRef]
  21. Giordano, J.; Burtschel, Y. Richtmyer-Meshkov instability induced by shock-bubble interaction: Numerical and analytical studies with experimental validation. Phys. Fluids 2006, 18, 036102. [Google Scholar] [CrossRef]
  22. Singh, S.; Msmali, A.H.; Nelson, M.I. Unfolding of shocked hydrodynamic instability at SF6 elliptical interface: Physical insights from numerical simulations. Comput. Fluids 2024, 277, 106304. [Google Scholar] [CrossRef]
  23. Singh, S. Numerical investigation of thermal non-equilibrium effects of diatomic and polyatomic gases on the shock-accelerated square light bubble using a mixed-type modal discontinuous Galerkin method. Int. J. Heat Mass Trans. 2021, 179, 121708. [Google Scholar] [CrossRef]
  24. Alsaeed, S.S.; Singh, S. Computational Study of Shocked V-Shaped N2/SF6 Interface across Varying Mach Numbers. Axioms 2024, 13, 700. [Google Scholar] [CrossRef]
  25. Alsaeed, S.S.; Singh, S. Numerical study of shock wave interaction with V-Shaped heavy/light interface. Mathematics 2024, 12, 3131. [Google Scholar] [CrossRef]
  26. Zhou, Y. Hydrodynamic Instabilities and Turbulence: Rayleigh–Taylor, Richtmyer–Meshkov, and Kelvin–Helmholtz Mixing; Cambridge University Press: Cambridge, UK, 2024. [Google Scholar]
  27. Jacobs, J.W.; Krivets, V.V. Experiments on the late-time development of single-mode Richtmyer–Meshkov instability. Phys. Fluids 2005, 17, 034105. [Google Scholar] [CrossRef]
  28. Rodriguez, G.; Galametz, I.; Croso, H.; Haas, J.F. Richtmyer-Meshkov instability in a vertical shock tube. In Shock Waves Marseille IV: Shock Structure and Kinematics, Blast Waves and Detonations; Springer: Berlin/Heidelberg, Germany, 1995; pp. 275–280. [Google Scholar]
  29. Tomkins, C.; Kumar, S.; Orlicz, G.; Prestridge, K. An experimental investigation of mixing mechanisms in shock-accelerated flow. J. Fluid Mech. 2008, 611, 131–150. [Google Scholar] [CrossRef]
  30. Liang, Y.; Liu, L.; Zhai, Z.; Si, T.; Wen, C.-Y. Evolution of shock-accelerated heavy gas layer. J. Fluid Mech. 2020, 886, A7. [Google Scholar] [CrossRef]
  31. Chen, Y.; Jin, T.; Liang, Z.; Zou, L. Numerical study of shock-induced Richtmyer–Meshkov instability in inhomogeneous heavy fluid layer. Phys. Fluids 2020, 36, 092105. [Google Scholar] [CrossRef]
  32. Li, L.; Jin, T.; Zou, L.; Luo, K.; Fan, J. Numerical study of Richtmyer-Meshkov instability in finite thickness fluid layers with reshock. Phys. Fluids 2020, 36, 092105. [Google Scholar] [CrossRef]
  33. Luo, X.; Li, M.; Ding, J.; Zhai, Z.; Si, T. Nonlinear behaviour of convergent Richtmyer–Meshkov instability. J. Fluid Mech. 2019, 877, 130–141. [Google Scholar] [CrossRef]
  34. Vetter, M.; Sturtevant, B. Experiments on the Richtmyer-Meshkov instability of an air/SF6 interface. Shock Waves 1995, 4, 247–252. [Google Scholar] [CrossRef]
  35. Si, T.; Zhai, Z.; Luo, X. Experimental study of Richtmyer-Meshkov instability in a cylindrical converging shock tube. Laser Part. Beams 2014, 32, 343–351. [Google Scholar] [CrossRef]
  36. Lombardini, M.; Pullin, D.I.; Meiron, D.I. Transition to turbulence in shock-driven mixing: A Mach number study. J. Fluid Mech. 2012, 690, 203–226. [Google Scholar] [CrossRef]
  37. Jourdan, G.; Houas, L.; Haas, J.-F.; Ben-Dor, G. Thickness and volume measurements of a Richtmyer–Meshkov instability-induced mixing zone in a square shock tube. J. Fluid Mech. 1997, 349, 67–94. [Google Scholar] [CrossRef]
  38. Alsaeed, S.S.; Singh, S.; Alrubea, N.A. Numerical Investigation of Atwood Number Effects on Shock-Driven Single-Mode Stratified Heavy Fluid Layers. Mathematics 2025, 13, 3032. [Google Scholar] [CrossRef]
  39. Singh, S. Numerical Simulations of Shock-driven Heavy Fluid Layer. J. Graph. Era Univ. 2025, 13, 75–90. [Google Scholar] [CrossRef]
  40. Azarova, O.A. Generation of Richtmyer–Meshkov and secondary instabilities during the interaction of an energy release with a cylinder shock layer. Aerosp. Sci. Technol. 2015, 42, 376–383. [Google Scholar] [CrossRef]
  41. Azarova, O.A.; Gvozdeva, L.G. Control of triple-shock configurations and vortex structures forming in high speed flows of gaseous media past an AD body under the action of external energy source. Aerospace 2017, 4, 9. [Google Scholar] [CrossRef]
  42. Azarova, O.A.; Knight, D.; Kolesnichenko, Y. Pulsating stochastic flows accompanying microwave filament/supersonic shock layer interaction. Shock Waves 2011, 21, 439–450. [Google Scholar] [CrossRef]
  43. Ogino, Y.; Ohnishi, N.; Taguchi, S.; Sawada, K. Baroclinic vortex influence on wave drag reduction induced by pulse energy deposition. Phys. Fluids 2009, 21, 066102. [Google Scholar] [CrossRef]
  44. Liang, Y.; Luo, X. On shock-induced heavy-fluid-layer evolution. J. Fluid Mech. 2021, 920, A13. [Google Scholar] [CrossRef]
  45. Ding, J.; Li, J.; Sun, R.; Zhai, Z.; Luo, X. Convergent Richtmyer-Meshkov instability of a heavy gas layer with perturbed outer interface. J. Fluid Mech. 2019, 878, 277. [Google Scholar] [CrossRef]
  46. Mikaelian, K.O. Numerical simulations of Richtmyer–Meshkov instabilities in finite thickness fluid layers. Phys. Fluids 1996, 8, 1269. [Google Scholar] [CrossRef]
  47. Ott, E. Nonlinear Evolution of the Rayleigh-Taylor instability of a thin layer. Phys. Rev. Lett. 1972, 29, 1429. [Google Scholar] [CrossRef]
  48. Thornber, B.; Zhou, Y. Nonlinear Numerical simulations of the two-dimensional multimode Richtmyer-Meshkov instability. Phys. Plasmas 2015, 22, 032309. [Google Scholar] [CrossRef]
  49. Kokkinakis, I.W.; Drikakis, D.; Youngs, D.L. Two-equation and multi-fluid turbulence models for Richtmyer–Meshkov mixing. Phys. Fluids 2020, 32, 074102. [Google Scholar] [CrossRef]
  50. Zhang, S.B.; Singh, S.; Torrilhon, M.; Zhang, H.H.; Chen, Z.H.; Zheng, C. Numerical investigation of Richtmyer-Meshkov instability in shock-driven light square bubble via magnetohydrodynamics. Comput. Fluids 2025, 299, 106698. [Google Scholar] [CrossRef]
  51. Asokakumar, S.V.; Sengupta, B.; Kammara, K.K.; Singh, S. On the evolution of magnetohydrodynamic flow instability in shock-accelerated light bubble. Phys. Fluids 2024, 36, 106140. [Google Scholar] [CrossRef]
  52. Lin, Z.H.; Luo, H.; Zhang, E.H.; Li, R.B.; Cai, H.B.; Zhu, S.P.; Zhu, G.H.; Luo, M.X. The effects of energetic ions in light/heavy Richtmyer–Meshkov instability. Phys. Plasmas 2025, 32, 082111. [Google Scholar] [CrossRef]
  53. Msmali, A.H.; Singh, S.; Meetei, M.Z. Single-Mode Richtmyer–Meshkov Instability in Light Fluid Layer: Insights from Numerical Simulations. Axioms 2025, 14, 473. [Google Scholar] [CrossRef]
  54. Wilke, C.R. A viscosity equation for gas mixtures. J. Chem. Phys. 1950, 18, 517–519. [Google Scholar] [CrossRef]
  55. Cockburn, B.; Shu, C.-W. The Runge–Kutta discontinuous Galerkin method for conservation laws V: Multidimensional systems. J. Comput. Phys. 1998, 141, 199–224. [Google Scholar] [CrossRef]
  56. Gottlieb, S.; Shu, C.-W.; Tadmor, E. Strong stability-preserving high-order time discretization methods. SIAM Rev. 2001, 43, 89–112. [Google Scholar] [CrossRef]
  57. Krivodonova, L.; Xin, J.; Remacle, J.F.; Chevaugeon, N.; Flaherty, J.E. Shock detection and limiting with discontinuous Galerkin methods for hyperbolic conservation laws. App. Num. Math. 2004, 48, 323–338. [Google Scholar] [CrossRef]
  58. Luo, X.; Dong, P.; Si, T.; Zhai, Z. The Richtmyer–Meshkov instability of a ‘V’shaped air/SF6 interface. J. Fluid Mech. 2016, 802, 186–202. [Google Scholar] [CrossRef]
  59. Luo, X.; Wang, M.; Si, T.; Zhai, Z. On the interaction of a planar shock with an SF6 polygon. J. Fluid Mech. 2015, 773, 366. [Google Scholar] [CrossRef]
Figure 1. Initial configuration for studying shock-accelerated interfacial instabilities in single-mode stratifications. A planar shock travels left-to-right through the ambient light gas and interacts with a finite-thickness heavy-gas layer of thickness d, bounded upstream by a sinusoidal interface I 1 (initial amplitude a 0 , wavelength λ ) and downstream by a planar interface I 2 .
Applsci 15 10687 g001
Figure 2. Validation of the present approach for shock-accelerated interfacial instabilities. (a) Side-by-side comparison of experimental Schlieren images from Luo et al. [58] and corresponding numerical Schlieren snapshots at matched times for a shocked chevron-shaped air/SF6 interface at M s = 1.2 . The computation reproduces shock refraction, triple-point motion, shear-layer roll-up, and interface deformation seen in the experiment. (b) Upstream-interface displacement D s ( t ) .
Applsci 15 10687 g002
Figure 3. Validation of the present approach for shock-accelerated SF6 square-bubble instabilities: Comparison of experimental Schlieren images from the literature [59] and corresponding numerical Schlieren snapshots at matched times for a shocked square SF6 bubble in air at M s = 1.2 . The simulation reproduces the observed flow features, including shock refraction and reflection (IS/RS/TS), Mach-stem formation, slip lines, triple points, diffracted shocks, and the development of upper/lower vortex rings.
Applsci 15 10687 g003
Figure 4. Quantitative validation for the shock-accelerated SF6 square-bubble case ( M s 1.17 ): time histories of shock-front positions—the incident shock in the free stream (IS), the incident shock sliding along the bubble face (ISB), and the direct transmitted shock within SF6 (DTS). Lines denote the present computation; symbols are measurements from Luo et al. [59].
Applsci 15 10687 g004
Figure 5. Mesh-resolution strategy for the shock-accelerated single-mode stratified heavy-fluid layer. Shown are density contours at τ = 20 on three uniform grids: N x × N y = 400 × 200 , 800 × 400 , and 1200 × 600 .
Applsci 15 10687 g005
Figure 6. Centerline density profiles ( y = 50 mm ) at τ = 20 for the shock-accelerated single-mode stratified heavy-fluid layer, computed on three uniform grids: N x × N y = 400 × 200 , 800 × 400 , and 1200 × 600 .
Applsci 15 10687 g006
Figure 7. Time evolution of shock-accelerated interfacial instabilities in single-mode stratifications for two heavy-layer thicknesses: (a) d = 2.5 mm and (b) d = 5 mm. Snapshots (density/Schlieren) are shown at τ = 0 , 10 , 20 , 30 , 40 , 50 , 60 , 80 . Annotated features include the incident (IS), reflected (RS), and transmitted (TS) shocks, secondary transmitted/reflected waves (TS2/RTS), diffracted shock (DS), shock focusing (SF), interface re-impact (IRR), Kelvin–Helmholtz (KH) roll-up, bulge formation, and jet pairs.
Applsci 15 10687 g007
Figure 8. Time evolution of shock-accelerated interfacial instabilities in single-mode stratifications for a heavy-layer thickness of d = 10 mm.
Applsci 15 10687 g008
Figure 9. Time evolution of shock-accelerated interfacial instabilities in single-mode stratifications for two heavy-layer thicknesses: (a) d = 20 mm and (b) d = 40 mm. Snapshots (density/Schlieren) are shown at τ = 0 , 10 , 20 , 30 , 40 , 50 , 60 , 80 .
Applsci 15 10687 g009
Figure 10. Influence of layer thickness on the temporal evolution of interface deformation in shock-accelerated interfacial instabilities in single-mode stratifications: (a) d = 2.5 mm , (b) d = 5 mm , (c) d = 10 mm , (d) d = 20 mm , and (e) d = 40 mm .
Applsci 15 10687 g010
Figure 11. Schematic illustration of vorticity generation in a shock-accelerated single-mode heavy–light stratification.
Applsci 15 10687 g011
Figure 12. Temporal evolution of vorticity distribution in shock-accelerated single-mode light-heavy stratifications for varying heavy-layer thicknesses ( d = 2.5 , 5 , 10 , 20 , 40 mm). Each row corresponds to a different layer thickness, with snapshots shown at times τ = 10 , 20 , 40 , 80 .
Applsci 15 10687 g012
Figure 13. Temporal evolution of vorticity extrema in shock-accelerated single-mode heavy–light stratifications for varying heavy-layer thicknesses ( d = 2.5 , 5 , 10 , 20 , 40 mm): (a) maximum vorticity ω max , and (b) minimum vorticity ω min .
Applsci 15 10687 g013
Figure 14. Temporal evolution of spatially integrated vorticity source terms in shock-accelerated single-mode heavy–light stratifications for varying heavy-layer thicknesses ( d = 2.5 , 5 , 10 , 20 , 40 mm): (a) dilatation ( ω d i l ) , (b) baroclinic ( ω b a r o ) , and (c) viscous ( ω v i s ) vorticity.
Applsci 15 10687 g014
Figure 15. Temporal evolution of spatially integrated circulation in shock-accelerated single-mode light–heavy stratifications for varying heavy-layer thicknesses ( d = 2.5 , 5 , 10 , 20 , 40 mm): (a) positive circulation ( Γ P o s ) , and (b) negative circulation ( Γ N e g ) , and (c) total circulation ( Γ T o t ) .
Applsci 15 10687 g015
Figure 16. Temporal evolution of spatially integrated fields in shock-accelerated single-mode light–heavy stratifications for varying heavy-layer thicknesses ( d = 2.5 , 5 , 10 , 20 , 40 mm): (a) enstrophy ( Ω ) , and (b) kinetic energy ( E k ) .
Applsci 15 10687 g016
Figure 17. Temporal evolution of spatially integrated fields in shock-accelerated single-mode light–heavy stratifications for varying heavy-layer thicknesses ( d = 2.5 , 5 , 10 , 20 , 40 mm): (a) normalized upstream interface ( X UI ) , and (b) normalized downstream interface ( X DI ) .
Applsci 15 10687 g017
Figure 18. Temporal evolution of spatially integrated fields in shock-accelerated single-mode light–heavy stratifications for varying heavy-layer thicknesses ( d = 2.5 , 5 , 10 , 20 , 40 mm): (a) normalized interface length ( L ) , and (b) normalized perturbation amplitude ( a ) .
Applsci 15 10687 g018
Table 1. Thermophysical properties of the gas pair used in this study—light ambient nitrogen (N2) and heavy sulfur hexafluoride (SF6). Reported quantities are the specific-heat ratio γ , density, specific heat at constant pressure, and molecular weight, evaluated at the initial uniform state P 0 = 101 , 325 Pa and T 0 = 293 K .
GasHeat Ratio ( γ )Density ( g · cm 3 ) Specific Heat ( kJ · g 1 · K 1 ) Molecular Weight ( g · mol 1 )
N 2 1.40 1.25 × 10 3 1.04 × 10 3 28.0134
SF 6 1.09 6.03 × 10 3 0.656 × 10 3 128.491
Disclaimer/Publisher’s Note: The statements, opinions and data contained in all publications are solely those of the individual author(s) and contributor(s) and not of MDPI and/or the editor(s). MDPI and/or the editor(s) disclaim responsibility for any injury to people or property resulting from any ideas, methods, instructions or products referred to in the content.