Article

Mapping 18F-FDG Positron Emission Tomography Uptake in the Aortic Wall and Thrombus: Validation and Reproducibility

by
Mireia Bragulat-Arévalo
1,2,3,†,
Marta Ferrer-Cornet
1,†,
Lydia Dux-Santoy
1,*,
Ruper Oliveró-Soldevila
4,
Marvin Garcia-Reyes
5,
Gisela Teixidó-Turà
3,4,
Juan Garrido-Oliver
1,2,
Laura Galian-Gay
4,
Pere Lopez-Gutierrez
1,2,
Alba Catalá-Santarrufina
1,
José Ramón García-Garzón
6,
Noemi Martinez-Esquerda
6,
Javier Solsona
2,
Ignacio Ferreira-González
1,2,4,7,
Sergi Bellmunt-Montoya
2,5,
Jose Rodriguez-Palomares
1,2,3,4,* and
Andrea Guala
1,3
1
Vall d’Hebron Institut de Recerca (VHIR), 08035 Barcelona, Spain
2
Department of Medicine, Universitat Autònoma de Barcelona, 08023 Bellaterra, Spain
3
Centro de Investigación Biomédica en Red—Enfermedades Cardiovasculares (CIBER-CV), Instituto de Salud Carlos III, 28029 Madrid, Spain
4
Department of Cardiology, Hospital Universitari Vall d’Hebron, 08035 Barcelona, Spain
5
Department of Vascular Surgery, Hospital Universitari Vall d’Hebron, 08035 Barcelona, Spain
6
Unidad PET/RM, CETIR ASCIRES, 08029 Barcelona, Spain
7
Centro de Investigación Biomédica en Red—Epidemiología y Salud Pública (CIBER-ESP), Instituto de Salud Carlos III, 28029 Madrid, Spain
*
Authors to whom correspondence should be addressed.
These authors contributed equally to this work.
Appl. Sci. 2025, 15(19), 10685; https://doi.org/10.3390/app151910685
Submission received: 10 September 2025 / Revised: 29 September 2025 / Accepted: 1 October 2025 / Published: 3 October 2025

Abstract

18F-fluorodeoxyglucose (18F-FDG) positron emission tomography (PET) could be useful to assess inflammation of the aortic wall, a potential early indicator of aneurysm formation. Nonetheless, its current clinical assessment presents several limitations. The study aimed to develop and validate an innovative technique to obtain thoraco-abdominal aortic wall PET uptake maps. PET/magnetic resonance (MR) was acquired in 82 patients with aortic aneurysms. The thoraco-abdominal aorta was segmented and expanded inward and outward (by 1 to 5 mm) and discretized into 80 standardized wall patches. Standard uptake values (SUV) were calculated for each patch and the thrombus. For inter-observer reproducibility, a second blinded observer analyzed 26 random patients. Validation against manual expert measurements was performed. The feasibility of the patch-wise PET analysis was 98.4%. Inter-observer Dice scores were 0.89 for lumen and 0.82 for thrombus segmentations. SUV mapping presented excellent reproducibility, modestly improving with wall thickness (ICC 0.950 to 0.966), while its agreement with expert measurements improved with thinner walls (ICC 0.848 to 0.755). An optimal balance between reproducibility and accuracy was obtained at 6 mm wall thickness. Reproducible and accurate thoraco-abdominal aortic wall 18F-FDG uptake maps can be obtained from PET/MR, potentially facilitating the exploration of local factors associated with vascular inflammation.

1. Introduction

Aortic aneurysms are a pathological dilation of the aorta and a risk factor for life-threatening events, such as aortic rupture and dissection. Aneurysm diagnosis and the control of patient’s evolution is complicated due to aneurysms’ mostly asymptomatic nature. Diagnosis and risk-stratification is based on maximum aortic diameter. [1] Although it is a well-established method, it has limited capacity for rupture prediction [2,3], and suffers from observer variability [4,5]. Thus, new biomarkers of aortic risk are urgently needed [3,6].
The etiology of most aortic aneurysms is unknown, which limits the identification and development of effective pharmacological treatments [7,8]. Certain studies have reported inflammatory cell influx in the aortic wall as an early event in aneurysm formation [9,10]. 18F-fluorodeoxyglucose positron emission tomography (18F-FDG PET) could be a useful imaging technique to assess aortic aneurysm inflammation, as it provides molecular-level information of glucose activity, which is commonly used for the detection of inflammation [11,12]. Importantly, a strong correlation between 18F-FDG activity and atherosclerotic disease was reported [13], but it did not clearly translate to aneurysm growth and risk prediction [9]. Moreover, a possible role of thrombus-driven hypoxia was proposed, although it still lacks robust evidence [14]. The heterogeneity of results could be attributed to the lack of cell-specific absorption of 18F-FDG in the macrophages involved [15], methodological differences in PET analysis [16] and the limited capacity to measure aneurysm growth [4]. Notably, most studies recommended further analysis on larger cohorts [17].
In current clinical practice and research, the analysis of PET images lacks solid standardization, and is mostly performed visually (qualitatively). When performed semi-quantitatively, nuclear medicine physicians extract the maximum standard uptake value (SUV) by manually drawing a region of interest where the highest activity is visualized [18]. While this semi-quantitative approach improves diagnostic performance compared to visual analysis [19], its reproducibility is limited [20]. Moreover, this methodology might be insufficient to quantify sub-clinical inflammation [21] and does not permit the assessment of spatially resolved activity. The assessment of uptake in several standardized aortic regions via the analysis of spatially resolved “maps” may permit localized prediction of disease evolution, as well as the identification of associations with local properties of diseases. A recent study which proposed the mapping of PET uptake in the ascending aortic wall [22] provides, despite some discrepancies, the methodological foundation of the study. That article reported an excellent intra-observer reproducibility and showed the potential of PET mapping, but a formal validation remains to be demonstrated [22].
This study aimed to develop and validate an image analysis technique to extract 18F-FDG PET uptake maps over the thoraco-abdominal aortic wall from PET/magnetic resonance (MR) acquisitions, and to assess its inter-observer reproducibility.

2. Materials and Methods

2.1. Study Cohort

As part of two ongoing projects approved by the Institutional Review Board, PET/MR scans were prospectively acquired in 82 adult patients (age > 18 years) with aortic aneurysms of non-genetic etiology. Exclusion criteria were previous aortic surgery or history of acute aortic syndromes, severe aortic valve disease and contraindications for MR or PET. Among them, 43 patients had a thoracic descending or abdominal aortic aneurysm with a maximum diameter ≥40 and <55 mm, and underwent thoraco-abdominal aorta imaging. The remaining 39 patients had a bicuspid aortic valve and a maximum diameter of the ascending aorta < 50 mm, and underwent thoracic region imaging alone.

2.2. Image Acquisition

All acquisitions were performed in a hybrid whole-body PET/MR scanner (SIGNA™ PET/MR, General Electric Healthcare, Waukesha, WI, USA), with a coil system of receive-only radiofrequency arrays for simultaneous acquisition. Following recommendations, patients were instructed to fast for 6 h and to follow a low-carbohydrate diet for 48 h. MR acquisition prior to imaging were performed at 3T, and included (i) a 4D flow MR sequence covering the thoracic or thoraco-abdominal aorta field of view (FOV) (homogeneous voxel size of 1.56 [1.41, 1.72] mm), (ii) a non-ECG gated, contrast-enhanced magnetic resonance angiography (CEMRA) with administration of gadolinium chelate contrast (homogeneous voxel size of 0.82 [0.82, 0.86] mm), and (iii) a blood-suppressed single-shot fast-spin echo (SSFSE) sequence (median voxel size of 0.70 × 0.70 × 5 mm3) [23]. Data from the 4D flow sequence was used to reconstruct a phase-contrast-enhanced MRA (PC-MRA) [24].
For PET imaging, all patients were administered 4 MBq/kg of 18F-FDG intravenously, minimum 60 min before PET acquisition to improve image quality [20]. Attenuation correction was based on fast spoiled gradient-echo MR sequences (Dixon sequences) generating four contrast maps (µ-maps) in fast acquisition of only water, fat, in-phase (water + fat) and out-of-phase (water − fat). Image reconstruction was performed automatically using a time of flight algorithm (Q.Clear, General Electric HealthCare), which reduces signal-to-noise ratio (homogeneous pixel size of 3.13 [3.13, 3.13] mm). SUV was computed as the decay-corrected 18F-FDG concentration divided by the injected dose and patient’s body weight [25].

2.3. Image Analysis

An overview of the image analysis is included in Figure 1. Aorta and thrombus segmentations were performed semi-automatically using 3DSlicer version 5.4.0 [26]. The thoracic aorta was segmented on PC-MRA images, while the abdominal aorta was segmented on MRA data using SSFSE sequence as guidance for thrombus corrections. In patients with thoraco-abdominal FOV and thrombus, all segmentations were merged generating a unique 3D aortic wall mesh. Then, the aortic centerline was generated, and nine anatomical landmarks (aortic annulus, sinotubular junction, brachiocephalic artery, left subclavian artery, diaphragmatic level, pulmonary bifurcation level, superior mesenteric artery, renal arteries, and aortoiliac bifurcation) were identified (Figure 1B and Figure S1). The colocalization between MR segmentations and PET images was confirmed visually, and misalignments were manually corrected by rigid registration using the 3DSlicer tools for rotation and translation, if needed (Figure 1C). To test inter-observer reproducibility, the whole annotation procedure was repeated by a second observer, blinded to the other observer annotations, in a randomly selected third part of the database (26 patients).
The subsequent image analysis was performed in Matlab version R2023b (The Mathworks, Natick, MA, USA). The surface of the 3D segmentation of the aorta underwent an inward and outward expansion to create an aortic wall volume, which was voxelized with a uniform spatial resolution of 1 mm. To test the impact of wall thickness in subsequent extraction, five different thicknesses (from 1 to 5 mm on each side) were tested (Figure 1D and Figure S2). SUV of PET voxels were interpolated to match the voxelized space resolution. Using a hot color-coded scale, aortic mapping of the SUV was reconstructed (Figure 1F). Performing a visual analysis of each patient’s map, spillover from the myocardium and other artifacts were identified: if minor and very local, segmentations were corrected before further analysis while, if the artifact was substantial, affected voxels were manually removed from the analysis. The aortic wall volume was then discretized into 52 (thoracic FOV) or 80 (thoraco-abdominal FOV) wall patches, representing a spatial framework for analyzing localized activity and its distribution. To this aim, the ascending aorta, the aortic arch, and the thoracic and abdominal descending aorta were discretized into 4, 2, 7, and 7 longitudinal regions, respectively, using the 9 anatomical points and the aortic centerline. Each longitudinal region was further divided into 4 circumferential patches (inner, right, outer, left), generating the standardized aortic patches (Figure 1E). For each patch, the median and 95th percentile SUV were calculated, and whether there was any thrombus present. Additionally, the same metrics were evaluated for the thrombus volume.

2.4. Validation

Clinical evaluation of PET images was performed by a nuclear medicine physician (JRGG) with extensive experience in PET imaging, using Carestream PACS Client Suite version 12.2 (Carestream, Rochester, NY, USA). The physician, blinded to mapping results, performed clinical practice quantification by measuring maximum SUV uptake in different regions: the ascending and thoracic descending aorta in patients with bicuspid aortic valve; and the thoracic aorta, abdominal aorta, and the aneurysmal region in patients with abdominal aortic aneurysms. For the validation test, and to match the clinical differentiation of the aorta, the maximum SUV was extracted in the same regions using the mapping technique.

2.5. Statistical Analysis

Inter-observer reproducibility and validation of aortic wall SUV maps were tested for the five wall thicknesses investigated. Inter-observer reproducibility for the segmentations was evaluated in terms of the 95% Hausdorff distance (HD) and Dice score coefficient (DSC), while absolute distance was used for the anatomical landmarks.
The median and 95th percentile SUV obtained by the two observers for each aortic patch and in the thrombus were compared via intra-class correlation coefficient (ICC, by two-way random-effects model, single-rater and absolute agreement) [27] to assess the SUV mapping reproducibility. For validation, SUV measurements obtained by both observers via PET mapping were compared with those reported by the expert physician using linear regression and Bland–Altman analysis.
Continuous variables with normal distribution were presented as mean ± standard deviation, while for non-normally distributed variables median and interquartile range [IQR] were used. Categorical variables were presented as a number (percentage). All statistical analyses were performed using R Studio version 4.3.2 (R: A Language and Environment for Statistical Computing, R Core Team, Vienna, Austria).

3. Results

Eighty-two patients were included in the analysis. Demographic and clinical variables are summarized in Table 1. A total of 5580 aortic patches were extracted (4264 in the thoracic aorta region, 1316 in the abdominal region). Image co-registration was needed for 30 (36.6%) patients. Two PET images were affected by artifacts, while PET images of 24 (29.3%) patients presented signal spillover from the myocardium. These artifacts required manual correction of a total of 100 (1.8%) patches. Thus, the feasibility of the patch-wise PET analysis was 98.4%.

3.1. Inter-Observer Reproducibility

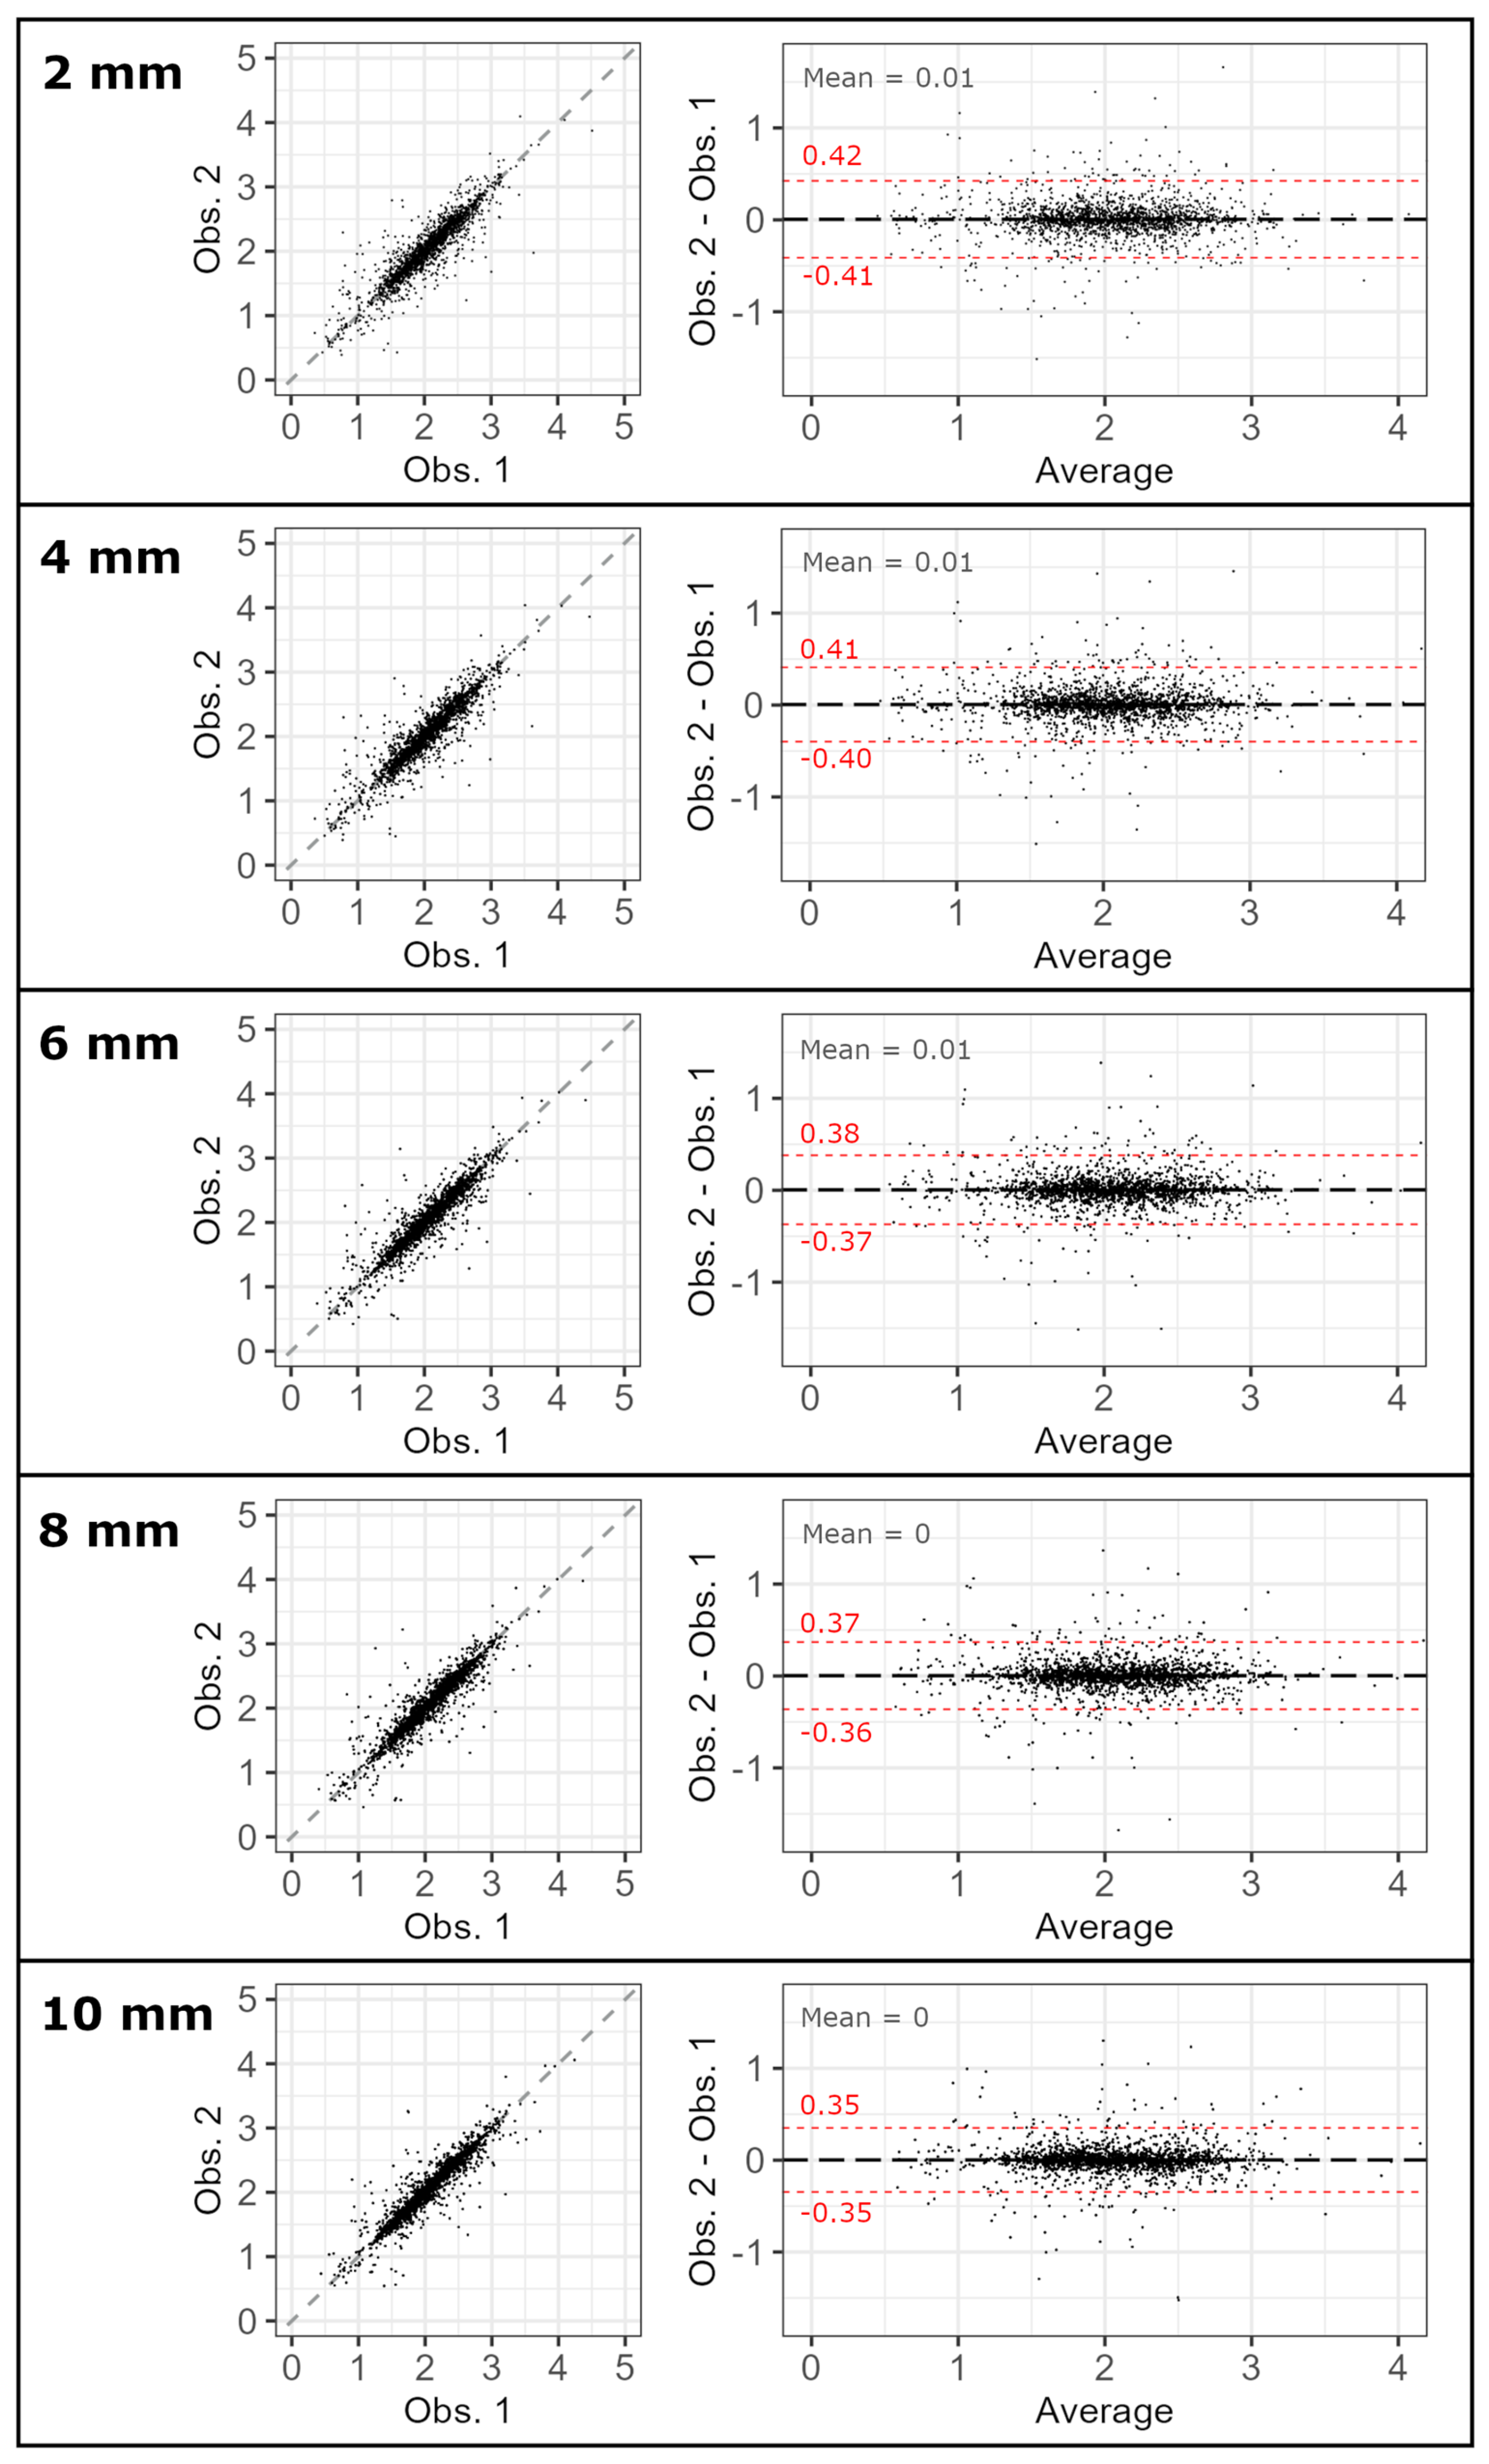
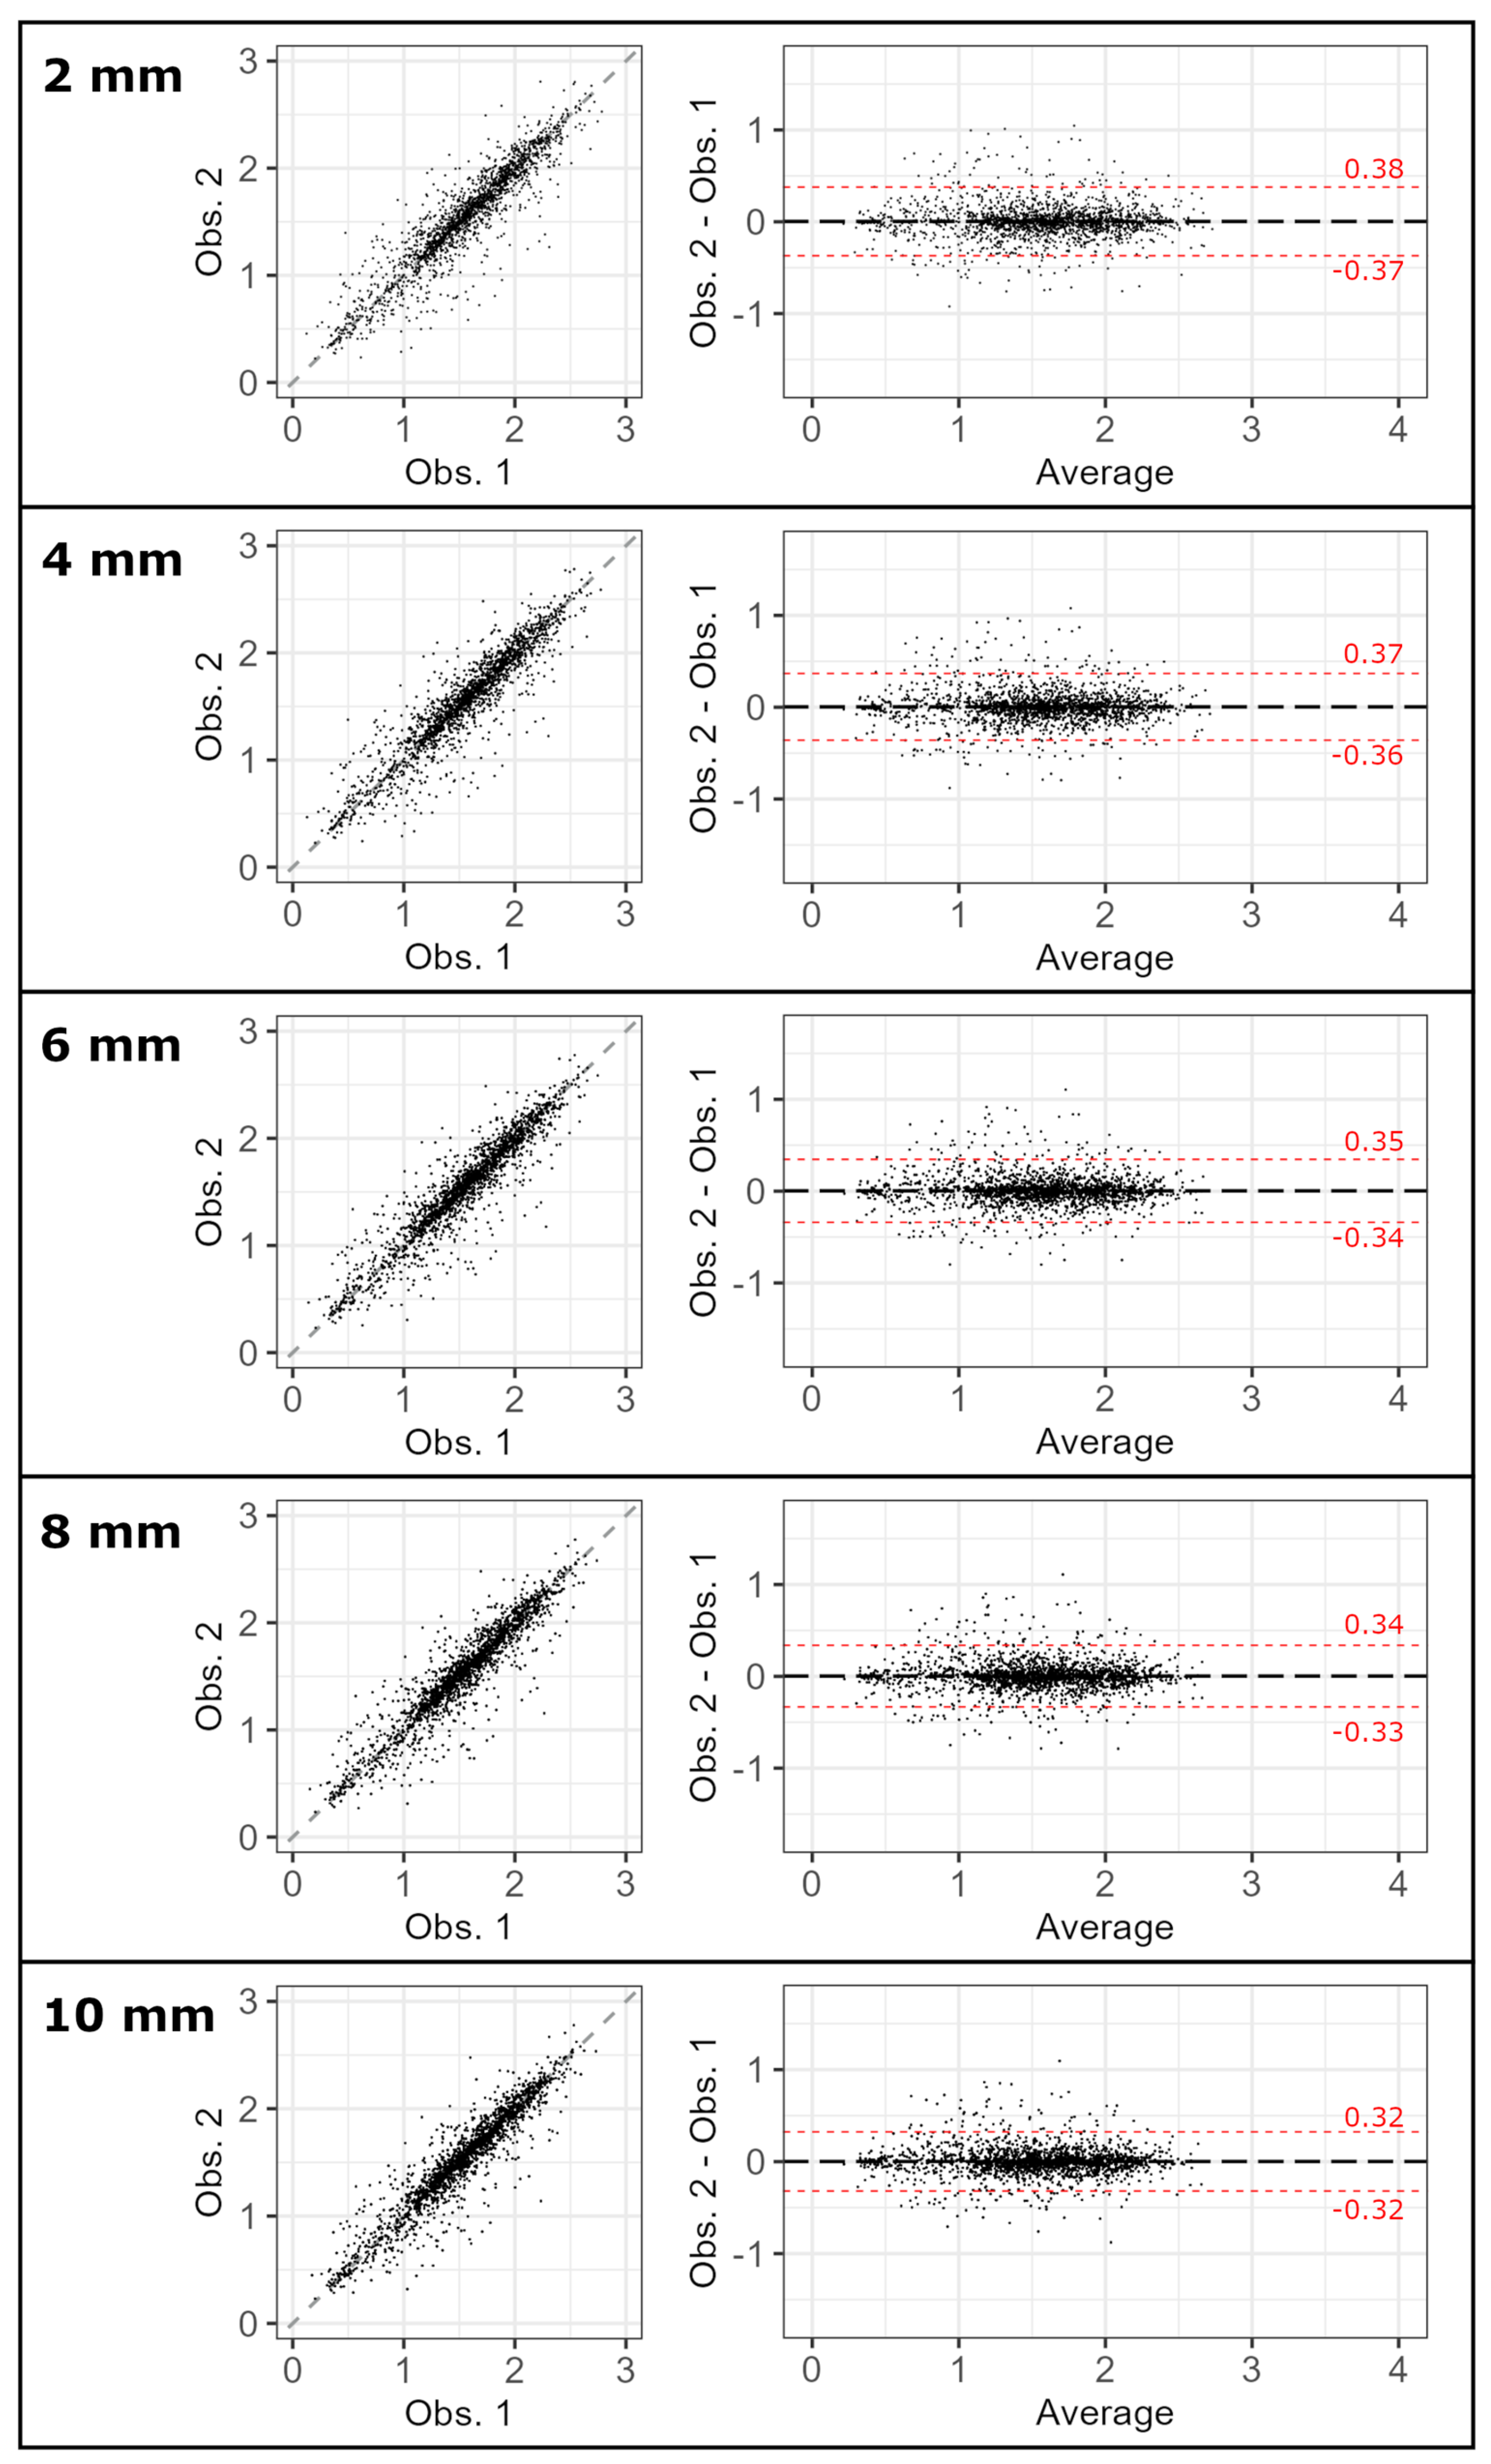
Of the 26 patients included for inter-reproducibility analysis, 17 presented thrombus (65.4%). Excellent reproducibility was obtained for the aortic (HD 3.97 [2.98, 5.36] mm, DSC 0.89 [0.87, 0.91]) and thrombus (HD 8.14 [4.58, 9.51] mm, DSC 0.82 [0.78, 0.86]) segmentations. Similarly, good reproducibility was obtained for the localization of the anatomical landmarks (6.11 [3.77, 9.61] mm). The inter-observer reproducibility of aortic SUV mapping was excellent (Table 2 and visually in Figure S2), with ICC between 0.950 and 0.966 for the 95th percentile (Figure 2) and median (Figure 3). Reproducibility tended to be higher at the larger thickness values (SUV median ICC increases from 0.959 at 2 mm to 0.966 at 10 mm). Notably, the reproducibility did not differ in patches with or without thrombus (Table S1).
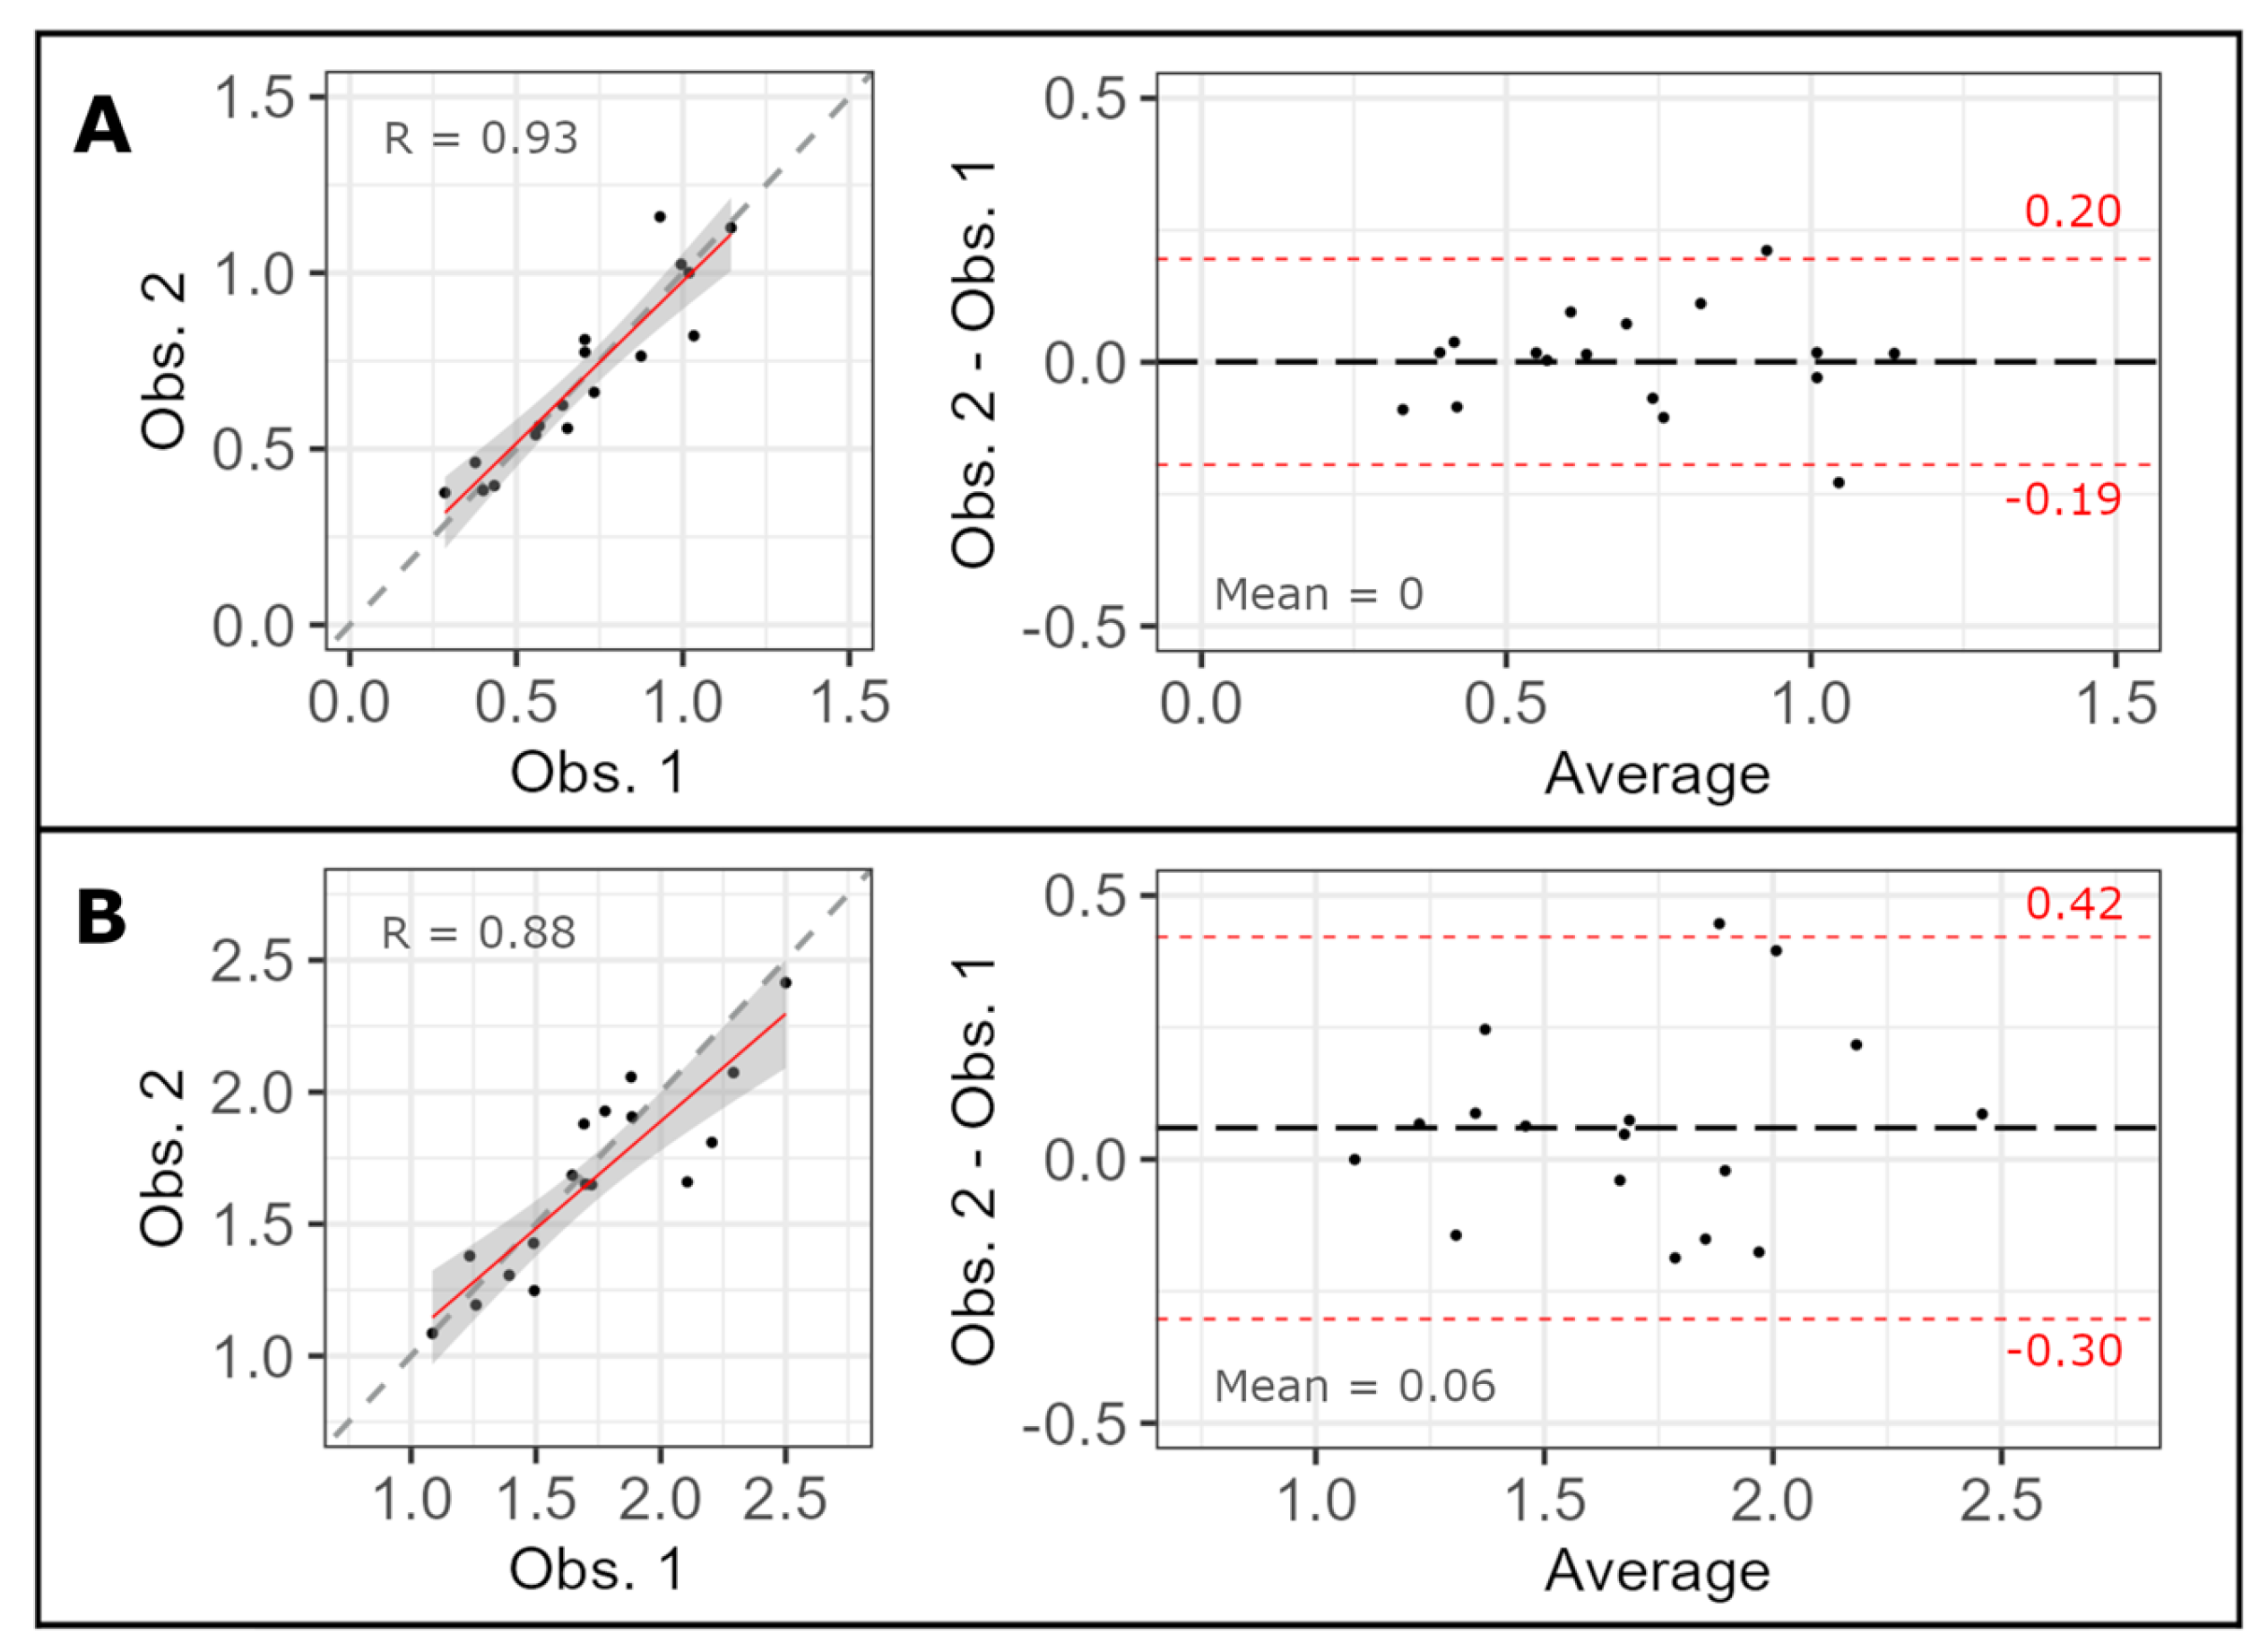
Similarly, good inter-observer reproducibility was obtained for median (ICC = 0.929 [0.816, 0.974]) and 95th percentile (ICC = 0.874 [0.693, 0.952]) SUV in the thrombus (Figure 4).

3.2. Validation

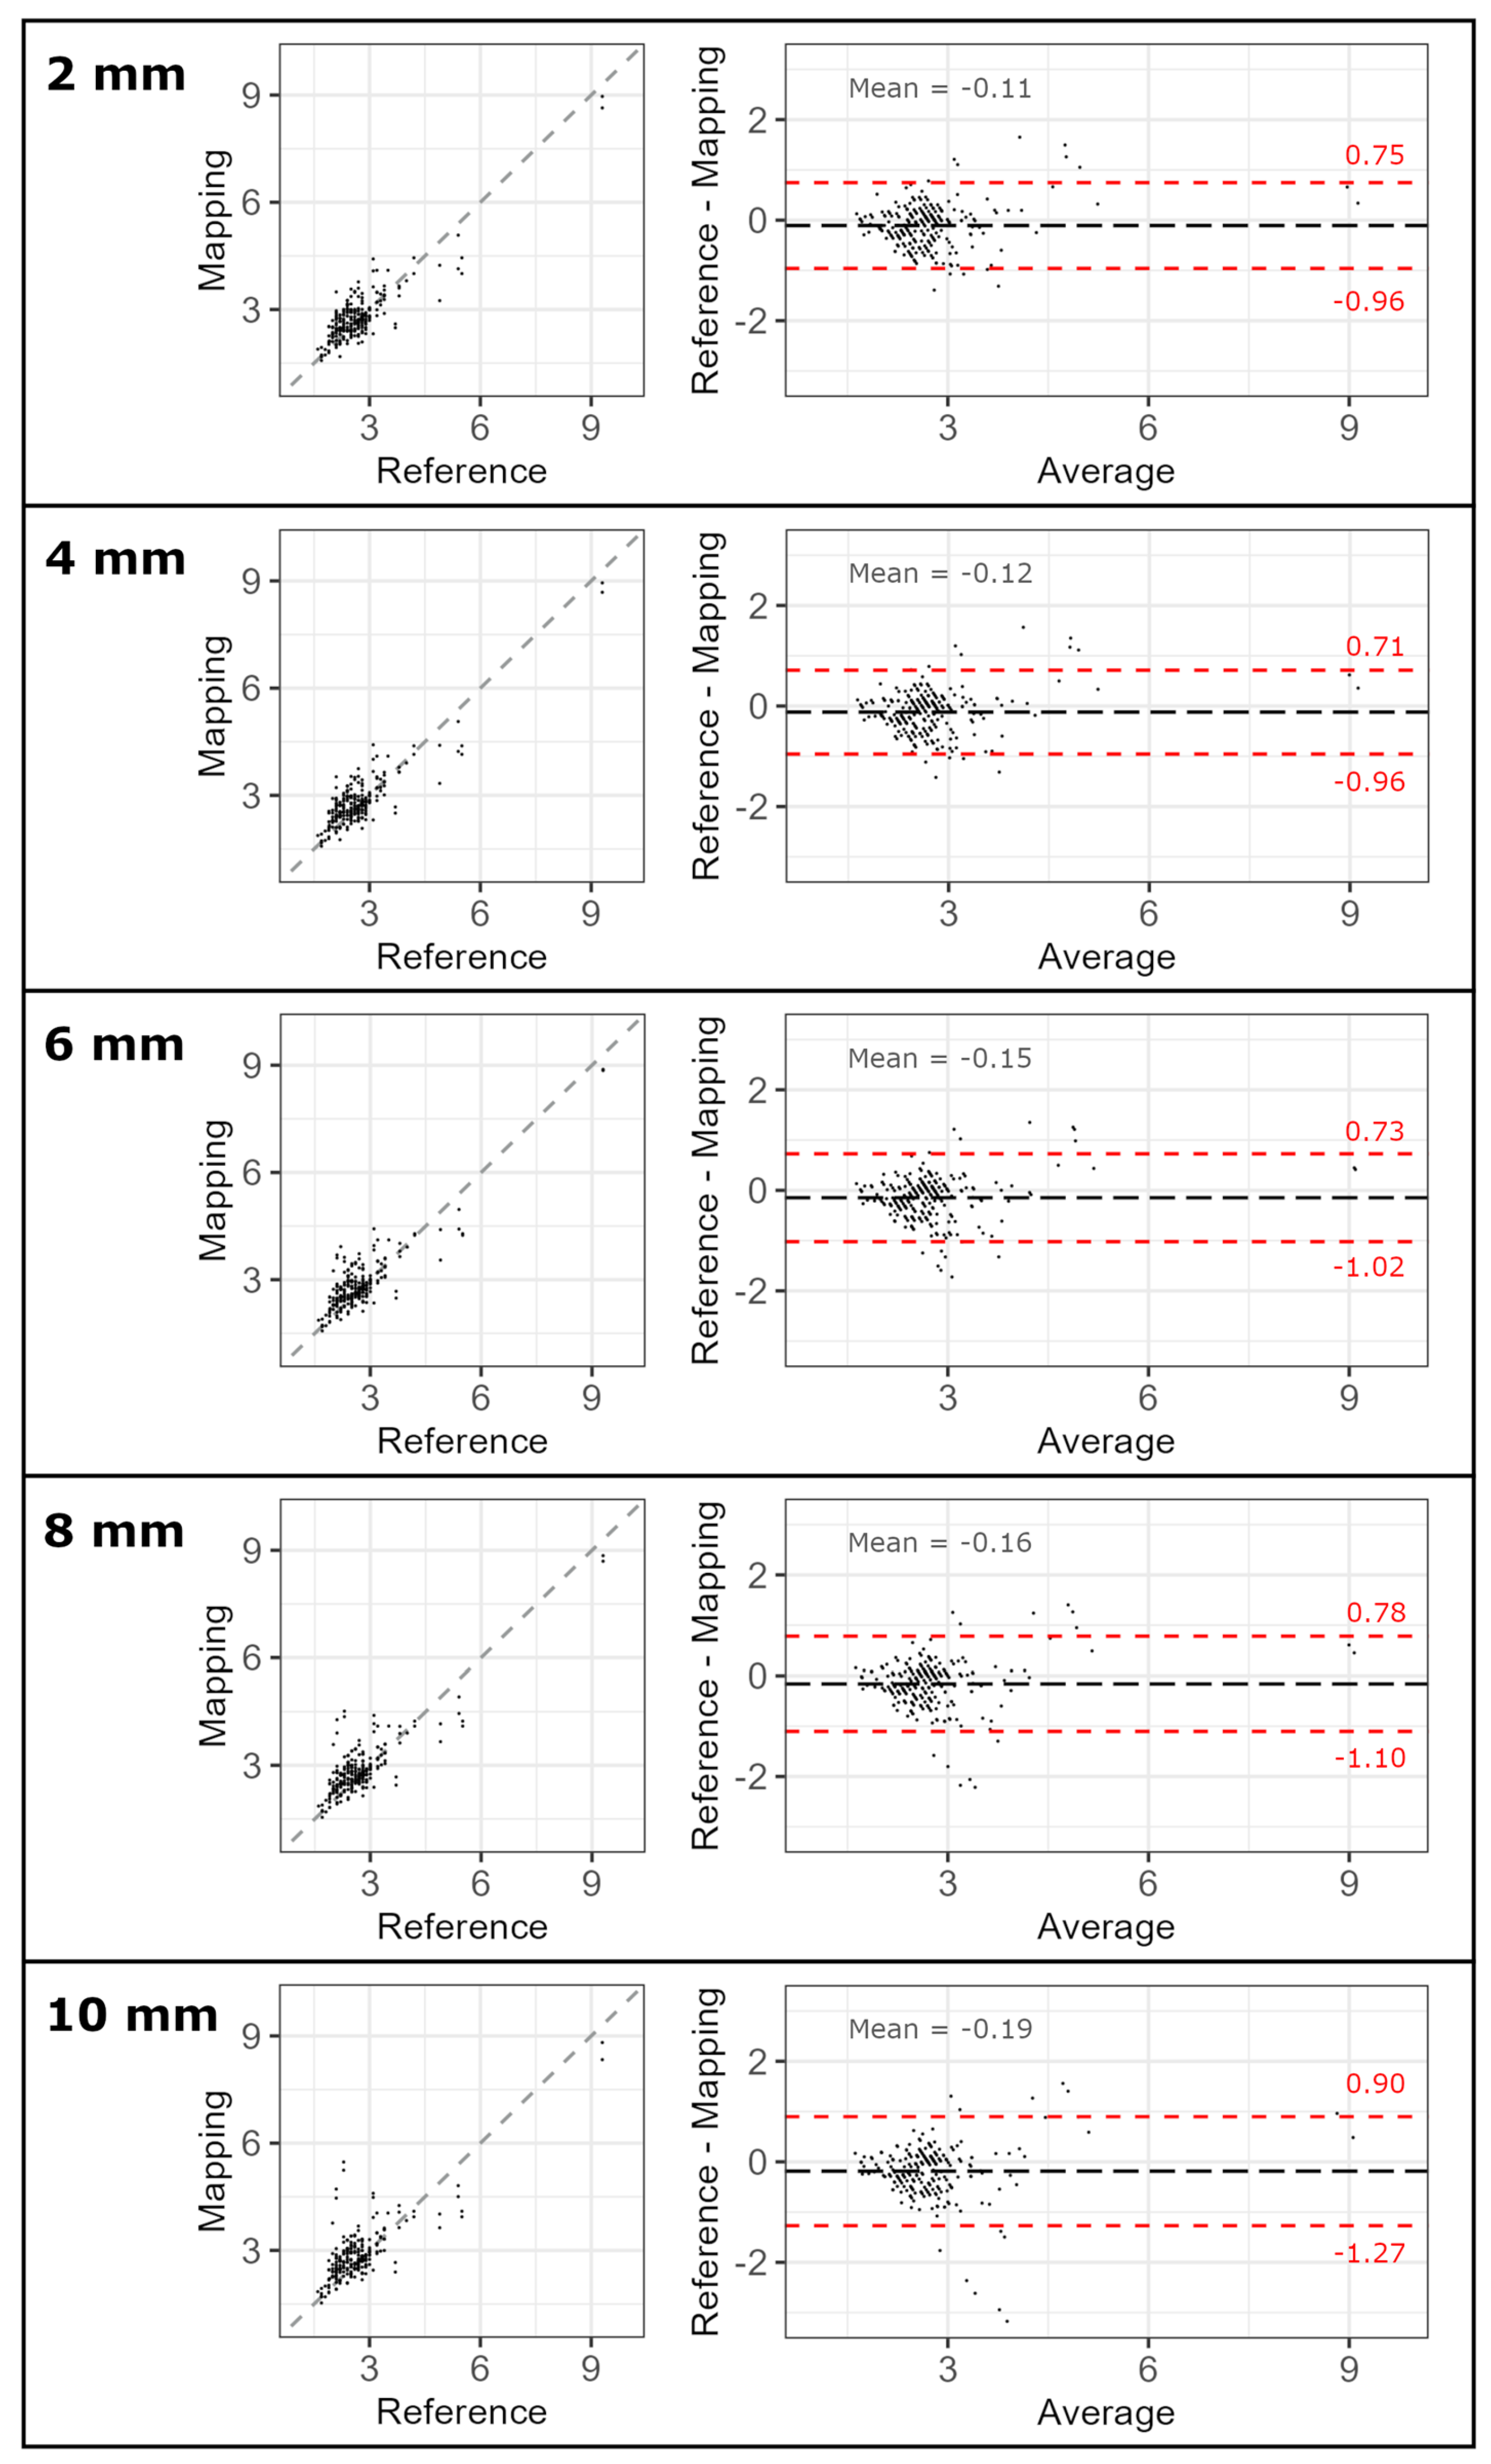
The validation of regional maximum SUV obtained by the mapping technique was performed by comparison against 257 SUV measurements manually assessed by the expert physician, as these measurements were not quantified by the clinician in 22 regions (7.9%). Results showed good agreement of mapping with the reference standard (linear correlation coefficient R between 0.848 at 2 mm and 0.755 at 10 mm), with different aortic wall thickness values having little impact on accuracy (Figure 5 and Table 2). The limited differences with respect to aortic wall thickness slightly favored the thinnest aortic wall volumes.

4. Discussion

In the present study, a semi-automatic method for 18F-FDG PET uptake mapping on the aortic wall is presented. Different thicknesses for the aortic wall segmentation have been tested to identify their possible impact on reproducibility and accuracy, with a thickness of 6 mm providing the best balance between them. Results showed that the method is highly feasible, reproducible and accurate, and thus is well-suited to empower research into the eventual role of aortic wall inflammation in the development and progression of aortic diseases.
PET/MR is a hybrid imaging modality introduced in the last decade that allows for simultaneous acquisition of PET and MR images. Using PET/MR, a comprehensive and multimodal analysis of the aorta can be achieved, enabling simultaneous geometrical, hemodynamic, and molecular characterization. Compared to the more established PET/computed tomography scanners, the use of PET/MR results in lower radiation exposure and improved tissue characterization, along with the high flexibility given by the variety of MR sequences available, while maintaining excellent scan–rescan repeatability [28], diagnostic utility [29] and research value [30]. Nonetheless, the full potential of PET/MR in evaluating aortic diseases remains to be established. Notably, the present implementation can be easily translated to PET/CT data, as MR data were used exclusively for anatomical reference (segmentation and landmarks), tasks where CT excels. Importantly, previous studies showed that PET/CT and PET/MR produce similar 18F-FDG measurements in the aorta [28]. The current clinical method of PET image analysis is evaluateing aortic uptake with a unique maximum value. While this method simplifies the evaluation, it is observer-dependent and neglects uptake in other regions, as well as its distribution along the aorta. For example, a previous study reported that the number of 18F-FDG hotspots, but not their maximum SUV, is correlated with aneurysm growth [30], a finding that might be related to a methodology that neglects SUV distribution. To address these limitations, the implementation presented here permits regional characterization to assess the 3D distribution of inflammatory markers, enabling regional and quantitative analysis, as well as comparisons between segments and co-localized markers of disease severity and progression. However, to ensure consistency with current clinical practice, this technique results have been compared with the clinical report from a nuclear medicine expert. The inter-observer variability in segmentations and anatomic landmarks localization demonstrated minor impact on the calculation of SUV in each patch of the aortic wall. Similarly, very little variation resulted from changing the aortic wall thickness. In this respect, inter-observer reproducibility improved slightly at wider wall thicknesses, and was highest at 10 mm. At wider wall thickness, patch SUV value is calculated for a thicker aortic wall which is composed of a larger number of data points. This may mitigate observer discrepancies in the identification of the aortic wall surface. The opposite trend was obtained in the validation analysis, where a thinner aortic wall tended to compare better with the reference method. Indeed, increasing aortic wall thickness was associated with an increase in the maximum uptake detected per region, which became slightly more overestimated. We speculate that this may be due to the fact that larger thicknesses may capture more surrounding tissue and organs, and thus the extracted maximum might not be representative of the aortic region of interest. Based on these opposite trends, present results suggest that a wall thickness of 6 mm may provide the best balance between accuracy and reproducibility in aortic PET uptake mapping. Notably, the only previous study implementing, but not validating, a similar method used a wall thickness of 6 mm [22].
The reproducibility of results in the thrombus was strong for both inter-observer segmentation and SUV metrics. While not all aortic aneurysms present thrombus, most abdominal aneurysms included in this cohort presented substantial thrombus. The role of thrombus in modulating the risk of complications in abdominal aortic aneurysms remains a topic of debate [14,31,32]. This methodology has the potential to provide more detailed insights into the interplay between aortic wall metabolism, thrombus presence and aneurysm evolution, which should be addressed in further studies.

5. Limitations and Future Research Directions

This analysis focused on a database of patients with non-genetic aneurysms. While we expect this technique to be applicable to other aortic diseases, such as genetic aortic syndromes, appropriate validation studies should be conducted.
Validation of uptake maps could not be performed at the single patch level since the fine spatial discretization implemented in the mapping cannot be manually reproduced by a nuclear medicine expert. Thus, the validation was performed on broader regions with clinical significance (ascending, thoracic-descending, and abdominal aorta) and in the aneurysm. The inter-observer agreement by PET mapping at the patch level was excellent, providing strong evidence that the results accurately represent local PET uptake.
The current implementation requires manual revision for the correction of artifacts and misregistration, which generates the potential for inter-observer variability. Future improvements could focus on the development of automatic identification and correction for these potential problems.
From a research perspective, applying this technique on longitudinal studies of aneurysm progression could provide insights into the prognostic value of PET uptake in this disease. Furthermore, future studies could examine the use of this PET mapping technique with other radiotracers, and on the comparison of PET maps with other co-localized biomarkers.

6. Conclusions

A technique permitting the 3D mapping of quantitative aortic wall 18-FDG standard uptake value from PET/MR scans was presented, showing excellent reproducibility and accuracy. This technique may improve the understanding of the impact of inflammation on aortic aneurysm etiology and evolution.

Supplementary Materials

The following supporting information can be downloaded at https://www.mdpi.com/article/10.3390/app151910685/s1, Figure S1: Visualization of (left) aortic segmentations of lumen (red) and thrombus (yellow) and the localization of anatomical points (black spheres) and the lumen centerline (black line); and segmentation merging (right) into aortic wall mesh (brown), with the corresponding anatomical points (black spheres) and the corresponding centerline (black line); Figure S2: Example of a patient’s different volume thickness representing the aortic wall increasing left to right from 2 to 10 mm, in A, the voxelized space, and in B, the color-coded mapped based on SUV (dark colors—lower values and bright colors—higher values); Table S1: Inter-observer reproducibility (median and 95th percentile) of aortic wall SUV mapping at different wall thicknesses in patches based on thrombus presence.

Author Contributions

M.B.-A.: data curation, formal analysis, investigation, methodology, software, visualization, writing—original draft. M.F.-C.: data curation, formal analysis, investigation, methodology, software, visualization, writing—review and editing. L.D.-S.: conceptualization, investigation, methodology, project administration, supervision, writing—review and editing. R.O.-S.: data curation, investigation, resources, writing—review and editing. M.G.-R.: data curation, methodology, investigation, resources, supervision, writing—review and editing. G.T.-T.: data curation, investigation, resources, supervision, writing—review and editing. J.G.-O.: methodology, software, visualization, writing—review and editing. L.G.-G.: data curation, investigation, resources, supervision, writing—review and editing. P.L.-G.: methodology, software, visualization, writing—review and editing. A.C.-S.: methodology, software, visualization, writing—review and editing. J.R.G.-G.: data curation, resources, validation, writing—review and editing. N.M.-E.: data curation, resources, validation, writing—review and editing. J.S.: data curation, investigation, resources, writing—review and editing. I.F.-G.: data curation, funding acquisition, investigation, project administration, resources, writing—review and editing. S.B.-M.: conceptualization, data curation, funding acquisition, methodology, project administration, resources, supervision, writing—review and editing. J.R.-P.: conceptualization, data curation, funding acquisition, methodology, project administration, resources, supervision, writing—review and editing. A.G.: conceptualization, funding acquisition, investigation, methodology, project administration, supervision, writing—review and editing. All authors have read and agreed to the published version of the manuscript.

Funding

This work was supported by funding from the Spanish Ministry of Science and Innovation MCIU/AEI/10.13039/501100011033 (FORT23/00034, PLEC2021-007664, RTC2019-007280-1, co-funded by the European Union), the Generalitat de Catalunya (PERIS-SLT028/23/000195 and AGAUR-2021SGR758), the CIBERCV and CIBER-ESP, and the Instituto de Salud Carlos III (PI19/01480, PI20/01727 and CP24/00121, co-funded by the European Union/European Regional Development Fund). Juan Garrido-Oliver has received funding from Secretaria d’Universitats i Recerca del Departament de Recerca i Universitats de la Generalitat de Catalunya i del Fons Europeu Social Plus (AGAUR-FI 2023 FI-1 00322 Joan Oró).

Institutional Review Board Statement

The study was conducted in accordance with the Declaration of Helsinki, and approved by the Institutional Ethics Committee of Vall d’Hebron University Hospital (PR(AG)253/2019 on 28 June 2019).

Informed Consent Statement

Written informed consent was obtained from all patients.

Data Availability Statement

The data that support the findings of this article are not publicly available due to privacy and ethical concerns. They can be requested from the corresponding authors.

Acknowledgments

The authors wish to thank Graham Watling for help with the English version of the manuscript and Santiago Perez Hoyos for statistical support.

Conflicts of Interest

The authors have no relevant financial or non-financial interests to disclose.

Abbreviations

The following abbreviations are used in this manuscript:
18F-FDG18F-fluorodeoxyglucose
CEMRAContrast-enhanced magnetic resonance angiography
DSCDice score coefficient
HDHausdorff distance
ICCIntra-class correlation coefficient
IQRInterquartile range
MRMagnetic resonance
PC-MRAPhase-contrast-enhanced magnetic resonance angiography
PETPositron emission tomography
SSFSESingle-shot fast-spin echo
SUVStandard uptake value

References

  1. Mazzolai, L.; Teixido-Tura, G.; Lanzi, S.; Boc, V.; Bossone, E.; Brodmann, M.; Bura-Rivière, A.; De Backer, J.; Deglise, S.; Della Corte, A.; et al. 2024 ESC Guidelines for the management of peripheral arterial and aortic diseases. Eur. Heart J. 2024, 45, 3538–3700. [Google Scholar] [CrossRef]
  2. Perez, Z.G.; Zafar, M.A.; Velasco, J.J.; Sonsino, A.; Ellauzi, H.; John, C.; Kalyanasundaram, A.; Ziganshin, B.A.; Elefteriades, J.A. Aortic Size at the Time of Type A and Type B Dissections. Ann. Thorac. Surg. 2023, 116, 262–268. [Google Scholar] [CrossRef] [PubMed]
  3. Elizondo-Benedetto, S.; Sultan, D.; Wahidi, R.; Hamdi, M.; Zaghloul, M.S.; Hafezi, S.; Arif, B.; McDonald, L.K.; Harrison, K.; Thies, D.; et al. Pilot first-in-human CCR2 PET/CT to detect abdominal aortic aneurysm wall instability. Theranostics 2025, 15, 5518–5528. [Google Scholar] [CrossRef] [PubMed]
  4. Dux-Santoy, L.; Rodríguez-Palomares, J.F.; Teixidó-Turà, G.; Garrido-Oliver, J.; Carrasco-Poves, A.; Morales-Galán, A.; Ruiz-Muñoz, A.; Casas, G.; Valente, F.; Galian-Gay, L.; et al. Three-dimensional aortic geometry mapping via registration of non-gated contrast-enhanced or gated and respiratory-navigated MR angiographies. J. Cardiovasc. Magn. Reson. 2024, 27, 100992. [Google Scholar] [CrossRef] [PubMed]
  5. Dux-Santoy, L.; Rodríguez-Palomares, J.F.; Teixidó-Turà, G.; Ruiz-Muñoz, A.; Casas, G.; Valente, F.; Servato, M.L.; Galian-Gay, L.; Gutiérrez, L.; González-Alujas, T.; et al. Registration-based semi-automatic assessment of aortic diameter growth rate from contrast-enhanced computed tomography outperforms manual quantification. Eur. Radiol. 2022, 32, 1997–2009. [Google Scholar] [CrossRef]
  6. Singh Dhesi, S.; Adusumilli, P.; Ravikumar, N.; Waduud, M.A.; Frood, R.; Frangi, A.F.; McDermott, G.; Rudd, J.H.F.; Huang, Y.; Boyle, J.R.; et al. Development and External Validation of [18F] FDG PET-CT-Derived Radiomic Models for Prediction of Abdominal Aortic Aneurysm Growth Rate. Algorithms 2025, 18, 86. [Google Scholar] [CrossRef]
  7. Isselbacher, E.M.; Preventza, O.; Black, J.H., 3rd; Augoustides, J.G.; Beck, A.W.; Bolen, M.A.; Braverman, A.C.; Bray, B.E.; Brown-Zimmerman, M.M.; Chen, E.P.; et al. 2022 ACC/AHA Guideline for the Diagnosis and Management of Aortic Disease: A Report of the American Heart Association/American College of Cardiology Joint Committee on Clinical Practice Guidelines. Circulation 2022, 146, E334–E482. [Google Scholar] [CrossRef]
  8. Evangelista, A.; Galian-Gay, L.; Guala, A.; Teixido-Tura, G.; Calvo-Iglesias, F.; Sevilla, T.; Bermejo, J.; Méndez, I.; Sánchez, V.; Carmona, J.M.R.; et al. Atorvastatin Effect on Aortic Dilatation and Valvular Calcification Progression in Bicuspid Aortic Valve (BICATOR): A Randomized Clinical Trial. Circulation 2024, 149, 1938–1948. [Google Scholar] [CrossRef]
  9. Bruls, S.; Musumeci, L.; Courtois, A.; Hustinx, R.; Sakalihasan, S.; Namur, G.; Defraigne, J.-O.; Sakalihasan, N. Can Biomarkers and PET Imaging Predict Abdominal Aortic Aneurysm Growth Rate? J. Clin. Med. 2024, 13, 2448. [Google Scholar] [CrossRef]
  10. Nakahara, T.; Miyazawa, R.; Iwabuchi, Y.; Tonda, K.; Narula, N.; Strauss, H.W.; Narula, J.; Jinzaki, M. Aortic Uptake of 18 F-NaF and 18 F-FDG and Calcification Predict the Development of Abdominal Aortic Aneurysms and Is Attenuated by Drug Therapy. Arterioscler. Thromb. Vasc. Biol. 2024, 44, 1975–1985. [Google Scholar] [CrossRef]
  11. Robson, P.M.; Dey, D.; Newby, D.E.; Berman, D.; Li, D.; Fayad, Z.A.; Dweck, M.R. MR/PET Imaging of the Cardiovascular System. JACC Cardiovasc. Imaging 2017, 10, 1165–1179. [Google Scholar] [CrossRef] [PubMed]
  12. Bell, M.; Gandhi, R.; Shawer, H.; Tsoumpas, C.; Bailey, M.A. Imaging Biological Pathways in Abdominal Aortic Aneurysms Using Positron Emission Tomography. Arterioscler. Thromb. Vasc. Biol. 2021, 41, 1596–1606. [Google Scholar] [CrossRef] [PubMed]
  13. Fernández-Friera, L.; Fuster, V.; López-Melgar, B.; Oliva, B.; Sánchez-González, J.; Macías, A.; Pérez-Asenjo, B.; Zamudio, D.; Alonso-Farto, J.C.; España, S.; et al. Vascular Inflammation in Subclinical Atherosclerosis Detected by Hybrid PET/MRI. J. Am. Coll. Cardiol. 2019, 73, 1371–1382. [Google Scholar] [CrossRef] [PubMed]
  14. Vorp, D.A.; Lee, P.C.; Wang, D.H.; Makaroun, M.S.; Nemoto, E.M.; Ogawa, S.; Webster, M.W. Association of intraluminal thrombus in abdominal aortic aneurysm with local hypoxia and wall weakening. J. Vasc. Surg. 2001, 34, 291–299. [Google Scholar] [CrossRef]
  15. Lee, H.; Paeng, J.C.; Kim, K.H.; Cheon, G.J.; Lee, D.S.; Chung, J.-K.; Kang, K.W. Correlation of FDG PET/CT Findings with Long-Term Growth and Clinical Course of Abdominal Aortic Aneurysm. Nucl. Med. Mol. Imaging 2018, 52, 46–52. [Google Scholar] [CrossRef]
  16. Tegler, G.; Ericson, K.; Sörensen, J.; Björck, M.; Wanhainen, A. Inflammation in the walls of asymptomatic abdominal aortic aneurysms is not associated with increased metabolic activity detectable by 18-fluorodeoxglucose positron-emission tomography. J. Vasc. Surg. 2012, 56, 802–807. [Google Scholar] [CrossRef]
  17. Courtois, A.; Nusgens, B.V.; Hustinx, R.; Namur, G.; Gomez, P.; Somja, J.; Defraigne, J.-O.; Delvenne, P.; Michel, J.-B.; Colige, A.C.; et al. 18F-FDG uptake assessed by PET/CT in abdominal aortic aneurysms is associated with cellular and molecular alterations prefacing wall deterioration and rupture. J. Nucl. Med. 2013, 54, 1740–1747. [Google Scholar] [CrossRef]
  18. Yoder, K.K. Basic PET Data Analysis Techniques. In Positron Emission Tomography—Recent Developments in Instrumentation, Research and Clinical Oncological Practice; Misciagna, S., Ed.; IntechOpen: London, UK, 2013. [Google Scholar] [CrossRef]
  19. Dashora, H.R.; Rosenblum, J.S.; Quinn, K.A.; Alessi, H.; Novakovich, E.; Saboury, B.; Ahlman, M.A.; Grayson, P.C. Comparing Semiquantitative and Qualitative Methods of Vascular 18F-FDG PET Activity Measurement in Large-Vessel Vasculitis. J. Nucl. Med. 2022, 63, 280–286. [Google Scholar] [CrossRef]
  20. Slart, R.H.J.A.; Glaudemans, A.W.J.M.; Chareonthaitawee, P.; Treglia, G.; Besson, F.L.; Bley, T.A.; Blockmans, D.; Boellaard, R.; Bucerius, J.; Carril, J.M.; et al. FDG-PET/CT (A) imaging in large vessel vasculitis and polymyalgia rheumatica: Joint procedural recommendation of the EANM, SNMMI, and the PET Interest Group (PIG), and endorsed by the ASNC. Eur. J. Nucl. Med. Mol. Imaging 2018, 47, 1250–1269. [Google Scholar] [CrossRef]
  21. McBride, O.M.B.; Joshi, N.; Robson, J.; MacGillivray, T.; Gray, C.; Fletcher, A.; Dweck, M.; van Beek, E.; Rudd, J.; Newby, D.; et al. Positron Emission Tomography and Magnetic Resonance Imaging of Cellular Inflammation in Patients with Abdominal Aortic Aneurysms. Eur. J. Vasc. Endovasc. Surg. 2016, 51, 518–526. [Google Scholar] [CrossRef]
  22. Minderhoud, S.C.S.; Fletcher, A.J.; MacNaught, G.; Cadet, S.; Korteland, S.-A.; Kardys, I.; Rizopoulos, D.; Slomka, P.; Newby, D.E.; Roos-Hesselink, J.W.; et al. Vascular biomechanics and molecular disease activity in the thoracic aorta: A novel imaging method. Eur. Heart J. Cardiovasc. Imaging 2022, 23, 1698–1707. [Google Scholar] [CrossRef] [PubMed]
  23. Kadian-Dodov, D.; Seo, P.; Robson, P.M.; Fayad, Z.A.; Olin, J.W. Inflammatory Diseases of the Aorta: JACC Focus Seminar, Part 2. J. Am. Coll. Cardiol. 2022, 80, 832–844. [Google Scholar] [CrossRef] [PubMed]
  24. Loecher, M.; Schrauben, E.; Johnson, K.M.; Wieben, O. Phase unwrapping in 4D MR flow with a 4D single-step laplacian algorithm. J. Magn. Reson. Imaging 2016, 43, 833–842. [Google Scholar] [CrossRef] [PubMed]
  25. Shin, H.B.; Sheen, H.; Lee, H.Y.; Kang, J.; Yoon, D.K.; Suh, T.S. Digital Imaging and Communications in Medicine (DICOM) information conversion procedure for SUV calculation of PET scanners with different DICOM header information. Phys. Medica 2017, 44, 243–248. [Google Scholar] [CrossRef]
  26. Fedorov, A.; Beichel, R.; Kalpathy-Cramer, J.; Finet, J.; Fillion-Robin, J.-C.; Pujol, S.; Bauer, C.; Jennings, D.; Fennessy, F.; Sonka, M.; et al. 3D Slicer as an image computing platform for the Quantitative Imaging Network. Magn. Reson. Imaging 2012, 30, 1323–1341. [Google Scholar] [CrossRef]
  27. Koo, T.K.; Li, M.Y. A Guideline of Selecting and Reporting Intraclass Correlation Coefficients for Reliability Research. J. Chiropr. Med. 2016, 15, 155–163. [Google Scholar] [CrossRef]
  28. Robson, P.M.; Kaufman, A.; Pruzan, A.; Dweck, M.R.; Trivieri, M.-G.; Abgral, R.; Karakatsanis, N.A.; Brunner, P.M.; Guttman, E.; Fayad, Z.A.; et al. Scan-rescan measurement repeatability of 18F-FDG PET/MR imaging of vascular inflammation. J. Nucl. Cardiol. 2022, 29, 1660–1670. [Google Scholar] [CrossRef]
  29. Laurent, C.; Ricard, L.; Fain, O.; Buvat, I.; Adedjouma, A.; Soussan, M.; Mekinian, A. PET/MRI in large-vessel vasculitis: Clinical value for diagnosis and assessment of disease activity. Sci. Rep. 2019, 9, 12388. [Google Scholar] [CrossRef]
  30. Kuzniar, M.; Tegler, G.; Wanhainen, A.; Ahlström, H.; Mani, K.; Hansen, T. Feasibility of Assessing Inflammation in Asymptomatic Abdominal Aortic Aneurysms with Integrated 18F-Fluorodeoxyglucose Positron Emission Tomography/Magnetic Resonance Imaging. Eur. J. Vasc. Endovasc. Surg. 2020, 59, 464–471. [Google Scholar] [CrossRef]
  31. Mulorz, J.; Mazrekaj, A.; Sehl, J.; Arnautovic, A.; Garabet, W.; Krott, K.-J.; Schelzig, H.; Elvers, M.; Wagenhäuser, M.U. Relative Thrombus Burden Ratio Reveals Overproportioned Intraluminal Thrombus Growth—Potential Implications for Abdominal Aortic Aneurysm. J. Clin. Med. 2024, 13, 962. [Google Scholar] [CrossRef]
  32. Huang, Y.; Teng, Z.; Elkhawad, M.; Tarkin, J.M.; Joshi, N.; Boyle, J.R.; Buscombe, J.R.; Fryer, T.D.; Zhang, Y.; Park, A.Y.; et al. High Structural Stress and Presence of Intraluminal Thrombus Predict Abdominal Aortic Aneurysm 18F-FDG Uptake: Insights from Biomechanics. Circ. Cardiovasc. Imaging 2016, 9, e004656. [Google Scholar] [CrossRef]
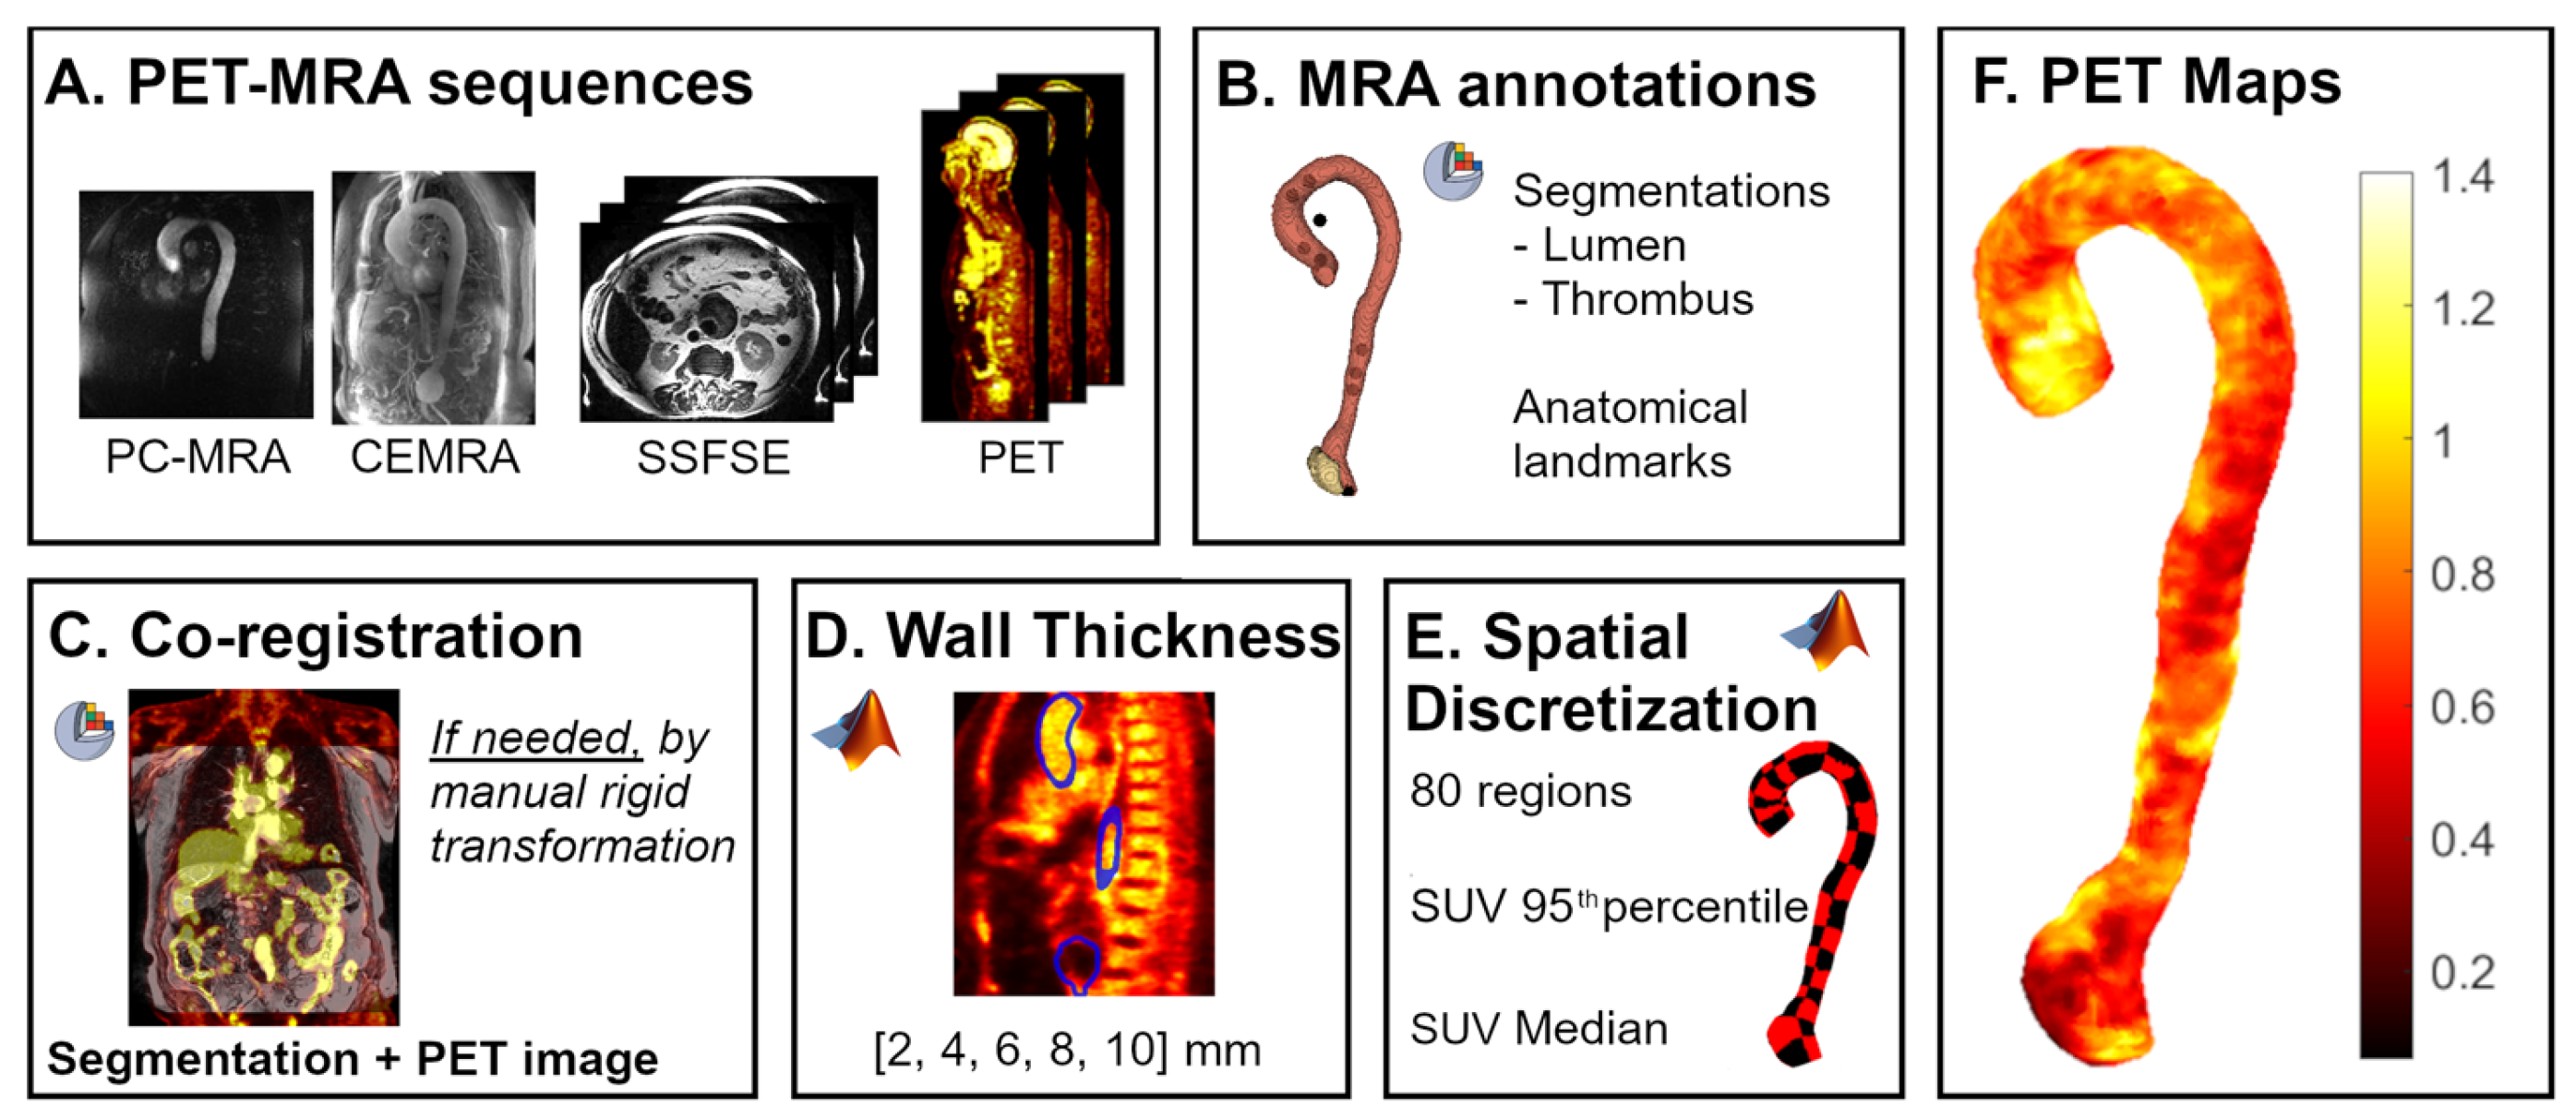
Figure 1. Workflow of proposed methodology, detailing the sequential process in six steps. (A) Data acquisition. (B) Magnetic resonance angiography (MRA) annotations. (C) Co-registration between segmentations and positron emission tomography (PET) images. (D) Setting the wall thickness volume, visualized in blue. (E) Spatial discretization of the aortic wall to calculate the standard uptake value (SUV) in each region and voxel and (F) perform a 3D color-coded map. Each step is represented in a dedicated box. Phase-contrast-enhanced MRA (PC-MRA), contrast-enhanced magnetic resonance angiography (MRA), single-shot fast-spin echo (SSFSE).
Applsci 15 10685 g001
Figure 2. Scatter (left) and Bland–Altmann (right) plots for the inter-observer variability of 95th percentile SUV maps according to aortic wall thickness (2 to 10 mm, topdown order). In the scatter plots, the gray dashed line shows theoretical perfect correlation of data. In the Bland–Altmann plot, the black long-dashed line shows interobserver difference mean, and red dashed lines show the 95% limits of agreement, with their respective value in gray and red.
Applsci 15 10685 g002
Figure 3. Scatter (left) and Bland–Altmann (right) plots for the inter-observer variability of median SUV maps according to aortic wall thickness (2 to 10 mm, topdown order). In the scatter plots, the gray dashed line shows theoretical perfect correlation of data. In the Bland–Altmann plot, the black long-dashed line shows interobserver difference mean (for all plots is 0), and red dashed lines show the 95% limits of agreement, with their respective values in gray and red.
Applsci 15 10685 g003
Figure 4. Inter-observer reproducibility of median (A) and 95th percentile (B) SUV uptake in the thrombus. In the scatter plots, the gray dashed line shows theoretical perfect correlation of data and the red line shows the linear trend of the data, with the confident interval in gray. In the Bland–Altmann plot, the black long-dashed line shows interobserver difference, and red dashed lines shows the 95% limits of agreement, with their respective values in gray and red.
Applsci 15 10685 g004
Figure 5. Scatter (left) and Bland–Altmann (right) plots for the validation of maximum SUVs according to aortic wall thickness (2 to 10 mm, topdown order). In the scatter plots, the gray dashed line shows theoretical perfect correlation of data. In the Bland–Altmann plot, the black long-dashed line shows interobserver difference, and red dashed lines shows the 95% limits of agreement, with their respective values in gray and red.
Applsci 15 10685 g005
Table 1. Patient characteristics.
Characteristic n = 82
Age (years) 66 [53–73]
Male sex (n (%)) 67 (81.7%)
Body surface area (m2)1.9 [1.8–2.1]
Aortic valve (n (%))
Bicuspid aortic valve 39 (47.6%)
Tricuspid aortic valve 43 (52.4%)
Aneurysm location (n (%))
Aortic root 1 (1.2%)
Thoracic ascending 43 (52.5%)
Thoracic descending 2 (2.4%)
Abdominal 36 (43.9%)
Thrombus (n (%)) 29 (35.4%)
Table 2. Inter-observer reproducibility (median and 95th percentile) and validation (maximum) of aortic wall SUV mapping at different wall thicknesses. Bold represents the best values for each parameter among all thicknesses.
Thickness2 [mm]4 [mm]6 [mm]8 [mm]10 [mm]
Interobserver reproducibility
ICC Median 0.959
[0.955, 0.962]
0.960
[0.958, 0.963]
0.964
[0.962, 0.965]
0.964
[0.963, 0.966]
0.966
[0.965, 0.968]
95th percentile 0.950
[0.946, 0.955]
0.953
[0.949, 0.956]
0.958
[0.956, 0.960]
0.959
[0.957, 0.961]
0.962
[0.960, 0.963]
Validation with manual assessment
ICC Maximum 0.848
[0.803, 0.882]
0.852
[0.803, 0.888]
0.836
[0.774, 0.879]
0.810
[0.739, 0.860]
0.755
[0.669, 0.817]
Disclaimer/Publisher’s Note: The statements, opinions and data contained in all publications are solely those of the individual author(s) and contributor(s) and not of MDPI and/or the editor(s). MDPI and/or the editor(s) disclaim responsibility for any injury to people or property resulting from any ideas, methods, instructions or products referred to in the content.