Article

Frequency-Domain Importance-Based Attack for 3D Point Cloud Object Tracking

1
Xuzhou Public Security Bureau, Xuzhou 221008, China
2
School of Computer Science and Technology, China University of Mining and Technology, Xuzhou 221116, China
*
Author to whom correspondence should be addressed.
Appl. Sci. 2025, 15(19), 10682; https://doi.org/10.3390/app151910682
Submission received: 30 May 2025 / Revised: 24 July 2025 / Accepted: 30 September 2025 / Published: 2 October 2025

Abstract

3D point cloud object tracking plays a critical role in fields such as autonomous driving and robotics, making the security of these models essential. Adversarial attacks are a key approach for studying the robustness and security of tracking models. However, research on the generalization of adversarial attacks for 3D point-cloud-tracking models is limited, and the frequency-domain information of the point cloud’s geometric structure is often overlooked. This frequency information is closely related to the generalization of 3D point-cloud-tracking models. To address these limitations, this paper proposes a novel adversarial method for 3D point cloud object tracking, utilizing frequency-domain attacks based on the importance of frequency bands. The attack operates in the frequency domain, targeting the low-frequency components of the point cloud within the search area. To make the attack more targeted, the paper introduces a frequency band importance saliency map, which reflects the significance of sub-frequency bands for tracking and uses this importance as attack weights to enhance the attack’s effectiveness. The proposed attack method was evaluated on mainstream 3D point-cloud-tracking models, and the adversarial examples generated from white-box attacks were transferred to other black-box tracking models. Experiments show that the proposed attack method reduces both the average success rate and precision of tracking, proving the effectiveness of the proposed adversarial attack. Furthermore, when the white-box adversarial samples were transferred to the black-box model, the tracking metrics also decreased, verifying the transferability of the attack method.

1. Introduction

3D point cloud object tracking is based on the given point cloud object in the first frame as a template, generating a 3D prediction box to determine the position of the object in subsequent frames. The introduction of 3D point cloud into object tracking makes up for the shortage of tracking only by 2D images. 3D point cloud object tracking is widely used in the fields of automatic driving [1], robotics [2], video surveillance [3], etc. In these application areas, the safety and reliability of the tracker are the main priorities [4,5]. The research of generating adversarial examples plays an important role in evaluating the robustness of trackers and improving the anti-perturbation capability of trackers.
In recent years, adversarial attack methods for 3D object-tracking models have also been proposed [6,7]. However, the existing studies on 3D point cloud object tracking adversarial attacks have the following limitations: (1) There are few studies on the portability of existing attack methods, and there is a lack of differentiation between generalized and non-generalized features. Among the existing research, only the Transferable Attack Network (TAN) [7] has paid attention to the researching the transportability of the 3D point cloud object tracking adversarial attack method. Existing studies have shown [8] that the features learned by a model from a dataset can be subdivided into generalized features and non-generalized features. The generalized features have nothing to do with the model, and different models can learn similar generalized features from the same dataset. The attack dataset has the features of generalization and fragility, which can produce migrable adversarial perturbations. (2) The frequency-domain information of the geometric structure of the point cloud is ignored, and the generalization of the 3D point-cloud-tracking model is closely related to its frequency-domain information. The frequency-domain principle [9] shows that the generalization of deep neural networks is related to the frequency domain, and the noise of the high-frequency component of point cloud data can easily lead to overfitting and thus reduce the generalization, while the noise of the low-frequency component is less.
The 3D point cloud, when analyzed across different frequency bands, reveals distinct aspects of its geometric structure. Low-frequency bands capture the basic shape of the point cloud, while high-frequency bands convey its finer details. Attacks targeting the geometric structure can significantly alter the point cloud’s features. In Figure 1, we extract the track-id 88 object and its surrounding background from frame 975 in scene 19 of the KITTI dataset. The upper plot of Figure 1a illustrates the 3D point cloud representation alongside its frequency-domain coefficient representation. This figure demonstrates that the majority of the frequency domain energy is concentrated in the low-frequency coefficients. In the lower plot of Figure 1b, we remove the high-frequency bands, retaining only the first one-third of the frequency-domain coefficients. The upper plot of Figure 1b visualizes the point cloud after this high-frequency removal. Despite the low-frequency band comprising only one-third of the total frequency spectrum, it preserves most of the target object’s geometric structure, with some background elements effectively filtered out. Inspired by the correlation between the frequency domain and geometric properties, we propose that the low-frequency region of the target in the frequency domain is strongly associated with both generalization and geometric features. Furthermore, attacks targeting this low-frequency region exhibit greater transferability. In this study, we separate generalized and non-generalized features using frequency-domain analysis.
To validate this hypothesis, we conducted experiments to explore the relationship between the low-frequency region of the search area and tracking performance. When the template point cloud and the search area point cloud are input into the tracking model, only the low-frequency band of the search area is retained, with the high-frequency band coefficients set to zero. We tested low-frequency bands corresponding to the first 1/5, 1/4, and 1/3 of the entire frequency spectrum. The results, presented in Table 1, show that discarding more than two-thirds of the high-frequency bands results in only a marginal decline in tracking performance. This suggests that tracking information is predominantly concentrated in the low-frequency region. Based on the findings in Table 1, we selected the first one-third of the frequency band as the low-frequency region. However, as shown in Figure 1, the energy concentration within the frequency domain is confined to less than one-third of the spectrum, indicating the need for further refinement of the low-frequency region during attacks.
In this paper, we introduce a novel adversarial attack method targeting 3D point cloud object-tracking models. Our approach operates in the frequency domain, leveraging the significance of different frequency bands. By transforming the search area point cloud from the spatial domain to the frequency domain using spectrogram and signal-processing techniques, we introduce perturbations to the low-frequency components to enhance attack generalization. To improve the targeting precision, we propose a frequency band saliency map that assigns importance scores to individual sub-bands within the low-frequency region based on their relevance to the tracking performance. During the attack, we perturb the low-frequency coefficients of the point cloud in the search area, weighting the sub-bands according to the saliency map to amplify the perturbation of critical sub-bands. We employ an optimization function, combining three established loss functions, to iteratively refine the frequency-domain perturbations, generating adversarial examples that are both effective and transferable. In our experiments, we target the P2B model as the victim in white-box attacks to generate adversarial examples. These examples are then transferred to black-box tracking models, specifically BAT and M2-Track, to evaluate the transferability of our proposed attack method.
Our main contributions are summarized as follows:
  • We develop a frequency-domain attack method that targets low-frequency components, utilizing a saliency map to enhance perturbation in critical sub-bands, improving attack effectiveness and generalization.
  • On the KITTI dataset, our approach effectively reduces P2B tracking performance in white-box attacks and demonstrates robust transferability to black-box models, significantly impacting their performance.

2. Related Works

2.1. 3D Point Cloud Object Tracking

With the rise of applications like autonomous driving, 3D object detection [10] and 3D object tracking have become essential. In autonomous driving, 3D object detection typically gathers information about surrounding scenes and objects using sensors, such as cameras and LiDAR (Light Detection and Ranging). 3D point cloud object tracking predicts the position and orientation of an object across consecutive frames based on a given object template. This task is broadly categorized into Multiple Object Tracking (MOT) and Single Object Tracking (SOT). This paper focuses on attacks targeting SOT, which tracks and predicts the behavior of a single object. In SOT, a point cloud object is provided in the first frame as the target, and its location and orientation are predicted in subsequent point cloud scenes. Giancola et al. introduced SC3D [11], the first 3D SOT method, utilizing a 3D Siamese network as its backbone. However, SC3D relies on heuristic sampling and cannot be trained end-to-end, making it computationally expensive.
To address these limitations, P2B [12] proposed an end-to-end trainable Siamese framework that employs PointNet++ to extract features from the template and search area, embedding target cues from the template into the search area. P2B then uses the VoteNet [13] prediction head to generate target proposals, selecting the highest-scoring proposal as the final prediction. BAT [14] enhances 3D SOT performance by incorporating free box information, introducing BoxCloud features for size and part awareness to improve feature comparison, and proposing a box-aware feature fusion module to create a more target-specific search area. PTTR [15] replaces random sampling with relation-aware sampling, utilizing self-attention modules to enhance template and search area features and cross-attention modules for feature matching. Building on PTTR, Zhou et al. proposed PTTR++ [16]. CXTrack [17] leverages contextual information from continuous frames to improve the tracking accuracy and refines the localization head for better object–background differentiation. M2-Track [18], a two-stage tracking model based on the motion center paradigm, locates the target through motion transformation in the first stage and refines it with motion assistance in the second stage.
In addition to the M2-Track framework, the above 3D trackers inherit the design idea of 2D tracking framework and follow the Siamese paradigm based on feature matching, that is, matching point cloud template and search area. The trackers for attack in this paper is mostly this kind of tracker. Matching based trackers rely heavily on the feature information of the point cloud. Our proposed method changes the feature information of the point cloud by attacking the frequency-domain information of the point cloud, thus reducing the tracking effect of the tracker.

2.2. Adversarial Attack for 3D Point Cloud Object Tracking

In recent years, adversarial attack methods for 3D point cloud object tracking have been gradually proposed. AD-Net [6] is a generative point cloud object-tracking attack method. The pipeline uses a binary distribution encoding layer to extract adversarial example from tracing templates based on feature loss and position loss. The point cloud object tracking adversarial attack method based on non-rigid transformation [19] is based on the features of the 3D point cloud that is different from the 2D image. In this method, the tracking template is divided into several local regions using a cluster-based method, and then the local regions are subtly rotated to generate adversarial examples. TAN [7] is a network that generates transferable attack examples, guided by MFD (Multiple-Fold Drift) loss to generate adversarial example. The adversarial example generated by TAN can be transferred to the black box model for attack.
The existing adversarial attack methods for 3D point cloud object tracking ignore the frequency-domain information of the point cloud, and the generalization of the attack is insufficient. We analyze the correlation between the point cloud frequency domain information, geometric structure, and generalization, and propose a 3D point cloud object-tracking adversarial attack method based on the importance of the frequency domain.

3. Methodology

3.1. Problem Setting and Framework

Given a video sequence P i i = 1 N P consisting of N P point cloud frames, the 3D point cloud object-tracking model T is tasked with predicting the target’s position in subsequent frames based on its initial state in the first frame. Specifically, we crop the tracking template point cloud P t m p from the first frame using the ground-truth bounding box of the target object, which also serves as the tracking prediction box for the first frame. From the second frame onward, the search area P s e a is cropped based on the tracking prediction box of the previous frame. The tracking process is expressed as T ( P t m p , P s e a ) , yielding K 3D target proposals { s i , p i } i = 1 K , where s i denotes the targetness score of the proposal, and  p i represents the target proposal position, comprising 3D center position offsets and the rotation in the X-Y plane. The target proposal position p i is defined as follows:
p i = x i offset , y i offset , z i offset , θ i X Y
The final bounding box B is generated based on the highest-scoring target proposal.
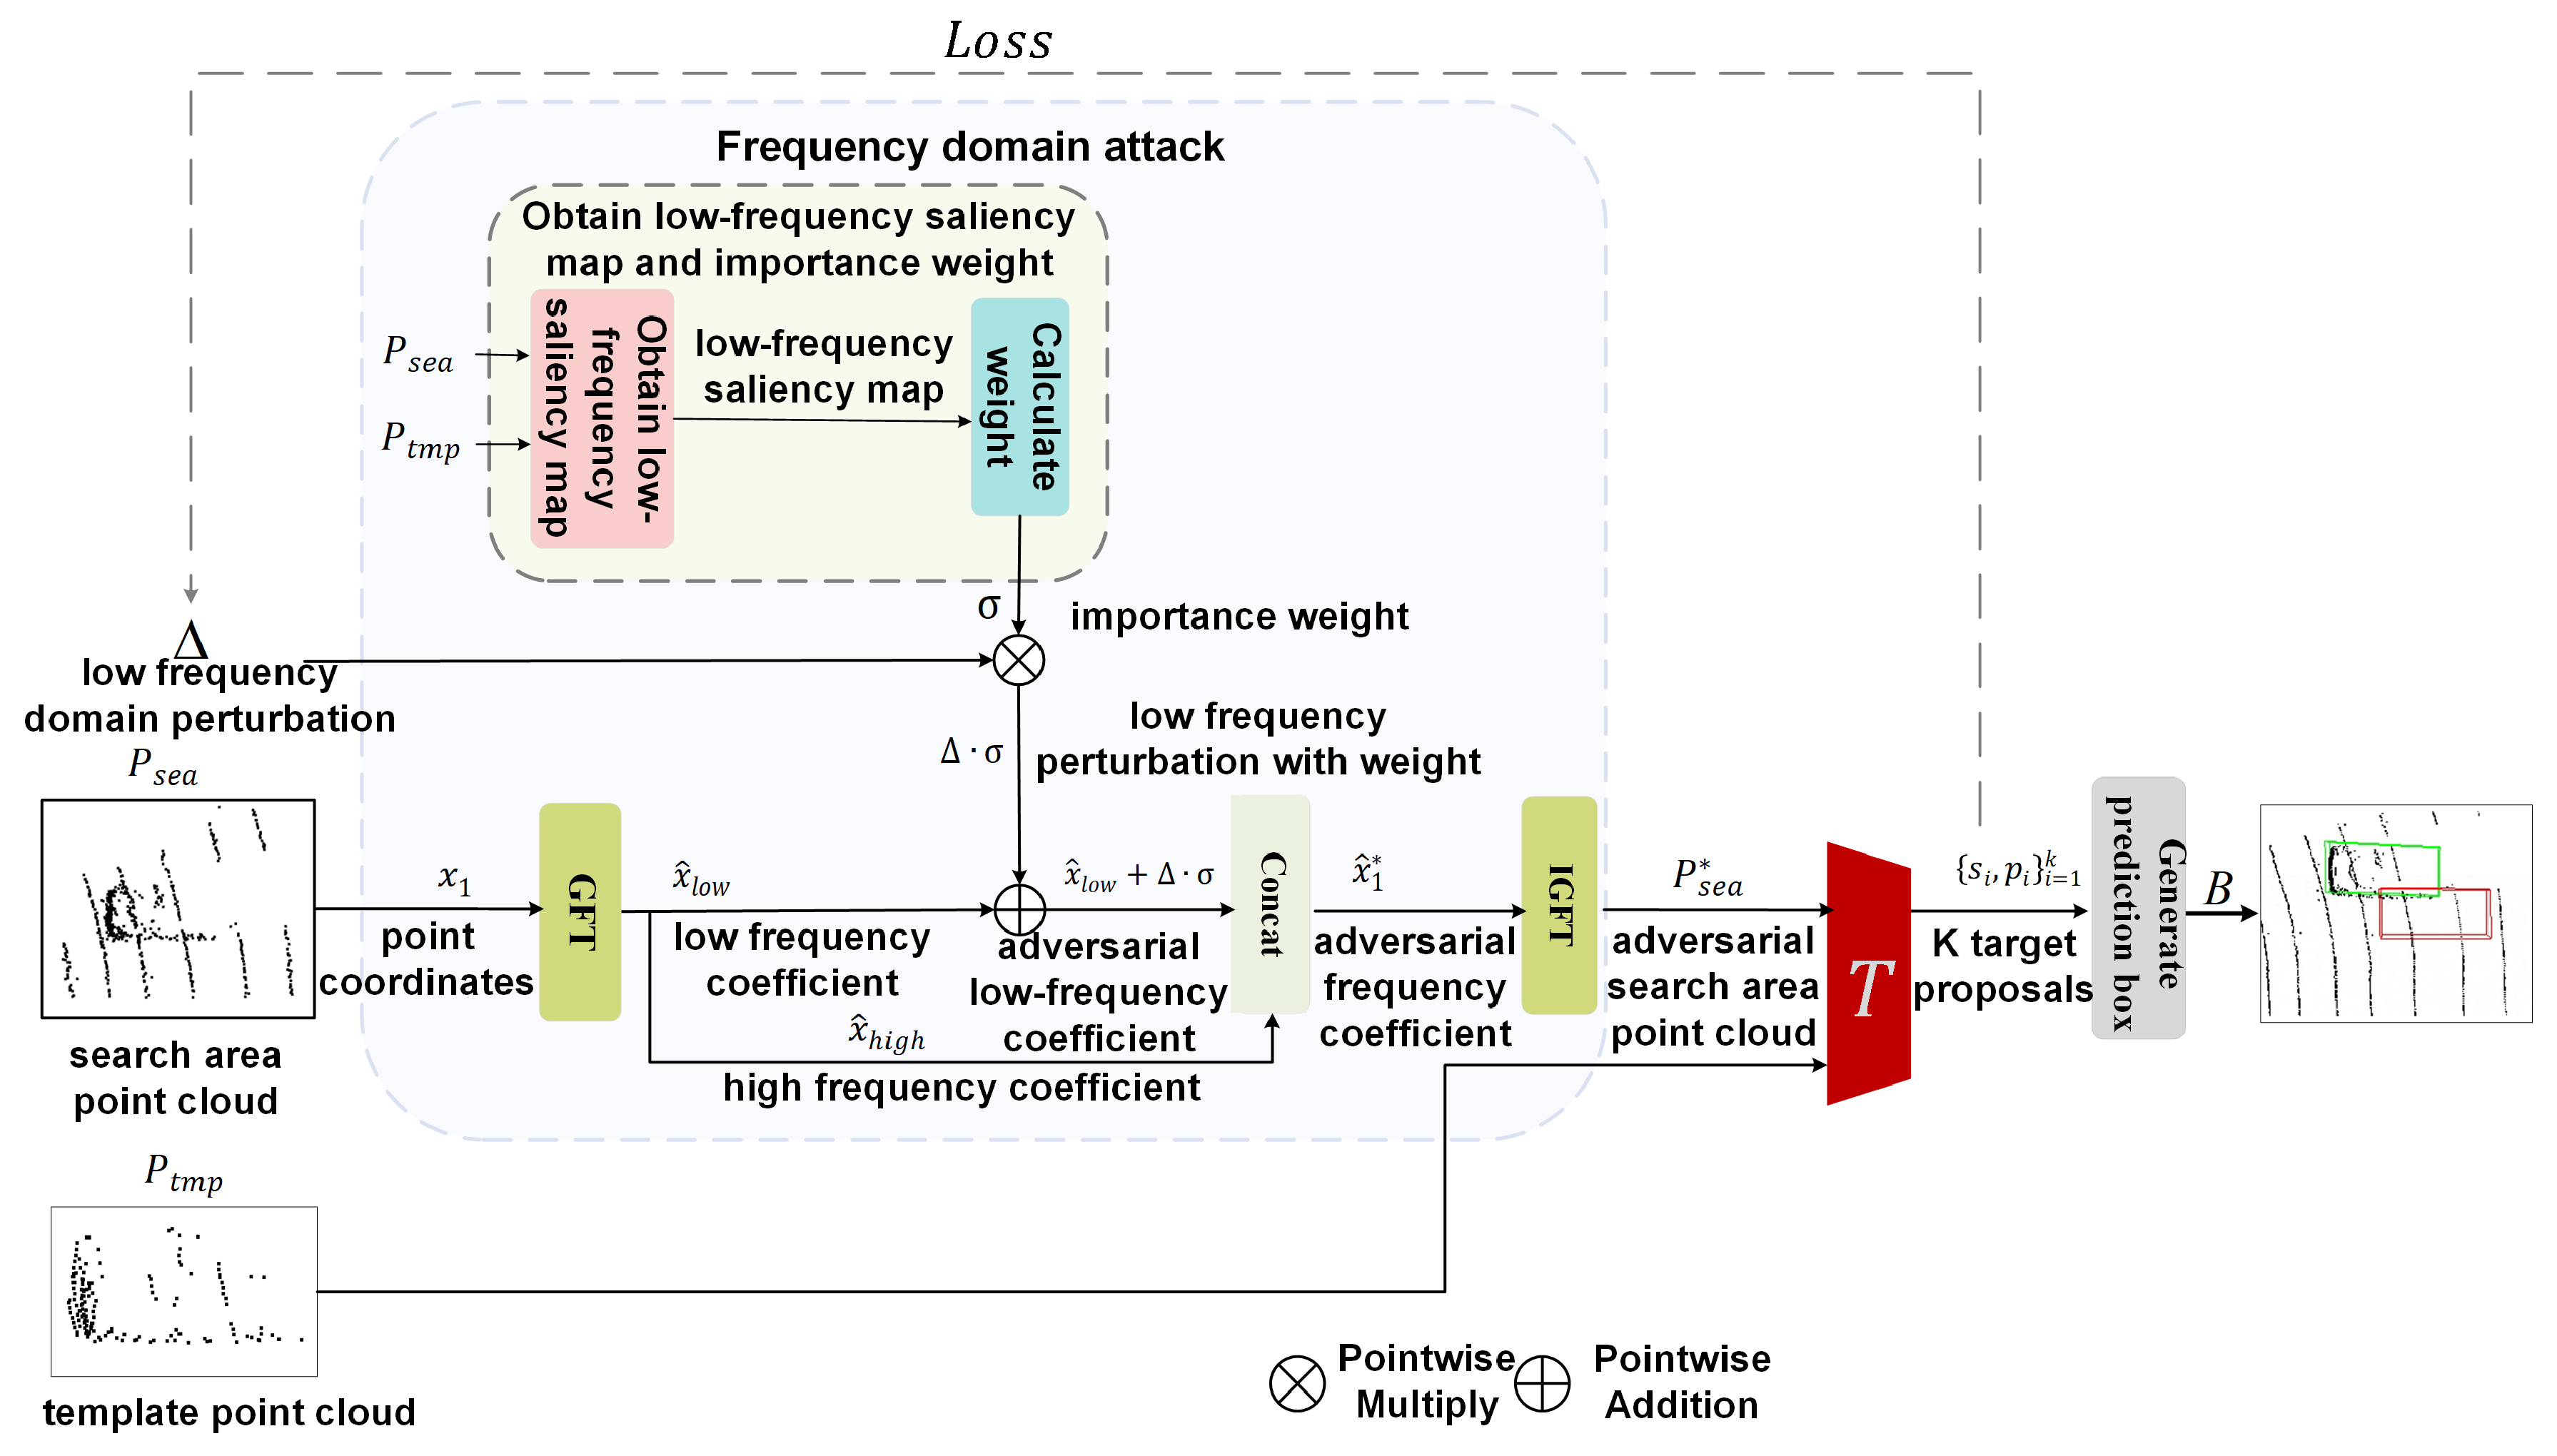
The pipeline of our proposed adversarial attack method for 3D point cloud object tracking is illustrated in Figure 2. Our approach operates in the frequency domain by perturbing the search area point cloud P s e a . The attack process begins with the construction of a saliency map to evaluate the importance of low-frequency bands in the original search area point cloud. Based on this saliency map, we compute the frequency band importance weights σ for the attack. The attack proceeds as follows: The search area point cloud P s e a and a frequency-domain perturbation Δ R N × 3 are first transformed from the spatial-domain coordinate representation x 1 to the frequency-domain coefficient representation x ^ . The perturbation Δ , weighted by the importance weights σ , is then applied to the low-frequency coefficients of x ^ to amplify its impact on critical sub-bands. This yields the adversarial frequency-domain coefficients x 1 ^ * , which are subsequently inverse-transformed back to the spatial domain, generating the adversarial point coordinates x 1 * and the perturbed search area point cloud P s e a * . Next, the adversarial search area point cloud P s e a * and the template point cloud P t m p are fed into the tracking model T to produce adversarial 3D target proposals s i * , p i * i = 1 K and the final tracking result box B. The frequency perturbation Δ is iteratively optimized using our objective function. Through multiple optimization iterations, we obtain the intermediate adversarial search area point cloud P s e a * with refined frequency-domain perturbations.

3.2. Frequency-Domain Attack Module Based on Frequency Band Importance

Point cloud transformation between the spatial domain and frequency domain: First, recent studies have shown that deep neural networks exhibit a spectral bias, prioritizing the capture of low-frequency structural and semantic information while being less sensitive to high-frequency details, often treating them as noise. This phenomenon provides a theoretical foundation for our low-frequency attack strategy. In convolutional neural networks, multiple studies (e.g., [20,21,22]) have found that networks preferentially learn low-frequency components during training, and different models exhibit high consistency in their responses to low-frequency signals. Low-frequency perturbations are more likely to consistently impact the semantic decision boundaries of models, thereby achieving greater transferability across different architectures (e.g., ResNet, DenseNet). Second, from the perspective of frequency-domain optimization, the stability of attack propagation is enhanced. In 3D point clouds, perturbations are typically applied to point coordinates (i.e., ( x i , y i , z i ) ). These perturbations manifest as local, minor changes in the high-frequency domain but as global shape or contour alterations in the low-frequency domain. Low-frequency components correspond to smaller, slower-changing variations in the spatial domain, maintaining structural continuity, whereas high-frequency perturbations correspond to rapid local changes (e.g., point cloud jitter or boundary noise). When the perturbation Δ predominantly affects low-frequency components, satisfying M low · Δ ^ 2 M high · Δ ^ 2 , where M low and M high are low- and high-frequency masks, respectively, the perturbation remains stable under various conditions, including point cloud resampling, data augmentation (e.g., rotation, scaling, and jitter), and model architecture variations (e.g., different feature extractors or adjacency graphs). This stability arises because low-frequency perturbations maintain the global consistency in the spatial domain, making them robust against resampling or geometric transformations. Finally, a gradient consistency analysis supports our findings. Highly transferable adversarial perturbations can mislead targets across multiple models or tasks. Low-frequency perturbations target the “global shape information” of point clouds, such as contours, distribution density, or geometric continuity. These features are commonly extracted by various 3D networks (e.g., PointNet++), leading to higher consistency in gradient responses. This indicates that low-frequency perturbation directions possess greater generality, enabling them to trigger decision boundary shifts across models and tasks, thus achieving superior black-box attack performance.
The existing research in the signal-processing field combine spectral theory and harmonic analysis to process high-dimensional data signals, and extend classical signal-processing operations to the graph structure. The graph is transformed to the frequency domain, and high-dimensional effective information is extracted [23]. The attack object point cloud is a collection of point coordinates, which is a disordered and loose structure. We transform the point cloud from a loose, unordered collection to a structured graph. Specifically, we use the K-NN algorithm to compute the k-nearest neighbors of each point in the point cloud, transforming the point cloud from a set to a graph G = { A , Σ , W } , where vertex A is the point of the point cloud, Σ is the k-nearest neighbor points, and W is the adjacency matrix. According to the frequency-domain transformation method of the graph, first we construct the Laplace matrix L : = D W  [23], where D is a diagonal matrix, and the diagonal element d i is equal to the sum of the weights of all edges associated with the i-th vertice. The Laplacian matrix L is a real symmetric matrix, and the eigendecomposition of L yields L = V Λ V , where Λ = { λ 0 , , λ N 1 } is the vector of the eigenvalues of L, and V = { v 0 , , v N 1 } consists of the eigenvectors of L. Based on the diagram based on spectral graph theory on the study of the wavelet, the spatial domain expressed in coordinates of point x R N × 3 on Fourier transform in frequency domain [24], as shown in Equation (2):
x ^ = V x ,
where x ^ is the representation of point in the frequency domain, that is, the frequency-domain coefficient.
According to Equation (2), the frequency-domain coefficient of the point cloud is inverse-Fourier-transformed back into the spatial domain, as shown in Equation (3):
x = V x ^ .
The attack method based on frequency domain is shown in Figure 2. We convert the search area point cloud P s e a from the spatial domain to the frequency domain, and attack in the frequency domain. For the point cloud P s e a , the coordinates of its points in the spatial domain are expressed as x 1 R N × 3 , N is the number of points P s e a , which is transformed into the frequency-domain coefficient by Equation (2). Frequency-domain perturbation Δ R N × 3 is learnable. The random initialization perturbation makes it obey the normal distribution of N 0 , 10 3 . Perturbation Δ is added to the frequency-domain coefficient to obtain the frequency-domain coefficient x ^ * with perturbation, as shown in Equation (4):
x ^ * = x ^ + Δ .
Previous studies have shown that frequency-domain coefficients have different generalization and geometric properties in different frequency bands. The low-frequency band contains less overfitting noise, has higher generalization, and contains the basic shape information of the point cloud geometrically. The high-frequency band contains more overfitting noise and less generalization, and contains the details of the point cloud in terms of geometry. Therefore, our proposed attack targets the low-frequency band of the search area point cloud which has strong generalization in the frequency domain and represents the basic shape. The frequency band saliency map is introduced in the low frequency band to evaluate the importance of each unit frequency sub-band for tracking. The frequency perturbation Δ is adjusted according to the importance of sub-bands to enhance the attack effect. The frequency division of the frequency-domain coefficient of the search area is shown in Equation (5):
x ^ = c o n c a t x ^ low , x ^ high ,
where x ^ l o w is the low-frequency band, and x ^ h i g h is the high frequency band. According to the experiments of low-frequency band selected in Table 1, we set the first 1/3 frequency band to be the low-frequency band.
The process of generating the frequency band saliency map is shown in Algorithm 1. First, the original search area point cloud P s e a and template point cloud P t m p are input into the tracking model, and the original prediction bounding box B is obtained, and the IoU score between B and the ground-truth prediction box B g t is calculated. Then, the search area point cloud P s e a is transformed into the frequency-domain coefficient x ^ by GFT. The low-frequency band x ^ l o w of the frequency-domain coefficient x ^ is divided into multiple sub-frequency bands, and every m continuous frequency coefficient is a sub-band x ^ j * . For each sub-band x ^ j * , the same operation is performed: the frequency-domain coefficient corresponding to this sub-band x ^ j * is set to zero, and the remaining sub-bands and high bands are not changed, so that the remaining frequency-domain coefficient x ^ r e * , excluding this sub-band x ^ r e * , is obtained. We transform the remaining frequency-domain coefficients x ^ r e * back into the spatial domain by Equation (2) to obtain the residual point cloud P j r e represented by coordinates x ^ r e * . The tracking prediction box B j r e is obtained by using P j r e as the search area for tracking. Calculate the IoU score of the remaining point cloud prediction box B j r e and the ground-truth prediction box B g t . The importance score of the sub-band s ^ j r e for tracking is defined as Equation (6):
s ^ j re = I o U B , B g t I o U B j re , B g t , I o U B , B g t = | B B g t | | B B g t |
where the higher score s ^ j r e indicates that the removed sub-band x ^ j * is more important for tracking. B represents the predicted bounding box region, B gt represents the ground truth (annotated) bounding box region, the numerator is the area of their intersection, and the denominator is the area of their union. This metric is used to measure the overlap between the predicted and ground truth bounding boxes, with values ranging from 0 to 1. A higher value indicates a greater degree of overlap. The scores of all sub-bands of the low-frequency band are calculated, and the table recording the scores s ^ j r e constitutes the frequency-band-importance saliency map.
The low-frequency-band importance weight σ is constructed according to the score in the frequency-band-importance saliency map and is defined as shown in Equation (7):
σ i = α 1 + e 5 t · s i im ,
where σ i is the importance weight of the i-th low-frequency-domain coefficient of the search area point cloud P s e a , s i i m is the importance score of the i-th frequency domain coefficient in the frequency-band-importance saliency map, α is the hyper-parameter that controls the upper limit of the weight σ i , and t is the hyper-parameter that controls the importance score-weight mapping.
To improve Equation (4), add frequency perturbation Δ to the low-frequency band of the search area, and enhance the attack according to the frequency band importance, and obtain the adversarial low-frequency band frequency domain coefficient x ^ l o w * , as shown in Equation (8):
x ^ l o w * = x ^ l o w + Δ · σ .
The adversarial low-frequency-domain coefficient x ^ l o w * and high-frequency coefficient x ^ h i g h are concatenated according to Equation (5) to obtain the complete adversarial frequency-domain coefficient x 1 ^ * . By transforming x 1 ^ * back into the spatial domain through Equation (3), the adversarial search area point cloud P s e a * , represented by the adversarial points’ coordinates, x 1 * is obtained.
Algorithm 1: Generate frequency band saliency map
Input: template point cloud P t m p , search area point cloud P s e a , tracking model T, ground-truth bounding box B g t , low band range [ 0 , l l o w ] , sub-band length m
Output: frequency band saliency map
1:
Input the template P t m p and search area P s e a into the tracking model T, and obtain the tracking prediction bounding box B.
2:
According to Equation (2), transform the search area P s e a to the frequency domain, and obtain the frequency domain coefficient x ^ .
3:
Calculate the number of sub-bands N l o w = l l o w / m .
4:
for j = 1 to N l o w  do
 # The sub-band x ^ j * range is [ j 1 × 5 , j × 5 ]
5:
    Zero the frequency domain coefficients of the sub-band x ^ j * and obtain the residual frequency domain coefficient x ^ r e * ;
6:
    Transform the residual frequency domain coefficients x ^ r e * back to the spatial domain to obtain the residual search area point cloud P j r e ;
7:
    Input template P t m p and the remaining point cloud P j r e into the tracking model to obtain the prediction bounding box B j r e ;
8:
    According to Equation (6), calculate the importance score s ^ j r e of sub-band x ^ j * for tracking.;
9:
    Record the score s j r e to the frequency band saliency map.
10:
end for

3.3. Optimization

For each search area point cloud, we perform multiple iterations to optimize the frequency domain perturbation Δ and obtain adversarial and imperceptible examples p s e a * . We use the following loss functions for optimization.
Confidence Loss: We use the Confidence Loss function [25]. This loss function is to make the tracker confuse high-quality target proposals with low-quality ones and give higher scores to the low-quality ones, thereby causing the prediction results to deviate from the target center. The confidence loss function is shown in Equation (9):
L c o n f = i = 1 r 1 s R i * i = r 2 r 3 s R i * ,
where s R i * is the i-ranked confidence score from adversarial target proposals s i * , p i * i = 1 K , the former is the sum of scores in the top-ranked high-quality proposals, and the latter is the sum of scores in the lower-ranked low-quality proposals.
Distance Measurement: We refer to the C&W point cloud classification attack method [26] and use the Chamfer distance [27] to measure the similarity between the adversarial point cloud and the original search point cloud to ensure that the deformation of the generated adversarial example is acceptable. The Chamfer distance is defined as shown in Equation (10):
D C P s e a , P s e a * = 1 x * 0 x j * x * m i n x i x x i x j * 2 2 ,
where x is the coordinate set of the original search region P s e a , and  x * is the coordinate set of the adversarial search region P s e a * .
Bounding-Box Offset Loss: We use the bounding-box offset loss function [28], which aims to enhance the adversarial effect of the generated adversarial examples by moving all the predicted candidate target proposal bounding boxes away from the target center. The bounding-box offset loss is shown in Equation (11):
L b o x = i = 1 K smooth L 1 p i p o f f ,
where L b o x is based on smooth- L 1 loss function, p i * is the i-th target proposal in s i * , p i * i = 1 k , and  p o f f * is the specified non-target object proposal. We select the adversarial attack object proposal with confidence ranking of 4/5 as the specific p o f f * .
Optimization Function: For the adversarial example P s e a * generated by frequency-domain attack, P s e a * can mislead the tracker to deviate from the ground-truth, and it is highly similar to the original search area P s e a , so we constrain D C P s e a , P s e a * ϵ . The optimization function is shown in Equation (12):
m i n L c o n f + a · D C P s e a , P s e a * + b · L b o x , s . t .   D C P s e a , P s e a * ϵ
where a and b are hyper-parameters, and ϵ represents the “maximum constraint distance”.
We use the Adam optimizer to solve the optimization problem of Equation (12) and iteratively optimize the frequency perturbation Δ . Algorithm 2 shows the process of adjusting the perturbation Δ based on the sub-band importance.
Algorithm 2: Optimize frequency perturbation based on sub-band importance
Input: search area point cloud P s e a , frequency coefficients x ^ l o w and x ^ h i g h , frequency band saliency map s i m , maximum iterations T
Output: adversarial point cloud P s e a *
1:
Initialize perturbation Δ 0 ;
2:
Calculate importance weight σ i = α 1 + e 5 t · s i i m for each sub-band;
3:
for  i t e r = 1 to T do
4:
    Add perturbation to low-frequency: x ^ l o w * = x ^ l o w + Δ · σ ;
5:
    Concatenate x ^ l o w * and x ^ h i g h to get x ^ 1 * ;
6:
    Transform x ^ 1 * to spatial domain to get P s e a * ;
7:
    Optimize Δ using loss by Equation (12).
8:
end for
9:
return  P s e a *

4. Experiments

4.1. Experiment Settings

Dataset and Models: We adopt P2B [12] as the 3D tracker source model for the attack. In addition, to test the transferability of the proposed method against invisible models, we applied the adversarial example generated by the white box attack P2B to the black-box attack against the other two mainstream 3D tracking models BAT [14] and M2-Track [18].
We conduct experiments on the most popular 3D point-cloud-tracking dataset KITTI [29] to verify the effectiveness and 3D point cloud of the proposed attack method. The KITTI dataset provides a large cloud of driving scenes scanned by liDAR sensors, containing 21 outdoor scenarios and eight types of targets for training. Since KITTI’s testing set labels are not accessible, we adopted the same strategy for training the P2B trace model as we did for testing. We split the KITTI training set and use the sequence 19–20 training-set scenes as the test set.
Evaluation Metrics: On the KITTI dataset, we use the success rate and precision rate as indicators to evaluate the tracking results [30]. The AUC (Area Under Curve) represents the area under the performance curve, commonly used to measure a model’s overall performance across different thresholds. In this study, the AUC is used to evaluate the success rate curve of the tracker, reflecting its overall tracking accuracy across various overlap thresholds, with a higher value indicating better tracking performance. The success rate is defined as the IoU between the predicted bounding box and the true bounding box. The precision rate is an AUC with an error of 0 to 2 m. For adversarial attack, low success rate and precision of tracking results indicate a good attack.
Implementation Details: The code of our proposed attack method is based on the PyTorch framework (PyTorch 2.1.0). In Algorithm 1, the sub-band length is m = 4 . The hyper-parameter of Equation (7) is set to α = 1.5 and t = 14 . The optimization function Equation (12) hyper-parameters are a = 0.8 and b = 0.04 , the maximum constraint distance ϵ = 0.005 , the minimum iteration number is 150, and the maximum iteration number is 300. The confidence loss function Equation (9) is set to r 1 = 15 , r 2 = 36 , and r 3 = 50 .

4.2. Comprehensive Comparisons

On the KITTI and NuScenes datasets, we attack the P2B tracking model using no-attack, AD-Net-based adversarial attack [6], TAN [7] attack, and our proposed attack method, respectively. The tracking object type is Car. The qualitative evaluation of the tracking results is shown in Table 2. Compared with the original tracking results without attack, all the adversarial attack methods significantly degrade the performance of the tracking model. Among the three adversarial attack methods, the attack effect of our proposed method is the best, which reduces the average success rate from 53.3% to 28.9%, with a decrease of 45.7%. The average precision of tracking dropped from 68.4% to 35.0%, a 48.8% decrease. The attack results prove the effectiveness of our proposed adversarial attack method.
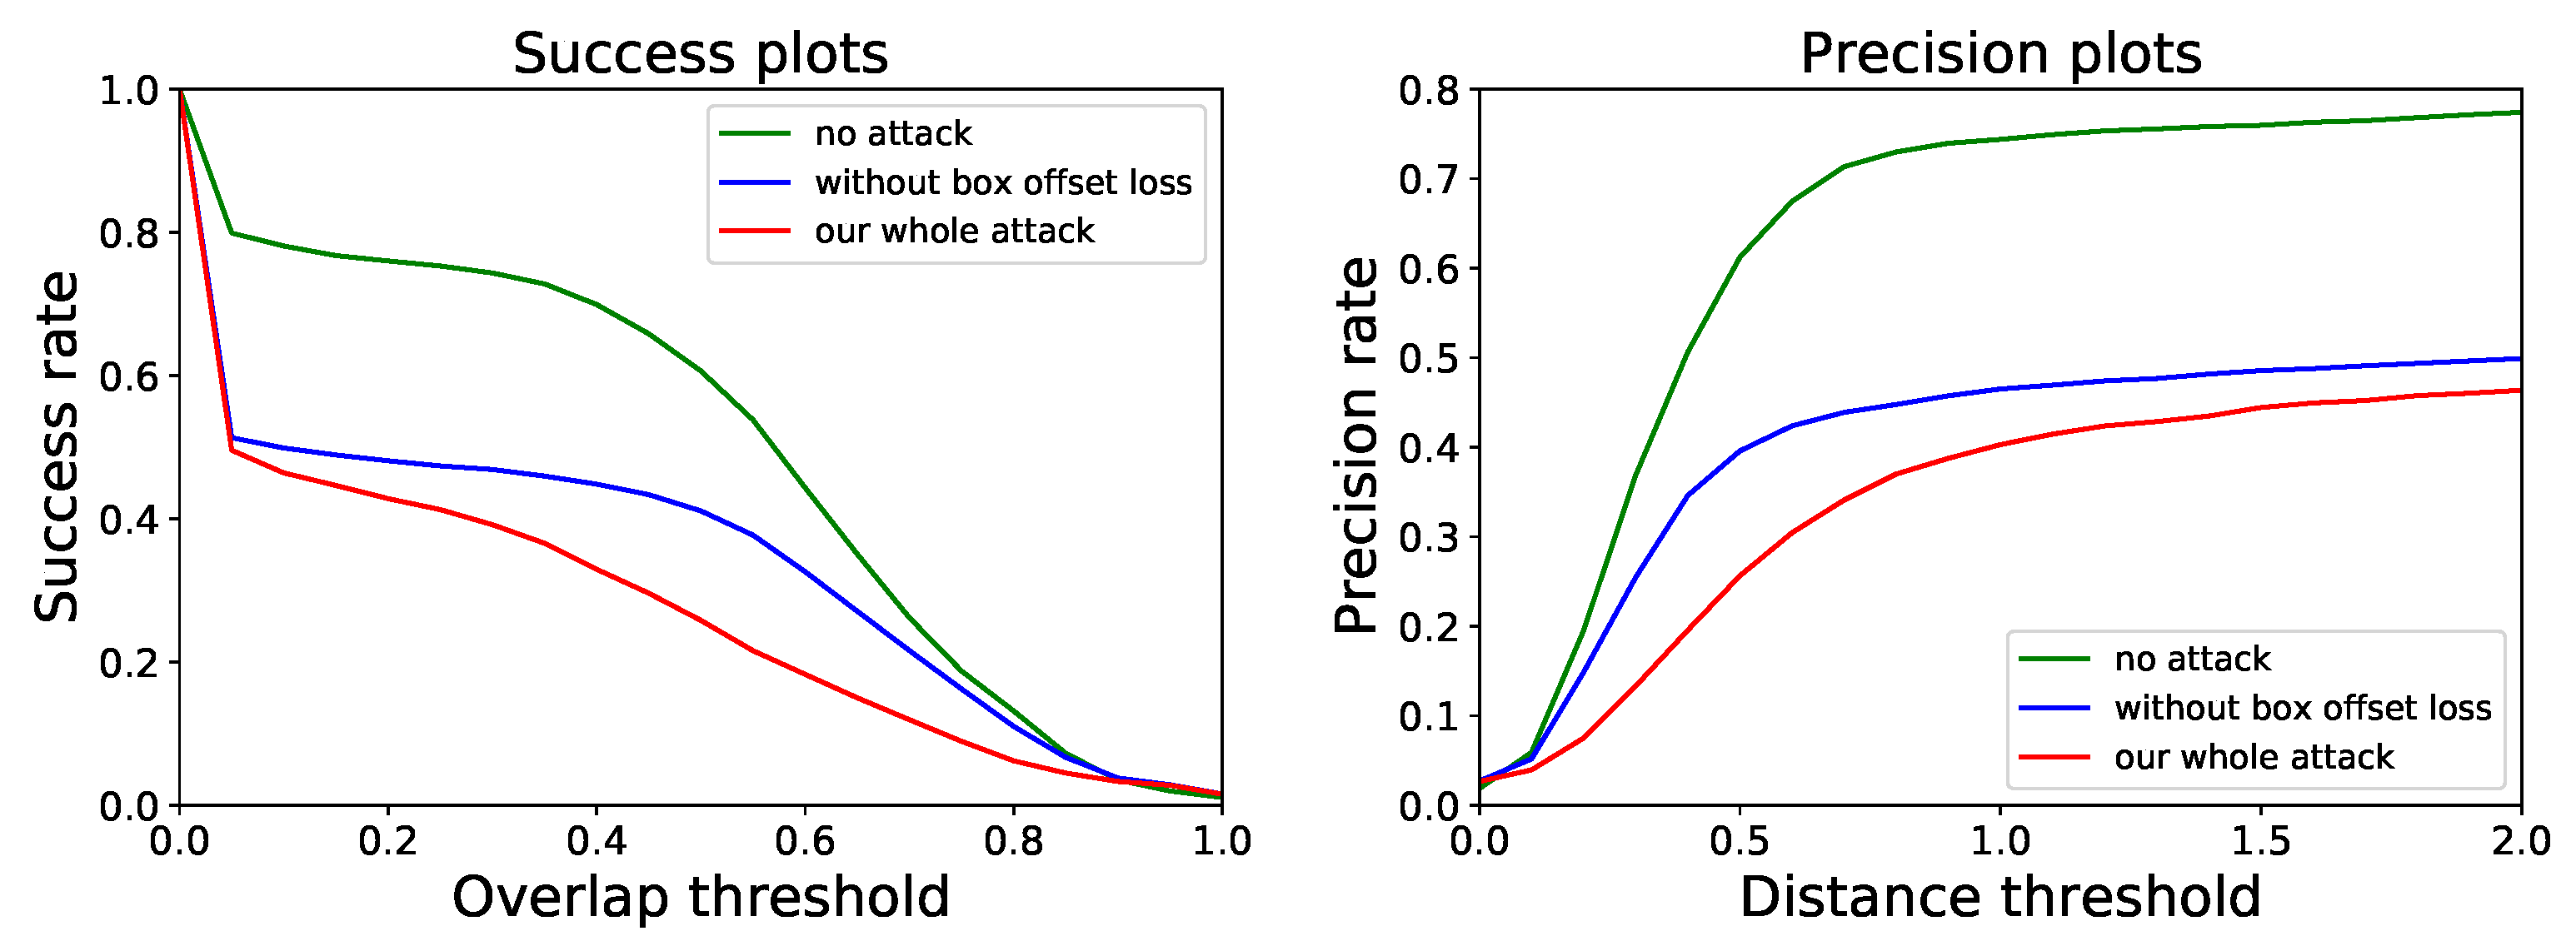
Figure 3 shows the evaluation results of the tracking model with and without adversarial attack. In the success plot, the proportion of proposals with IoU less than 0.05 decreased by 38.0% compared with no attack using our proposed attack method. In the precision plot, the proportion of proposals that are less than 0.5 m from the actual true value center decreased by 58.1%.
To explore the transferability of our proposed attack method, we transfer white-box adversarial examples, which are generated by our proposed method against P2B attacks on KITTI and NuScenes dataset, to invisible tracking models BAT and M2-Track for black-box attacks and compare them with attacks with random heavy noise perturbations. The attack results are shown in Table 2, Table 3 and Table 4. Compared with the original tracking results without attack, the performance of the tracking model is significantly reduced by the black-box attack. Black box attacks on BAT models reduced the average success rate of tracking from 65.3% to 48.7%, a 25.4% decrease. The average precision rate of tracking decreased by 27.5% from 78.8% to 57.1%. In the BAT model, both of the black-box attack evaluation indicators are better than the random heavy noise perturbation attack results. The black-box attack on the M2-Track model reduces the average success rate of tracking from 67.4% to 50.9%, a decrease of 24.5%. The average precision rate drops from 81.0% to 61.4%, a decrease of 24.2%. In the M2-Track model, both of the black-box attack evaluation indicators are better than the random heavy noise perturbation attack results. Experiments verify the transferability of our proposed attack method. The proposed attack method effectively degrades the performance of 3D point-cloud-tracking models, achieving significant reductions in success and precision rates in white-box settings, particularly for P2B and MixCycle. In black-box scenarios, it demonstrates strong transferability, especially on NuScenes, though M2Track shows higher resilience. The method outperforms random attacks, with acceptable computational overhead for real-time applications.
We analyzed the time and space complexity of the proposed method. Specifically, for the P2B model, the original model’s memory consumption is 2125 M, while the attacked model’s is 2167 M, with minimal impact on the model size. Compared to mainstream spatial-domain attack methods on the KITTI dataset under the same hardware environment (NVIDIA 1080Ti(NVIDIA Corporation, Santa Clara, CA, USA)), our method’s training time is 8.7 h versus 6.5 h for the baseline, with an additional delay of approximately 34% (about 2.2 h), remaining reasonably acceptable for real-time or resource-constrained scenarios.

4.3. Ablation Study

Table 5 compares the attack results of the adversarial samples generated using different loss functions. When the distance loss function is used by default, the adversarial examples generated using only the confidence loss have a success rate of 34.0% and a precision rate of 40.2%. The adversarial samples generated by using both the confidence loss and bounding box offset loss perform better, with a success rate of 28.9% and an precision rate of 35.0%.
To explore the best value of the hyper-parameter α for the importance weight σ of the low-frequency bands, we use our proposed white-box attack method on the P2B model on the KITTI dataset. Table 6 shows the comparison of tracking results of adversarial examples generated by different frequency band weight σ hyper-parameter α values. All settings are the same except for hyper-parameter α . We choose α = 1.5 as the hyper-parameter value of the importance weight σ of the low-frequency frequency band.
The ablation study results in Table 7 show that lower p o f f * values (e.g., p * ( 1 / 5 ) ) achieve the highest success rates (32.8% for KITTI, 31.6% for NuScenes) and precision (41.0% for KITTI, 40.5% for NuScenes) when generating adversarial samples for the P2B tracker. As p o f f * increases to p * ( 1 ) , both metrics generally decline, with the lowest precision (26.5%) observed at p * ( 4 / 5 ) on NuScenes. This suggests that smaller p o f f * values produce subtler, more effective perturbations, while larger values may degrade the quality of adversarial samples.

4.4. Visualization Result

Figure 4 is a visual qualitative assessment on the KITTI dataset, illustrating three tracking video sequences of different target objects. The green box shows the ground-truth of tracking the objects. The red boxes represent the tracking results after the attack on the P2B model using our proposed method. The tracking results after the attack are quite different from the real situation, and this difference becomes more and more obvious as time goes on. The visual comparison results show that our proposed method is effective in attacking the tracking model.

4.5. Defensive Strategies and Methods

Regarding frequency-domain attacks in 3D point cloud tracking, we believe defenses can be implemented through enhancing model robustness, anomaly detection, and input preprocessing. Common and effective defense strategies for frequency-domain attacks in 3D point cloud tracking primarily include the following three aspects: First, adversarial training is a proven method, where adversarial samples generated by frequency-domain perturbations are incorporated during training, enabling the model to learn to recognize and resist such perturbations, thereby improving its robustness in practical applications. Second, a frequency-domain anomaly detection mechanism analyzes the spectral characteristics of input point clouds to monitor abnormal distributions or sudden changes in frequency energy, allowing for the timely detection of potential adversarial attack behaviors and providing early warnings for system security. Additionally, frequency-domain filtering techniques in input preprocessing (such as low-pass filtering or band-stop filtering) can effectively suppress abnormal frequency components, filtering out potential adversarial perturbations, and thus mitigating their impact on the model. The combined use of these defense methods can effectively counter frequency-domain attacks at different levels, enhancing the security and stability of 3D point-cloud-tracking systems.

5. Conclusions

We propose a new adversarial attack method for 3D point cloud object tracking. It is a frequency-domain attack method based on the importance of frequency band. Our proposed method is designed to take advantage of the geometric features and generalizations of the point cloud frequency domain. We carry out low-band attacks on the frequency domain representation of the search area point cloud in the frequency domain, use the frequency band importance saliency map to identify the low-frequency sub-bands that are important for tracking, and enhance the attack effect according to the importance of the sub-bands. Experimental results show that our proposed attack method can greatly reduce the tracking performance of the mainstream 3D point-cloud-tracking model P2B, and the generated adversarial example also has attack effects on the black-box tracking model. Experiments show that the proposed method is transferable. However, our method’s computational complexity, particularly in frequency-domain transformations and iterative optimization, may limit its applicability in resource-constrained real-time systems. Additionally, the effectiveness of the attack has been primarily validated on the KITTI and NuScenes datasets, and its performance on other diverse datasets remains unexplored. Furthermore, the reliance on low-frequency perturbations may be less effective against models specifically designed to mitigate frequency-based attacks. Future research could focus on optimizing the computational efficiency of frequency-domain attacks to enable real-time applications and developing adaptive attack strategies to counter frequency-aware defense mechanisms. We hope that our research will help future research on the robustness and defense of 3D point-cloud-tracking models.

Author Contributions

Conceptualization, A.M. and R.Y.; methodology, A.M. and A.Z.; validation, A.M. and A.Z.; formal analysis, L.W.; investigation and resources, A.M. and L.W.; data curation, A.M. and A.Z.; writing—original draft preparation, A.M.; writing—review and editing, A.Z. and R.Y.; visualization, A.M. and A.Z. All authors have read and agreed to the published version of the manuscript.

Funding

This research received no external funding.

Institutional Review Board Statement

Not applicable.

Informed Consent Statement

Not applicable.

Data Availability Statement

The original contributions presented in the study are included in this article. Further inquiries can be directed to the corresponding author.

Acknowledgments

The authors thank Nan Zhou, Muyu He, Haibo Gao, and Meng Wang from the Xuzhou Public Security Bureau for their valuable help in this study.

Conflicts of Interest

The authors declare no conflicts of interest.

References

  1. Luo, W.; Yang, B.; Urtasun, R. Fast and furious: Real time end-to-end 3d detection, tracking and motion forecasting with a single convolutional net. In Proceedings of the IEEE Conference on Computer Vision and Pattern Recognition, Salt Lake City, UT, USA, 18–23 June 2018; pp. 3569–3577. [Google Scholar]
  2. Lee, O.; Joo, K.; Sim, J.Y. Learning-Based Reflection-Aware Virtual Point Removal for Large-Scale 3D Point Clouds. IEEE Robot. Autom. Lett. 2023, 8, 8510–8517. [Google Scholar] [CrossRef]
  3. Ingle, P.Y.; Kim, Y.G. Multiview abnormal video synopsis in real-time. Eng. Appl. Artif. Intell. 2023, 123, 106406. [Google Scholar] [CrossRef]
  4. An, Y.; Wu, J.; Cui, Y.; Hu, H. Multi-object tracking based on a novel feature image with multi-modal information. IEEE Trans. Veh. Technol. 2023, 72, 9909–9921. [Google Scholar] [CrossRef]
  5. Ko, K.; Kim, S.; Kwon, H. Selective Audio Perturbations for Targeting Specific Phrases in Speech Recognition Systems. Int. J. Comput. Intell. Syst. 2025, 18, 103. [Google Scholar] [CrossRef]
  6. Wang, Z.; Wang, X.; Sohel, F.; Bennamoun, M.; Liao, Y.; Yu, J. Adversary distillation for one-shot attacks on 3D target tracking. In Proceedings of the ICASSP 2022-2022 IEEE International Conference on Acoustics, Speech and Signal Processing (ICASSP), Virtual, 7–13 May 2022; IEEE: Piscataway, NJ, USA, 2022; pp. 2749–2753. [Google Scholar]
  7. Liu, X.; Lin, Y.; Yang, Q.; Fan, H. Transferable adversarial attack on 3D object tracking in point cloud. In Proceedings of the International Conference on Multimedia Modeling, Nara, Japan, 8–10 January 2025; Springer: Berlin/Heidelberg, Germany, 2023; pp. 446–458. [Google Scholar]
  8. Ilyas, A.; Santurkar, S.; Tsipras, D.; Engstrom, L.; Tran, B.; Madry, A. Adversarial examples are not bugs, they are features. Adv. Neural Inf. Process. Syst. 2019, 32, 125–136. [Google Scholar]
  9. Xu, Z.Q.J.; Zhang, Y.; Xiao, Y. Training behavior of deep neural network in frequency domain. In Proceedings of the Neural Information Processing: 26th International Conference, ICONIP 2019, Sydney, NSW, Australia, 12–15 December 2019; Proceedings, Part I 26. Springer: Berlin/Heidelberg, Germany, 2019; pp. 264–274. [Google Scholar]
  10. Li, Y.; Yu, A.W.; Meng, T.; Caine, B.; Ngiam, J.; Peng, D.; Shen, J.; Lu, Y.; Zhou, D.; Le, Q.V.; et al. Deepfusion: Lidar-camera deep fusion for multi-modal 3d object detection. In Proceedings of the IEEE/CVF Conference on Computer Vision and Pattern Recognition, New Orleans, LA, USA, 18–24 June 2022; pp. 17182–17191. [Google Scholar]
  11. Giancola, S.; Zarzar, J.; Ghanem, B. Leveraging shape completion for 3d siamese tracking. In Proceedings of the IEEE/CVF Conference on Computer Vision and Pattern Recognition, Long Beach, CA, USA, 15–20 June 2019; pp. 1359–1368. [Google Scholar]
  12. Qi, H.; Feng, C.; Cao, Z.; Zhao, F.; Xiao, Y. P2b: Point-to-box network for 3d object tracking in point clouds. In Proceedings of the IEEE/CVF Conference on Computer Vision and Pattern Recognition, Seattle, WA, USA, 13–19 June 2020; pp. 6329–6338. [Google Scholar]
  13. Li, B.; Yan, J.; Wu, W.; Zhu, Z.; Hu, X. High performance visual tracking with siamese region proposal network. In Proceedings of the IEEE Conference on Computer Vision and Pattern Recognition, Salt Lake City, UT, USA, 18–23 June 2018; pp. 8971–8980. [Google Scholar]
  14. Zheng, C.; Yan, X.; Gao, J.; Zhao, W.; Zhang, W.; Li, Z.; Cui, S. Box-aware feature enhancement for single object tracking on point clouds. In Proceedings of the IEEE/CVF International Conference on Computer Vision, Montreal, BC, Canada, 11–17 October 2021; pp. 13199–13208. [Google Scholar]
  15. Zhou, C.; Luo, Z.; Luo, Y.; Liu, T.; Pan, L.; Cai, Z.; Zhao, H.; Lu, S. Pttr: Relational 3d point cloud object tracking with transformer. In Proceedings of the IEEE/CVF Conference on Computer Vision and Pattern Recognition, New Orleans, LA, USA, 18–24 June 2022; pp. 8531–8540. [Google Scholar]
  16. Luo, Z.; Zhou, C.; Pan, L.; Zhang, G.; Liu, T.; Luo, Y.; Zhao, H.; Liu, Z.; Lu, S. Exploring point-bev fusion for 3d point cloud object tracking with transformer. IEEE Trans. Pattern Anal. Mach. Intell. 2024, 46, 5921–5935. [Google Scholar] [CrossRef] [PubMed]
  17. Xu, T.X.; Guo, Y.C.; Lai, Y.K.; Zhang, S.H. CXTrack: Improving 3D point cloud tracking with contextual information. In Proceedings of the IEEE/CVF Conference on Computer Vision and Pattern Recognition, Vancouver, BC, Canada, 17–24 June 2023; pp. 1084–1093. [Google Scholar]
  18. Zheng, C.; Yan, X.; Zhang, H.; Wang, B.; Cheng, S.; Cui, S.; Li, Z. Beyond 3d siamese tracking: A motion-centric paradigm for 3d single object tracking in point clouds. In Proceedings of the IEEE/CVF Conference on Computer Vision and Pattern Recognition, New Orleans, LA, USA, 18–24 June 2022; pp. 8111–8120. [Google Scholar]
  19. Cheng, R.; Sang, N.; Zhou, Y.; Wang, X. Non-rigid transformation based adversarial attack against 3d object tracking. In Proceedings of the ICASSP 2022-2022 IEEE International Conference on Acoustics, Speech and Signal Processing (ICASSP), Virtual, 7–13 May 2022; IEEE: Piscataway, NJ, USA, 2022; pp. 2744–2748. [Google Scholar]
  20. Guo, C.; Frank, J.S.; Weinberger, K.Q. Low Frequency Adversarial Perturbation. In Proceedings of the Thirty-Fifth Conference on Uncertainty in Artificial Intelligence, UAI 2019, Tel Aviv, Israel, 22–25 July 2019; Globerson, A., Silva, R., Eds.; AUAI Press: Corvallis, OR, USA, 2019. Proceedings of Machine Learning Research. Volume 115, pp. 1127–1137. [Google Scholar]
  21. Long, Y.; Zhang, Q.; Zeng, B.; Gao, L.; Liu, X.; Zhang, J.; Song, J. Frequency domain model augmentation for adversarial attack. In Proceedings of the European Conference on Computer Vision, Tel Aviv, Israel, 23–27 October 2022; Springer: Berlin/Heidelberg, Germany, 2022; pp. 549–566. [Google Scholar]
  22. Cai, X.; Tao, Y.; Liu, D.; Zhou, P.; Qu, X.; Dong, J.; Tang, K.; Sun, L. Frequency-aware gan for imperceptible transfer attack on 3d point clouds. In Proceedings of the 32nd ACM International Conference on Multimedia, Melbourne, VIC, Australia, 28 October–1 November 2024; pp. 6162–6171. [Google Scholar]
  23. Shuman, D.I.; Narang, S.K.; Frossard, P.; Ortega, A.; Vandergheynst, P. The emerging field of signal processing on graphs: Extending high-dimensional data analysis to networks and other irregular domains. IEEE Signal Process. Mag. 2013, 30, 83–98. [Google Scholar] [CrossRef]
  24. Hammond, D.K.; Vandergheynst, P.; Gribonval, R. Wavelets on graphs via spectral graph theory. Appl. Comput. Harmon. Anal. 2011, 30, 129–150. [Google Scholar] [CrossRef]
  25. Chen, X.; Yan, X.; Zheng, F.; Jiang, Y.; Xia, S.T.; Zhao, Y.; Ji, R. One-shot adversarial attacks on visual tracking with dual attention. In Proceedings of the IEEE/CVF Conference on Computer Vision and Pattern Recognition, Seattle, WA, USA, 13–19 June 2020; pp. 10176–10185. [Google Scholar]
  26. Xiang, C.; Qi, C.R.; Li, B. Generating 3d adversarial point clouds. In Proceedings of the IEEE/CVF Conference on Computer Vision and Pattern Recognition, Long Beach, CA, USA, 15–20 June 2019; pp. 9136–9144. [Google Scholar]
  27. Fan, H.; Su, H.; Guibas, L.J. A point set generation network for 3d object reconstruction from a single image. In Proceedings of the IEEE Conference on Computer Vision and Pattern Recognition, Honolulu, HI, USA, 21–26 July 2017; pp. 605–613. [Google Scholar]
  28. Yao, R.; Zhang, A.; Zhou, Y.; Zhao, J.; Liu, B.; El Saddik, A. Adversarial Geometric Attacks for 3D Point Cloud Object Tracking. IEEE Trans. Multimed. 2025, 27, 3144–3157. [Google Scholar] [CrossRef]
  29. Geiger, A.; Lenz, P.; Urtasun, R. Are we ready for autonomous driving? In the kitti vision benchmark suite. In Proceedings of the 2012 IEEE Conference on Computer Vision and Pattern Recognition, Providence, RI, USA, 16–21 June 2012; IEEE: Piscataway, NJ, USA, 2012; pp. 3354–3361. [Google Scholar]
  30. Wu, Y.; Lim, J.; Yang, M.H. Online object tracking: A benchmark. In Proceedings of the IEEE Conference on Computer Vision and Pattern Recognition, Portland, OR, USA, 23–28 June 2013; pp. 2411–2418. [Google Scholar]
  31. Wu, Q.; Yang, J.; Sun, K.; Zhang, C.; Zhang, Y.; Salzmann, M. Mixcycle: Mixup assisted semi-supervised 3d single object tracking with cycle consistency. In Proceedings of the IEEE/CVF International Conference on Computer Vision, Paris, France, 1–6 October 2023; pp. 13956–13966. [Google Scholar]
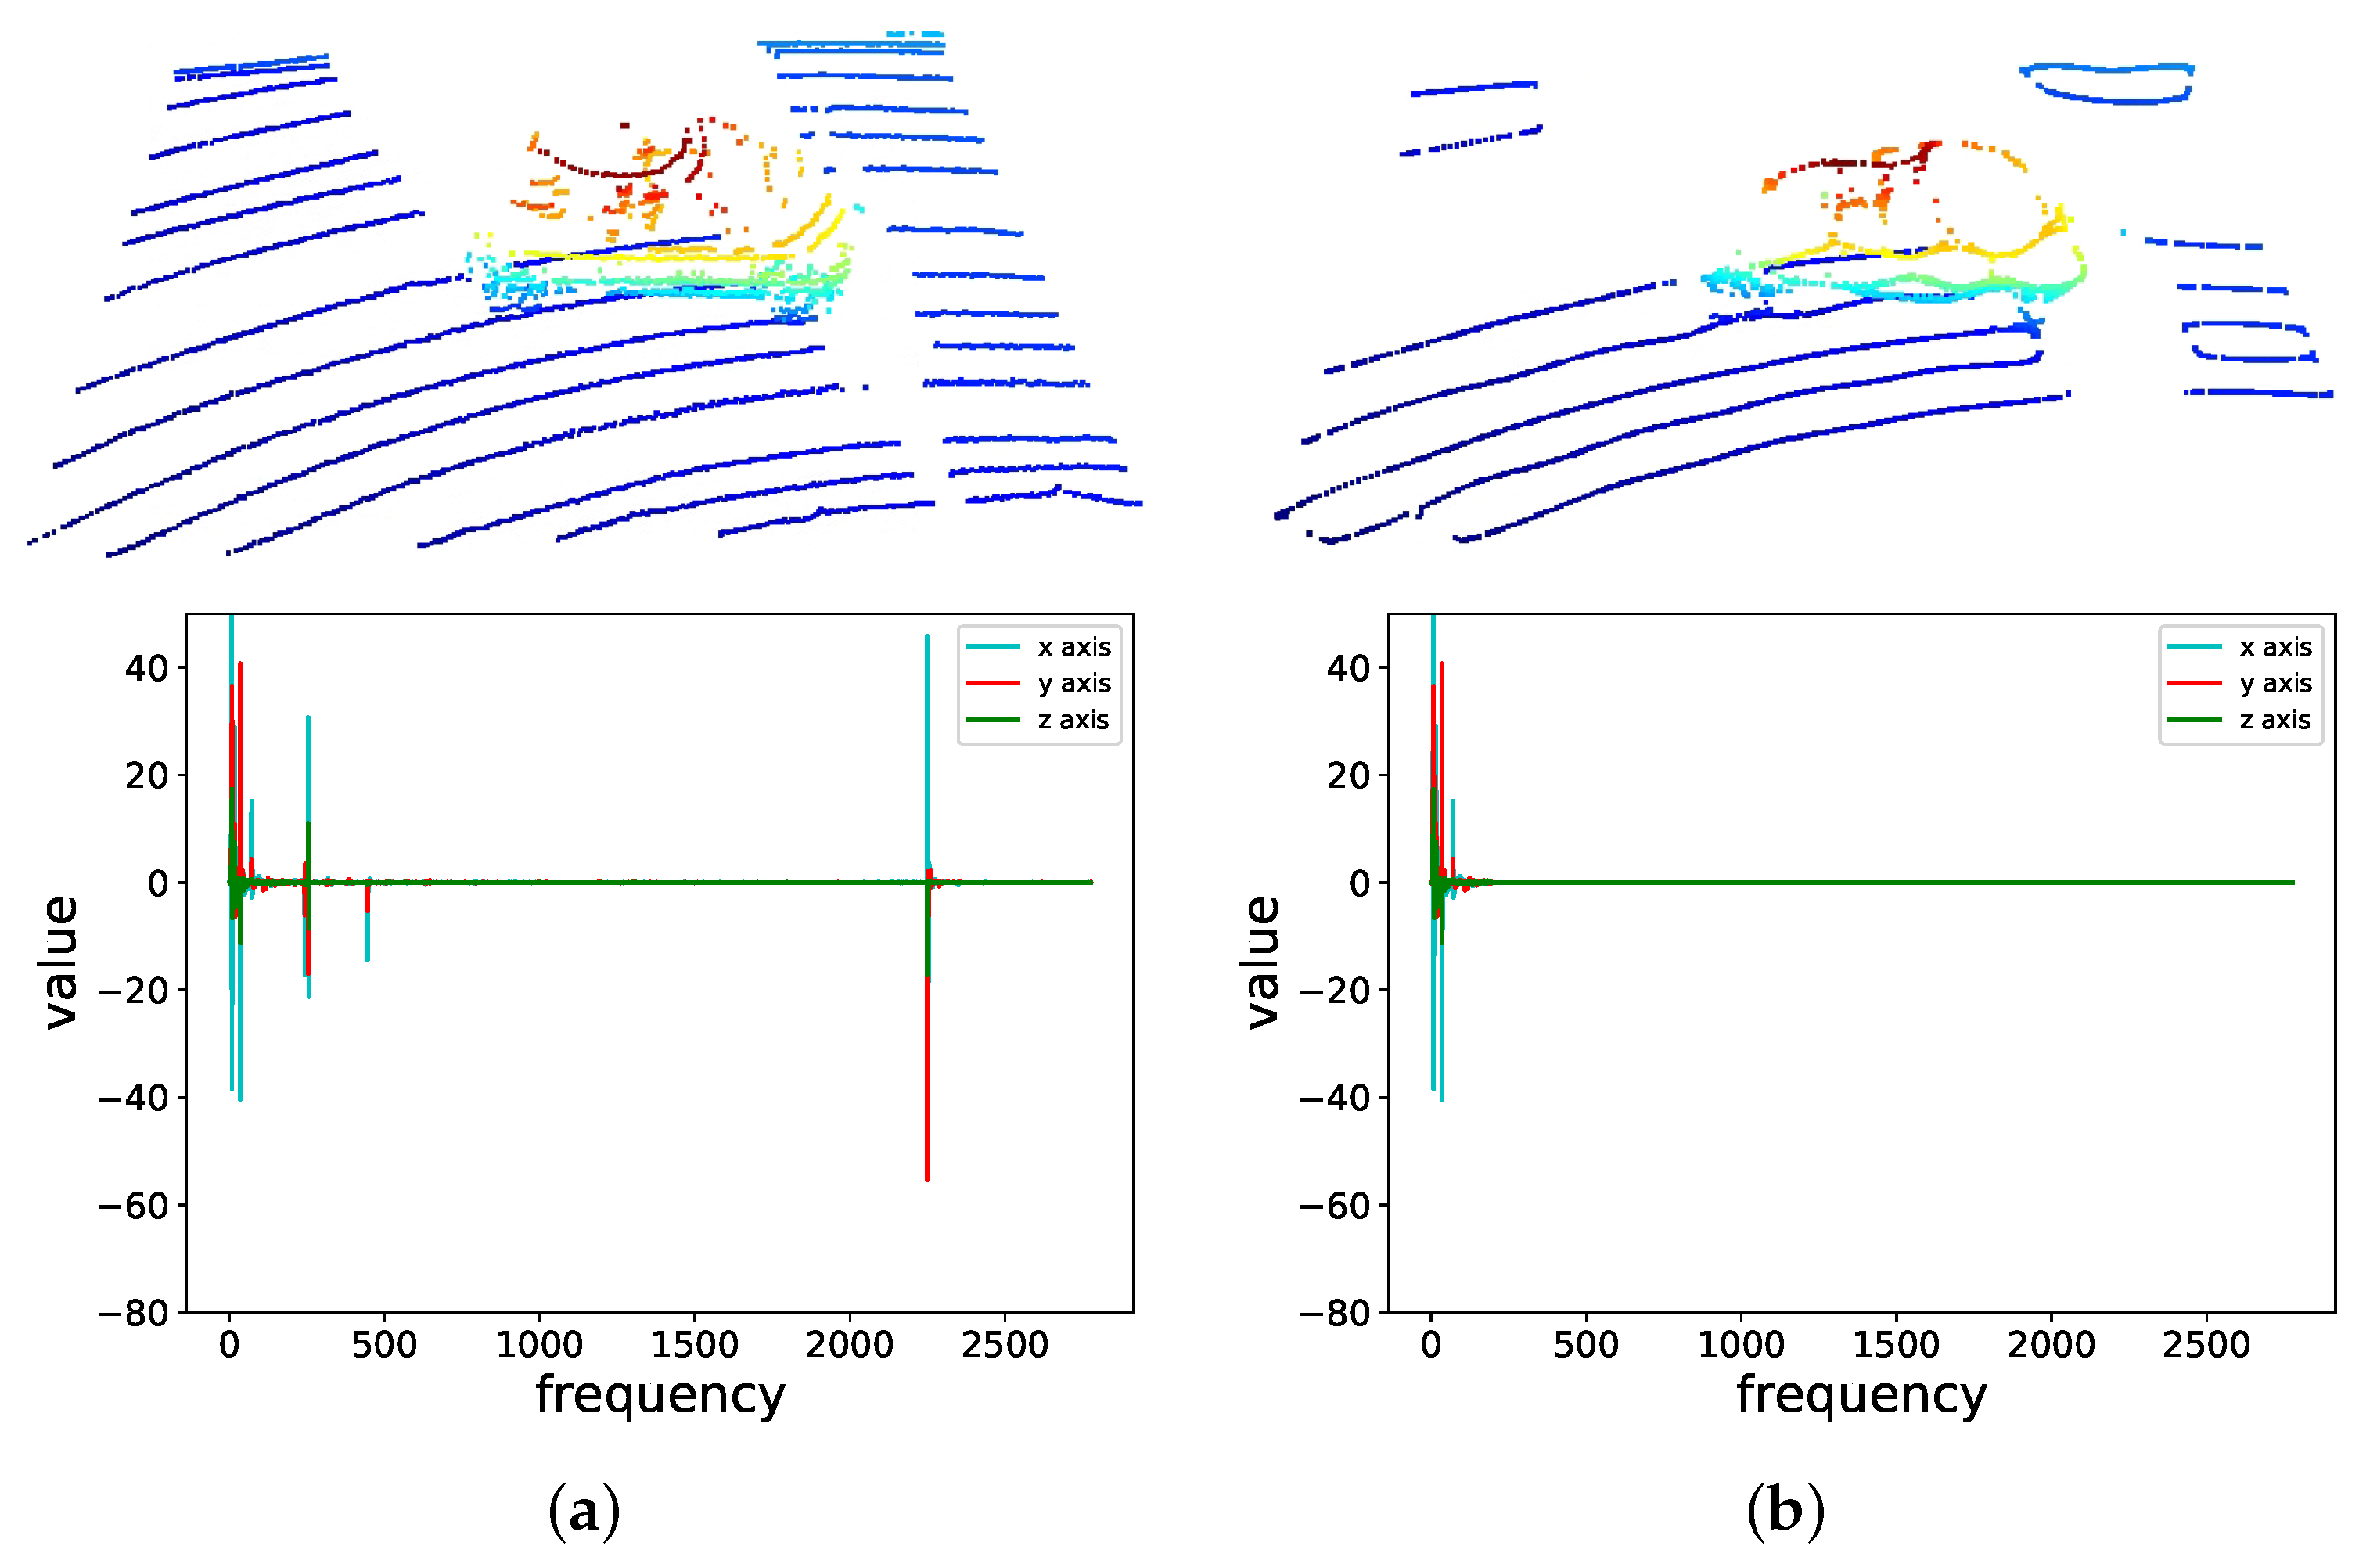
Figure 1. The track-id 88 object and its nearby background from frame 975 in scene 19 of the KITTI dataset. The top list is about spatial domain. The below list is about frequency domain. (a) Complete spatial domain point cloud image and frequency domain coefficients. (b) The spatial domain point cloud image and frequency domain coefficients of retaining the first 1/3 frequency band.
Applsci 15 10682 g001
Figure 2. The pipeline of 3D point cloud object tracking adversarial attack based on frequency-domain importance.
Applsci 15 10682 g002
Figure 3. Evaluation results of the proposed method on the P2B tracker using the KITTI datasets.
Applsci 15 10682 g003
Figure 4. Qualitative results of the proposed attack on four challenging sequences from the P2B tracker on the KITTI dataset. The green box is the ground-truth, and the red box is the tracking result after the attack. IoU: Intersection over Union. CD: Chamfer Distance; the unit of measurement is meters.
Applsci 15 10682 g004
Table 1. On KITTI dataset, the tracking results obtained by P2B using the search area that only retains the low-frequency band. Success rate is defined as the IoU between the predicted bounding box and the true bounding box. Precision rate is an AUC with an error of 0 to 2 m.
Retained Frequency BandSuccess (%)Precision (%)
first 1/5 band39.648.8
first 1/4 band40.049.6
first 1/3 band46.057.5
whole band53.368.4
Table 2. On the KITTI and NuScenes datasets, the white-box attack (W) results of the proposed method on P2B compared with the transfer-based black-box attack (B) results on BAT, M2Track, and MixCycle. The dataset sampling rate during MixCycle (CYCP2B) training is 10%, and the dataset’s sampling rate during P2B and BAT training is 100%.
MetricsTrackerKITTINuScenesType
OriRandomOursOriRandomOurs
Success (%)P2B [12]53.348.928.939.037.027.3W
BAT [14]65.355.248.740.339.631.0B
M2Track [18]67.453.850.957.254.250.2B
MixCycle [31]45.142.734.634.233.128.6B
Precision (%)P2B [12]68.462.535.039.937.426.5W
BAT [14]78.873.057.143.440.031.2B
M2Track [18]81.072.261.465.761.350.2B
MixCycle [31]58.855.144.635.833.828.8B
Table 3. On the KITTI and NuScenes datasets, the white-box attack (W) results of the proposed method on BAT compared with the transfer-based black-box attack (B) results on P2B, M2Track, and MixCycle. The dataset’s sampling rate during training is the same as in Table 2.
MetricsTrackerKITTINuScenesType
OriRandomOursOriRandomOurs
Success (%)BAT [14]65.355.229.540.339.625.1W
P2B [12]53.348.939.839.037.033.7B
M2Track [18]67.453.851.557.254.249.3B
MixCycle [31]45.142.737.134.233.129.0B
Precision (%)BAT [14]78.873.035.243.440.026.3W
P2B [12]68.462.549.439.937.432.2B
M2Track [18]81.072.268.265.761.352.0B
MixCycle [31]58.855.146.035.833.828.3B
Table 4. On the KITTI and NuScenes datasets, the white-box attack (W) results of the proposed method on MixCycle (CYCP2B) compared with the transfer-based black-box attack (B) results on P2B, BAT, and M2Track. The dataset’s sampling rate during training is the same as in Table 2.
MetricsTrackerKITTINuScenesType
OriRandomOursOriRandomOurs
Success (%)MixCycle [31]45.142.728.234.233.122.3W
P2B [12]53.348.937.539.037.028.5B
BAT [14]65.355.246.240.339.630.5B
M2Track [18]67.453.850.357.254.245.5B
Precision (%)MixCycle [31]58.855.135.035.833.823.5W
P2B [12]68.462.546.339.937.430.0B
BAT [14]78.873.055.043.340.035.6B
M2Track [18]81.072.265.665.761.352.0B
Table 5. Ablation experiments evaluate the effects of different loss functions on generating adversarial samples in P2B tracker on the KITTI and NuScenes datasets.
Confidence
Loss
Bounding-Box
Offset Loss
KITTINuScenes
Success (%)Precision (%)Success (%)Precision (%)
34.040.237.631.2
28.935.027.326.5
Table 6. Ablation experiments evaluate the effects of different values of the frequency band weight hyper-parameter α on generating adversarial samples in the P2B tracker on the KITTI and NuScenes datasets.
Hyper-Parameter α KITTINuScenes
Success (%)Precision (%)Success (%)Precision (%)
032.540.832.833.2
131.639.230.630.8
1.528.935.027.326.5
Table 7. Ablation experiments evaluate the effects of different values of parameter p o f f * of the bounding-box offset loss on generating adversarial samples in the P2B tracker on the KITTI and NuScenes datasets.
p off * KITTINuScenes
Success (%)Precision (%)Success (%)Precision (%)
p * ( 1 / 5 ) 32.841.031.640.5
p * ( 2 / 5 ) 31.438.930.837.6
p * ( 3 / 5 ) 30.535.828.535.0
p * ( 4 / 5 ) 28.935.027.326.5
p * ( 1 ) 28.434.627.134.3
Disclaimer/Publisher’s Note: The statements, opinions and data contained in all publications are solely those of the individual author(s) and contributor(s) and not of MDPI and/or the editor(s). MDPI and/or the editor(s) disclaim responsibility for any injury to people or property resulting from any ideas, methods, instructions or products referred to in the content.