Article

LM3D: Lightweight Multimodal 3D Object Detection with an Efficient Fusion Module and Encoders †

1
Graduate School of Science and Engineering, Ritsumeikan University, Kusatsu 525-8577, Shiga, Japan
2
Department of Intelligent Robotics, Faculty of Information Engineering, Toyama Prefectural University, Imizu 939-0398, Toyama, Japan
*
Authors to whom correspondence should be addressed.
This article is a revised and expanded version of a paper entitled “MCPT: Mixture of CNN and Point Transformer for Multimodal 3D Object Detection,” which was presented at the 40th International Technical Conference on Circuits/Systems, Computers and Communications (ITC-CSCC 2025, Seoul, Republic of Korea, 7–10 July 2025).
Appl. Sci. 2025, 15(19), 10676; https://doi.org/10.3390/app151910676
Submission received: 24 August 2025 / Revised: 18 September 2025 / Accepted: 30 September 2025 / Published: 2 October 2025

Abstract

In recent years, the demand for both high accuracy and real-time performance in 3D object detection has increased alongside the advancement of autonomous driving technology. While multimodal methods that integrate LiDAR and camera data have demonstrated high accuracy, these methods often have high computational costs and latency. To address these issues, we propose an efficient 3D object detection network that integrates three key components: a DepthWise Lightweight Encoder (DWLE) module for efficient feature extraction, an Efficient LiDAR Image Fusion (ELIF) module that combines channel attention with cross-modal feature interaction, and a Mixture of CNN and Point Transformer (MCPT) module for capturing rich spatial contextual information. Experimental results on the KITTI dataset demonstrate that our proposed method outperforms existing approaches by achieving approximately 0.6% higher 3D mAP, 7.6% faster inference speed, and 17.0% fewer parameters. These results highlight the effectiveness of our approach in balancing accuracy, speed, and model size, making it a promising solution for real-time applications in autonomous driving.

1. Introduction

Deep learning and computer vision have undergone revolutionary advances in recent years [1,2,3], leading to a dramatic acceleration of autonomous driving research. These innovations have further propelled the development of the recognition system at the core of autonomous vehicles. The recognition system detects and classifies other vehicles, pedestrians, traffic signs, road boundaries, and obstacles in real time, enabling a fine-grained understanding of the surrounding environment [4]. In particular, 3D object detection is a critical task that aims to predict an object’s position, orientation, size, and category in three-dimensional space [5]. Without high-precision localization of objects in 3D space, subsequent safe path planning and vehicle control are unachievable.
Traditionally, 3D object detection has relied heavily on LiDAR (Light Detection and Ranging) sensors. However, the point clouds they produce are typically quite sparse, and detection performance degrades significantly at long ranges. Against this backdrop, recent 3D detection research has converged on multimodal approaches that fuse data streams from heterogeneous sensors [6]. In particular, methods combining RGB images from cameras with 3D point clouds from LiDAR have become mainstream. As shown in Figure 1, LiDAR point clouds become increasingly sparse as the distance increases, making it difficult to obtain sufficient information about distant objects. In contrast, RGB images can capture high-resolution color information and shape cues even at relatively long ranges, thereby compensating for the information gaps in LiDAR point clouds.
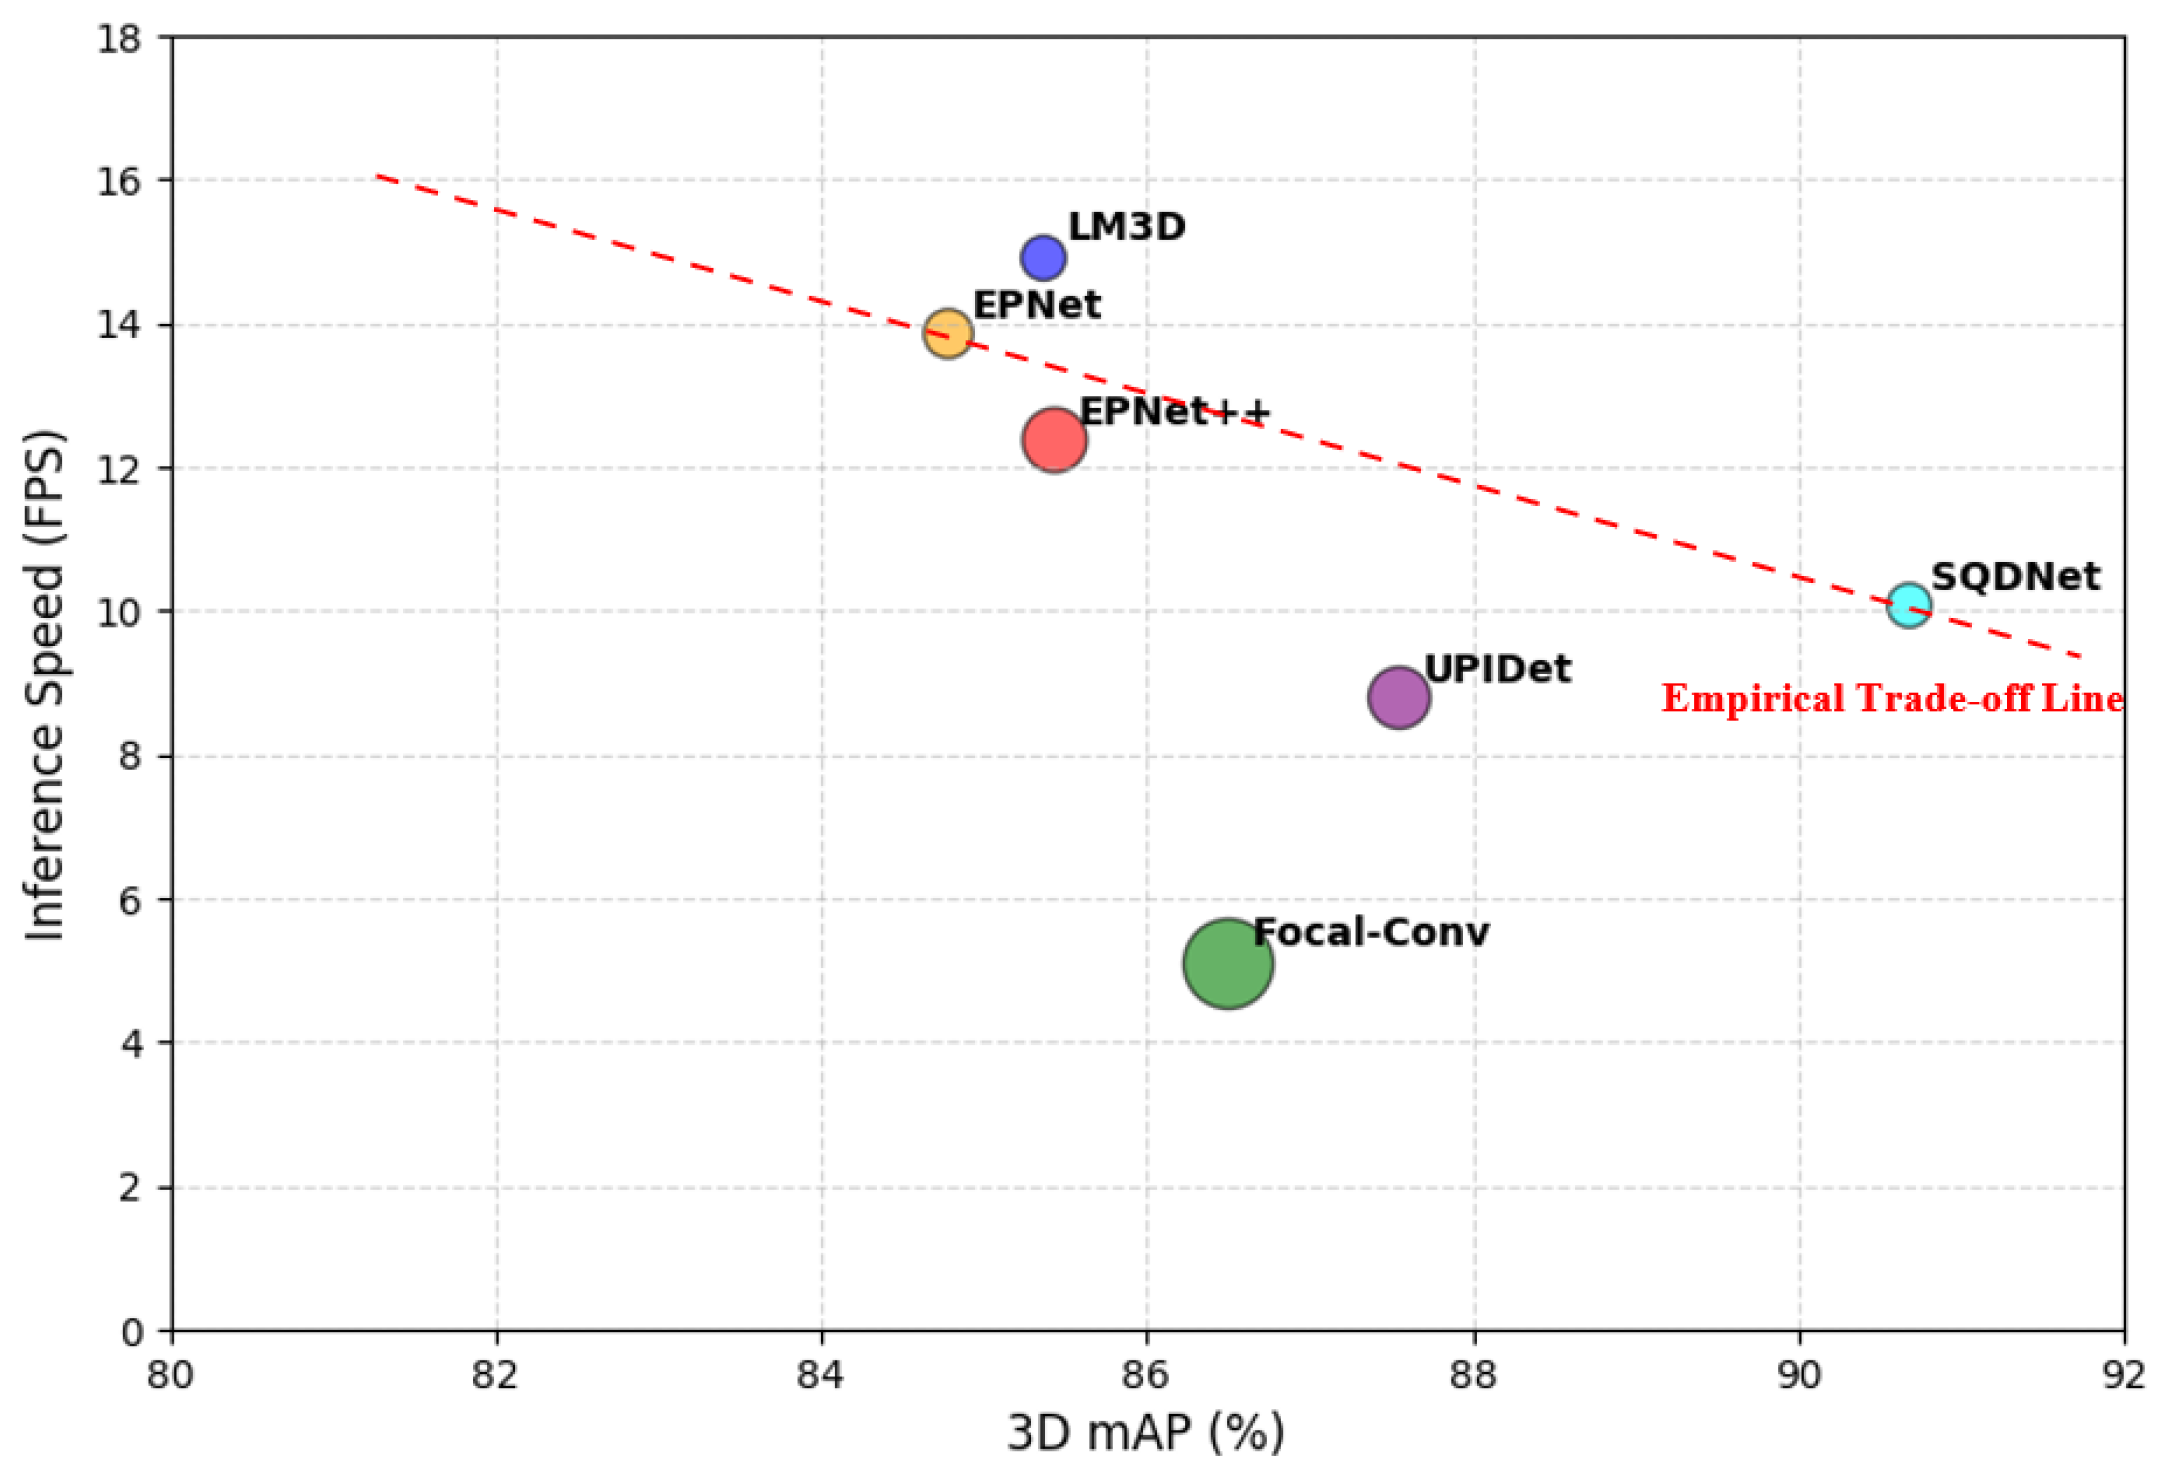
Driven by this trend, numerous multimodal frameworks have been proposed to enhance detection performance [7,8,9]. However, integrating LiDAR and camera data presents challenges: fusion increases computational cost and memory usage, leading to significant inference latency [4]. Furthermore, as shown in Figure 2, existing multimodal 3D object detection methods exhibit a clear trade-off between accuracy and processing speed.
Considering these constraints, there is an increasing demand for a new sensor fusion framework that optimizes the balance between detection accuracy and computational efficiency. In this study, we propose LM3D (Lightweight Multimodal 3D Object Detection), a lightweight and highly efficient multimodal 3D object detection network that fully exploits the complementary strengths of LiDAR and camera data. LM3D combines a lightweight encoder for feature extraction, an efficient LiDAR–image fusion module, and a hybrid feature learning module that integrates local and global features, achieving simultaneous improvements in accuracy, speed, and parameter efficiency compared to conventional methods.
This article is a revised and expanded version of our paper, “MCPT: Mixture of CNN and Point Transformer for Multimodal 3D Object Detection,” which was presented at the 40th International Technical Conference on Circuits/Systems, Computers and Communications (ITC-CSCC 2025, Seoul, Korea, 7–10 July 2025) [10]. This journal version includes several key updates from the original conference paper. First, the Mixture of CNN and Point Transformer (MCPT) module has been revised by replacing depthwise convolutions with standard convolutions, while retaining the original name to ensure continuity. Second, Lightweight Image Encoder has been renamed the DepthWise Lightweight Encoder (DWLE) module to better reflect its architectural characteristics. Third, we introduce the Efficient LiDAR Image Fusion (ELIF) module, which enables efficient and accurate fusion between LiDAR and camera features. Furthermore, this journal version extends the conference work by incorporating an additional contribution, which provides a more comprehensive evaluation and discussion.
The main contributions of this study are summarized as follows:
  • We propose three efficient modules (DWLE, ELIF, and MCPT), which enable lightweight yet accurate multimodal 3D object detection by reducing computational cost and enhancing feature representation.
  • Our method improves 3D detection accuracy (mAP) compared to baseline approaches, providing robust and discriminative feature representations even in complex driving scenarios.
  • The proposed LM3D achieves higher inference speed (FPS) while maintaining competitive accuracy, resulting in a superior trade-off among accuracy, efficiency, and model size compared to existing methods.

2. Related Work

2.1. Camera-Based 3D Object Detection

In recent years, numerous camera-based 3D object detection methods have been proposed due to their cost advantages [11,12,13]. Camera-based 3D object detection methods are broadly classified into two categories: monocular-based methods and stereo-based methods. MonoFENet [14] achieves high-precision localization by fusing 2D and 3D features. It employs a deep learning-based feature enhancement network that estimates disparity from a single RGB image. MonoGRNet [15] focuses on geometric consistency between 2D keypoints and 3D object properties. By explicitly modeling visual centers and object orientations, it enables high-accuracy detection without relying on dense depth estimation. Stereo R-CNN [16] was one of the first methods to extend the 2D object detection framework to stereo-based 3D detection. It aligns 2D regions of interest across left and right images and applies triangulation to estimate 3D bounding boxes. Pseudo-LiDAR++ [17] converts stereo image-derived disparity maps into pseudo point clouds, enabling the application of LiDAR-based methods. It aims to combine the semantic richness of images with the geometric precision of point-based representation.
Although recent monocular and stereo-based methods have shown significant improvements, LiDAR-based 3D object detectors still outperform them in terms of accuracy. Moreover, camera-based methods are susceptible to degraded performance under adverse lighting and weather conditions [18], due to the passive nature of image acquisition.

2.2. LiDAR-Based 3D Object Detection

LiDAR-based 3D object detection methods are generally classified into two categories: point-based methods and voxel-based methods. PointRCNN [19] is a two-stage framework that directly processes raw point clouds. It employs PointNet++ [20] to extract point-wise features and generates 3D object proposals from foreground points, which are subsequently refined in the second stage. VoteNet [21] is another point-based approach that directly operates on raw point clouds. It extracts features and applies a voting mechanism to estimate the object centers. These point-based methods are advantageous for preserving fine-grained geometric structures with high accuracy.
On the other hand, voxel-based methods convert point clouds into regular 3D voxel grids, enabling efficient convolutional operations. SECOND [22] employs sparse 3D convolutions to improve computational efficiency while maintaining detection accuracy. PointPillars [23] divides 3D space into vertical columns (pillars), encodes non-empty pillars into pseudo-images, and applies 2D CNNs for fast inference. These voxel-based methods are efficient and scalable but may suffer from reduced spatial resolution and loss of geometric detail due to voxelization.

2.3. Multimodal 3D Object Detection

According to [4], sensor fusion methods for 3D object detection are generally classified into the following three categories: Early Fusion, Late Fusion, and Intermediate Fusion.
Early fusion methods incorporate camera-derived information into LiDAR point clouds before the object detection stage. For example, PointPainting [24] enriches point clouds by attaching semantic segmentation from camera images. SFD [25] generates pseudo LiDAR points via depth completion from RGB images and fuses them with LiDAR data. LVP [26] introduces virtual points through three early-fusion modules to improve RoI generation. More recently, ViKIENet [27] replaces dense pseudo points with virtual key instances (VKIs) and employs multi-stage fusion modules (SKIS, VIFF, VIRA), substantially improving performance. In general, while these approaches are effective, training the accompanying semantic segmentation and depth completion models may require additional pixel-level and/or depth-map annotations, potentially increasing annotation cost. Moreover, performance can be affected by image quality (e.g., noise, exposure, motion blur) and environmental conditions (e.g., illumination, weather).
Late fusion methods process camera and LiDAR data independently and fuse their outputs—such as 2D and 3D detection boxes—at the final stage. For instance, CLOCs [28] combines candidate boxes from 2D and 3D detectors and learns geometric and semantic consistency between sensors to improve detection accuracy. It is reported to be especially effective for long-range object detection. BEVFusion [29] projects both images and point clouds into a unified bird’s-eye view (BEV) representation, allowing efficient fusion while retaining both semantic and geometric information. Its optimized BEV pooling reduces latency and enables high-speed, multi-task processing. However, late fusion methods do not leverage intermediate deep features from either modality. As a result, they cannot fully exploit the rich semantic and geometric cues, limiting their flexibility and representational capacity for higher-precision detection.
Intermediate fusion methods integrate image and LiDAR features at intermediate layers of the network, especially in the backbone or proposal generation stages. This approach enables tighter coupling of multimodal features and facilitates fine-grained information fusion. Compared to early and late fusion, intermediate fusion allows deeper multimodal representation and offers better robustness. For example, UPIDet [30] employs a Transformer-based architecture that strengthens the learning of the image branch and integrates image and LiDAR features in the BEV space. This enables the model to leverage visual information that was underutilized in prior approaches. EPNet [31] uses visual features from images and integrates them with LiDAR features at an intermediate stage via a specialized fusion module called Li-Fusion, resulting in improved foreground–background discrimination and high-accuracy 3D detection through a two-stage architecture. EPNet++ [32] extends this idea by employing a cascaded structure that progressively acquires and fuses features from both images and LiDAR, effectively combining semantic and geometric information to achieve robust and high-precision 3D object detection.

3. Method

This section describes the main components of the proposed method. Section 3.1 presents the overall architecture, followed by the DepthWise Lightweight Encoder (DWLE) module in Section 3.2, the Efficient LiDAR Image Fusion (ELIF) module in Section 3.3, and the Mixture of CNN and Point Transformer (MCPT) module in Section 3.4.

3.1. Overall Architecture

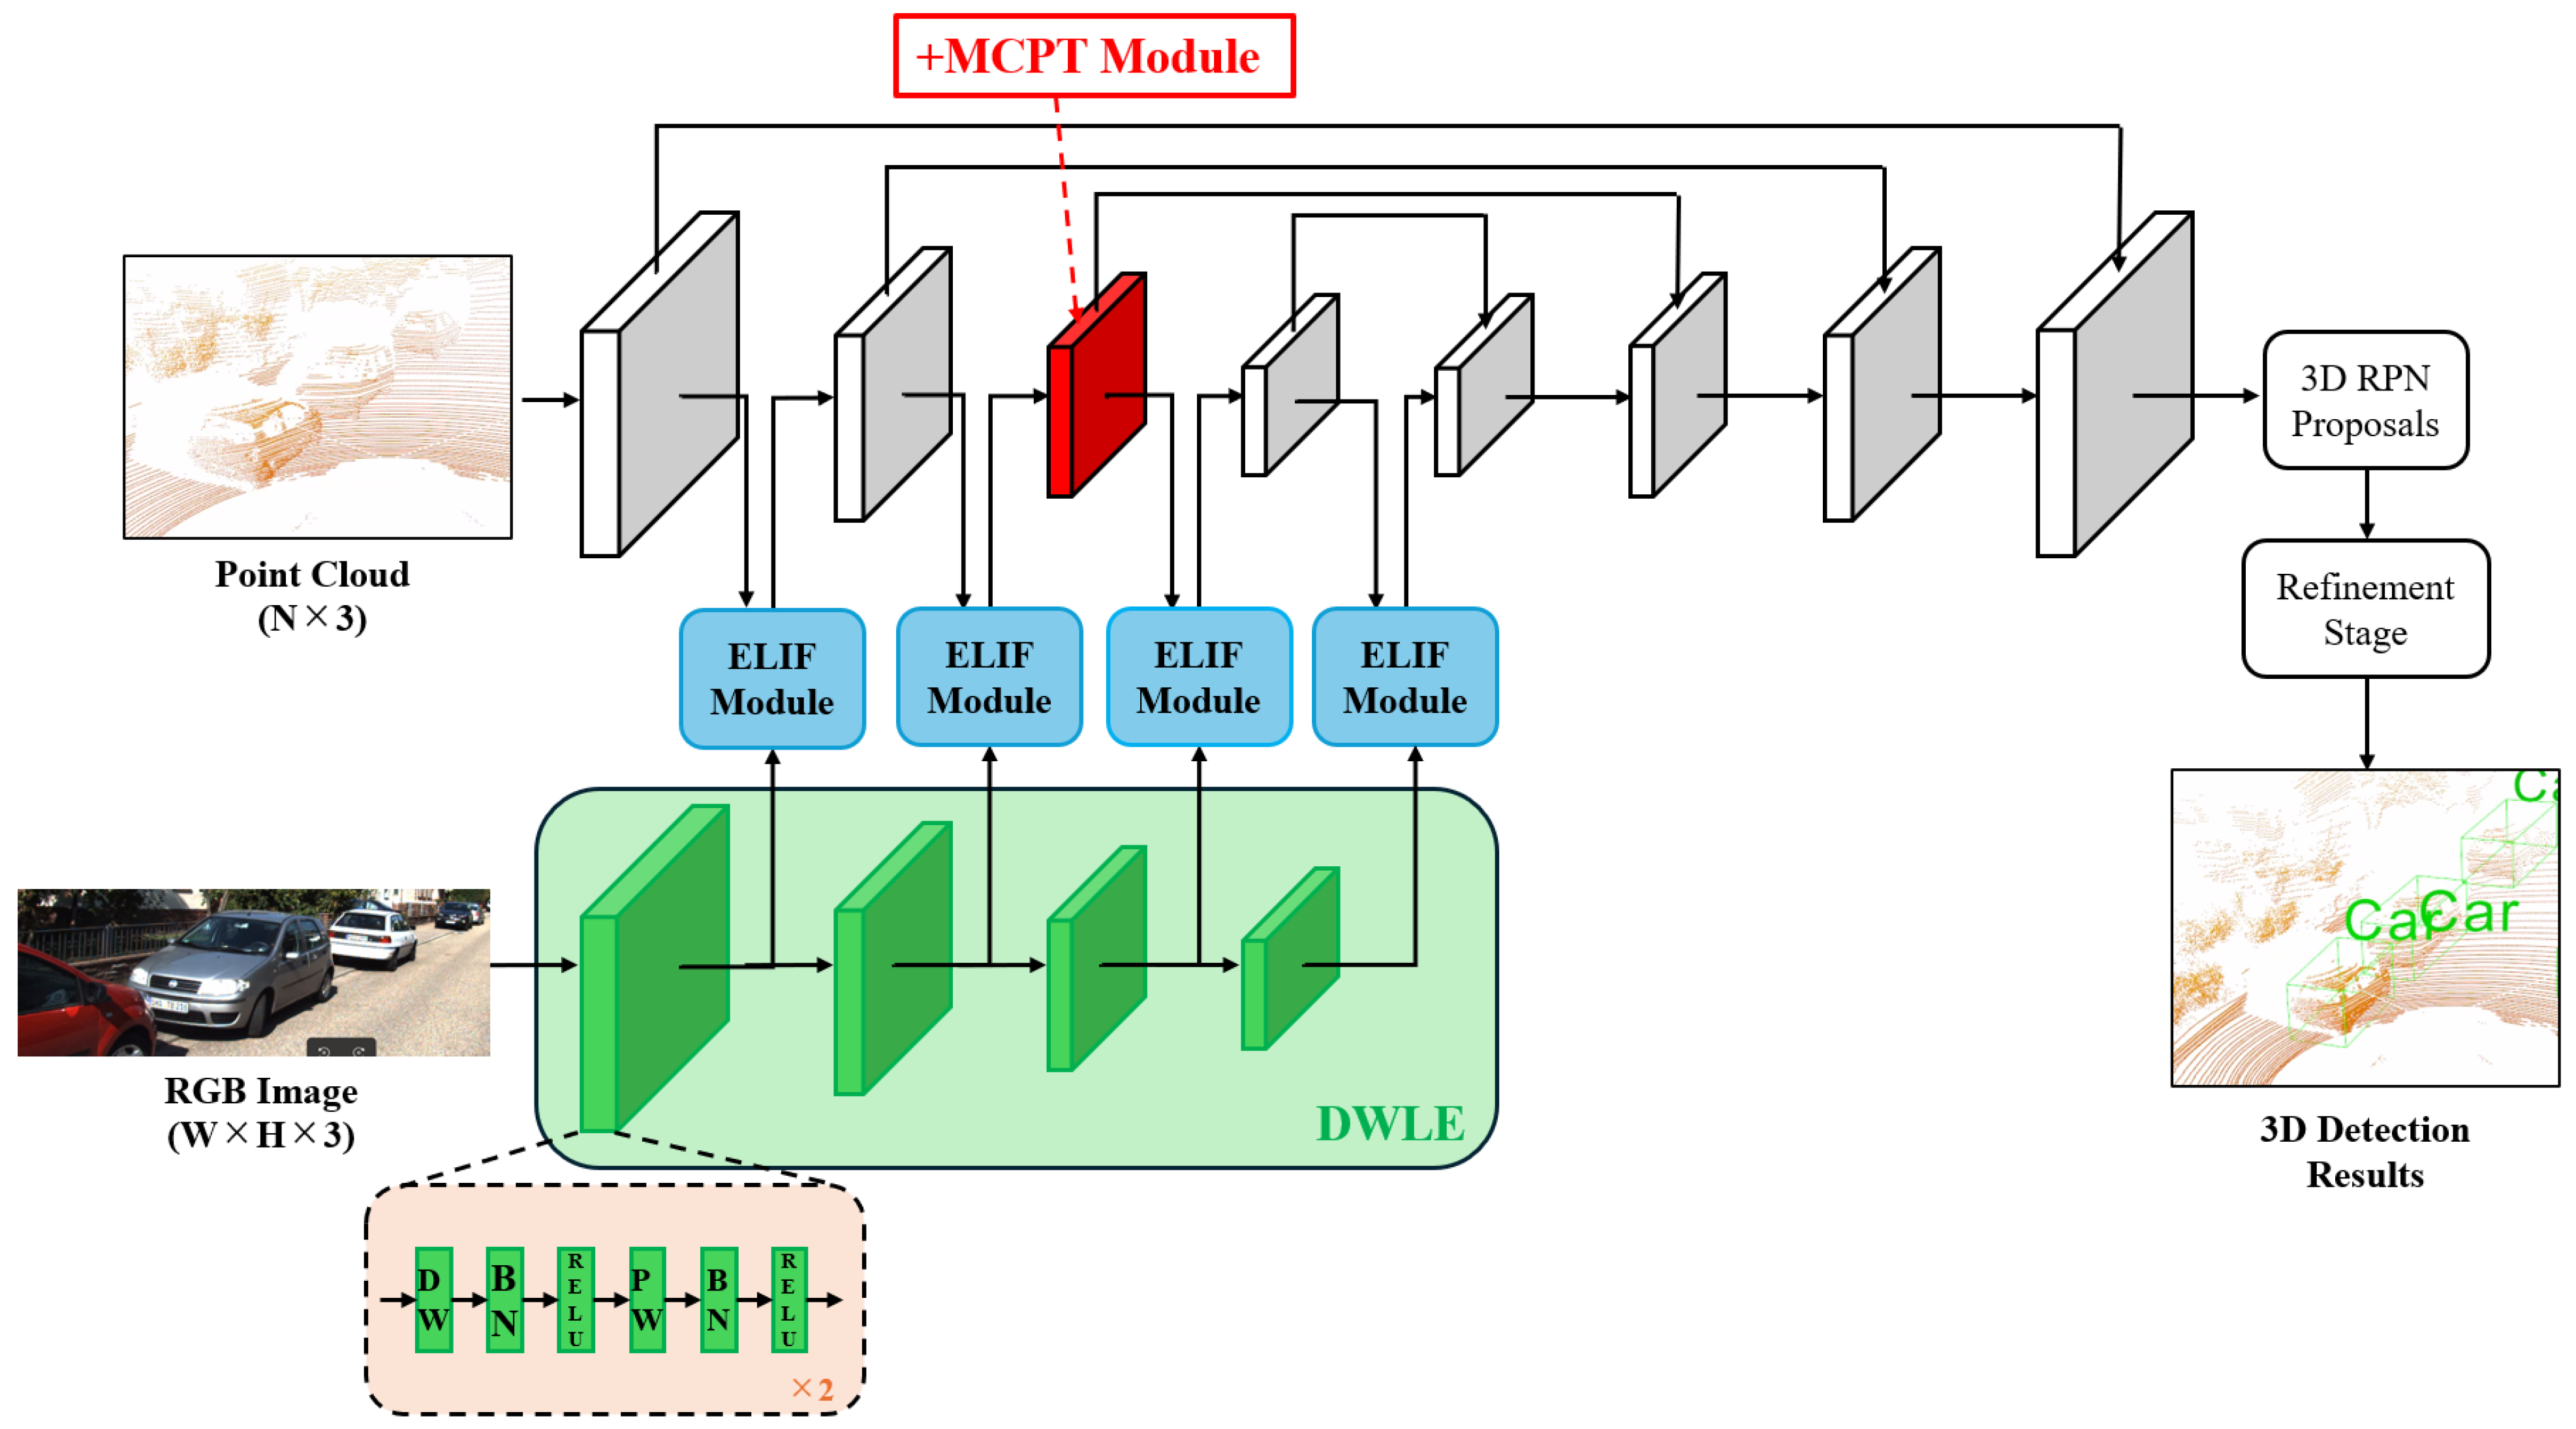
We illustrate the overall architecture of our proposed method in Figure 3. Our proposed 3D object detection network consists of three main components: a point cloud backbone for extracting point-wise features, a DepthWise Lightweight Encoder (DWLE) module for extracting image features, and an Efficient LiDAR–Image Fusion (ELIF) module for fusing multimodal features.
For the point cloud backbone, we adopt a hierarchical structure similar to PointNet++ [20], which effectively captures local geometric information. The raw point cloud is processed through a series of Set Abstraction (SA) layers to progressively learn high-level spatial features. The DWLE module utilizes depthwise separable convolutions [33] to significantly reduce computational cost and the number of parameters, while maintaining strong feature representation capability. This lightweight design allows for the efficient extraction of high-quality semantic features from RGB images. In the ELIF module, we first apply an Efficient Channel Attention (ECA) mechanism [34] to enhance the inter-channel dependencies of the image features. Then, we perform spatial alignment between the image and point cloud features based on LiDAR-to-image projection. A cross-attention mechanism is employed, where the point cloud features serve as queries and the aligned image features act as keys and values. This enables context-aware and high-precision multimodal feature fusion.

3.2. DepthWise Lightweight Encoder (DWLE) Module

The DepthWise Lightweight Encoder (DWLE) module is a lightweight encoder designed to efficiently extract semantic features from RGB images. This module significantly reduces both computational cost and the number of parameters compared to conventional image backbones, while maintaining sufficient representational capacity.
The DWLE module is based on the structure of depthwise separable convolutions, which decompose a standard convolution into the following two steps:
  • Depthwise Convolution (DW): Performs spatial convolution independently on each input channel.
  • Pointwise Convolution (PW): Applies a 1 × 1 convolution to integrate information across channels.
This technique is also employed in lightweight neural networks such as MobileNet, and is widely used as an architecture that achieves a good balance between computational efficiency and accuracy. Each DWLE block consists of the following sequence applied twice: DW, Batch Normalization (BN), ReLU, PW, BN, and ReLU, as illustrated in the dashed box at the bottom left of Figure 3.
The DWLE module outputs multi-scale image feature maps from the RGB image, which are passed to the ELIF modules at each stage of the 3D backbone. This enables spatially aligned multimodal fusion with point cloud features.
While existing methods (e.g., EPNet [31]) typically adopt image encoders composed of stacked 3 × 3 convolutions, the DWLE module offers significant advantages in terms of inference speed and model size. In particular, adopting it reduces the model size to approximately 58 % and improves inference speed by about 9 % , with negligible loss in accuracy (details are provided in Section 5.3). These properties make the DWLE module highly suitable for real-time 3D object detection in autonomous driving scenarios.

3.3. Efficient LiDAR Image Fusion (ELIF) Module

The overall structure of the ELIF module is illustrated in Figure 4. The ELIF (Efficient LiDAR–Image Fusion) module is a multimodal fusion module designed to efficiently and accurately integrate features extracted from LiDAR point clouds and RGB images. It consists of three key components: enhancement of channel dependencies via the ECA module, spatial alignment using LiDAR projection, and a cross-modal attention mechanism based on a Transformer-like Query–Key–Value structure.
First, the Efficient Channel Attention (ECA) module is applied to the image features extracted from the RGB image to emphasize inter-channel relationships, thereby enhancing their discriminative power. Then, the LiDAR points are projected onto the image plane using a projection matrix to obtain spatially aligned image features (referred to as Image-Aligned Features).
Next, a cross-attention mechanism is introduced, where the point cloud features serve as queries, and the aligned image features serve as keys and values. Following EPNet, the similarity between queries and keys is computed through addition and normalized via a softmax function. The resulting attention weights are used to compute a weighted sum of the value features, enabling context-aware fusion. Finally, the fused features are refined through convolutional layers to produce the final output.
This structure enables the ELIF module to generate high-quality multimodal features that are spatially and semantically consistent, thereby improving detection performance. Notably, despite having a comparable number of parameters to existing methods, ELIF achieves both high computational efficiency and accuracy, outperforming conventional fusion modules and making it highly suitable for real-time applications.

3.4. Mixture of CNN and Point Transformer (MCPT) Module

The Mixture of CNN and Point Transformer (MCPT) module is designed to enhance the fused LiDAR–image features by capturing both local geometric patterns and global spatial relationships. This hybrid design is inspired by recent works such as ConvViT [35] and CoAtNet [36], which demonstrate the effectiveness of integrating convolutional and attention-based architectures. The structure of the MCPT module is illustrated in Figure 5.
It consists of two parallel branches:
  • CNN Branch: A 7 × 7 convolutional layer is used to extract localized geometric features. Batch Normalization and ReLU activation follow to stabilize and transform the feature maps.
  • Point Transformer Branch: This branch employs a point-based transformer architecture to capture long-range dependencies and spatial context based on self-attention mechanisms.
The outputs of both branches are concatenated and refined via BatchNorm and ReLU layers, resulting in a unified representation called Enhanced Fused Features. This hybrid approach allows the model to benefit from both the efficiency of convolution and the expressiveness of transformer-based attention.
Although adding modules generally leads to an increase in the number of parameters, the MCPT module was strategically introduced based on experimental performance comparisons, successfully improving accuracy while keeping the parameter increase to a minimum. Based on these investigations, the MCPT module was added to the third Set Abstraction (SA) layer of the point cloud backbone, considering the trade-off between accuracy, inference speed, and the number of parameters. Furthermore, we experimentally explore the optimal kernel size for the convolutional layers, as performance varies significantly depending on this parameter. Details on the placement of the MCPT module and the effect of kernel size are provided in Section 5.4.

3.5. Overall Loss Function

We adopt a multi-task loss function for training, following the same design as EPNet [31]. The total loss is defined as:
L total = L rpn + L rcnn ,
Each loss term consists of classification, regression, and confidence components.
For classification, we use the focal loss [37] with α = 0.25 and γ = 2.0 to address class imbalance. Bounding box regression predicts object center ( x , y , z ) , size ( l , h , w ) , and orientation θ .
The y-axis and object size are optimized using Smooth L1 loss [38]. For x, z, and θ , we adopt a bin-based regression approach [8,19]: the network first classifies the bin and then regresses the residual within that bin.
The RPN loss is formulated as:
L rpn = L cls + L reg + λ L conf ,
L cls = α ( 1 c t ) γ log ( c t ) ,
L reg = u { x , z , θ } E ( b u , b ^ u ) + u { x , y , z , h , w , l , θ } S ( r u , r ^ u ) ,
where E and S denote cross-entropy and Smooth L1 loss, respectively. c t is the predicted class probability, and b u , r u are the predicted bin and residual. b ^ u , r ^ u are their ground truth values.

4. Experimental Setup

4.1. Datasets

The KITTI dataset [39] is a widely used benchmark for autonomous driving research. It consists of 7481 frames for training and 7518 frames for testing, totaling approximately 15,000 frames. Following the data split protocol used in previous works [8,19], the 7481 training frames are further divided into 3712 frames for training and 3769 frames for validation. In our experiments, we report evaluation results on the validation set across all three difficulty levels: Easy, Moderate, and Hard.
To evaluate generalization under low-light conditions, we additionally evaluated a night-time subset of the nuScenes dataset [40], visualizations of which are shown in Figure 6. Following the official dev-kit and similar to previous work [41], we converted the annotations to the KITTI format and selected a scene pattern that primarily contains night-time scenes, obtaining 3420 frames in total. This subset was split into 1710 frames for training and 1710 for validation. Note that this evaluation was performed on a subset of a large-scale dataset and is therefore not directly comparable to the official nuScenes benchmark metrics.

4.2. Network Training

Our network configuration largely follows the design of EPNet [31]. Similar to EPNet, both LiDAR point clouds and RGB images are used as inputs during training and inference. The range of point clouds is limited to [ 0 m , 70.4 m ] along the X-axis (forward), [ 40 m , 40 m ] along the Y-axis (left–right), and [ 1 m , 3 m ] along the Z-axis (up–down) in the camera coordinate system. The orientation angle θ is constrained to the range of [ π , π ] . For the LiDAR stream, 16,384 points are randomly subsampled from the raw point cloud as input. For the image stream, the input resolution is set to 1280 × 384 pixels.
In the LiDAR branch, four Set Abstraction (SA) layers are employed to progressively downsample the point cloud to sizes of 4096, 1024, 256, and 64 points. Subsequently, four Feature Propagation (FP) layers are used to upsample the features back to the original resolution.
For optimization, we adopt the Adaptive Moment Estimation (Adam) [42] optimizer. Compared to the original setting, we reduce the initial learning rate by a factor of 10, setting it to 0.0002. The weight decay and momentum factor are set to 0.001 and 0.9, respectively. Training is conducted for up to 50 epochs with a batch size of 2, using a single RTX 4070 Ti Super GPU (Nvidia Corporation, Santa Clara, CA, USA).
For the nuScenes night-time subset, we based our settings on the KITTI configuration with two key modifications. First, we resized the images from 1600 × 900 to 1280 × 384 . Second, to account for format conversion and the domain shift from low-light conditions, we used a 3D detection IoU threshold of 0.25 for evaluation.

4.3. Evaluation Metrics

In this study, we adopt Average Precision (AP) as the evaluation metric. AP is defined as the area under the precision–recall (PR) curve, which evaluates the overall detection performance by combining precision and recall.
Specifically, AP is calculated as the average precision over N sampled recall levels:
AP = 1 N i = 1 N P ( r i )
where P ( r i ) is the precision at recall level r i , and N is the number of sampled points (40 for the KITTI benchmark).
The definitions of Precision (P) and Recall (R) are as follows:
P = T P T P + F P
R = T P T P + F N
where T P , F P , and F N denote true positives, false positives, and false negatives, respectively.
Following the official KITTI benchmark protocol, the Intersection over Union (IoU) threshold for the Car category is set to 0.7.
In this study, we define “real-time” as approximately 15 FPS, since Velodyne HDL-64E LiDAR sensors operate at a user-selectable frame rate of 5–15 Hz [43]. Achieving 15 FPS ensures that the processing keeps up with the maximum scan rate of such sensors.

5. Experiments

5.1. Main Results on KITTI

We evaluated our proposed method on the validation set of the KITTI benchmark. For comparison, we benchmarked it against representative point cloud-based methods and multimodal approaches utilizing both LiDAR and RGB images. The results are presented in Table 1 and Table 2.
For evaluation, we adopted Average Precision (AP) with an IoU threshold of 0.7, calculated over 40 recall points, for both 3D object detection and Bird’s Eye View (BEV) detection. These metrics were evaluated separately across three difficulty levels: Easy, Moderate, and Hard.
In the evaluation on the KITTI Car dataset, the proposed method did not achieve the highest accuracy across all categories and difficulty levels; however, it improved the 3D detection mAP by approximately 0.6% compared to the baseline EPNet, demonstrating a measurable enhancement in accuracy.
We also compared model efficiency in terms of the number of parameters and inference speed (Table 2). The proposed method achieves a compact model size of 13.03 M parameters and a real-time inference speed of 14.94 FPS, demonstrating significantly higher efficiency compared to other multimodal approaches. As shown in Figure 2, existing methods generally exhibit a clear trade-off between accuracy and inference speed. For instance, UPIDet achieves a high accuracy of approximately 87.54%, but its inference speed is only 8.79 FPS and its parameter size (24.99 M) is larger than that of the proposed method.
In contrast, our proposed method maintains a strong 3D mAP of 85.36% while achieving an inference speed of 14.94 FPS. Furthermore, its parameter size is relatively small. These results indicate that the proposed method achieves a well-balanced trade-off among accuracy, inference speed, and parameter size, demonstrating superior efficiency compared to existing approaches. While many multimodal methods tend to suffer from increased model size and reduced inference speed in pursuit of higher detection accuracy, our method achieves a favorable trade-off by maintaining high accuracy while ensuring both compactness and fast inference. This suggests that our method is well-suited for deployment in resource-constrained edge environments and real-time autonomous driving applications. Moreover, unlike approaches that require additional annotations such as depth completion [44,46,47], our method can be applied without extra labeling efforts, making it more practical for real-world deployment.
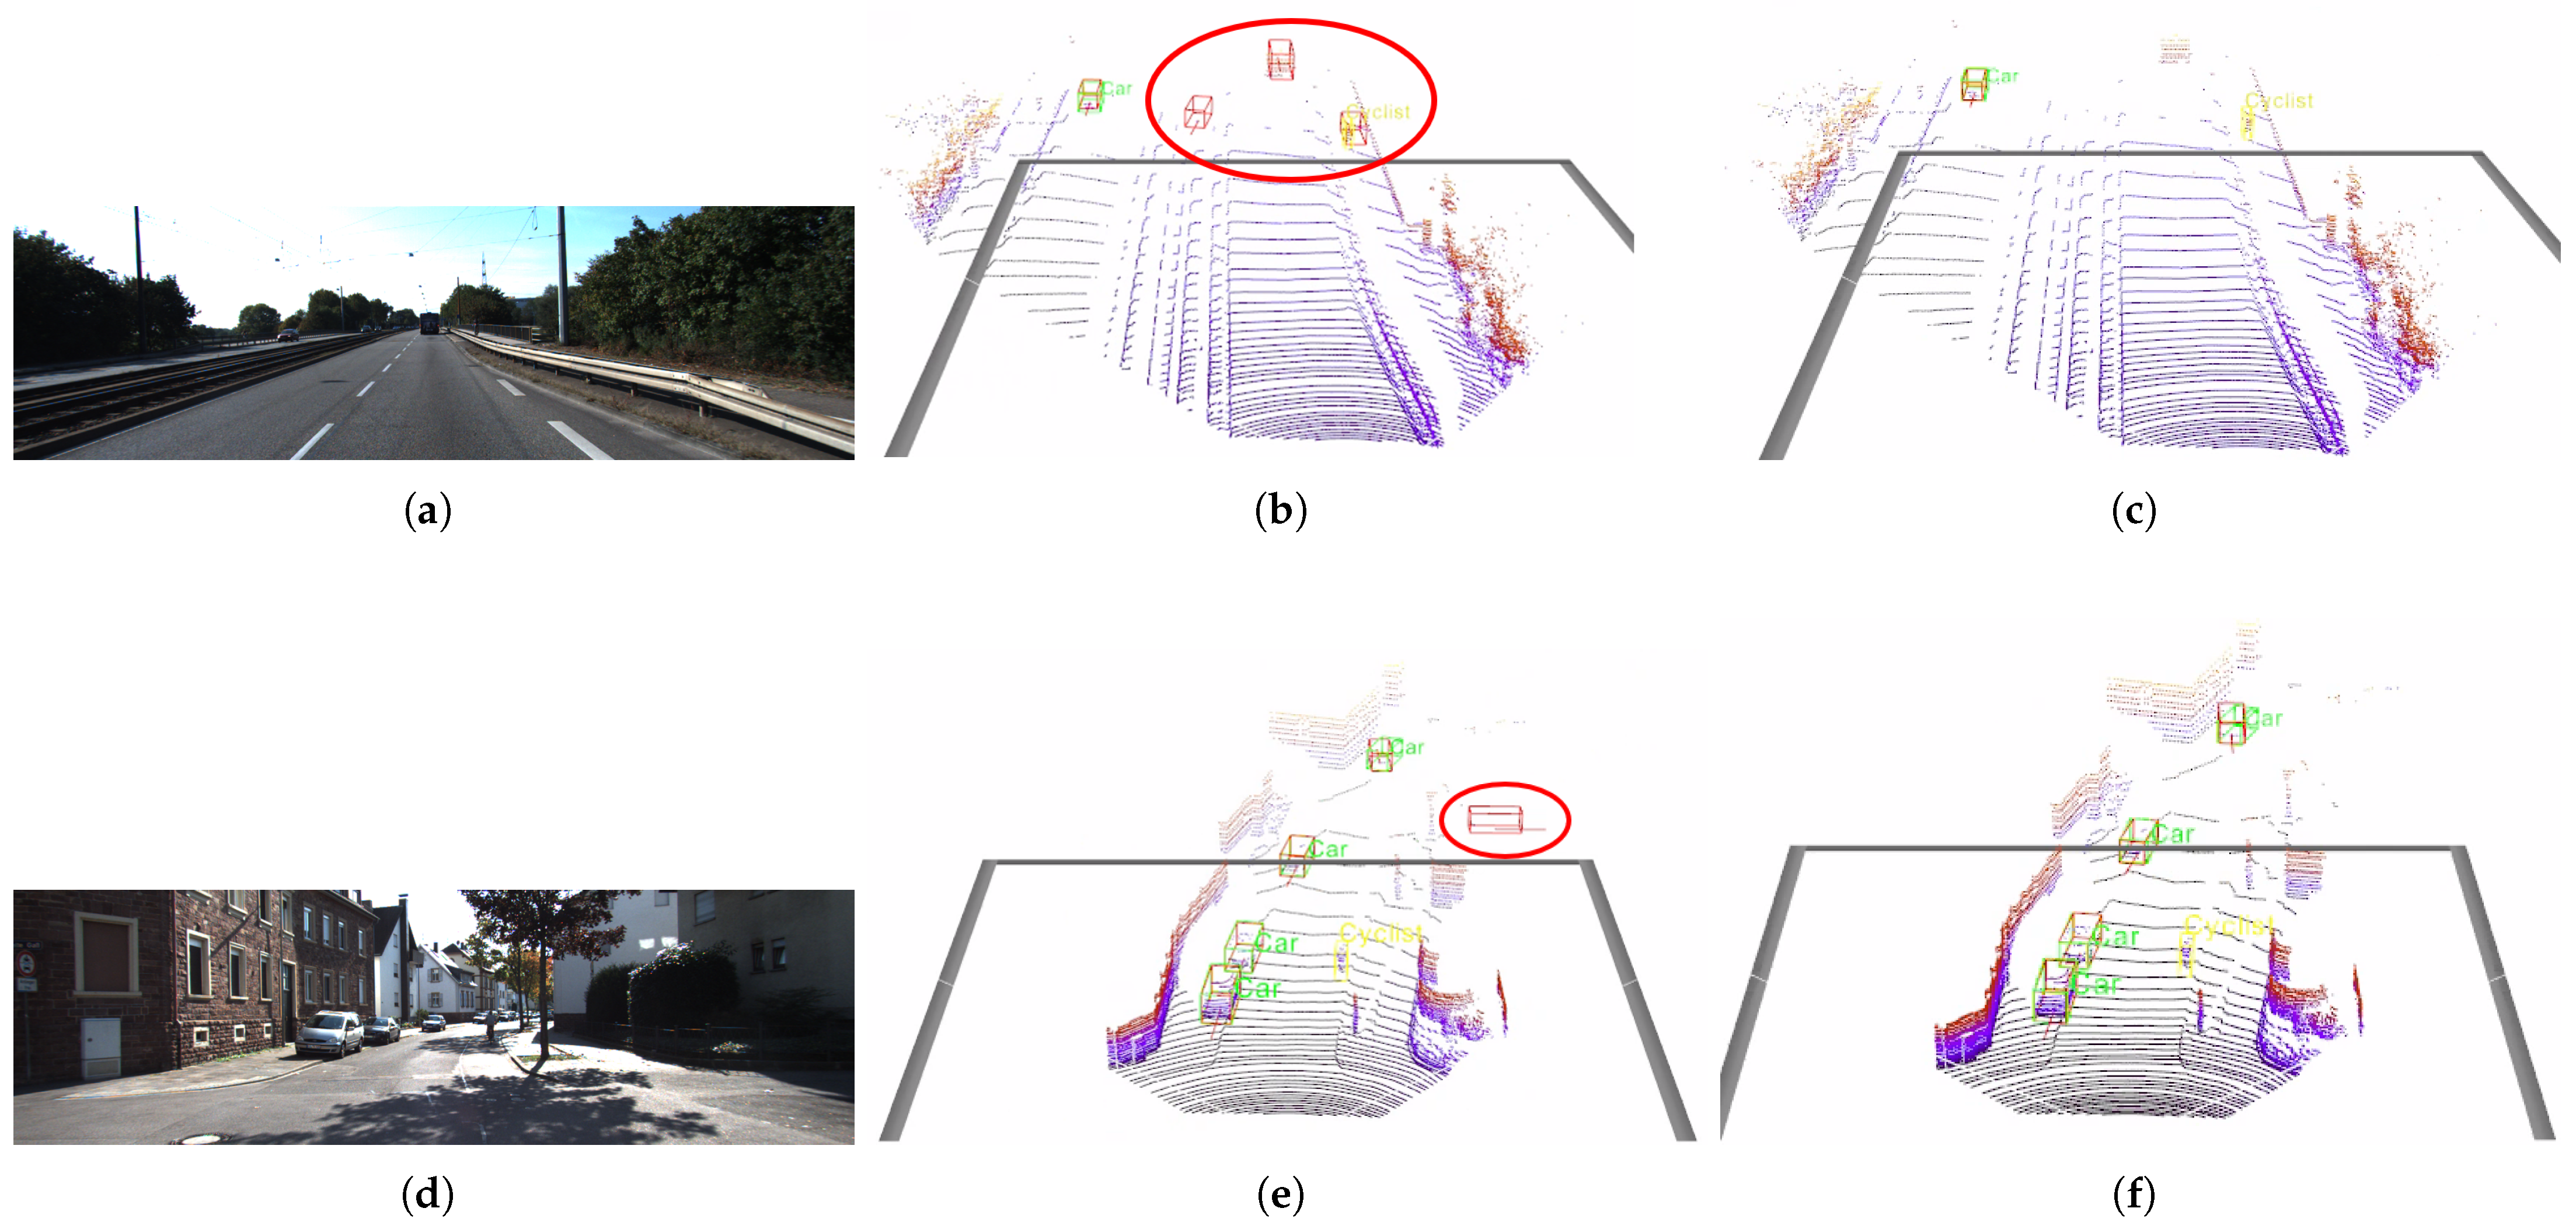
From the qualitative comparison results shown in Figure 7, our proposed method demonstrates more effective false-positive suppression compared to EPNet. In four representative examples, false detections commonly observed in EPNet are markedly reduced. This performance improvement is attributed to the enhanced feature fusion capabilities provided by the ELIF and MCPT modules, enabling more precise and robust object recognition. False positives not only degrade detection accuracy but, in the context of autonomous driving, can lead to unsafe control actions that may compromise safety; therefore, their reduction is essential from a system safety perspective. These qualitative observations suggest that the proposed method holds significant potential for enhancing the safety and reliability of practical autonomous driving applications.
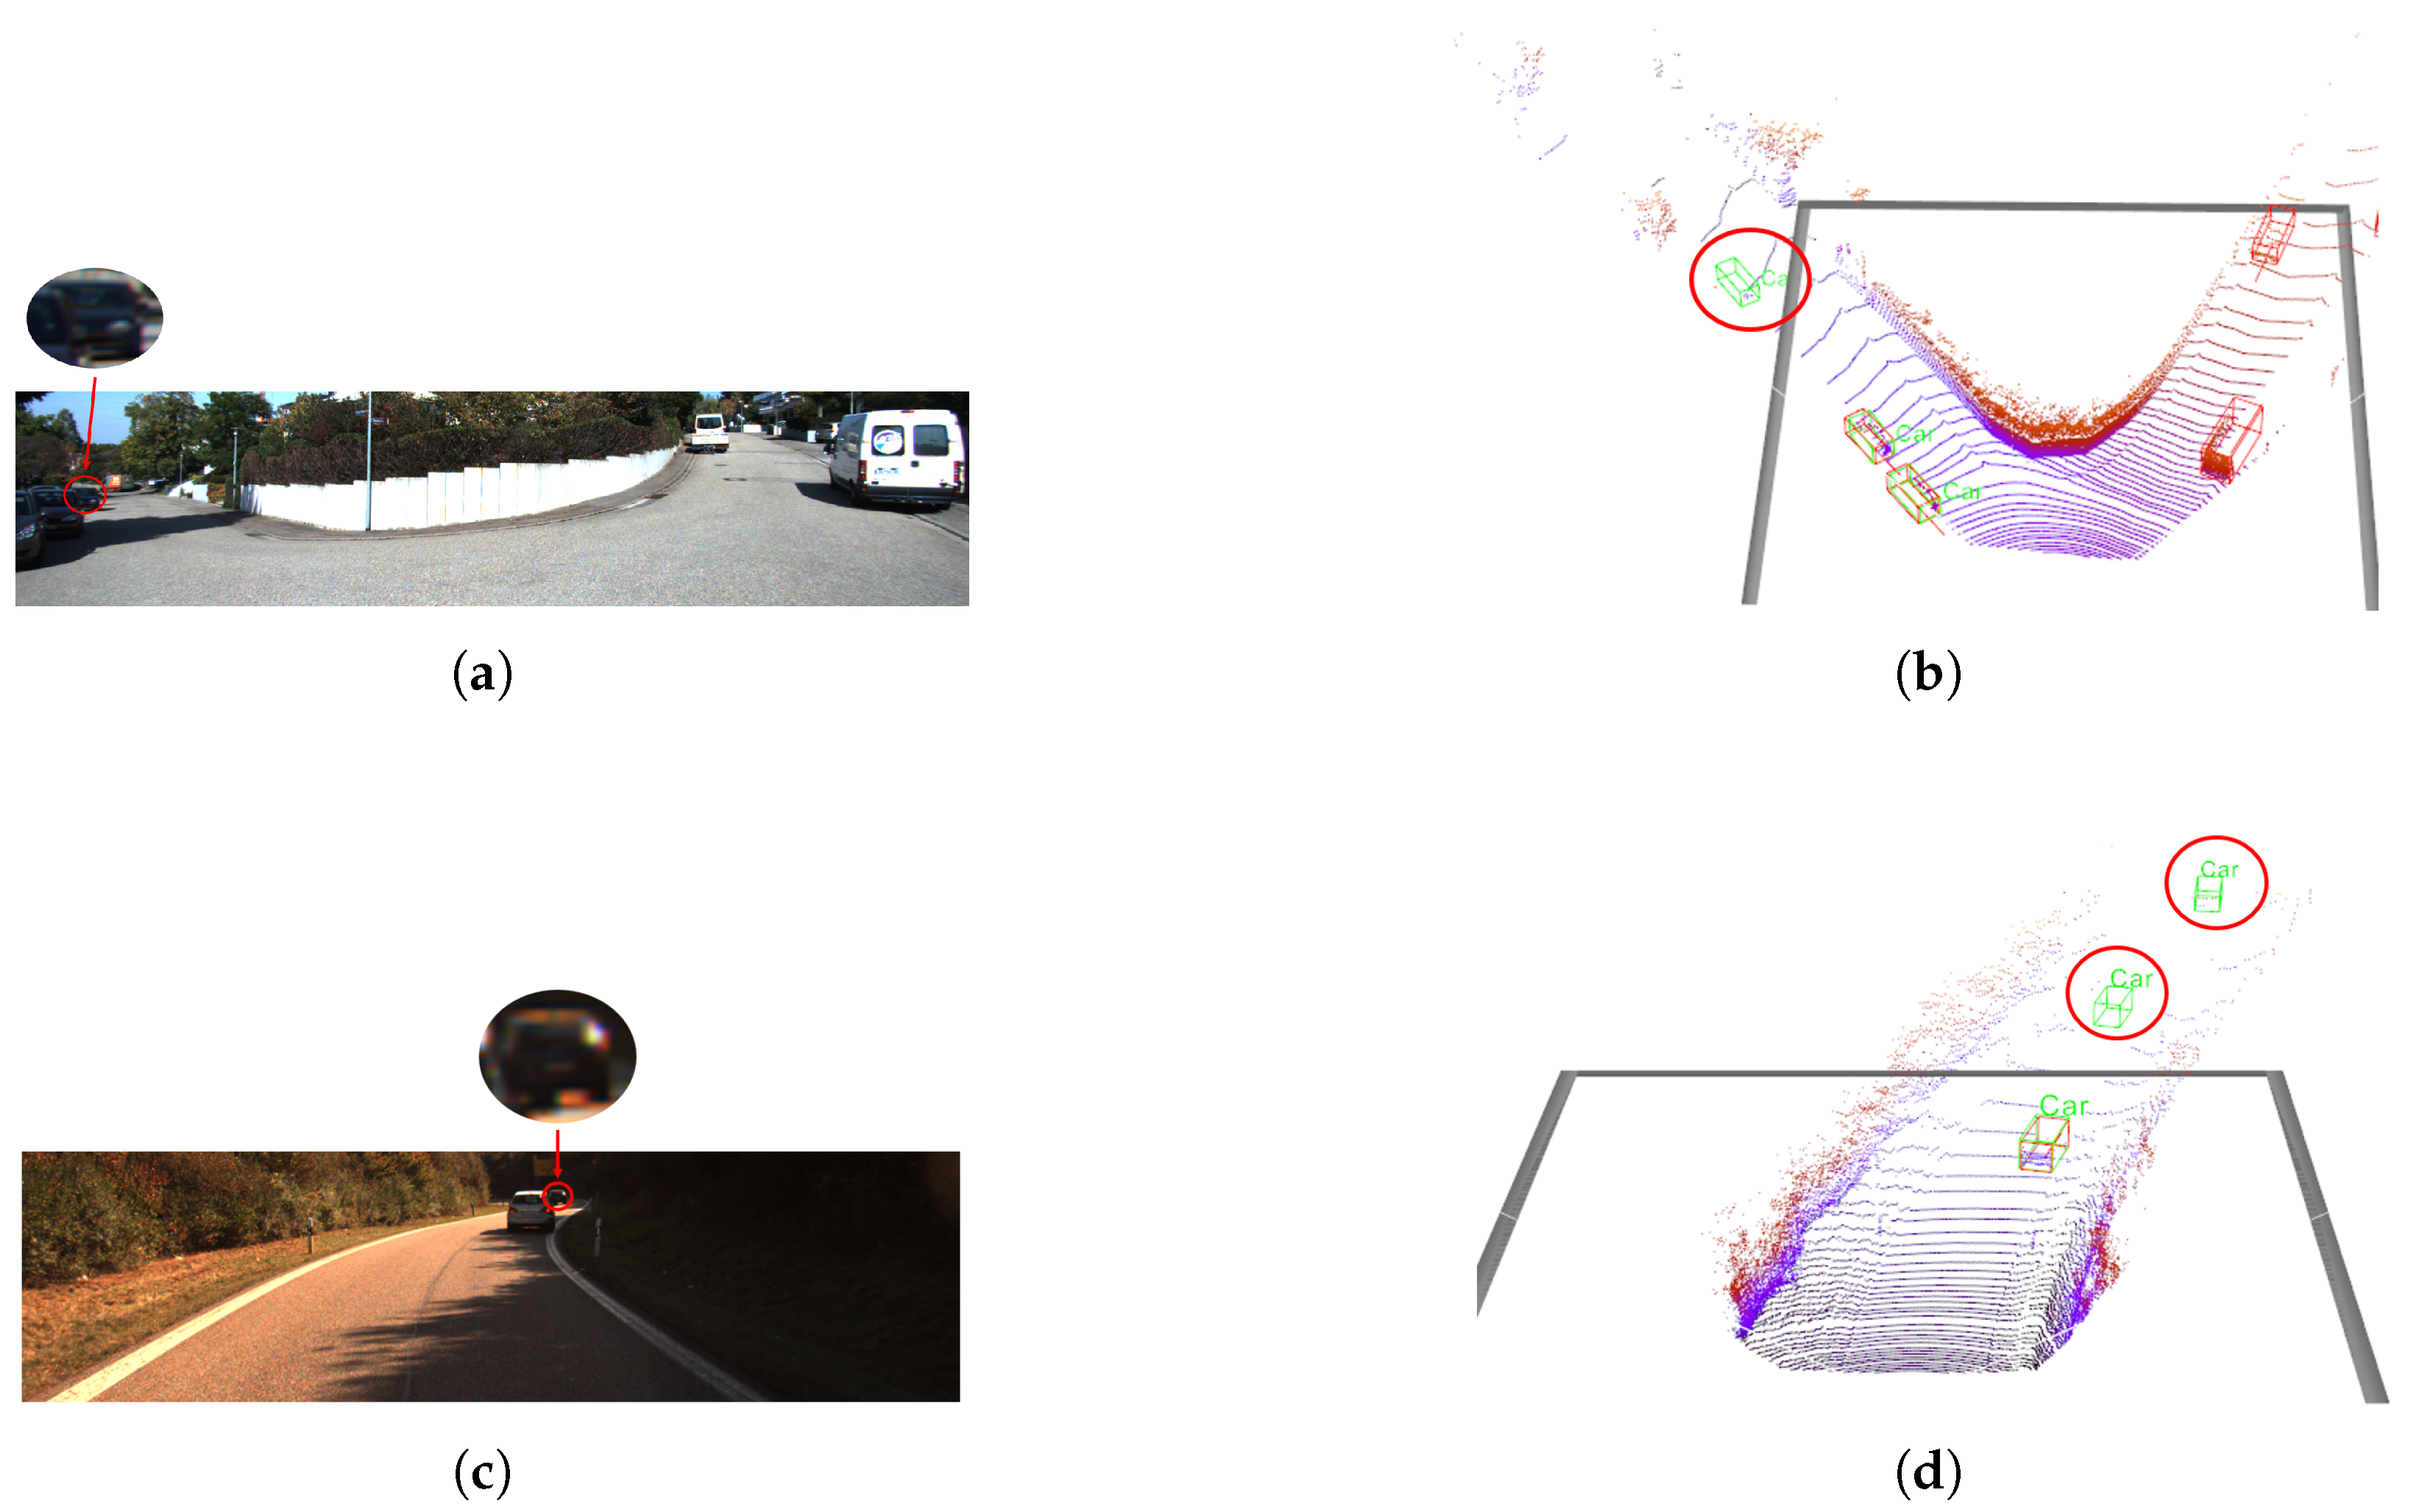
Despite the improvements shown in Figure 7, our method still faces challenges in difficult scenarios on the KITTI dataset. Figure 8 presents representative failure cases. In these examples, our method struggles to detect heavily occluded vehicles and distant cars with sparse LiDAR points, resulting in missed detections. These observations indicate that certain challenging scenes remain unsolved, highlighting clear directions for future research.

5.2. Results on the nuScenes Night-Time Subset

We compare the proposed method with EPNet and EPNet++ on the nuScenes night-time subset converted into the KITTI format. As summarized in Table 3, our method achieves an mAP of 36.63%, outperforming EPNet by about 6% absolute. In addition, our inference speed is improved by approximately 6% over the baselines under the same hardware.
These results indicate that, beyond the daytime-oriented KITTI benchmark, our approach maintains strong generalization under challenging night-time conditions.

5.3. Ablation Study

To evaluate the contributions of the three key modules DWLE, ELIF, and MCPT, we conducted an ablation study on the KITTI validation dataset. Table 4 reports the 3D average precision (3D mAP), bird’s-eye-view average precision (BEV mAP), total number of parameters, and inference speed (FPS) for each model variant.
Introducing the DWLE module reduces the parameter count from 15.68 M to 9.09 M and increases the inference speed from 13.88 FPS to 15.11 FPS. The 3D mAP and BEV mAP decrease only marginally by 0.04% and 0.39%, respectively, demonstrating that DWLE module significantly improves efficiency with minimal impact on accuracy. Adding the ELIF module maintains the parameter count at 9.09 M while recovering and improving detection performance: 3D mAP reaches 85.08%, BEV mAP reaches 91.11%, and inference speed increases from 15.11 FPS to 15.41 FPS. This indicates that ELIF is an effective fusion module that balances detection accuracy and speed with negligible overhead. Integrating the MCPT module in the full model further improves detection performance, achieving a 3D mAP of 85.36% and a BEV mAP of 91.25%. The total parameter count increases to 13.03 M and inference speed slightly decreases to 14.94 FPS, while real-time performance is still preserved.
These results demonstrate that the three modules function complementarily: the DWLE module dramatically boosts efficiency, the ELIF module enhances both accuracy and speed simultaneously, and the MCPT module provides the final accuracy uplift without sacrificing real-time capability.

5.4. Placement Strategy of MCPT Module

As shown in Table 5, we investigated the effect of inserting the MCPT module into different Set Abstraction (SA) layers of the point-cloud backbone. Placing the MCPT at the 1st SA layer yields the highest 3D mAP of 85.38% but reduces the inference speed to 12.13 FPS. In contrast, placing it at the 3rd SA layer maintains a competitive 3D mAP of 85.36% while achieving high throughput (14.94 FPS) with a moderate parameter size. Therefore, we conclude that the 3rd SA layer is the optimal insertion point for the MCPT module.

5.5. Kernel Size Strategy of MCPT Module

We also evaluated the impact of varying the convolutional kernel size in the CNN branch of the MCPT module, testing sizes from 1 × 1 to 9 × 9 . As shown in Table 6, the 7 × 7 kernel achieves the best trade-off, reaching a 3D mAP of 85.36% while maintaining an inference speed of 14.94 FPS. Based on these results, we determined that the 7 × 7 kernel is the optimal choice.

6. Conclusions

In this study, we proposed a lightweight multimodal 3D object detection network that incorporates three novel modules—DWLE, ELIF, and MCPT—to achieve an effective balance of accuracy, speed, and model size. Extensive experiments on the KITTI benchmark demonstrated that our proposed method improves upon the EPNet baseline by increasing 3D mAP by 0.6%, enhancing inference speed by 7.6%, and reducing the total parameter count by 17.0%.
Moreover, to assess generalization beyond the daytime-oriented KITTI benchmark, we additionally evaluated our method on the nuScenes night-time subset converted to KITTI format. Our method achieved an mAP of 36.63%, outperforming EPNet by about 6% absolute, while also improving inference speed by roughly 6% under the same hardware. These findings confirm that the proposed network maintains strong robustness even under challenging low-light conditions.
From a practical standpoint, these results extend beyond benchmark scores and suggest the potential of our method in real-world autonomous driving systems. An inference speed of 14.94 FPS is critical, as it is sufficient to handle the data rate of LiDAR sensors, which typically operate at 10–15 Hz, without introducing hazardous latency. This enables a vehicle to make decisions based on up-to-the-moment environmental data. Furthermore, the compact model size (13.03 M parameters) is a promising characteristic for implementation on resource-constrained automotive embedded hardware. Such a low computational load could generally contribute to reduced power consumption and lower hardware costs.
Furthermore, unlike existing methods that rely on depth completion, our approach does not require additional annotations. This characteristic lessens the burden of large-scale data collection and labeling for autonomous driving systems, thereby reducing development and operational costs. Consequently, our proposed method offers a more practical and cost-effective solution.

Author Contributions

Conceptualization, Y.S.; Funding acquisition, X.K. and H.T.; Investigation, Y.S.; Methodology, Y.S.; Software, Y.S.; Supervision, T.S., X.K. and H.T.; Validation, Y.S.; Writing—original draft, Y.S.; Writing—review and editing, T.S., X.K. and H.T. All authors have read and agreed to the published version of the manuscript.

Funding

This work was partly supported by Suzuki Foundation.

Institutional Review Board Statement

Not applicable.

Informed Consent Statement

Not applicable.

Data Availability Statement

The original contributions presented in this study are included in the article. Further inquiries can be directed to the corresponding author.

Acknowledgments

This work was partly supported by Suzuki Foundation. During the preparation of this manuscript, the authors used ChatGPT (OpenAI, versions 5, 4o, 4o-mini-high, and 4o-mini) for the purposes of text generation and manuscript refinement. The authors have reviewed and edited the output and take full responsibility for the content of this publication.

Conflicts of Interest

The authors declare no conflicts of interest.

References

  1. Krizhevsky, A.; Sutskever, I.; Hinton, G.E. Imagenet classification with deep convolutional neural networks. Adv. Neural Inf. Process. Syst. 2012, 25. [Google Scholar] [CrossRef]
  2. Redmon, J.; Divvala, S.; Girshick, R.; Farhadi, A. You only look once: Unified, real-time object detection. In Proceedings of the IEEE Conference on Computer Vision and Pattern Recognition, Las Vegas, NV, USA, 27–30 June 2016; pp. 779–788. [Google Scholar]
  3. Dosovitskiy, A.; Beyer, L.; Kolesnikov, A.; Weissenborn, D.; Zhai, X.; Unterthiner, T.; Dehghani, M.; Minderer, M.; Heigold, G.; Gelly, S.; et al. An image is worth 16 × 16 words: Transformers for image recognition at scale. arXiv 2020, arXiv:2010.11929. [Google Scholar]
  4. Mao, J.; Shi, S.; Wang, X.; Li, H. 3D object detection for autonomous driving: A comprehensive survey. Int. J. Comput. Vis. 2023, 131, 1909–1963. [Google Scholar] [CrossRef]
  5. Wang, J.; Kong, X.; Nishikawa, H.; Lian, Q.; Tomiyama, H. Dynamic Point-Pixel Feature Alignment for Multimodal 3-D Object Detection. IEEE Internet Things J. 2024, 11, 11327–11340. [Google Scholar] [CrossRef]
  6. Wang, Y.; Mao, Q.; Zhu, H.; Deng, J.; Zhang, Y.; Ji, J.; Li, H.; Zhang, Y. Multi-modal 3D object detection in autonomous driving: A survey. Int. J. Comput. Vis. 2023, 131, 2122–2152. [Google Scholar] [CrossRef]
  7. Li, Y.; Yu, A.W.; Meng, T.; Caine, B.; Ngiam, J.; Peng, D.; Shen, J.; Lu, Y.; Zhou, D.; Le, Q.V.; et al. Deepfusion: Lidar-camera deep fusion for multi-modal 3D object detection. In Proceedings of the IEEE/CVF Conference on Computer Vision and Pattern Recognition, New Orleans, LA, USA, 18–24 June 2022; pp. 17182–17191. [Google Scholar]
  8. Qi, C.R.; Liu, W.; Wu, C.; Su, H.; Guibas, L.J. Frustum pointnets for 3D object detection from rgb-d data. In Proceedings of the IEEE Conference on Computer Vision and Pattern Recognition, Salt Lake City, UT, USA, 18–23 June 2018; pp. 918–927. [Google Scholar]
  9. Li, X.; Ma, T.; Hou, Y.; Shi, B.; Yang, Y.; Liu, Y.; Wu, X.; Chen, Q.; Li, Y.; Qiao, Y.; et al. Logonet: Towards accurate 3D object detection with local-to-global cross-modal fusion. In Proceedings of the IEEE/CVF Conference on Computer Vision and Pattern Recognition, Vancouver, BC, Canada, 17–24 June 2023; pp. 17524–17534. [Google Scholar]
  10. Sakai, Y.; Shimada, T.; Kong, X.; Tomiyama, H. MCPT: Mixture of CNN and Point Transformer for Multimodal 3D Object Detection. In Proceedings of the 40th International Technical Conference on Circuits/Systems, Computers, and Communications (ITC-CSCC), Seoul, Republic of Korea, 7–10 July 2025. [Google Scholar]
  11. Zhou, Y.; He, Y.; Zhu, H.; Wang, C.; Li, H.; Jiang, Q. Monocular 3D object detection: An extrinsic parameter free approach. In Proceedings of the IEEE/CVF Conference on Computer Vision and Pattern Recognition, Nashville, TN, USA, 20–25 June 2021; pp. 7556–7566. [Google Scholar]
  12. Liu, H.; Liu, H.; Wang, Y.; Sun, F.; Huang, W. Fine-grained multilevel fusion for anti-occlusion monocular 3D object detection. IEEE Trans. Image Process. 2022, 31, 4050–4061. [Google Scholar] [CrossRef]
  13. Ding, M.; Huo, Y.; Yi, H.; Wang, Z.; Shi, J.; Lu, Z.; Luo, P. Learning depth-guided convolutions for monocular 3D object detection. In Proceedings of the IEEE/CVF Conference on Computer Vision and Pattern Recognition Workshops, Seattle, WA, USA, 13–19 June 2020; pp. 1000–1001. [Google Scholar]
  14. Bao, W.; Xu, B.; Chen, Z. Monofenet: Monocular 3D object detection with feature enhancement networks. IEEE Trans. Image Process. 2019, 29, 2753–2765. [Google Scholar] [CrossRef]
  15. Qin, Z.; Wang, J.; Lu, Y. Monogrnet: A general framework for monocular 3D object detection. IEEE Trans. Pattern Anal. Mach. Intell. 2021, 44, 5170–5184. [Google Scholar] [CrossRef]
  16. Li, P.; Chen, X.; Shen, S. Stereo r-cnn based 3D object detection for autonomous driving. In Proceedings of the IEEE/CVF Conference on Computer Vision and Pattern Recognition, Long Beach, CA, USA, 15–20 June 2019; pp. 7644–7652. [Google Scholar]
  17. You, Y.; Wang, Y.; Chao, W.-L.; Garg, D.; Pleiss, G.; Hariharan, B.; Campbell, M.; Weinberger, K.Q. Pseudo-LiDAR++: Accurate Depth for 3D Object Detection in Autonomous Driving. In Proceedings of the International Conference on Learning Representations (ICLR), Virtual Only Conference, 26 April–1 May 2020. [Google Scholar]
  18. Arnold, E.; Al-Jarrah, O.Y.; Dianati, M.; Fallah, S.; Oxtoby, D.; Mouzakitis, A. A survey on 3D object detection methods for autonomous driving applications. IEEE Trans. Intell. Transp. Syst. 2019, 20, 3782–3795. [Google Scholar] [CrossRef]
  19. Shi, S.; Wang, X.; Li, H. Pointrcnn: 3D object proposal generation and detection from point cloud. In Proceedings of the IEEE/CVF Conference on Computer Vision and Pattern Recognition, Long Beach, CA, USA, 15–20 June 2019; pp. 770–779. [Google Scholar]
  20. Qi, C.R.; Yi, L.; Su, H.; Guibas, L.J. Pointnet++: Deep hierarchical feature learning on point sets in a metric space. Adv. Neural Inf. Process. Syst. 2017, 30. [Google Scholar]
  21. Qi, C.R.; Litany, O.; He, K.; Guibas, L.J. Deep Hough Voting for 3D Object Detection in Point Clouds. arXiv 2019, arXiv:1904.09664. [Google Scholar] [CrossRef]
  22. Yan, Y.; Mao, Y.; Li, B. SECOND: Sparsely Embedded Convolutional Detection. Sensors 2018, 18, 3337. [Google Scholar] [CrossRef]
  23. Lang, A.H.; Vora, S.; Caesar, H.; Zhou, L.; Yang, J.; Beijbom, O. Pointpillars: Fast encoders for object detection from point clouds. In Proceedings of the IEEE/CVF Conference on Computer Vision and Pattern Recognition, Long Beach, CA, USA, 15–20 June 2019; pp. 12697–12705. [Google Scholar]
  24. Vora, S.; Lang, A.H.; Helou, B.; Beijbom, O. Pointpainting: Sequential fusion for 3D object detection. In Proceedings of the IEEE/CVF Conference on Computer Vision and Pattern Recognition, Seattle, WA, USA, 13–19 June 2020; pp. 4604–4612. [Google Scholar]
  25. Wu, X.; Peng, L.; Yang, H.; Xie, L.; Huang, C.; Deng, C.; Liu, H.; Cai, D. Sparse fuse dense: Towards high quality 3D detection with depth completion. In Proceedings of the IEEE/CVF Conference on Computer Vision and Pattern Recognition, New Orleans, LA, USA, 18–24 June 2022; pp. 5418–5427. [Google Scholar]
  26. Chen, Y.; Cai, G.; Song, Z.; Liu, Z.; Zeng, B.; Li, J.; Wang, Z. LVP: Leverage Virtual Points in Multimodal Early Fusion for 3-D Object Detection. IEEE Trans. Geosci. Remote Sens. 2025, 63, 5700415. [Google Scholar] [CrossRef]
  27. Yu, Z.; Qiu, B.; Khong, A.W. ViKIENet: Towards Efficient 3D Object Detection with Virtual Key Instance Enhanced Network. In Proceedings of the Computer Vision and Pattern Recognition Conference, Nashville, TN, USA, 10–17 June 2025; pp. 11844–11853. [Google Scholar]
  28. Pang, S.; Morris, D.; Radha, H. CLOCs: Camera-LiDAR object candidates fusion for 3D object detection. In Proceedings of the 2020 IEEE/RSJ International Conference on Intelligent Robots and Systems (IROS), Las Vegas, NV, USA, 24 October–24 January 2021; IEEE: Piscataway, NJ, USA, 2020; pp. 10386–10393. [Google Scholar]
  29. Liu, Z.; Tang, H.; Amini, A.; Yang, X.; Mao, H.; Rus, D.L.; Han, S. Bevfusion: Multi-task multi-sensor fusion with unified bird’s-eye view representation. In Proceedings of the 2023 IEEE International Conference on Robotics and Automation (ICRA), London, UK, 29 May–2 June 2023; IEEE: Piscataway, NJ, USA, 2023; pp. 2774–2781. [Google Scholar]
  30. Zhang, Y.; Zhang, Q.; Hou, J.; Yuan, Y.; Xing, G. Unleash the potential of image branch for cross-modal 3D object detection. Adv. Neural Inf. Process. Syst. 2023, 36, 51562–51583. [Google Scholar]
  31. Huang, T.; Liu, Z.; Chen, X.; Bai, X. Epnet: Enhancing point features with image semantics for 3D object detection. In Proceedings of the Computer Vision–ECCV 2020: 16th European Conference, Glasgow, UK, 23–28 August 2020; Proceedings, Part XV 16. Springer: Berlin/Heidelberg, Germany, 2020; pp. 35–52. [Google Scholar]
  32. Liu, Z.; Huang, T.; Li, B.; Chen, X.; Wang, X.; Bai, X. EPNet++: Cascade bi-directional fusion for multi-modal 3D object detection. IEEE Trans. Pattern Anal. Mach. Intell. 2022, 45, 8324–8341. [Google Scholar] [CrossRef] [PubMed]
  33. Howard, A.G.; Zhu, M.; Chen, B.; Kalenichenko, D.; Wang, W.; Weyand, T.; Andreetto, M.; Adam, H. Mobilenets: Efficient convolutional neural networks for mobile vision applications. arXiv 2017, arXiv:1704.04861. [Google Scholar] [CrossRef]
  34. Wang, Q.; Wu, B.; Zhu, P.; Li, P.; Zuo, W.; Hu, Q. ECA-Net: Efficient channel attention for deep convolutional neural networks. In Proceedings of the IEEE/CVF Conference on Computer Vision and Pattern Recognition, Seattle, WA, USA, 13–19 June 2020; pp. 11534–11542. [Google Scholar]
  35. Dutta, P.; Sathi, K.A.; Hossain, M.A.; Dewan, M.A.A. Conv-ViT: A convolution and vision transformer-based hybrid feature extraction method for retinal disease detection. J. Imaging 2023, 9, 140. [Google Scholar] [CrossRef] [PubMed]
  36. Dai, Z.; Liu, H.; Le, Q.V.; Tan, M. Coatnet: Marrying convolution and attention for all data sizes. Adv. Neural Inf. Process. Syst. 2021, 34, 3965–3977. [Google Scholar]
  37. Lin, T.Y.; Goyal, P.; Girshick, R.; He, K.; Dollár, P. Focal loss for dense object detection. In Proceedings of the IEEE International Conference on Computer Vision, Venice, Italy, 22–29 October 2017; pp. 2980–2988. [Google Scholar]
  38. Girshick, R. Fast r-cnn. In Proceedings of the IEEE International Conference on Computer Vision, Santiago, Chile, 7–13 December 2015; pp. 1440–1448. [Google Scholar]
  39. Geiger, A.; Lenz, P.; Urtasun, R. Are we ready for autonomous driving? The kitti vision benchmark suite. In Proceedings of the 2012 IEEE Conference on Computer Vision and Pattern Recognition, Providence, RI, USA, 16–21 June 2012; IEEE: Piscataway, NJ, USA, 2012; pp. 3354–3361. [Google Scholar]
  40. Caesar, H.; Bankiti, V.; Lang, A.H.; Vora, S.; Liong, V.E.; Xu, Q.; Krishnan, A.; Pan, Y.; Baldan, G.; Beijbom, O. nuScenes: A Multimodal Dataset for Autonomous Driving. In Proceedings of the IEEE/CVF Conference on Computer Vision and Pattern Recognition, Seattle, WA, USA, 13–19 June 2020; pp. 11621–11631. [Google Scholar]
  41. Hegde, D.; Lohit, S.; Peng, K.C.; Jones, M.; Patel, V. Multimodal 3D Object Detection on Unseen Domains. In Proceedings of the Computer Vision and Pattern Recognition Conference, Nashville, TN, USA, 11–12 June 2025; pp. 2499–2509. [Google Scholar]
  42. Kingma, D.P. Adam: A method for stochastic optimization. arXiv 2014, arXiv:1412.6980. [Google Scholar]
  43. Velodyne Acoustics, Inc. HDL-64E: High Definition Lidar Sensor; Product Data Sheet, Rev. B; Velodyne Acoustics: San Jose, CA, USA, 2014. [Google Scholar]
  44. Chen, Y.; Li, Y.; Zhang, X.; Sun, J.; Jia, J. Focal sparse convolutional networks for 3D object detection. In Proceedings of the IEEE/CVF Conference on Computer Vision and Pattern Recognition, New Orleans, LA, USA, 18–24 June 2022; pp. 5428–5437. [Google Scholar]
  45. Liu, H.; Duan, T. Real-Time Multimodal 3D Object Detection with Transformers. World Electr. Veh. J. 2024, 15, 307. [Google Scholar] [CrossRef]
  46. Gao, H.; Shao, J.; Iqbal, M.; Wang, Y.; Xiang, Z. CFPC: The Curbed Fake Point Collector to Pseudo-LiDAR-Based 3D Object Detection for Autonomous Vehicles. IEEE Trans. Veh. Technol. 2025, 74, 1922–1934. [Google Scholar] [CrossRef]
  47. Mo, Y.; Wu, Y.; Zhao, J.; Hou, Z.; Huang, W.; Hu, Y.; Wang, J.; Yan, J. Sparse Query Dense: Enhancing 3D Object Detection with Pseudo Points. In Proceedings of the 32nd ACM International Conference on Multimedia (ACM MM 2024), Melbourne, Australia, 28 October–1 November 2024; pp. 409–418. [Google Scholar]
Figure 1. Figure illustrates the differences in LiDAR point cloud density at varying distances. (a) shows the overall scene image, (b) depicts a vehicle located approximately 10 m away, and (c) presents the corresponding LiDAR point cloud of this vehicle. (d) shows another overall scene image, (e) depicts a vehicle at a distance of around 80 m, and (f) presents the associated LiDAR point cloud. As observed, the density of LiDAR points decreases significantly as the distance from the sensor increases.
Applsci 15 10676 g001
Figure 2. Comparison of 3D object detection methods in terms of detection accuracy (3D mAP) and inference speed (FPS). The red dashed line indicates the trade-off trend between accuracy and processing speed. The proposed LM3D demonstrates an excellent balance, achieving higher inference speed while maintaining competitive accuracy compared to existing methods.
Applsci 15 10676 g002
Figure 3. Overview of the proposed 3D object detection network. In the top branch, the point cloud is first input to a 3D backbone to extract features. At the third layer, the MCPT (Mixture of CNN and Point Transformer) module, shown in red, is inserted to enhance multi-scale and contextual information without sacrificing processing speed. In the bottom branch, the RGB image is efficiently processed by the DWLE (DepthWise Lightweight Encoder) module, and at each backbone stage, image features are fused with point cloud features via the ELIF (Efficient LiDAR–Image Fusion) module. The RPN then generates region proposals, and the refinement stage outputs the final 3D bounding boxes. In DWLE module, DW denotes depthwise convolution, BN denotes batch normalization, and PW denotes pointwise convolution.
Applsci 15 10676 g003
Figure 4. Structure of the proposed ELIF module, which integrates LiDAR and image features through an ECA module, LiDAR-guided feature aligner, and cross-attention fusion.
Applsci 15 10676 g004
Figure 5. Structure of the proposed Mixture of CNN and Point Transformer (MCPT) module. The CNN branch (left) captures local geometric features through a convolution followed by BatchNorm and ReLU. The Point Transformer branch (right) models global spatial relationships. The outputs of both branches are concatenated and further refined to produce the final Enhanced Fused Features.
Applsci 15 10676 g005
Figure 6. Examples from the nuScenes night-time subset: (a) RGB image and (b) LiDAR point cloud.
Applsci 15 10676 g006
Figure 7. Qualitative comparison between EPNet and our proposed method on the KITTI dataset. Four different scenes are presented: (a,d,g,j) show the corresponding 2D images; (b,e,h,k) show the detection results of EPNet; and (c,f,i,l) show the detection results of our method. In this figure, ground truth bounding boxes are color-coded as follows: yellow for cyclists, light green for cars, and light blue for pedestrians. For the predicted results, cars are shown in red, and incorrect detections are highlighted with red circles.
Applsci 15 10676 g007aApplsci 15 10676 g007b
Figure 8. Qualitative examples of failure cases on the KITTI dataset. Two different scenes are presented: (a,c) show the corresponding 2D images, while (b,d) show the detection results of the proposed method.
Applsci 15 10676 g008
Table 1. Comparison of detection performance on the KITTI benchmark (Cars). “L” and “R” denote the LiDAR point cloud and RGB image, respectively.
3D DetectionBEV Detection
Method Reference Modality Add. Sup. Easy Mod. Hard mAP Easy Mod. Hard mAP
PointRCNN [19]CVPR 2019L87.6974.3272.2378.0892.1885.7483.7887.23
PointPillars [23]CVPR 2019L81.8271.4668.5073.9390.9986.7884.1687.31
SECOND [22]Sensors 2018L87.3575.7373.0378.7093.1488.0087.0489.39
Focal-Conv [44]CVPR 2022L + RYes91.7284.7583.0486.5093.9490.2688.5590.92
EPNet (base) [31]ECCV 2020L + RNo92.1382.1880.0084.7796.2388.8988.5991.24
EPNet++ [32]TPAMI 2022L + RNo92.3983.2480.6285.4296.2389.5589.1591.64
UPIDet [30]NeurIPS 2023L + RNo92.8286.2283.5787.5495.4991.7589.2792.17
Fast Transfusion * [45]WEVJ 2024L + RNo88.0679.4371.5879.6990.9983.1476.8583.66
CFPC * [46]IEEE TVT 2024L + RYes92.0183.3982.3587.42
SQDNet [47]ACM MM 2024L + RYes95.8488.3087.8890.6796.4593.4891.4793.80
LM3DAppl. Sci 2025L + RNo92.5082.9680.5485.3695.9489.1288.7091.25
Note. The asterisk (*) indicates that the values are quoted directly from the original papers. “Add. Sup.” = Additional Supervision.
Table 2. Comparison of model parameters, inference speed, and use of depth completion on the KITTI benchmark (Cars). “L” and “R” denote the LiDAR point cloud and RGB image, respectively.
MethodReferenceModalityAdd. Sup.ParametersInference Speed
PointRCNN [19]CVPR 2019L4.04 M18.85 FPS
PointPillars [23]CVPR 2019L4.83 M48.95 FPS
SECOND [22]Sensors 2018L5.30 M31.15 FPS
Focal-Conv [44]CVPR 2022L + RYes53.01 M5.12 FPS
EPNet (base) [31]ECCV 2020L + RNo15.68 M13.88 FPS
EPNet++ [32]TPAMI 2022L + RNo27.25 M12.40 FPS
UPIDet [30]NeurIPS 2023L + RNo24.99 M8.79 FPS
Fast Transfusion * [45]WEVJ 2024L + RNo10.64 FPS
SQDNet [47]ACM MM 2024L + RYes12.71 M10.10 FPS
LM3DAppl. Sci 2025L + RNo13.03 M14.94 FPS
Note. The asterisk (*) indicates that the values are quoted directly from the original papers. “Add. Sup.” = Additional Supervision.
Table 3. Evaluation on the nuScenes night-time subset (converted to KITTI format).
Method3D mAP (%)BEV mAP (%)Inference Speed (FPS)
EPNet (base)30.2447.9213.46
EPNet++32.4948.8812.72
LM3D36.6351.1514.25
Table 4. Contribution of each component in the proposed method. (✓ indicates that the network includes the corresponding module).
DWLEELIFMCPT3D mAP (%)BEV mAP (%)Params (M)Inference Speed (FPS)
84.7791.2415.6813.88
84.7390.859.0915.11
85.0891.119.0915.41
85.3691.2513.0314.94
Table 5. Performance when the MCPT module with a kernel size of 7 × 7 is inserted at different layers of Set Abstraction.
Configuration3D mAP (%)BEV mAP (%)Params (M)Inference Speed (FPS)
Placed at the 1st85.3891.2810.8312.13
Placed at the 2nd85.3391.2111.3914.37
Placed at the 3rd85.3691.2513.0314.94
Placed at the 4th85.1890.4819.0614.82
Table 6. Performance when varying the kernel size of the MCPT module inserted at the 3rd layer of Set Abstraction.
Configuration3D mAP (%)BEV mAP (%)Params (M)Inference Speed (FPS)
Point Transformer Only84.8990.4511.1915.22
kernel size: 1 × 185.1390.4811.4615.26
kernel size: 3 × 384.9890.6211.9815.26
kernel size: 5 × 585.3291.3112.5115.13
kernel size: 7 × 785.3691.2513.0314.94
kernel size: 9 × 985.0291.1213.5615.15
Disclaimer/Publisher’s Note: The statements, opinions and data contained in all publications are solely those of the individual author(s) and contributor(s) and not of MDPI and/or the editor(s). MDPI and/or the editor(s) disclaim responsibility for any injury to people or property resulting from any ideas, methods, instructions or products referred to in the content.